Embed Size (px)
Citation preview

RH2INE Kickstart Study Regulatory & Safety Analysis Sub-study Guidance for Safety Distances

RH2INE PROGRAM - SUB-STUDY 1B: SAFETY AND REGULATORY ANALYSIS
RH2INE Consortium
Report No.: 10254098-1, Rev. 1
Document No.: 11IAVRZB-3
Date: 2021-08-05

DNV – Report No. 10254098-1, Rev. 1 – www.dnv.com Page i
Project name: RH2INE program - Sub-study 1b: Safety and Regulatory
analysis
DNV B.V.
Energy Systems
Risk Management Advisory
Zwolseweg 1
2994 LB Barendrecht
Netherlands
Tel: +31 (0) 10 2922600
VAT No.: NL008585635B01
Report title: SuAc A3 & B3: Guidance for safety distances for
bunkering hydrogen in the Netherlands & Germany
Customer: RH2INE Consortium (Province Zuid-Holland, Ministry of
Economic Affairs, Innovation, Digitalisation and Energy
of North Rhine-Westphalia, the Port of Rotterdam,
Duisport and RheinCargo)
Customer contact: SJ. Kelderman (Provence of Zuid-Holland)
Date of issue: 2021-08-05
Project No.: 10254098
Organisation unit: Risk Management Advisory Rotterdam
Report No.: 10254098-1, Rev. 1
Document No.: 11IAVRZB-3
Applicable contract(s) governing the provision of this Report:
Objective: this report provides guidance for mandatory (external) safety distances for different land-based bunkering
systems and scenarios supplying hydrogen to inland navigational vessels in the Netherlands and Germany.
Prepared by: Verified by: Approved by:
Dennis van der Meulen Senior Consultant
Niek Wessels Consultant
Rob van der Spek Head of Risk Management Advisory NL, digital lead region CEMEIA
Jürgen Hofman Principal Consultant
Copyright © DNV 2021. All rights reserved. Unless otherwise agreed in writing: (i) This publication or parts thereof may not be copied, reproduced or transmitted in any form, or by any means, whether digitally or otherwise; (ii) The content of this publication shall be kept confidential by the customer; (iii) No third party may rely on its contents; and (iv) DNV undertakes no duty of care toward any third party. Reference to part of this publication which may lead to misinterpretation is prohibited. DNV Distribution: Keywords:
☒ OPEN. Unrestricted distribution, internal and external. Hydrogen, Bunkering, Inland Waterway Transport,
Safety distances ☐ INTERNAL use only. Internal DNV document.
☐ CONFIDENTIAL. Distribution within DNV according to applicable
contract.*
☐ SECRET. Authorized access only.
*Specify distribution:
Rev. No. Date Reason for Issue Prepared by Verified by Approved by
0 2021-04-09 Draft report D. van der Meulen
J. Hofman
N. Wessels R. van der Spek
1 2021-08-05 Final report D. van der Meulen
J. Hofman
N. Wessels R. van der Spek

DNV – Report No. 10254098-1, Rev. 1 – www.dnv.com Page ii
Table of contents
ABREVIATIONS................................................................................................................................................................. 1
EXECUTIVE SUMMARY ................................................................................................................................................... 3
1 INTRODUCTION ............................................................................................................................................... 6
2 STUDY APPROACH ......................................................................................................................................... 7
3 SAFETY DISTANCES ....................................................................................................................................... 8 3.1 External safety distance 8 3.2 Internal safety distances 9 3.3 Focus areas 9 3.4 Safety zone 10 3.5 Hazardous areas 10
4 LAND-USE PLANNING IN THE NETHERLANDS .......................................................................................... 12 4.1 Legal framework & risk criteria 12 4.2 Guidelines 14 4.3 QRA methodology 15
5 LAND-USE PLANNING IN GERMANY ........................................................................................................... 18 5.1 Legal background 18 5.2 Approach & consequence-based thresholds 18 5.3 Application of external safety distances 19 5.4 Guidelines 20
6 HYDROGEN BUNKERING SCENARIOS ....................................................................................................... 21
7 RESULTS ........................................................................................................................................................ 23 7.1 External safety distances 23 7.2 Focus areas 24
8 CONCLUSIONS .............................................................................................................................................. 26
9 REFERENCES ................................................................................................................................................ 28 Appendix A Starting points and assumptions for bunkering scenarios Appendix B Scenario-specific input parameters for KAS-18 calculations Appendix C Detailed QRA results (risk contours & focus areas) Appendix D Detailed results KAS-18 calculations
DNV – Report No. 10254098-1, Rev. 1 – www.dnv.com Page 1
ABREVIATIONS
ATEX “Appareils destinés à être utilisés en ATmosphères Explosives” (French for Equipment intended for
use in Explosive Atmospheres)
Bevi Dutch decree on external safety of facilities (“Besluit externe veiligheid inrichtingen”)
Bkl Dutch decree quality living environment that will come into force in 2022 (“Besluit kwaliteit
leefomgeving”)
BauBG German Federal building code (“Baugesetzbuch”)
BlmSchG German Federal emission protection law (“Bundesemissionschutzgesetz”)
Brzo Dutch decree on risk of major accidents (“Besluit risico’s zware ongevallen”)
CO2 Carbon Dioxide
EIGA European Industrial Gases Association
ERPG Emergency Response Planning Guidelines
H2 Hydrogen
HAZID Hazard Identification Study
HRS Hydrogen Refuelling Stations
IEC International Electrotechnical Commission
IMO International Maritime Organization
ISO International Organization for Standardization
IWT Inland Waterway Transport
KAS German commission of plant safety (“Kommission für Anlagensicherheit”)
LBW Life Threatening Concentration (“Levensbedreigende waarde”) based on Dutch intervention values
LFL Lower Flammable Limit
LH2 Liquid hydrogen
LNG Liquefied natural gas
LoC Loss of Containment
LSIR Location-specific individual risk
LUP Land-use planning
ME Multi-Energy
NEN Dutch Standardization Institute (“Nederlands Normalisatie-instituut”)
PGS Dutch guidelines for dangerous goods
QRA Quantitative Risk Assessment
RH2INE The Rhine Hydrogen Integration Network of Excellence

DNV – Report No. 10254098-1, Rev. 1 – www.dnv.com Page 2
RIVM Dutch National Institute for Public Health and the Environment (Rijksinstituut voor Volksgezondheid en
Milieu)
TTS Truck-to-Ship
UDM Unified Dispersion Model
UFL Upper Flammable Limit
VDI Association of German Engineers (“Verein Deutscher Ingenieure”)

DNV – Report No. 10254098-1, Rev. 1 – www.dnv.com Page 3
EXECUTIVE SUMMARY
Introduction
The Rhine Hydrogen Integration Network of Excellence (RH2INE) is an international programme and consists of public
and private parties. Its global aim is to implement hydrogen as a fuel in the inland waterway transport (IWT).
This report is the result of sub-activity 3: Guidance for external safety distances and other mandatory safety distances
for land-based systems supplying hydrogen to vessels in the Netherlands and Germany of the tender “Sub-study 1b:
Safety and Regulatory analysis” issued by the Provence of Zuid-Holland in the Netherlands on behalf of the RH2INE
consortium.
Hydrogen facilities and bunkering activities may pose a threat to human health and the environment, due to the
possibility of accidents with hazardous consequences. It is therefore important to establish (and get insight in) safety
distances to prevent and limit the consequences of possible major accidents. The European legislation for control of
major accident hazards, the Seveso III Directive, includes provisions for land-use planning (LUP). Land-use planning
aims to prevent and limit the consequences of possible major accidents and deals with the potential conflicts between
sources of risk and surrounding land-uses. This is to establish and maintain appropriate external safety distances
between sensitive areas and installations where dangerous substances are present. The approach to determine
external safety distances differs in the Netherlands and Germany because both countries have made their own
implementation of the Seveso III Directive.
In this report, safety distances are calculated for several hydrogen bunkering scenarios based on the applicable LUP
methodologies in the Netherlands and Germany. The scenarios are based on the outcomes of RH2INE sub-study 1a:
Safety framework conditions, Sub-Activity (SuAc) 1.1b: Identification of hydrogen bunkering scenarios for inland
navigational vessels. The SuAc 1.1b report contains a short list of the most feasible IWT hydrogen bunkering scenarios
as determined in a workshop held with the RH2INE consortium participants and stakeholders.
This report also discusses other (mandatory) safety distances for land-based hydrogen bunkering installations.
Approach
The approach for the study comprises of the following steps:
1. Prepare an overview of the different type of safety distances applicable for hydrogen installations and
bunkering;
2. Provide generic guidance to determine these safety distances;
3. Describe the legal framework, methodological approach and criteria for land-use planning (LUP) in the
Netherlands and Germany;
4. Determine the safety distances for hydrogen bunkering scenarios based on the specific LUP approach in the
Netherlands and Germany.
The study focusses on (mandatory) safety distances applicable for land-based bunkering installations, such as external
safety distances.
Results
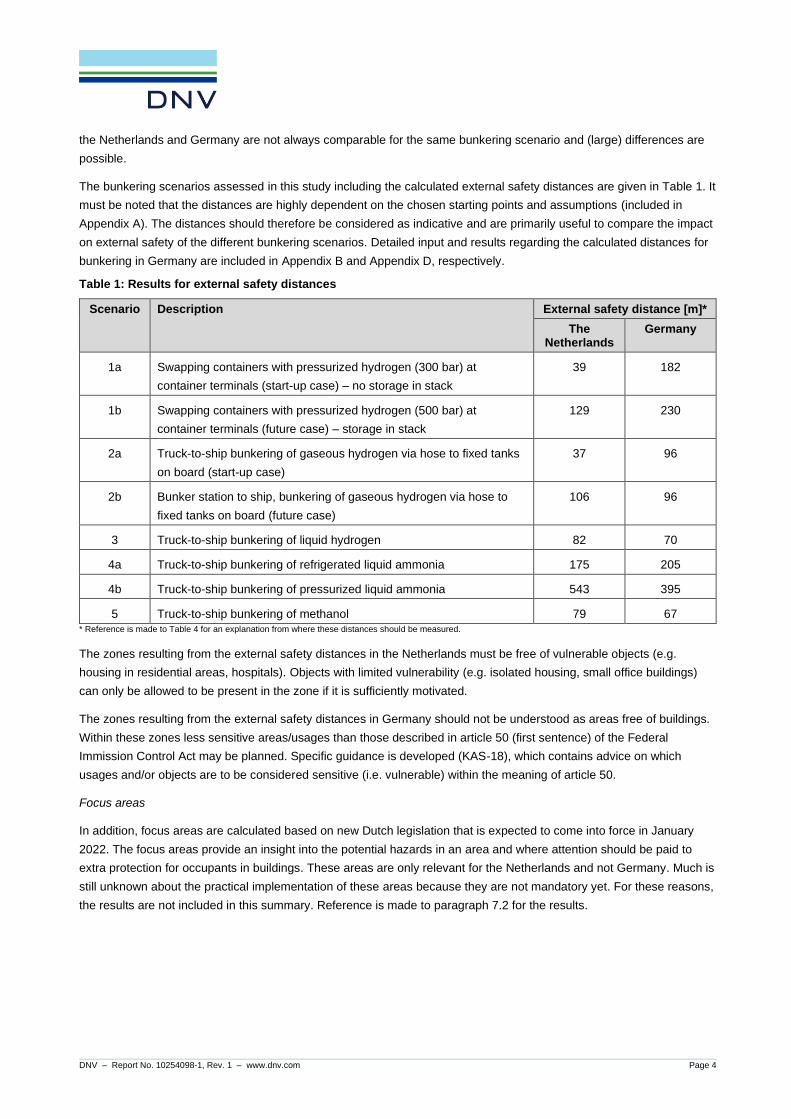
External safety distances
The approach to determine external safety distances in the Netherlands and Germany differs because both countries
have made their own implementation of the Seveso III Directive. The Netherlands uses a risk-based approach (QRA),
while Germany has developed a deterministic approach with implicit judgment of risk. For this reason, the distances in
DNV – Report No. 10254098-1, Rev. 1 – www.dnv.com Page 4
the Netherlands and Germany are not always comparable for the same bunkering scenario and (large) differences are
possible.
The bunkering scenarios assessed in this study including the calculated external safety distances are given in Table 1. It
must be noted that the distances are highly dependent on the chosen starting points and assumptions (included in
Appendix A). The distances should therefore be considered as indicative and are primarily useful to compare the impact
on external safety of the different bunkering scenarios. Detailed input and results regarding the calculated distances for
bunkering in Germany are included in Appendix B and Appendix D, respectively.
Table 1: Results for external safety distances
Scenario Description External safety distance [m]*
The Netherlands
Germany
1a Swapping containers with pressurized hydrogen (300 bar) at
container terminals (start-up case) – no storage in stack
39 182
1b Swapping containers with pressurized hydrogen (500 bar) at
container terminals (future case) – storage in stack
129 230
2a Truck-to-ship bunkering of gaseous hydrogen via hose to fixed tanks
on board (start-up case)
37 96
2b Bunker station to ship, bunkering of gaseous hydrogen via hose to
fixed tanks on board (future case)
106 96
3 Truck-to-ship bunkering of liquid hydrogen 82 70
4a Truck-to-ship bunkering of refrigerated liquid ammonia 175 205
4b Truck-to-ship bunkering of pressurized liquid ammonia 543 395
5 Truck-to-ship bunkering of methanol 79 67
* Reference is made to Table 4 for an explanation from where these distances should be measured.
The zones resulting from the external safety distances in the Netherlands must be free of vulnerable objects (e.g.
housing in residential areas, hospitals). Objects with limited vulnerability (e.g. isolated housing, small office buildings)
can only be allowed to be present in the zone if it is sufficiently motivated.
The zones resulting from the external safety distances in Germany should not be understood as areas free of buildings.
Within these zones less sensitive areas/usages than those described in article 50 (first sentence) of the Federal
Immission Control Act may be planned. Specific guidance is developed (KAS-18), which contains advice on which
usages and/or objects are to be considered sensitive (i.e. vulnerable) within the meaning of article 50.
Focus areas
In addition, focus areas are calculated based on new Dutch legislation that is expected to come into force in January
2022. The focus areas provide an insight into the potential hazards in an area and where attention should be paid to
extra protection for occupants in buildings. These areas are only relevant for the Netherlands and not Germany. Much is
still unknown about the practical implementation of these areas because they are not mandatory yet. For these reasons,
the results are not included in this summary. Reference is made to paragraph 7.2 for the results.

DNV – Report No. 10254098-1, Rev. 1 – www.dnv.com Page 5
Conclusions
The following is concluded from the results for external safety distances:
The Netherlands
The external safety distances for swapping hydrogen containers at container terminals are relatively small (39 m) in the
Netherlands when containers are directly loaded from trailer onto the receiving vessel. However, in the future case when
demand grows and storage of containers in the stack might be needed (to create a buffer stock), the external safety
distance could increase with about a factor 3. This should normally not be a problem for container terminals because of
their layout and location, which provides sufficient stand-off distance to vulnerable objects. Bunkering of gaseous
hydrogen via hose results in relatively small distances (approx. 40 m) when bunkering takes place directly from a (tube)-
trailer. The distance for bunker stations could go up to approximately 100 m.
Germany
The external safety distances for swapping containers at container terminals are about a factor 2 larger than for
bunkering gaseous hydrogen with a hose. The reason for this difference is related to the potential for explosions with
high overpressures due to the level of confinement present at a container terminal. Typically, this level of confinement
(&congestion) is expected to be much less for truck-to-ship bunkering and bunker stations (scenario 2a&2b) as
bunkering will typically take place in an open area where the gas cannot accumulate in confined areas. If this is not the
case, the safety distances for scenario 1a/1b may be more appropriate.
The Netherlands & Germany
For truck-to-ship (TTS) bunkering of liquid hydrogen and methanol result in safety distances of approximately 70-80 m,
which are in line with calculated distances for TTS bunkering of LNG to inland vessels in the LNG Masterplan study of
2015 /12/. For bunkering ammonia, the safety distances are considerably larger and are caused by the high toxicity of
ammonia. The distances for pressurized ammonia are about a factor 2-3 larger than for bunkering refrigerated
ammonia. It will be challenging to introduce ammonia as a fuel in IWT due to the large safety distances for bunkering
ammonia with a hose. This could be showstopper for bunkering ammonia in inland ports and waterways where
residential areas and industries etc. could be nearby.

DNV – Report No. 10254098-1, Rev. 1 – www.dnv.com Page 6
1 INTRODUCTION
The world fleet is large with 115,000 ships and it will grow in the years to come, with more than 30% up to 2030. IMO's
goal of halving CO2 emissions from shipping by 2050 will lead to a significant restructuring over the next thirty years.
The IMO targets and national decarbonization policies are expected to be fundamental drivers for developing low and
zero emission technologies in the shipping industry. Next to IMO’s goals, the European Union formulated its goals for all
sectors in the European Green Deal. It is necessary to find and integrate low-emission propulsion fuels, such as
hydrogen, in every part of the transport sector. Hydrogen could significantly reduce emissions, but implementation in
inland shipping is new. Hydrogen is the only available zero emission solution for longer distances and high energy
needs, but it will remain expensive, especially in the short term. To bring costs down it is absolutely necessary that
authorities push for hydrogen technology to be used in vessels and that safety rules & regulations are standardized,
which do not exist today.
The Rhine Hydrogen Integration Network of Excellence (RH2INE) is an international programme and consists of public
and private parties. Its global aim is to implement hydrogen as a fuel in the inland waterway transport (IWT). On behalf
of the consortium of the RH2INE programme, the province of Zuid-Holland1 is taking the lead for Sub-study 1b: Safety
and Regulatory analysis.
Sub-study 1b specifically focusses on safety and regulations related to land-based systems supplying hydrogen to
inland navigational vessels in the Netherlands and Germany. This sub-study comprises of three sub-activities:
1. Identification of land-based regulations and standards for systems supplying hydrogen to vessels in the
Netherlands and Germany;
2. Identification of gaps in land-based regulations and standards;
3. Guidance for external safety distances and other mandatory safety distances.
This report covers sub-activity 3: Guidance for external safety distances and other mandatory safety distances for land-
based systems supplying hydrogen to vessels in the Netherlands and Germany.
Hydrogen facilities and bunkering activities may pose a threat to human health and the environment, due to the
possibility of accidents with hazardous consequences. It is therefore important to establish (and get insight in) safety
distances to prevent and limit the consequences of possible major accidents. The European legislation for control of
major accident hazards, the Seveso III directive, includes provisions for land-use planning (LUP). Land-use planning
aims to prevent and limit the consequences of possible major accidents and deals with the potential conflicts between
sources of risk and surrounding land-uses. This is to establish and maintain appropriate external safety distances
between sensitive areas and installations where dangerous substances are present. The approach to determine
external safety distances differs in the Netherlands and Germany because both countries have made their own
implementation of the Seveso III directive.
In this report, safety distances are calculated for several hydrogen bunkering scenarios based on the applicable LUP
methodologies in the Netherlands and Germany. The scenarios are based on the outcomes of RH2INE sub-study 1a:
Safety framework conditions, Sub-Activity (SuAc) 1.1b: Identification of hydrogen bunkering scenarios for inland
navigational vessels /1/. The SuAc 1.1b report contains a short list of the most feasible IWT hydrogen bunkering
scenarios as determined in a workshop held with the RH2INE consortium participants and stakeholders.
This report also provides guidance for other (mandatory) safety distances for land-based hydrogen bunkering
installations.
1 The province of Zuid-Holland is a Dutch organisation that operates on behalf of the community of the province Zuid-Holland in the Netherlands.

DNV – Report No. 10254098-1, Rev. 1 – www.dnv.com Page 7
2 STUDY APPROACH
The approach for the study comprises of the following steps:
1. Prepare an overview of the different type of safety distances applicable for hydrogen installations and
bunkering;
2. Provide generic guidance to determine these safety distances;
3. Describe the legal framework, methodological approach and criteria for land-use planning (LUP) in the
Netherlands and Germany;
4. Determine the safety distances for hydrogen bunkering scenarios based on the specific LUP approach in the
Netherlands and Germany.
The study focusses on (mandatory) safety distances applicable for land-based bunkering installations, such as external
safety distances. Water-based safety distances such as safe passing distances for ships and exclusion2, monitoring or
control zones3 that may need to be established during hydrogen bunkering are not discussed.
2 This is the area around the bunkering manifold where water-based uncontrolled ignition sources or activities are not allowed or limited to a minimum to mitigate
intrusive ignition risk and intrusions threating the physical integrity of the facility and ships (e.g. due to collision risk). 3 This is the area around the bunkering facility and ship where ship traffic and other activities are monitored (and controlled) to mitigate harmful effects. For bunkering,
these zones are also sometimes referred to as a security zone. However, the term security zone should not be confused with the zones/border described in the International Ship and Port Facility Security (ISPS) code, therefore the term monitoring zone or control zone are more often used in practice.

DNV – Report No. 10254098-1, Rev. 1 – www.dnv.com Page 8
3 SAFETY DISTANCES
Different types of safety distances can be distinguished. The most relevant for land-based installations are:
• External safety distance;
• Internal safety distances;
• Focus areas;
• Safety zone;
• Hazardous areas.
These concepts are briefly discussed in the paragraphs below.
3.1 External safety distance
The external safety distance is the separation distance between an establishment or activity with hazardous goods (e.g.
hydrogen) and surrounding land-uses (e.g. vulnerable objects such as houses, large office buildings, hospitals). There
are several methodological approaches to determine external safety distances in the LUP process and many countries
have developed their own methodology. These approaches often require the use of specific tools and guidelines. In
addition, threshold (or risk) criteria are needed to determine the external safety distance.
The Netherlands has developed a specific risk-based (QRA) methodology, which is described in detail in chapter 4.
Germany has adopted a deterministic approach with implicit judgment of risk. The specific methodology and criteria are
explained in chapter 5.
The existing methodologies can be divided into the following four main categories:
1. Consequence-based approaches
The consequence-based approach is based on the assessment of consequences of credible (or conceivable) scenarios,
without explicitly quantifying the likelihood of these accidents. The consequences of the scenarios are mostly taken into
consideration by calculating the distance in which the physical and/or human health impacts (e.g. heat radiation) reach,
for a given exposure period and a threshold value (e.g. irreversible health effect/harm or fatality). The external safety
zone is thus defined according to which LUP restriction are applied. The method has been generally used in
Luxembourg, Spain, and Austria.
2. Deterministic approach with implicit judgment of risk
A simplified form of the consequence-based approach is the use of “generic” safety distances. These distances are
usually derived from a selected credible scenario and developed on a conservative basis. In their most simple form, they
are derived from expert judgement, including consideration of historical data or experience from operation similar plants.
The approach of generic safety distances has been established and used in Germany. A specific consequence
calculation to determine the safety distance is also possible, but this is often based on a (standard) credible release
scenario. Not all conceivable scenarios have to be considered (e.g. those with low frequencies such as catastrophic
failure scenarios), hence there is an implicit judgement of risk. Typically, a representative credible scenario is taken with
a relatively high frequency (e.g. in Germany a 25 mm leak scenario would be considered to determine the safety
distance).
3. Risk-based (or “probabilistic”) approaches
The risk-based approaches define the risk as a combination of the consequences derived from a range of possible
accidents, and the likelihood of the accidents. A Quantitative Risk Assessment (QRA) is required to calculate the risk.
The results are represented as location-specific individual risk contours and/or societal risk (reference is made to
DNV – Report No. 10254098-1, Rev. 1 – www.dnv.com Page 9
paragraph 4.1 for definitions). Risk criteria are developed to assess the acceptability of the calculated risk. The external
safety distance is based on the location-specific individual risk contours. This approach is followed in e.g. the United
Kingdom, Belgium (Flanders), the Netherlands and Switzerland (only societal risk).
4. Hybrid approaches
Hybrid approaches (or semi-quantitative) combining risk and consequence-based approached have been developed
and extensively used in France and Italy. Under these methods, one of the elements (usually frequency) is assessed
more qualitatively, i.e. using classes rather than continuous figures. The use of a risk matrix is a typical example. For
instance, France adopted a hybrid approach that combines a consequence-based approach for the determination of the
zones that correspond to damage thresholds and a risk-based approach for the determination of the considered
accident scenarios. Respectively, Italy has adopted a hybrid criterion that takes into account the frequencies, as
mitigation factor for the damaged zones, identified using a consequence-oriented approach.
3.2 Internal safety distances
An internal safety distance is the minimal separation distance between a potential hazard source (e.g. equipment
involving dangerous substances) and an object (e.g. equipment), which will mitigate the effect of a likely foreseeable
incident and prevent a minor incident escalating into a larger incident (also known as domino effect). The provision of
adequate internal safety distances is thus a fundamental consideration for safe layout of hydrogen installations.
In general, the approach used to calculate internal safety distances is typically based on EIGA 75/07/E (2007) /2/. The
EIGA report describes how a full assessment of the nature of the hazard, the frequency of the event and its potential
consequence is essential for understanding which risks can be reasonably mitigated by an internal safety distance. If the
resultant safety distance is too large, additional mitigation or prevention measures should be considered and the safety
distance re-calculated. Examples of alternatives to implementing the full safety distances include the installation of
barriers or protection measures (e.g. firewalls) to reduce escalation, or the alteration of equipment design and/or
operating conditions to reduce the severity and/or likelihood of the incident. EIGA uses an individual harm exposure
threshold value (or range of values) as the criterion for selecting the incidents to be included in the internal safety
distance calculations.
In the Netherlands, the Dutch Standardization Institute (Nederlands Normalisatie-instituut, NEN) develops so-called
PGS (“Publicatiereeks Gevaarlijke Stoffen”) guidelines, which provide requirements & provisions for the safe design and
operation of an installation with hazardous goods. PGS 35 /3/ is a guideline developed for Hydrogen Refuelling Stations
(HRS) and contains fixed internal safety distances. The background of the determination of these internal safety
distances is given in the report: “Internal Safety Distances for PGS 35” /4/.
A guideline for the design and operation of a hydrogen bunker station to ship is currently not (yet) under development.
However, the equivalent PGS guideline for LNG bunker stations (PGS 33-2) was first published in 2014 /5/. Depending
on the market developments and the need for regulations for bunker stations, it is expected that a similar guideline will
eventually be developed for hydrogen bunker stations (‘PGS 35-2’), which should include internal safety distances. In
the new environmental legalisation that will come into force in 2022, internal safety distances are mandatory to
implement when they are covered in a PGS guideline. Currently, authorities use PGS guidelines in the permitting
process and often mandate the provisions and measures given in these guidelines (making them mandatory as well).
Germany has not determined (or developed guidance for) internal safety distances for hydrogen installations.
3.3 Focus areas
Focus areas is a new concept in Dutch law (Environmental and Planning Act) that will come into force in 2022 and are
therefore mandatory to establish. Focus areas will replace the societal risk and are determined with means of a
DNV – Report No. 10254098-1, Rev. 1 – www.dnv.com Page 10
consequence-based approach by calculating the maximum effects (to certain thresholds) of all conceivable scenarios
that are included in a QRA. Germany does not require the determination of focus areas.
The areas are established around activities with hazardous substances and they visualise where people are possibly
insufficiently protected indoors against the consequences of accidents involving hazardous substances, without
additional measures. That means that in the event of an accident with hazardous substances, life-threatening hazards to
people in buildings can occur. There are three types of focus area:
• Fire focus area;
• Explosion focus area;
• Toxic cloud focus area.
The focus areas provide an insight into the potential hazards in an area and where attention should be paid to extra
protection for occupants in buildings against fire, explosion or toxic impact. In its environmental vision and environmental
plan, the competent authority makes and motivates its choices about what is sufficiently safe and how health and the
environment are protected. The competent authority also evaluates whether, and if so what measures are needed to
sufficiently protect people present (indoors) in focus areas.
3.4 Safety zone
A safety zone is required to be established around the bunkering station to ensure that only essential personnel and
activities are allowed in the area that could be exposed to hazards in case of an accidental release during bunkering.
The purpose of a safety zone is primarily to control ignition sources in order to reduce the likelihood of igniting a
flammable gas cloud due to an accidental release. The size of the safety zone is normally determined by a risk
assessment. In general, two different methods can be distinguished to determine a safety zone:
1. A conservative and simple (deterministic) approach based on a qualitative risk assessment (HAZID), or;
2. By a risk based approach (QRA) relating to the overall safety requirements.
The more complex risk based approach may be accepted provided that it can be demonstrated by the QRA that risk
acceptance criteria can be met for 1st, 2nd, and 3rd party personnel. If the risk is acceptable in accordance with the
acceptance criteria (as agreed with authorities), the safety zone is acceptable. The safety zone should be implemented
as a safety distance all around the bunkering area and is complementary to the minimum required external safety
distance (to e.g. neighbouring industry, residential or vulnerable areas) as determined based on national criteria for
land-use planning. It must be noted that the risk criteria set by (national) authorities must also be evaluated in the risk
based approach for safety zone determination (relating to the total risk acceptance).
ISO/TS 18683 provides detailed guidance to determine a safety zone for LNG bunkering /6/. No specific guidance has
been developed (e.g. by ISO) to determine safety zones for hydrogen bunkering. Operational safety zones are not
mandatory (by law) to establish and implement during bunkering, but are recommended by international bunkering
guidelines, checklists and procedures. For these reasons, operational safety zones are not calculated or further
discussed in this report (with exception of the external safety zone).
3.5 Hazardous areas
The hazardous area is an area in which an explosive gas atmosphere is or may be expected to be present, in quantities
such as to require special precautions for the construction, installation and use of equipment. The purpose of these
areas (EX-zones) is to prevent ignition of explosive atmospheres by proper selection of electrical equipment to be used

DNV – Report No. 10254098-1, Rev. 1 – www.dnv.com Page 11
inside the zones. The size of the EX-zones is normally defined by IEC 60079-10-1 /7/ or other relevant (national)
regulations and guidelines.
Regulations related to Hazardous Area Classification (ATEX) are generally applicable to all industrial installations,
including hydrogen installations. The European ATEX directives 2014/34/EU (ATEX 114) & 99/92/EG (ATEX 153) are
commonly applied to onshore installations in the EU. The national implementation of ATEX does not contain specific
features that will influence the development of hydrogen land-based installations. A hazardous area does also not fall
under the definition of a safety distance, although it is a safety related concept and they are mandatory to establish and
implement. Hazardous areas are not further discussed in this report.

DNV – Report No. 10254098-1, Rev. 1 – www.dnv.com Page 12
4 LAND-USE PLANNING IN THE NETHERLANDS
4.1 Legal framework & risk criteria
The Netherlands uses a risk-based approach (QRA) for the assessment of external risk and to determine external safety
distances. Criteria for individual and societal risk for fixed installations (so-called Bevi establishments) are implemented in
the Decree External Safety Establishments (Bevi, Besluit Externe Veiligheid Inrichtingen, 2015). This decree applies to all
establishments falling under the Decree concerning Major Accident Hazards (Brzo, Besluit risico’s zware ongevallen,
2015), which is the Dutch implementation of Seveso III.
4.1.1 Location-specific individual risk
The location-specific individual risk (LSIR) is the probability per year of a single fatality involving an unprotected
individual who is outdoors for 24 hours per day (365 days per year) at a location outside the establishment, arising from
the fatal harmful effects of an unusual incident (accident scenario) within the establishment under consideration.
The location-specific individual risk is visualised by LSIR contours. For instance, the 10-6 LSIR contour shows those
locations where the probability of death of an individual is one in a million per year. The LSIR is independent of the
actual population distribution in the vicinity of the establishment.
The Bevi norm further states that the limit value for vulnerable objects (such as housing in residential areas, hospitals,
schools, large offices etc.) is equal to 10-6 per year. This means that vulnerable objects within the 10-6 LSIR contour of
an establishment are not allowed. For objects with limited vulnerability (such as scattered dwellings, smaller offices,
sports complexes etc.) a target value of 10-6 per year is defined. The aim should be that these objects do not fall within
the 10-6 LSIR contour; a higher risk may be permitted, if it is sufficiently motivated.
Vulnerable objects and objects with limited vulnerability are, by definition, located outside of their (own) risk-causing
Bevi establishment (or activity). Objects that are part of another Bevi establishment, such as an office building, are not
considered as a vulnerable for the location-specific individual risk on the basis of Article 1, paragraph 2 of Bevi.
The external safety distance is determined by measuring the distance from the hazardous establishment or activity to the
10-6/year risk contour.
Table 2: Overview of vulnerable objects and objects with limited vulnerability
Vulnerable objects (not allowed to be exposed to a risk level
equal or higher than 10-6/year)
Objects with limited vulnerability. Risk level of 10-6/year
applies as target value.
Housing;
Hospitals, elderly care centers and nursing centers;
Schools and day care for minors;
Office buildings and hotels with a gross floor area more than
1500 m2;
Shopping malls (with more than five shops and a gross floor
area of more than 1000 m2) and shops with a total floor area
of more than 2000 m2;
Camping- and other recreational terrains intended for the
stay of more than 50 persons during multiple consecutive
days.
Isolated housing (maximum of 2 houses per hectare);
Other* office buildings (<1500 m2);
Other* hotels and restaurants;
Other* shops;
Sporting places, sporting terrains, swimming pools and
play grounds;
Other* Camping- and other recreational terrains;
Company/plant buildings;
Equivalent objects;
Objects with high infrastructural value
*Other means: other than defined in the first column as vulnerable object

DNV – Report No. 10254098-1, Rev. 1 – www.dnv.com Page 13
4.1.2 Societal risk
Societal risk is defined as the (cumulative) frequency per year that a particular group of people dies concurrently as a
result of accidents. Societal risk is represented in an FN curve, which is a Log-log graph: the X-axis represents the number
of deaths and the y-axis the cumulative frequency of the accidents, with the number of deaths equal to N or more.
The societal risk evaluation in the Netherlands is not based on a ‘hard’ limit value for acceptability for risk. Instead, there
is a so-called ‘justification’ obligation. This implies primarily that the societal risk has to be compared against a target value.
This means that the same principle as for individual risk for objects with limited vulnerability is valid: a higher risk could be
accepted with proper motivation and under certain conditions. The target value is expressed for fixed installation on an
FN curve as 10-5 per year for 10 fatalities, with F=10-3/N2 for higher fatalities (see figure below). It does not apply for fewer
than 10 fatalities. The societal risk ‘cut-off’ criterion is 10-9/year, below this value the societal risk is considered negligible
for any number of fatalities.
Figure 1: Criteria for societal risk in the Netherlands (target value)
Because societal risk does not directly result in a required external safety distance and because it depends heavily on the
population present the vicinity of the bunkering activity, it is not further addressed in this study. Moreover, in the new
Environmental and Planning Act (expected to come into force in January 2022), societal risk will be replaced by focus
areas.
4.1.3 Focus areas
A distinction is made between three types of focus areas:
• Fire focus area;
• Explosion focus area;
• Toxic cloud focus area.
The methodology to determine these areas is explained in the subsequent paragraphs.

DNV – Report No. 10254098-1, Rev. 1 – www.dnv.com Page 14
4.1.3.1 Fire focus area
For the calculation of the fire focus area, the fire effect areas calculated in a QRA are used. The fire focus area is the
area around an activity in which, as a result of the activity, heat radiation effects in excess of 10 kW/m2 are possible.
Upon prolonged exposure to heat radiation above 10 kW/m2, buildings may collapse and anyone who is indoors may die
as a result.
4.1.3.2 Explosion focus area
The explosion focus area is determined as the area in which overpressures of more than 0.1 bar are possible as a result
of the activity. In the calculation of the location-specific individual risk, it is assumed that people are outside. The
criterion for death due to overpressure for people outside is 0.3 bar. But because focus areas are focused on people
who are indoors, lethality could already occur at overpressures of 0.1 bar. At 0.1 bar overpressure, structural damage to
the building can occur and people who are indoors may die through the (partial) collapse of the building. In addition, the
explosion focus area may also be determined by the 35 kW/m2 radiation contour from the fireball.
4.1.3.3 Toxic cloud focus area
The toxic cloud focus area is defined as the area in which a toxic concentration of 2.54 times the LBW (for 1-hour
exposure) of a substance can occur. The LBW-1h value of a substance is the air concentration above which possible
lethality or life-threatening conditions can occur as a result of one hour of exposure. The National Institute for Public
Health and the Environment (“Rijksinstituut voor Volksgezondheid en Milieu”), the RIVM, has determined that if the toxic
concentration in a cloud outside is equal to 2.54 x LBW (corresponds approximately to the ERPG-3 concentration4),
concentrations equal to LBW can occur indoors. Within the toxic focus area, people who are indoors can therefore be
exposed to life-threatening toxic concentrations.
4.2 Guidelines
Bevi specifies that a QRA must be developed based on the Reference Manual Risk Assessments Bevi /8/ written by the
RIVM and making use of DNV’s software program Safeti-NL 8.x (current version is 8.3). This manual provides
information about possible failure scenario’s, failure frequencies and how to model the consequences & risk. The
manual is based on and is the successor of the most well-known and world-wide accepted guideline for the execution of
quantitative risk assessment: the ‘Purple Book’ /9/. Together with the other ‘coloured books’ (yellow, green and red) the
guideline forms valuable reference material for safety studies. The coloured books have become obsolete and are not
kept up-to-date anymore since 2005.
The Reference Manual Risk Assessments Bevi /8/ is not specifically written for hydrogen, it has generic applicability. For
instance, the manual does not specify hydrogen-specific failure frequencies for e.g. storage in tube-containers, but
rather specifies generic failure frequencies for pressurized onshore storage or pressurized vessels on trailers, which
could be derived based on failure data of storage vessels that are very different in design compared to (compressed or
liquid) hydrogen containment systems.
The RIVM has developed calculation guidelines for specific installations, e.g. container terminals, LNG refuelling
stations and LNG bunker stations. These guidelines also contain case studies. Similar guidelines for hydrogen
installations (e.g. bunker stations) do not exist. However, the RIVM has written a memo on risk and effect distances of
HRS /10/. Based on these results the Ministry of Infrastructure and Environment has decided to include fixed external
safety distances for HRS (30 m or 35 m depending on the supply of hydrogen via pipeline or trailer, respectively) in the
new 2022 legislation (Bkl) and not to develop a specific QRA calculation guideline for HRS. However, there is still a
need to develop a QRA calculation guideline for hydrogen bunker stations supplying hydrogen as a fuel to (inland)
4 EPRG: Emergency Response Planning Guidelines. Three concentrations are specified for each substance (EPRG-1 to EPRG-3). The EPRG-3 value for a substance
is the maximum airborne concentration below which nearly all individuals could be exposed for up to 1 hour without experiencing more than mild, transient adverse health effects or without perceiving a clearly defined objectionable odour.

DNV – Report No. 10254098-1, Rev. 1 – www.dnv.com Page 15
vessels, because the way of calculating the risk of hydrogen releases differs compared to other substances (e.g. related
to ignition probability5, definition of failure cases and outflow modelling).
The QRA calculation guideline for container terminals is included in the Reference Manual /8/, module C, chapter 5. This
guideline does not specify failure scenarios for hydrogen containers in particular. The scenarios are related to hoisting
and storage of tank-containers, either with gas or liquid. The assumptions related to gas tank-containers are actually
based on liquified gas (inventory 20 m3 and a liquid head of 2 m is assumed) and specific assumptions for e.g.
pressurized (hydrogen) gas in e.g. tube-containers are not given. In addition, the design and strength (e.g. wall
thickness of the tube/cylinder) of such containers is very different to a liquefied gas tank-container and therefore the
failure scenarios & frequencies may not be appropriate. More research would be required to investigate the failure
modes and derive failure frequencies from e.g. incident databases or fault trees.
4.3 QRA methodology
A QRA gives insight into the risks to human life of a certain activity by calculating the potential hazardous effects of a
variety of scenarios as well as considering the probability of occurrence of these scenarios. The QRA methodology is
visualized in the figure underneath.
1. Establishing the context
2. Hazard identification
3. Frequency analysis4. Consequence
analysis
5. Risk calculationand evaluation
6. Reporting
A. Iteration loop:- mitigating measures
- revision- expansion
Figure 2: QRA methodology
In general, a QRA tries to answer six simple questions. Beside each question, the technical term is listed for that activity
in the QRA:
1. What can go wrong? Hazard identification
2. How bad? Consequence analysis
3. How often? Frequency analysis
4. What is the risk? Risk calculation
5 For instance, the RIVM memo /10/ assumes an immediate ignition probability of 1 for gaseous hydrogen and 0.9 for liquid hydrogen. These specific parameters
should be captured in a QRA calculation methodology for hydrogen installations, such as bunker stations.

DNV – Report No. 10254098-1, Rev. 1 – www.dnv.com Page 16
5. So What? Risk assessment (or evaluation)
6. What do I do? Risk management (risk mitigation measures)
These activities are further explained below.
What can go wrong? Hazard identification
Potential hazards to people can arise if Loss of Containment (LoC) of hazardous substances occurs. Several LoC-
scenarios associated with failure of equipment are defined for the QRA. The failure cases (scenarios) for the selected
equipment items must be taken from the Dutch Reference Manual Bevi Risk Assessments /8/.
How bad? Consequence analysis
In parallel with the frequency analysis, consequence analysis (modelling) evaluates the resulting effects if the accidents
occur, and their impact on people. Ignited flammable releases can result in various consequences such as jet-, pool-, or
flash fire or vapour cloud explosions depending on the type of scenario and time and place of ignition. The consequence
assessment must be carried out using recognized and validated consequence modelling tools that can determine the
resulting effects and their impact on people. The consequences for the scenarios in a Dutch QRA are calculated by
Phast 8.3 (incorporated in Safeti-NL 8.3).
How often? Frequency analysis
After the hazards of a system or activity have been identified, the next step in performing the QRA is to estimate the
frequency at which the hazardous events (scenarios) may occur. Default failure frequencies for the scenarios must be
taken from the Reference Manual /8/ and are adjusted for the annual bunkering time.
What is the risk? Risk calculation
Once the potential physical damage zones are estimated by a consequence analysis, the probability of actual damage
realization (i.e. safety risk) is calculated by taking various event probabilities into account. For example, frequent
occurrence of an undesirable event by itself may not cause damage. Actual damage realization depends on several
event probabilities like:
• Weather stability class;
• Wind direction probability;
• Wind velocity and stability probability;
• Ignition probability (immediate and delayed);
• Presence of people (population) in the effect zone (only relevant for societal risk).
The likelihood of the damage realization is determined by an event tree analysis taking the above event probabilities into
account. Another important factor that determines the actual damage caused is the vulnerability of people/property in
the effected zone and the time of exposure using e.g. probit functions or other vulnerability criteria.
The software program used to calculate the risk in the Netherlands is Safeti-NL 8.3. Fixed model parameters are
incorporated in Safeti-NL, which cannot be modified.
So What? Risk assessment
The next stage is to introduce criteria which are yardsticks to indicate whether the risks are “acceptable”, “tolerable” or
“negligible” or to make some other value-judgment about their significance. This step begins to introduce non-technical
issues of risk acceptability and decision making, and the process is then known as risk assessment.

DNV – Report No. 10254098-1, Rev. 1 – www.dnv.com Page 17
What do I do? Risk management
In order to make the risks acceptable or the safety distances smaller, risk reduction measures may be necessary. The
benefits from these mitigating measures can be evaluated by recalculating the risk. Detailed investigation of risk
mitigation measures and their impact on the calculated risk is normally only performed when the calculated risks are
evaluated as unacceptable based on the risk criteria applied.

DNV – Report No. 10254098-1, Rev. 1 – www.dnv.com Page 18
5 LAND-USE PLANNING IN GERMANY
5.1 Legal background
The German ‘Störfallkommission’ (now called “Kommission für Anlagensicherheit” (KAS)) prepared guidelines in 2005
(2nd revised edition 2010) /11/ for implementing article 13 of the Seveso III Directive on land-use planning and ensuring
the necessary distances between major hazard establishments and vulnerable objects. The requirements of Seveso
were transposed into German law primarily through Article 50 of the Federal Immission Control Act (BlmSchG) and by
amending Article 9 of the Federal building code (Baugesetzbuch, BauBG).
5.2 Approach & consequence-based thresholds
Germany has adopted a simplified version of a consequence-based approach (the deterministic approach with implicit
judgment of risk, see paragraph 3.1) to determine generic external safety distances. Distinction in the approach depends
on two situations:
1. Recommendation for safety distances for the land-use-planning without detailed information about the
establishment (‘greenfield sites’)
The relevant authority in Germany has to decide which industrial activities can be projected for different areas
based on the distances provided in appendix 1 of KAS-18 /11/. These are generic safety distances (so called
“Achtungsabstände”) based on the declared substances stored or used by the establishment. The distance
requirements are divided into four classes, with distances of: 200, 500, 900 and 1500 m. The latter distances are
based on a consequence calculation of a release scenario with the following parameters:
o Leakage of the dangerous substance from a 490 mm2 hole (corresponds to a rupture of a pipe with a nominal
diameter of 25 mm)
o Flammable substances ignite immediately
o Atmospheric parameters and the dispersion model are based on the VDI6 guideline 3783 Blatt 1 for low density
gases and Blatt 2 for heavy gas dispersion.
o Effect distances are calculated for the following end-point (threshold) values and the maximum value is taken:
▪ 1.6 kW/m2 for thermal radiation
▪ 0.1 bar for overpressure
▪ For toxic substances the EPRG-2 value7 is calculated
2. Planning in the surrounding of industrial activities with information.
This is often the case when an operator/company plans to extend/change an operation or a new development
is planned in the surrounding of an existing industrial activity. In this both cases, the hazardous potential of the
handled material is usually well-known, so the required safety distances can be calculated based on a more
detailed approach. If the so called “Achtungsabstand” (distance of respect or safety distance) will be underrun
in an individual case, a systematic determination of the appropriate safety distance has to be performed based
on the precise location and the nature of the industrial activity. Consequence calculations can be performed for
specific release scenarios and under consideration of the actual safety measures in place to prevent and/or to
mitigate the consequence of the specific accident scenario. In variation of the approach described under point
1 (or chapter 3.1 in KAS-18) some freedom is permitted in selecting the scenario parameters (e.g. a specific
6 Association of German Engineers (“Verein Deutscher Ingenieure”). See http://www.vdi.eu/guidelines/ 7 The EPRG-2 value for a substance is the maximum airborne concentration below which nearly all individuals could be exposed for up to 1 hour without experiencing
or developing irreversible or other serious health effects or symptoms which could impair an individual's ability to take protective action.

DNV – Report No. 10254098-1, Rev. 1 – www.dnv.com Page 19
hole size can be chosen), but the calculation is limited to the assumptions provided in chapter 3.2 of KAS-18
(page 12-14). The conventions given in KAS-18 must be respected in each concrete determination of
appropriate safety distances in order to ensure the comparability and reproducibility of the results. It is,
however, allowed to use other (than VDI) validated software tools if the tools are calibrated against the KAS-18
guideline9 (e.g. Phast 8.4, which has implemented state of the art dispersion (UDM10) and consequence
models implemented). For the individual determination of appropriate safety distances the approach,
calculation methods and (model) assumptions should be properly documented in a detailed report. If the
individual case calculation is not done by the authority itself, it is recommended that the consequence
calculation and the determination of the safety distances is performed by a nominated expert according § 29 a
BImSchG. The selected approach should then be communicated to the authority in an early stage.
Table 3: Recommended external safety distances* to be used in Germany when no detailed information is available, adopted from KAS-18 /11/.
Class I, required distance: 200m
Class II, required distance: 500m
Class III, required distance: 900m
Class IV, required distance: 1500m
Ethylene oxide
Acrylnitrile
Hydrogen chloride
Methanol
Propane (F-gas)
Benzene
Oleum 65% (Sulphur trioxide)
Bromine
Ammonia
Hydrogen fluoride
Fluorine
Sulphur dioxide
Hydrogen sulphide
Formaldehyde (>90%)
Hydrogen cyanide
Phosgene
Acrolein
Chlorine
*Note: Hydrogen is currently not yet categorized.
5.3 Application of external safety distances
The external safety distances are to be understood as consultation distances (i.e. not as a hard criterion). The safety
distance apply for the following land-use planning scenarios:
• Identification of new building zones for establishments
• Identification of site for extensions to existing establishments
• Sensitive land use (i.e. vulnerable objects) moving closer to existing establishments
The safety distance only apply to human risk receptors and not to other risk receptors under article 50 of the Federal
Immission Control Act. Furthermore, the distances do not apply to: permitting individual projects inside the
establishment, existing developments and external emergency planning.
The recommended safety distance can be exceeded under certain conditions according § 31 paragraph 1 BauGB. In
that case it can be assumed that prevention at the planning level has been sufficient in order to limit as much as
possible the effects of major accidents, and that the planning-related protection objective stipulated in Article 50 of the
Federal Immission Control Act is met.
The zones resulting from the safety distance should not be understood as areas free of buildings. Within these zones
less sensitive areas/usages than those described in article 50 (first sentence) of the Federal Immission Control Act may
be planned. Specific guidance is developed (KAS-18, see below), which contains advice on which usages and/or
objects are to be considered sensitive (i.e. vulnerable) within the meaning of article 50.
According article 12 of the Seveso-III Directive the member states shall ensure during the LUP process that appropriate
safety distances are preserved between:
9 “Fachtagung Anlagensicherheit”, Köthen, 07.-08.11.2013, Dipl.-Ing. Jürgen Farsbotter & Dipl.-Ing. Sibylle Mayer, „Land-Use-Planing“, Practical Experiences with the
application of the KAS-18 guideline” (deutsch: Praktische Erfahrungen bei der Anwendung des Leitfadens KAS-18). 10 Unified Dispersion Model

DNV – Report No. 10254098-1, Rev. 1 – www.dnv.com Page 20
• Industrial activities (falling under the Störfall-Verordnung) on the one hand and
• Residential areas, buildings and areas of public use, major transport routes as far as possible, recreational
areas and areas of particular natural sensitivity
Typical sensitive objects for each category are given below:
• Residential areas (e.g. apartments, houses, block of flats etc.)
• Buildings and areas of public use (e.g. stores, shops, educational establishments, child care, etc.)
• Major transport routes (as far as possible) – (e.g. public roads and streets)
• Recreational area and areas of particular sensitivity (e.g. park areas, protected nature, etc.)
All other objects would normally be allowed within the calculated safety distance.
5.4 Guidelines
The guidance document KAS-18 /11/ offers guidance, assessment methods and recommendations with respect to the
consequence-based safety distance. Key principles of this guideline are stipulated in this paragraph and also
given/summarized underneath:
• The KAS-18 is a “guideline” that helps especially authorities responsible for the LUP to determine safety
distances and to comply with § 50 BImSchG.
• The intention of the KAS-18 guideline is not to predict, describe and evaluate a real accident scenario (also if
you have detailed information this is not the intention of the guideline).
• The frequency of an accident scenario will not be considered at all and it is also not important whether a
bunkering activity takes place day and night all the week or only for some hours 1-2 times per week.
• The condition/maintenance of an operation will be also not considered, e.g. the safety distance is the same for
poorly maintained operations and operations with good maintenance practices.
• The number of vessels does not have an influence on the safety distance. If you have an operation A with 2
pressure vessels and an operation B with one pressure vessel (same as in operation A) the safety distances
would be the same. That means the risk potential will be completely taken out of the consideration in KAS-18.
• The different steps described in KAS-18 (source term, dispersion, evaluation) are defined as (simple)
requirements in order to assure comparability and reproducibility for all cases.

DNV – Report No. 10254098-1, Rev. 1 – www.dnv.com Page 21
6 HYDROGEN BUNKERING SCENARIOS
Safety distances are calculated for several hydrogen bunkering scenarios based on the applicable LUP methodologies
in the Netherlands and Germany as described in the previous two chapters. The bunkering scenarios are based on the
outcomes of RH2INE sub-study 1a: Safety framework conditions, SuAc 1.1b: Identification of hydrogen bunkering
scenarios for inland navigational vessels /1/. The SuAc 1.1b report contains a short list of the most feasible IWT
hydrogen bunkering scenarios as determined in a workshop held with the RH2INE consortium participants and
stakeholders.
The following bunkering scenarios are considered in this study:
1. Swapping containers with pressurized hydrogen at container terminals
a. Start-up case: swapping 300 bar containers (no storage in stack)
b. Future case: swapping 500 bar containers (with storage in stack)
2. Bunkering of gaseous hydrogen via hose to fixed tanks on board
a. Start-up case: truck-to-ship bunkering with tube-trailer (300 bar) and compressor pressurize hydrogen
to 500 bar and slow fill with 60 g/s to storage on board
b. Future case: bunker station to ship with onshore storage (380 bar) and bunkering based on pressure
balancing and cascade filling at low pressure storage on board (250 bar), achieving a fast filling rate
(3.000 kg/h)
3. Truck-to-ship bunkering of liquid hydrogen
4. Truck-to-ship bunkering of liquid ammonia
a. Bunkering of refrigerated liquid ammonia (-34 °C)
b. Bunkering of pressurized liquid ammonia (9 barg)
5. Truck-to-ship bunkering of methanol
The bunkering scenarios are further detailed below. Relevant starting points, parameters & assumptions for each
scenario that are needed for safety distance calculations are provided in Appendix A.
Scenario 1A: swapping containers with pressurized hydrogen (300 bar) at container terminals (start-up case)
At a container terminal, tube-containers or containers with vertical cylinders with a volume inventory of 44 m3 gaseous
hydrogen at 300 bar (900 kg) are hoisted directly from a trailer onto a hydrogen propelled vessel by a crane. Three
hydrogen containers are swapped per week (low demand case).
Scenario 1B: swapping containers with pressurized hydrogen (500 bar) at container terminals (Future case)
At a container terminal, containers with an inventory of 44 m3 gaseous hydrogen at 500 bar (1370 kg) are hoisted
directly from the stack onto a vessel. The stack contains on average 10 gaseous hydrogen containers. Two hydrogen
containers are hoisted onto a vessel per day (high demand case). The supply of containers to the container terminal can
take place via road (trailers), rail (train wagons) or water (e.g. container barges).
Scenario 2A: Truck-to-ship bunkering of gaseous hydrogen via hose to fixed tanks on board (start-up case)
A vessel is bunkered with gaseous hydrogen from a tube-trailer (300 bar). The tube-trailer is connected via hoses to a
compressor which compresses the gas to 500 bar that is in turn supplied to the receiving vessel. The bunker rate is
controlled at 60 g/s to prevent excessive heating caused by adiabatic compression. A vessel (e.g. ferry) is bunkered

DNV – Report No. 10254098-1, Rev. 1 – www.dnv.com Page 22
once per day at a fixed location during nighttime (365 bunkering operations per year). The bunker volume equals the
inventory of one tube-trailer (900 kg). The bunker duration is 4 hours and 10 minutes.
Scenario 2B: Bunker station to ship, bunkering of gaseous hydrogen via hose to fixed tanks on board (future
case)
Gaseous hydrogen is supplied to the bunker station via an incoming hydrogen pipeline (20 bar). A compressor
pressurizes the gas to 380 bar for storage into 10 (onshore) tube-containers. From the tube-containers, hydrogen is
transferred through a pipeline with flexible joints to a bunker pontoon at which a receiving vessel is moored. The vessel
is bunkered via two hose connections. Using pressure balancing (at relatively low pressures) and cascade filling and
thereby avoiding problems of excessive adiabatic heating, a bunker rate of 3.000 kg/h is achieved. The onboard storage
pressure is 250 bar. The fuel storage capacity is 2 x 800 kg (1600 kg). With a bunker rate of 3.000 kg/h this results in a
bunker duration just over half an hour, conservatively assuming that the bunker volume is the same as the onboard fuel
storage capacity. 1500 bunker operations are carried out per year (a little over 4 bunkering operations per day), which is
assumed to be a feasible business case for a bunker station.
Scenario 3: Truck-to-ship bunkering of liquid hydrogen
Vessels are bunkered with liquid hydrogen from a trailer using a cryogenic pump and with a bunker rate of 65 m3/h. The
trailer is connected to a filling point with means of a short hose. An insulated pipeline runs from the filling point into a
bunker boom. The outboard side of the bunker boom is a short 2 inch bunker hose that is connected to the bunker
manifold of the receiving vessel. The vessel has a fuel tank capacity of 100 m3. One vessel is bunkered per day at the
same location (365 bunker operations per year), requiring 2 trailers per bunker operation to meet the bunker demand
(50 m3 per trailer).
Scenario 4A: Truck-to-ship bunkering of refrigerated liquid ammonia
Vessels are bunkered with refrigerated liquid ammonia from a trailer using a pump with a bunker rate of 65 m3/h. The
temperature of refrigerated liquid ammonia is -34 °C at atmospheric pressure. The trailer is connected directly to the
vessel’s bunker manifold using a hose. The fuel tank capacity is 75 m3, which is scaled based on the difference in
energy density using the liquid hydrogen scenario (scenario 3, with 100 m3 fuel tank) as a reference. The bunker volume
is 50 m3 (inventory of one trailer) per operation, because it is assumed that a second trailer will not deliver only half of its
capacity. The number of bunker operations is determined based on the assumption that the vessel has the same yearly
energy demand as assumed in scenario 3 to allow for a meaningful comparison of bunkering the different liquid fuels
and associated risk profiles (and safety distances). Based on the difference in energy density between liquid ammonia
and liquid hydrogen, the required number of bunkering operations is determined at 549 per year to meet the same
demand.
Scenario 4B: Truck-to-ship bunkering of pressurized liquid ammonia
Vessels are bunkered with liquid ammonia from a trailer using a pump with a bunker rate of 65 m3/h. The pressure of
liquid ammonia is 9 barg at atmospheric temperature. The trailer is connected to the vessel’s manifold using a hose and
is bunkered at 12 barg. A vessel has a fuel tank capacity of 67 m3, scaled using the same approach as for scenario 4A.
The bunker volume is 50 m3 per operation. A total of 489 bunker operations per year are needed to meet the same
annual demand as for scenario 4A. Pressurized liquid ammonia has a slightly higher energy density than refrigerated
liquid ammonia therefore fewer bunkering operations are needed.
Scenario 5: Truck-to-ship bunkering of methanol
Vessels are bunkered with methanol from a trailer using a pump with a bunker rate of 65 m3/h. The trailer is connected
to the vessel’s manifold using a hose. The fuel tank capacity is 54 m3 based on differences in energy density (see
explanation under scenario 4A). 398 bunker operations are required to meet the same annual energy demand as in the
other truck-to-ship bunkering scenarios (3&4).

DNV – Report No. 10254098-1, Rev. 1 – www.dnv.com Page 23
7 RESULTS
7.1 External safety distances
The calculated external safety distances per hydrogen bunkering scenario as determined in accordance with the
applicable LUP approach in the Netherlands and Germany are given in Table 4. Reference is made to Appendix C for a
more accurate size and location of the calculated external safety zone (10-6/year risk contours) for bunkering in the
Netherlands. Detailed input and results regarding the calculated distances for bunkering in Germany are included in
Appendix B and Appendix D, respectively.
Table 4: Results for external safety distances
Scenario Description External safety distance [m]
The Netherlands*
Germany**
1a Swapping containers with pressurized hydrogen (300 bar) at
container terminals (start-up case) – no storage in stack
39 182
1b Swapping containers with pressurized hydrogen (500 bar) at
container terminals (future case) – storage in stack
129 230
2a Truck-to-ship bunkering of gaseous hydrogen via hose to fixed tanks
on board (start-up case)
37 96
2b Bunker station to ship, bunkering of gaseous hydrogen via hose to
fixed tanks on board (future case)
106 96
3 Truck-to-ship bunkering of liquid hydrogen 82 70
4a Truck-to-ship bunkering of refrigerated liquid ammonia 175 205
4b Truck-to-ship bunkering of pressurized liquid ammonia 543 395
5 Truck-to-ship bunkering of methanol 79 67
*Measured from the receiving vessel’s bunker manifold to the boundary of the 10-6/year location-specific risk contour (see Appendix C). For swapping containers, the distance is measured from the location of the containers on the vessel in the direction land inwards.
**Measured from possible leak locations, typically the distance is measured from the site boundary
The zones resulting from the external safety distances in the Netherlands must be free of vulnerable objects (e.g.
residential areas, hospitals). Objects with limited vulnerability (e.g. isolated housing, small office buildings) can only be
allowed to be present in the zone if it is sufficiently motivated.
The zones resulting from the external safety distances in Germany should not be understood as areas free of buildings.
Within these zones less sensitive areas/usages than those described in article 50 (first sentence) of the Federal
Immission Control Act may be planned. Specific guidance is developed (KAS-18), which contains advice on which
usages and/or objects are to be considered sensitive (i.e. vulnerable) within the meaning of article 50.
The following is concluded from the results in Table 4:
The Netherlands
The external safety distances for swapping hydrogen containers at container terminals are relatively small (39 m) in the
Netherlands when containers are directly loaded from trailer onto the receiving vessel. However, in the future case when
demand grows and storage of containers in the stack might be needed (to create a buffer stock), the external safety
distance could increase with about a factor 3. This should normally not be a problem for container terminals because of
their layout and location, which provides sufficient stand-off distance to vulnerable objects. Bunkering of gaseous
hydrogen via hose results in relatively small distances (approx. 40 m) when bunkering takes place directly from a (tube)-
trailer. The distance for bunker stations could go up to approximately 100 m.

DNV – Report No. 10254098-1, Rev. 1 – www.dnv.com Page 24
Germany
The external safety distances for swapping containers at container terminals are about a factor 2 larger than for
bunkering gaseous hydrogen with a hose. The reason for this difference is related to the potential for explosions with
high overpressures due to the level of confinement present at a container terminal. Typically, this level of confinement
(&congestion) is expected to be much less for truck-to-ship bunkering and bunker stations (scenario 2a&2b) as
bunkering will typically take place in an open area where the gas cannot accumulate in confined areas. If this is not the
case, the safety distances for scenario 1a/1b may be more appropriate.
The Netherlands & Germany
For truck-to-ship (TTS) bunkering of liquid hydrogen and methanol result in safety distances of approximately 70-80 m,
which are in line with calculated distances for TTS bunkering of LNG to inland vessels in the LNG Masterplan study of
2015 /12/. For bunkering ammonia, the safety distances are considerably larger and are caused by the high toxicity of
ammonia. The distances for pressurized ammonia are about a factor 2-3 larger than for bunkering refrigerated
ammonia. It will be challenging to introduce ammonia as a fuel in IWT due to the large safety distances for bunkering
ammonia with a hose. This could be showstopper for bunkering ammonia in inland ports and waterways where
residential areas and industries etc. could be nearby.
7.2 Focus areas
The distances for the calculated focus areas are provided in Table 5. These areas are only applicable in the Netherlands
and are based on new legislation that is expected to come into force in January 2022. Germany does not require the
determination of focus areas.
Table 5: Focus area distances
Scenario Description Fire area distance* [m]
Explosion area distance* [m]
Toxic area distance* [m]
1a Swapping containers with pressurized hydrogen (300
bar) at container terminals (start-up case) – no storage
in stack
110 128 -
1b Swapping containers with pressurized hydrogen (500
bar) at container terminals (future case) – storage in
stack
150 223 -
2a Truck-to-ship bunkering of gaseous hydrogen via hose
to fixed tanks on board (start-up case) 60 132 -
2b Bunker station to ship, bunkering of gaseous hydrogen
via hose to fixed tanks on board (future case) 105 195 -
3 Truck-to-ship bunkering of liquid hydrogen 150 185 -
4a Truck-to-ship bunkering of refrigerated liquid ammonia - - 777
4b Truck-to-ship bunkering of pressurized liquid ammonia - - 1203
5 Truck-to-ship bunkering of methanol 122 - -
*Measured from the receiving vessel’s bunker manifold to the boundary of the contours given in Appendix C. For swapping containers, the distance is measured from the location of the containers on the vessel in the direction land inwards.

DNV – Report No. 10254098-1, Rev. 1 – www.dnv.com Page 25
The following is observed from the above results:
• The explosion focus areas are all in the range of approximately 130 m – 220 m for bunkering hydrogen in
gaseous (via hose or container swapping) or liquid form.
• The fire focus areas are between 60 m – 150 m.
• The focus areas for bunkering ammonia are very large (in the range of 1 km) due to the high toxicity of
ammonia.
Within the areas, specific construction requirements may be enforced for buildings to offer protection against fire,
explosion or toxic impact to the occupants inside.
DNV – Report No. 10254098-1, Rev. 1 – www.dnv.com Page 26
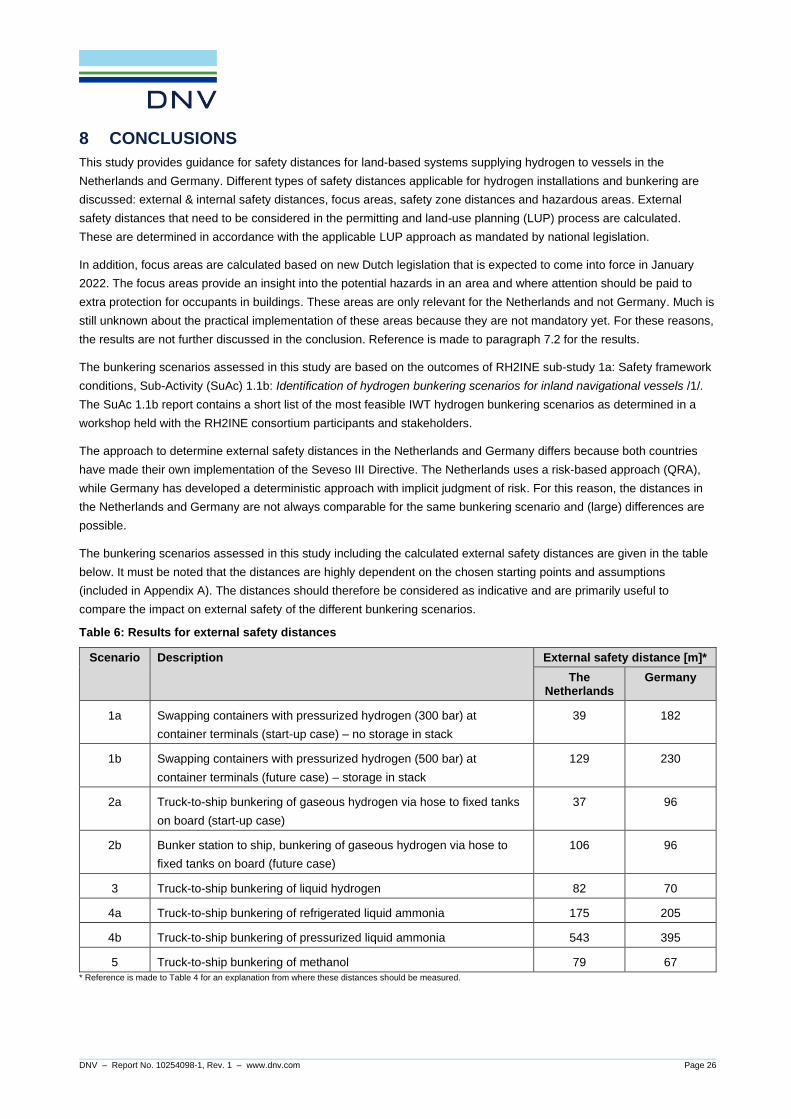
8 CONCLUSIONS
This study provides guidance for safety distances for land-based systems supplying hydrogen to vessels in the
Netherlands and Germany. Different types of safety distances applicable for hydrogen installations and bunkering are
discussed: external & internal safety distances, focus areas, safety zone distances and hazardous areas. External
safety distances that need to be considered in the permitting and land-use planning (LUP) process are calculated.
These are determined in accordance with the applicable LUP approach as mandated by national legislation.
In addition, focus areas are calculated based on new Dutch legislation that is expected to come into force in January
2022. The focus areas provide an insight into the potential hazards in an area and where attention should be paid to
extra protection for occupants in buildings. These areas are only relevant for the Netherlands and not Germany. Much is
still unknown about the practical implementation of these areas because they are not mandatory yet. For these reasons,
the results are not further discussed in the conclusion. Reference is made to paragraph 7.2 for the results.
The bunkering scenarios assessed in this study are based on the outcomes of RH2INE sub-study 1a: Safety framework
conditions, Sub-Activity (SuAc) 1.1b: Identification of hydrogen bunkering scenarios for inland navigational vessels /1/.
The SuAc 1.1b report contains a short list of the most feasible IWT hydrogen bunkering scenarios as determined in a
workshop held with the RH2INE consortium participants and stakeholders.
The approach to determine external safety distances in the Netherlands and Germany differs because both countries
have made their own implementation of the Seveso III Directive. The Netherlands uses a risk-based approach (QRA),
while Germany has developed a deterministic approach with implicit judgment of risk. For this reason, the distances in
the Netherlands and Germany are not always comparable for the same bunkering scenario and (large) differences are
possible.
The bunkering scenarios assessed in this study including the calculated external safety distances are given in the table
below. It must be noted that the distances are highly dependent on the chosen starting points and assumptions
(included in Appendix A). The distances should therefore be considered as indicative and are primarily useful to
compare the impact on external safety of the different bunkering scenarios.
Table 6: Results for external safety distances
Scenario Description External safety distance [m]*
The Netherlands
Germany
1a Swapping containers with pressurized hydrogen (300 bar) at
container terminals (start-up case) – no storage in stack
39 182
1b Swapping containers with pressurized hydrogen (500 bar) at
container terminals (future case) – storage in stack
129 230
2a Truck-to-ship bunkering of gaseous hydrogen via hose to fixed tanks
on board (start-up case)
37 96
2b Bunker station to ship, bunkering of gaseous hydrogen via hose to
fixed tanks on board (future case)
106 96
3 Truck-to-ship bunkering of liquid hydrogen 82 70
4a Truck-to-ship bunkering of refrigerated liquid ammonia 175 205
4b Truck-to-ship bunkering of pressurized liquid ammonia 543 395
5 Truck-to-ship bunkering of methanol 79 67
* Reference is made to Table 4 for an explanation from where these distances should be measured.
DNV – Report No. 10254098-1, Rev. 1 – www.dnv.com Page 27
The zones resulting from the external safety distances in the Netherlands must be free of vulnerable objects (e.g.
housing in residential areas, hospitals). Objects with limited vulnerability (e.g. isolated housing, small office buildings)
can only be allowed to be present in the zone if it is sufficiently motivated.
The zones resulting from the external safety distances in Germany should not be understood as areas free of buildings.
Within these zones less sensitive areas/usages than those described in article 50 (first sentence) of the Federal
Immission Control Act may be planned. Specific guidance is developed (KAS-18), which contains advice on which
usages and/or objects are to be considered sensitive (i.e. vulnerable) within the meaning of article 50.
The following is concluded from the results for external safety distances:
The Netherlands
The external safety distances for swapping hydrogen containers at container terminals are relatively small (39 m) in the
Netherlands when containers are directly loaded from trailer onto the receiving vessel. However, in the future case when
demand grows and storage of containers in the stack might be needed (to create a buffer stock), the external safety
distance could increase with about a factor 3. This should normally not be a problem for container terminals because of
their layout and location, which provides sufficient stand-off distance to vulnerable objects. Bunkering of gaseous
hydrogen via hose results in relatively small distances (approx. 40 m) when bunkering takes place directly from a (tube)-
trailer. The distance for bunker stations could go up to approximately 100 m.
Germany
The external safety distances for swapping containers at container terminals are about a factor 2 larger than for
bunkering gaseous hydrogen with a hose. The reason for this difference is related to the potential for explosions with
high overpressures due to the level of confinement present at a container terminal. Typically, this level of confinement
(&congestion) is expected to be much less for truck-to-ship bunkering and bunker stations (scenario 2a&2b) as
bunkering will typically take place in an open area where the gas cannot accumulate in confined areas. If this is not the
case, the safety distances for scenario 1a/1b may be more appropriate.
The Netherlands & Germany
For truck-to-ship (TTS) bunkering of liquid hydrogen and methanol result in safety distances of approximately 70-80 m,
which are in line with calculated distances for TTS bunkering of LNG to inland vessels in the LNG Masterplan study of
2015 /12/. For bunkering ammonia, the safety distances are considerably larger and are caused by the high toxicity of
ammonia. The distances for pressurized ammonia are about a factor 2-3 larger than for bunkering refrigerated
ammonia. It will be challenging to introduce ammonia as a fuel in IWT due to the large safety distances for bunkering
ammonia with a hose. This could be showstopper for bunkering ammonia in inland ports and waterways where
residential areas and industries etc. could be nearby.

DNV – Report No. 10254098-1, Rev. 1 – www.dnv.com Page 28
9 REFERENCES
/1/ DNV, RH2INE Sub-study 1a, Sub-activity 1.1b: “Hydrogen Bunkering Scenarios”, March 2021
/2/ EIGA report 75/07/E “Determination of safety distances”, 2007.
/3/ Dutch Standardization Institute (Nederlands Normalisatie-instituut, NEN) - PGS 35 (“Publicatiereeks
Gevaarlijke Stoffen”), Guideline for Hydrogen Refuelling Stations (HRS), April 2020.
/4/ Dutch Standardization Institute (Nederlands Normalisatie-instituut, NEN) - PGS 35 (“Publicatiereeks
Gevaarlijke Stoffen”), Report: “Internal Safety Distances for PGS 35”, version 1.0
/5/ Dutch Standardization Institute (Nederlands Normalisatie-instituut, NEN) - PGS 33-2 (“Publicatiereeks
Gevaarlijke Stoffen”), Guideline for LNG bunker stations (shore to ship), April 2020.
/6/ ISO/TS 18683, “Guidelines for Systems and Installations for Supply of LNG as Fuel to Ships”, 2015
/7/ IEC 60079-10-1, Explosive atmospheres - Part 10-1: Classification of areas - Explosive gas atmospheres,
2020
/8/ Dutch National Institute for Public Health and the Environment (Rijksinstituut voor Volksgezondheid en Milieu,
RIVM), Reference Manual Bevi Risk Assessment (Handleiding Risicoberekeningen Bevi), version 4.3, 1st of
January 2021
/9/ Guidelines for Quantitative Risk Assessment CPR18E (“Purple Book”), Committee for Prevention of
Disasters, 1999
/10/ Dutch National Institute for Public Health and the Environment (Rijksinstituut voor Volksgezondheid en Milieu,
RIVM), Memo Risk- and effect distances for hydrogen refueling stations for road vehicles, 3rd of October 2016
/11/ KAS – Commission on Process Safety. KAS-18: Recommendations for separation distances between
establishments covered by the Major Accidents Ordinance (Störfall-Verordnung) and areas worthy of
protection within the framework of land-use planning – implementation of article 50 of the Federal Immission
Control Act (BlmSchG); 2nd revised edition, Nov. 2010. Supplemented by KAS-32: Scenario specific questions
related to KAS-18; 2nd revised edition, Nov. 2015.
/12/ DNV, Safety Study LNG Masterplan for Rhine Port Group, Suac D 2.4.2, Part C: Comparison of risk
assessment tools, 2015

DNV – Report No. 10254098-1, Rev. 1 – www.dnv.com A-1
APPENDIX A
Starting points and assumptions for bunkering scenarios
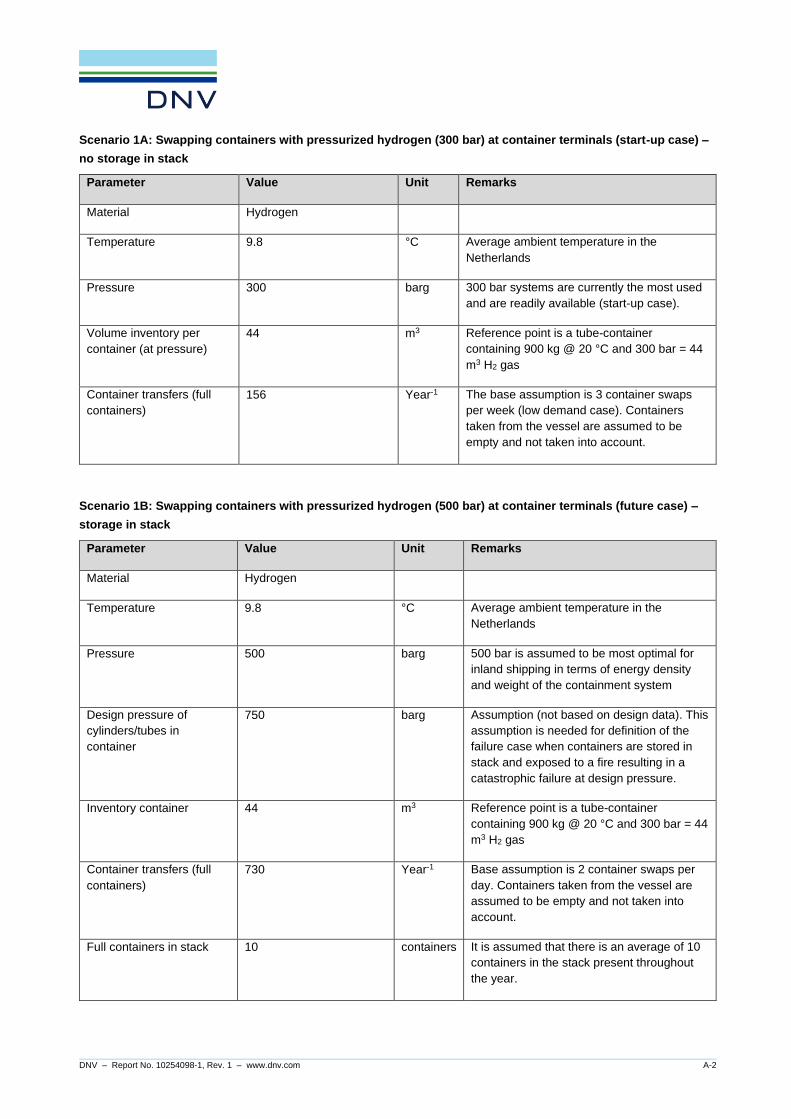
DNV – Report No. 10254098-1, Rev. 1 – www.dnv.com A-2
Scenario 1A: Swapping containers with pressurized hydrogen (300 bar) at container terminals (start-up case) –
no storage in stack
Parameter Value Unit Remarks
Material Hydrogen
Temperature 9.8 °C Average ambient temperature in the
Netherlands
Pressure 300 barg 300 bar systems are currently the most used
and are readily available (start-up case).
Volume inventory per
container (at pressure)
44 m3 Reference point is a tube-container
containing 900 kg @ 20 °C and 300 bar = 44
m3 H2 gas
Container transfers (full
containers)
156 Year-1 The base assumption is 3 container swaps
per week (low demand case). Containers
taken from the vessel are assumed to be
empty and not taken into account.
Scenario 1B: Swapping containers with pressurized hydrogen (500 bar) at container terminals (future case) –
storage in stack
Parameter Value Unit Remarks
Material Hydrogen
Temperature 9.8 °C Average ambient temperature in the
Netherlands
Pressure 500 barg 500 bar is assumed to be most optimal for
inland shipping in terms of energy density
and weight of the containment system
Design pressure of
cylinders/tubes in
container
750 barg Assumption (not based on design data). This
assumption is needed for definition of the
failure case when containers are stored in
stack and exposed to a fire resulting in a
catastrophic failure at design pressure.
Inventory container 44 m3 Reference point is a tube-container
containing 900 kg @ 20 °C and 300 bar = 44
m3 H2 gas
Container transfers (full
containers)
730 Year-1 Base assumption is 2 container swaps per
day. Containers taken from the vessel are
assumed to be empty and not taken into
account.
Full containers in stack 10 containers It is assumed that there is an average of 10
containers in the stack present throughout
the year.

DNV – Report No. 10254098-1, Rev. 1 – www.dnv.com A-3
Scenario 2A: Truck-to-ship bunkering of gaseous hydrogen via hose to fixed tanks on board (start-up case)
Parameter Value Unit Remarks
Material Hydrogen
Temperature 9.8 °C Average ambient temperature in the
Netherlands
Pressure trailer 300 barg
Bunker pressure 500 barg Using a compressor
Hose diameter 1 inch
Number of hoses 1 -
Maximum onboard storage
capacity
900 kg
Bunker volume (mass) 900 Kg Inventory one trailer
Bunker rate 60 g/s
Number of bunker
operations per year
365 Year-1 1 bunkering operation per day
Bunker hours 1522 h/year Based on bunker rate

DNV – Report No. 10254098-1, Rev. 1 – www.dnv.com A-4
Scenario 2B: Bunker station to ship, bunkering of gaseous hydrogen via hose to fixed tanks on board (future
case)
Parameter Value Unit Remarks
Material Hydrogen
Temperature 9.8 °C Average ambient temperature in the
Netherlands
Pressure storage onshore 380 barg
Pressure storage fuel
tanks on board
250 barg
Hose diameter 2 inch
Number of hoses 2 - Two 2-inch hoses are used simultaneously
Inventory onboard storage 2x800 Kg 2 tube-containers of each 800 kg at 250 bar
(e.g. 44 m3 inventory per tube-container)
Number of bunker
operations per year
1500 Year-1 Assumed to be a feasible business case for
a bunker station (based on previous
studies)
Bunker hours 800 h/year Based on 3000 kg/h, 1600 kg onboard
storage and 1500 operations per year
Hydrogen throughput 2.400.000 Kg/year Based on 1600 kg onboard storage and
1500 operations per year
Onshore storage capacity 10 x 44 m3 Assumption based on ~1.5x daily demand
to account for supply interruptions. 10 tube-
containers.

DNV – Report No. 10254098-1, Rev. 1 – www.dnv.com A-5
Scenario 3: Truck-to-ship bunkering of liquid hydrogen
Parameter Value Unit Remarks
Material Hydrogen
Temperature -246 °C Due to heat intake (trailer/hoses),
temperature will be a few degrees higher
than normal boiling point (-253 °C)
Bunker pressure 7 barg 7 barg bunker pressure, 5 barg onboard
storage pressure
Hose diameter 2 inch
Number of hoses 1 -
Inventory fuel tank 100 m3 Based on energy density LNG vs LH2
assuming equivalent to typical 40 m3 LNG
fuel tank for inland vessels based on
previous studies. Rounded to 100 m3
Bunker rate 65 m3/h Assumed 4000 kg/h bunker rate (@ -246 °C
and 7 barg)
Bunker volume (per
operation)
100 m3 Two trailers unload during one operation
Number of bunker
operations per year
365 Year-1 Assumed 1 bunkering operation per day
Bunker hours 562 h/year Based on 100 m3 onboard storage, 65 m3/h
bunker rate and 365 operations per year
Hydrogen throughput 2.248.000 Kg/year Based on bunker rate of 4000 kg/h and 562
hours per year
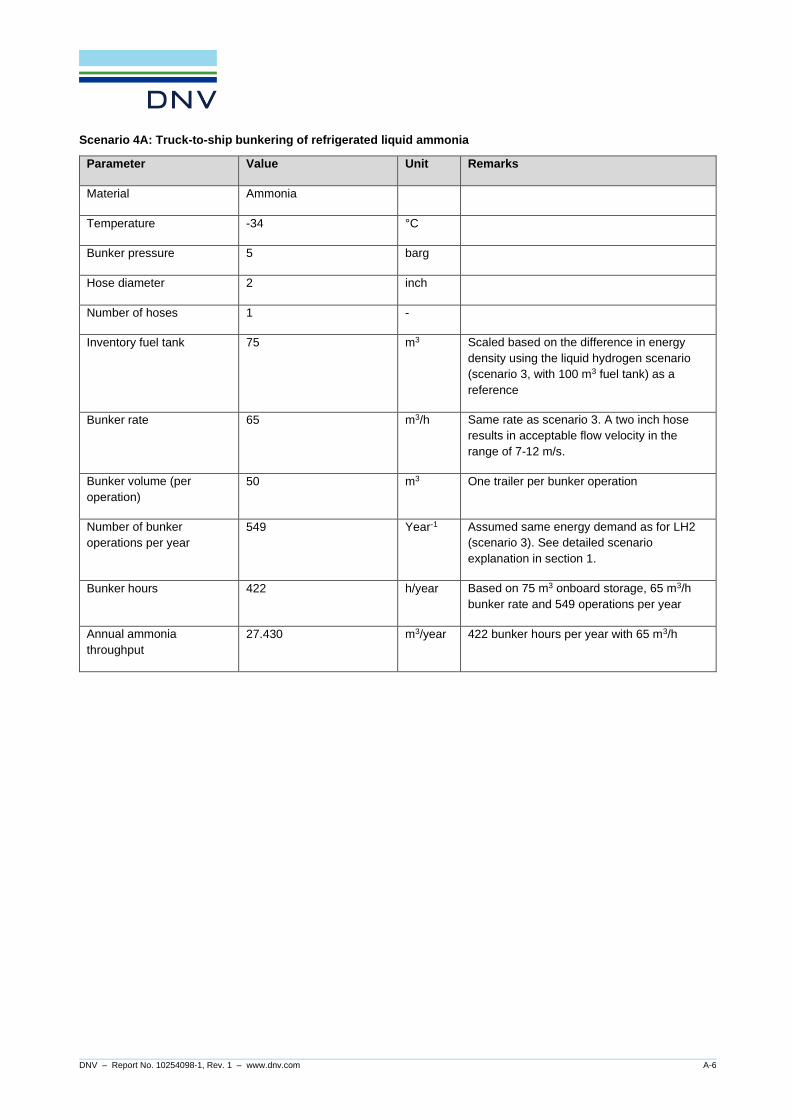
DNV – Report No. 10254098-1, Rev. 1 – www.dnv.com A-6
Scenario 4A: Truck-to-ship bunkering of refrigerated liquid ammonia
Parameter Value Unit Remarks
Material Ammonia
Temperature -34 °C
Bunker pressure 5 barg
Hose diameter 2 inch
Number of hoses 1 -
Inventory fuel tank 75 m3 Scaled based on the difference in energy
density using the liquid hydrogen scenario
(scenario 3, with 100 m3 fuel tank) as a
reference
Bunker rate 65 m3/h Same rate as scenario 3. A two inch hose
results in acceptable flow velocity in the
range of 7-12 m/s.
Bunker volume (per
operation)
50 m3 One trailer per bunker operation
Number of bunker
operations per year
549 Year-1 Assumed same energy demand as for LH2
(scenario 3). See detailed scenario
explanation in section 1.
Bunker hours 422 h/year Based on 75 m3 onboard storage, 65 m3/h
bunker rate and 549 operations per year
Annual ammonia
throughput
27.430 m3/year 422 bunker hours per year with 65 m3/h

DNV – Report No. 10254098-1, Rev. 1 – www.dnv.com A-7
Scenario 4B: Truck-to-ship bunkering of pressurized liquid ammonia
Parameter Value Unit Remarks
Material Ammonia
Temperature 9.8 °C
Bunker pressure 12 barg
Hose diameter 2 inch
Number of hoses 1 -
Inventory fuel tank 67 m3 Scaled based on the difference in energy
density using the liquid hydrogen scenario
(scenario 3, with 100 m3 fuel tank) as a
reference.
Bunker rate 65 m3/h See scenario 4A
Bunker volume (per
operation)
50 m3 One trailer per bunker operation
Number of bunker
operations per year
489 Year-1 Assumed same energy demand as for LH2
(scenario 3). See detailed scenario
explanation in section 1.
Bunker hours 376 h/year Based on 67 m3 onboard storage, 65 m3/h
bunker rate and 489 operations per year
Annual ammonia
throughput
24.440 m3/year 376 bunker hours per year and a bunker rate
of 65 m3/h
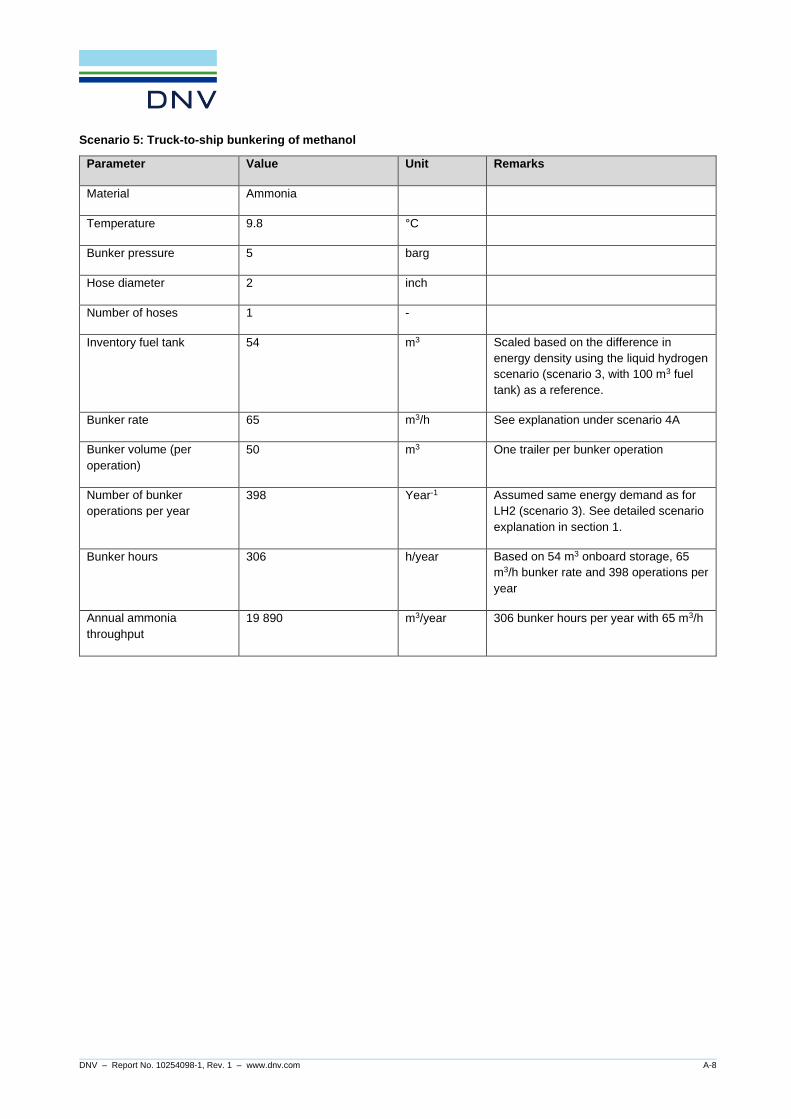
DNV – Report No. 10254098-1, Rev. 1 – www.dnv.com A-8
Scenario 5: Truck-to-ship bunkering of methanol
Parameter Value Unit Remarks
Material Ammonia
Temperature 9.8 °C
Bunker pressure 5 barg
Hose diameter 2 inch
Number of hoses 1 -
Inventory fuel tank 54 m3 Scaled based on the difference in
energy density using the liquid hydrogen
scenario (scenario 3, with 100 m3 fuel
tank) as a reference.
Bunker rate 65 m3/h See explanation under scenario 4A
Bunker volume (per
operation)
50 m3 One trailer per bunker operation
Number of bunker
operations per year
398 Year-1 Assumed same energy demand as for
LH2 (scenario 3). See detailed scenario
explanation in section 1.
Bunker hours 306 h/year Based on 54 m3 onboard storage, 65
m3/h bunker rate and 398 operations per
year
Annual ammonia
throughput
19 890 m3/year 306 bunker hours per year with 65 m3/h

DNV – Report No. 10254098-1, Rev. 1 – www.dnv.com B-1
APPENDIX B
Scenario-specific input parameters for KAS-18 calculations

DNV – Report No. 10254098-1, Rev. 1 – www.dnv.com B-2
Scenario 1a: Swapping containers with pressurized hydrogen (300 bar) at container terminals (start-up case) – no storage in stack
Hazardous substance: Hydrogen
Maximum volume in trailer: V = 44 m³
Temperature: T = 20 °C
Pressure: P = 300 barg
Hole size: A = 490 mm² ➔ D = 25 mm
Discharge coefficient: 0.62 (sharp)
Roughness length: 1000 mm; regular large obstacle coverage
Release duration (calculated): 164 s
Discharge rate (Phast): 5.5 kg/s
Released amount: 899 kg
Multi Energy (ME) strength curve: 10 (due to high reactivity)11
Scenario 1b: Swapping containers with pressurized hydrogen (500 bar) at container terminals (future case) –
storage in stack
Hazardous substance: Hydrogen
Maximum volume in trailer: V = 44 m³
Temperature: T = 20 °C
Pressure: P = 500 barg
Hole size: A = 490 mm² ➔ D = 25 mm
Design pressure container: 750 barg
Discharge coefficient: 0.62 (sharp)
Roughness length: 1000 mm; regular large obstacle coverage
Release duration (calculated): 151 s
Discharge rate (Phast): 8.9 kg/s
Released amount: 1334 kg
Multi Energy (ME) strength curve: 10 (due to high reactivity)11
Scenario 2a: Truck-to-ship bunkering of gaseous hydrogen via hose to fixed tanks on board (start-up case)
Hazardous substance: Hydrogen
Maximum volume in vessel: V = 44 m³
Temperature: T = 20 °C
Pressure: P = 500 barg
Hole size: A = 490 mm² ➔ D = 25 mm (= hose diameter)
Pipe length: 5 m
Roughness length: 300 mm; relatively flat area with small buildings
Release duration: 120 s; truck-to-ship bunkering operation is supervised, operator
intervention is assumed that stops the release after latest 120 s
Discharge rate (Phast): 7.4 kg/s
11 Hydrogen is a high reactive material and there are expected to be congested areas on a container terminal, therefore a ME strength curve of 10 (highest) is used
for the explosion calculations.

DNV – Report No. 10254098-1, Rev. 1 – www.dnv.com B-3
Released amount (calculated): 889 kg
Multi Energy (ME) strength curve: 2 (default unconfined explosion strength)12
Scenario 2b: Bunker station to ship, bunkering of gaseous hydrogen via hose to fixed tanks on board (future
case)
Hazardous substance: Hydrogen
Maximum volume in container: V = 88 m³ (assumed two tube containers in open connection)
Temperature: T = 20 °C
Pressure: P = 380 barg
Hole size: A = 490 mm² ➔ D = 25 mm
Discharge coefficient: 0.62 (sharp)
Roughness length: 300 mm; relatively flat area with small buildings
Release duration: 120 s; bunkering operation is supervised, operator intervention is
assumed that stops the release after latest 120 s
Discharge rate (Phast): 6.8 kg/s
Released amount (calculated): 822 kg
Multi Energy (ME) strength curve: 2 (default unconfined explosion strength)13
Scenario 3: Truck-to-ship bunkering of liquid hydrogen
Hazardous substance: Hydrogen
Maximum volume (fuel tank vessel)14: V = 100 m³
Temperature: T = -246 °C
Pressure: P = 7 barg
Hole size: A = 490 mm² ➔ D = 25 mm
Discharge coefficient: 0.62 (sharp)
Roughness length: 300 mm; relatively flat area with small buildings
Release duration: 120 s; truck-to-ship bunkering operation is supervised, operator
intervention is assumed that stops the release after latest 120 s
Discharge rate (Phast): 2.8 kg/s
Released amount (calculated): 335 kg
Multi Energy (ME) strength curve: 2 (default unconfined explosion strength)15
12 During truck-to-ship bunkering, it is not expected that flammable gas clouds (due to leakage scenarios) can reach congested areas. Typically, truck-to-ship
bunkering will take place in an open area. In an open space, outdoors situation, there is no or limited confinement. Additionally, since hydrogen is lighter than air it will lift off, reducing the probability of gas accumulating in a congested area. For the explosion analysis, however, it is assumed that a typical strength factor would be 2 applicable (slight confinement, e.g. fences, bunds, or hedges).
13 During truck-to-ship bunkering, it is not expected that flammable gas clouds (due to leakage scenarios) can reach congested areas. Typically, truck-to-ship
bunkering will take place in an open area. In an open space, outdoors situation, there is no or limited confinement. Additionally, since hydrogen is lighter than air it will lift off, reducing the probability of gas accumulating in a congested area. For the explosion analysis, however, it is assumed that a typical strength factor would be 2 applicable (slight confinement, e.g. fences, bunds, or hedges).
14 It is assumed that the vessel will only bunker if it can accept the load of a full truck. The maximum amount of material in the truck + vessel is equal to the maximum
storage capacity of the vessel. For the LH2 vessel a storage tank of 100 m3 is assumed, this is based on previous studies with inland LNG vessels with a typical storage capacity of 40 m3 LNG. Using the energy density of LNG and LH2 the storage capacity for LH2 is calculated so that it carries a similar amount of energy to a typical LNG inland vessel.
15 During truck-to-ship bunkering, it is not expected that flammable gas clouds (due to leakage scenarios) can reach congested areas. Typically, truck-to-ship
bunkering will take place in an open area. In an open space, outdoors situation, there is no or limited confinement. Additionally, since hydrogen is lighter than air it will lift off, reducing the probability of gas accumulating in a congested area. For the explosion analysis, however, it is assumed that a typical strength factor would be 2 applicable (slight confinement, e.g. fences, bunds, or hedges).

DNV – Report No. 10254098-1, Rev. 1 – www.dnv.com B-4
Scenario 4a: Truck-to-ship bunkering of refrigerated liquid ammonia
Hazardous substance: Ammonia
Maximum volume (fuel tank vessel)16: V = 75 m³
Temperature: T = -34 °C
Pressure: P = 5 barg
Hole size: A = 490 mm² ➔ D = 25 mm
Discharge coefficient: 0.62 (sharp)
Roughness length: 300 mm; relatively flat area with small buildings
Release duration: 120 s; truck-to-ship bunkering operation is supervised, operator
intervention is assumed that stops the release after latest 120 s
Discharge rate (Phast): 9.0 kg/s
Released amount (calculated): 1076 kg
Multi Energy (ME) strength curve: 2 (default unconfined explosion strength)17
Scenario 4b: Truck-to-ship bunkering of pressurized liquid ammonia
Hazardous substance: Ammonia
Maximum volume (fuel tank vessel)18: V = 67 m³
Temperature: T = 20 °C
Pressure: P = 12 barg
Hole size: A = 490 mm² ➔ D = 25 mm
Discharge coefficient: 0.62 (sharp)
Roughness length: 300 mm; relatively flat area with small buildings
Release duration: 120 s; truck-to-ship bunkering operation is supervised, operator
intervention is assumed that stops the release after latest 120 s
Discharge rate (Phast): 13 kg/s
Released amount (calculated): 1576 kg
Multi Energy (ME) strength curve: 2 (default unconfined explosion strength)19
16 It is assumed that the vessel will only bunker if it can accept the load of a full truck. The maximum amount of material in the truck + vessel is equal to the maximum
storage capacity of the vessel. Based on the energy density of ammonia and LH2, the storage capacity for ammonia is calculated so that the vessel carries a similar amount of energy as the LH2 vessel (scenario 3).
17 During truck-to-ship bunkering, it is not expected that flammable gas clouds (due to leakage scenarios) can reach congested areas. Typically, truck-to-ship
bunkering will take place in an open area. In an open space, outdoors situation, there is no or limited confinement. For the explosion analysis, however, it is assumed that a typical strength factor would be 2 applicable (slight confinement, e.g. fences, bunds, or hedges).
18 It is assumed that the vessel will only bunker if it can accept the load of a full truck. The maximum amount of material in the truck + vessel is equal to the maximum
storage capacity of the vessel. Based on the energy density of ammonia and LH2, the storage capacity for ammonia is calculated so that the vessel carries a similar amount of energy as the LH2 vessel (scenario 3).
19 During truck-to-ship bunkering, it is not expected that flammable gas clouds (due to leakage scenarios) can reach congested areas. Typically, truck-to-ship
bunkering will take place in an open area. In an open space, outdoors situation, there is no or limited confinement. For the explosion analysis, however, it is assumed that a typical strength factor would be 2 applicable (slight confinement, e.g. fences, bunds, or hedges).
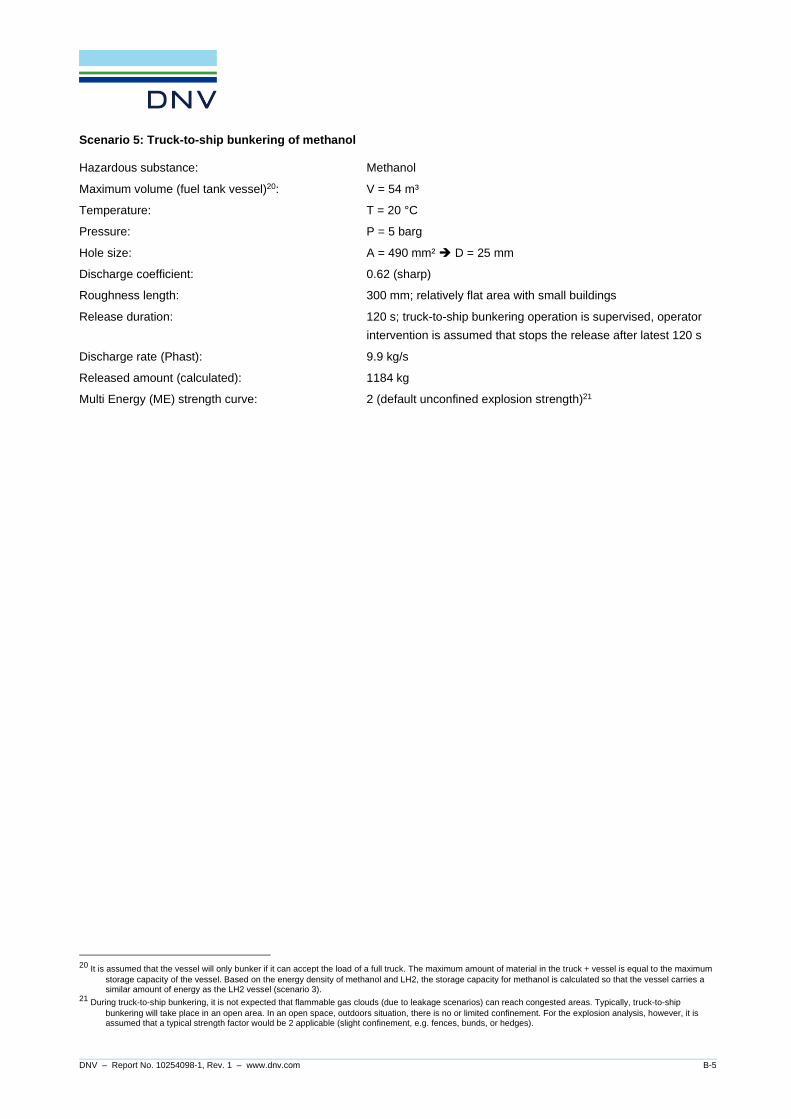
DNV – Report No. 10254098-1, Rev. 1 – www.dnv.com B-5
Scenario 5: Truck-to-ship bunkering of methanol
Hazardous substance: Methanol
Maximum volume (fuel tank vessel)20: V = 54 m³
Temperature: T = 20 °C
Pressure: P = 5 barg
Hole size: A = 490 mm² ➔ D = 25 mm
Discharge coefficient: 0.62 (sharp)
Roughness length: 300 mm; relatively flat area with small buildings
Release duration: 120 s; truck-to-ship bunkering operation is supervised, operator
intervention is assumed that stops the release after latest 120 s
Discharge rate (Phast): 9.9 kg/s
Released amount (calculated): 1184 kg
Multi Energy (ME) strength curve: 2 (default unconfined explosion strength)21
20 It is assumed that the vessel will only bunker if it can accept the load of a full truck. The maximum amount of material in the truck + vessel is equal to the maximum
storage capacity of the vessel. Based on the energy density of methanol and LH2, the storage capacity for methanol is calculated so that the vessel carries a similar amount of energy as the LH2 vessel (scenario 3).
21 During truck-to-ship bunkering, it is not expected that flammable gas clouds (due to leakage scenarios) can reach congested areas. Typically, truck-to-ship
bunkering will take place in an open area. In an open space, outdoors situation, there is no or limited confinement. For the explosion analysis, however, it is assumed that a typical strength factor would be 2 applicable (slight confinement, e.g. fences, bunds, or hedges).

DNV – Report No. 10254098-1, Rev. 1 – www.dnv.com C-1
APPENDIX C
Detailed QRA results (risk contours & focus areas)
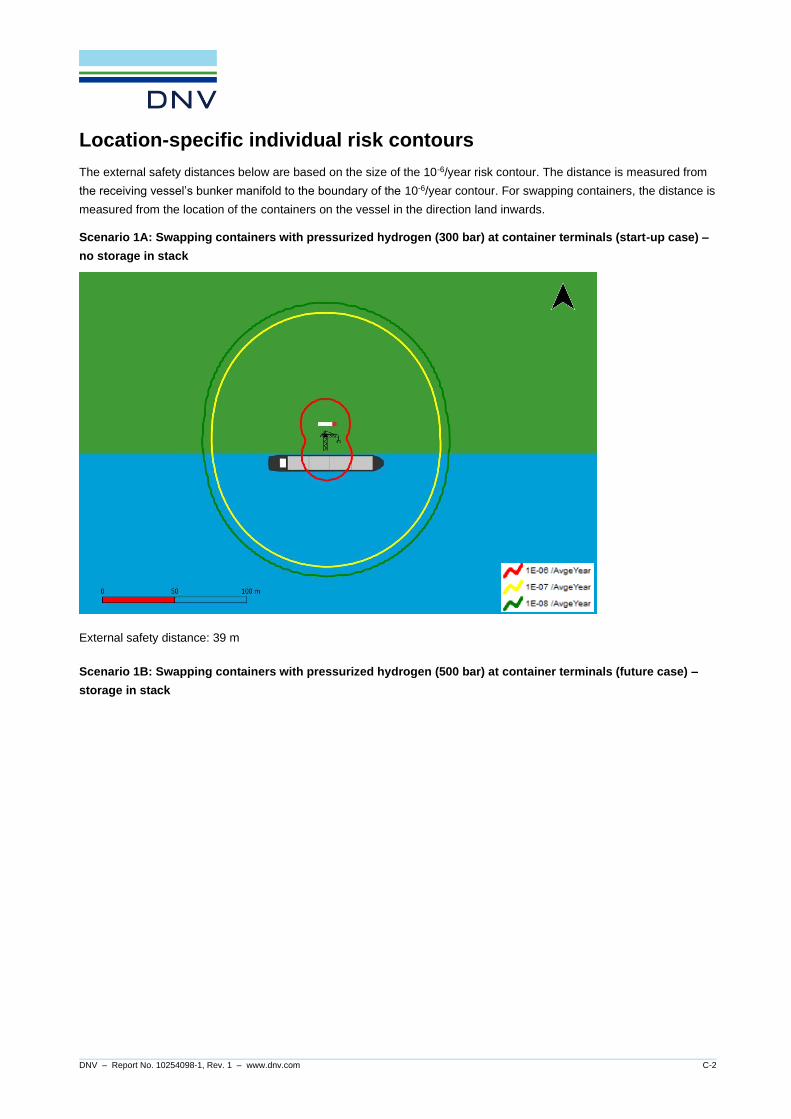
DNV – Report No. 10254098-1, Rev. 1 – www.dnv.com C-2
Location-specific individual risk contours
The external safety distances below are based on the size of the 10-6/year risk contour. The distance is measured from
the receiving vessel’s bunker manifold to the boundary of the 10-6/year contour. For swapping containers, the distance is
measured from the location of the containers on the vessel in the direction land inwards.
Scenario 1A: Swapping containers with pressurized hydrogen (300 bar) at container terminals (start-up case) –
no storage in stack
External safety distance: 39 m
Scenario 1B: Swapping containers with pressurized hydrogen (500 bar) at container terminals (future case) –
storage in stack

DNV – Report No. 10254098-1, Rev. 1 – www.dnv.com C-3
External safety distance: 129 m
Scenario 2A: Truck-to-ship bunkering of gaseous hydrogen via hose to fixed tanks on board (start-up case)
External safety distance: 37 m
0.00 0.04 0.08
km

DNV – Report No. 10254098-1, Rev. 1 – www.dnv.com C-4
Scenario 2B: Bunker station to ship, bunkering of gaseous hydrogen via hose to fixed tanks on board (future
case)
External safety distance: 106 m
Scenario 3: Truck-to-ship bunkering of liquid hydrogen
External safety distance: 82 m
0.000 0.030 0.060
km

DNV – Report No. 10254098-1, Rev. 1 – www.dnv.com C-5
Scenario 4A: Truck-to-ship bunkering of refrigerated liquid ammonia
External safety distance: 175 m
Scenario 4B: Truck-to-ship bunkering of pressurized liquid ammonia
External safety distance: 543 m
0.00 0.06 0.12
km
0.0 0.2 0.4
km

DNV – Report No. 10254098-1, Rev. 1 – www.dnv.com C-6
Scenario 5: Truck-to-ship bunkering of methanol
External safety distance: 79 m
0.000 0.030 0.060
km

DNV – Report No. 10254098-1, Rev. 1 – www.dnv.com C-7
Focus areas
Scenario 1A: Swapping containers with pressurized hydrogen (300 bar) at container terminals (start-up case) –
no storage in stack
Fire area distance: 110 m
Explosion area distance: 128 m
Scenario 1B: Swapping containers with pressurized hydrogen (500 bar) at container terminals (future case) –
storage in stack
Fire area distance: 150 m
Explosion area distance: 223 m
0.000 0.030 0.060
km
0.000 0.050 0.100
km

DNV – Report No. 10254098-1, Rev. 1 – www.dnv.com C-8
Scenario 2A: Truck-to-ship bunkering of gaseous hydrogen via hose to fixed tanks on board (start-up case)
Fire area distance: 60 m
Explosion area distance: 132 m
Scenario 2B: Bunker station to ship, bunkering of gaseous hydrogen via hose to fixed tanks on board (future
case)
Fire area distance: 105 m
Explosion area distance: 195 m
0.000 0.030 0.060
km
0.00 0.04 0.08
km

DNV – Report No. 10254098-1, Rev. 1 – www.dnv.com C-9
Scenario 3: Truck-to-ship bunkering of liquid hydrogen
Fire area distance: 150 m
Explosion area distance: 185 m
Scenario 4A: Truck-to-ship bunkering of refrigerated liquid ammonia
Toxic area distance: 777 m
0.000 0.050 0.100
km
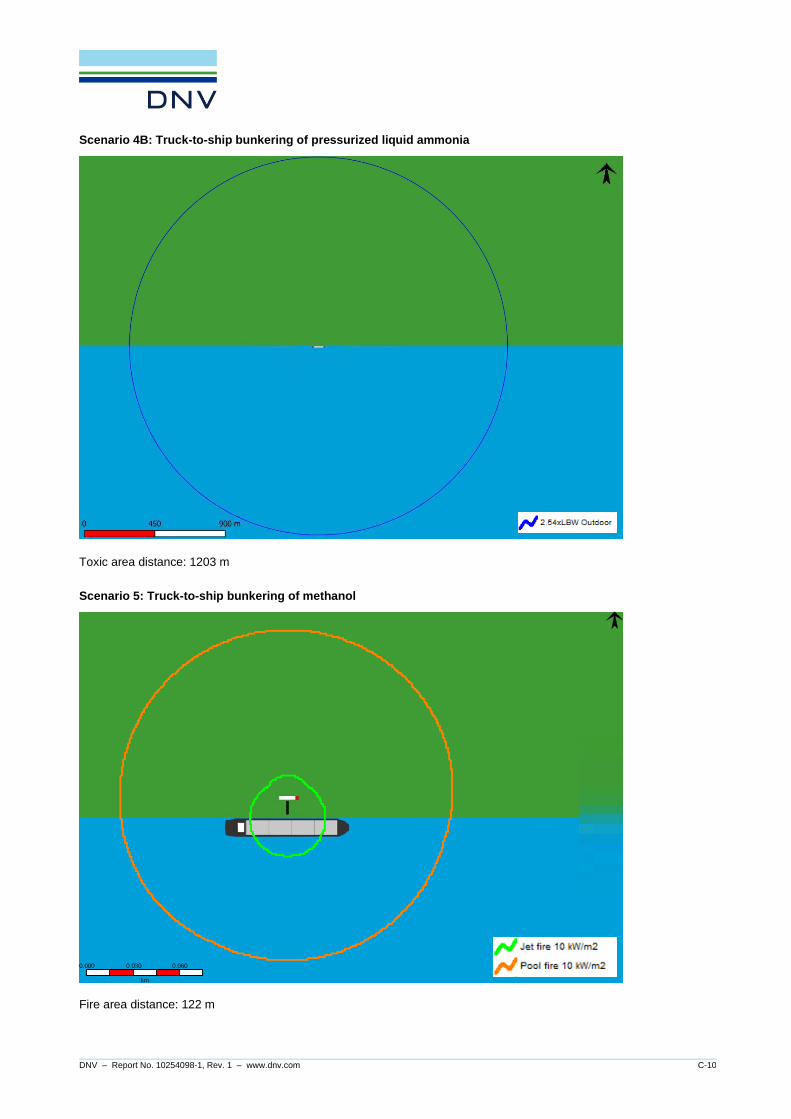
DNV – Report No. 10254098-1, Rev. 1 – www.dnv.com C-10
Scenario 4B: Truck-to-ship bunkering of pressurized liquid ammonia
Toxic area distance: 1203 m
Scenario 5: Truck-to-ship bunkering of methanol
Fire area distance: 122 m
0.000 0.030 0.060
km

DNV – Report No. 10254098-1, Rev. 1 – www.dnv.com D-1
APPENDIX D
Detailed results KAS-18 calculations

DNV – Report No. 10254098-1, Rev. 1 – www.dnv.com D-2
Effect distances are calculated for the following end-point (threshold) values and the maximum value is taken for the
external safety distance:
• 1.6 kW/m2 for thermal radiation, in case of direct ignition (resulting in jet fire).
• 0.1 bar for max. side-on overpressure
The toxic criterion of KAS-18 is the ERPG-2 value.
PHAST 8.4 is used for the calculation of the effect distances, which has implemented state of the art dispersion (UDM22)
and consequence models.
The consequences of the bunkering scenarios are partially purely flammable (scenarios 1 a/b, 2a/b and 3 with hydrogen
releases) or both flammable and toxic (scenarios 4a/b (ammonia releases) and 5 (methanol release)).
Scenario 1a: Swapping containers with pressurized hydrogen (300 bar) at container terminals (start-up case) –
no storage in stack
The maximum distances to LFL (64 m) and 0.5 LFL (88 m) are shown in the maximum concentration footprint in the
figure below.
Figure 3: Maximum concentration footprint for 50 % LFL (20000 ppm) and LFL (40000 ppm) of cloud at 0 m height for scenario 1a
The gas cloud is per definition only ignitable between the UFL and the LFL, potentially causing a flash fire or an
explosion when ignited. For this assessment a safety factor 2 is applied to determine the end-point criterion for a
flammable gas cloud, i.e. the range of the flash fire extends to the 50 % LFL contour.
22 Unified Dispersion Model

DNV – Report No. 10254098-1, Rev. 1 – www.dnv.com D-3
The heat radiation contours for the jet fire are shown in the figure below.
Figure 4: Heat radiation contours for the jet fire for scenario 1a
The range of the 1.6 kW/m2 safety distance extends up to 55 m.
The results overpressure contours are shown in Figure 5.
Figure 5: Overpressure contours for scenario 1a
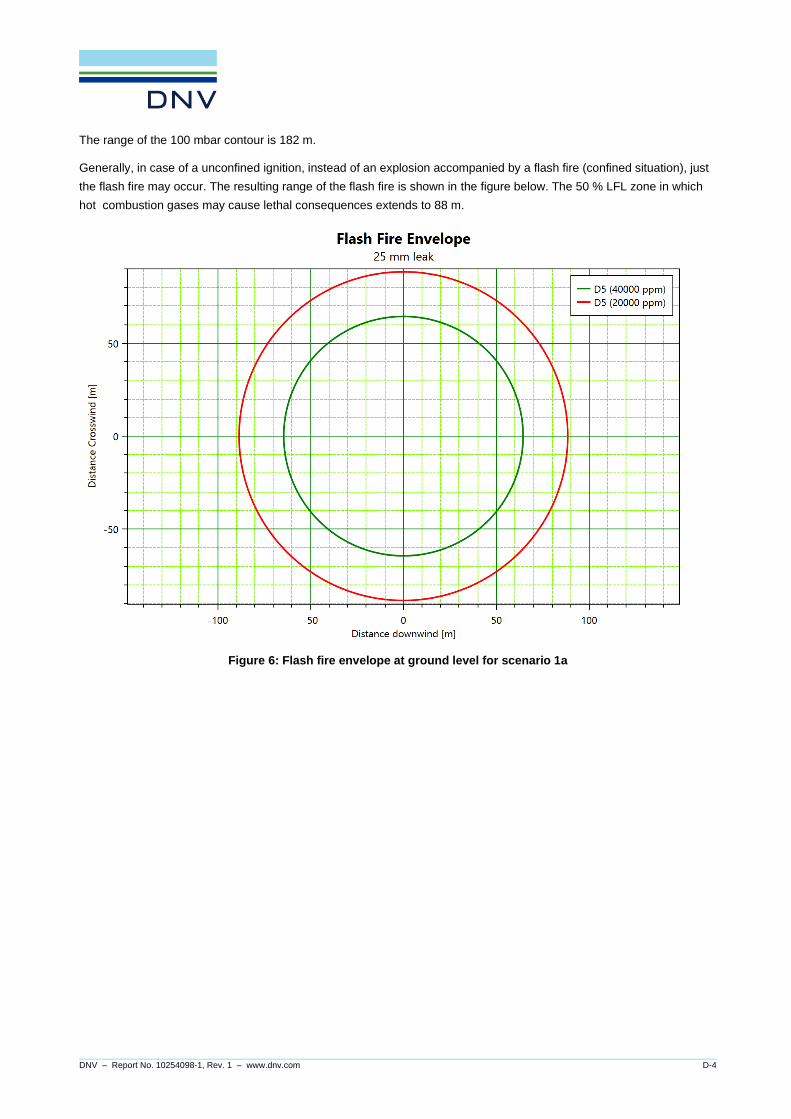
DNV – Report No. 10254098-1, Rev. 1 – www.dnv.com D-4
The range of the 100 mbar contour is 182 m.
Generally, in case of a unconfined ignition, instead of an explosion accompanied by a flash fire (confined situation), just
the flash fire may occur. The resulting range of the flash fire is shown in the figure below. The 50 % LFL zone in which
hot combustion gases may cause lethal consequences extends to 88 m.
Figure 6: Flash fire envelope at ground level for scenario 1a

DNV – Report No. 10254098-1, Rev. 1 – www.dnv.com D-5
Scenario 1b: Swapping containers with pressurized hydrogen (500 bar) at container terminals (future case) –
storage in stack
The maximum distances to LFL (78 m) and 0.5 LFL (104 m) are shown in the maximum concentration footprint in the
figure underneath.
Figure 7: Maximum concentration footprint for 50 % LFL (20000 ppm) and LFL (40000 ppm) of cloud at 0 m height for scenario 1b
The heat radiation contours for the jet fire are shown in Figure 8.
Figure 8: Heat radiation contours for the jet fire for scenario 1b
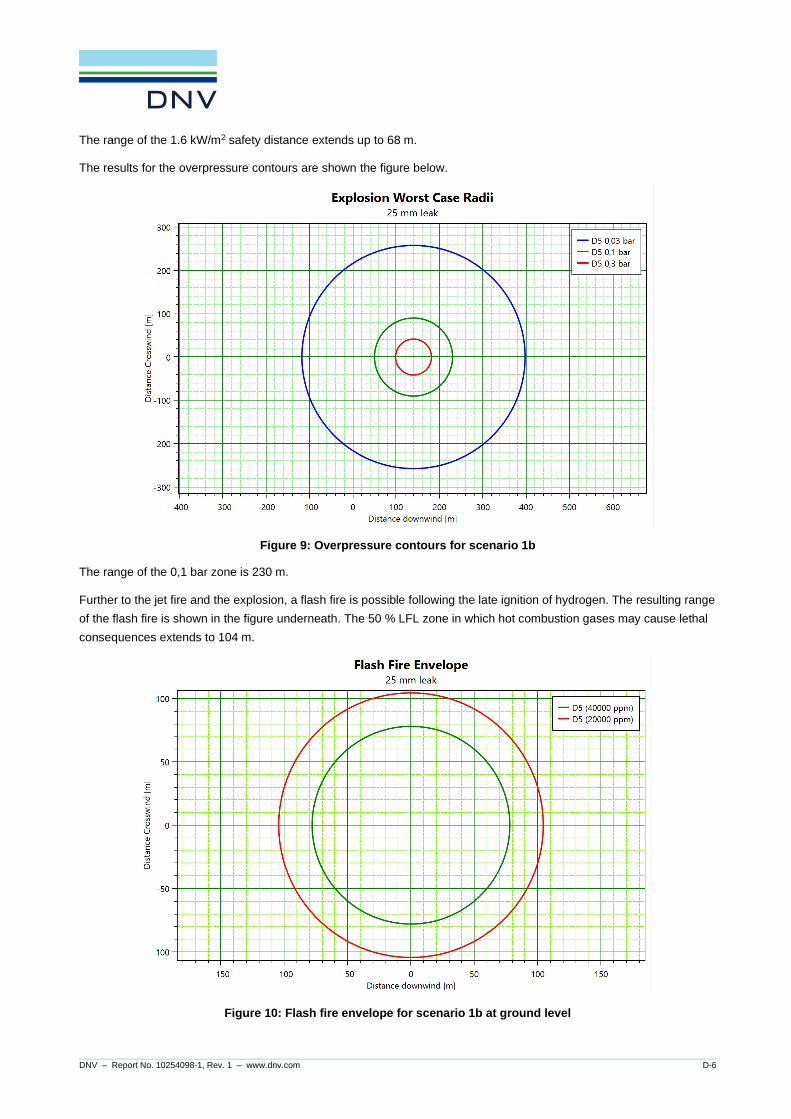
DNV – Report No. 10254098-1, Rev. 1 – www.dnv.com D-6
The range of the 1.6 kW/m2 safety distance extends up to 68 m.
The results for the overpressure contours are shown the figure below.
Figure 9: Overpressure contours for scenario 1b
The range of the 0,1 bar zone is 230 m.
Further to the jet fire and the explosion, a flash fire is possible following the late ignition of hydrogen. The resulting range
of the flash fire is shown in the figure underneath. The 50 % LFL zone in which hot combustion gases may cause lethal
consequences extends to 104 m.
Figure 10: Flash fire envelope for scenario 1b at ground level

DNV – Report No. 10254098-1, Rev. 1 – www.dnv.com D-7
Scenario 2a: Truck-to-ship bunkering of gaseous hydrogen via hose to fixed tanks on board (start-up case)
The maximum distances to LFL (72 m) and 0.5 LFL (96 m) are shown in the maximum concentration footprint in the
figure below.
Figure 11: Maximum concentration footprint for 50 % LFL (20000 ppm) and LFL (40000 ppm) of cloud at 0 m
height for scenario 2a
The heat radiation contours for the jet fire are shown in Figure 12.
Figure 12: Heat radiation contours for the jet fire of scenario 2a
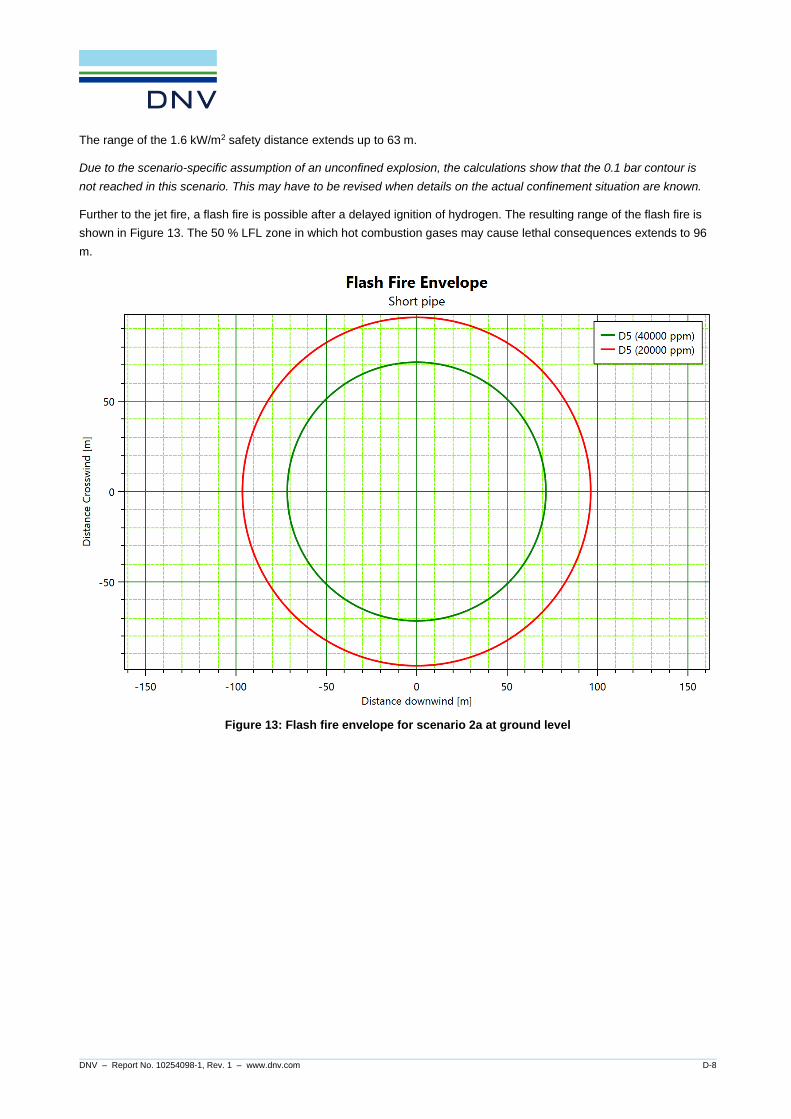
DNV – Report No. 10254098-1, Rev. 1 – www.dnv.com D-8
The range of the 1.6 kW/m2 safety distance extends up to 63 m.
Due to the scenario-specific assumption of an unconfined explosion, the calculations show that the 0.1 bar contour is
not reached in this scenario. This may have to be revised when details on the actual confinement situation are known.
Further to the jet fire, a flash fire is possible after a delayed ignition of hydrogen. The resulting range of the flash fire is
shown in Figure 13. The 50 % LFL zone in which hot combustion gases may cause lethal consequences extends to 96
m.
Figure 13: Flash fire envelope for scenario 2a at ground level
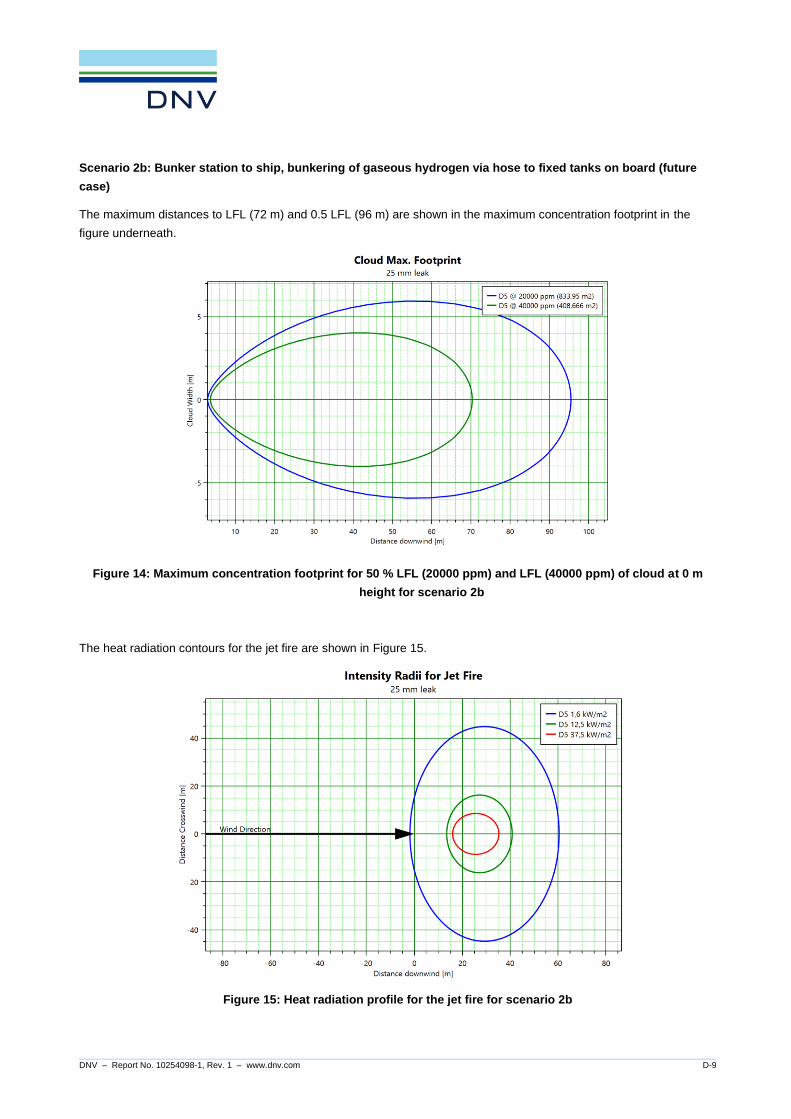
DNV – Report No. 10254098-1, Rev. 1 – www.dnv.com D-9
Scenario 2b: Bunker station to ship, bunkering of gaseous hydrogen via hose to fixed tanks on board (future
case)
The maximum distances to LFL (72 m) and 0.5 LFL (96 m) are shown in the maximum concentration footprint in the
figure underneath.
Figure 14: Maximum concentration footprint for 50 % LFL (20000 ppm) and LFL (40000 ppm) of cloud at 0 m
height for scenario 2b
The heat radiation contours for the jet fire are shown in Figure 15.
Figure 15: Heat radiation profile for the jet fire for scenario 2b

DNV – Report No. 10254098-1, Rev. 1 – www.dnv.com D-10
The range of the 1.6 kW/m2 safety distance extends up to 61 m.
Due to the scenario-specific assumption of an unconfined explosion, the calculations show that the 0.1 bar contour is
not reached in this scenario. This may have to be revised when details on the actual confinement situation are known.
The consequences of the potential flash fire are shown in Figure 16. The 50 % LFL zone in which hot combustion gases
may cause lethal consequences extends to 96 m.
Figure 16: Flash fire envelope for scenario 2b at ground level

DNV – Report No. 10254098-1, Rev. 1 – www.dnv.com D-11
Scenario 3: Truck-to-ship bunkering of liquid hydrogen
The maximum distances to LFL (41 m) and 0.5 LFL (52 m) are shown in the maximum concentration footprint in Figure
17.
Figure 17: Maximum concentration footprint for 50 % LFL (20000 ppm) and LFL (40000 ppm) of cloud at 0 m
height for scenario 3
The heat radiation contours for the jet fire are shown in Figure 18.
Figure 18: Heat radiation contours for the jet fire for scenario 3
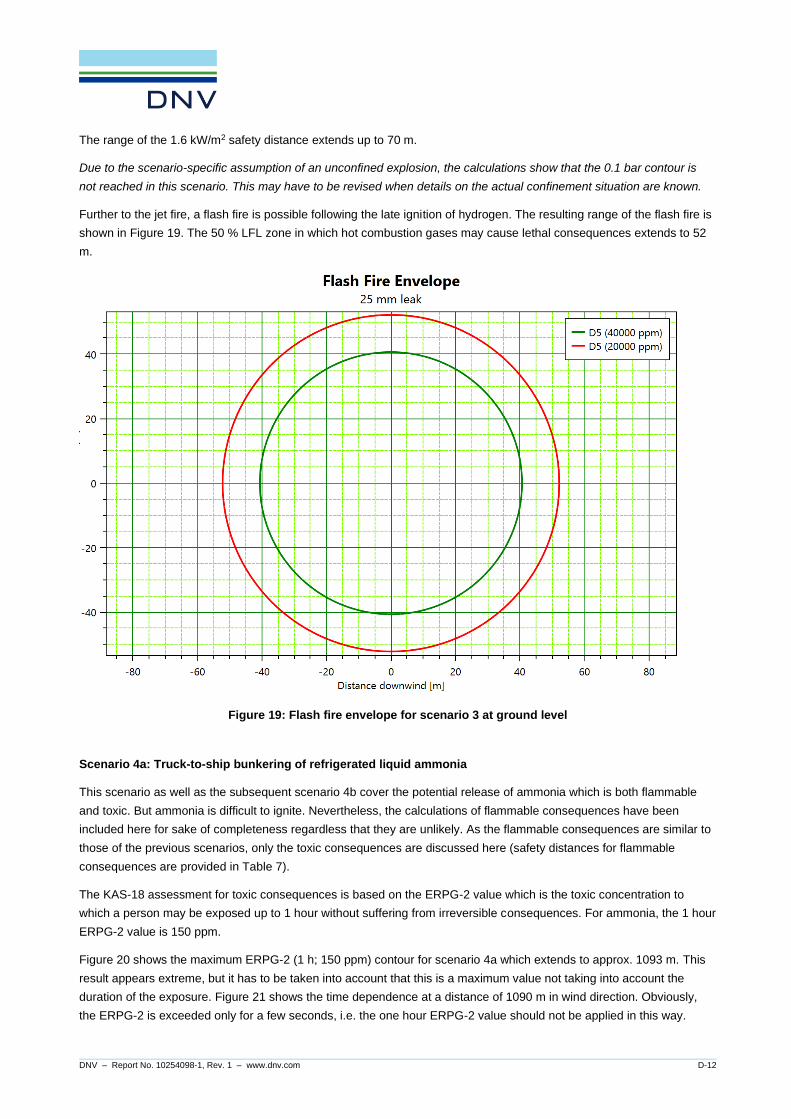
DNV – Report No. 10254098-1, Rev. 1 – www.dnv.com D-12
The range of the 1.6 kW/m2 safety distance extends up to 70 m.
Due to the scenario-specific assumption of an unconfined explosion, the calculations show that the 0.1 bar contour is
not reached in this scenario. This may have to be revised when details on the actual confinement situation are known.
Further to the jet fire, a flash fire is possible following the late ignition of hydrogen. The resulting range of the flash fire is
shown in Figure 19. The 50 % LFL zone in which hot combustion gases may cause lethal consequences extends to 52
m.
Figure 19: Flash fire envelope for scenario 3 at ground level
Scenario 4a: Truck-to-ship bunkering of refrigerated liquid ammonia
This scenario as well as the subsequent scenario 4b cover the potential release of ammonia which is both flammable
and toxic. But ammonia is difficult to ignite. Nevertheless, the calculations of flammable consequences have been
included here for sake of completeness regardless that they are unlikely. As the flammable consequences are similar to
those of the previous scenarios, only the toxic consequences are discussed here (safety distances for flammable
consequences are provided in Table 7).
The KAS-18 assessment for toxic consequences is based on the ERPG-2 value which is the toxic concentration to
which a person may be exposed up to 1 hour without suffering from irreversible consequences. For ammonia, the 1 hour
ERPG-2 value is 150 ppm.
Figure 20 shows the maximum ERPG-2 (1 h; 150 ppm) contour for scenario 4a which extends to approx. 1093 m. This
result appears extreme, but it has to be taken into account that this is a maximum value not taking into account the
duration of the exposure. Figure 21 shows the time dependence at a distance of 1090 m in wind direction. Obviously,
the ERPG-2 is exceeded only for a few seconds, i.e. the one hour ERPG-2 value should not be applied in this way.

DNV – Report No. 10254098-1, Rev. 1 – www.dnv.com D-13
Therefore we look onto the toxic dose D which according to Haber’s rule is given for a person exposed to a constant
concentration C by
D = Cn x tE,
where tE is the time of exposure and n is the substance specific toxic exponent being n = 2 for ammonia. The toxic dose
corresponding to the 1 h ERPG-2 hence is D1h = 1502 ppm x 60 min. = 1.35 x 10⁶ ppm min.
Figure 20: Maximum ERPG-2 contour for scenario 4a
Figure 21: Time dependence of the local concentration at 1090 m in wind direction

DNV – Report No. 10254098-1, Rev. 1 – www.dnv.com D-14
Figure 22: Toxic dose for scenario 4a
Figure 22 shows the toxic dose for scenario 4a. If extrapolated to higher distances, it is obvious that the dose
corresponding to the 1 h ERPG is achieved at a distance of 205 m. This is the toxic safety distance for scenario 4a.
Scenario 4b: Truck-to-ship bunkering of pressurized liquid ammonia
For the second scenario describing an ammonia release, Figure 23 shows the maximum ERPG-2 (1 h; 150 ppm)
contour which extends to approx. 1895 m. This result appears extreme, but here again, it has to be taken into account
that this is a maximum value not taking into account the duration of the exposure. Figure 24 shows the time dependence
at a distance of 1860 m in wind direction. Obviously, the ERPG-2 is exceeded only for about 30 s. Therefore, the toxic
dose D has to considered again, i.e. the toxic dose corresponding to the 1 h ERPG-2 which is 1.35 x 10⁶ ppm x min. The
toxic does is shown in Figure 25.
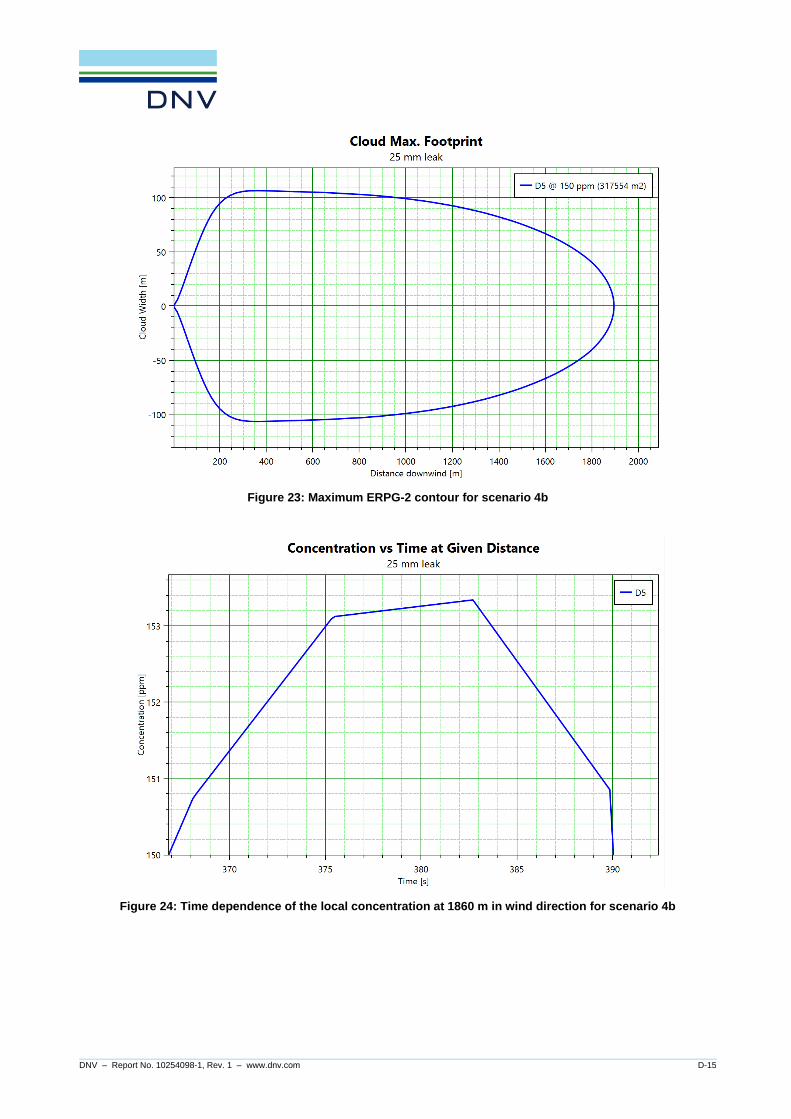
DNV – Report No. 10254098-1, Rev. 1 – www.dnv.com D-15
Figure 23: Maximum ERPG-2 contour for scenario 4b
Figure 24: Time dependence of the local concentration at 1860 m in wind direction for scenario 4b
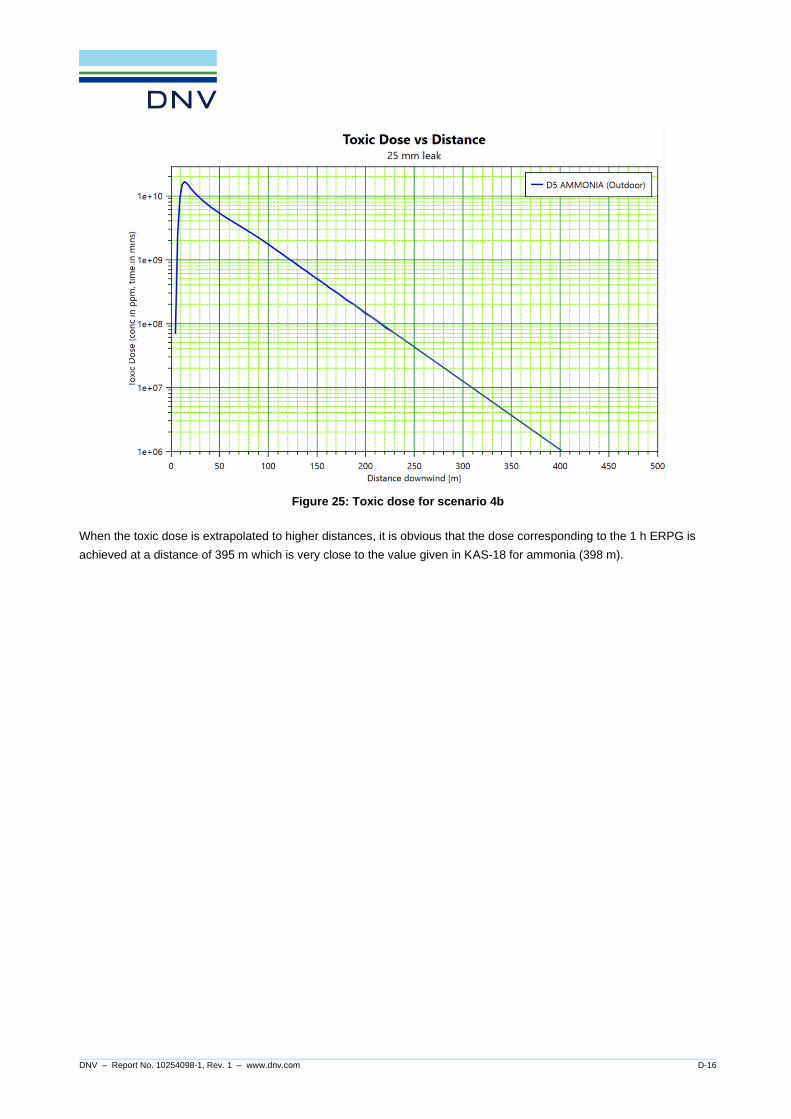
DNV – Report No. 10254098-1, Rev. 1 – www.dnv.com D-16
Figure 25: Toxic dose for scenario 4b
When the toxic dose is extrapolated to higher distances, it is obvious that the dose corresponding to the 1 h ERPG is
achieved at a distance of 395 m which is very close to the value given in KAS-18 for ammonia (398 m).

DNV – Report No. 10254098-1, Rev. 1 – www.dnv.com D-17
Scenario 5: Truck-to-ship bunkering of methanol
This scenario covers the potential release of methanol which is both flammable and toxic. Safety distances for
flammable consequences are contained in Table 7.
For methanol, the 1 hour ERPG-2 value is 1000 ppm. The substance specific toxic exponent for methanol is n = 1. The
toxic dose corresponding to the 1 h ERPG-2 hence is D1h = 1000 ppm x 60 min. = 60,000 ppm min.
The PHAST calculations show that the toxic dose of 60,000 ppm min is not reached.
The maximum concentration footprint is shown in the figure underneath.
Figure 26: Maximum concentration footprint of methanol for scenario 5 (ERPG-2 = 1000 ppm; 50 % LFL = 35,900 ppm and LFL =71800 ppm)
In summary, the toxic consequences are not of relevance for the determination of the safety distance for this methanol
release.
It is obvious that a substantial fraction of the methanol release accumulates in a pool, which shows a rather small
evaporation rate. Hence the distance to the LFL is 16 m only. If the jet is ignited it will develop into a jet fire. The heat
radiation contours are shown in Figure 27.

DNV – Report No. 10254098-1, Rev. 1 – www.dnv.com D-18
Figure 27: Jet fire heat radiation contours for scenario 5
The range of the 1.6 kW/m2 zone is 67 m.
If the methanol in the pool catches fire, the pool fire develops. The respective radiation contours are shown in Figure 28.
Figure 28: Heat radiation from the pool fire developing in scenario 5
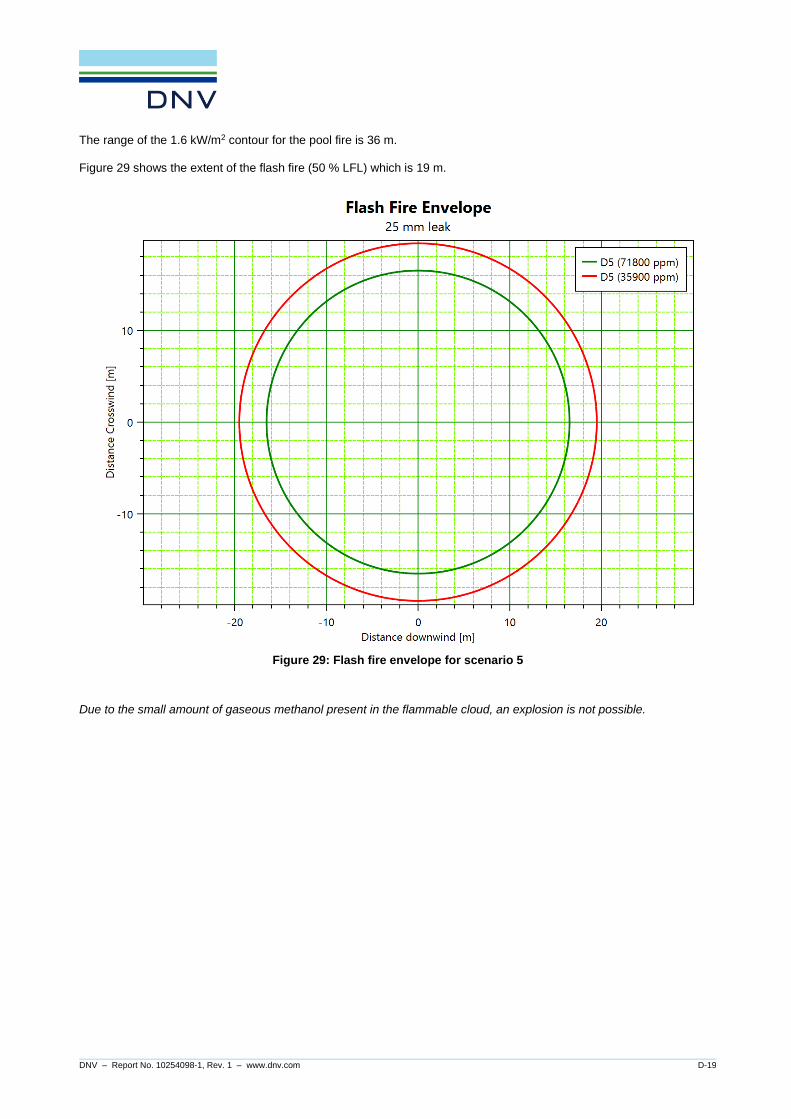
DNV – Report No. 10254098-1, Rev. 1 – www.dnv.com D-19
The range of the 1.6 kW/m2 contour for the pool fire is 36 m.
Figure 29 shows the extent of the flash fire (50 % LFL) which is 19 m.
Figure 29: Flash fire envelope for scenario 5
Due to the small amount of gaseous methanol present in the flammable cloud, an explosion is not possible.

DNV – Report No. 10254098-1, Rev. 1 – www.dnv.com D-20
Summary of Consequence Calculations
The subsequent table summarizes the results for all scenarios.
Table 7: KAS-18 safety distances for all scenarios
Scenario Material
released
Distance to max
jet / pool fire
radiation of 1.6
kW/m2 [m]
Distance to flash
fire
(50 % LFL)
[m]
Distance to 0.1
bar overpressure
[m]
Distance to
ERPG-2 [1 h]
[m]
1a Hydrogen 55 88 182 n/a*
1b Hydrogen 68 104 230 n/a
2a Hydrogen 63 96 n/r n/a
2b Hydrogen 61 96 n/r n/a
3 Hydrogen 70 52 n/r n/a
4a Ammonia 81 28 n/r 205
4b Ammonia 81 24 n/r 395
5 Methanol 67 19 n/r n/r
* n/r = not reached; n/a = not applicable
The table below shows the maximum external safety distances per scenario:
Table 8: Maximum external safety distance per scenario
Scenario Description External
safety
distance [m]
1a Swapping containers with pressurized hydrogen (300 bar) at container
terminals (start-up case) – no storage in stack
182
1b Swapping containers with pressurized hydrogen (500 bar) at container
terminals (future case) – storage in stack
230
2a Truck-to-ship bunkering of gaseous hydrogen via hose to fixed tanks on
board (start-up case)
96
2b Bunker station to ship, bunkering of gaseous hydrogen via hose to fixed
tanks on board (future case)
96
3 Truck-to-ship bunkering of liquid hydrogen 70
4a Truck-to-ship bunkering of refrigerated liquid ammonia 205
4b Truck-to-ship bunkering of pressurized liquid ammonia 395
5 Truck-to-ship bunkering of methanol 67


About DNV DNV is the independent expert in risk management and assurance, operating in more than 100 countries. Through its broad experience and deep expertise DNV advances safety and sustainable performance, sets industry benchmarks, and inspires and invents solutions. Whether assessing a new ship design, optimizing the performance of a wind farm, analyzing sensor data from a gas pipeline or certifying a food company’s supply chain, DNV enables its customers and their stakeholders to make critical decisions with confidence. Driven by its purpose, to safeguard life, property, and the environment, DNV helps tackle the challenges and global transformations facing its customers and the world today and is a trusted voice for many of the world’s most successful and forward-thinking companies.