Embed Size (px)
Citation preview
© 2013 Agilent Technologies
Aerospace & Defense Symposium
RF/uW Measurement Uncertainty: Calculate, Characterize, Minimize
Antonio Castro, Agilent Technologies

© 2013 Agilent Technologies
Aerospace & Defense Symposium
2 © 2013 Agilent Technologies
Aerospace & Defense Symposium
Measurement Uncertainty
Measurement Uncertainty is an important but often ignored or not well characterized parameter when making signal measurements.
Applications when Measurement Uncertainty is important:
1. Measured value is near specification of the instrument.
2. Mismatch between device under test (DUT) and test equipment.
3. Signal amplitude measurement near noise level.
4. Measurements under different test setup.
© 2013 Agilent Technologies
Aerospace & Defense Symposium
3 © 2013 Agilent Technologies
Aerospace & Defense Symposium
What is Measurement Uncertainty?
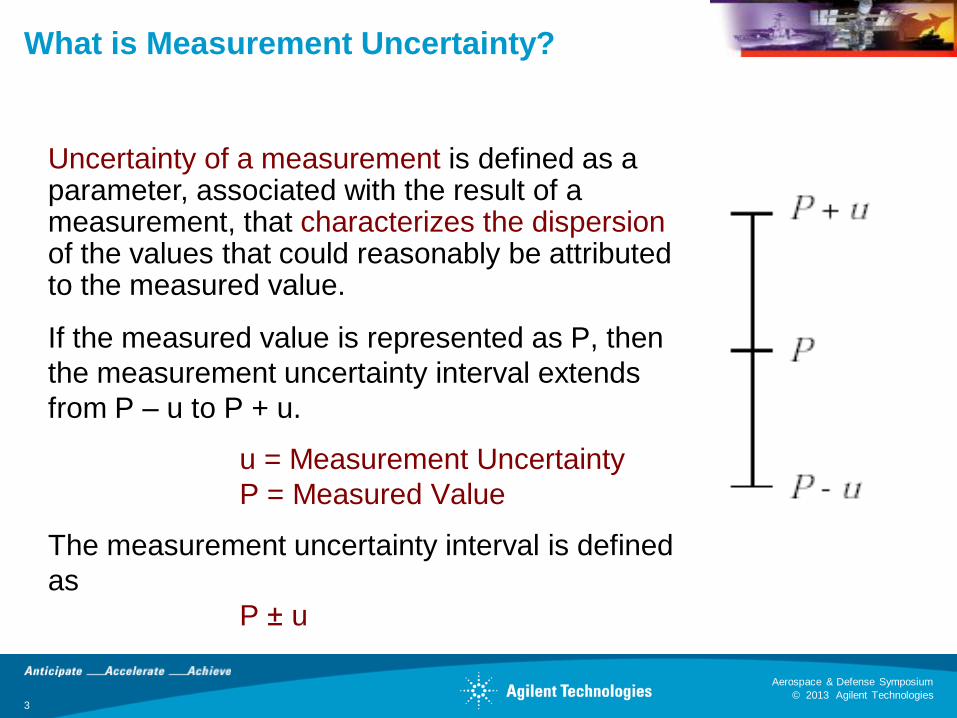
Uncertainty of a measurement is defined as a parameter, associated with the result of a measurement, that characterizes the dispersion of the values that could reasonably be attributed to the measured value.
If the measured value is represented as P, then
the measurement uncertainty interval extends
from P – u to P + u.
u = Measurement Uncertainty
P = Measured Value
The measurement uncertainty interval is defined
as
P ± u

© 2013 Agilent Technologies
Aerospace & Defense Symposium
4 © 2013 Agilent Technologies
Aerospace & Defense Symposium Page 4
The ISO Process/Method
A standardized method to determine measurement uncertainty • ISO/IEC 17025 – General Requirements for the Competence of
Calibration and Testing Laboratories
• ANSI/NCSL Z540-2-1997 – U.S. Guide to the Expression of
Uncertainty in Measurement
Application of the ISO Method • Production line measurements to meet specifications.
• Device characterization by metrology laboratories.
• Test equipment calibration by metrology laboratories.
• R&D feasibility studies.

© 2013 Agilent Technologies
Aerospace & Defense Symposium
Page 5
Measurement Uncertainty in our Measurement Process

© 2013 Agilent Technologies
Aerospace & Defense Symposium
6 © 2013 Agilent Technologies
Aerospace & Defense Symposium
Definitions Related to Specifications
Specification - Describe the performance of parameters covered
by product warranty over a temperature range, i.e. 0 to 55°C.
95th Percentile Values - Indicate the breadth of the population
(≈2σ) of performance tolerances expected to be met in 95% of
the cases with a 95% confidence, for a given ambient
temperature, usually 20 to 30°C.
Typical Values – Describe additional product performance
information that is not covered by the product warranty. It is
performance beyond specification that 80% of the units exhibit
with a 95% confidence level over a temperature range, usually
20 to 30°C.
Nominal Values – Indicate expected performance, or describe
product performance that is useful in the application of the
product, but is not covered by the product warranty.

© 2013 Agilent Technologies
Aerospace & Defense Symposium
Page 7
Standard & Relative Measurement Uncertainty
Relative Uncertainty is defined as the standard uncertainty of measurement divided by the true value of the measurand. In practice, the true measurand value (or quantity of interest) is estimated.
u(y)
y = Measurement Uncertainty
Standard Uncertainty, u(y), is
defined as the uncertainty of
measurement expressed as a
standard deviation.

© 2013 Agilent Technologies
Aerospace & Defense Symposium
8 © 2013 Agilent Technologies
Aerospace & Defense Symposium
Categories of Measurement Uncertainty
ISO • Type A – Can be quantified with statistical methods
• Type B – Determined with other methods usually based on prior
information
Engineering (Hardware Perspective) • Mismatch Uncertainty
• Instrumentation Uncertainty
Other Categories (We avoid using) • Systematic
• Random
© 2013 Agilent Technologies
Aerospace & Defense Symposium
9 © 2013 Agilent Technologies
Aerospace & Defense Symposium
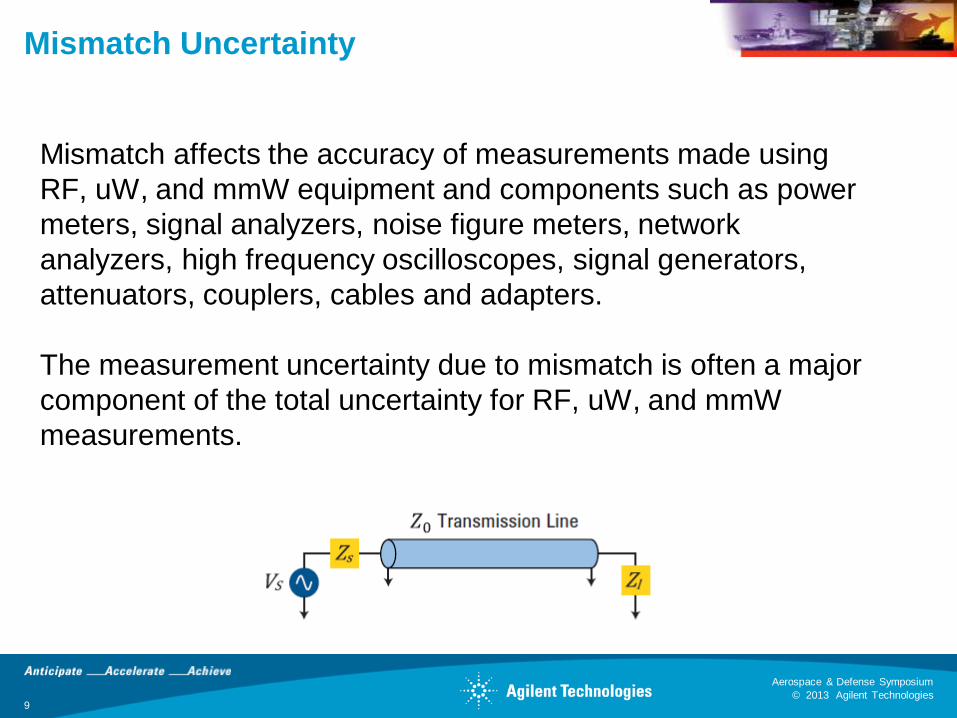
Mismatch Uncertainty
Mismatch affects the accuracy of measurements made using
RF, uW, and mmW equipment and components such as power
meters, signal analyzers, noise figure meters, network
analyzers, high frequency oscilloscopes, signal generators,
attenuators, couplers, cables and adapters.
The measurement uncertainty due to mismatch is often a major
component of the total uncertainty for RF, uW, and mmW
measurements.

© 2013 Agilent Technologies
Aerospace & Defense Symposium
10
Sensor and Source Mismatch
Signal
Source Power Sensor Power Meter
Ideal impedance = Z0
Impedance Z0
VSWR
Z0
Impedance Z0
Ideal impedance = Z0
Transmission Line with
Impedance = Z0

© 2013 Agilent Technologies
Aerospace & Defense Symposium
11 © 2013 Agilent Technologies
Aerospace & Defense Symposium
Mismatch from Two Reflection Coefficients
ρ1
ρ2
ρ1 = 0.05
ρ2 = 0.5
Worst Mismatch
Uncertainty
±0.2-dB
© 2013 Agilent Technologies
Aerospace & Defense Symposium
12 © 2013 Agilent Technologies
Aerospace & Defense Symposium
Reducing One Reflection Coefficient
Controlling mismatch uncertainty is as simple as reducing the
reflection coefficient on any transmission lines or components
that are part of the test arrangement. Assuming that equipment
with the lowest practical VSWR has been selected, many other
simple measures can be taken to ensure that the performance
of the test system does not become degraded.

© 2013 Agilent Technologies
Aerospace & Defense Symposium
13 © 2013 Agilent Technologies
Aerospace & Defense Symposium
Techniques to Reduce Mismatch Uncertainty
Simple Techniques • Select test equipment with lowest VSWR
• Keep cable lengths as short as possible
• Cables, Connectors, and Adapters:
- Select appropriately, keep clean
- Use torque wrench and torque as specified
- Minimize number of adapters
- Do not use dissimilar families of connectors

© 2013 Agilent Technologies
Aerospace & Defense Symposium
14 © 2013 Agilent Technologies
Aerospace & Defense Symposium
Techniques to Reduce Mismatch Uncertainty
Advanced Techniques
• Use an attenuator (pad) - Return loss of attenuator is better than original source or load
- Place at end of the line with the worst return loss
- Increase generator level, if needed
• Use a leveling loop to improve the effective source/line matching - Requires a two-resistor power splitter or a directional coupler,
power sensor/meter

© 2013 Agilent Technologies
Aerospace & Defense Symposium
15 © 2013 Agilent Technologies
Aerospace & Defense Symposium
Standard Uncertainty of Mismatch Model
Uniform
Fixed
Rayleigh

© 2013 Agilent Technologies
Aerospace & Defense Symposium
16 © 2013 Agilent Technologies
Aerospace & Defense Symposium
Rayleigh Distribution
Probability density of the magnitude
of the reflection coefficient is
Rayleigh distributed if the probability
density of both complex parts is
Gaussian distributed
Real
Imaginary

© 2013 Agilent Technologies
Aerospace & Defense Symposium
17 © 2013 Agilent Technologies
Aerospace & Defense Symposium
Mismatch Uncertainty Examples
Reflection Coefficient for 26.5-GHz PXA • Bands 1 – 4
• Preamp On
• 0-dB Attenuation
By inspection, the level that exceeded 5% of the frequency
points is: SWR = 1.6. Hence, Γ95 = 0.23.
The probability density of the magnitude of the reflection
coefficient (or VSWR) is Rayleigh distributed for all X-Series
signal analyzers, sources, and power sensors. This is very
useful information. There is no need to characterize and model.

© 2013 Agilent Technologies
Aerospace & Defense Symposium
18 © 2013 Agilent Technologies
Aerospace & Defense Symposium
Example: Obtaining Magnitude and Phase
Information for Г
Known magnitude and phase information for Г of a given sample
determines its distribution characteristic. • Measure S11 (magnitude and phase) with network analyzer
• At each frequency point of interest, set the signal analyzer to zero
span and measure S11 with network analyzer using a marker at the
tuned frequency of the signal analyzer.
• Network analyzer should be calibrated over frequency range of
interest. Its settings should not change while data acquisition.

© 2013 Agilent Technologies
Aerospace & Defense Symposium
19 © 2013 Agilent Technologies
Aerospace & Defense Symposium
X-Series Analyzer Reflection Coefficient
X-Series analyzers have a reflection coefficient that is well modeled
with a Rayleigh probability distribution.
Agilent recommends using the methods outlined in Application Note
1449-3 and companion Average Power Sensor Measurement
Uncertainty Calculator to compute mismatch uncertainty.
Use the 95th percentile VSWR information and the Rayleigh model
(Case C or E in the application note) with that process.

© 2013 Agilent Technologies
Aerospace & Defense Symposium
20 © 2013 Agilent Technologies
Aerospace & Defense Symposium
Mismatch Uncertainty Examples
The observed Γ95 is 0.0219.
Reflection Coefficient for 8481A
Power Sensor
• Frequency Range: 0 to 8 GHz
Estimate Γ95 from Γmax
• Γmax = 0.0826
• Γ95 = 0.712 Γmax
• Γ95 = 0.0588
Estimate Γ95 from Γmean
• Γmean = 0.014
• Γ95 = 1.953Γmean
• Γ95 = 0.0273

© 2013 Agilent Technologies
Aerospace & Defense Symposium
21 © 2013 Agilent Technologies
Aerospace & Defense Symposium
Instrumentation Uncertainty
Now, we are going to switch our attention to the
instrumentation uncertainty
• This is the uncertainty inherited to each measurement instrument
• Lets consider the following instruments
- Signal analyzer
- Power Sensor
- Power Meter
© 2013 Agilent Technologies
Aerospace & Defense Symposium
22 © 2013 Agilent Technologies
Aerospace & Defense Symposium
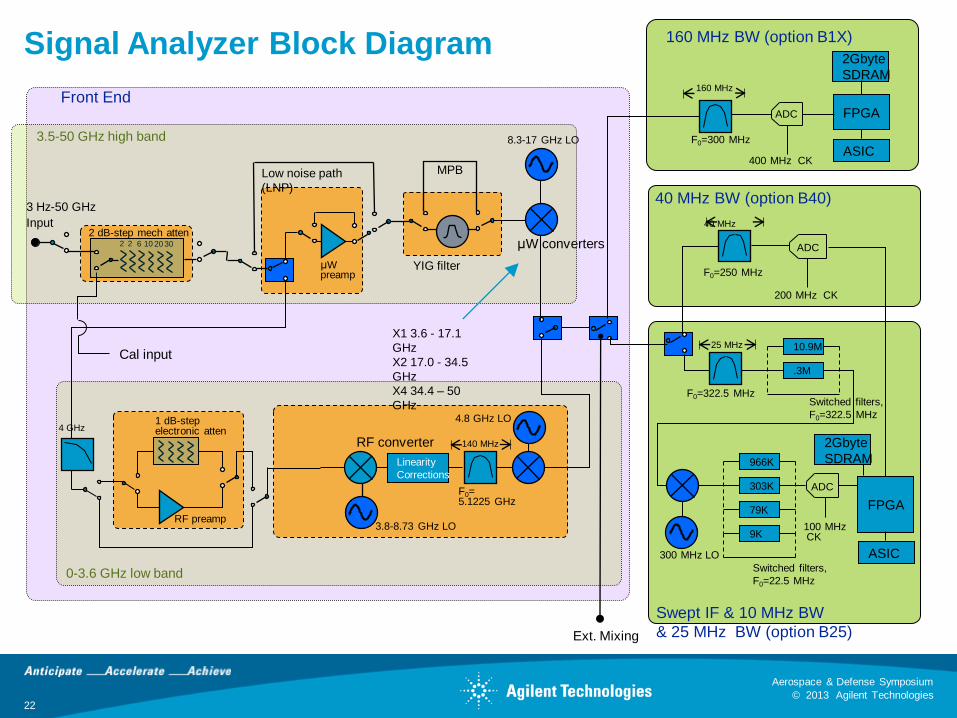
Signal Analyzer Block Diagram
0-3.6 GHz low band
3 Hz-50 GHz
Input
Cal input
2 dB-step mech atten μW converters
8.3-17 GHz LO
10.9M
.3M
4.8 GHz LO
RF converter
3.8-8.73 GHz LO
Ext. Mixing
FPGA
300 MHz LO
200 MHz CK
100 MHz CK
ADC
ADC
Switched filters,
F0=22.5 MHz
X1 3.6 - 17.1
GHz
X2 17.0 - 34.5
GHz
X4 34.4 – 50
GHz
140 MHz
3.5-50 GHz high band
FPGA
160 MHz
Front End
Swept IF & 10 MHz BW
& 25 MHz BW (option B25)
25 MHz
966K
303K
79K
9K
Switched filters,
F0=322.5 MHz
160 MHz BW (option B1X)
30 2 2 6 10 20
RF preamp
40 MHz
400 MHz CK
40 MHz BW (option B40)
ADC
F0=250 MHz
F0=300 MHz
F0=322.5 MHz
Linearity
Corrections
Low noise path
(LNP)
μW preamp
YIG filter
1 dB-step electronic atten
F0= 5.1225 GHz
4 GHz
ASIC
2Gbyte
SDRAM
ASIC
2Gbyte
SDRAM
MPB

© 2013 Agilent Technologies
Aerospace & Defense Symposium
23 © 2013 Agilent Technologies
Aerospace & Defense Symposium
Switching Uncertainty of Signal Analyzer

© 2013 Agilent Technologies
Aerospace & Defense Symposium
24 © 2013 Agilent Technologies
Aerospace & Defense Symposium Page 24
Reduce Overall Measurement Uncertainty
from a Signal Analyzer
Minimize changes when making a measurement • Before taking any data, step through a measurement to see if any
controls can be left unchanged.
- Input attenuation (mechanical and electronic)
- Resolution bandwidth
Allow signal analyzer to run Alignments
Characterize signal analyzer • Use a calibration signal closer to the frequency of interest
• Use a leveling loop (power splitter and power sensor/meter)
Improve sensitivity when measuring low level signals
Add a well-matched pad (attenuator) to the analyzer input to
reduce mismatch uncertainty
© 2013 Agilent Technologies
Aerospace & Defense Symposium
25
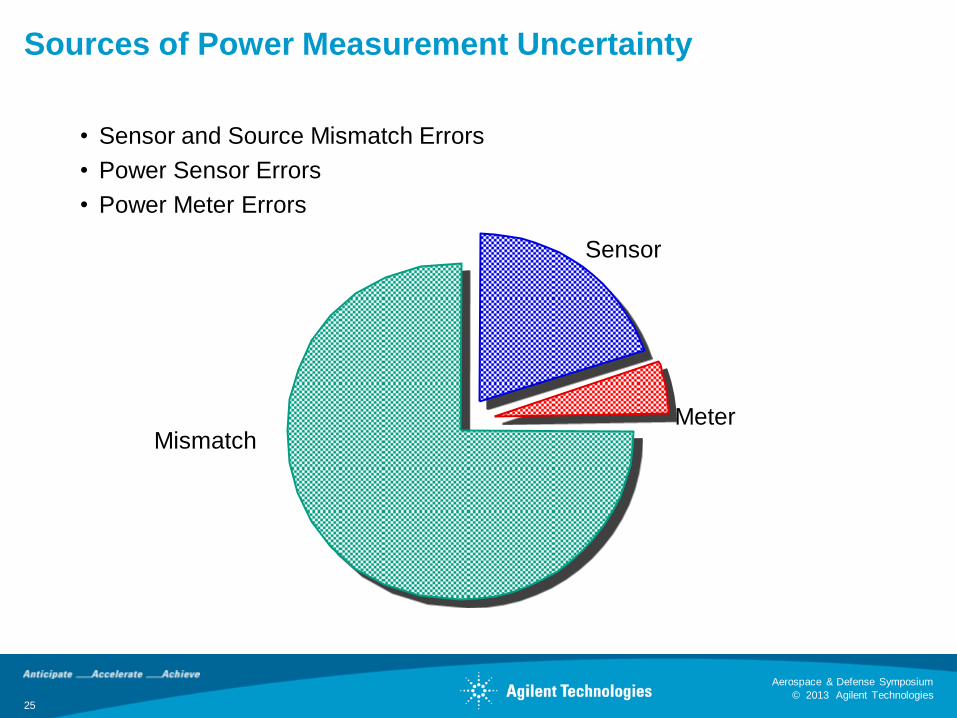
Sources of Power Measurement Uncertainty
• Sensor and Source Mismatch Errors
• Power Sensor Errors
• Power Meter Errors
Mismatch
Sensor
Meter

© 2013 Agilent Technologies
Aerospace & Defense Symposium
26
Power Sensor Uncertainties
Various sensor
losses
DC
Power
Sensor
Power Meter
P r
Element
P i P in
Cal Factor : h e
P K
b = in
P i
(he = Effective Efficiency)
• Printed on sensor label (8480 series)
• Stored in EEPROM (E-series and P-series)

© 2013 Agilent Technologies
Aerospace & Defense Symposium
27
Power Meter Instrumentation Uncertainties
Power
Reference
Uncertainty
Instrumentation Uncertainty

© 2013 Agilent Technologies
Aerospace & Defense Symposium
28
Calculating Measurement Uncertainty Using ISO Model
Identify significant uncertainties sources • Mismatch and Instrumentation
Estimate measurement uncertainty from each source • Type A (statistically) or Type B (known information)
• Use appropriate divisor for each distribution
Combine uncertainties and determine expanded uncertainty • Worst-case (Very Conservative)
- All sources of error at their extreme values
- Errors add constructively
• Root Sum of the Squares (RSS) method

© 2013 Agilent Technologies
Aerospace & Defense Symposium
29
Calculation of Uncertainty using ISO Method
Signal Source
Power Sensor Power Meter
Ideal impedance = Z0
Impedance Z0
VSWR
Instrument Uncertainty Mismatch Uncertainty
E4418B E9300A
Measurement Conditions: 2-GHz at -13-dBm

© 2013 Agilent Technologies
Aerospace & Defense Symposium
Calculation of Uncertainty using ISO Method
30
Rayleigh
Uniform
0.21%
1.8%
3.6%

© 2013 Agilent Technologies
Aerospace & Defense Symposium
31
References
AN 1316: Optimizing Spectrum Analyzer Amplitude Accuracy
AN 1286-1: 8 Hints for Better Spectrum Analysis
AN 1303: Spectrum Analyzer Measurements and Noise
AN 1449: Fundaments of RF and Microwave Power
Measurements
White Paper: Revisiting Mismatch Uncertainty with the
Rayleigh Distribution
AN 1408-20: High-Accuracy Noise Figure Measurements
Using the PNA-X Series Network Analyzer
AN 1408-21: Active Device Characterization in Pulsed
Operation Using the PNA-X