Embed Size (px)
DESCRIPTION
RF Cavity Simulation for SPL. Simulink Model for HP-SPL Extension to LINAC4 at CERN from RF Point of View. Acknowledgement: CEA team, in particular O. Piquet ( simulink model) W. Hofle , J. Tuckmantel , D. Valuch , G. Kotzian. Presentation Overview. SPL Characteristics - PowerPoint PPT Presentation
Citation preview
1
RF Cavity Simulation for SPL
Simulink Model for HP-SPL Extension to LINAC4 at CERN from RF Point of View
Acknowledgement: CEA team, in particular O. Piquet (simulink model)
W. Hofle, J. Tuckmantel, D. Valuch, G. Kotzian
2
Presentation Overview
• SPL Characteristics
• Single Cavity Model and Simulation Results
• Double Cavity Model and Simulation Results
• Error Analysis
3
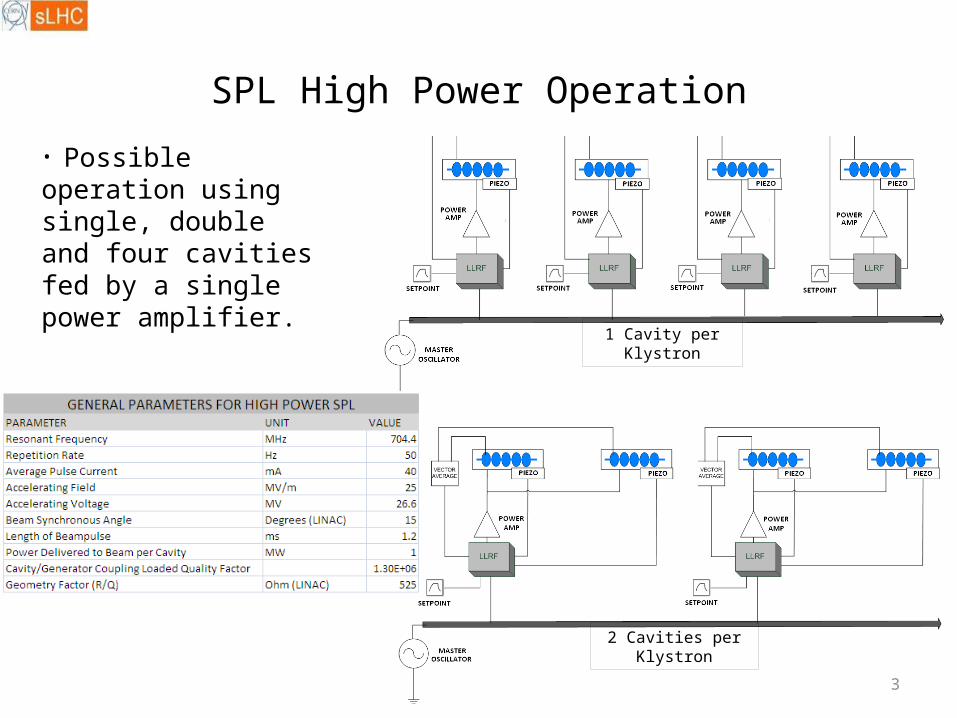
SPL High Power Operation
1 Cavity per Klystron
2 Cavities per Klystron
• Possible operation using single, double and four cavities fed by a single power amplifier.
4
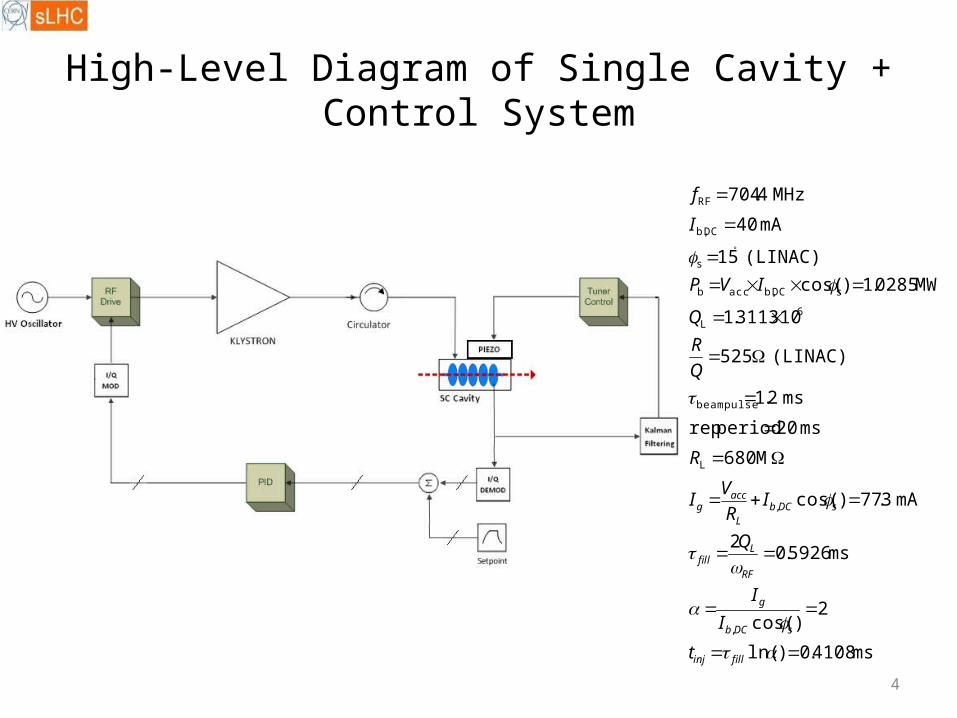
High-Level Diagram of Single Cavity + Control System
ms4108.0)ln(
2)cos(
ms5926.02
mA3.77)cos(
M680
ms20periodrep
ms2.1
(LINAC)525
103113.1
MW0285.1)cos(
(LINAC)15
mA40
MHz4.704
,
,
L
beampulse
6L
sDCb,accb
s
DCb,
RF
fillinj
sDCb
g
RF
Lfill
sDCbL
accg
t
I
I
Q
IR
VI
R
Q
R
Q
IVP
I
f
5
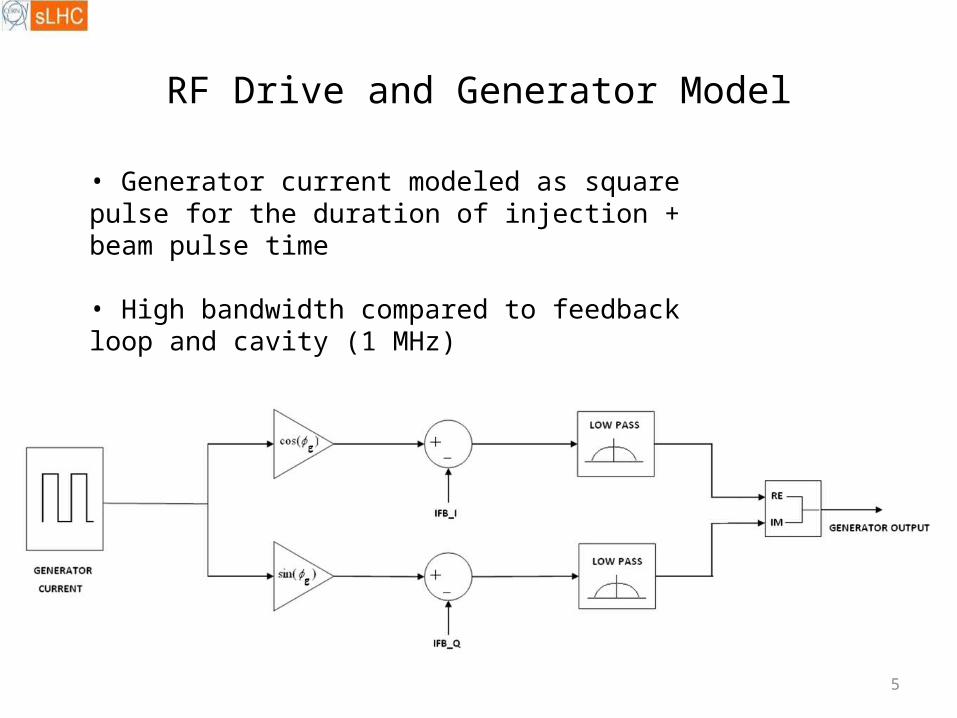
RF Drive and Generator Model
• Generator current modeled as square pulse for the duration of injection + beam pulse time
• High bandwidth compared to feedback loop and cavity (1 MHz)
6
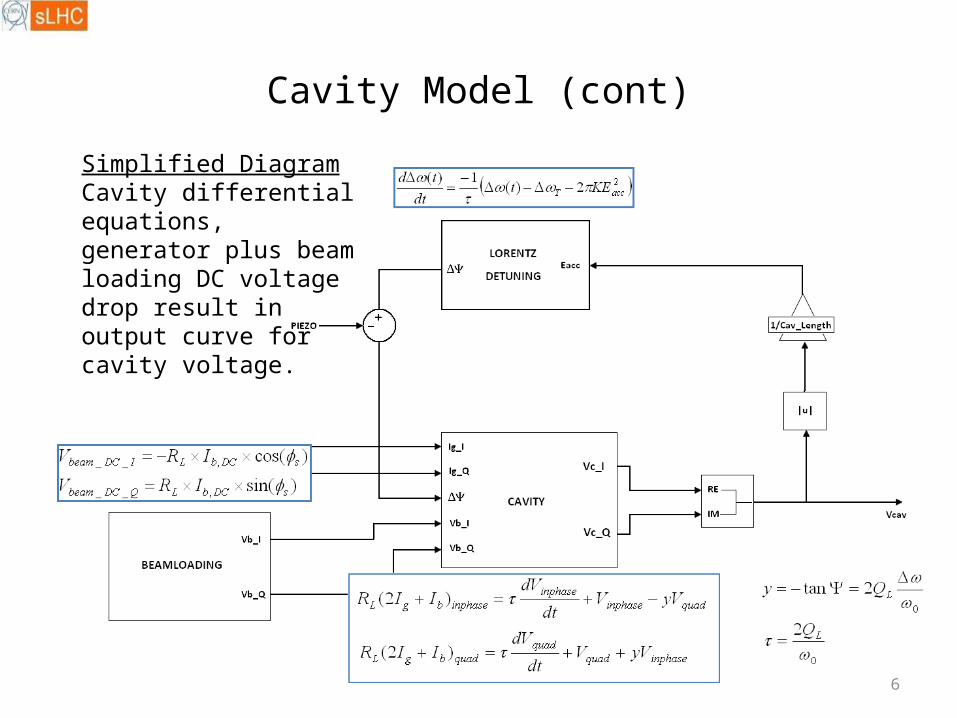
Cavity Model (cont)
Simplified DiagramCavity differential equations, generator plus beam loading DC voltage drop result in output curve for cavity voltage.
7
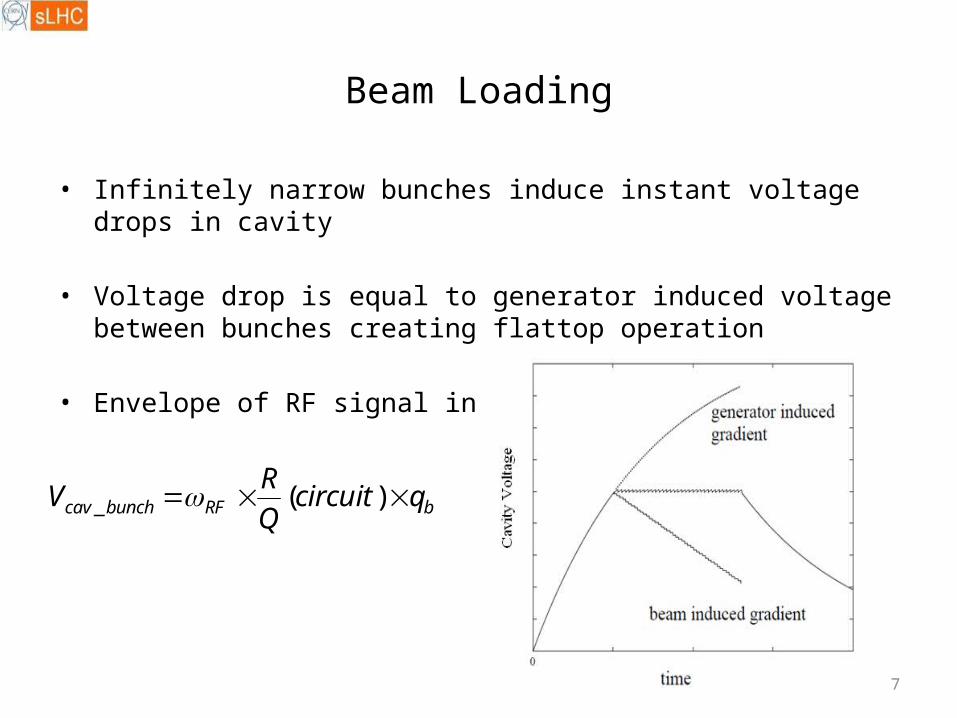
• Infinitely narrow bunches induce instant voltage drops in cavity
• Voltage drop is equal to generator induced voltage between bunches creating flattop operation
• Envelope of RF signal in I/Q
Beam Loading
bRFbunchcav qcircuitQ
RV )(_
8
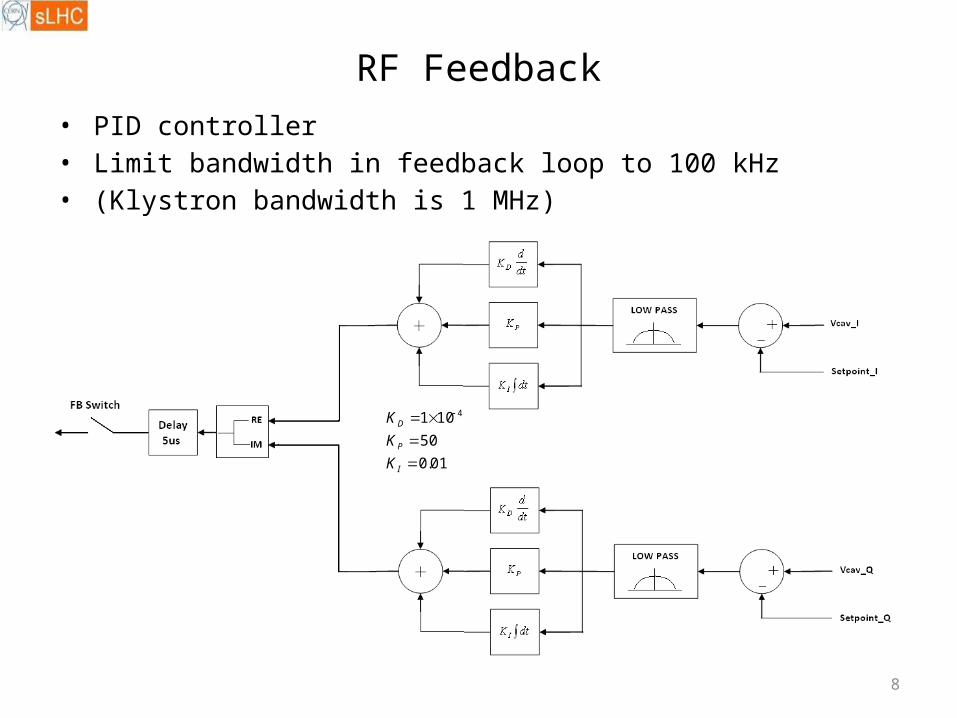
RF Feedback• PID controller• Limit bandwidth in feedback loop to 100 kHz • (Klystron bandwidth is 1 MHz)
01.0
50
101 4
I
P
D
K
K
K
9
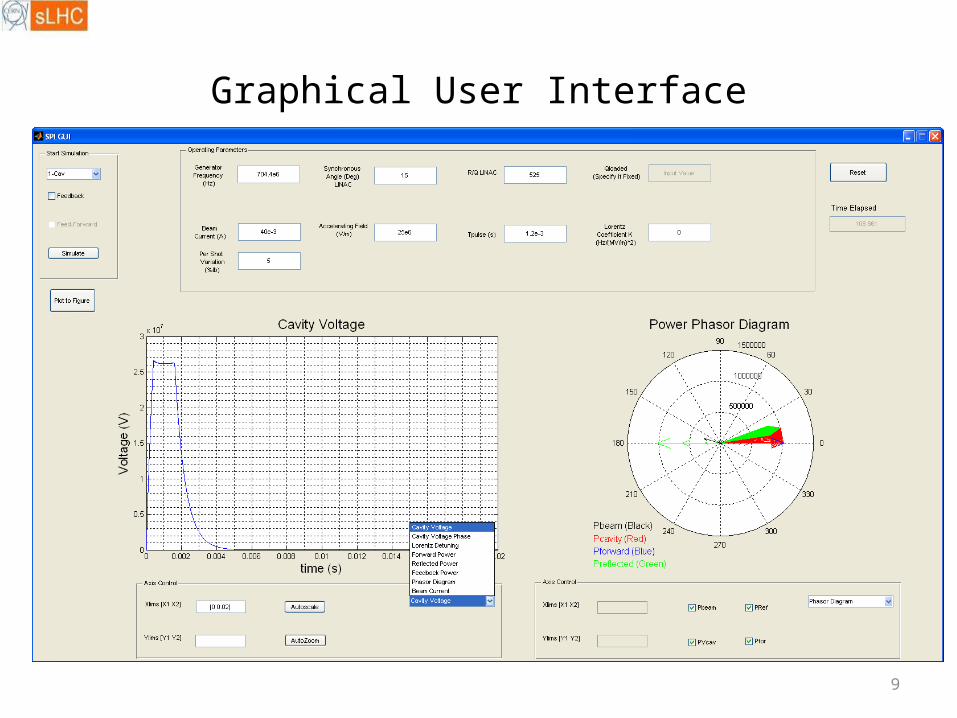
Graphical User Interface
10
Results
• Cavity Voltage Amplitude and Phase
• Forward and Reflected Power
• Additional Power for Feedback Transients and Control
• Effect of Lorentz Detuning on Feedback Power
• Effect of Source Current Fluctuations
• Mismatched Low-Power Case
11
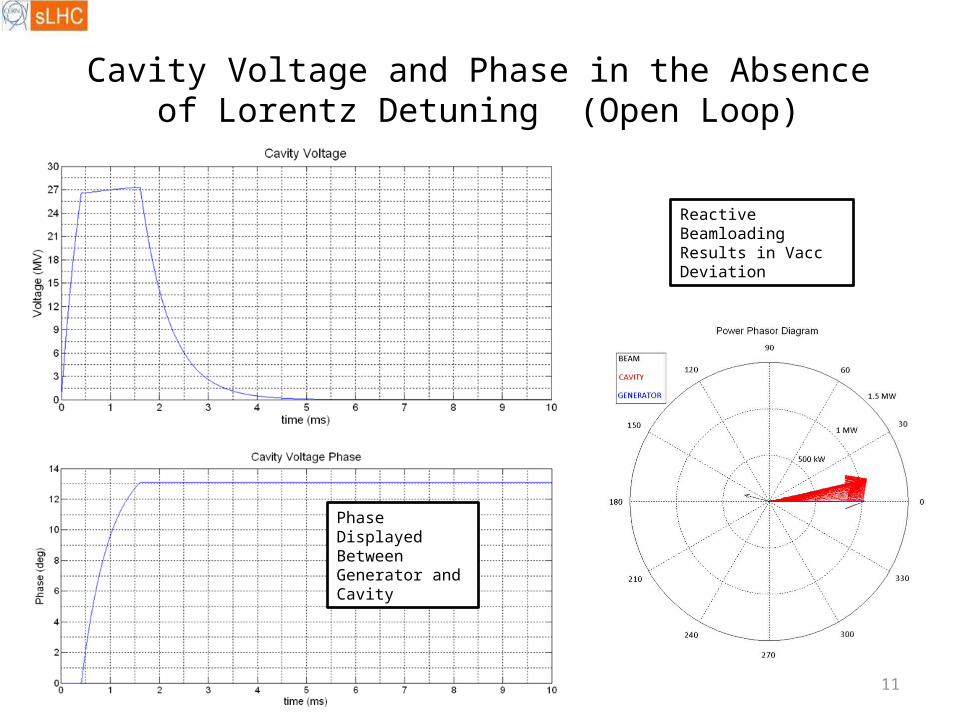
Cavity Voltage and Phase in the Absence of Lorentz Detuning (Open Loop)
Phase Displayed Between Generator and Cavity
Reactive Beamloading Results in Vacc Deviation
12
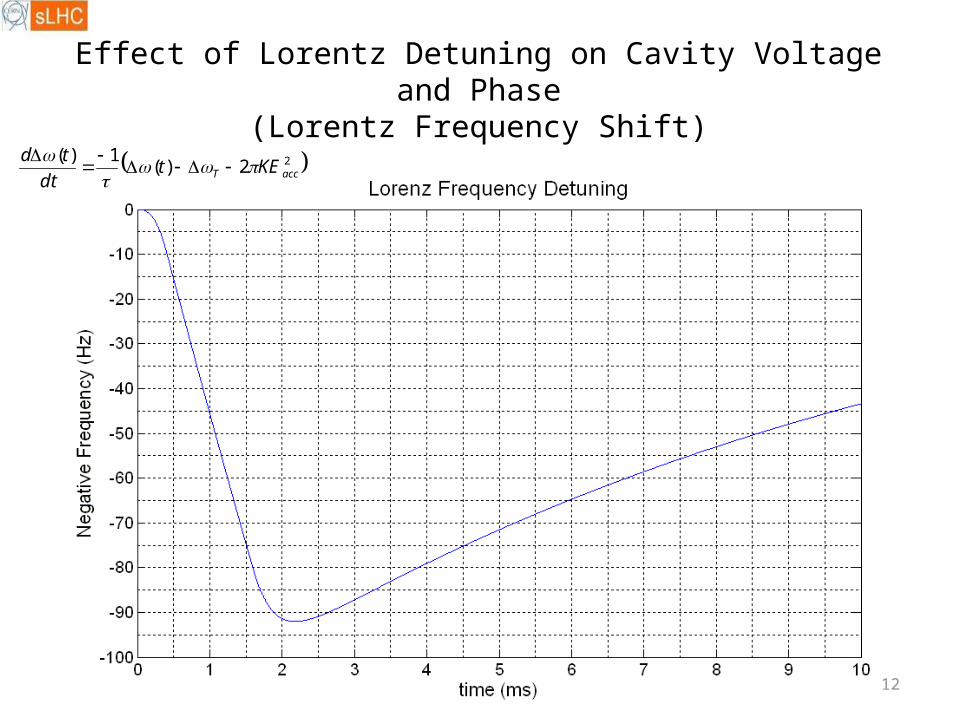
Effect of Lorentz Detuning on Cavity Voltage and Phase(Lorentz Frequency Shift)
22)(1)(
accT KEtdt
td
13
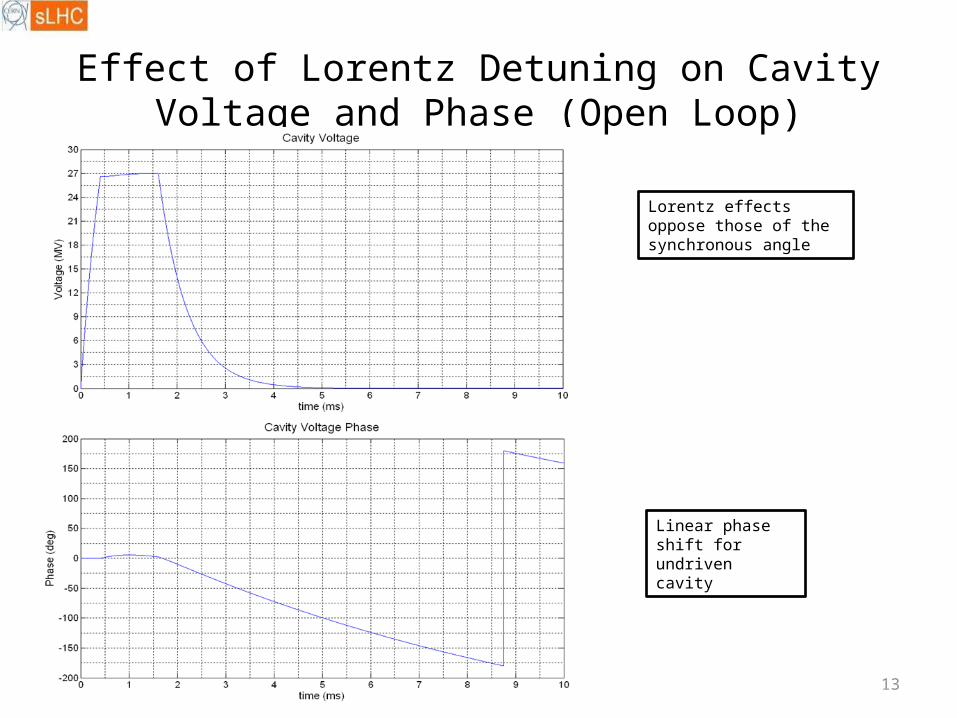
Effect of Lorentz Detuning on Cavity Voltage and Phase (Open Loop)
Lorentz effects oppose those of the synchronous angle
Linear phase shift for undriven cavity
14
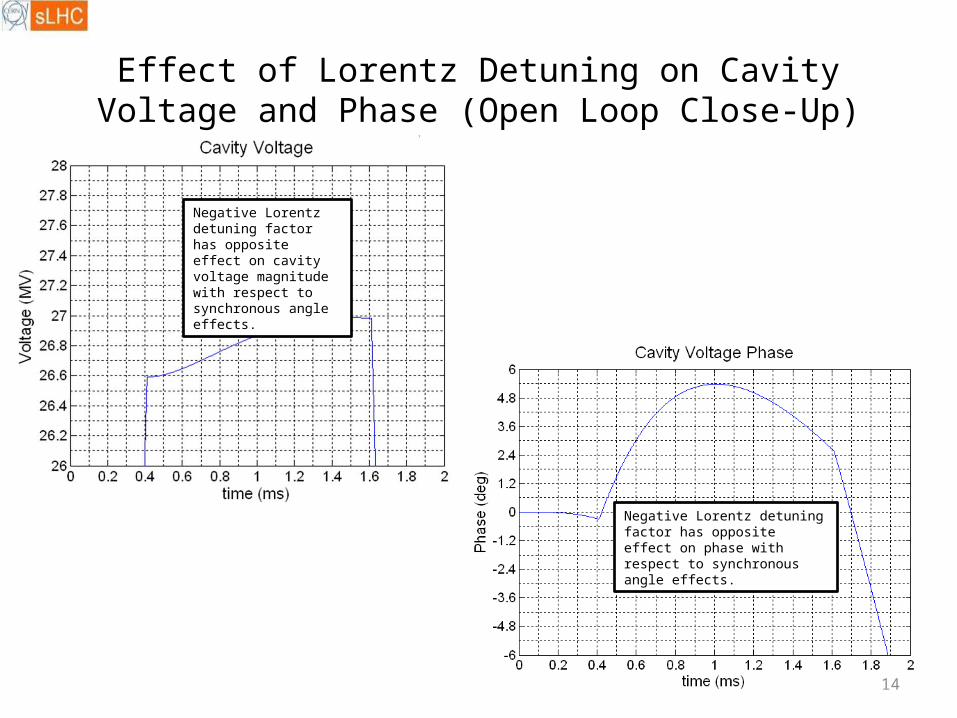
Effect of Lorentz Detuning on Cavity Voltage and Phase (Open Loop Close-Up)
Negative Lorentz detuning factor has opposite effect on phase with respect to synchronous angle effects.
Negative Lorentz detuning factor has opposite effect on cavity voltage magnitude with respect to synchronous angle effects.
15
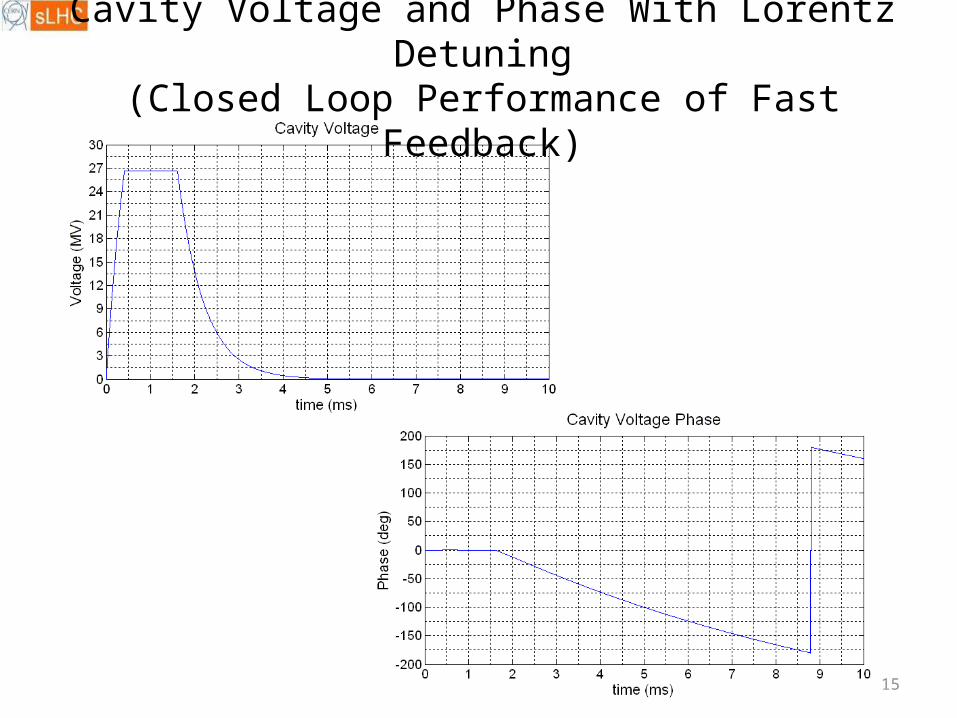
Cavity Voltage and Phase With Lorentz Detuning(Closed Loop Performance of Fast Feedback)
16
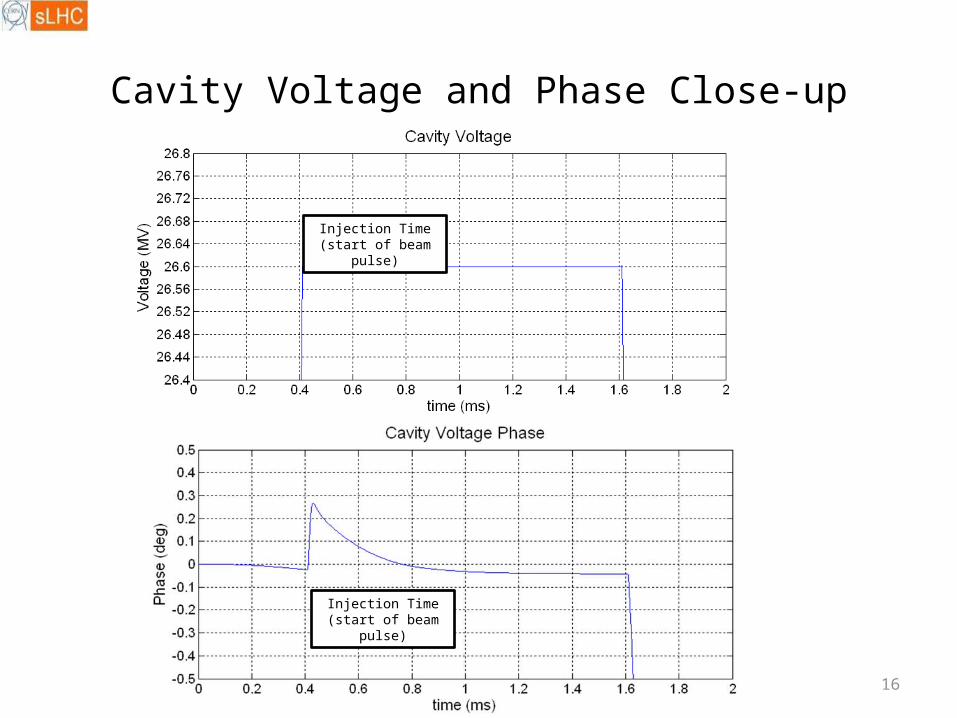
Cavity Voltage and Phase Close-up
Injection Time(start of beam pulse)
Injection Time(start of beam pulse)
17
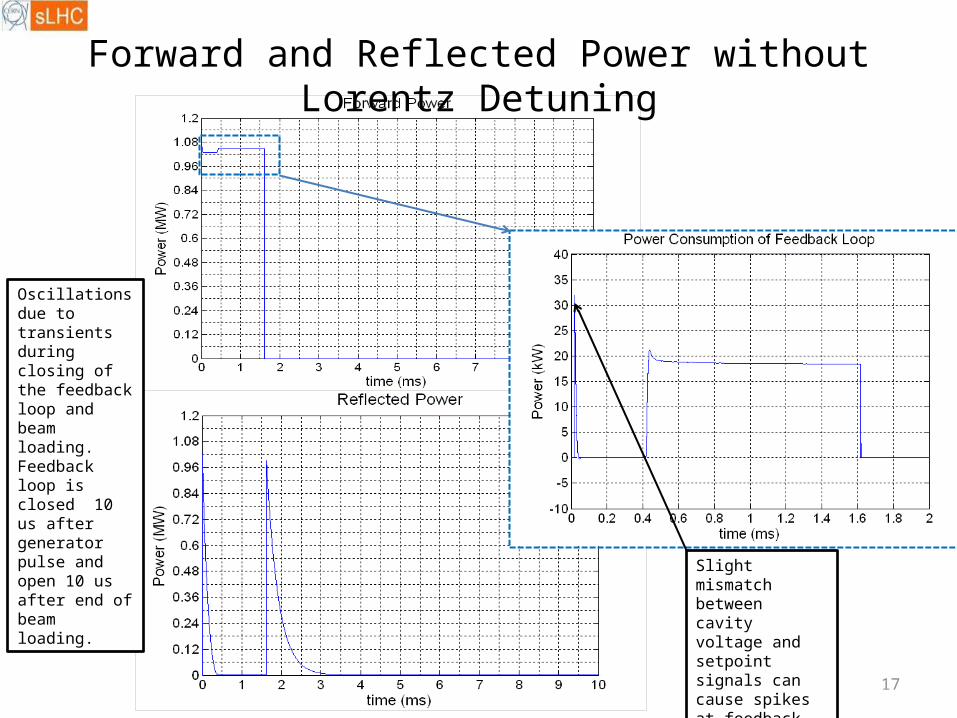
Forward and Reflected Power without Lorentz Detuning
Oscillations due to transients during closing of the feedback loop and beam loading.Feedback loop is closed 10 us after generator pulse and open 10 us after end of beam loading.
Slight mismatch between cavity voltage and setpoint signals can cause spikes at feedback switch ON
18
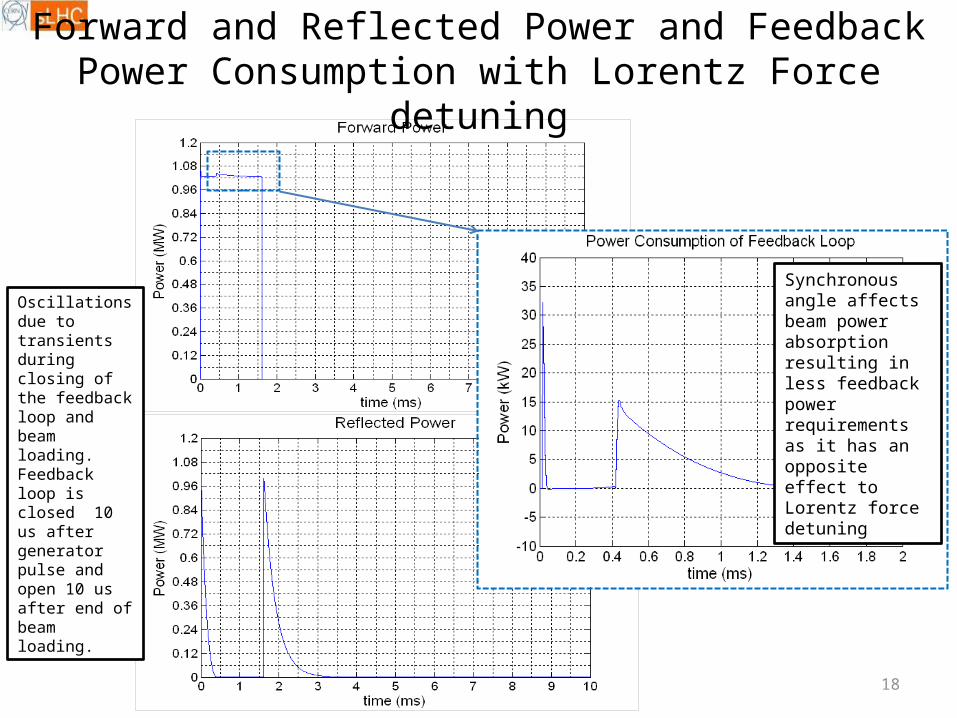
Forward and Reflected Power and Feedback Power Consumption with Lorentz Force detuning
Oscillations due to transients during closing of the feedback loop and beam loading.Feedback loop is closed 10 us after generator pulse and open 10 us after end of beam loading.
Synchronous angle affects beam power absorption resulting in less feedback power requirements as it has an opposite effect to Lorentz force detuning
19
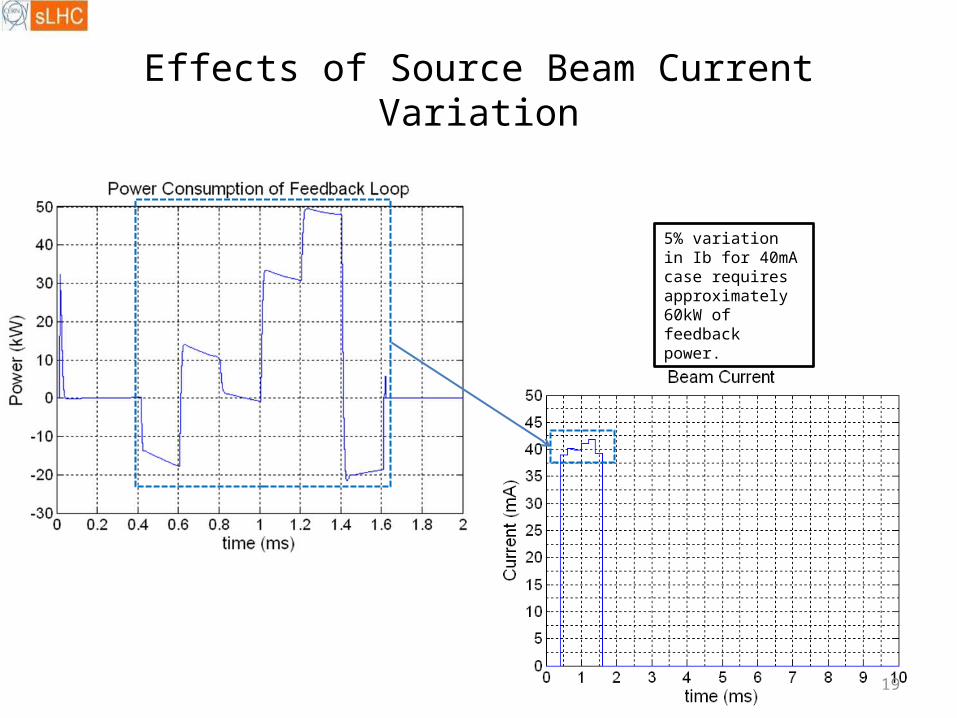
Effects of Source Beam Current Variation
5% variation in Ib for 40mA case requires approximately 60kW of feedback power.
20
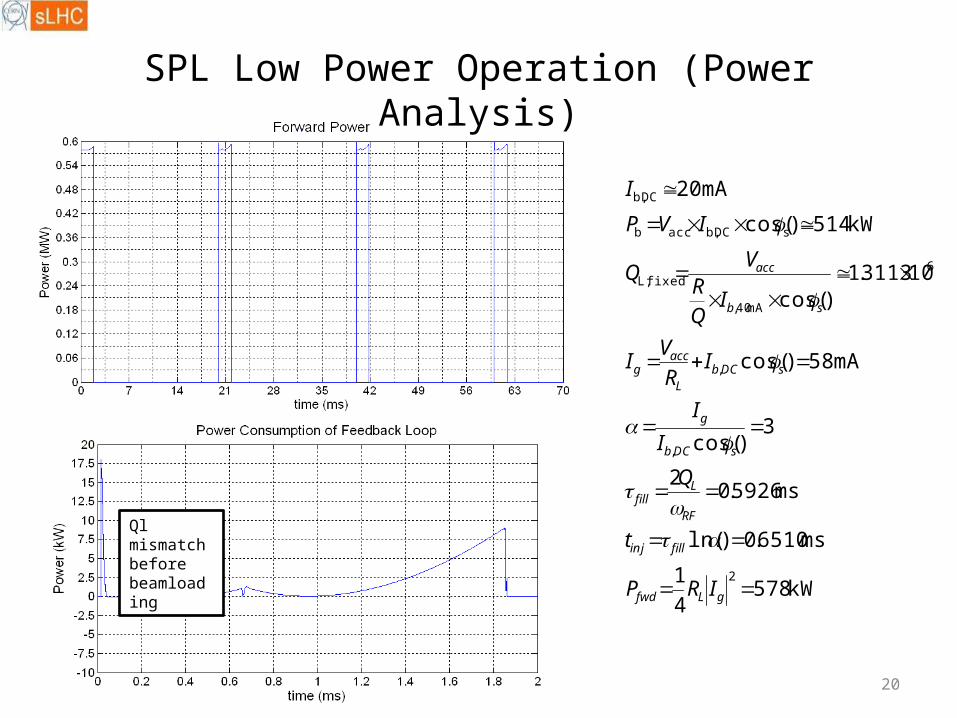
SPL Low Power Operation (Power Analysis)
kW5784
1
ms6510.0)ln(
ms5926.02
3)cos(
mA58)cos(
103113.1)cos(
kW514)cos(
mA20
2
,
,
6
mA40,
fixedL,
sDCb,accb
DCb,
gLfwd
fillinj
RF
Lfill
sDCb
g
sDCbL
accg
sb
acc
IRP
t
Q
I
I
IR
VI
IQR
VQ
IVP
I
Ql mismatch before beamloading
21
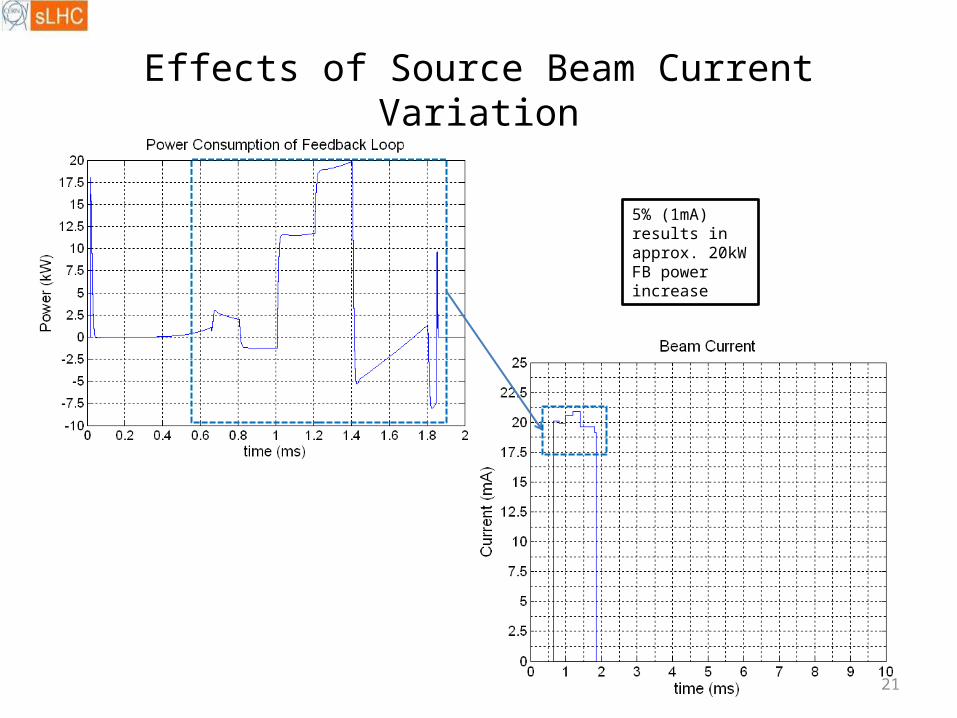
Effects of Source Beam Current Variation
5% (1mA) results in approx. 20kW FB power increase
22
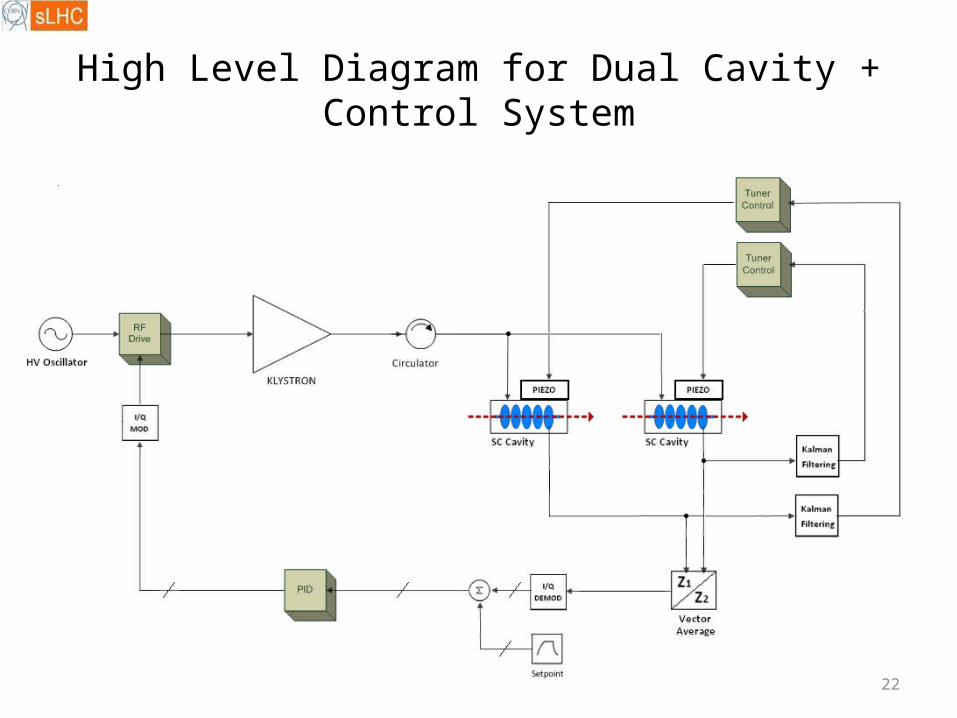
High Level Diagram for Dual Cavity + Control System
23
Kalman Filtering
• Proposed to obtain accurate output from noisy measurement (e.g cavity voltage)
• Uses model estimates + real measurements to find best output fit
• Useful for accurate feed-forward scheme for piezo-electric tuning of resonant cavities in the presence of Lorentz force
24
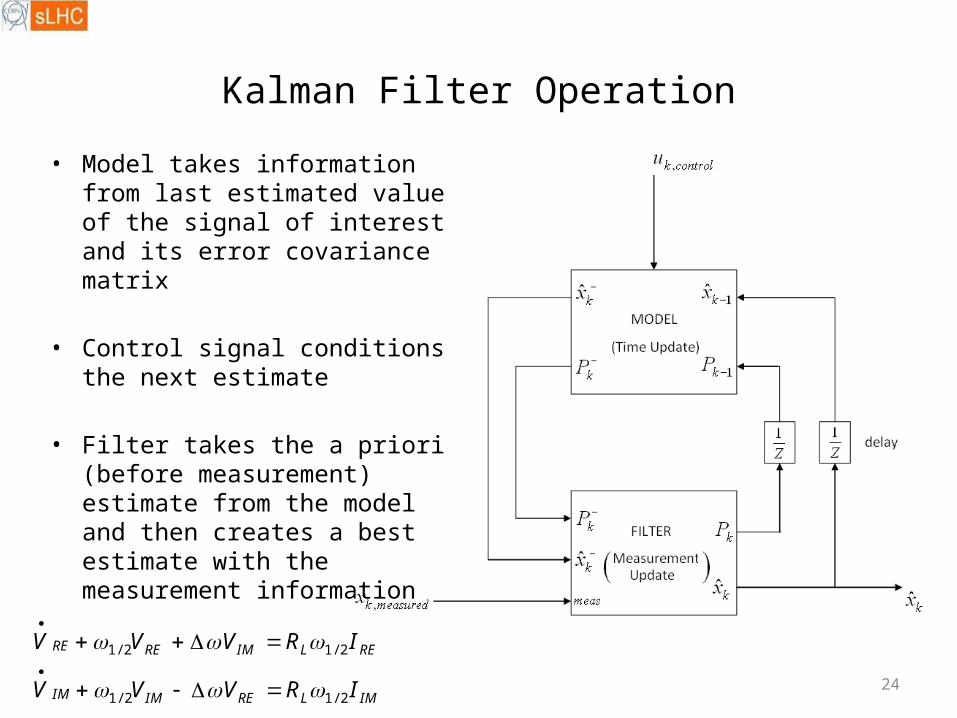
Kalman Filter Operation
• Model takes information from last estimated value of the signal of interest and its error covariance matrix
• Control signal conditions the next estimate
• Filter takes the a priori (before measurement) estimate from the model and then creates a best estimate with the measurement information
IMLREIMIM
RELIMRERE
IRVVV
IRVVV
2/12/1
2/12/1
25
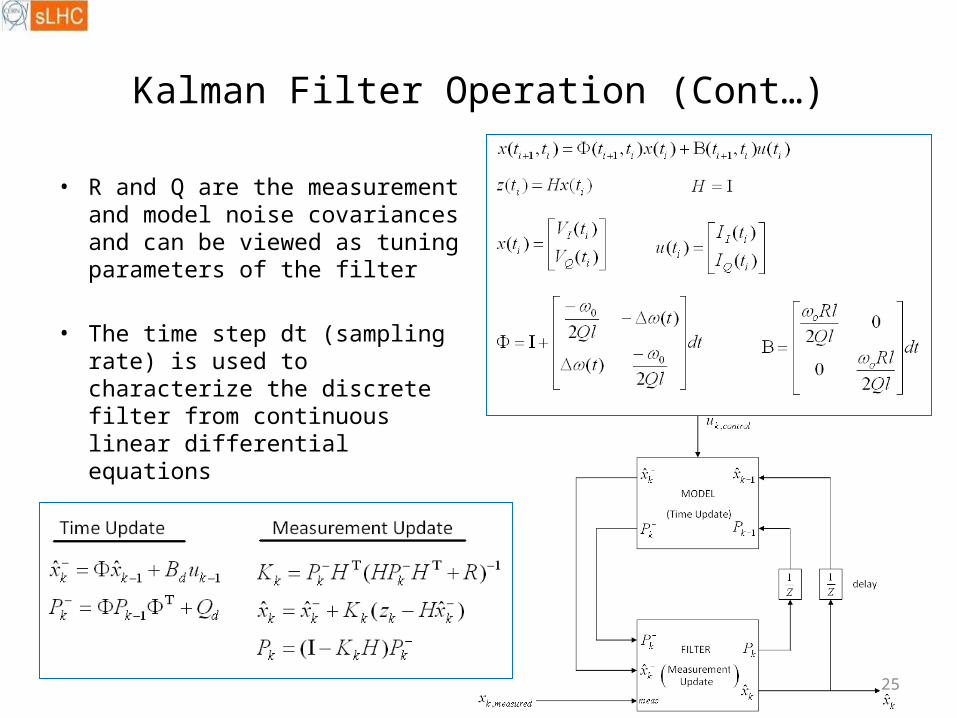
Kalman Filter Operation (Cont…)
• R and Q are the measurement and model noise covariances and can be viewed as tuning parameters of the filter
• The time step dt (sampling rate) is used to characterize the discrete filter from continuous linear differential equations
26
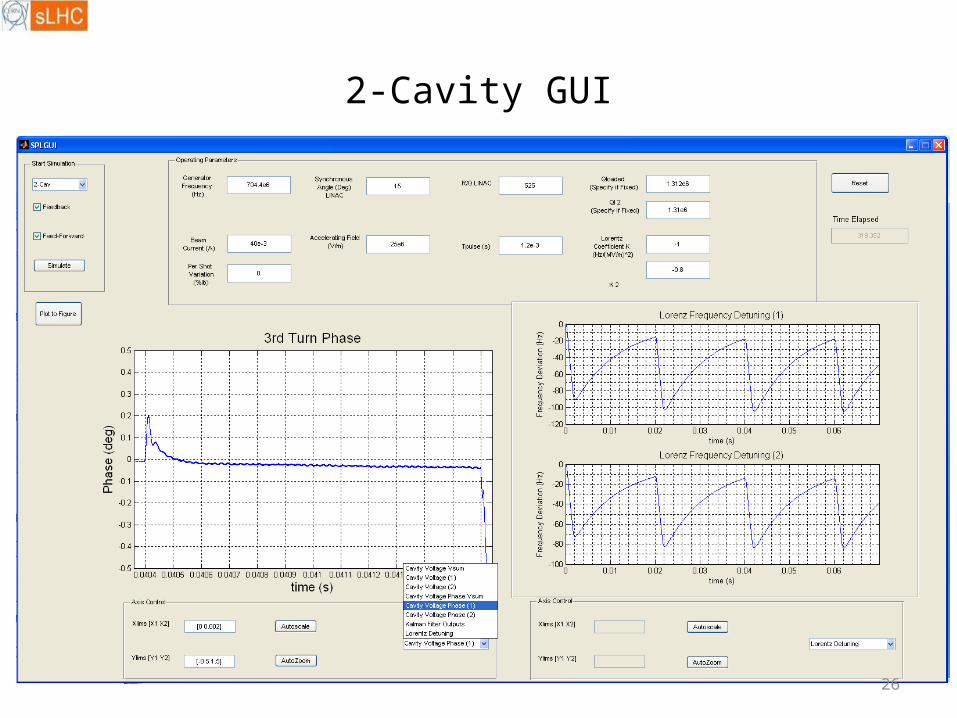
2-Cavity GUI
27
Results
• Cavity Phase Variation Without Feed-Forward
• Effects of Adaptive Feed-Forward
• Effects of Loaded Quality Factor Variation
28
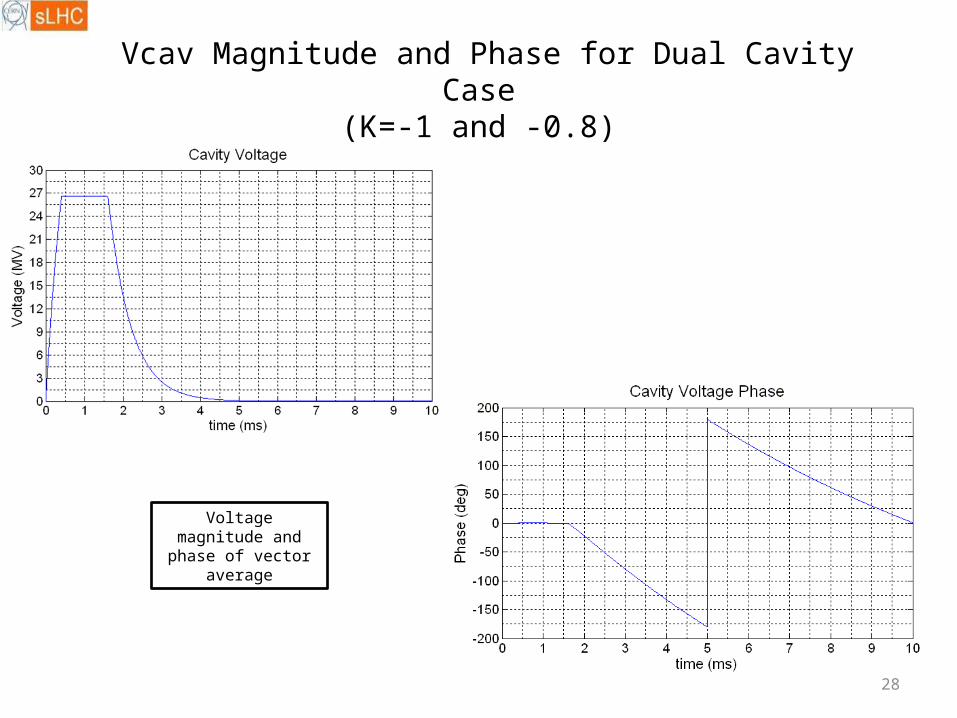
Vcav Magnitude and Phase for Dual Cavity Case(K=-1 and -0.8)
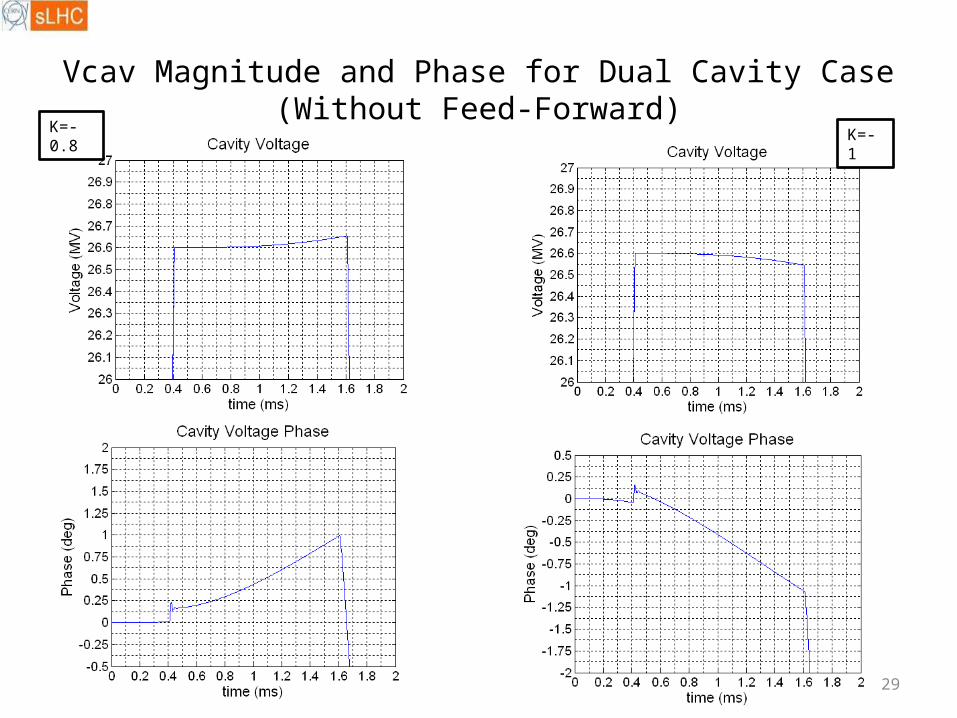
Voltage magnitude and phase of vector average
29
Vcav Magnitude and Phase for Dual Cavity Case(Without Feed-Forward)K=-0.8 K=-1
30
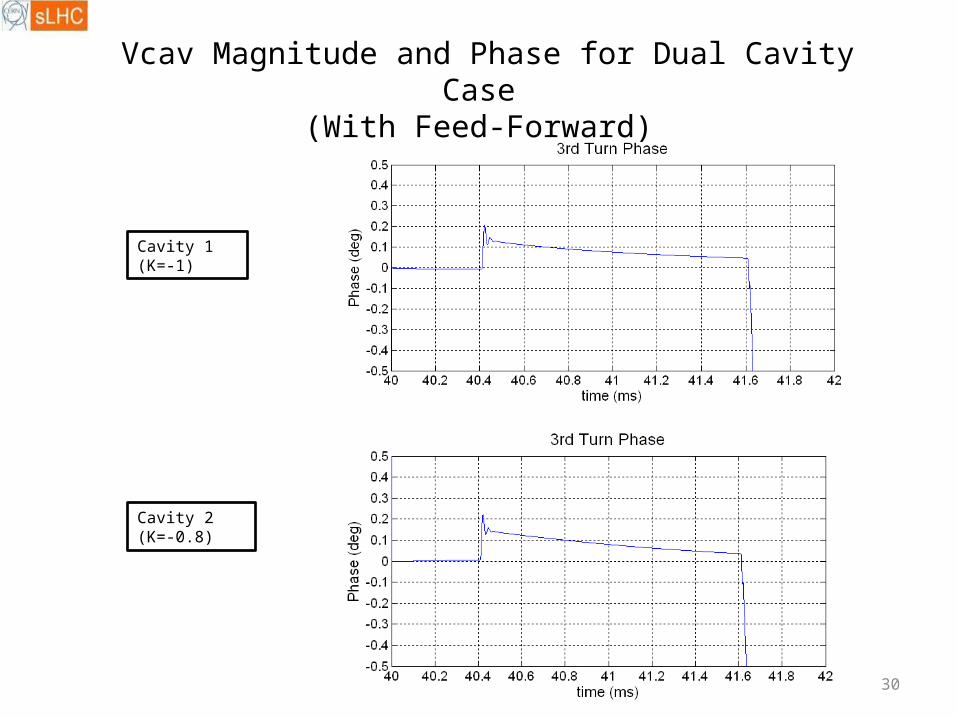
Vcav Magnitude and Phase for Dual Cavity Case(With Feed-Forward)
Cavity 1 (K=-1)
Cavity 2 (K=-0.8)
31
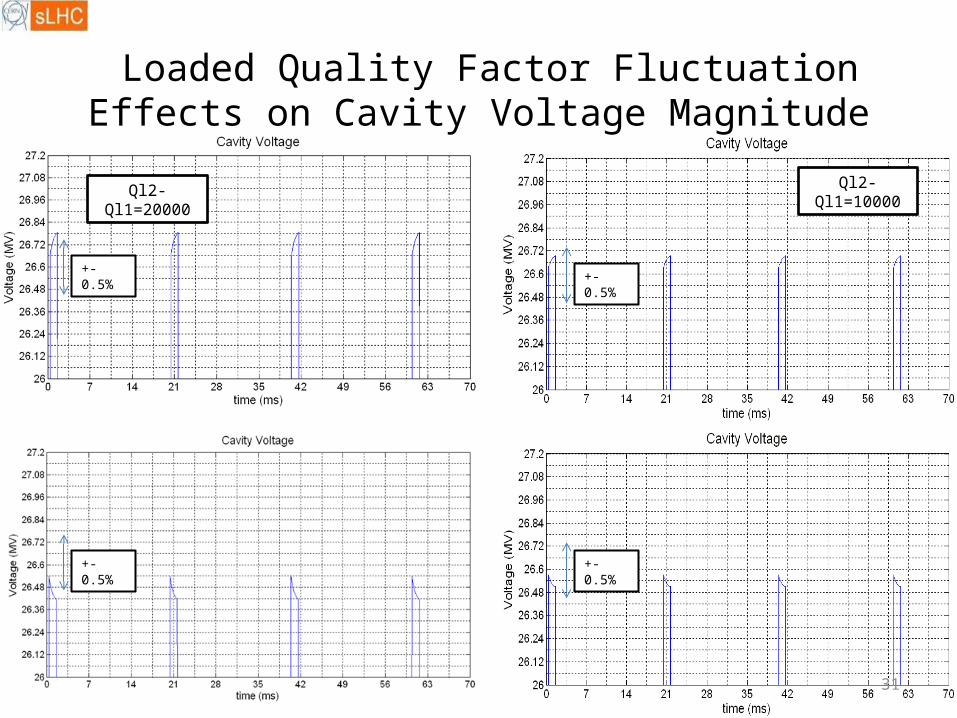
Loaded Quality Factor Fluctuation Effects on Cavity Voltage Magnitude
Ql2-Ql1=20000 Ql2-Ql1=10000
+-0.5%
+-0.5%
+-0.5%
+-0.5%
32
Error Analysis
• Vector average is maintained within specifications with RF feedback loop, but individual cavities deviate depending on their parameters.
• Characterize deviation of cavity voltage with variations in loaded quality factor and lorentz detuning coefficients
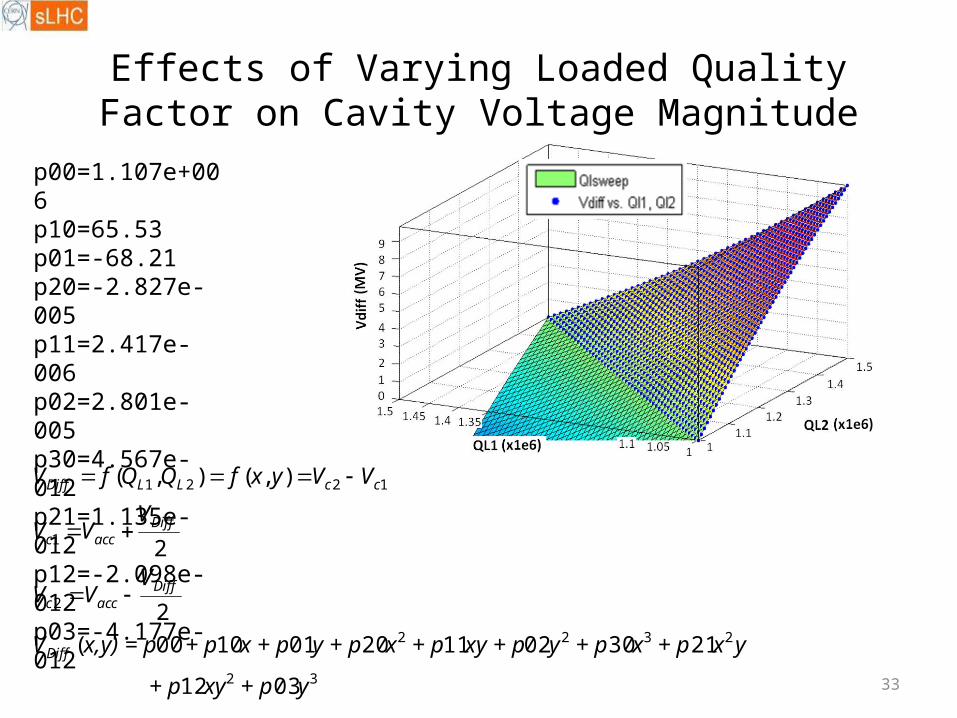
• Curves fitted for difference in cavity voltage magnitude and phase between 2 cavities controlled by a single RF feedback loop, centered at nominal accelerating voltage magnitude and phase.
33
Effects of Varying Loaded Quality Factor on Cavity Voltage Magnitude
32
2322
2
1
1221
0312
2130021120011000(
2
2
),(),(
y + pxy+ p
y x + px + pyxy + p + pxy + px + p + px,y) = pV
VVV
VVV
VVyxfQQfV
Diff
Diffaccc
Diffaccc
ccLLDiff
p00=1.107e+006p10=65.53p01=-68.21 p20=-2.827e-005p11=2.417e-006p02=2.801e-005p30=4.567e-012p21=1.135e-012p12=-2.098e-012p03=-4.177e-012
34
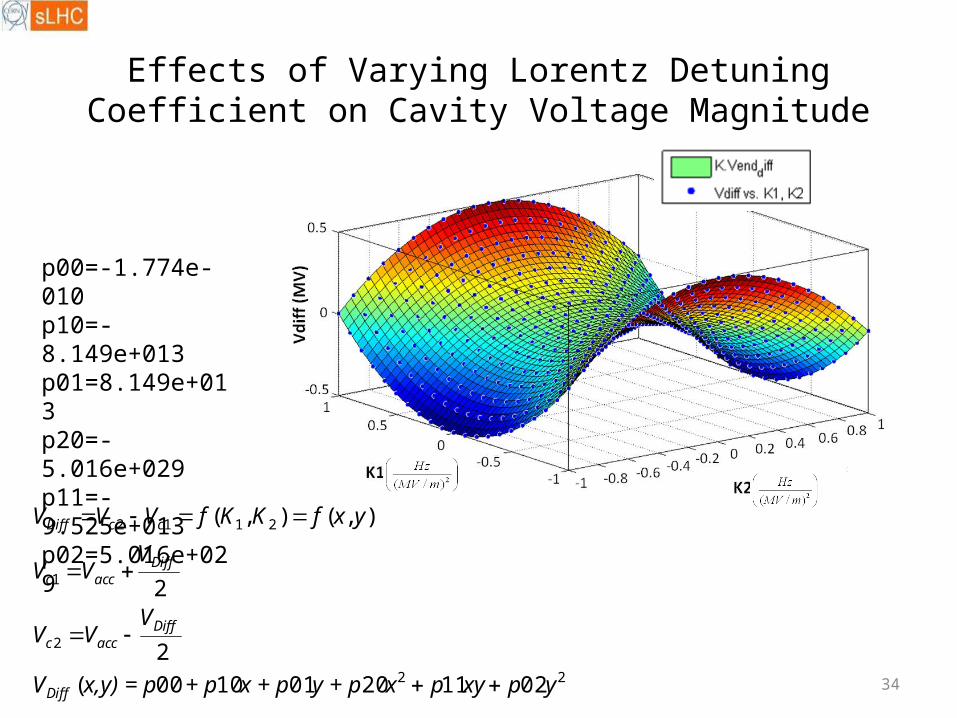
Effects of Varying Lorentz Detuning Coefficient on Cavity Voltage Magnitude
22
2
1
2112
021120011000(
2
2
),(),(
ypxypxy + px + p + px,y) = pV
VVV
VVV
yxfKKfVVV
Diff
Diffaccc
Diffaccc
ccDiff
p00=-1.774e-010p10=-8.149e+013p01=8.149e+013p20=-5.016e+029p11=-9.525e+013p02=5.016e+029
35
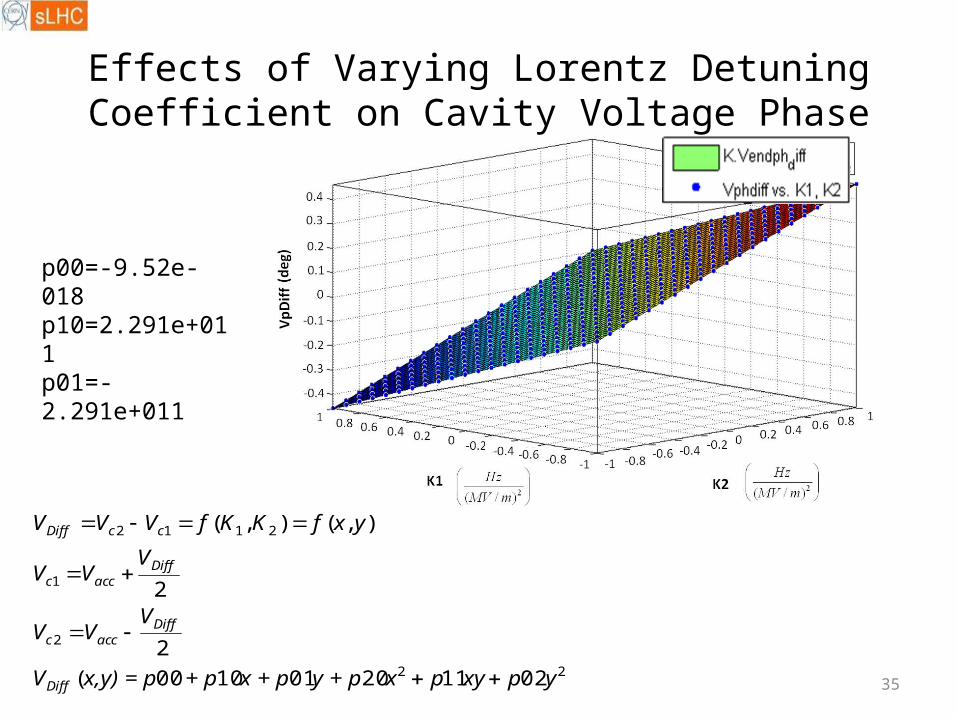
Effects of Varying Lorentz Detuning Coefficient on Cavity Voltage Phase
22
2
1
2112
021120011000(
2
2
),(),(
ypxypxy + px + p + px,y) = pV
VVV
VVV
yxfKKfVVV
Diff
Diffaccc
Diffaccc
ccDiff
p00=-9.52e-018p10=2.291e+011p01=-2.291e+011
36
In Summary…
• In order to cater for the needs of project specifications in constant need of revision, a high flexibility simulation model developed
• Flexible graphical user interface allows for efficient handling of simulation data
• 1, 2 and 4 cavities can be observed from RF point of view under a wide set of circumstances
• Can estimate practical issues that can arise during development of a real LLRF system in terms of power, stability of accelerating field and technology necessary for operation
37
Next Step
• Include and quantify effect from finite transit time for low beta cavities.
• Characterize power amplifier nonlinearities
• Characterize the behavior of the piezo-electronic tuner within the control loop.