Embed Size (px)
Citation preview
AFRICAN CAPITAL MARKETS CHALLENGES AND OPPORTUNITIES
CFA INSTITUTE RESEARCH FOUNDATION / BRIEF
HEIDI RAUBENHEIMER, CFA EDITOR
AFRICAN CAPITAL MARKETSChallenges and Opportunities
Heidi Raubenheimer, CFA Editor
Statement of Purpose
CFA Institute Research Foundation is a not-for-profit organization established to promote the development and dissemination of relevant research for investment practitioners worldwide.
Neither CFA Institute Research Foundation, CFA Institute, nor the publication’s edi-torial staff is responsible for facts and opinions presented in this publication. This publication reflects the views of the author(s) and does not represent the official views of CFA Institute Research Foundation.
CFA®, Chartered Financial Analyst®, and GIPS® are just a few of the trademarks owned by CFA Institute. To view a list of CFA Institute trademarks and the Guide for the Use of CFA Institute Marks, please visit our website at www.cfainstitute.org.
© 2019 CFA Institute Research Foundation. All rights reserved.
No part of this publication may be reproduced, stored in a retrieval system, or transmitted, in any form or by any means, electronic, mechanical, photocopying, recording, or otherwise, without the prior written permission of the copyright holder.
This publication is designed to provide accurate and authoritative information in regard to the subject matter covered. It is sold with the understanding that the publisher is not engaged in rendering legal, accounting, or other professional service. If legal advice or other expert assistance is required, the services of a competent professional should be sought.
Cover credit: Jialiang Gao / Moment / Getty Images
ISBN 978-1-944960-87-2
CFA Institute Research Foundation | iii
BIOGRAPHIESBadr Benyoussef is chief business develop-ment officer at the Casablanca Stock Exchange. Previously, he held the position of financial communication and investor relations manager at Maroc Telecom, the leading telecom opera-tor in Morocco. Mr. Benyoussef also worked in the Moroccan stock market as a financial ana-lyst. He has a master’s degree in business from Paris Dauphine University, is a laureate of the Institut des Hautes Études de Management de Casablanca, and has a financial analyst diploma from SFAF-Polyfinance.
Kopano Bolokwe, CAIA, MBA, is the head of product development at Botswana Stock Exchange and has over 11 years of industry experience. He joined the BSE in 2011 and, prior to that, was a broker and investment ana-lyst at Stanlib. Mr. Bolokwe holds a degree in finance and an MBA, both from the University of Botswana. He has completed the CAIA Charter program and the Level II exam of the CFA Program. Mr. Bolokwe is a graduate fel-low of the IFC-Milken Institute Capital Markets Program at the George Washington University School of Business.
Bhavik Desai conducts equity research on stocks listed on the Stock Exchange of Mauritius (SEM) at AXYS Stockbroking. His team provides regular market wraps covering equities, fixed income, and other securities listed on the SEM and provides recommendations for blue chips. Prior to joining AXYS, Mr. Desai worked on the implementation and monitoring of corporate strategies at SAP Labs LLC in California. He holds a master’s in finance from the Sorbonne Business School at IAE de Paris and a double bachelor’s degree in physics and astrophysics from the University of California, Berkeley.
Ronak Gopaldas is a political economist, “pra-cademic,” writer, and speaker focused on the intersection of politics, economics, and busi-ness in Africa. He is a director at Signal Risk and fellow at the Centre for African Management and Markets at the Gordon Institute of Business Science. Previously, Mr. Gopaldas was the head of country risk at Rand Merchant Bank. He has made frequent appearances on CNN, BBC, Al Jazeera, and CNBC Africa, and publishes regu-lar opinion and analysis pieces. He has spoken at top universities and leading Africa-focused policy and business conferences as a moderator, panelist, and keynote speaker, and delivered a TEDx talk entitled “Embracing Africa: Beyond the Binaries.” Earlier this year, Mr. Gopaldas was selected for the Archbishop Tutu Leadership Fellowship. He is also an alumnus of the Asian Forum on Global Governance, as well as the Young African Leaders Initiative.
Karim Hajji is the CEO of the Casablanca Stock Exchange. Prior to joining CSE, he was chair-man and CEO of Atlas Capital Group. After var-ious management roles at Eli Lilly and Company in the United States, Italy, and Switzerland, Mr. Hajji joined the ONA Group, Morocco’s largest conglomerate—first as adviser to the chairman, then as general manager of an affili-ate in Monaco, and finally as group CFO. In November 2018, he was appointed chairman of the African Securities Exchanges Association (ASEA). Mr. Hajji is also a board member of Operation Hope and a member of the advi-sory board of Silatech. He holds an MBA from NYU Stern School of Business, a diploma from Institut d’Études Politiques de Paris, and a master’s degree in capital markets from the University of Paris-IX Dauphine.
BIogRApHIes
iv | CFA Institute Research Foundation
Ivy Hesse, CFA, CIPM, is the founder and principal consultant of Synercate, an investment performance, GIPS compliance, and general advisory firm in Ghana. She previously worked at Databank Brokerage Ltd and SEM International Associates (SEM Capital Advisors) and served as an independent trustee on seven pension trustee boards. Ms. Hesse has been a panelist at the EASEA (East African Securities Exchanges Association, a regional grouping under ASEA) conference in Kigali, Rwanda; a moderator at the annual Capital Market Week and Financial Analyst Society, Ghana (the precursor soci-ety to CFA Society Ghana), conferences; and a session facilitator for the ACCPA (Association of Certified Compliance Professionals, Africa) Ghana conference. She is an instructor for the professional licensing program for investment industry professional courses in Ghana and pro-vides training for professionals of key industry institutions through her in-house training, pub-lic workshops, and industry forums.
Adil Hlimi is managing editor of Boursenews.ma, a Moroccan financial information website. He is also professor of universities in finance. He started his career in wealth management and investment consulting in specialized firms in Casablanca and Marrakech, Morocco. Mr. Hlimi is a graduate in corporate finance.
Gehad Hussein is managing editor at Business Forward and journalism instructor at Misr International University (MIU), with nine years of experience in journalistic writing, content cura-tion, and copy editing. Her focus has been on eco-nomic, financial, political, social and stock market stories. Previously, Ms. Hussein has worked at Daily News Egypt, Egypt Business Directory, RiseUp LLC, and Mubasher.info, among others. She has a BA in online and print journalism from MIU and an MA in political science from the American University in Cairo (AUC).
Dennis Murekachiro is a full-time lecturer and head of the banking and finance department at Bindura University of Science Education. He is a passionate researcher on capital markets and investment management and is also passion-ate about financial and risk analytics and fin-tech and its application of artificial intelligence systems. Mr. Murekachiro is a PhD candidate in finance, with a thesis on predicting African stock markets. He holds an Msc in finance and investment from the National University of Science and Technology, Zimbabwe, and a cer-tificate in algorithmic trading from QuantInsti, India.
Norbert Mungwini is a full-time lecturer in the department of finance at the National University of Science Technology, Zimbabwe (NUST). He lectures on corporate finance, alternative invest-ments, and derivatives pricing and applica-tion. Mr. Mungwini’s research interests include capital markets, personal finance, alternative investments, and corporate finance. He holds a master of science in finance and investment (NUST), a bachelor’s degree in financial man-agement from the University of South Africa (Unisa), and a post-graduate diploma in higher education (NUST). Mr. Mungwini is a member of the Investment Professionals Association of Zimbabwe.
Brighton Mutingwende, CFA, is an invest-ments analyst with First Mutual Wealth Management, a local asset management com-pany. He is a founder and lecturer at Wintelstar Finance School, a local finance school with sole mandate of assisting candidates in the in the CFA Program. Mr. Mutingwende’s experience spans investment research, financial reporting analysis, private equity valuation, and invest-ment management. He holds a bachelor’s of accounting sciences from Africa University and is a member of the Investment Professionals
BIogRApHIes
CFA Institute Research Foundation | v
Association of Zimbabwe and CFA Society South Africa.
Rufus Mwanyasi is an executive with an invest-ment advisory firm, Canaan Capital, that man-ages an equity-focused investment partnership fund. He runs a weekly business column, Mark to Market, with Business Daily and features on business media, CNBC Africa, and CGTN. Mr. Mwanyasi currently advises various corporate entities on East African capital markets and is a contributor to The Exchange.
Martin Mwita is a regular writer for The Exchange, contributing on the economy and financial and economic trends in East Africa. He is a popular journalist in East Africa cover-ing the various financial and capital markets. Mr. Mwita holds a diploma in journalism from the Mombasa Aviation Training Institute and a BA in mass media and communication from Mount Kenya University.
Aly Z. Ramji is a director at Mediapix Limited, a media house that publishes The Exchange. He is also responsible for overseeing the operations of various other news publications under the Mediapix portfolio on the continent. Mr. Ramji has worked for UNESCO, UNDP, UN OIOS, and the African Union, in addition to having his own development consulting firm, where he was an adviser for the US military on reconstruction efforts in Iraq. Previously, he has served as a consultant on energy and security to various US companies in West Africa. Mr. Ramji holds a BA in economics and finance from the University of Waterloo, an MA in international relations from the Maxwell School at Syracuse University, and an MSc in public relations from the Newhouse School at Syracuse University.
Adrian Saville is chief executive at Cannon Asset Managers. He has experience in man-aging all the major asset classes and holds a
professorship of economics, finance, and strat-egy at the Gordon Institute of Business Science (GIBS). Dr. Saville has been nominated for the Economist Intelligence Unit’s Business Professor of the Year Award and received the Central and East European Management Development Association award in teaching excellence. He has consulted widely to government and busi-ness, including serving as an economic con-sultant to Visa South Africa. Dr. Saville holds a bachelor’s degree, master’s of commerce, and PhD (economics) from the University of Natal, for which he was awarded the Economic Society of South Africa’s Founders’ Medal. He is a UNESCO laureate and a matriculant of Linacre College at the University of Oxford and has completed programmes in value investing and competitive strategy at Columbia University and Harvard Business School.
Kagiso Sedimo, FRM, CFA, is a co-founder and a portfolio manager at Morula Capital Partners. He has over 13 years’ experience in asset man-agement. Previously, Mr. Sedimo was a port-folio manager at Investec Asset Management, where he was a strategy leader responsible for the management of multi-asset portfolios. Prior to joining Investec, Mr. Sedimo was a portfolio manager at Fleming Asset Management, where he managed emerging and frontier market equities.
Mohamed Selim Tantawy is deputy manager in the R&D department at the Egyptian Exchange (EGX), where he works on new business devel-opment projects and reports. He is also an instructor for EGX and Egyptian Capital Market Association training programs. Mr. Tantawy holds a bachelor’s of economics and political science from Cairo University and a business administration diploma from the American University in Cairo. He has passed the Level I exam for the CFA Program and the global
BIogRApHIes
vi | CFA Institute Research Foundation
securities exam from the Chartered Institute for Securities & Investment “London 2017.”
Dave Uduanu, CFA, is the CEO at Sigma Pensions Limited, a Nigeria-based pension fund manager, and a member of the board of trustees of CFA Institute Research Foundation. Previously, he was chairman of the Pension Fund Operators Association of Nigeria. Mr. Uduanu has worked at Ernst & Young in Lagos and served as a director of a life insurance company in Nigeria. He has held board posi-tions for general insurance, asset management,
and healthcare companies. Mr. Uduanu holds an honors degree in civil engineering and a Certificate in Institutional Private Equity Investing jointly awarded by the EVCA and the Saïd Business School at the University of Oxford. He is a Chartered Accountant.
Virginia Wairimu is an independent research analyst. She has been an avid writer for The Exchange, as well as holding various positions with investment funds in Kenya. Ms. Wairimu holds a BSc. in actuarial science, with nine years of experience working in capital markets in Africa.
This publication qualifies for 3.5 CE credits under the guidelines of the CFA Institute Continuing Education Program.
CONTENTS
Foreword ........................................................................................................................... ix
Introduction ...................................................................................................................... xi
South Africa and Namibia ...................................................................................................1
Botswana .......................................................................................................................... 13
Zimbabwe ......................................................................................................................... 23
Mauritius .......................................................................................................................... 29
East Africa ........................................................................................................................ 39
Nigeria ............................................................................................................................. 59
Ghana ............................................................................................................................... 73
Egypt ................................................................................................................................ 83
Morocco ........................................................................................................................... 91
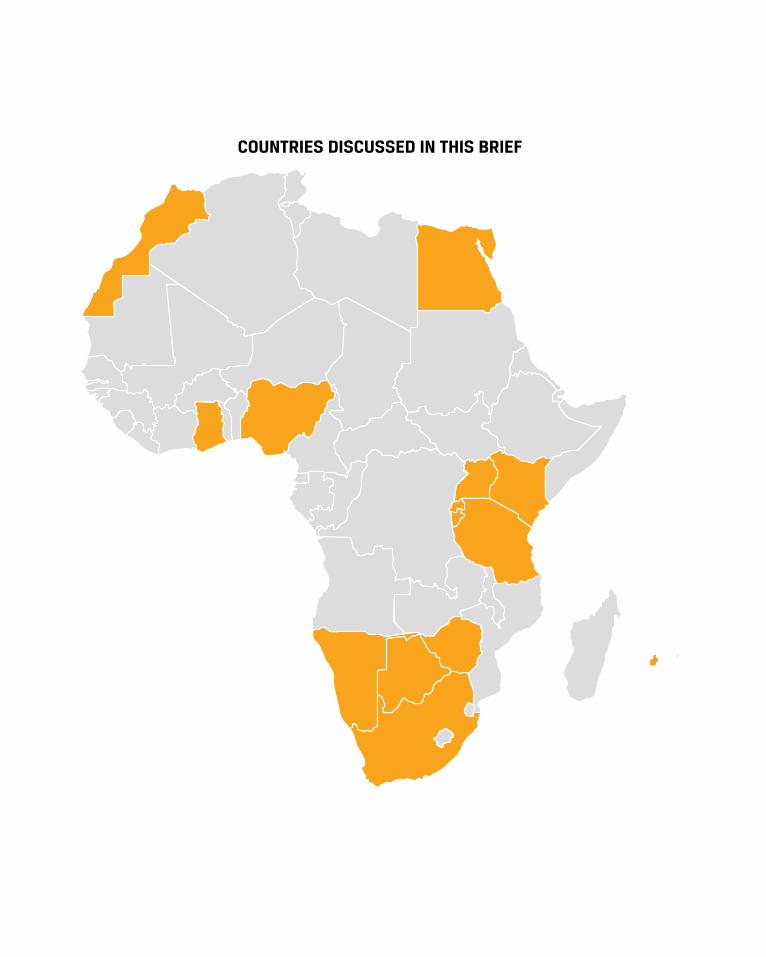
COUNTRIES DISCUSSED IN THIS BRIEF
CFA Institute Research Foundation | ix
FOREWORDWhere are you going?
Where are you coming from?...
Ub’ ubiziwe yiAfrika1 then we’re singing the same song.
So goes the refrain of one of my favourite songs from home: Freshlyground’s “Mowbray Kaap.”
Every piece in this CFA Institute Research Foundation brief tells of a market in Africa: where it’s going and where it’s coming from. It was my privilege to edit this first Africa-focused publication by CFA Institute: a collaboration of essays from authors across my home con-tinent. I hope that they “sing the same song” and stimulate and engage investment industry stakeholders, including CFA Institute members and societies, firms, universities, regulators, exchanges, trade associations, and other capital market stakeholders in Africa.
What you’ll read here was developed in con-junction with the African Securities Exchanges Association (ASEA) and builds on the mem-orandum of understanding between CFA Institute and ASEA. CFA Institute has part-nered with CFA Institute local societies in South Africa, Nigeria, Mauritius, and Ghana, as well as our emerging pre-society in Zimbabwe, to iden-tify authors and present a collection of pieces by local contributors on their respective markets. In addition, ASEA has collaborated with local authors in Morocco, Egypt, Botswana, and East Africa to contribute to the brief. And so this brief reflects our desire to partner with strong African entities and our own local societies to provide authoritative insights and analysis for
1Translated from Xhosa: “If you’ve been called by Africa, then we’re singing the same song.”
current or prospective investors in African capi-tal markets.
Some of the exchanges you’ll read about here were established in early colonial times. South Africa led the way on the heels of the diamond and gold rush, followed by Zimbabwe, Egypt, and Namibia (a German colony at the time)—all before 1905. Some of these didn’t outlive the commodities rush (Kimberley and Cape Town in South Africa; Namibia), but others are still thriving today, substantially diversified and modernised from their beginnings a century ago. Some capital markets on the continent were established more recently, and their develop-ment tells of independence and nation building: Nigeria in the 1960s; Botswana, Mauritius, and Ghana in 1989; Namibia (post-independence from South Africa in the 1990s). Still others, par-ticularly the East African exchanges, are brand new and leapfrogging toward greater participa-tion. All of these tell of how regulation, trad-ing technology, and fintech are enabling fairer, faster, and lower-cost participation in finance and investment for more market participants.
These tales of African capital markets’ history and future reflect the journey of CFA Institute: from a lunch group in New York City in 1937 to a diverse collection of 170,000 members and 157 societies worldwide in 2019, united with the purpose of leading the investment profes-sion globally for the ultimate benefit of society. I hope that each of these pieces will tell you a story that you didn’t entirely anticipate, from origin to modern day and the many ambitions for the future.
Heidi Raubenheimer, CFASenior Director, Journal Publications

CFA Institute Research Foundation | xi
INTRODUCTIONKarim HajjiPresident ASEA
The critical role of stock exchanges in the global economy cannot be overemphasized. Not only do exchange businesses contribute to the eco-nomic objectives of their jurisdictions—rais-ing money and investing—but they also have a social responsibility to, for example, prudently allocate resources and create employment, among other obligations.
The origin of exchanges can be traced as far back as the 14th and 15th centuries—trading of com-modities by merchants in Venice and, soon after, by voyagers sailing to the East Indies. Although the infrastructure and institutions back then did not resemble today’s stock markets, they laid the groundwork for the present-day stock exchanges by bringing together buyers, sellers, and borrowers to trade among themselves while hedging against the risks of investment.
In the developed world, major stock markets emerged in the 19th and 20th centuries, led by the London Stock Exchange and New York Stock Exchange. Today, virtually every country or territory in the world has its own bourse. All of the world’s major economic powers have highly sophisticated stock markets that are active and considerably contributing to their national GDPs. There are approximately 48,000 companies listed on stock exchanges around the world, and nearly USD95 trillion trades across these exchange platforms.
In Africa, the first stock market was estab-lished in 1861, and 15 decades later, the region
is now home to 36 stock exchanges serving 43 economies and representing 1,400 listed companies with a turnover of USD41.14 bil-lion. These markets have grown steadily and demonstrated their capability to create pros-perity on the continent. Successful fundraising initiatives by multilateral entities, such as the African Development Bank (AfDB) and the Trade and Development Bank, continue to bor-row in domestic currencies from local capital markets, which demonstrates the growth and capacity of these exchanges. Proceeds of such fundraising are directed toward developmen-tal projects in the respective jurisdictions. For instance, in 2014, the AfDB successfully raised NGN12.95 billion (approximately USD80 mil-lion) through its maiden local currency issuance in the Nigerian capital market. The proceeds of the successful NGN issuance went toward fund-ing local small and medium enterprises (SMEs) and some infrastructure projects requiring local currency financing.
However, despite such encouraging success stories, African exchanges are still character-ized as being illiquid and highly fragmented and as operating under weak regulatory envi-ronments. This categorization is supported by dismal activities on the stock exchanges and shrinking foreign investor participation across the markets. Conversely, the continent faces an infrastructure deficit of approximately USD108 billion, which could be easily accessed through the local capital markets.
IntRoduCtIon
xii | CFA Institute Research Foundation
It is with this background that the African Securities Exchanges Association (ASEA) was established in 1993 to provide a concerted effort in lobbying for and promoting the position of African stock exchanges as drivers of economic growth in the region.
ASEA hosts 26 exchanges in Africa and was established with the aim of developing mem-ber exchanges to be significant drivers of eco-nomic and societal transformation in Africa. ASEA works closely with its member exchanges to unlock the potential of the African capital markets and the African economies they serve. It does so by championing common areas of interest among the exchanges, such as capacity building, market development, and advocacy.
ASEA provides its members with
• opportunities that can enhance their effec-tiveness through exchange integration efforts as a means of deepening the markets and enhancing their liquidity attributes;
• capacity-building initiatives that equip members with the skills they need; and
• close liaisons with market stakeholders to develop an investor-ready environment.
For African bourses to attain a desirable level of competitiveness and thereafter live up to their economic and social mandate, they must be strategically positioned to attract international inflows in a sustainable way.
IntRoduCtIon
CFA Institute Research Foundation | xiii
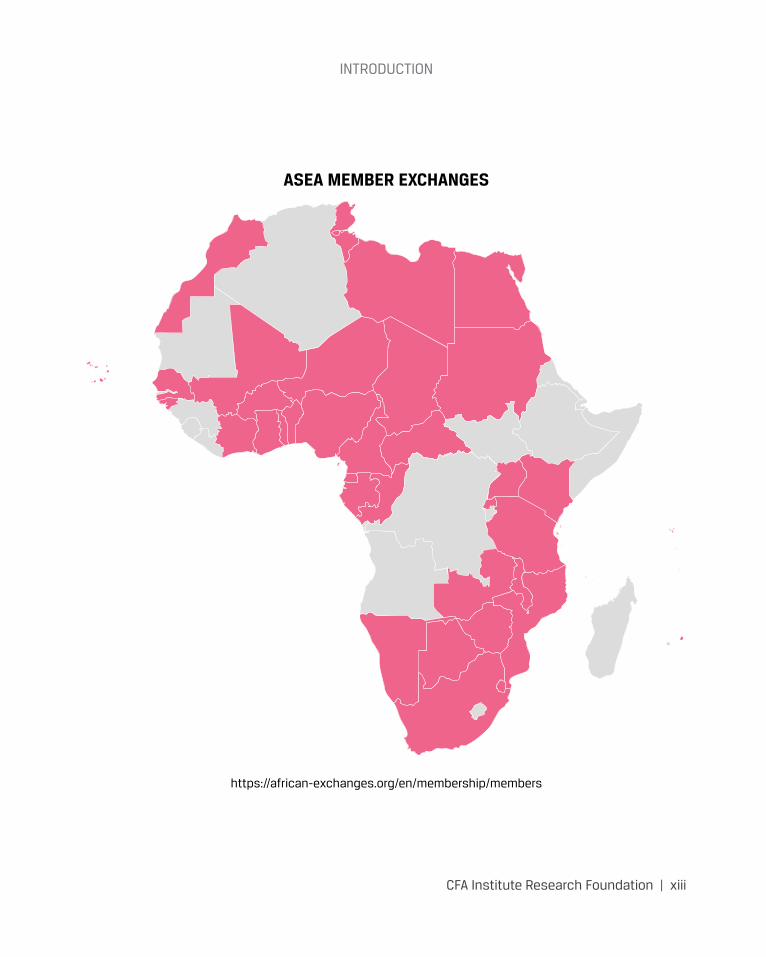
ASEA MEMBER EXCHANGES
https://african-exchanges.org/en/membership/members

CFA Institute Research Foundation | 1
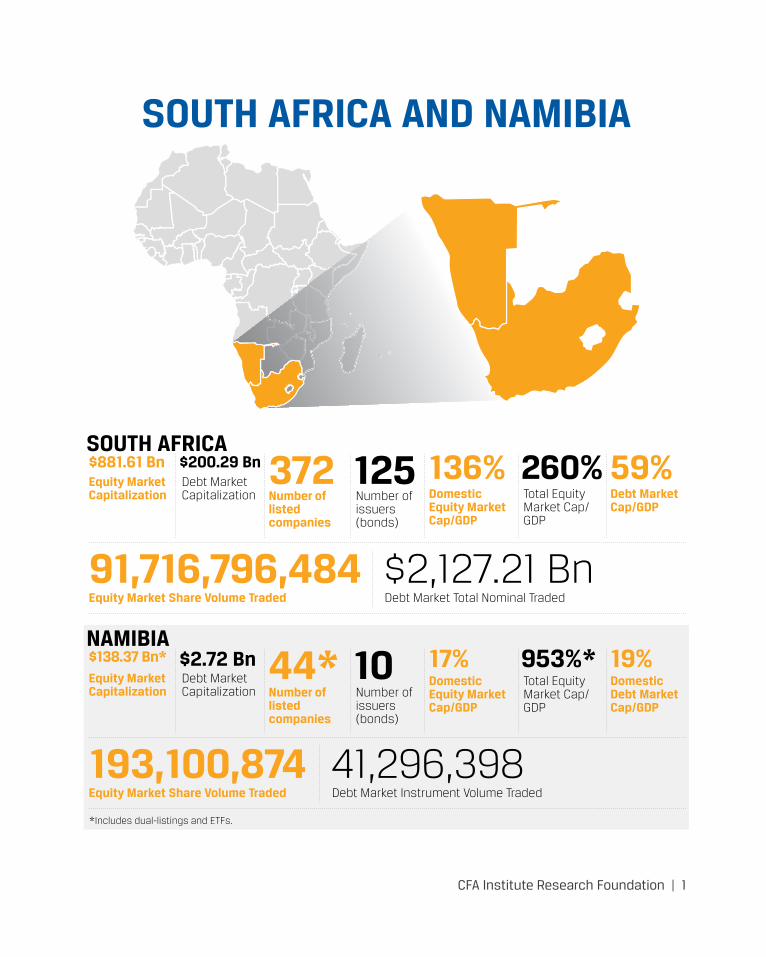
SOUTH AFRICA AND NAMIBIA
Equity Market Capitalization
Equity Market Share Volume Traded
Debt Market Capitalization
Debt Market Total Nominal Traded
Number of issuers (bonds)
Total Equity Market Cap/GDP
Number of listed companies
Domestic Equity Market Cap/GDP
Debt Market Cap/GDP
$881.61 Bn
91,716,796,484
372 136% 59%$200.29 Bn
$2,127.21 Bn
125 260%SOUTH AFRICA
Equity Market Capitalization
Equity Market Share Volume Traded
Debt Market Capitalization
Debt Market Instrument Volume Traded
*Includes dual-listings and ETFs.
Number of issuers (bonds)
Total Equity Market Cap/GDP
Number of listed companies
Domestic Equity Market Cap/GDP
Domestic Debt Market Cap/GDP
$138.37 Bn*
193,100,874
44* 17% 19%$2.72 Bn
41,296,398
10 953%*NAMIBIA
soutH AFRICA And nAmIBIA
2 | CFA Institute Research Foundation
1880s
1890s
1910s
1960s
2000s
1900s
1940s
1990s
2010s
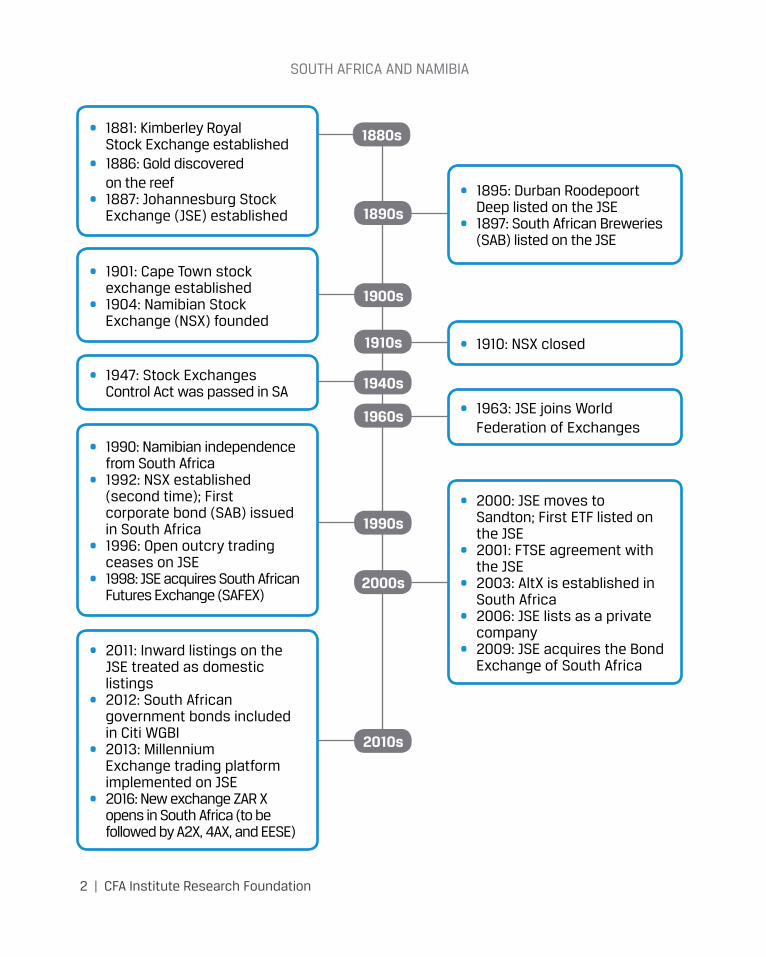
• 1881: Kimberley Royal Stock Exchange established
• 1886: Gold discovered on the reef
• 1887: Johannesburg Stock Exchange (JSE) established
• 2011: Inward listings on the JSE treated as domestic listings
• 2012: South African government bonds included in Citi WGBI
• 2013: Millennium Exchange trading platform implemented on JSE
• 2016: New exchange ZAR X opens in South Africa (to be followed by A2X, 4AX, and EESE)
• 1901: Cape Town stock exchange established
• 1904: Namibian Stock Exchange (NSX) founded
• 1947: Stock Exchanges Control Act was passed in SA
• 1990: Namibian independence from South Africa
• 1992: NSX established (second time); First corporate bond (SAB) issued in South Africa
• 1996: Open outcry trading ceases on JSE
• 1998: JSE acquires South African Futures Exchange (SAFEX)
• 1910: NSX closed
• 1963: JSE joins World Federation of Exchanges
• 2000: JSE moves to Sandton; First ETF listed on the JSE
• 2001: FTSE agreement with the JSE
• 2003: AltX is established in South Africa
• 2006: JSE lists as a private company
• 2009: JSE acquires the Bond Exchange of South Africa
• 1895: Durban Roodepoort Deep listed on the JSE
• 1897: South African Breweries (SAB) listed on the JSE
CFA Institute Research Foundation | 3
SOUTH AFRICAAdrian SavilleChief Executive, Cannon Asset Managers Professor of Economics and Finance, Gordon Institute of Business Science
Ronak GopaldasDirector, Signal Risk
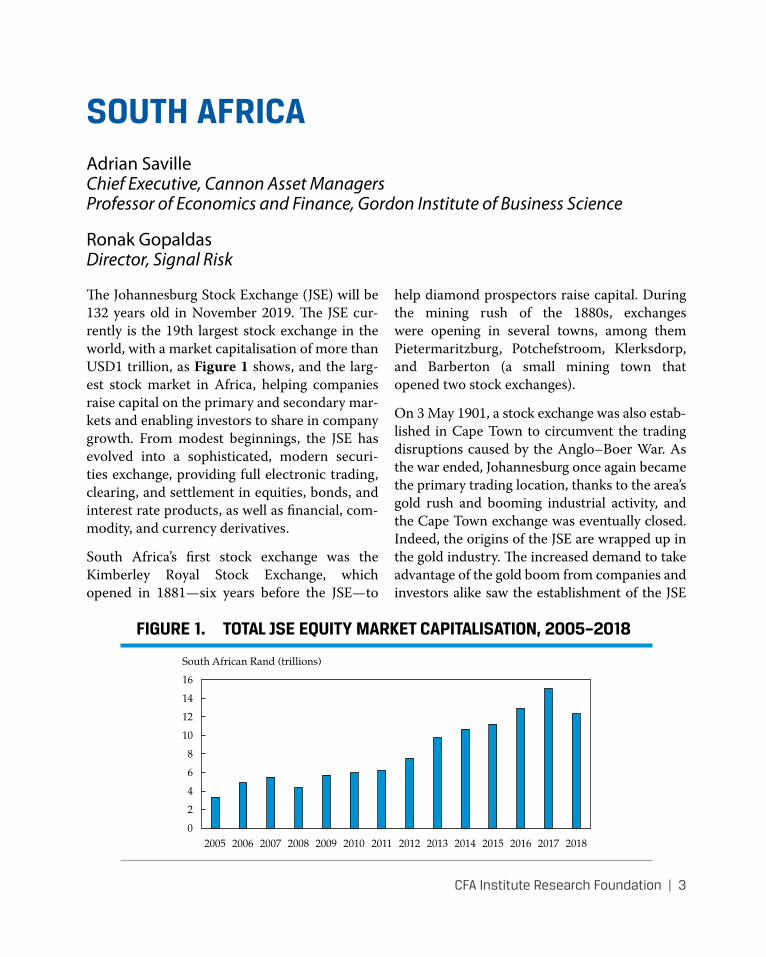
The Johannesburg Stock Exchange (JSE) will be 132 years old in November 2019. The JSE cur-rently is the 19th largest stock exchange in the world, with a market capitalisation of more than USD1 trillion, as Figure 1 shows, and the larg-est stock market in Africa, helping companies raise capital on the primary and secondary mar-kets and enabling investors to share in company growth. From modest beginnings, the JSE has evolved into a sophisticated, modern securi-ties exchange, providing full electronic trading, clearing, and settlement in equities, bonds, and interest rate products, as well as financial, com-modity, and currency derivatives.
South Africa’s first stock exchange was the Kimberley Royal Stock Exchange, which opened in 1881—six years before the JSE—to
help diamond prospectors raise capital. During the mining rush of the 1880s, exchanges were opening in several towns, among them Pietermaritzburg, Potchefstroom, Klerksdorp, and Barberton (a small mining town that opened two stock exchanges).
On 3 May 1901, a stock exchange was also estab-lished in Cape Town to circumvent the trading disruptions caused by the Anglo–Boer War. As the war ended, Johannesburg once again became the primary trading location, thanks to the area’s gold rush and booming industrial activity, and the Cape Town exchange was eventually closed. Indeed, the origins of the JSE are wrapped up in the gold industry. The increased demand to take advantage of the gold boom from companies and investors alike saw the establishment of the JSE
FIGURE 1. TOTAL JSE EQUITY MARKET CAPITALISATION, 2005–2018
South African Rand (trillions)
16
14
12
10
8
6
2
4
020082006 2007 2009 2010 2011 2013 2014 2015 2017 20182005 2012 2016
soutH AFRICA
4 | CFA Institute Research Foundation
on 8 November 1887, just one year after the dis-covery of gold on the reef.
It is estimated that more than £200 million was invested in South Africa’s gold industry between 1887 and 1934, more than half of which came from foreign investors.
Chambers and Company was the first company to list on the JSE, in 1887. In 1895, gold min-ing company Durban Roodepoort Deep (DRD) listed on the JSE, and it remains the oldest listed company in South Africa. The country’s largest brewer, South African Breweries (SAB), now owned by Anheuser-Busch InBev SA/NV, listed in 1897. The exchange has since seen thousands of listings, mergers, acquisitions, and delistings. Among these epochs are several listing booms, including the Merensky platinum boom of the late 1920s, the 1968 listings boom, and the 1986–87 small-companies boom, which saw 293 companies list in the space of two years, includ-ing 102 listings on the JSE’s junior boards—namely, the Venture Capital Market (VCM) and Development Capital Market (DCM) boards.
As the market continued to grow, the Stock Exchanges Control Act was passed in 1947 to regulate the operation of stock exchanges by
stating capital requirements for members and to define the parameters of broker conduct. In 1963, the JSE joined the World Federation of Exchanges, the global industry association for exchanges and clearinghouses.
On 7 June 1996, open outcry trading ceased, with the 108-year practice replaced by an order-driven, centralised, automated system known as the Johannesburg Equities Trading (JET) system.
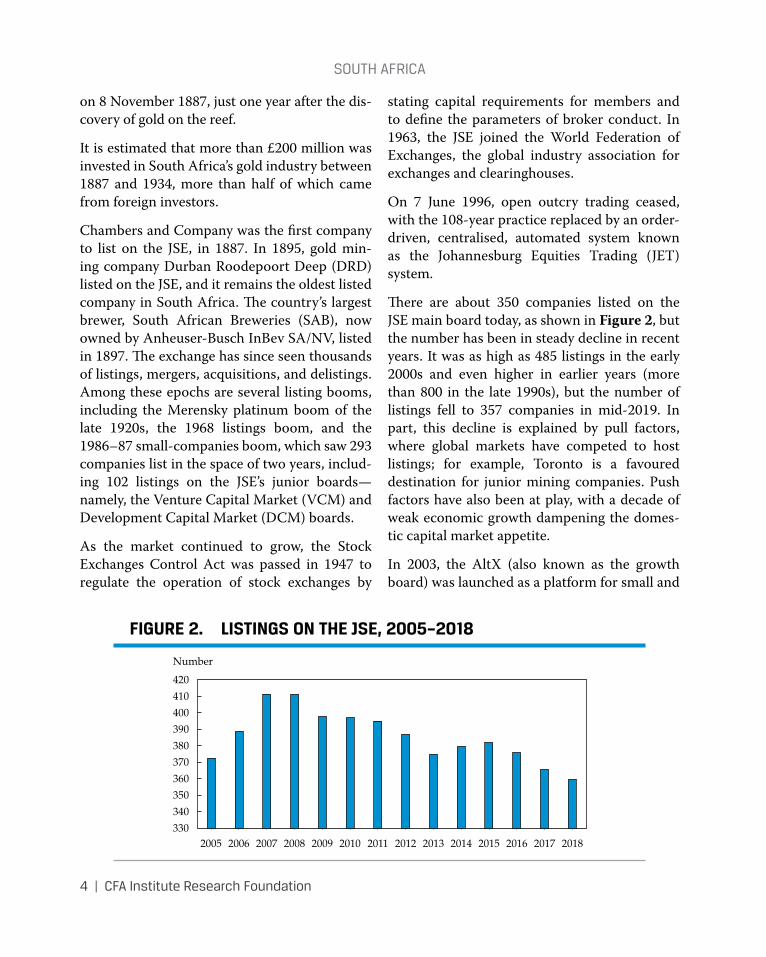
There are about 350 companies listed on the JSE main board today, as shown in Figure 2, but the number has been in steady decline in recent years. It was as high as 485 listings in the early 2000s and even higher in earlier years (more than 800 in the late 1990s), but the number of listings fell to 357 companies in mid-2019. In part, this decline is explained by pull factors, where global markets have competed to host listings; for example, Toronto is a favoured destination for junior mining companies. Push factors have also been at play, with a decade of weak economic growth dampening the domes-tic capital market appetite.
In 2003, the AltX (also known as the growth board) was launched as a platform for small and
FIGURE 2. LISTINGS ON THE JSE, 2005–2018
Number
420
410
400
390
380
370
350
340
360
33020082006 2007 2009 2010 2011 2013 2014 2015 2017 20182005 2012 2016
soutH AFRICA
CFA Institute Research Foundation | 5
mid-sized listings, and over the next five years, 76 firms listed on the AltX, with a handful ulti-mately migrating to the main board of the JSE. In 2005, the JSE launched YieldX to facilitate trade in a broad spectrum of interest rate prod-ucts, with a focus on derivatives to encourage liquidity and promote market diversification. As such, YieldX became the JSE’s fourth elec-tronic clearing and settlement platform, along-side equities, financial futures, and agricultural products.
As a company itself, the JSE has also undergone significant changes. Having demutualised on 1 July 2005, the JSE was incorporated in South Africa as the JSE Limited, ultimately listing on its own exchange one year later.
In terms of the physical exchange, before the JSE’s conception, trading took place in a miner’s tent, later moving to horse stables in central Johannesburg. After many years of evolution from these early locales, it was in 2000 that the JSE finally established itself in its current premises at 1 Exchange Square, in the heart of Sandton, Africa’s “most valuable square mile.”
After facing no competition for decades, the JSE met a flurry of smaller competitors in recent years. South Africa’s financial market regulator, the Financial Services Board (now the Financial Sector Conduct Authority, or FSCA), granted approval to ZAR X in 2016 to open an exchange aimed at servicing lower-income individuals through its low-cost model. Since then, other competitors have joined, including A2X, 4AX, and the black eco-nomic empowerment–focused Equity Express Securities Exchange (EESE).
Although dominated by a single large player, South Africa’s capital markets are deep and liquid and boast high trade volumes, predomi-nantly in the equity, bond, and derivatives space.
EQUITIESSouth Africa’s equity market nevertheless con-stitutes less than 1% of the world’s total equity market. The JSE entered into a joint venture with London’s FTSE in 2001 to bring index reporting in line with international investment standards and aid market liquidity under the FTSE/JSE Africa Index Series.2 At the time, a lack of market liquidity prevented local trad-ers from obtaining company stock and led to skewed price increases when buying company shares and outsized losses when selling. The col-laboration with the FTSE did much to improve equity trading and led to the formation of the FTSE/JSE indices, which remain in place today and report across an extensive set of categories, such as market cap, tradability, industry, sector, and style.
In terms of structure, the JSE’s main board lists well-established companies that want to grow their business through share sales and rights issues. Almost a fifth of companies listed on the JSE’s main board are dual-listed; primary listing companies are regulated by the JSE, while sec-ondary listings are regulated in the companies’ primary domicile—for example, the New York, London, Frankfurt, Australian, and Swiss exchanges.
The JSE segments its listed companies by the super sectors in which they operate, including resources (market capitalisation of ZAR3.2 tril-lion), financials (ZAR2.6 trillion), industrials (ZAR7.8 trillion), and real estate (ZAR0.4 tril-lion). In turn, these supersectors are made up of subsectors, such as diversified miners and
2This venture included the implementation of the so-called free-float weighting methodology. When the joint venture was initiated in 2001, the FTSE was jointly owned by the London Stock Exchange and the Financial Times. Today, it trades as FTSE Russell, operating 250,000 indices calcu-lated across 80 markets.
soutH AFRICA
6 | CFA Institute Research Foundation
oil and gas (in the case of resources) and bank-ing and insurance (in the case of financials). Numerous FTSE/JSE industry groupings are derived from these subsectors. Examples of the broader groupings include the FTSE/INDI25 (25 largest industrial stocks), the FTSE/FINI (15 largest financial stocks), and the FTSE/RESI10 (10 largest resource stocks). The headline indi-ces also support numerous subindices recorded by market cap, including the FTSE/JSE Large Cap, FTSE/JSE Mid Cap, FTSE/JSE Small Cap, and FTSE/JSE Fledgling Indices.
Perhaps the best-known index is the FTSE/JSE Top 40 Index, made up of the 40 largest com-panies listed on the main board, which are all typically “blue-chip” stocks. Such companies come from a diverse spectrum of industries and include Naspers (internet and media), Mondi (paper), Tiger Brands (fast-moving consumer goods), Vodacom (communications), Shoprite (retail), Anglo American (resources), FirstRand (banking), Impala Platinum (platinum mining), Bidvest (diversified industries), Woolworths (retail), Sasol (oil and gas), and Old Mutual (insurance).
The robust index measurement and report-ing architecture has birthed a rapidly growing passive investment industry, underpinned by exchange-traded funds (ETFs) listed on the JSE. Overwhelmingly, these funds are designed to match the performance of a quoted index—or to match the behaviour of a rules-based invest-ment approach. The number of ETFs has grown to 76 funds (as of September 2019), and passive or rules-based mutual funds have also experi-enced rapid growth, numbering 36 in 2009 and reaching 168 funds at the end of 2018.
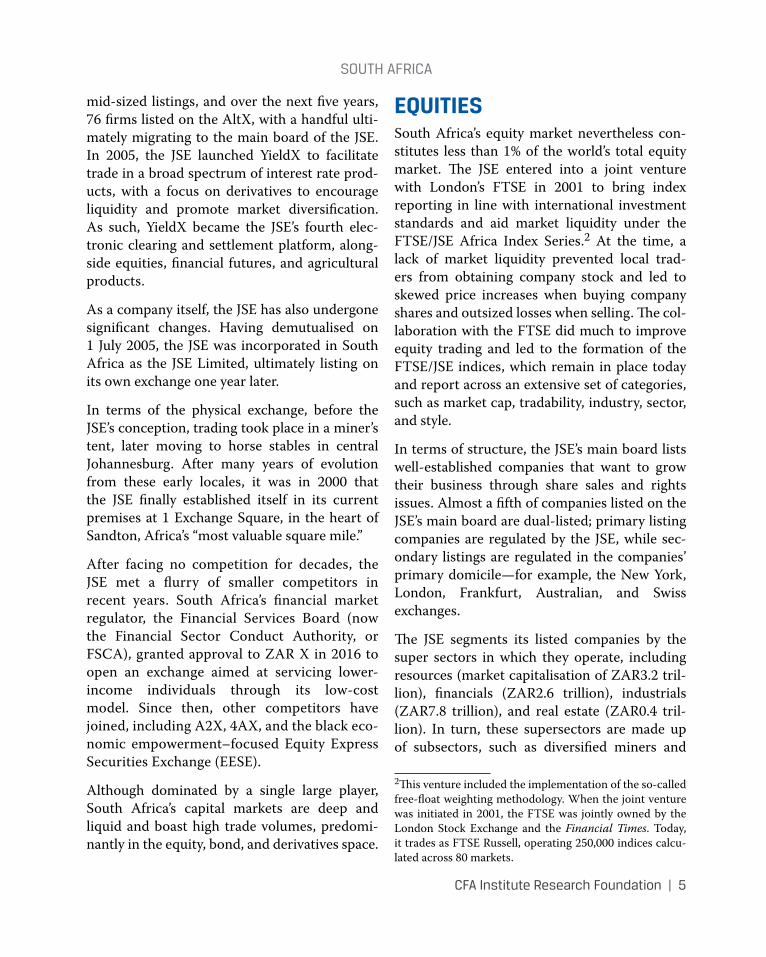
Equity trade volumes and the value of shares changing hands have fallen since the global finan-cial crisis of 2008–09, as Figure 3 shows. Trade values fell 2.1% in 2017 and increased just 8.4% in 2018. The prognosis for 2019 points to another contraction as foreign investors shy away from South African assets in the wake of poor results from a sluggish domestic economy. The value of equity trades fell 39.5% in the first half of 2019, with trade volumes halving in the previous year.
As a globally connected exchange in a small open economy, the JSE and its participants are
FIGURE 3. TOTAL JSE EQUITY VALUE TRADED, 2006–2018
Percent
807060504030
100
–10
20
–2020082006 2007 2009 2010 2011 2013 2014 2015 2017 20182005 2012 2016
soutH AFRICA
CFA Institute Research Foundation | 7
subject to the cut and thrust of global financial markets and domestic constraints, such as the country’s sovereign credit rating.
BONDSThe Bond Exchange of South Africa (BESA) resolved in August 2007 to demutualise in order to grow its business and expand into other mar-kets. The bond exchange was acquired by the JSE in 2009, and the JSE now oversees the larg-est listed debt market on the continent, both by market capitalisation and by liquidity.
The BESA’s decision to demutualise and the JSE’s subsequent acquisition of South Africa’s bond market has afforded it further reach, improved efficiency, and increased competitiveness. In addition, in October 2012, South African gov-ernment bonds were included in the Citi World Government Bond Index (WGBI) for the first time.
South Africa embraced the WGBI inclusion, listing 12 government bonds with a market value of USD93.8 billion, gaining greater expo-sure to global bond markets and the attention
of international institutional investors and asset managers.
At the end of 2013, the JSE had roughly 1,600 listed debt instruments, totalling more than ZAR1.8 trillion. More than half (ZAR1.0 trillion) of the debt listed on the JSE has been issued by the South African government, accounting for 90% of all liquidity on the exchange.
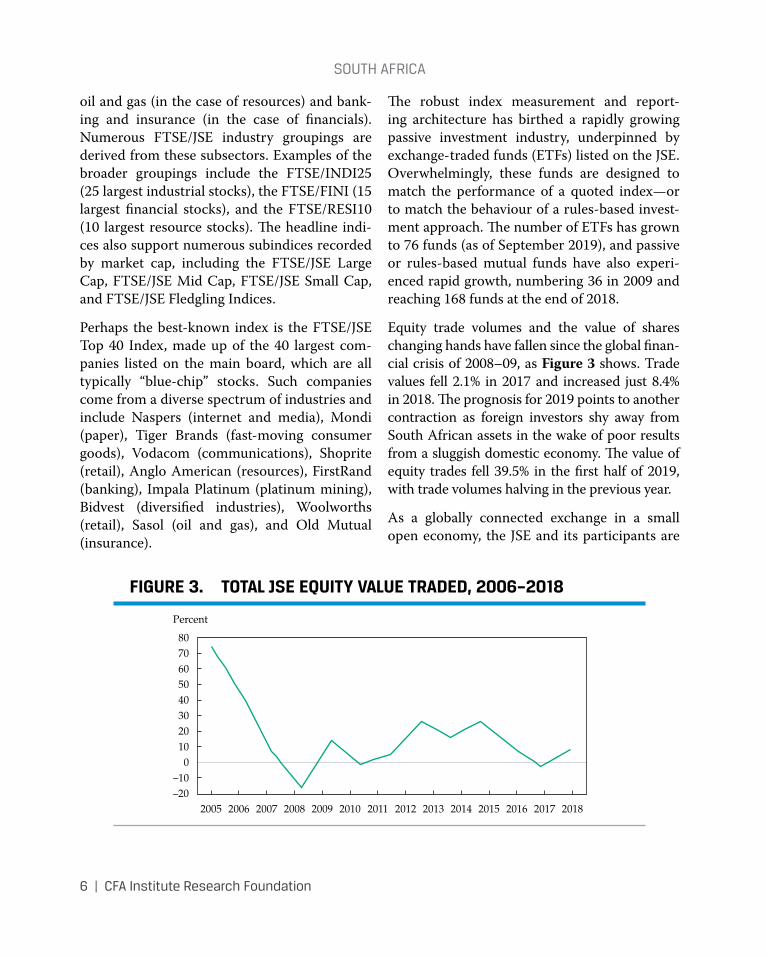
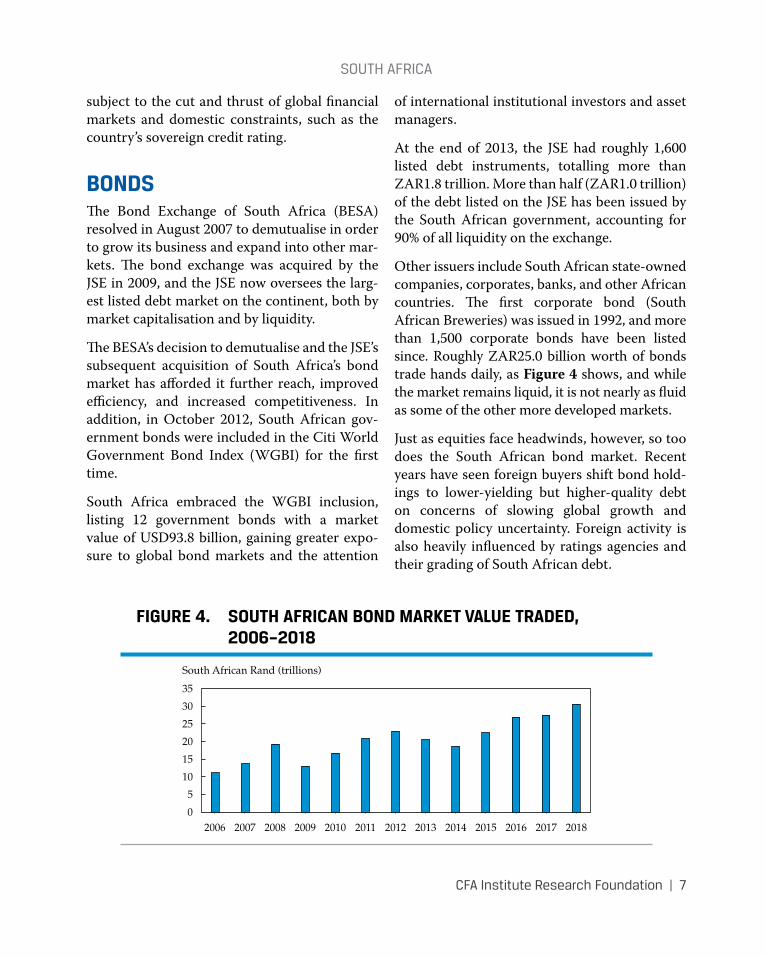
Other issuers include South African state-owned companies, corporates, banks, and other African countries. The first corporate bond (South African Breweries) was issued in 1992, and more than 1,500 corporate bonds have been listed since. Roughly ZAR25.0 billion worth of bonds trade hands daily, as Figure 4 shows, and while the market remains liquid, it is not nearly as fluid as some of the other more developed markets.
Just as equities face headwinds, however, so too does the South African bond market. Recent years have seen foreign buyers shift bond hold-ings to lower-yielding but higher-quality debt on concerns of slowing global growth and domestic policy uncertainty. Foreign activity is also heavily influenced by ratings agencies and their grading of South African debt.
FIGURE 4. SOUTH AFRICAN BOND MARKET VALUE TRADED, 2006–2018
South African Rand (trillions)
35
30
25
20
15
10
5
020082006 2007 2009 2010 2011 2013 2014 2015 2017 20182012 2016
soutH AFRICA
8 | CFA Institute Research Foundation
DERIVATIVESThe local bond derivatives market offers trade in bond futures, forward rate agreements, vanilla swaps, and other standard bond contracts. The JSE hopes to attract new bond issuers to the bourse, seeking to partner with other African exchanges with a dual-issuance model.
These derivative instruments include equity, bond, commodity, interest rate, and currency derivatives. There are 62 equity members, 120 equity derivatives members, 92 commodity derivatives members, and 102 interest rate and currency derivatives members licensed in South Africa, representing a mix of local and interna-tional operations.
The Equity Derivatives Market originated from JSE’s acquisition of the South African Futures Exchange (SAFEX) in 1998 and provides a platform for trade in futures, exchange-traded contracts for difference (CFDs), options, and a variety of other bespoke instruments. The exchange’s Bond Derivatives Market enables trade in bond derivatives that the JSE lists in the form of futures and options.
The Commodity Derivatives Market is a plat-form for efficient pricing and market-risk man-agement for the grain market in South Africa. Through a licensing agreement with the Chicago Mercantile Exchange (CME Group), the market also offers a range of foreign-referenced deriva-tives on soft and hard commodities.
South Africa’s interest rate derivatives mar-ket is the largest on the continent, allowing participants to trade interest rate derivatives futures and options in government- and state-owned enterprise debt through short-term
interest rate futures and long-term interest rates or swap futures.
THE WAY FORWARDThe JSE has undertaken significant technology upgrades over the past few years in a drive to upgrade trading, clearing, and settlement. In July 2013, the exchange implemented a new trading platform called the Millennium Exchange in the equity market while also moving the trad-ing system from London to Johannesburg. As a result of this successful transition, trades are now executed up to 400 times faster than under the previous TradElect system. These techno-logical changes allow for increased liquidity and more algorithmic trades.
The regulatory landscape is set to change sig-nificantly in the future as South Africa looks to implement a “twin peaks” model of oversight.3 Under the new system, prudential supervision will be conducted by the South African Reserve Bank (SARB), and market conduct regulation will be led by the FSCA.
Another regulatory change that could have widespread implications is the 2011 decision to alter South Africa’s inward listing rules, allow-ing foreign domiciled companies to be treated as domestic listings. While foreign firms had been allowed to list on the JSE since 2004, they were previously subject to foreign exchange rules, which limited the amount of these equi-ties that local investors could hold. The lifting of these restrictions has been an important regula-tory shift for the exchange and makes the JSE a more attractive listings destination.
3See www.fin24.com/Opinion/twin-peaks-the-big-bang-of-sas-financial-industry-20180408 for an explanation of the twin peaks model.
soutH AFRICA
CFA Institute Research Foundation | 9
South Africa was ranked first in the world in terms of regulation of securities exchanges in the World Economic Forum’s Global Competitiveness Report 2013–20144 and con-tinues to be a well-regulated and -managed, effi-cient exchange.
4h t t p : / / w w w 3 . w e f o r u m . o r g / d o c s / W E F _ G l o b a l CompetitivenessReport_2013-14.pdf.
10 | CFA Institute Research Foundation
NAMIBIAThe Namibian Stock Exchange (NSX) was founded in 1904 in Luderitz to fund the dia-mond rush happening in the country at the time. By 1910, however, the rush was over, and the exchange was closed that year.
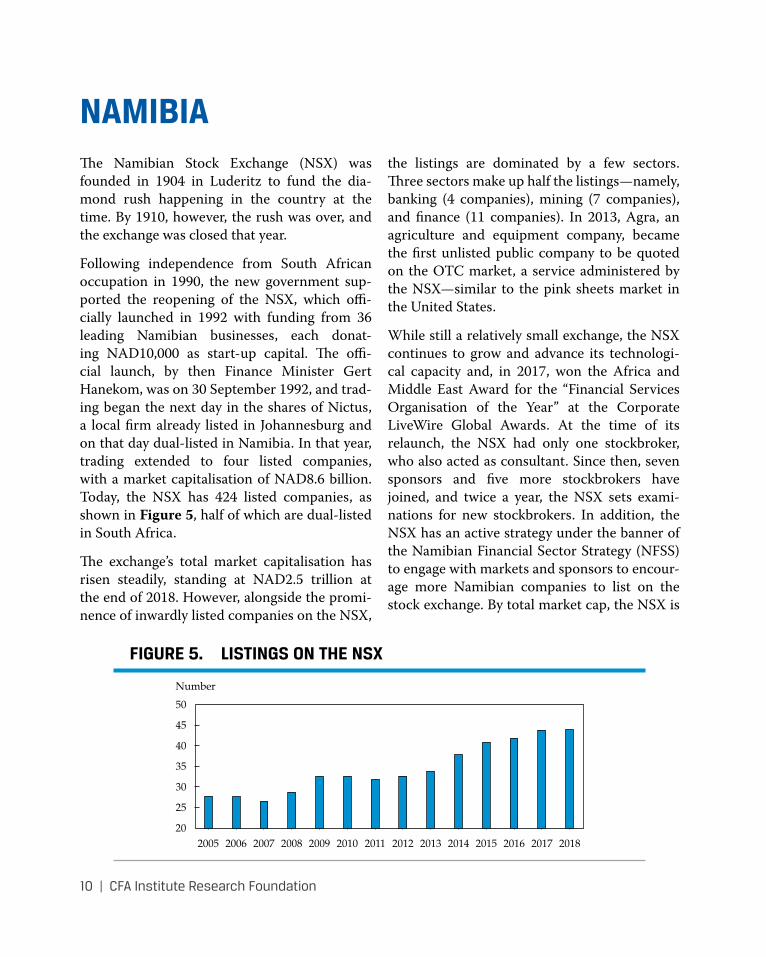
Following independence from South African occupation in 1990, the new government sup-ported the reopening of the NSX, which offi-cially launched in 1992 with funding from 36 leading Namibian businesses, each donat-ing NAD10,000 as start-up capital. The offi-cial launch, by then Finance Minister Gert Hanekom, was on 30 September 1992, and trad-ing began the next day in the shares of Nictus, a local firm already listed in Johannesburg and on that day dual-listed in Namibia. In that year, trading extended to four listed companies, with a market capitalisation of NAD8.6 billion. Today, the NSX has 424 listed companies, as shown in Figure 5, half of which are dual-listed in South Africa.
The exchange’s total market capitalisation has risen steadily, standing at NAD2.5 trillion at the end of 2018. However, alongside the promi-nence of inwardly listed companies on the NSX,
the listings are dominated by a few sectors. Three sectors make up half the listings—namely, banking (4 companies), mining (7 companies), and finance (11 companies). In 2013, Agra, an agriculture and equipment company, became the first unlisted public company to be quoted on the OTC market, a service administered by the NSX—similar to the pink sheets market in the United States.
While still a relatively small exchange, the NSX continues to grow and advance its technologi-cal capacity and, in 2017, won the Africa and Middle East Award for the “Financial Services Organisation of the Year” at the Corporate LiveWire Global Awards. At the time of its relaunch, the NSX had only one stockbroker, who also acted as consultant. Since then, seven sponsors and five more stockbrokers have joined, and twice a year, the NSX sets exami-nations for new stockbrokers. In addition, the NSX has an active strategy under the banner of the Namibian Financial Sector Strategy (NFSS) to engage with markets and sponsors to encour-age more Namibian companies to list on the stock exchange. By total market cap, the NSX is
FIGURE 5. LISTINGS ON THE NSX
Number
50
45
40
35
30
25
2020082005 2007 2009 2010 2011 2013 2014 2015 2017 20182012 20162006
nAmIBIA
CFA Institute Research Foundation | 11
among the largest securities markets in Africa, and because of its low-cost base and good trad-ing volumes, it has been able to self-fund with-out any form of government or external funding.
The bourse recently celebrated its 25th anni-versary. In 2018, it marked 5,005 deals and con-cluded with a trading value of NAD12.2 billion. Nevertheless, the Namibian economy has been in recession for the past three years, and trading values have declined by 16%, 4%, and 12% year-on-year over this period.
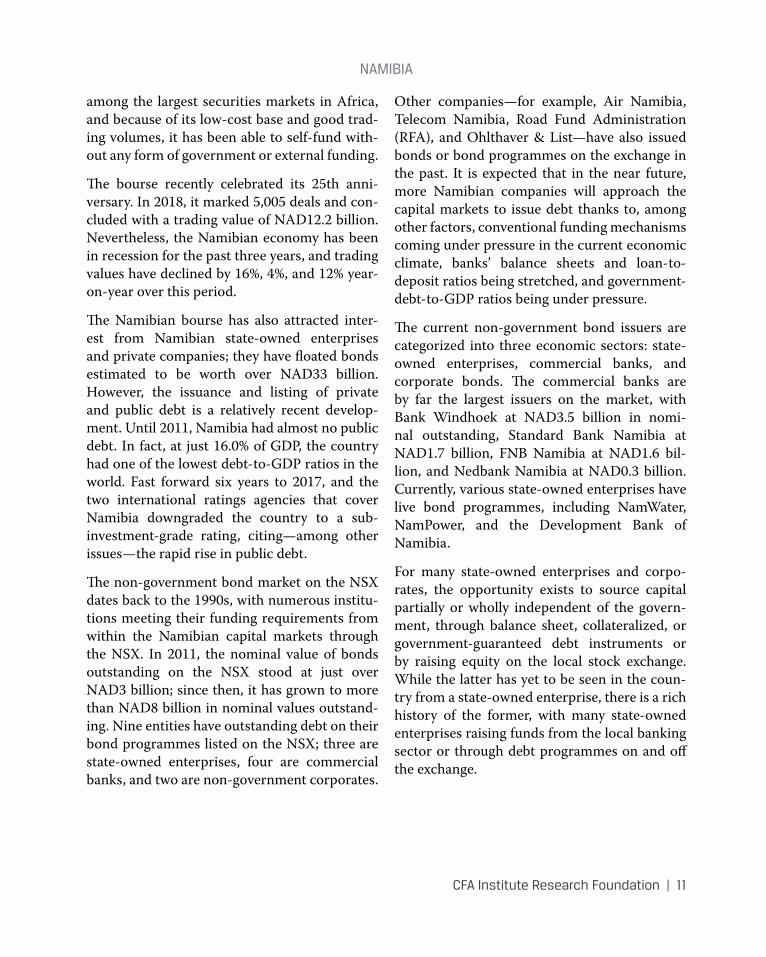
The Namibian bourse has also attracted inter-est from Namibian state-owned enterprises and private companies; they have floated bonds estimated to be worth over NAD33 billion. However, the issuance and listing of private and public debt is a relatively recent develop-ment. Until 2011, Namibia had almost no public debt. In fact, at just 16.0% of GDP, the country had one of the lowest debt-to-GDP ratios in the world. Fast forward six years to 2017, and the two international ratings agencies that cover Namibia downgraded the country to a sub-investment-grade rating, citing—among other issues—the rapid rise in public debt.
The non-government bond market on the NSX dates back to the 1990s, with numerous institu-tions meeting their funding requirements from within the Namibian capital markets through the NSX. In 2011, the nominal value of bonds outstanding on the NSX stood at just over NAD3 billion; since then, it has grown to more than NAD8 billion in nominal values outstand-ing. Nine entities have outstanding debt on their bond programmes listed on the NSX; three are state-owned enterprises, four are commercial banks, and two are non-government corporates.
Other companies—for example, Air Namibia, Telecom Namibia, Road Fund Administration (RFA), and Ohlthaver & List—have also issued bonds or bond programmes on the exchange in the past. It is expected that in the near future, more Namibian companies will approach the capital markets to issue debt thanks to, among other factors, conventional funding mechanisms coming under pressure in the current economic climate, banks’ balance sheets and loan-to-deposit ratios being stretched, and government-debt-to-GDP ratios being under pressure.
The current non-government bond issuers are categorized into three economic sectors: state-owned enterprises, commercial banks, and corporate bonds. The commercial banks are by far the largest issuers on the market, with Bank Windhoek at NAD3.5 billion in nomi-nal outstanding, Standard Bank Namibia at NAD1.7 billion, FNB Namibia at NAD1.6 bil-lion, and Nedbank Namibia at NAD0.3 billion. Currently, various state-owned enterprises have live bond programmes, including NamWater, NamPower, and the Development Bank of Namibia.
For many state-owned enterprises and corpo-rates, the opportunity exists to source capital partially or wholly independent of the govern-ment, through balance sheet, collateralized, or government-guaranteed debt instruments or by raising equity on the local stock exchange. While the latter has yet to be seen in the coun-try from a state-owned enterprise, there is a rich history of the former, with many state-owned enterprises raising funds from the local banking sector or through debt programmes on and off the exchange.

CFA Institute Research Foundation | 13
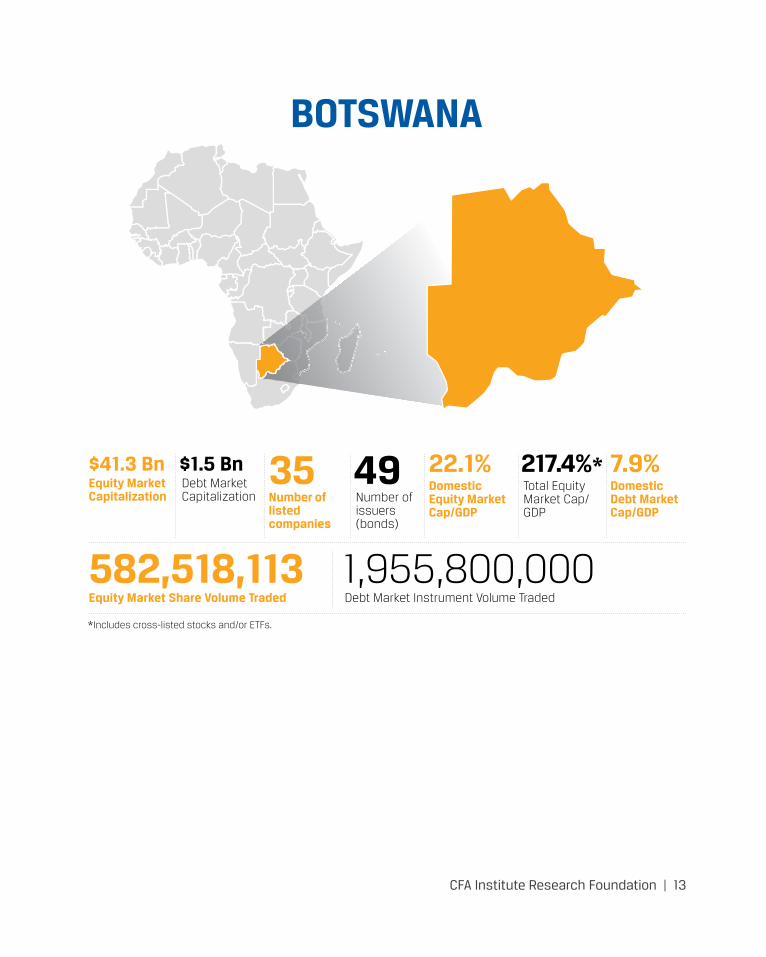
BOTSWANA
Equity Market Capitalization
Equity Market Share Volume Traded
Debt Market Capitalization
Debt Market Instrument Volume Traded
*Includes cross-listed stocks and/or ETFs.
Number of issuers (bonds)
Total Equity Market Cap/GDP
Number of listed companies
Domestic Equity Market Cap/GDP
Domestic Debt Market Cap/GDP
$41.3 Bn
582,518,113
35 22.1% 7.9%$1.5 Bn
1,955,800,000
49 217.4%*
BotswAnA
14 | CFA Institute Research Foundation
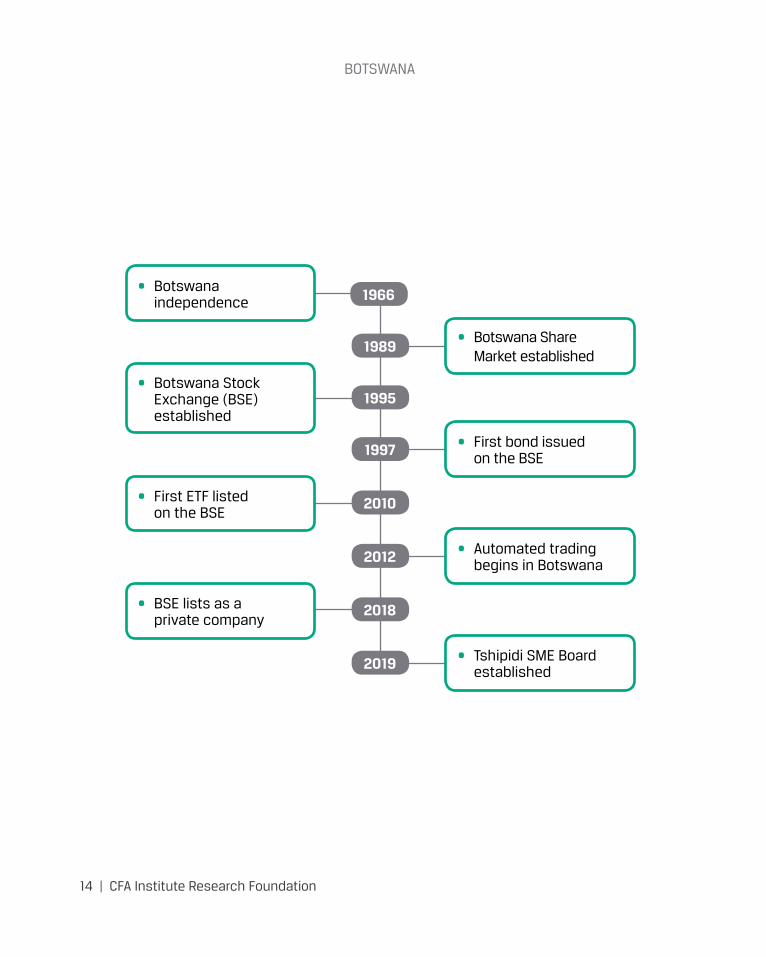
1966
1989
1995
2010
2018
2019
1997
2012
• Botswana independence
• Botswana Share Market established
• First bond issued on the BSE
• Automated trading begins in Botswana
• Tshipidi SME Board established
• Botswana Stock Exchange (BSE) established
• First ETF listed on the BSE
• BSE lists as a private company
CFA Institute Research Foundation | 15
BOTSWANAKopano Bolokwe, CAIA, MBAHead of Product Development Botswana Stock Exchange
Kagiso Sedimo, FRM, CFAPortfolio Manager Morula Capital Partners
The formation of the capital markets in Botswana can be traced back to 1989, with the introduction of the Botswana Share Market (BSM). At the time, there was no formal stock exchange, and the BSM operated as an infor-mal market with five listed entities and a single brokerage firm that was charged with facilitat-ing trading. In September 1994, the legislation to transform the BSM into a stock exchange was passed, and trading opened on the Botswana Stock Exchange (BSE) in November 1995. Historically, the BSE was owned by its members or brokers through ownership of proprietary rights and by the government of the Republic of Botswana. The BSE has since demutualised; 81.3% is owned by the government, and the four members of the BSE own the other 18.7%.
Over the years, the domestic stock market has grown tremendously, and as the regulatory environment has improved, new products have been introduced and various outreach programs implemented to attract issuers and investors. The BSE currently lists equities, fixed-income instruments, and exchange-traded funds (ETFs) in local5 and foreign currencies. The exchange operates a tiered market composed of the Main Equity Board, the Venture Capital Market
5Botswana’s local currency is the pula, which means “rain” in Setswana.
Board, the Tshipidi6 SME Board, and an OTC Board. At the end of 2018, the BSE had 35 com-panies (26 domestic and 9 foreign), 3 ETFs, and 49 bonds listed.
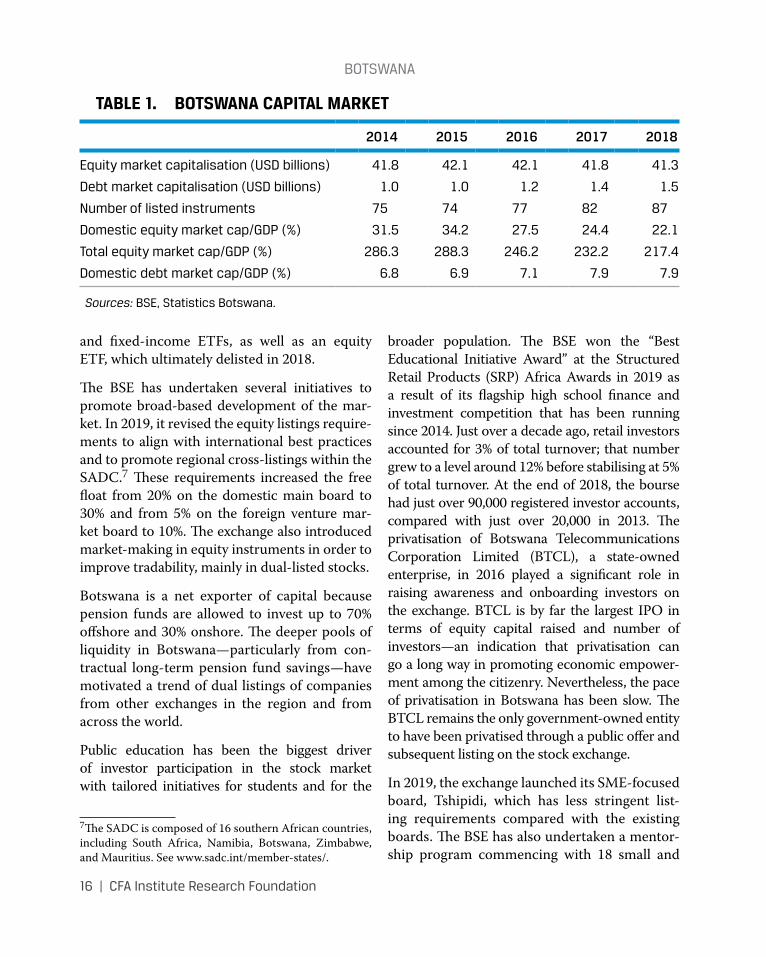
Table 1 shows a snapshot of the Botswana capi-tal market.
The BSE plays host to the most preeminent com-panies doing business in Botswana, Africa, and the world. These companies represent a spectrum of industries and commerce—agriculture, bank-ing, financial services, wholesaling and retailing, tourism, property, security services, energy, min-ing, and telecommunications. Mining represents the biggest share (85.2%) of the BSE’s total mar-ket capitalisation, followed by financial services (6.2%) and banking (3.2%). As a percentage of GDP, the domestic market size has been shrink-ing, from 34% in 2015 to 22% in 2018. Over the same period, market returns and trading activity have consistently declined in line with softening economic growth.
In 2010, the BSE became the first stock exchange outside of South Africa to list ETFs in Africa. To date, Botswana remains second only to South Africa in terms of trading levels of ETFs. The exchange has listed gold, platinum,
6Tshipidi is the Setswana word for hand-holding a child who is learning to walk.
BotswAnA
16 | CFA Institute Research Foundation
and fixed-income ETFs, as well as an equity ETF, which ultimately delisted in 2018.
The BSE has undertaken several initiatives to promote broad-based development of the mar-ket. In 2019, it revised the equity listings require-ments to align with international best practices and to promote regional cross-listings within the SADC.7 These requirements increased the free float from 20% on the domestic main board to 30% and from 5% on the foreign venture mar-ket board to 10%. The exchange also introduced market-making in equity instruments in order to improve tradability, mainly in dual-listed stocks.
Botswana is a net exporter of capital because pension funds are allowed to invest up to 70% offshore and 30% onshore. The deeper pools of liquidity in Botswana—particularly from con-tractual long-term pension fund savings—have motivated a trend of dual listings of companies from other exchanges in the region and from across the world.
Public education has been the biggest driver of investor participation in the stock market with tailored initiatives for students and for the
7The SADC is composed of 16 southern African countries, including South Africa, Namibia, Botswana, Zimbabwe, and Mauritius. See www.sadc.int/member-states/.
broader population. The BSE won the “Best Educational Initiative Award” at the Structured Retail Products (SRP) Africa Awards in 2019 as a result of its flagship high school finance and investment competition that has been running since 2014. Just over a decade ago, retail investors accounted for 3% of total turnover; that number grew to a level around 12% before stabilising at 5% of total turnover. At the end of 2018, the bourse had just over 90,000 registered investor accounts, compared with just over 20,000 in 2013. The privatisation of Botswana Telecommunications Corporation Limited (BTCL), a state-owned enterprise, in 2016 played a significant role in raising awareness and onboarding investors on the exchange. BTCL is by far the largest IPO in terms of equity capital raised and number of investors—an indication that privatisation can go a long way in promoting economic empower-ment among the citizenry. Nevertheless, the pace of privatisation in Botswana has been slow. The BTCL remains the only government-owned entity to have been privatised through a public offer and subsequent listing on the stock exchange.
In 2019, the exchange launched its SME-focused board, Tshipidi, which has less stringent list-ing requirements compared with the existing boards. The BSE has also undertaken a mentor-ship program commencing with 18 small and
TABLE 1. BOTSWANA CAPITAL MARKET
2014 2015 2016 2017 2018
equity market capitalisation (usd billions) 41.8 42.1 42.1 41.8 41.3
debt market capitalisation (usd billions) 1.0 1.0 1.2 1.4 1.5
number of listed instruments 75 74 77 82 87
domestic equity market cap/gdp (%) 31.5 34.2 27.5 24.4 22.1
total equity market cap/gdp (%) 286.3 288.3 246.2 232.2 217.4
domestic debt market cap/gdp (%) 6.8 6.9 7.1 7.9 7.9
Sources: Bse, statistics Botswana.
BotswAnA
CFA Institute Research Foundation | 17
medium enterprises (SMEs) to develop a pipe-line for this board.
Markets like Botswana have become attractive to international and regional companies as well as larger corporates within the country. Half of the domestic companies on the exchange have a pan-African footprint, and the majority of foreign listings are dual listings from London, Australia, Toronto, and Johannesburg that are tapping into the local pension funds to develop their local assets.
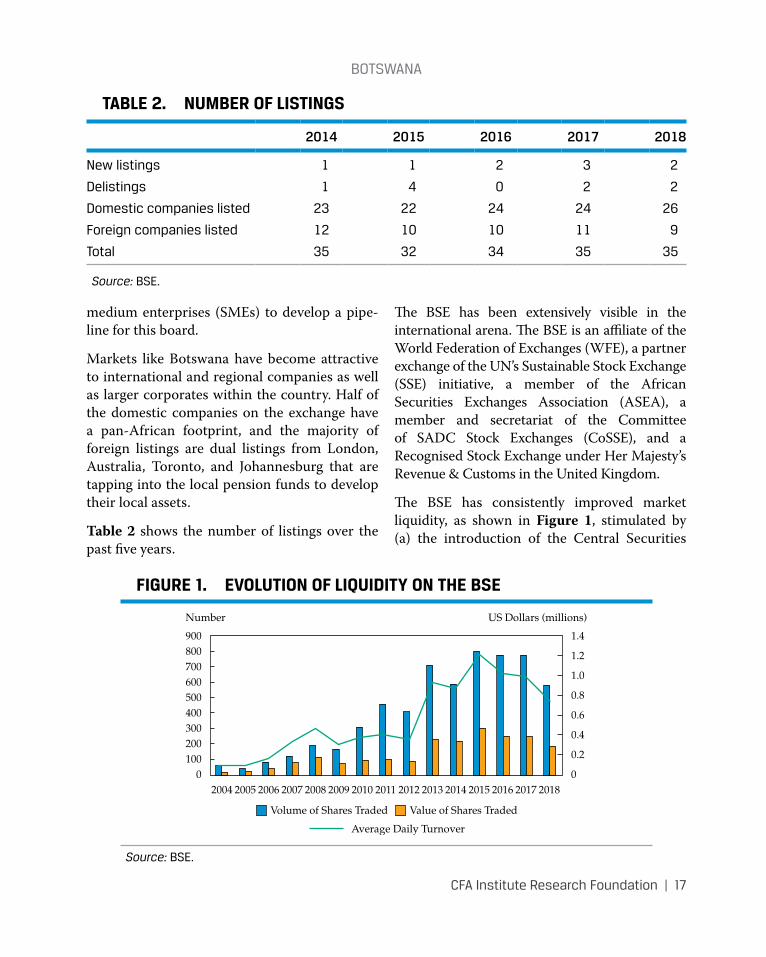
Table 2 shows the number of listings over the past five years.
The BSE has been extensively visible in the international arena. The BSE is an affiliate of the World Federation of Exchanges (WFE), a partner exchange of the UN’s Sustainable Stock Exchange (SSE) initiative, a member of the African Securities Exchanges Association (ASEA), a member and secretariat of the Committee of SADC Stock Exchanges (CoSSE), and a Recognised Stock Exchange under Her Majesty’s Revenue & Customs in the United Kingdom.
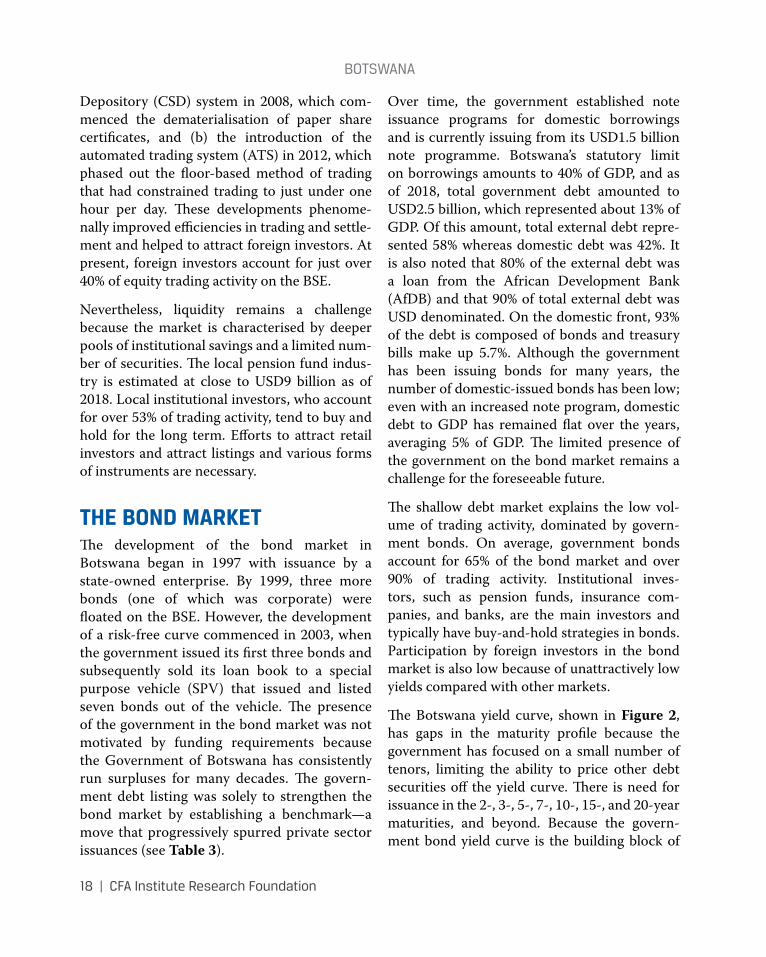
The BSE has consistently improved market liquidity, as shown in Figure 1, stimulated by (a) the introduction of the Central Securities
TABLE 2. NUMBER OF LISTINGS
2014 2015 2016 2017 2018
new listings 1 1 2 3 2
delistings 1 4 0 2 2
domestic companies listed 23 22 24 24 26
Foreign companies listed 12 10 10 11 9
total 35 32 34 35 35
Source: Bse.
FIGURE 1. EVOLUTION OF LIQUIDITY ON THE BSE
Number
900
700800
600
400500
300
100200
0
US Dollars (millions)
1.4
1.2
1.0
0.6
0.8
0.4
0.2
020082007200620052004 2009 2010 2011 2013 2014 2015 2016 20182012 2017
Average Daily Turnover
Volume of Shares Traded Value of Shares Traded
Source: Bse.
BotswAnA
18 | CFA Institute Research Foundation
Depository (CSD) system in 2008, which com-menced the dematerialisation of paper share certificates, and (b) the introduction of the automated trading system (ATS) in 2012, which phased out the floor-based method of trading that had constrained trading to just under one hour per day. These developments phenome-nally improved efficiencies in trading and settle-ment and helped to attract foreign investors. At present, foreign investors account for just over 40% of equity trading activity on the BSE.
Nevertheless, liquidity remains a challenge because the market is characterised by deeper pools of institutional savings and a limited num-ber of securities. The local pension fund indus-try is estimated at close to USD9 billion as of 2018. Local institutional investors, who account for over 53% of trading activity, tend to buy and hold for the long term. Efforts to attract retail investors and attract listings and various forms of instruments are necessary.
THE BOND MARKETThe development of the bond market in Botswana began in 1997 with issuance by a state-owned enterprise. By 1999, three more bonds (one of which was corporate) were floated on the BSE. However, the development of a risk-free curve commenced in 2003, when the government issued its first three bonds and subsequently sold its loan book to a special purpose vehicle (SPV) that issued and listed seven bonds out of the vehicle. The presence of the government in the bond market was not motivated by funding requirements because the Government of Botswana has consistently run surpluses for many decades. The govern-ment debt listing was solely to strengthen the bond market by establishing a benchmark—a move that progressively spurred private sector issuances (see Table 3).
Over time, the government established note issuance programs for domestic borrowings and is currently issuing from its USD1.5 billion note programme. Botswana’s statutory limit on borrowings amounts to 40% of GDP, and as of 2018, total government debt amounted to USD2.5 billion, which represented about 13% of GDP. Of this amount, total external debt repre-sented 58% whereas domestic debt was 42%. It is also noted that 80% of the external debt was a loan from the African Development Bank (AfDB) and that 90% of total external debt was USD denominated. On the domestic front, 93% of the debt is composed of bonds and treasury bills make up 5.7%. Although the government has been issuing bonds for many years, the number of domestic-issued bonds has been low; even with an increased note program, domestic debt to GDP has remained flat over the years, averaging 5% of GDP. The limited presence of the government on the bond market remains a challenge for the foreseeable future.
The shallow debt market explains the low vol-ume of trading activity, dominated by govern-ment bonds. On average, government bonds account for 65% of the bond market and over 90% of trading activity. Institutional inves-tors, such as pension funds, insurance com-panies, and banks, are the main investors and typically have buy-and-hold strategies in bonds. Participation by foreign investors in the bond market is also low because of unattractively low yields compared with other markets.
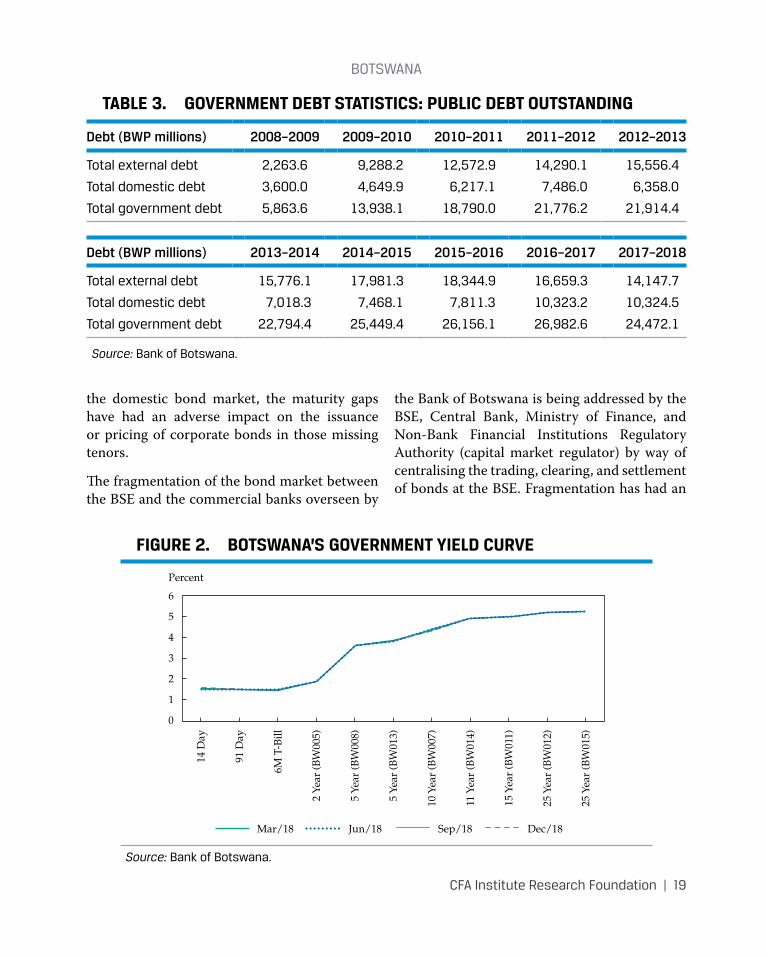
The Botswana yield curve, shown in Figure 2, has gaps in the maturity profile because the government has focused on a small number of tenors, limiting the ability to price other debt securities off the yield curve. There is need for issuance in the 2-, 3-, 5-, 7-, 10-, 15-, and 20-year maturities, and beyond. Because the govern-ment bond yield curve is the building block of
BotswAnA
CFA Institute Research Foundation | 19
the domestic bond market, the maturity gaps have had an adverse impact on the issuance or pricing of corporate bonds in those missing tenors.
The fragmentation of the bond market between the BSE and the commercial banks overseen by
the Bank of Botswana is being addressed by the BSE, Central Bank, Ministry of Finance, and Non-Bank Financial Institutions Regulatory Authority (capital market regulator) by way of centralising the trading, clearing, and settlement of bonds at the BSE. Fragmentation has had an
TABLE 3. GOVERNMENT DEBT STATISTICS: PUBLIC DEBT OUTSTANDING
Debt (BWP millions) 2008–2009 2009–2010 2010–2011 2011–2012 2012–2013
total external debt 2,263.6 9,288.2 12,572.9 14,290.1 15,556.4
total domestic debt 3,600.0 4,649.9 6,217.1 7,486.0 6,358.0
total government debt 5,863.6 13,938.1 18,790.0 21,776.2 21,914.4
Debt (BWP millions) 2013–2014 2014–2015 2015–2016 2016–2017 2017–2018
total external debt 15,776.1 17,981.3 18,344.9 16,659.3 14,147.7
total domestic debt 7,018.3 7,468.1 7,811.3 10,323.2 10,324.5
total government debt 22,794.4 25,449.4 26,156.1 26,982.6 24,472.1
Source: Bank of Botswana.
FIGURE 2. BOTSWANA’S GOVERNMENT YIELD CURVE
Percent
6
5
4
3
2
1
0
6M T
-Bill
2 Ye
ar (B
W00
5)
91 D
ay
14 D
ay
10 Y
ear
(BW
007)
11 Y
ear
(BW
014)
5 Ye
ar (B
W01
3)
25 Y
ear
(BW
012)
25 Y
ear
(BW
015)
15 Y
ear
(BW
011)
5 Ye
ar (B
W00
8)
Mar/18 Jun/18 Sep/18 Dec/18
Source: Bank of Botswana.
BotswAnA
20 | CFA Institute Research Foundation
adverse impact in the overall development of the debt market because it affects information dissemination, price formation, price discovery, computation of bond indices, transaction costs, perceived riskiness of the market, retail investor access, and international investor participation.
FUTURE DEVELOPMENTSIn 2016, brokerage commissions effectively increased following the introduction of a floor of 0.60%, and trading levels began to decline. The BSE has proposed a tiered fee structure and a removal of the old brokerage fee structure (currently being assessed by the regulator), and this change is expected to incentivise trading and promote equitable levying of commission charges across the retail and institutional inves-tor categories.
Historically, the reach of the exchange has not been satisfactory, which could explain the diffi-culty in getting domestic listings prior to 2016. The Tshipidi Mentorship Program will be an important contributor to listings in the medium to long term. The BSE’s increased visibility, accessibility, and education for entrepreneurs are the right ingredients for attracting domestic companies to the market.
In 2019, it is expected that the exchange will submit its rules for listing depositary receipts (DRs) to the regulator for approval. In the cur-rent environment, where domestic output is subtle and is adversely impacting stock market returns, DRs are a necessary addition to broaden investor exposure to international securities. In the same vein, private equity has taken shape in Botswana, with bigger pension funds now mak-ing substantial allocations to emerging private equity firms. In the long run, private equity will potentially drive listings because exchanges are usually the preferred exit mechanisms.
The exchange is presently pioneering sustain-able investment among issuers and is exten-sively leading capital market development throughout Africa through its stewardship of the Market Development Working Group of ASEA.
Botswana’s bond market is moving toward centralisation of trading, clearing, and settle-ment of government bond trades at the BSE and CSDB. This is expected to unlock capacity, increase efficiencies, and improve compliance with the IOSCO Principles for Financial Market Infrastructure, improving the attractiveness of the domestic bond market to international investors. The BSE and CSDB are procuring a new clearing and settlement system that will connect to real-time gross settlement (RTGS) and use central bank money for settlement to eliminate counterparty risk. Furthermore, revised debt listing requirements intended to reduce the prevalence of unlisted bonds and improve access to information, custody, and safety of currently unlisted assets are being con-sidered by the regulator.
In 2019, the Bank of Botswana outlined its intention to re-examine the debt ceilings and increase the government’s domestic issuances to 15% of GDP so that the market would be optimally developed to allow the private sec-tor to price its instruments. Similarly, there is commitment from the BSE and BBMA8 to encourage state-owned enterprises to issue and reduce dependence on the fiscus. The debut Botswana issuance by the International Finance Corporation (IFC) and the first ever eurobond, both in 2017, are viewed as criti-cal milestones that have placed Botswana’s
8BBMA stands for Botswana Bond Market Association – a non-profit association of capital market practitioners whose mandate is to lobby for reforms and complement the BSE in undertaking the development of the bond market.
BotswAnA
CFA Institute Research Foundation | 21
debt capital market on the international scene, signalling the strength of the regulatory envi-ronment and the trading and settlement infra-structure and an avalanche of institutional funding. Progressively, it is expected that the increased debates around diversifying fixed-income offerings—to include infrastructure bonds, retail savings bonds, and inflation-linked bonds—will gain momentum.
Botswana is capitalising on the benefits of being a developing market by exploring untapped capacity, mobilising industry participants, and collectively rectifying the impediments to the development of the capital markets. Increased competitiveness, activity, and liquidity and a regulatory environment continuing to embrace best practices can only improve participation and protect investor interests.

CFA Institute Research Foundation | 23
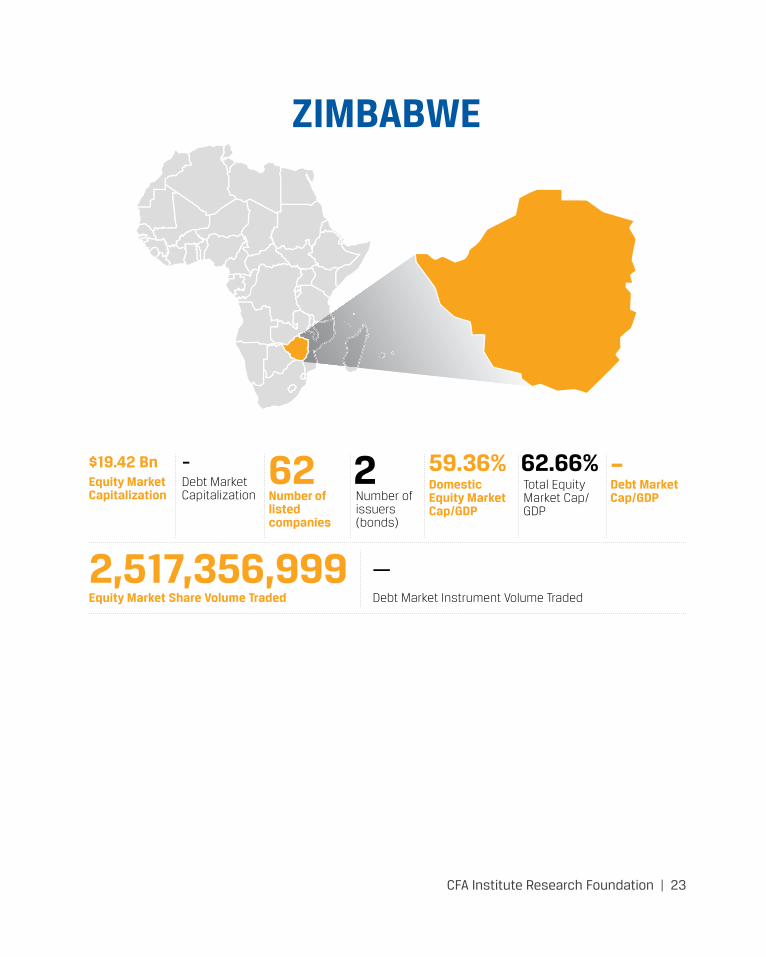
ZIMBABWE
Equity Market Capitalization
Equity Market Share Volume Traded
Debt Market Capitalization
Debt Market Instrument Volume Traded
Number of issuers (bonds)
Total Equity Market Cap/GDP
Number of listed companies
Domestic Equity Market Cap/GDP
Debt Market Cap/GDP
$19.42 Bn
2,517,356,999
62 59.36% ––
–
2 62.66%
ZImBABwe
24 | CFA Institute Research Foundation
1896
1980
2009
2016
2019
2015
2018
• Zimbabwe Stock Exchange (ZSE) established
• Zimbabwean independence
• ZSE demutualises and automated trading begins
• ZSE introduces All Share and Top 10 indices; ZSE launches C-Trade online trading platform
• Zimbabwe introduces multicurrency trading
• Financial Securities Exchange (FINSEC) established in Zimbabwe
• Zimbabwean exchange rate pegged; Multicurrency regime in Zimbabwe replaced with RTGS dollar (“zollar”)
CFA Institute Research Foundation | 25
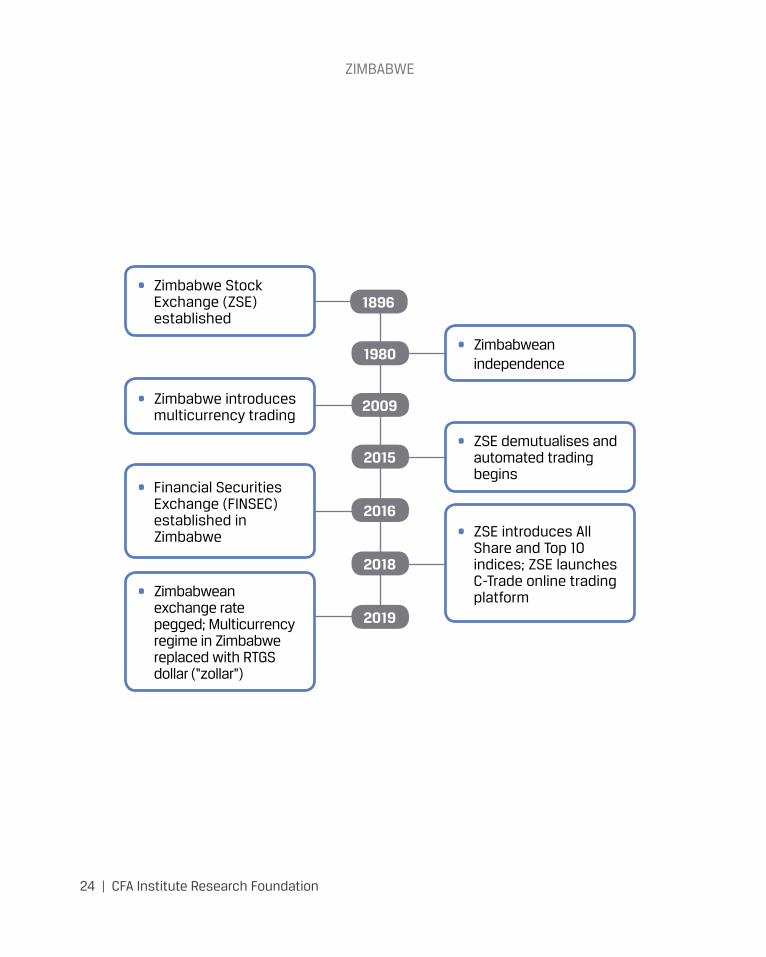
ZIMBABWEDennis MurekachiroBrighton Mutingwende, CFANorbert MungwiniInvestment Professionals Association of Zimbabwe
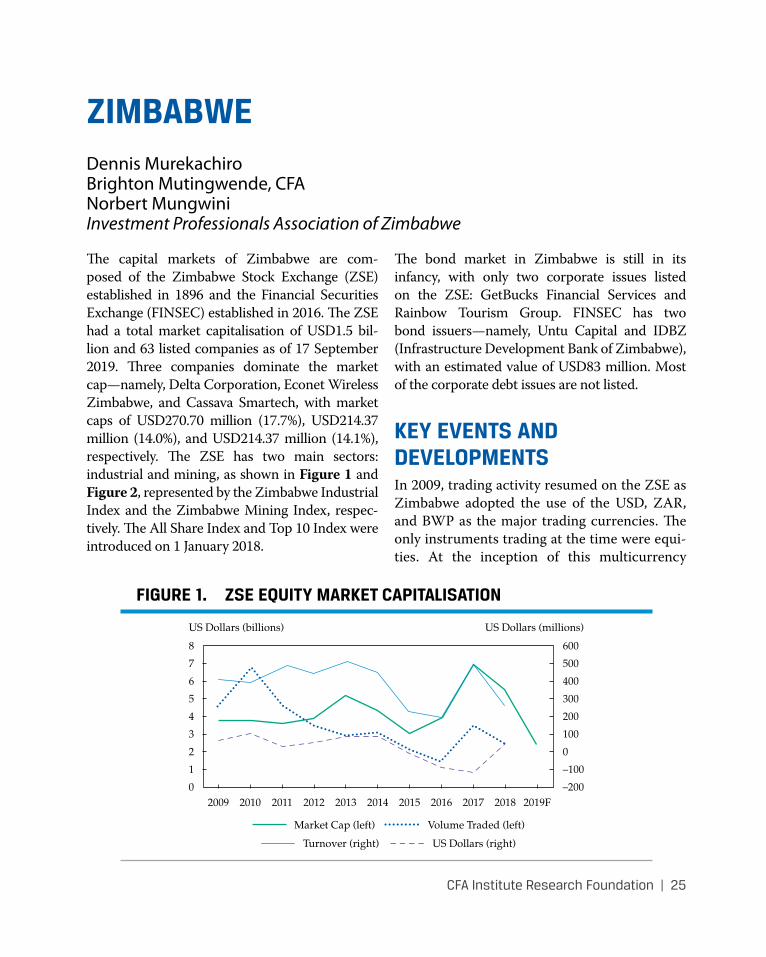
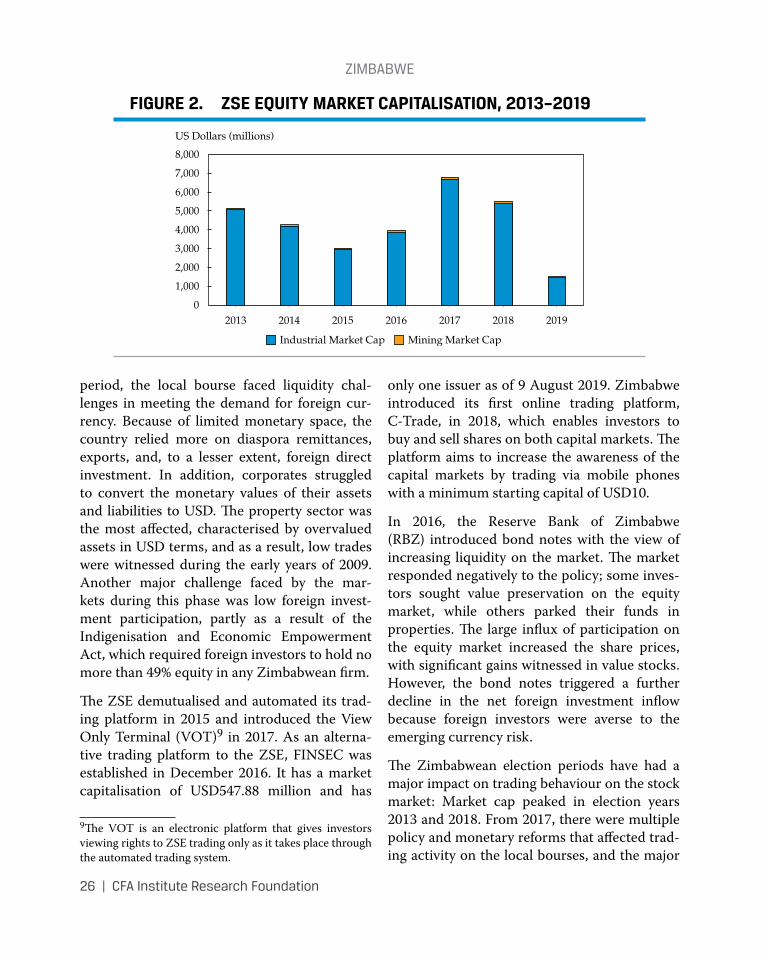
The capital markets of Zimbabwe are com-posed of the Zimbabwe Stock Exchange (ZSE) established in 1896 and the Financial Securities Exchange (FINSEC) established in 2016. The ZSE had a total market capitalisation of USD1.5 bil-lion and 63 listed companies as of 17 September 2019. Three companies dominate the market cap—namely, Delta Corporation, Econet Wireless Zimbabwe, and Cassava Smartech, with market caps of USD270.70 million (17.7%), USD214.37 million (14.0%), and USD214.37 million (14.1%), respectively. The ZSE has two main sectors: industrial and mining, as shown in Figure 1 and Figure 2, represented by the Zimbabwe Industrial Index and the Zimbabwe Mining Index, respec-tively. The All Share Index and Top 10 Index were introduced on 1 January 2018.
The bond market in Zimbabwe is still in its infancy, with only two corporate issues listed on the ZSE: GetBucks Financial Services and Rainbow Tourism Group. FINSEC has two bond issuers—namely, Untu Capital and IDBZ (Infrastructure Development Bank of Zimbabwe), with an estimated value of USD83 million. Most of the corporate debt issues are not listed.
KEY EVENTS AND DEVELOPMENTSIn 2009, trading activity resumed on the ZSE as Zimbabwe adopted the use of the USD, ZAR, and BWP as the major trading currencies. The only instruments trading at the time were equi-ties. At the inception of this multicurrency
FIGURE 1. ZSE EQUITY MARKET CAPITALISATION
US Dollars (billions)
8
7
6
5
4
3
2
1
0
US Dollars (millions)
600
500
400
300
200
100
0
–100
–200201220102009 2011 2013 2014 2016 20172015 2018 2019F
Market Cap (left) Volume Traded (left)
Turnover (right) US Dollars (right)
ZImBABwe
26 | CFA Institute Research Foundation
period, the local bourse faced liquidity chal-lenges in meeting the demand for foreign cur-rency. Because of limited monetary space, the country relied more on diaspora remittances, exports, and, to a lesser extent, foreign direct investment. In addition, corporates struggled to convert the monetary values of their assets and liabilities to USD. The property sector was the most affected, characterised by overvalued assets in USD terms, and as a result, low trades were witnessed during the early years of 2009. Another major challenge faced by the mar-kets during this phase was low foreign invest-ment participation, partly as a result of the Indigenisation and Economic Empowerment Act, which required foreign investors to hold no more than 49% equity in any Zimbabwean firm.
The ZSE demutualised and automated its trad-ing platform in 2015 and introduced the View Only Terminal (VOT)9 in 2017. As an alterna-tive trading platform to the ZSE, FINSEC was established in December 2016. It has a market capitalisation of USD547.88 million and has
9The VOT is an electronic platform that gives investors viewing rights to ZSE trading only as it takes place through the automated trading system.
only one issuer as of 9 August 2019. Zimbabwe introduced its first online trading platform, C-Trade, in 2018, which enables investors to buy and sell shares on both capital markets. The platform aims to increase the awareness of the capital markets by trading via mobile phones with a minimum starting capital of USD10.
In 2016, the Reserve Bank of Zimbabwe (RBZ) introduced bond notes with the view of increasing liquidity on the market. The market responded negatively to the policy; some inves-tors sought value preservation on the equity market, while others parked their funds in properties. The large influx of participation on the equity market increased the share prices, with significant gains witnessed in value stocks. However, the bond notes triggered a further decline in the net foreign investment inflow because foreign investors were averse to the emerging currency risk.
The Zimbabwean election periods have had a major impact on trading behaviour on the stock market: Market cap peaked in election years 2013 and 2018. From 2017, there were multiple policy and monetary reforms that affected trad-ing activity on the local bourses, and the major
FIGURE 2. ZSE EQUITY MARKET CAPITALISATION, 2013–2019
US Dollars (millions)
8,000
7,000
6,000
5,000
4,000
3,000
2,000
1,000
020142013 2016 201820172015 2019
Industrial Market Cap Mining Market Cap
ZImBABwe
CFA Institute Research Foundation | 27
political change on 17 November 2017 saw the market cap rise to the tune of USD10 billion during this time.
Fiscal and monetary reforms were introduced in 2018. The Zimbabwean economy was hit by a cash crisis because of a mismatch between real-time gross settlement (RTGS) balances and USD balances, and banks were no longer able to meet demand deposits. To curb this challenge, RBZ introduced the FCA RTGS and FCA Nostro accounts, as well as a 2% tax on all electronic transactions. There was a notable decline in business across all sectors, including the capital markets. Year-on-year inflation for October 2018 rose to 20.85%—up from 5.39% in September 2018. Equities sold by foreign-ers increased by 196%, from USD22.71 million in September to USD67.28 million in October 2018.
On 22 February 2019, the RBZ liberalised the exchange rate, pegging USD1 to RTGS2.5, and introduced the interbank market. The balance sheet values were debased by 40%, and equi-ties sold by foreigners increased by 466%—from
USD42 million in January 2019 to USD237.83 million in February 2019. An abolishment of the multicurrency regime was completed in June 2019 with the introduction of a new currency: the RTGS dollar. In addition, stricter capital flow policy was introduced to curb excessive capital flows for dual-listed companies.
REGULATORY ENVIRONMENTThe Securities and Exchange Commission of Zimbabwe (SECZIM) is a regulator of 16 secu-rities dealers, 16 asset management firms, 31 securities investment advisers, 3 securities transfer secretaries, 5 securities custodians, the Central Securities Depository (CSD) of Zimbabwe, 2 securities trustees, and 2 security exchanges. SECZIM has filed for membership into the International Organisation of Securities Commissions (IOSCO) and is awaiting approval. Other financial institutions, such as pension funds, are regulated through the Insurance and Pensions Commission (IPEC), while banks and microfinance institutions are regulated through the RBZ.

CFA Institute Research Foundation | 29
MAURITIUS
Equity Market Capitalization
Equity Market Share Volume Traded
Debt Market Capitalization
Debt Market Instrument Volume Traded
Number of issuers (bonds)
Total Equity Market Cap/GDP
Number of listed companies
Domestic Equity Market Cap/GDP
Domestic Debt Market Cap/GDP
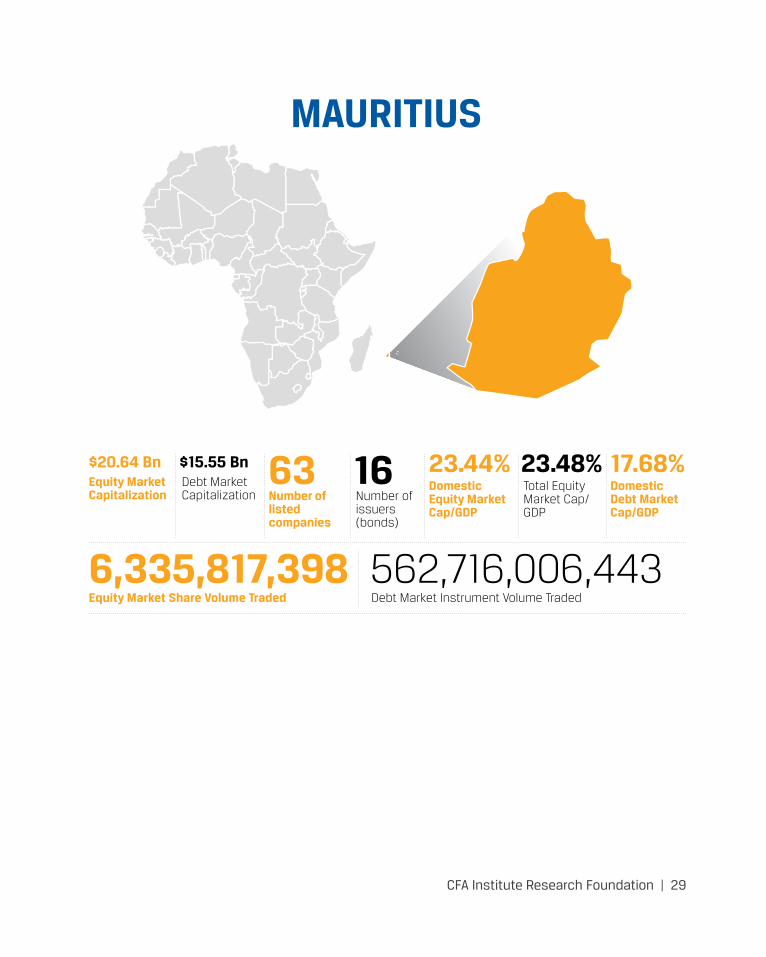
$20.64 Bn
6,335,817,398
63 23.44% 17.68%$15.55 Bn
562,716,006,443
16 23.48%
mAuRItIus
30 | CFA Institute Research Foundation
1968
1989
1994
2001
2015
1997
2013
2017
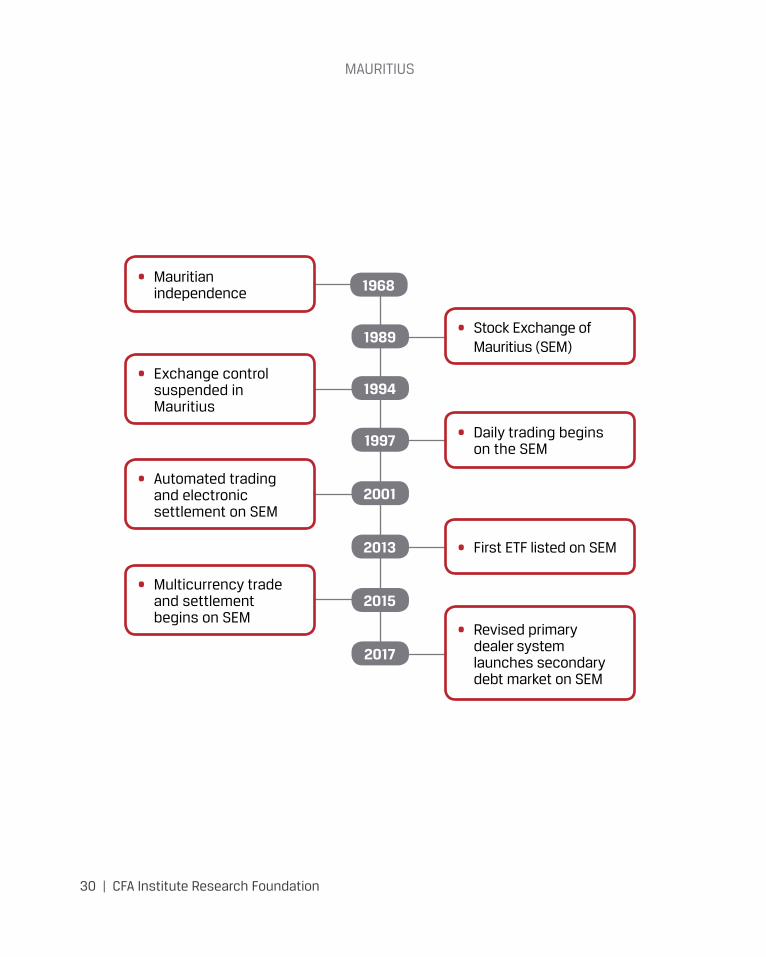
• Mauritian independence
• Stock Exchange of Mauritius (SEM)
• Daily trading begins on the SEM
• First ETF listed on SEM
• Revised primary dealer system launches secondary debt market on SEM
• Exchange control suspended in Mauritius
• Automated trading and electronic settlement on SEM
• Multicurrency trade and settlement begins on SEM
CFA Institute Research Foundation | 31
MAURITIUSBhavik DesaiHead of Research AXYS Stockbroking Ltd
Trading commenced on the Stock Exchange of Mauritius (SEM)10 on 5 July 1989 with five listed companies for a combined market capi-talisation of USD70 million. At first, trading occurred through a closed-box method,11 then through an open-outcry system, in which trad-ing lasted five minutes with a settlement cycle of more than a fortnight. Trading was extended to two days a week in 1992 and to three in 1994. The Exchange Control Act of 1951 was suspended in 1994, which meant that foreign investors could freely participate on the SEM for the first time. In 1997, trading became a daily affair, and the Central Depository & Settlement Co Ltd (CDS) was created. In 2001, trading on the SEM became both automated and electronic through the SEM Automatic Trading System (SEMATS).
Although trading on the SEM main board, known as the Official List (OFF), had been automated, an OTC board remained. It was not offered a similar path to automation until 2006, when the creation of the Development & Enterprise Market (DEM)12 offered a proper listing status on this secondary board. In 2012,
10See www.stockexchangeofmauritius.com/about-us/sem- at-a-glance.11Brokers would place client orders into a box dedicated for a company, and then the SEM would conduct the matching upon opening the boxes.12The DEM offers a secondary listing status. The key dif-ferences between OFF and DEM are free-float limits, a minimum number of shareholders, and a track record requirement for entities aiming to go public.
the SEM enabled multicurrency13 listings, trad-ing, and settlement on its platform and on-boarded the first stock that could be traded in US dollars, opening the gates for similar listings of Global Business License (GBL) holders.14 In 2013, the SEM welcomed its first exchange-traded fund (ETF), and by 2015, it would be possible to trade and settle a given security in multiple currencies.15 The SEM continues to pursue an internationalisation strategy. Most recently, it introduced a “fast-track” process for the listing of entities that are already listed on a major exchange. The SEM is a member of the World Federation of Exchanges and recognised by Her Majesty’s Revenue & Customs in the United Kingdom, and it won the Africa investor (Ai) “Most Innovative African Stock Exchange” award in 2017.
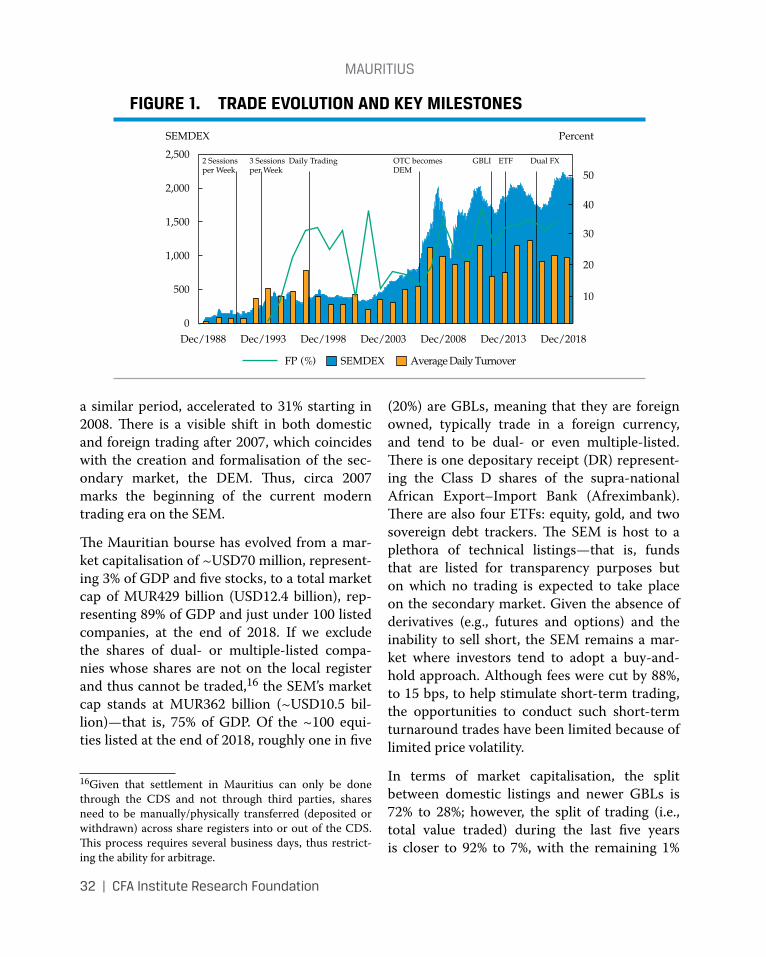
Figure 1 charts the evolution of the SEM’s main equity index, the SEMDEX. Measured at con-stant currency (i.e., adjusted for inflation), the average daily market turnover during the early years stood at MUR7 million (<USD0.5 million) per day and rose to MUR63 million (~USD2 million) starting in 2007. Similarly, foreign investor participation, which averaged 22% over
13It is possible to trade and settle securities denominated in MUR, USD, EUR, GBP, and ZAR on the SEM.14Typically, a company set up in Mauritius by non-Mauritians for the purpose of conducting business outside of Mauritius. Such entities are allowed to be domiciled in Mauritius and are regulated by the financial services regulator—the Financial Services Commission (FSC)—operating with a GBL.15There is only one such security to date.
mAuRItIus
32 | CFA Institute Research Foundation
a similar period, accelerated to 31% starting in 2008. There is a visible shift in both domestic and foreign trading after 2007, which coincides with the creation and formalisation of the sec-ondary market, the DEM. Thus, circa 2007 marks the beginning of the current modern trading era on the SEM.
The Mauritian bourse has evolved from a mar-ket capitalisation of ~USD70 million, represent-ing 3% of GDP and five stocks, to a total market cap of MUR429 billion (USD12.4 billion), rep-resenting 89% of GDP and just under 100 listed companies, at the end of 2018. If we exclude the shares of dual- or multiple-listed compa-nies whose shares are not on the local register and thus cannot be traded,16 the SEM’s market cap stands at MUR362 billion (~USD10.5 bil-lion)—that is, 75% of GDP. Of the ~100 equi-ties listed at the end of 2018, roughly one in five
16Given that settlement in Mauritius can only be done through the CDS and not through third parties, shares need to be manually/physically transferred (deposited or withdrawn) across share registers into or out of the CDS. This process requires several business days, thus restrict-ing the ability for arbitrage.
(20%) are GBLs, meaning that they are foreign owned, typically trade in a foreign currency, and tend to be dual- or even multiple-listed. There is one depositary receipt (DR) represent-ing the Class D shares of the supra-national African Export–Import Bank (Afreximbank). There are also four ETFs: equity, gold, and two sovereign debt trackers. The SEM is host to a plethora of technical listings—that is, funds that are listed for transparency purposes but on which no trading is expected to take place on the secondary market. Given the absence of derivatives (e.g., futures and options) and the inability to sell short, the SEM remains a mar-ket where investors tend to adopt a buy-and-hold approach. Although fees were cut by 88%, to 15 bps, to help stimulate short-term trading, the opportunities to conduct such short-term turnaround trades have been limited because of limited price volatility.
In terms of market capitalisation, the split between domestic listings and newer GBLs is 72% to 28%; however, the split of trading (i.e., total value traded) during the last five years is closer to 92% to 7%, with the remaining 1%
FIGURE 1. TRADE EVOLUTION AND KEY MILESTONES
50
40
30
20
10
3 Sessionsper Week
Daily Trading OTC becomesDEM
GBLI ETF Dual FX2 Sessionsper Week
2,500
2,000
1,500
1,000
500
0
FP (%) SEMDEX Average Daily Turnover
SEMDEX Percent
Dec/1988 Dec/1993 Dec/1998 Dec/2003 Dec/2008 Dec/2013 Dec/2018
mAuRItIus
CFA Institute Research Foundation | 33
driven by ETFs. This split in value traded more closely reflects the 88%–12% split in terms of market cap between domestic companies and GBLs when excluding the shares not available for trading on the SEM.
The constitution of the domestic market reflects the way Mauritius diversified its economy dur-ing the past half-century. Mauritius became an independent island state in 1968. A sugarcane-based monocrop economy at the time, Mauritius went on to develop an inward-focused manufac-turing industry in the 1960s and a textiles-heavy and export-focused manufacturing industry during the 1980s. It then diversified into the ter-tiary sector in the early 1990s, with a particular focus on financial services through the creation of “cross-border investment and finance” under a “well-regulated and transparent platform,” according to the Economic Development Board Mauritius.17
Today’s conglomerates and investment holding companies are legacies of the sugar estates that spun their non-sugar-related businesses off into separate investment holding companies post-independence. A hundred and fifty years ago, the number of sugar mills in Mauritius peaked close to 300 before shrinking to ~25 in the 1970s, fewer than 20 mills when the SEM began, and just 3 operational mills in 2019. The limited liquidity and complex shareholding structures of select listed companies and the prevalence of common shareholding structures among listed companies reflect the family-owned nature and the subsequent consolidation of sugar industry enterprises.
The majority of today’s conglomerates have either been consolidating their stakes in listed subsidiaries or quite simply absorbed them
17See http://edbmauritius.org/opportunities/financial- services/fs-overview/.
through takeover bids or amalgamations.18 The number of domestic listings has shrunk from ~100 a decade ago to just over 70 in 2019. The end result is that the SEM today is home to few single-sector “pure plays” and to many large, multi-sector holding companies that are both highly diversified and complex. Adding to the complexity is the recent creation, by some com-panies, of a separate class of voting-only shares to be held by the founding families, therein reducing the risk of hostile takeover bids. The limits on foreign ownership of sugar compa-nies—stemming from restrictions of foreign ownership of real estate in Mauritius—coupled with the manner in which they joined the SEM and the complexity of their operations would seem to explain the limited foreign participation in this category of companies.
Most of the listed consumer companies are among those established in the 1960s to pro-duce fast-moving consumer goods (both food products and household necessities) to replace imports. Travel and leisure companies (hotels, airlines, and betting/gaming companies) make up 8% of market cap and 16% of trades. In a quest for higher yields in the post-crisis world of low interest rates, REIT-type companies are not only being sought by Mauritian retail and institutional investors but also attract-ing interest from overseas portfolio managers focusing on real estate. The result is a gain in prominence for this sector, which now makes up 16% of market cap and 8% of trades on the SEM, compared with 4% and 2%, respectively, a decade ago.
The financial sector is the largest sector in size and trade (36% of market cap and 46% of trades) and represents the overwhelming majority of foreign investor participation on the SEM. Here, we find the largest companies by market cap as
18See Figure 2.
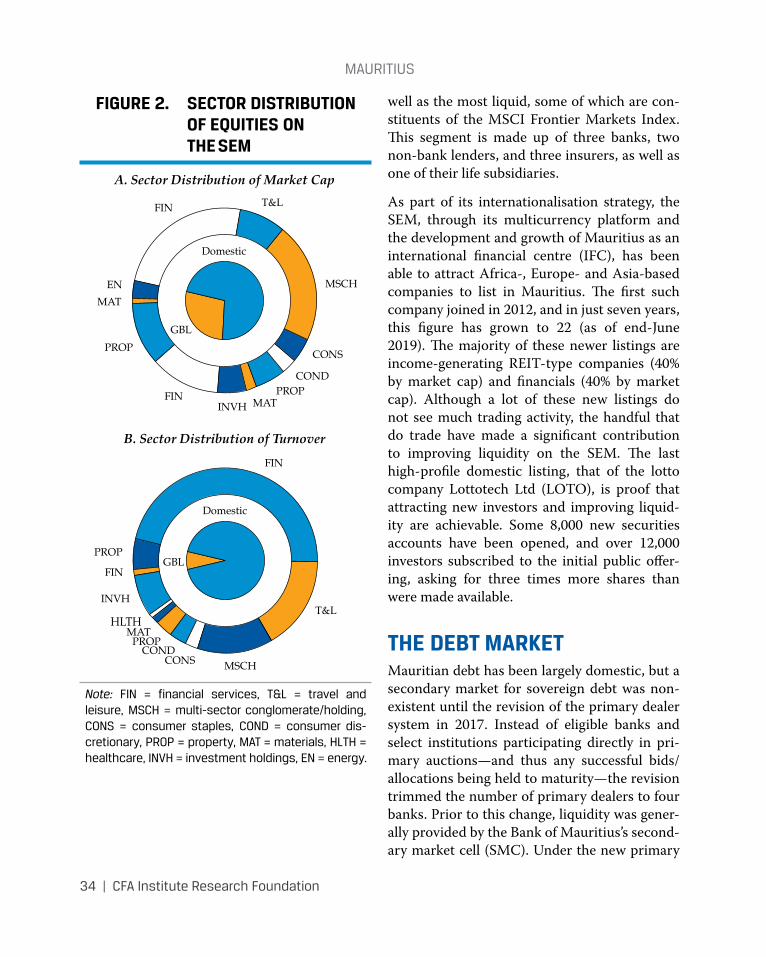
mAuRItIus
34 | CFA Institute Research Foundation
well as the most liquid, some of which are con-stituents of the MSCI Frontier Markets Index. This segment is made up of three banks, two non-bank lenders, and three insurers, as well as one of their life subsidiaries.
As part of its internationalisation strategy, the SEM, through its multicurrency platform and the development and growth of Mauritius as an international financial centre (IFC), has been able to attract Africa-, Europe- and Asia-based companies to list in Mauritius. The first such company joined in 2012, and in just seven years, this figure has grown to 22 (as of end-June 2019). The majority of these newer listings are income-generating REIT-type companies (40% by market cap) and financials (40% by market cap). Although a lot of these new listings do not see much trading activity, the handful that do trade have made a significant contribution to improving liquidity on the SEM. The last high-profile domestic listing, that of the lotto company Lottotech Ltd (LOTO), is proof that attracting new investors and improving liquid-ity are achievable. Some 8,000 new securities accounts have been opened, and over 12,000 investors subscribed to the initial public offer-ing, asking for three times more shares than were made available.
THE DEBT MARKETMauritian debt has been largely domestic, but a secondary market for sovereign debt was non-existent until the revision of the primary dealer system in 2017. Instead of eligible banks and select institutions participating directly in pri-mary auctions—and thus any successful bids/allocations being held to maturity—the revision trimmed the number of primary dealers to four banks. Prior to this change, liquidity was gener-ally provided by the Bank of Mauritius’s second-ary market cell (SMC). Under the new primary
FIGURE 2. SECTOR DISTRIBUTION OF EQUITIES ON THE SEM
B. Sector Distribution of Turnover
A. Sector Distribution of Market Cap
T&L
MSCHCONSCOND
PROPMAT
INVH
FIN
PROP
HLTH
FIN
T&L
MSCH
CONS
CONDPROP
MATINVHFIN
PROP
MAT
EN
FIN
GBL
Domestic
Domestic
GBL
Note: FIn = financial services, t&L = travel and leisure, msCH = multi-sector conglomerate/holding, Cons = consumer staples, Cond = consumer dis-cretionary, pRop = property, mAt = materials, HLtH = healthcare, InVH = investment holdings, en = energy.
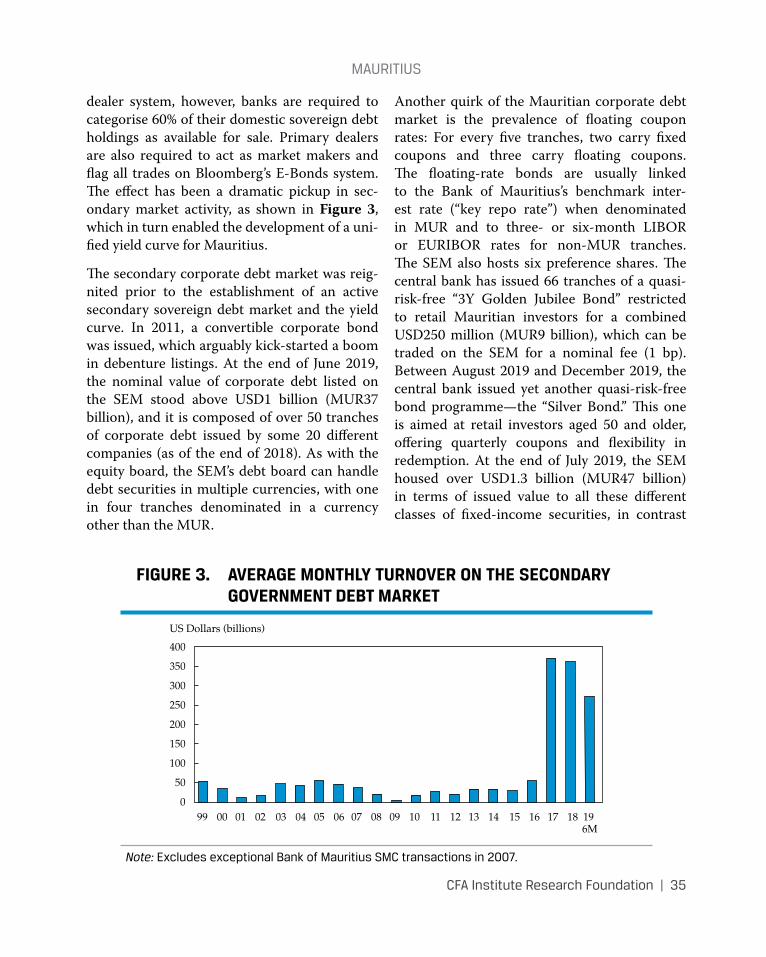
mAuRItIus
CFA Institute Research Foundation | 35
dealer system, however, banks are required to categorise 60% of their domestic sovereign debt holdings as available for sale. Primary dealers are also required to act as market makers and flag all trades on Bloomberg’s E-Bonds system. The effect has been a dramatic pickup in sec-ondary market activity, as shown in Figure 3, which in turn enabled the development of a uni-fied yield curve for Mauritius.
The secondary corporate debt market was reig-nited prior to the establishment of an active secondary sovereign debt market and the yield curve. In 2011, a convertible corporate bond was issued, which arguably kick-started a boom in debenture listings. At the end of June 2019, the nominal value of corporate debt listed on the SEM stood above USD1 billion (MUR37 billion), and it is composed of over 50 tranches of corporate debt issued by some 20 different companies (as of the end of 2018). As with the equity board, the SEM’s debt board can handle debt securities in multiple currencies, with one in four tranches denominated in a currency other than the MUR.
Another quirk of the Mauritian corporate debt market is the prevalence of floating coupon rates: For every five tranches, two carry fixed coupons and three carry floating coupons. The floating-rate bonds are usually linked to the Bank of Mauritius’s benchmark inter-est rate (“key repo rate”) when denominated in MUR and to three- or six-month LIBOR or EURIBOR rates for non-MUR tranches. The SEM also hosts six preference shares. The central bank has issued 66 tranches of a quasi-risk-free “3Y Golden Jubilee Bond” restricted to retail Mauritian investors for a combined USD250 million (MUR9 billion), which can be traded on the SEM for a nominal fee (1 bp). Between August 2019 and December 2019, the central bank issued yet another quasi-risk-free bond programme—the “Silver Bond.” This one is aimed at retail investors aged 50 and older, offering quarterly coupons and flexibility in redemption. At the end of July 2019, the SEM housed over USD1.3 billion (MUR47 billion) in terms of issued value to all these different classes of fixed-income securities, in contrast
FIGURE 3. AVERAGE MONTHLY TURNOVER ON THE SECONDARY GOVERNMENT DEBT MARKET
US Dollars (billions)
400
300
350
250
200
150
100
50
099 00 01 02 03 04 05 06 07 08 09 10 11 12 13 14 15 16 17 18 19
6M
Note: excludes exceptional Bank of mauritius smC transactions in 2007.
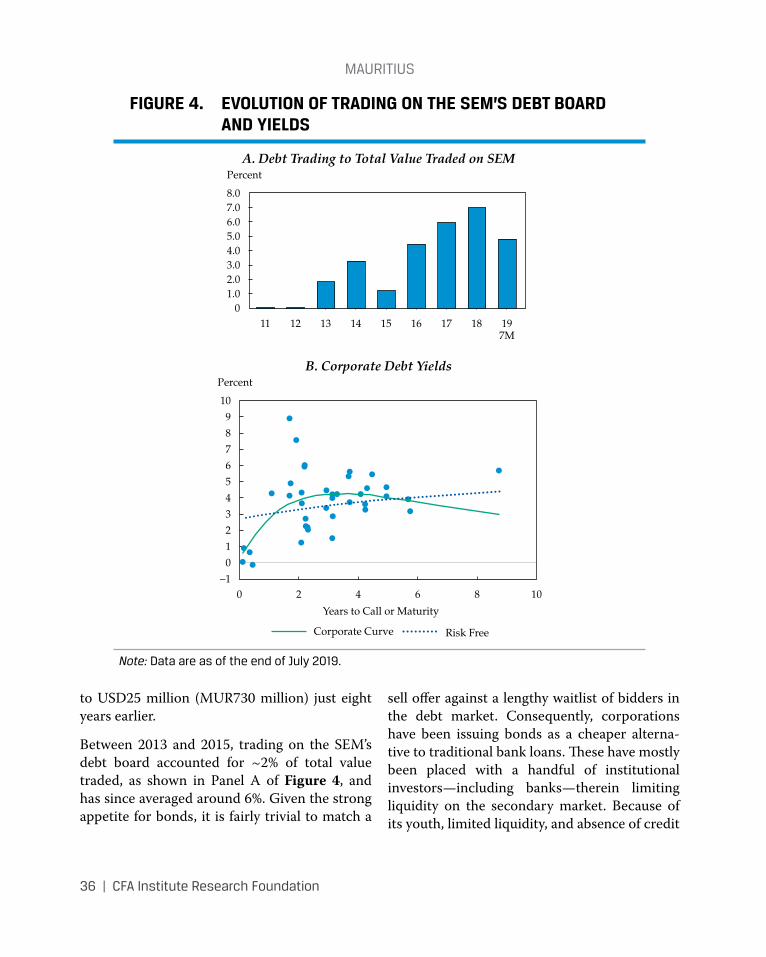
mAuRItIus
36 | CFA Institute Research Foundation
to USD25 million (MUR730 million) just eight years earlier.
Between 2013 and 2015, trading on the SEM’s debt board accounted for ~2% of total value traded, as shown in Panel A of Figure 4, and has since averaged around 6%. Given the strong appetite for bonds, it is fairly trivial to match a
sell offer against a lengthy waitlist of bidders in the debt market. Consequently, corporations have been issuing bonds as a cheaper alterna-tive to traditional bank loans. These have mostly been placed with a handful of institutional investors—including banks—therein limiting liquidity on the secondary market. Because of its youth, limited liquidity, and absence of credit
FIGURE 4. EVOLUTION OF TRADING ON THE SEM’S DEBT BOARD AND YIELDS
0
PercentA. Debt Trading to Total Value Traded on SEM
8.0
6.07.0
5.04.03.02.01.0
014131211 15 18 19
7M1716
Percent
Years to Call or Maturity
B. Corporate Debt Yields
10
89
7654321
–1420 6 108
Corporate Curve Risk Free
Note: data are as of the end of July 2019.
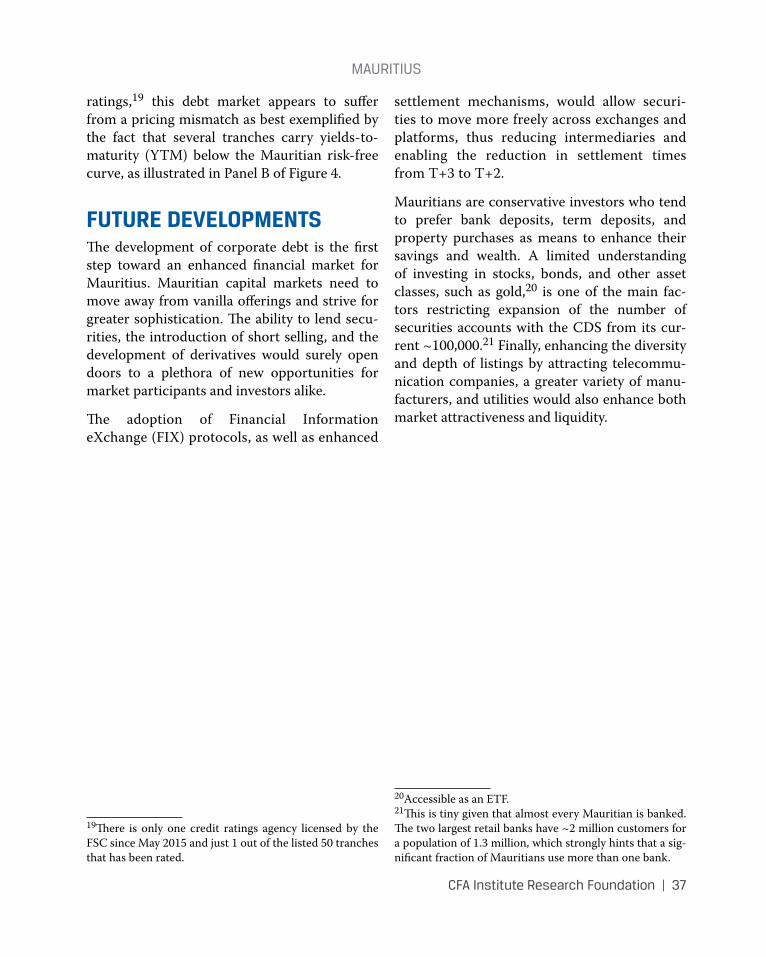
mAuRItIus
CFA Institute Research Foundation | 37
ratings,19 this debt market appears to suffer from a pricing mismatch as best exemplified by the fact that several tranches carry yields-to-maturity (YTM) below the Mauritian risk-free curve, as illustrated in Panel B of Figure 4.
FUTURE DEVELOPMENTSThe development of corporate debt is the first step toward an enhanced financial market for Mauritius. Mauritian capital markets need to move away from vanilla offerings and strive for greater sophistication. The ability to lend secu-rities, the introduction of short selling, and the development of derivatives would surely open doors to a plethora of new opportunities for market participants and investors alike.
The adoption of Financial Information eXchange (FIX) protocols, as well as enhanced
19There is only one credit ratings agency licensed by the FSC since May 2015 and just 1 out of the listed 50 tranches that has been rated.
settlement mechanisms, would allow securi-ties to move more freely across exchanges and platforms, thus reducing intermediaries and enabling the reduction in settlement times from T+3 to T+2.
Mauritians are conservative investors who tend to prefer bank deposits, term deposits, and property purchases as means to enhance their savings and wealth. A limited understanding of investing in stocks, bonds, and other asset classes, such as gold,20 is one of the main fac-tors restricting expansion of the number of securities accounts with the CDS from its cur-rent ~100,000.21 Finally, enhancing the diversity and depth of listings by attracting telecommu-nication companies, a greater variety of manu-facturers, and utilities would also enhance both market attractiveness and liquidity.
20Accessible as an ETF.21This is tiny given that almost every Mauritian is banked. The two largest retail banks have ~2 million customers for a population of 1.3 million, which strongly hints that a sig-nificant fraction of Mauritians use more than one bank.

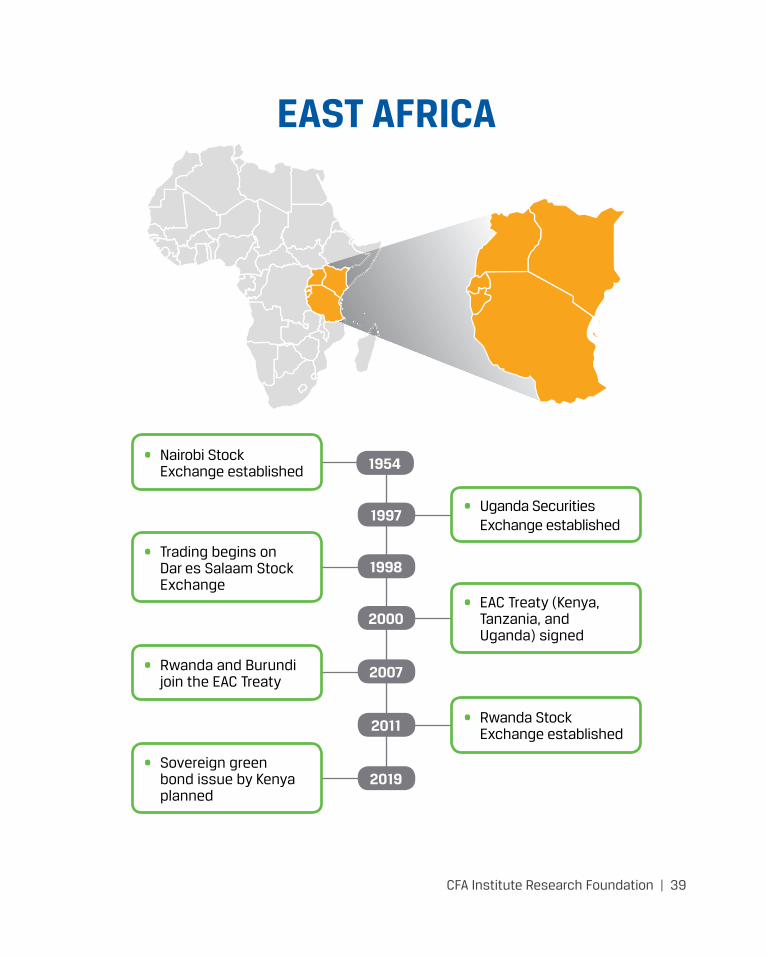
CFA Institute Research Foundation | 39
EAST AFRICA
1954
1997
1998
2007
2019
2000
2011
• Nairobi Stock Exchange established
• Uganda Securities Exchange established
• EAC Treaty (Kenya, Tanzania, and Uganda) signed
• Rwanda Stock Exchange established
• Trading begins on Dar es Salaam Stock Exchange
• Rwanda and Burundi join the EAC Treaty
• Sovereign green bond issue by Kenya planned
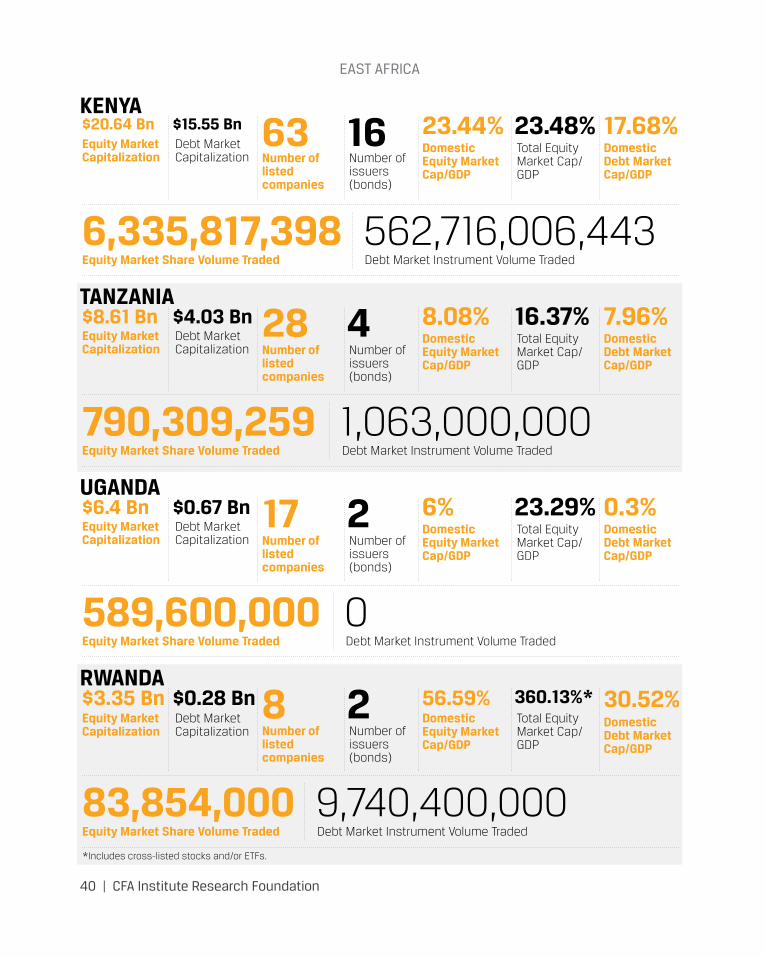
eAst AFRICA
40 | CFA Institute Research Foundation
Equity Market Capitalization
Equity Market Share Volume Traded
Debt Market Capitalization
Debt Market Instrument Volume Traded
Number of issuers (bonds)
Total Equity Market Cap/GDP
Number of listed companies
Domestic Equity Market Cap/GDP
Domestic Debt Market Cap/GDP
$20.64 Bn
6,335,817,398
63 23.44% 17.68%$15.55 Bn
562,716,006,443
16 23.48%KENYA
Equity Market Capitalization
Equity Market Share Volume Traded
Debt Market Capitalization
Debt Market Instrument Volume Traded
Number of issuers (bonds)
Total Equity Market Cap/GDP
Number of listed companies
Domestic Equity Market Cap/GDP
Domestic Debt Market Cap/GDP
$6.4 Bn
589,600,000
17 6% 0.3% $0.67 Bn
0
2 23.29%UGANDA
Equity Market Capitalization
Equity Market Share Volume Traded
Debt Market Capitalization
Debt Market Instrument Volume Traded
Number of issuers (bonds)
Total Equity Market Cap/GDP
Number of listed companies
Domestic Equity Market Cap/GDP
Domestic Debt Market Cap/GDP
$8.61 Bn
790,309,259
28 8.08% 7.96%$4.03 Bn
1,063,000,000
4 16.37%TANZANIA
Equity Market Capitalization
Equity Market Share Volume Traded
Debt Market Capitalization
*Includes cross-listed stocks and/or ETFs.
Debt Market Instrument Volume Traded
Number of issuers (bonds)
Total Equity Market Cap/GDP
Number of listed companies
Domestic Equity Market Cap/GDP
Domestic Debt Market Cap/GDP
$3.35 Bn
83,854,000
8 56.59% 30.52%$0.28 Bn
9,740,400,000
2 360.13%*RWANDA
CFA Institute Research Foundation | 41
EAST AFRICAAly Z. RamjiDirector Mediapix Limited
Virginia WairimuResearch Analyst Mediapix Limited
Martin MwitaResearch Analyst Mediapix Limited
Rufus MwanyasiExecutive Canaan Capital
The East African Community (EAC) is a regional intergovernmental organisation of six partner states—namely, Kenya, Tanzania, Uganda, Rwanda, Burundi, and South Sudan—with headquarters in Arusha, Tanzania.22 In 1977, the initial organisation had collapsed, and it wasn’t until November 1999 that the re-unifi-cation of the organisation took place, under the leadership of the then president of Kenya, presi-dent of Uganda, and president of Tanzania.
The EAC has a population of 172 million citi-zens, a land area of 2.5 million square kilome-tres, and a combined GDP of USD172 billion, and thus, its realization bears great strategic and geopolitical significance and prospects. As one of the fastest-growing regional economic blocs in the world, the EAC is widening and deepen-ing cooperation among the partner states in various key spheres for their mutual benefit.
22The EAC Treaty came into force on 7 July 2000 with Kenya, Tanzania, and Uganda. Rwanda and Burundi joined in 2007, and the Republic of South Sudan, in 2016.
The Nairobi Stock Exchange (NSE) was estab-lished in 1954—the first stock exchange estab-lished to cater to the EAC partner states under British rule—namely, Kenya, Uganda, and Tanzania. In 1977, the collapse of the EAC enabled the NSE to become a fully Kenyan out-fit, with all the non-Kenyan companies delisted and nationalised in their respective countries of Uganda and Tanzania. It was not until the 1990s that Uganda and Tanzania established their own national stock exchanges: the Uganda Securities Exchange (USE) in 1997 and the Dar es Salaam Stock Exchange (DSE) in 1998. The Rwanda Stock Exchange (RSE) followed in 2011. Burundi has yet to establish a capital market, but plans are underway. Both the NSE and DSE are demutualised entities and self-listed in their respective bourses. Besides equities, the stock exchanges provide a debt market for trading government and corporate bonds.
Currently, the NSE, DSE, USE, and RSE trade on the Automated Trading System (ATS) with
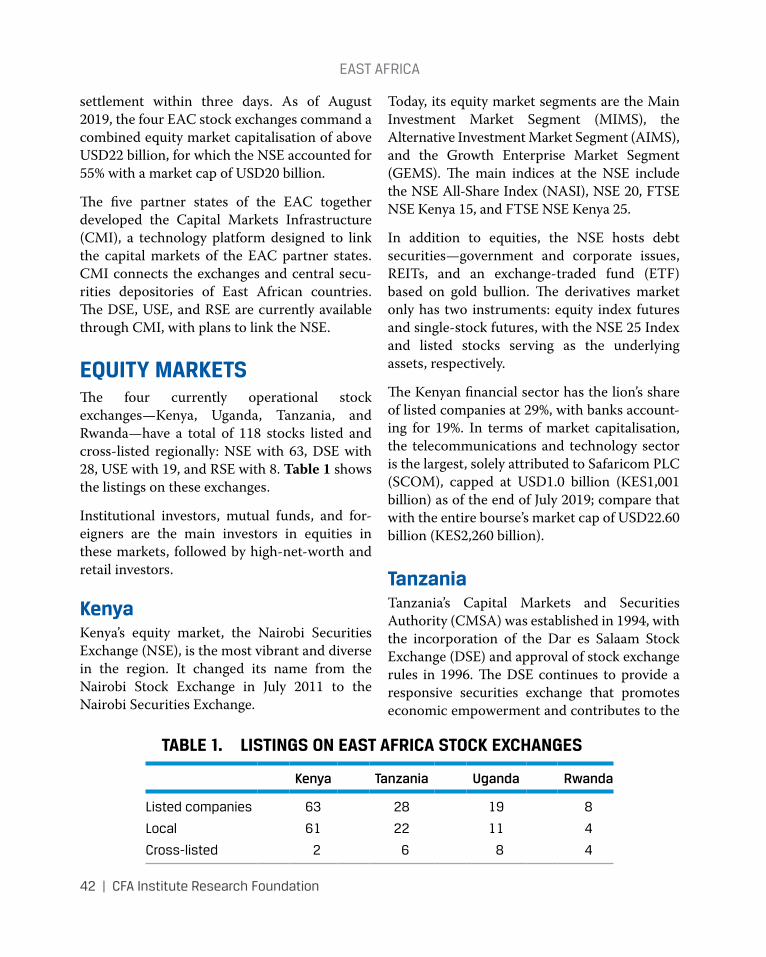
eAst AFRICA
42 | CFA Institute Research Foundation
settlement within three days. As of August 2019, the four EAC stock exchanges command a combined equity market capitalisation of above USD22 billion, for which the NSE accounted for 55% with a market cap of USD20 billion.
The five partner states of the EAC together developed the Capital Markets Infrastructure (CMI), a technology platform designed to link the capital markets of the EAC partner states. CMI connects the exchanges and central secu-rities depositories of East African countries. The DSE, USE, and RSE are currently available through CMI, with plans to link the NSE.
EQUITY MARKETSThe four currently operational stock exchanges—Kenya, Uganda, Tanzania, and Rwanda—have a total of 118 stocks listed and cross-listed regionally: NSE with 63, DSE with 28, USE with 19, and RSE with 8. Table 1 shows the listings on these exchanges.
Institutional investors, mutual funds, and for-eigners are the main investors in equities in these markets, followed by high-net-worth and retail investors.
KenyaKenya’s equity market, the Nairobi Securities Exchange (NSE), is the most vibrant and diverse in the region. It changed its name from the Nairobi Stock Exchange in July 2011 to the Nairobi Securities Exchange.
Today, its equity market segments are the Main Investment Market Segment (MIMS), the Alternative Investment Market Segment (AIMS), and the Growth Enterprise Market Segment (GEMS). The main indices at the NSE include the NSE All-Share Index (NASI), NSE 20, FTSE NSE Kenya 15, and FTSE NSE Kenya 25.
In addition to equities, the NSE hosts debt securities—government and corporate issues, REITs, and an exchange-traded fund (ETF) based on gold bullion. The derivatives market only has two instruments: equity index futures and single-stock futures, with the NSE 25 Index and listed stocks serving as the underlying assets, respectively.
The Kenyan financial sector has the lion’s share of listed companies at 29%, with banks account-ing for 19%. In terms of market capitalisation, the telecommunications and technology sector is the largest, solely attributed to Safaricom PLC (SCOM), capped at USD1.0 billion (KES1,001 billion) as of the end of July 2019; compare that with the entire bourse’s market cap of USD22.60 billion (KES2,260 billion).
TanzaniaTanzania’s Capital Markets and Securities Authority (CMSA) was established in 1994, with the incorporation of the Dar es Salaam Stock Exchange (DSE) and approval of stock exchange rules in 1996. The DSE continues to provide a responsive securities exchange that promotes economic empowerment and contributes to the
TABLE 1. LISTINGS ON EAST AFRICA STOCK EXCHANGES
Kenya Tanzania Uganda Rwanda
Listed companies 63 28 19 8
Local 61 22 11 4
Cross-listed 2 6 8 4
eAst AFRICA
CFA Institute Research Foundation | 43
country’s economic development by offering a range of attractive and cost-effective products and services. Incentives to issuers include
• reduced corporation tax, from 30% to 25%, for three successive years after listing for any company that has issued at least 25% of its shares to the public and
• tax deductibility of all IPO costs.
Investors benefit from zero capital gains tax, versus 10% for unlisted companies; zero stamp duty on transactions executed at the DSE, com-pared with 6% for unlisted companies; with-holding tax of 5% on dividend income, versus 10% for unlisted companies; and zero withhold-ing tax on interest income from listed bonds whose maturities are three years or longer.
The Treasury bond market has four maturi-ties (2, 5, 7, and 10 years) that are issued in the primary market. The market is dominated by pension funds. The auction is held once every month. The bonds are listed at the DSE, but sec-ondary market trading of government bonds is not vibrant.
UgandaThe Capital Markets Authority (CMA) of Uganda is a semi-autonomous government body responsible for the financial regulation of the country’s capital markets. The CMA has been driving campaigns to improve pub-lic education for issuers and investors through face-to-face presentations while developing and regulating the capital markets industry with the overall objectives of investor protection and market efficiency.
The market has been stagnant because the devaluation in the Ugandan shilling discour-aged investments in the country. The country is facing dozens of challenges related to access
to affordable capital; commercial bank interest rates remain high at 22%.
RwandaIn 2015, the Rwanda Ministry of Finance and Economic Planning mandated CMA Rwanda to develop a capital market master plan (CMMP), setting the CMA’s policy strategy for the next 10 years.
In this respect, Rwanda’s capital market was established under the Capital Market Act in 2011. The CMMP created an opportunity to raise funds for investment—mainly, the devel-opment of mega-infrastructure projects.
The CMMP is aimed at helping deepen debt markets, expand listings on the Rwanda Stock Exchange (RSE), develop an ecosystem of finan-cial sector intermediaries, and further integrate Rwanda’s capital markets with those of its East African peers.
Since inception, the CMA has been able to mobil-ise capital worth more than USD300 million. To attract investments in the sector, the government has provided several incentives—among them, exemption of capital gains and a value-added tax (VAT) on secondary market transactions.
Local and international portfolio investors have an opportunity to own assets in the banking and telecom sectors and the domestic bond market. The RSE remains vibrant, providing a trading platform for stocks, bonds, and other invest-ment instruments.
Challenges and OpportunitiesThe EAC equity markets have made some tre-mendous improvements over the years in terms of regulation, investor education, and trade automation—all of which have opened avenues for trading.
eAst AFRICA
44 | CFA Institute Research Foundation
Some of the notable remaining challenges include
• Low liquidity across the region’s stock mar-kets. Some of the leading factors of low liquidity are weak market fundamentals, low free floats except for a few blue chips, and low market access by local retail investors.
• Dependence on foreign investors, mainly from emerging markets and investors invest-ing with a dollar-based currency. Policy changes by the US Federal Reserve play a huge role in the position these investors take, which makes the EAC market vulnerable.
• Drastic policy changes that have detrimental effects on economic growth. For example, the implementation of the interest rate cap in Kenya in 2016 led to a decline in private sector credit growth, resulting in low returns and profit warnings from most corporations.
• A weak local currency in Tanzania, Uganda, and Rwanda, which has played a role in dis-couraging foreign investors because of high foreign exchange risk.
• Stock price volatility in the less-developed markets, such as Tanzania, that has led to a decline in investor participation.
• Lack of local investor confidence and risk appetite is still prevalent, despite height-ened awareness about the benefits of invest-ment in the stock market. For instance, in Tanzania, participation is about 1.5% of the population.
• High requirements and costs associated with the listing of new entrants in Kenya. A reduction in brokerage fees would be wel-come; East African stock markets are rated as the most expensive in Africa.
• A lack of product diversity relative to other emerging markets.
Despite these challenges, East Africa’s economy is the fastest growing in sub-Saharan Africa in the past three years. The region also woos foreign investors, with foreign direct inflows of more than USD9 billion in 2018. Despite a bearish regional stock market characterised by declining share prices and low trade volumes and market cap, EAC equity markets remain an attractive investment vehicle for both local and international investors.
In Kenya going forward, we expect improved liquidity with the repeal of interest rate cap-ping, which will further spur private-sector-led growth. The shilling is likely to remain strong against the dollar, hence keeping foreign exchange risk at bay. Tanzania, Uganda, and Rwanda policymakers are also keen to stabilise their local currencies and the macroeconomy to offer a more conducive investment environ-ment. The CMA Kenya plan to “create a vibrant and globally competitive financial sector that will promote a high level of savings to finance Kenya’s overall investment needs”23 is geared to increase activity and provide small and medium enterprises (SMEs) with broad opportunities to raise funds and stimulate growth. The Ibuka incubation and acceleration program by the NSE, which kicked off in January 2019, identi-fied 20 SMEs that will be offered financial advice and access to strategic investors.
Continued sensitisation by the four bourses on increasing savings and the benefits of investing is expected to yield better results in increasing local participation and thus liquidity.
DEBT MARKETSThe EAC’s bond markets (see Table 2) are now widely recognized as playing an important role in promoting the effectiveness of macroeconomic
23Kenya Foreign Policy and Government Guide, vol. 1 (2004): 58.
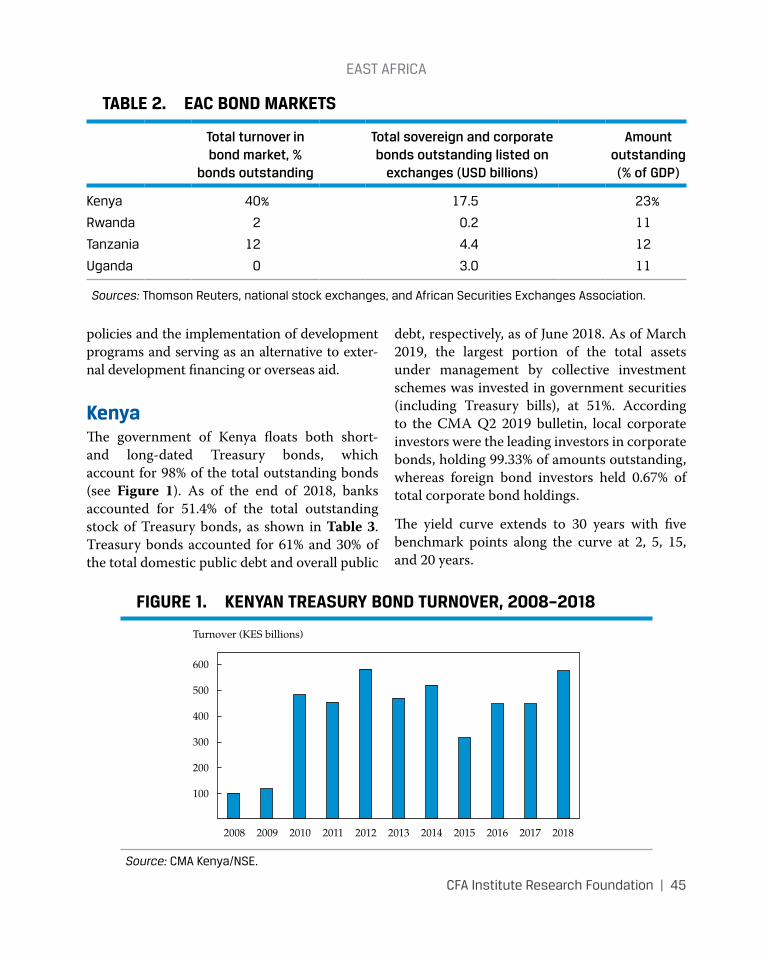
eAst AFRICA
CFA Institute Research Foundation | 45
policies and the implementation of development programs and serving as an alternative to exter-nal development financing or overseas aid.
KenyaThe government of Kenya floats both short- and long-dated Treasury bonds, which account for 98% of the total outstanding bonds (see Figure 1). As of the end of 2018, banks accounted for 51.4% of the total outstanding stock of Treasury bonds, as shown in Table 3. Treasury bonds accounted for 61% and 30% of the total domestic public debt and overall public
debt, respectively, as of June 2018. As of March 2019, the largest portion of the total assets under management by collective investment schemes was invested in government securities (including Treasury bills), at 51%. According to the CMA Q2 2019 bulletin, local corporate investors were the leading investors in corporate bonds, holding 99.33% of amounts outstanding, whereas foreign bond investors held 0.67% of total corporate bond holdings.
The yield curve extends to 30 years with five benchmark points along the curve at 2, 5, 15, and 20 years.
TABLE 2. EAC BOND MARKETS
Total turnover in bond market, %
bonds outstanding
Total sovereign and corporate bonds outstanding listed on
exchanges (USD billions)
Amount outstanding (% of GDP)
Kenya 40% 17.5 23%
Rwanda 2 0.2 11
tanzania 12 4.4 12
uganda 0 3.0 11
Sources: thomson Reuters, national stock exchanges, and African securities exchanges Association.
FIGURE 1. KENYAN TREASURY BOND TURNOVER, 2008–2018
Turnover (KES billions)
2011 2012 2013 2015 2016 2018201020092008 2014 2017
500
600
400
300
200
100
Source: CmA Kenya/nse.
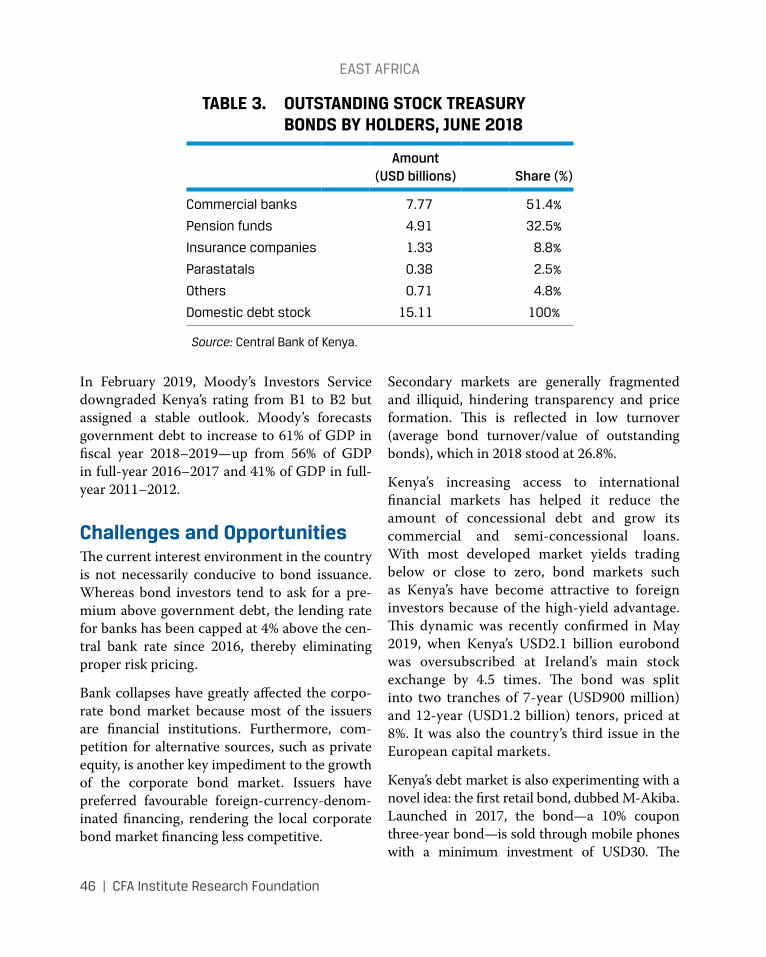
eAst AFRICA
46 | CFA Institute Research Foundation
In February 2019, Moody’s Investors Service downgraded Kenya’s rating from B1 to B2 but assigned a stable outlook. Moody’s forecasts government debt to increase to 61% of GDP in fiscal year 2018–2019—up from 56% of GDP in full-year 2016–2017 and 41% of GDP in full-year 2011–2012.
Challenges and OpportunitiesThe current interest environment in the country is not necessarily conducive to bond issuance. Whereas bond investors tend to ask for a pre-mium above government debt, the lending rate for banks has been capped at 4% above the cen-tral bank rate since 2016, thereby eliminating proper risk pricing.
Bank collapses have greatly affected the corpo-rate bond market because most of the issuers are financial institutions. Furthermore, com-petition for alternative sources, such as private equity, is another key impediment to the growth of the corporate bond market. Issuers have preferred favourable foreign-currency-denom-inated financing, rendering the local corporate bond market financing less competitive.
Secondary markets are generally fragmented and illiquid, hindering transparency and price formation. This is reflected in low turnover (average bond turnover/value of outstanding bonds), which in 2018 stood at 26.8%.
Kenya’s increasing access to international financial markets has helped it reduce the amount of concessional debt and grow its commercial and semi-concessional loans. With most developed market yields trading below or close to zero, bond markets such as Kenya’s have become attractive to foreign investors because of the high-yield advantage. This dynamic was recently confirmed in May 2019, when Kenya’s USD2.1 billion eurobond was oversubscribed at Ireland’s main stock exchange by 4.5 times. The bond was split into two tranches of 7-year (USD900 million) and 12-year (USD1.2 billion) tenors, priced at 8%. It was also the country’s third issue in the European capital markets.
Kenya’s debt market is also experimenting with a novel idea: the first retail bond, dubbed M-Akiba. Launched in 2017, the bond—a 10% coupon three-year bond—is sold through mobile phones with a minimum investment of USD30. The
TABLE 3. OUTSTANDING STOCK TREASURY BONDS BY HOLDERS, JUNE 2018
Amount (USD billions) Share (%)
Commercial banks 7.77 51.4%
pension funds 4.91 32.5%
Insurance companies 1.33 8.8%
parastatals 0.38 2.5%
others 0.71 4.8%
domestic debt stock 15.11 100%
Source: Central Bank of Kenya.
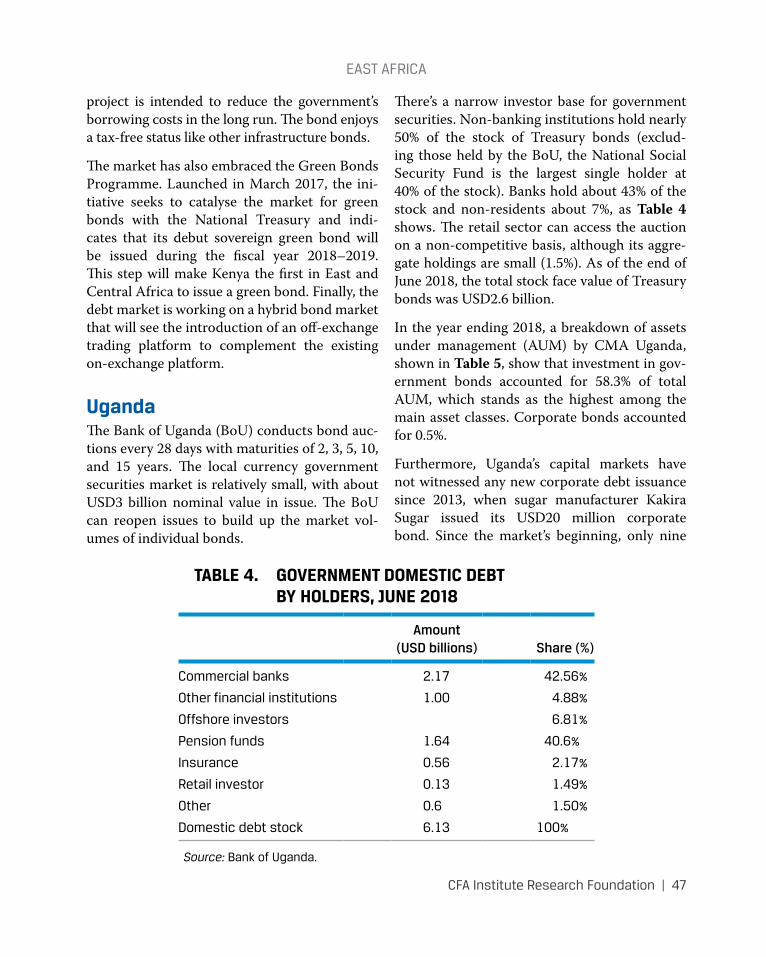
eAst AFRICA
CFA Institute Research Foundation | 47
project is intended to reduce the government’s borrowing costs in the long run. The bond enjoys a tax-free status like other infrastructure bonds.
The market has also embraced the Green Bonds Programme. Launched in March 2017, the ini-tiative seeks to catalyse the market for green bonds with the National Treasury and indi-cates that its debut sovereign green bond will be issued during the fiscal year 2018–2019. This step will make Kenya the first in East and Central Africa to issue a green bond. Finally, the debt market is working on a hybrid bond market that will see the introduction of an off-exchange trading platform to complement the existing on-exchange platform.
UgandaThe Bank of Uganda (BoU) conducts bond auc-tions every 28 days with maturities of 2, 3, 5, 10, and 15 years. The local currency government securities market is relatively small, with about USD3 billion nominal value in issue. The BoU can reopen issues to build up the market vol-umes of individual bonds.
There’s a narrow investor base for government securities. Non-banking institutions hold nearly 50% of the stock of Treasury bonds (exclud-ing those held by the BoU, the National Social Security Fund is the largest single holder at 40% of the stock). Banks hold about 43% of the stock and non-residents about 7%, as Table 4 shows. The retail sector can access the auction on a non-competitive basis, although its aggre-gate holdings are small (1.5%). As of the end of June 2018, the total stock face value of Treasury bonds was USD2.6 billion.
In the year ending 2018, a breakdown of assets under management (AUM) by CMA Uganda, shown in Table 5, show that investment in gov-ernment bonds accounted for 58.3% of total AUM, which stands as the highest among the main asset classes. Corporate bonds accounted for 0.5%.
Furthermore, Uganda’s capital markets have not witnessed any new corporate debt issuance since 2013, when sugar manufacturer Kakira Sugar issued its USD20 million corporate bond. Since the market’s beginning, only nine
TABLE 4. GOVERNMENT DOMESTIC DEBT BY HOLDERS, JUNE 2018
Amount (USD billions) Share (%)
Commercial banks 2.17 42.56%
other financial institutions 1.00 4.88%
offshore investors 6.81%
pension funds 1.64 40.6%
Insurance 0.56 2.17%
Retail investor 0.13 1.49%
other 0.6 1.50%
domestic debt stock 6.13 100%
Source: Bank of uganda.
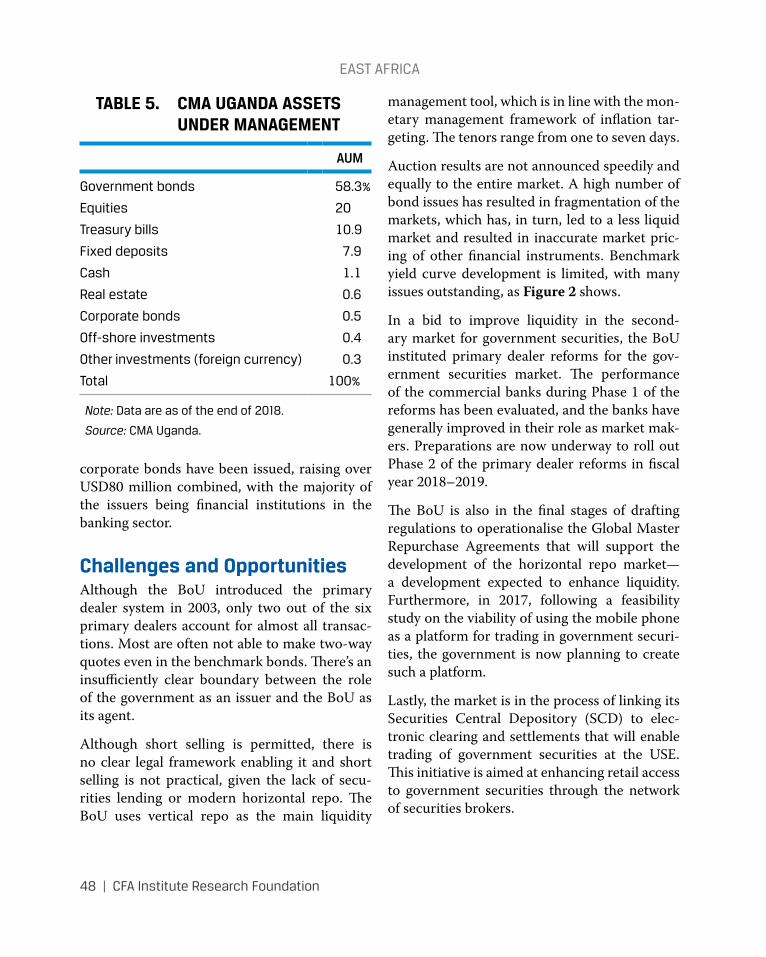
eAst AFRICA
48 | CFA Institute Research Foundation
corporate bonds have been issued, raising over USD80 million combined, with the majority of the issuers being financial institutions in the banking sector.
Challenges and OpportunitiesAlthough the BoU introduced the primary dealer system in 2003, only two out of the six primary dealers account for almost all transac-tions. Most are often not able to make two-way quotes even in the benchmark bonds. There’s an insufficiently clear boundary between the role of the government as an issuer and the BoU as its agent.
Although short selling is permitted, there is no clear legal framework enabling it and short selling is not practical, given the lack of secu-rities lending or modern horizontal repo. The BoU uses vertical repo as the main liquidity
management tool, which is in line with the mon-etary management framework of inflation tar-geting. The tenors range from one to seven days.
Auction results are not announced speedily and equally to the entire market. A high number of bond issues has resulted in fragmentation of the markets, which has, in turn, led to a less liquid market and resulted in inaccurate market pric-ing of other financial instruments. Benchmark yield curve development is limited, with many issues outstanding, as Figure 2 shows.
In a bid to improve liquidity in the second-ary market for government securities, the BoU instituted primary dealer reforms for the gov-ernment securities market. The performance of the commercial banks during Phase 1 of the reforms has been evaluated, and the banks have generally improved in their role as market mak-ers. Preparations are now underway to roll out Phase 2 of the primary dealer reforms in fiscal year 2018–2019.
The BoU is also in the final stages of drafting regulations to operationalise the Global Master Repurchase Agreements that will support the development of the horizontal repo market—a development expected to enhance liquidity. Furthermore, in 2017, following a feasibility study on the viability of using the mobile phone as a platform for trading in government securi-ties, the government is now planning to create such a platform.
Lastly, the market is in the process of linking its Securities Central Depository (SCD) to elec-tronic clearing and settlements that will enable trading of government securities at the USE. This initiative is aimed at enhancing retail access to government securities through the network of securities brokers.
TABLE 5. CMA UGANDA ASSETS UNDER MANAGEMENT
AUM
government bonds 58.3%
equities 20
treasury bills 10.9
Fixed deposits 7.9
Cash 1.1
Real estate 0.6
Corporate bonds 0.5
off-shore investments 0.4
other investments (foreign currency) 0.3
total 100%
Note: data are as of the end of 2018.
Source: CmA uganda.
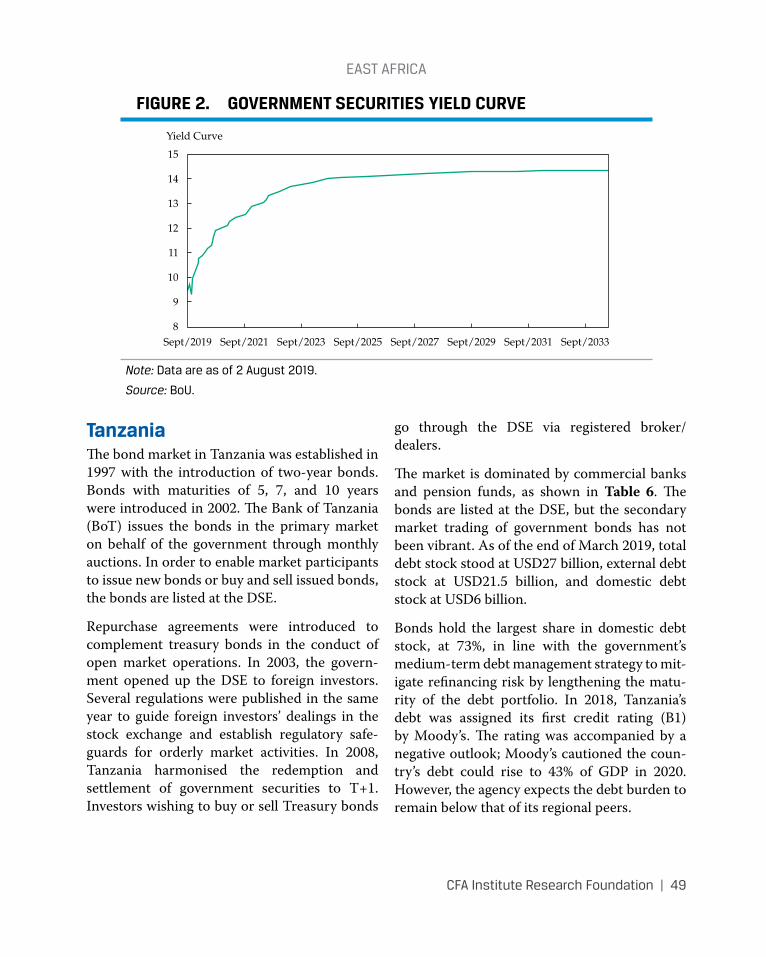
eAst AFRICA
CFA Institute Research Foundation | 49
TanzaniaThe bond market in Tanzania was established in 1997 with the introduction of two-year bonds. Bonds with maturities of 5, 7, and 10 years were introduced in 2002. The Bank of Tanzania (BoT) issues the bonds in the primary market on behalf of the government through monthly auctions. In order to enable market participants to issue new bonds or buy and sell issued bonds, the bonds are listed at the DSE.
Repurchase agreements were introduced to complement treasury bonds in the conduct of open market operations. In 2003, the govern-ment opened up the DSE to foreign investors. Several regulations were published in the same year to guide foreign investors’ dealings in the stock exchange and establish regulatory safe-guards for orderly market activities. In 2008, Tanzania harmonised the redemption and settlement of government securities to T+1. Investors wishing to buy or sell Treasury bonds
go through the DSE via registered broker/dealers.
The market is dominated by commercial banks and pension funds, as shown in Table 6. The bonds are listed at the DSE, but the secondary market trading of government bonds has not been vibrant. As of the end of March 2019, total debt stock stood at USD27 billion, external debt stock at USD21.5 billion, and domestic debt stock at USD6 billion.
Bonds hold the largest share in domestic debt stock, at 73%, in line with the government’s medium-term debt management strategy to mit-igate refinancing risk by lengthening the matu-rity of the debt portfolio. In 2018, Tanzania’s debt was assigned its first credit rating (B1) by Moody’s. The rating was accompanied by a negative outlook; Moody’s cautioned the coun-try’s debt could rise to 43% of GDP in 2020. However, the agency expects the debt burden to remain below that of its regional peers.
FIGURE 2. GOVERNMENT SECURITIES YIELD CURVE
Yield Curve
15
14
13
12
11
10
9
8Sept/2019 Sept/2021 Sept/2023 Sept/2025 Sept/2027 Sept/2029 Sept/2031 Sept/2033
Note: data are as of 2 August 2019.
Source: Bou.
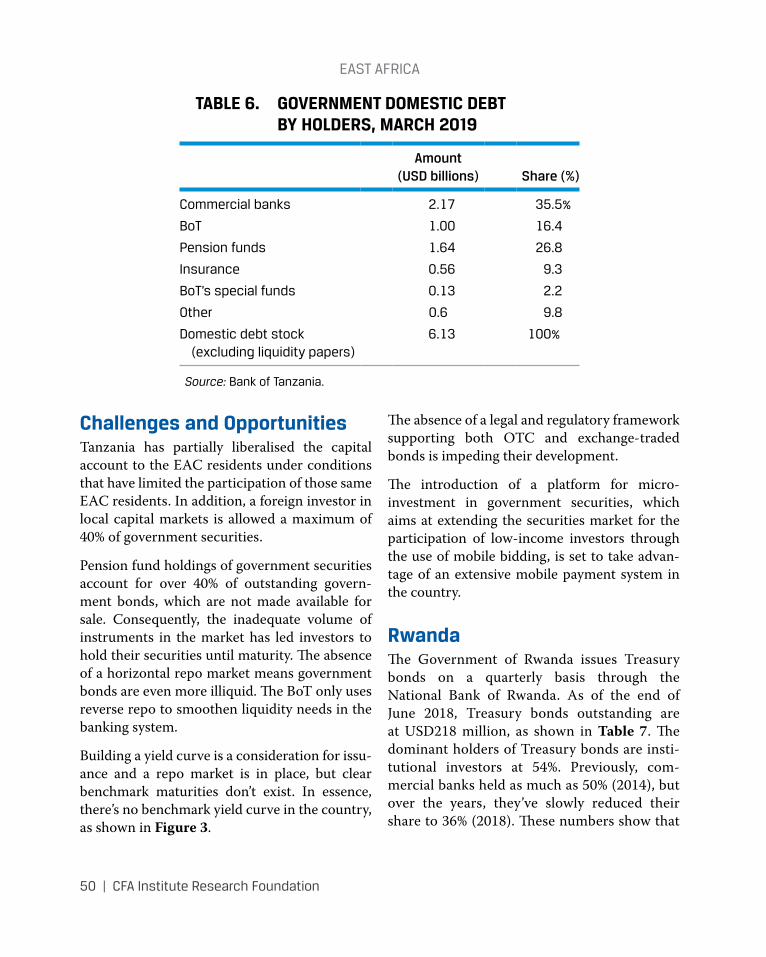
eAst AFRICA
50 | CFA Institute Research Foundation
Challenges and OpportunitiesTanzania has partially liberalised the capital account to the EAC residents under conditions that have limited the participation of those same EAC residents. In addition, a foreign investor in local capital markets is allowed a maximum of 40% of government securities.
Pension fund holdings of government securities account for over 40% of outstanding govern-ment bonds, which are not made available for sale. Consequently, the inadequate volume of instruments in the market has led investors to hold their securities until maturity. The absence of a horizontal repo market means government bonds are even more illiquid. The BoT only uses reverse repo to smoothen liquidity needs in the banking system.
Building a yield curve is a consideration for issu-ance and a repo market is in place, but clear benchmark maturities don’t exist. In essence, there’s no benchmark yield curve in the country, as shown in Figure 3.
The absence of a legal and regulatory framework supporting both OTC and exchange-traded bonds is impeding their development.
The introduction of a platform for micro-investment in government securities, which aims at extending the securities market for the participation of low-income investors through the use of mobile bidding, is set to take advan-tage of an extensive mobile payment system in the country.
RwandaThe Government of Rwanda issues Treasury bonds on a quarterly basis through the National Bank of Rwanda. As of the end of June 2018, Treasury bonds outstanding are at USD218 million, as shown in Table 7. The dominant holders of Treasury bonds are insti-tutional investors at 54%. Previously, com-mercial banks held as much as 50% (2014), but over the years, they’ve slowly reduced their share to 36% (2018). These numbers show that
TABLE 6. GOVERNMENT DOMESTIC DEBT BY HOLDERS, MARCH 2019
Amount (USD billions) Share (%)
Commercial banks 2.17 35.5%
Bot 1.00 16.4
pension funds 1.64 26.8
Insurance 0.56 9.3
Bot’s special funds 0.13 2.2
other 0.6 9.8
domestic debt stock (excluding liquidity papers)
6.13 100%
Source: Bank of tanzania.
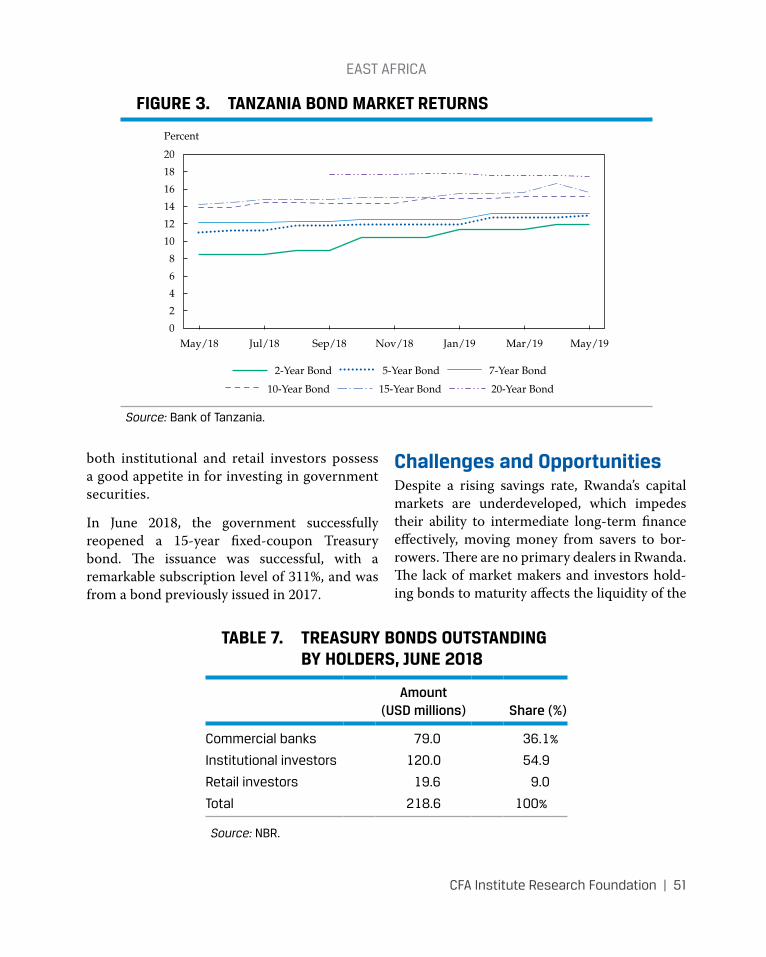
eAst AFRICA
CFA Institute Research Foundation | 51
both institutional and retail investors possess a good appetite in for investing in government securities.
In June 2018, the government successfully reopened a 15-year fixed-coupon Treasury bond. The issuance was successful, with a remarkable subscription level of 311%, and was from a bond previously issued in 2017.
Challenges and OpportunitiesDespite a rising savings rate, Rwanda’s capital markets are underdeveloped, which impedes their ability to intermediate long-term finance effectively, moving money from savers to bor-rowers. There are no primary dealers in Rwanda. The lack of market makers and investors hold-ing bonds to maturity affects the liquidity of the
FIGURE 3. TANZANIA BOND MARKET RETURNS
Percent
20
18
16
14
12
10
8
6
4
2
0May/18 Jul/18 Sep/18 Nov/18 Jan/19 Mar/19 May/19
2-Year Bond 5-Year Bond 7-Year Bond
10-Year Bond 15-Year Bond 20-Year Bond
Source: Bank of tanzania.
TABLE 7. TREASURY BONDS OUTSTANDING BY HOLDERS, JUNE 2018
Amount (USD millions) Share (%)
Commercial banks 79.0 36.1%
Institutional investors 120.0 54.9
Retail investors 19.6 9.0
total 218.6 100%
Source: nBR.
eAst AFRICA
52 | CFA Institute Research Foundation
bonds. Lack of information is also a barrier to investing in the bond market.
Interest earned on fixed-income securities is subject to a 15% withholding tax; a 5% reduc-tion is available on interest earned on Treasury bonds of three years or more.
Corporations are expected to start issuing pri-vate bonds to get long-term financing. While most of the EAC’s bond markets are largely inactive, increased focus on addressing the impediments to the development of the local bond markets is important and welcome.
BANKING AND FINANCEFollowing the signing and ratification of the Common Market Protocol, the EAC Secretariat established the EAC Financial Sector Development and Regionalization Project I (FSDRP I) in collaboration with the World Bank and other development partners. The project development objective is to establish the foun-dation for financial sector integration among EAC partner states.
The higher-level objective of the program is to support the broadening and deepening of the financial sector through the establishment of a single market in financial services among EAC partner states, with a view to making a wide range of financial products and services avail-able to all, at competitive prices.
The FSDRP I has the following six components:
• Component 1. Financial Inclusion and Strengthening Market Participants
• Component 2. Harmonisation of Financial Laws and Regulations
• Component 3. Mutual Recognition of Supervisory Agencies
• Component 4. Integration of Financial Market Infrastructure
• Component 5. Development of the Regional Bond Market
• Component 6. Capacity Building
The banking sector is playing a major role in propelling regional financial integration in the region by adopting a regional business model motivated by a range of factors, including client demand and opportunities perceived along the regional trade corridors.
Kenya leads the region with the largest banking industry. Its commercial banking sector is the fourth largest in sub-Saharan Africa, after South Africa, Nigeria, and Mauritius. It is followed by Tanzania, Uganda, Rwanda, and then Burundi. The region’s banking sector has undergone a huge transformation in the last 19 years, having recorded cross-border expansion since the 2000s.
At the end of 2012, Kenyan banks had set up a substantial branch network with 251 branches in the EAC (including 31 branches in South Sudan). A total of 11 multinational and Kenyan-owned banks are performing cross-border banking business in the EAC. Top Kenyan banks with operations in the region include Kenya Commercial Bank (KCB), Diamond Trust Bank, Equity Bank, Commercial Bank of Africa, and Co-Operative Bank.
KenyaKenya is arguably the strongest economy in the region; its financial sector is considered the third largest in sub-Saharan Africa. The coun-try’s financial sector has been characterised by the adoption of technology, the emergence of alternative channels of distribution, increased financial inclusion levels, and a stable regulatory environment—all of which have driven growth.
eAst AFRICA
CFA Institute Research Foundation | 53
The country’s banking sector remains a key con-tributor to economic growth and job creation. The government remains focused on creating a lively and globally competitive financial sector under its ambitious Vision 2030.
Kenya has 42 commercial banks and one mort-gage financing institution. The sector has had its fair share of turbulence in recent years, even as the Central Bank of Kenya (CBK) has continued to institute sound governance and adopt global standards.
International Financial Reporting Standard (IFRS) 9 came into effect on 1 January 2018 and saw the country move from the previous provisions for accounting purposes guided by International Accounting Standard (IAS) 39. In August 2017, the CBK issued a Guidance Note on Cybersecurity “to all commercial banks and mortgage finance companies that outlines the minimum requirements for banks to enhance their cyber risks framework.
“The banking sector is projected to remain sta-ble and sustain its growth momentum in 2018 as the outcomes of various reform initiatives in the banking sector start to manifest.
“Some of the reforms and initiatives planned include;
• review of the legal and regulatory frame-works for institutions licensed under the Banking Act.
• development of a pricing index of cost of banking services and products.
• review of emerging disruptive technol-ogy such as distributed ledger technology, cloud computing and artificial intelligence and formulating appropriate regulatory responses to emerging risks from these technologies” (Central Bank of Kenya, Bank Supervision Annual Report 2017, p. XI).
Current key challenges in the sector include interest rate caps, which restrict commercial lending rates at four percentage points above the CBK rate, and regulation addressing banks profiling SMEs and individuals as high-risk bor-rowers, denying them credit.
Mergers and acquisitions are expected to con-tinue, with the latest being the NIC Bank merger with Commercial Bank of Africa and the Kenya Commercial Bank move on the National Bank of Kenya.
On 1 June 2019, the CBK launched the country’s new generation banknotes, which, apart from meeting constitutional requirements, appear to be taming corruption in the country. The aim is to prevent holders of looted cash from deposit-ing the older notes, while preventing them from exchanging notes.
Kenya remains a pioneer in the fintech space in the region and the continent at large. Renowned globally as a pioneer in mobile money through the M-Pesa platform, the country continues to command attention in financial technology innovations. This characterisation is supported by the high mobile penetration, which has sur-passed 100%; active customer subscriptions stand at 46.6 million.
Over 38 fintech companies have been estab-lished in the country as they seek a piece of the vibrant fintech market. The capital, Nairobi, is a hub, and digital technologies are rapidly growing in terms of both providing solutions in credit availability and enabling small businesses to access loans, as well as allowing individuals to invest via mobile digital solutions.
Kenya has embraced the blockchain and arti-ficial intelligence (AI) technologies that have been identified as effective tools to curb corrup-tion, land fraud, and election disputes. The gov-ernment has expressed confidence that the two
eAst AFRICA
54 | CFA Institute Research Foundation
instruments will help increase the level of integ-rity, security, and reliability for the information it manages, reducing the risks associated with having a single point of failure.
Kenyan pension fund assets stood at USD11.3 billion as of June 2018, as shown by the Retirement Benefits Authority (RBA) data. The country remains focused on growing the sector. The bulk of the investments (93%) are still in traditional asset classes of fixed income and equities. There are, however, concerns over scarcity of innovative alternative investment vehicles; pension schemes have thus tended to overinvest in fewer asset classes.
Investment opportunities remain high in such segments as energy, private equity, affordable housing, and infrastructure projects.
TanzaniaTanzania is the second-largest economy in the EAC and the tenth-largest in Africa. The country is largely dependent on agriculture for employment, accounting for about half of the employed workforce. The country embarked on financial liberalisation 27 years ago (1992) to sustain its economic growth. This liberalisation has included mobilisation of financial resources, increased competition in the financial market, and enhanced quality and efficiency in credit allocation. As a result, the sector has been booming, particularly during the last few years.
With a total of 56 licensed banks and other non-banking financial institutions, the country’s banking industry continues to show resilience. The market is dominated by a few big players, despite several small banks commanding a siz-able share of the market. Currently, about 40 local and foreign private commercial banks are registered with the Bank of Tanzania, the coun-try’s central bank. The sector has witnessed the
privatisation of local state-owned banks, but the government maintains minority shares in CRDB Bank, National Bank of Commerce (NBC Tanzania), and National Microfinance Bank (NMB), among others.
Interest rates vary between 17.2% and 18.3% for large and personal loans, with an average of 11.14%. The high interest rates in a liberalised market are pegged on the risk associated with consumer credit fraud. In the past few years, the sector has faced challenges of poor lending poli-cies and overexposure, especially in a faltering real estate sector. Other challenges are a high number of non-performing loans (NPLs) and lack of capital buffers in some institutions.
In 2018, the BoT suspended five banks from trading in the interbank foreign exchange mar-ket for breaching regulatory rules. A number of reforms are being implemented, including requiring TZS1 billion (USD435,175) capital to operate a currency exchange.
To tame NPLs, the BoT is counting on the mini-mum core and total capital ratios, which have been raised to 10% and 12%, respectively. Banks and financial institutions are also required to hold an additional capital conservation buffer of 2.5% of risk-weighted assets and off-balance-sheet exposures. These measures, combined with some cost-cutting measures, are expected to continue strengthening the country’s banking sector.
Like her neighbour Kenya, Tanzania has been embracing financial technology, which contin-ues to deepen financial inclusion in the country. Fintech and mobile money remain strong driv-ers of the economy. Challenges in the fintech sector include lack of resources, lack of infra-structure, and low financial literacy.
The performance of pension schemes remains low, which has led the government push to
eAst AFRICA
CFA Institute Research Foundation | 55
merge its seven social security funds into two schemes—namely, the Public Service Social Security Fund and the National Social Security Fund (NSSF). The government currently restricts any foreign entities from entering this arena and heavily regulates this sector because it is dependent on future recipients. The pen-sion funds have been scrutinised under the Public Service Social Security Fund Act (2018), which now holds a total of TZS5.518 trillion (approximately USD2.2 billion) in assets.
UgandaThe country’s financial sector is made of for-mal, semiformal, and informal institutions. The formal institutions include banks, microfinance deposit-taking institutions, credit institutions, insurance companies, development banks, pen-sion funds, and capital markets.
The Ugandan financial sector is relatively well developed and has remained resilient to both internal and external shocks. About 47% of Ugandans have financial services accounts, with mobile money playing a critical role in financial inclusion. About 43% of the adult population has a mobile money account. The major challenge that remains is the fact that 76% of Ugandan adults live in rural areas. Financial institutions find it difficult to penetrate these areas, mainly because of lack of incentives and an inability to mitigate perceived operational risks. The major-ity of the population also lacks disposable cash; about 48% of Ugandan adults rely on farming and fishing activities for money.
Uganda’s banking sector is composed of 25 commercial banks, one development bank, and several micro-deposit and credit deposit institutions. Most of Uganda’s largest com-mercial banks are foreign owned. The BoU has been leading a national Financial Inclusion Project to increase access to financial services
and empower the users of financial services. Banks have been forced to innovate into mobile money services and agency banking because many people prefer mobile money transactions to formal bank accounts. This shift has helped its population address rational financial deci-sions and contribute to economic growth. The current challenge in the banking sector includes how to strengthen bank lending to the private sector, reduce lending interest rates in a finan-cially sustainable manner, and reduce high operating costs.
The penetration of financial technology remains steady, with new partnerships between fintech companies and banks driving the growth of the sector. There are at least 50 fintech com-panies in the country. The government is keen to tap into the blockchain technology to drive economic growth. Areas targeted include agri-culture, manufacturing and processing, service sectors, and information and communications technology.
Uganda’s pension system is over 80 years old, having started in 1935 with the establishment of the public service pension scheme. The sector, however, covers less than 10% of the popula-tion. Uganda Retirement Benefits Regulatory Authority (URBRA) has been pushing for regu-latory frameworks suitable for workers in the informal sector with the aim of introducing retirement savings arrangements that consider cash flow needs, income seasonality, compe-tition for spending priorities, and alternative investment options.
RwandaAs a developing country, Rwanda has experi-enced rapid industrialisation owing to successful government policy. An economic boom start-ing in the early 2000s has improved the living standards of many Rwandans. The progressive
eAst AFRICA
56 | CFA Institute Research Foundation
goals of the government have inspired the rapid transformation.
The country’s financial sector is dominated by commercial banks and microfinance institu-tions, such as savings and credit cooperatives (SACCOs), insurance companies, and pension funds. The government has been keen to reform the sector, with great progress made toward modernisation. The financial sector can be described as stable, well capitalised, profitable, and liquid. The banking sector dominates the financial system at 65.5%, followed by pension, insurance, and microfinance with 18.1%, 9.8%, and 6.6%, respectively.
Rwanda’s priorities are to increase long-term savings under its Financial Sector Development Programme, as well as enable greater savings via pension schemes so that credit availability to the private sector is attained. To achieve this goal, there are efforts to enhance the savings culture and the mobilisation of long-term capital for investment. The government has received back-ing from the World Bank and IMF to reform the sector in a program outlined in a policy frame-work paper24 that stresses a greater reliance on market forces and the private sector, as well as a more export-oriented development approach. Growth potential for the sector remains strong, despite only 42% of the population engaging in the formal financial system.
Rwanda has 11 commercial banks comple-mented by numerous microfinance institutions and rural savings and credit cooperatives. The sector is regulated by the National Bank of
24IMF, “Rwanda: Tenth Review under the Policy Support Instrument—Press Release; Staff Report; and Statement by the Executive Director for Rwanda,” International Monetary Fund Country Report No. 18/335 (30 November 2018): 44. www.imf.org/en/Publications/CR/Issues/2018/11/30/Rwanda-Tenth-Review-Under-the-Policy-Support-Instrument-Press-Release-Staff-Report-and-46407.
Rwanda. Access to affordable credit remains a big challenge in Rwanda, which is marked by a high interest rate regime with lenders extend-ing predominantly short-term loans. The poor savings culture, limited rural access to banking products and services, and low incomes (i.e., low savings) also remain a challenge.
Another challenge, with Rwanda’s small and underdeveloped capital market, is the country’s inability to mobilise long-term stable financing to enable public and private sector access to long-term financing.
About 30% of the Rwandan population has no access to finance and is financially excluded. The country needs a supportive infrastructure—including the expansion of electronic payment systems for credit and debit cards, ATMs, and point-of-sale terminals—as well as harmonisa-tion and integration among supportive pillars for the payment and settlement systems with the EAC partner states. The state is counting on a private credit reference agency, which is in place to improve access to credit.
Opportunities are in the development of com-mercial bank products and services, particu-larly in rural areas; competitive loan facilities; agricultural products and services financing; mortgage financing; and investment banking services, among others.
The pension market is characterised by low penetration; only about 10% of the population is covered. Mainly, the public and private sec-tor salaried workers are covered via the govern-ment’s Rwanda Social Security Board’s defined benefit programme. Those lacking coverage are mainly non-salaried workers because the exist-ing scheme targets public servants. Those who are self-employed participate on a voluntary basis. The government is, however, keen to revitalise the sector with the support of a draft
eAst AFRICA
CFA Institute Research Foundation | 57
law because it guides more people to pension schemes.
Growth of the financial technology sector remains steady in Rwanda, thanks to the devel-opment of a fintech hub in the country. The hub features a co-working space for fintech businesses, and acceleration programs sup-porting technology entrepreneurs have helped drive the sector’s growth. With Rwanda boast-ing the second-highest use of mobiles in Africa and more than 50% of the population being unique subscribers, the fintech sector has a bright future. The sector will continue driv-ing the country’s agenda of financial inclusion, mainly by bringing on board the unbanked in rural areas.
Like its EAC partners, Rwanda has embraced developments in the blockchain technology, with a key focus on tracing its minerals—mainly tantalum, which it leads globally in producing. The country is also counting on the blockchain to drive growth of businesses and the economy at large. Sectors targeted for growth using the blockchain include finance, banking, travel, medical, and emerging markets.
BurundiThe mainstay of the Burundian economy is agri-culture, accounting for 32.9% of GDP in 2008. Agriculture supports more than 70% of the labour force, the majority of whom are subsis-tence farmers.
Burundi has a relatively small, developing financial sector dominated by banking institu-tions that control over 75% of total economy assets. There are nine commercial banks, two semi-governmental institutions, 11 insurance business companies, 26 microfinance insti-tutions, and the National Bank of Economic Development (BNDE).
The country is yet to put in place a stock market to mobilise savings for investment. Its central bank, la Banque de la République du Burundi (BRB), issues 91‐day Treasury bills to manage liquidity within the sector. Plans have, however, been underway to establish a securities exchange to support companies’ fundraising in the wake of a slowdown in commercial bank lending.
The national pension system (INSS) covers only 5% of the people and accounts for about 5% of total financial assets.

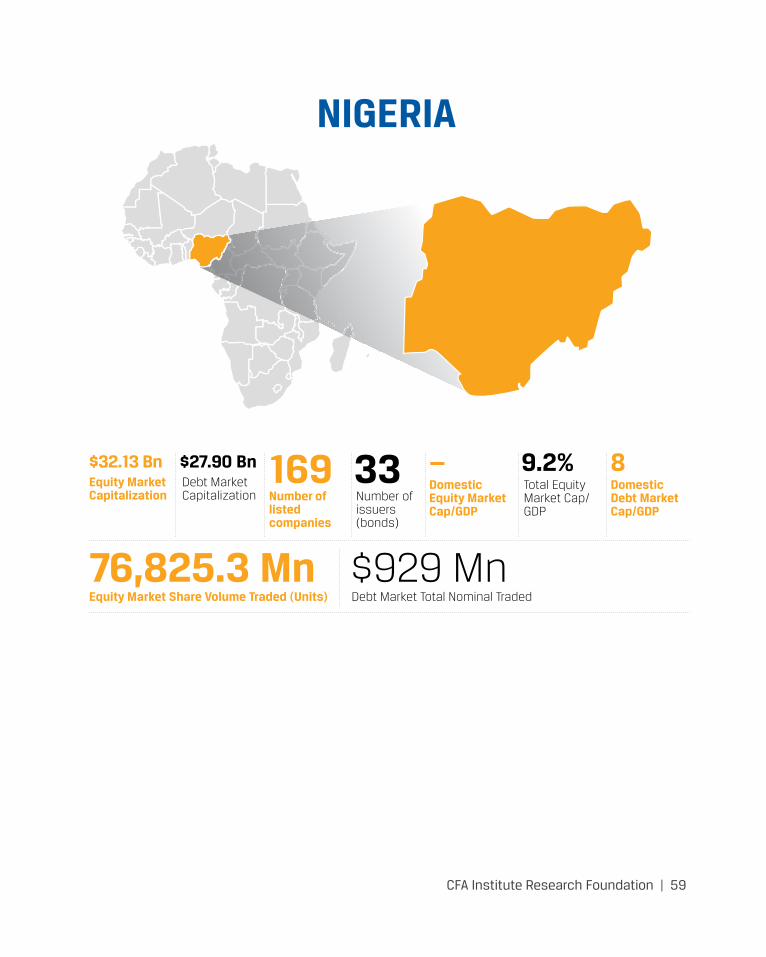
CFA Institute Research Foundation | 59
NIGERIA
Equity Market Capitalization
Equity Market Share Volume Traded (Units)
Debt Market Capitalization
Debt Market Total Nominal Traded
Number of issuers (bonds)
Total Equity Market Cap/GDP
Number of listed companies
Domestic Equity Market Cap/GDP
Domestic Debt Market Cap/GDP
$32.13 Bn
76,825.3 Mn
169 — 8$27.90 Bn
$929 Mn
33 9.2%
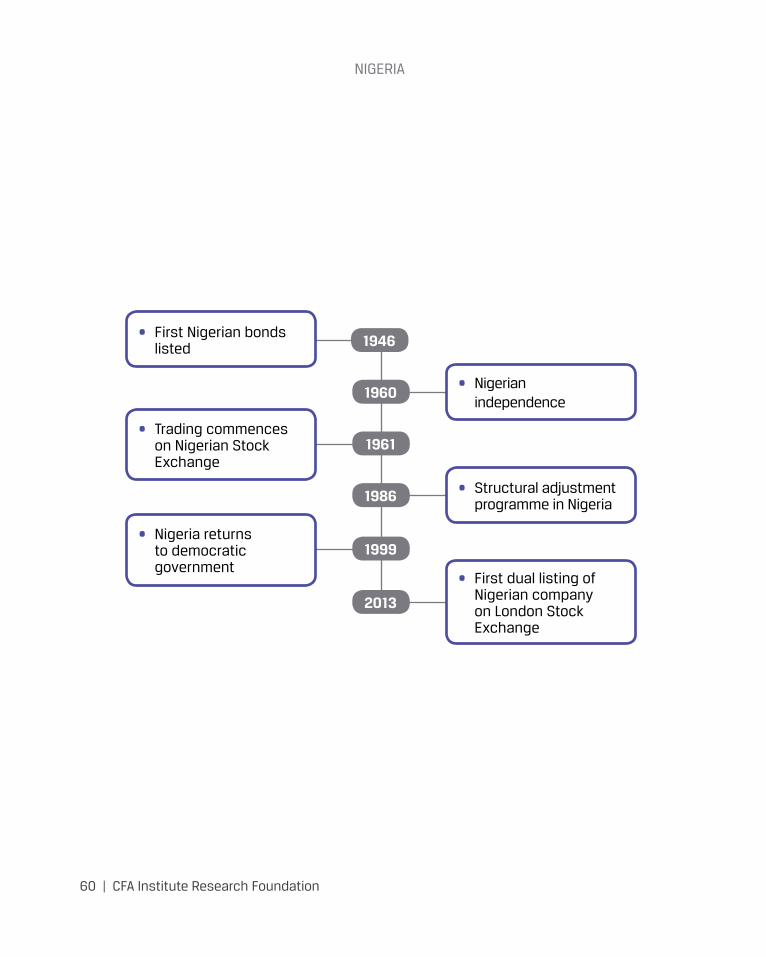
nIgeRIA
60 | CFA Institute Research Foundation
1946
1960
1961
1999
1986
2013
• First Nigerian bonds listed
• Nigerian independence
• Structural adjustment programme in Nigeria
• First dual listing of Nigerian company on London Stock Exchange
• Trading commences on Nigerian Stock Exchange
• Nigeria returns to democratic government
CFA Institute Research Foundation | 61
NIGERIADave Uduanu, CFACEO, Sigma Pensions limited Nigeria
The history of capital market activity in Nigeria dates back to pre-independence with the issu-ance of bonds by the British colonial author-ity to fund construction projects in 1946. Thereafter, more regular sales of government bonds and Treasury bills occurred in the lead-up to Nigeria’s independence in 1960. Though a latecomer compared with the fixed-income market, the equity market commenced with the promulgation of the Lagos Stock Exchange Act (later renamed the Nigerian Stock Exchange) in 1960. Actual stock market trading would begin in 1961 with 19 listed securities and four market dealers. As with the rest of the world, where developments in the capital markets tend to mirror events in the wider economy, the evolution of Nigeria’s debt and equity markets reflected the cross-currents across the political and economic environments.
At independence, Nigeria’s policy framework was largely inward looking with emphasis on reducing British influence over large parts of the economy. This desire resulted in the pas-sage of the Exchange Control Act (1962) and indigenisation decrees (1972), which limited foreign participation in the stock market. Despite the country’s modest budget deficits, which should have tolerated the development of a vibrant bond market, the absence of insti-tutional savings mechanisms meant that there was no viable buyer for government debt. This situation resulted in increased reliance on cen-tral bank financing of these deficits, which crowded out private sector borrowing activity.
However, following the slump in crude oil prices in the early 1980s, Nigeria’s policy environment transformed with the 1986 adoption of a struc-tural adjustment programme (SAP) that called for a liberalisation of the economy, advised by the International Monetary Fund (IMF). The post-1986 SAP era saw the repeal of inward-looking laws, such as indigenisation decrees and exchange control, as well as significant privati-sation of public corporations, which induced a wave of stock market listings in the 1990s. The period also witnessed the introduction of a depository system and deregulated secondary market pricing of securities. For debt markets, while there were some fiscal reforms under the SAP era, central bank financing of budget defi-cits remained large, which curtailed the devel-opment of a liquid bond market.
Following the restoration of democratic rule in 1999 and renewed impetus for liberal eco-nomic policy reform aimed at attracting local or foreign private capital, Nigeria’s capital mar-kets entered a new era of growth (see Table 1). Key economic policy initiatives, which created domestic institutional savings pools (with the pension reform in 2004 and consolidation of the banking sector in 2005), alongside the creation of a debt management office in 2005 and caps on deficit financing from the central bank, pro-vided a clear framework for the development of a liquid OTC debt market. At the end of 2018, the Nigerian Stock Exchange (NSE) was made up of 169 stocks, nine exchange-traded prod-ucts, five REITs, and 130 bonds. Today, the NSE
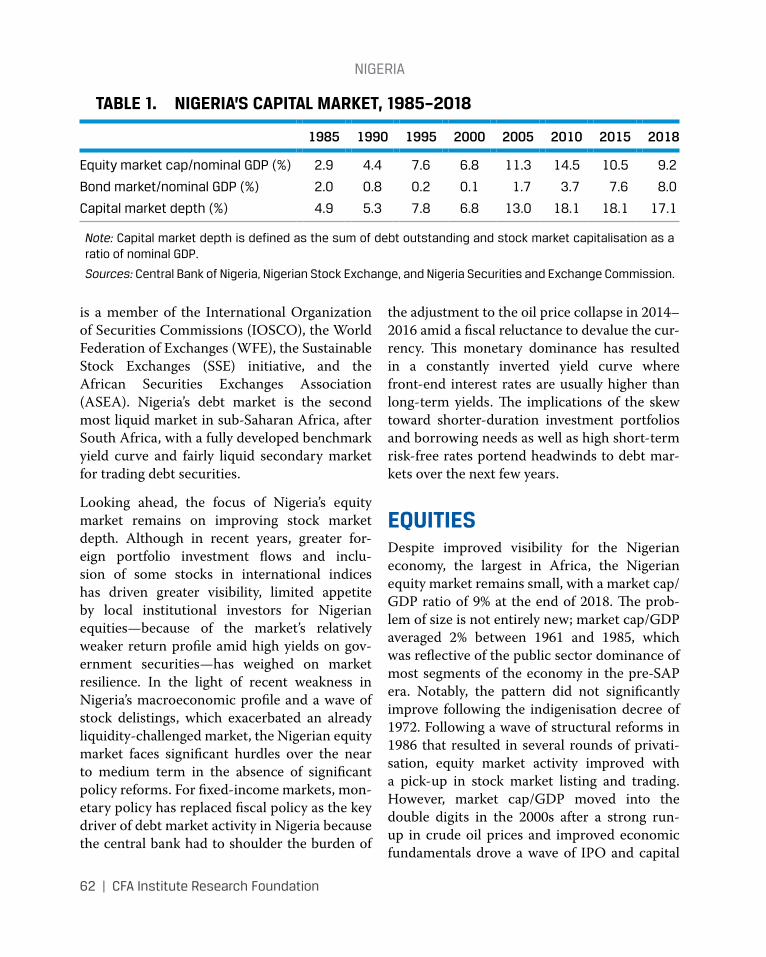
nIgeRIA
62 | CFA Institute Research Foundation
is a member of the International Organization of Securities Commissions (IOSCO), the World Federation of Exchanges (WFE), the Sustainable Stock Exchanges (SSE) initiative, and the African Securities Exchanges Association (ASEA). Nigeria’s debt market is the second most liquid market in sub-Saharan Africa, after South Africa, with a fully developed benchmark yield curve and fairly liquid secondary market for trading debt securities.
Looking ahead, the focus of Nigeria’s equity market remains on improving stock market depth. Although in recent years, greater for-eign portfolio investment flows and inclu-sion of some stocks in international indices has driven greater visibility, limited appetite by local institutional investors for Nigerian equities—because of the market’s relatively weaker return profile amid high yields on gov-ernment securities—has weighed on market resilience. In the light of recent weakness in Nigeria’s macroeconomic profile and a wave of stock delistings, which exacerbated an already liquidity-challenged market, the Nigerian equity market faces significant hurdles over the near to medium term in the absence of significant policy reforms. For fixed-income markets, mon-etary policy has replaced fiscal policy as the key driver of debt market activity in Nigeria because the central bank had to shoulder the burden of
the adjustment to the oil price collapse in 2014–2016 amid a fiscal reluctance to devalue the cur-rency. This monetary dominance has resulted in a constantly inverted yield curve where front-end interest rates are usually higher than long-term yields. The implications of the skew toward shorter-duration investment portfolios and borrowing needs as well as high short-term risk-free rates portend headwinds to debt mar-kets over the next few years.
EQUITIESDespite improved visibility for the Nigerian economy, the largest in Africa, the Nigerian equity market remains small, with a market cap/GDP ratio of 9% at the end of 2018. The prob-lem of size is not entirely new; market cap/GDP averaged 2% between 1961 and 1985, which was reflective of the public sector dominance of most segments of the economy in the pre-SAP era. Notably, the pattern did not significantly improve following the indigenisation decree of 1972. Following a wave of structural reforms in 1986 that resulted in several rounds of privati-sation, equity market activity improved with a pick-up in stock market listing and trading. However, market cap/GDP moved into the double digits in the 2000s after a strong run-up in crude oil prices and improved economic fundamentals drove a wave of IPO and capital
TABLE 1. NIGERIA’S CAPITAL MARKET, 1985–2018
1985 1990 1995 2000 2005 2010 2015 2018
equity market cap/nominal gdp (%) 2.9 4.4 7.6 6.8 11.3 14.5 10.5 9.2
Bond market/nominal gdp (%) 2.0 0.8 0.2 0.1 1.7 3.7 7.6 8.0
Capital market depth (%) 4.9 5.3 7.8 6.8 13.0 18.1 18.1 17.1
Note: Capital market depth is defined as the sum of debt outstanding and stock market capitalisation as a ratio of nominal gdp.
Sources: Central Bank of nigeria, nigerian stock exchange, and nigeria securities and exchange Commission.
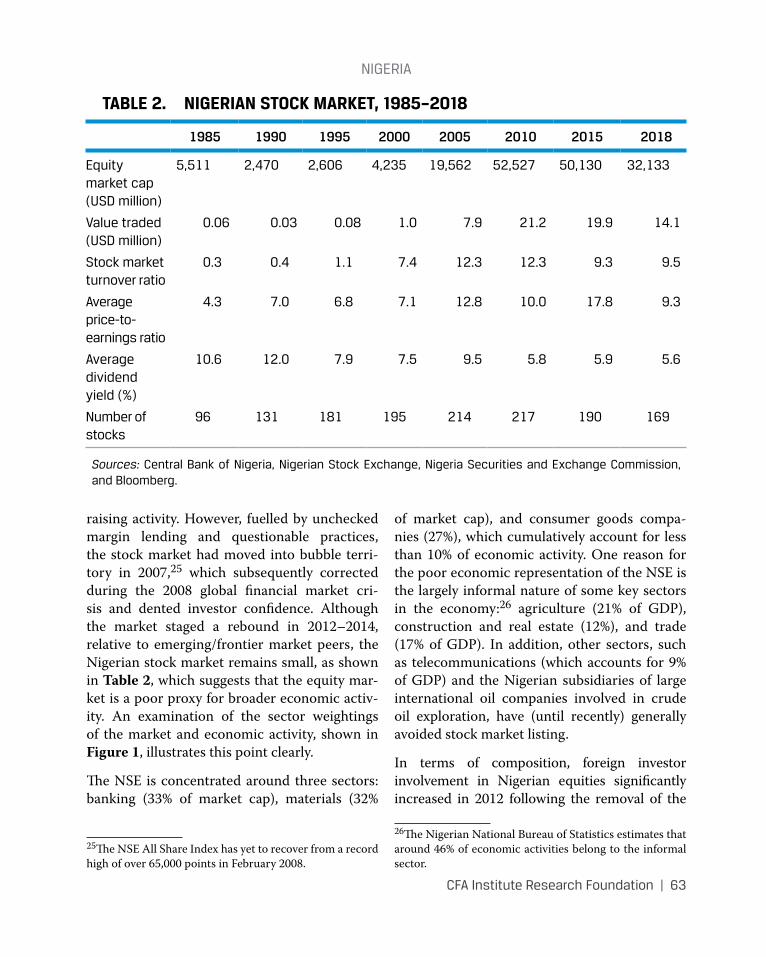
nIgeRIA
CFA Institute Research Foundation | 63
raising activity. However, fuelled by unchecked margin lending and questionable practices, the stock market had moved into bubble terri-tory in 2007,25 which subsequently corrected during the 2008 global financial market cri-sis and dented investor confidence. Although the market staged a rebound in 2012–2014, relative to emerging/frontier market peers, the Nigerian stock market remains small, as shown in Table 2, which suggests that the equity mar-ket is a poor proxy for broader economic activ-ity. An examination of the sector weightings of the market and economic activity, shown in Figure 1, illustrates this point clearly.
The NSE is concentrated around three sectors: banking (33% of market cap), materials (32%
25The NSE All Share Index has yet to recover from a record high of over 65,000 points in February 2008.
of market cap), and consumer goods compa-nies (27%), which cumulatively account for less than 10% of economic activity. One reason for the poor economic representation of the NSE is the largely informal nature of some key sectors in the economy:26 agriculture (21% of GDP), construction and real estate (12%), and trade (17% of GDP). In addition, other sectors, such as telecommunications (which accounts for 9% of GDP) and the Nigerian subsidiaries of large international oil companies involved in crude oil exploration, have (until recently) generally avoided stock market listing.
In terms of composition, foreign investor involvement in Nigerian equities significantly increased in 2012 following the removal of the
26The Nigerian National Bureau of Statistics estimates that around 46% of economic activities belong to the informal sector.
TABLE 2. NIGERIAN STOCK MARKET, 1985–2018
1985 1990 1995 2000 2005 2010 2015 2018
equity market cap (usd million)
5,511 2,470 2,606 4,235 19,562 52,527 50,130 32,133
Value traded (usd million)
0.06 0.03 0.08 1.0 7.9 21.2 19.9 14.1
stock market turnover ratio
0.3 0.4 1.1 7.4 12.3 12.3 9.3 9.5
Average price-to-earnings ratio
4.3 7.0 6.8 7.1 12.8 10.0 17.8 9.3
Average dividend yield (%)
10.6 12.0 7.9 7.5 9.5 5.8 5.9 5.6
number of stocks
96 131 181 195 214 217 190 169
Sources: Central Bank of nigeria, nigerian stock exchange, nigeria securities and exchange Commission, and Bloomberg.
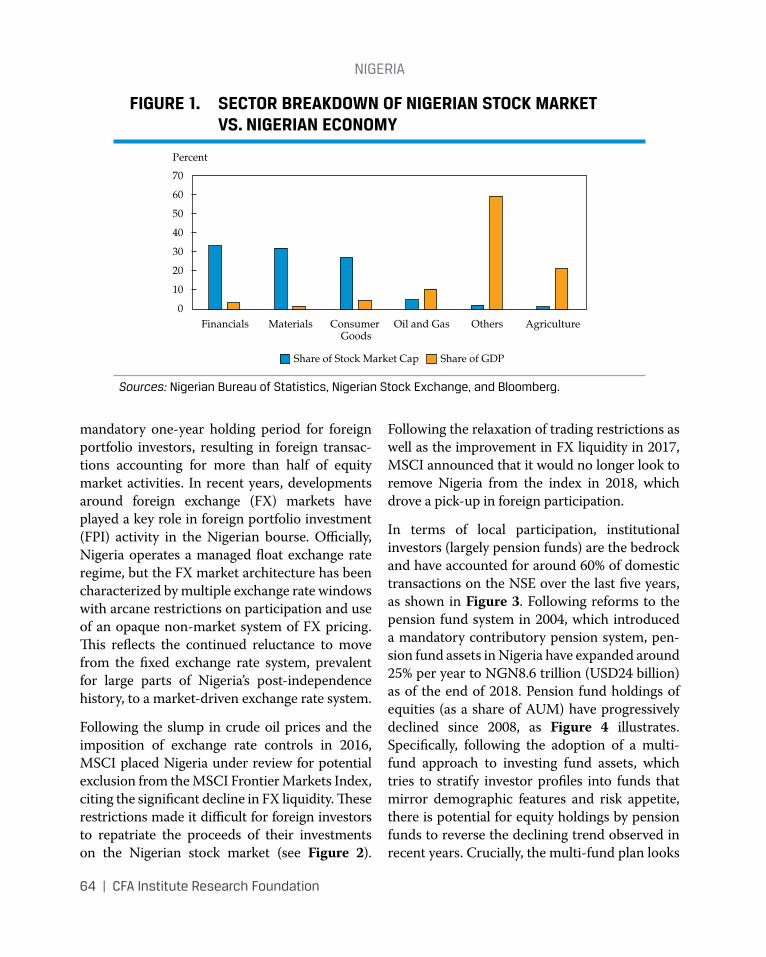
nIgeRIA
64 | CFA Institute Research Foundation
mandatory one-year holding period for foreign portfolio investors, resulting in foreign transac-tions accounting for more than half of equity market activities. In recent years, developments around foreign exchange (FX) markets have played a key role in foreign portfolio investment (FPI) activity in the Nigerian bourse. Officially, Nigeria operates a managed float exchange rate regime, but the FX market architecture has been characterized by multiple exchange rate windows with arcane restrictions on participation and use of an opaque non-market system of FX pricing. This reflects the continued reluctance to move from the fixed exchange rate system, prevalent for large parts of Nigeria’s post-independence history, to a market-driven exchange rate system.
Following the slump in crude oil prices and the imposition of exchange rate controls in 2016, MSCI placed Nigeria under review for potential exclusion from the MSCI Frontier Markets Index, citing the significant decline in FX liquidity. These restrictions made it difficult for foreign investors to repatriate the proceeds of their investments on the Nigerian stock market (see Figure 2).
Following the relaxation of trading restrictions as well as the improvement in FX liquidity in 2017, MSCI announced that it would no longer look to remove Nigeria from the index in 2018, which drove a pick-up in foreign participation.
In terms of local participation, institutional investors (largely pension funds) are the bedrock and have accounted for around 60% of domestic transactions on the NSE over the last five years, as shown in Figure 3. Following reforms to the pension fund system in 2004, which introduced a mandatory contributory pension system, pen-sion fund assets in Nigeria have expanded around 25% per year to NGN8.6 trillion (USD24 billion) as of the end of 2018. Pension fund holdings of equities (as a share of AUM) have progressively declined since 2008, as Figure 4 illustrates. Specifically, following the adoption of a multi-fund approach to investing fund assets, which tries to stratify investor profiles into funds that mirror demographic features and risk appetite, there is potential for equity holdings by pension funds to reverse the declining trend observed in recent years. Crucially, the multi-fund plan looks
FIGURE 1. SECTOR BREAKDOWN OF NIGERIAN STOCK MARKET VS. NIGERIAN ECONOMY
Percent
70
60
50
40
30
20
10
0MaterialsFinancials Oil and GasConsumer
GoodsOthers Agriculture
Share of Stock Market Cap Share of GDP
Sources: nigerian Bureau of statistics, nigerian stock exchange, and Bloomberg.
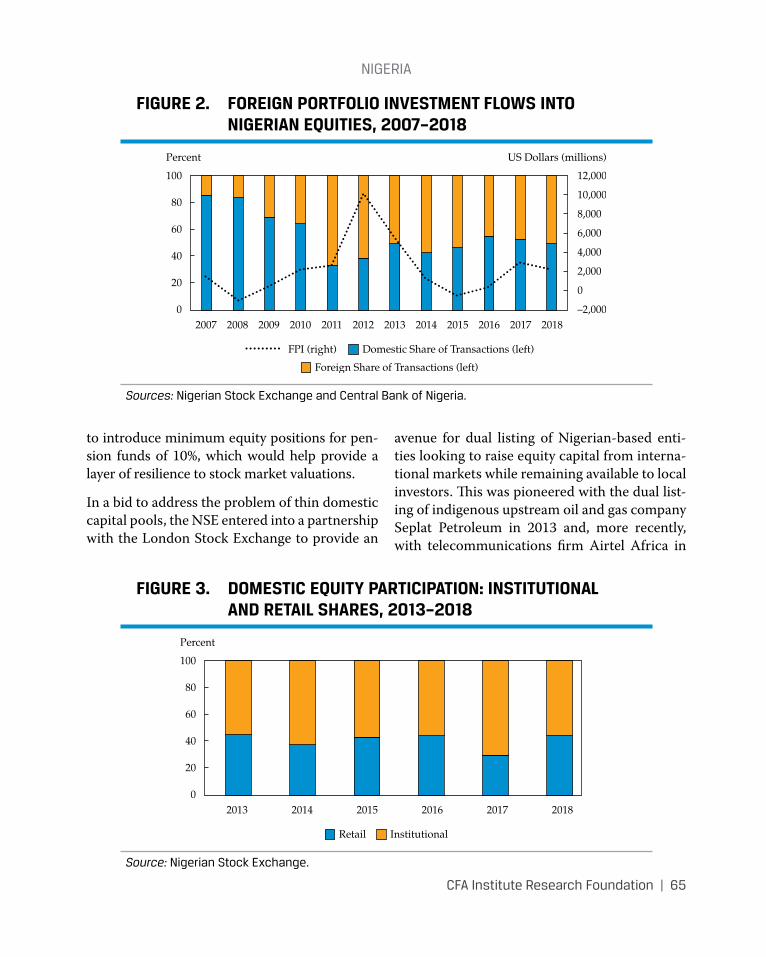
nIgeRIA
CFA Institute Research Foundation | 65
to introduce minimum equity positions for pen-sion funds of 10%, which would help provide a layer of resilience to stock market valuations.
In a bid to address the problem of thin domestic capital pools, the NSE entered into a partnership with the London Stock Exchange to provide an
avenue for dual listing of Nigerian-based enti-ties looking to raise equity capital from interna-tional markets while remaining available to local investors. This was pioneered with the dual list-ing of indigenous upstream oil and gas company Seplat Petroleum in 2013 and, more recently, with telecommunications firm Airtel Africa in
FIGURE 2. FOREIGN PORTFOLIO INVESTMENT FLOWS INTO NIGERIAN EQUITIES, 2007–2018
2010200920082007 20122011 20152014 201820172013 2016
Percent
100
80
60
40
20
0
US Dollars (millions)
12,000
10,000
8,000
6,000
4,000
2,000
0
–2,000
FPI (right) Domestic Share of Transactions (left)
Foreign Share of Transactions (left)
Sources: nigerian stock exchange and Central Bank of nigeria.
FIGURE 3. DOMESTIC EQUITY PARTICIPATION: INSTITUTIONAL AND RETAIL SHARES, 2013–2018
20152014 201820172013 2016
Percent
100
80
60
40
20
0
Retail Institutional
Source: nigerian stock exchange.
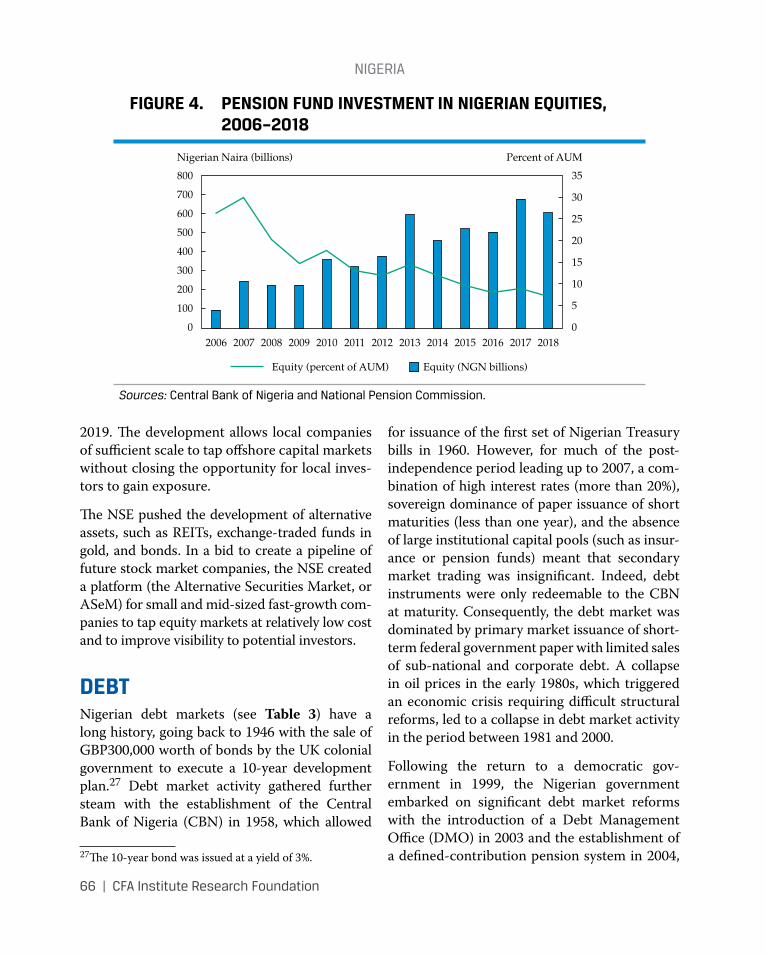
nIgeRIA
66 | CFA Institute Research Foundation
2019. The development allows local companies of sufficient scale to tap offshore capital markets without closing the opportunity for local inves-tors to gain exposure.
The NSE pushed the development of alternative assets, such as REITs, exchange-traded funds in gold, and bonds. In a bid to create a pipeline of future stock market companies, the NSE created a platform (the Alternative Securities Market, or ASeM) for small and mid-sized fast-growth com-panies to tap equity markets at relatively low cost and to improve visibility to potential investors.
DEBTNigerian debt markets (see Table 3) have a long history, going back to 1946 with the sale of GBP300,000 worth of bonds by the UK colonial government to execute a 10-year development plan.27 Debt market activity gathered further steam with the establishment of the Central Bank of Nigeria (CBN) in 1958, which allowed
27The 10-year bond was issued at a yield of 3%.
for issuance of the first set of Nigerian Treasury bills in 1960. However, for much of the post-independence period leading up to 2007, a com-bination of high interest rates (more than 20%), sovereign dominance of paper issuance of short maturities (less than one year), and the absence of large institutional capital pools (such as insur-ance or pension funds) meant that secondary market trading was insignificant. Indeed, debt instruments were only redeemable to the CBN at maturity. Consequently, the debt market was dominated by primary market issuance of short-term federal government paper with limited sales of sub-national and corporate debt. A collapse in oil prices in the early 1980s, which triggered an economic crisis requiring difficult structural reforms, led to a collapse in debt market activity in the period between 1981 and 2000.
Following the return to a democratic gov-ernment in 1999, the Nigerian government embarked on significant debt market reforms with the introduction of a Debt Management Office (DMO) in 2003 and the establishment of a defined-contribution pension system in 2004,
FIGURE 4. PENSION FUND INVESTMENT IN NIGERIAN EQUITIES, 2006–2018
2010200920082006 2007 20122011 20152014 201820172013 2016
Nigerian Naira (billions)
800
700
600
500
400
300
200
100
0
Percent of AUM
35
30
25
20
15
10
5
0
Equity (percent of AUM) Equity (NGN billions)
Sources: Central Bank of nigeria and national pension Commission.
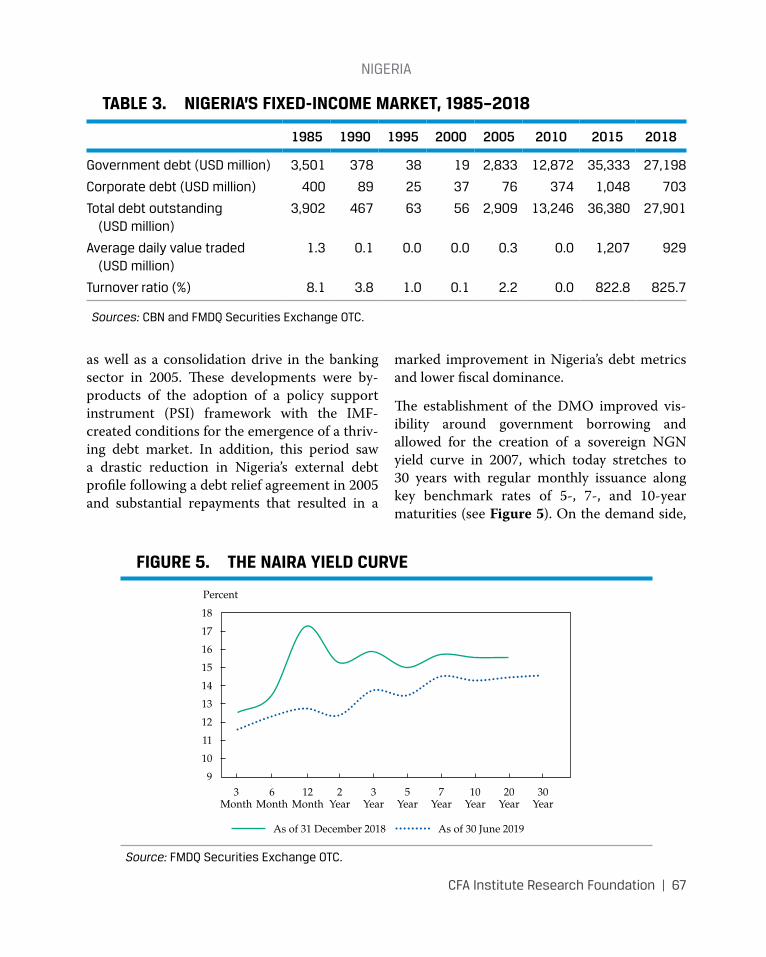
nIgeRIA
CFA Institute Research Foundation | 67
as well as a consolidation drive in the banking sector in 2005. These developments were by-products of the adoption of a policy support instrument (PSI) framework with the IMF-created conditions for the emergence of a thriv-ing debt market. In addition, this period saw a drastic reduction in Nigeria’s external debt profile following a debt relief agreement in 2005 and substantial repayments that resulted in a
marked improvement in Nigeria’s debt metrics and lower fiscal dominance.
The establishment of the DMO improved vis-ibility around government borrowing and allowed for the creation of a sovereign NGN yield curve in 2007, which today stretches to 30 years with regular monthly issuance along key benchmark rates of 5-, 7-, and 10-year maturities (see Figure 5). On the demand side,
TABLE 3. NIGERIA’S FIXED-INCOME MARKET, 1985–2018
1985 1990 1995 2000 2005 2010 2015 2018
government debt (usd million) 3,501 378 38 19 2,833 12,872 35,333 27,198
Corporate debt (usd million) 400 89 25 37 76 374 1,048 703
total debt outstanding (usd million)
3,902 467 63 56 2,909 13,246 36,380 27,901
Average daily value traded (usd million)
1.3 0.1 0.0 0.0 0.3 0.0 1,207 929
turnover ratio (%) 8.1 3.8 1.0 0.1 2.2 0.0 822.8 825.7
Sources: CBn and FmdQ securities exchange otC.
FIGURE 5. THE NAIRA YIELD CURVE
Percent
18
17
16
15
14
13
12
11
10
93
Month6
Month12
Month2
Year3
Year5
Year7
Year10
Year20
Year30
Year
As of 31 December 2018 As of 30 June 2019
Source: FmdQ securities exchange otC.
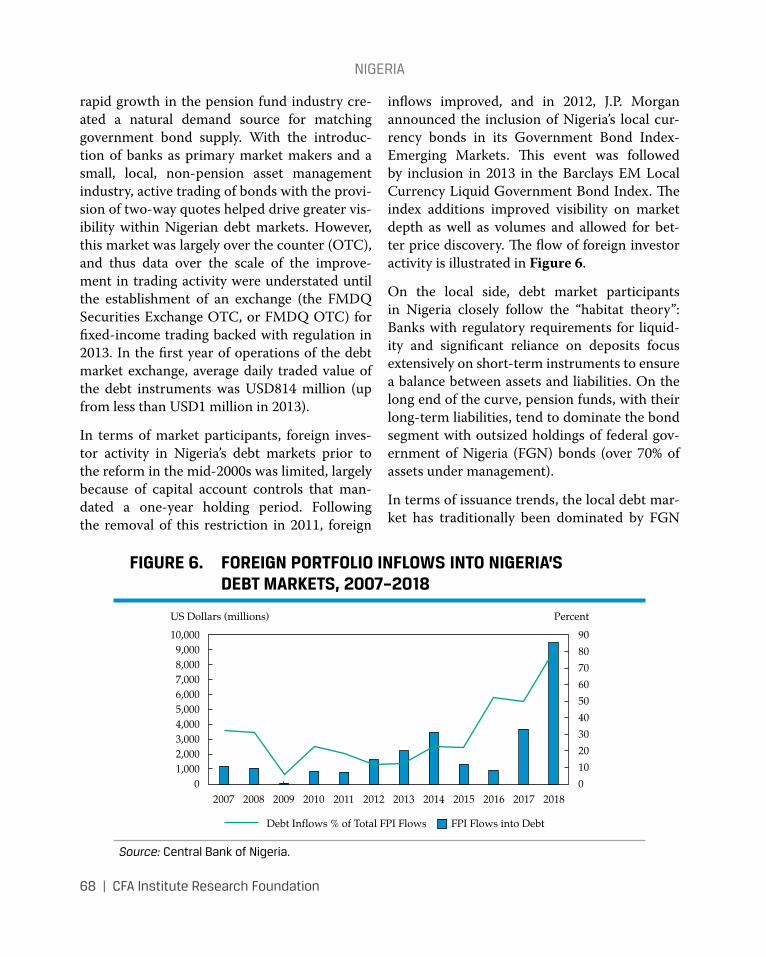
nIgeRIA
68 | CFA Institute Research Foundation
rapid growth in the pension fund industry cre-ated a natural demand source for matching government bond supply. With the introduc-tion of banks as primary market makers and a small, local, non-pension asset management industry, active trading of bonds with the provi-sion of two-way quotes helped drive greater vis-ibility within Nigerian debt markets. However, this market was largely over the counter (OTC), and thus data over the scale of the improve-ment in trading activity were understated until the establishment of an exchange (the FMDQ Securities Exchange OTC, or FMDQ OTC) for fixed-income trading backed with regulation in 2013. In the first year of operations of the debt market exchange, average daily traded value of the debt instruments was USD814 million (up from less than USD1 million in 2013).
In terms of market participants, foreign inves-tor activity in Nigeria’s debt markets prior to the reform in the mid-2000s was limited, largely because of capital account controls that man-dated a one-year holding period. Following the removal of this restriction in 2011, foreign
inflows improved, and in 2012, J.P. Morgan announced the inclusion of Nigeria’s local cur-rency bonds in its Government Bond Index-Emerging Markets. This event was followed by inclusion in 2013 in the Barclays EM Local Currency Liquid Government Bond Index. The index additions improved visibility on market depth as well as volumes and allowed for bet-ter price discovery. The flow of foreign investor activity is illustrated in Figure 6.
On the local side, debt market participants in Nigeria closely follow the “habitat theory”: Banks with regulatory requirements for liquid-ity and significant reliance on deposits focus extensively on short-term instruments to ensure a balance between assets and liabilities. On the long end of the curve, pension funds, with their long-term liabilities, tend to dominate the bond segment with outsized holdings of federal gov-ernment of Nigeria (FGN) bonds (over 70% of assets under management).
In terms of issuance trends, the local debt mar-ket has traditionally been dominated by FGN
FIGURE 6. FOREIGN PORTFOLIO INFLOWS INTO NIGERIA’S DEBT MARKETS, 2007–2018
2010200920082007 20122011 20152014 201820172013 2016
US Dollars (millions)
10,0009,0008,0007,0006,0005,0004,0003,0002,0001,000
0
Percent
90
80
70
60
50
40
30
20
10
0
Debt Inflows % of Total FPI Flows FPI Flows into Debt
Source: Central Bank of nigeria.
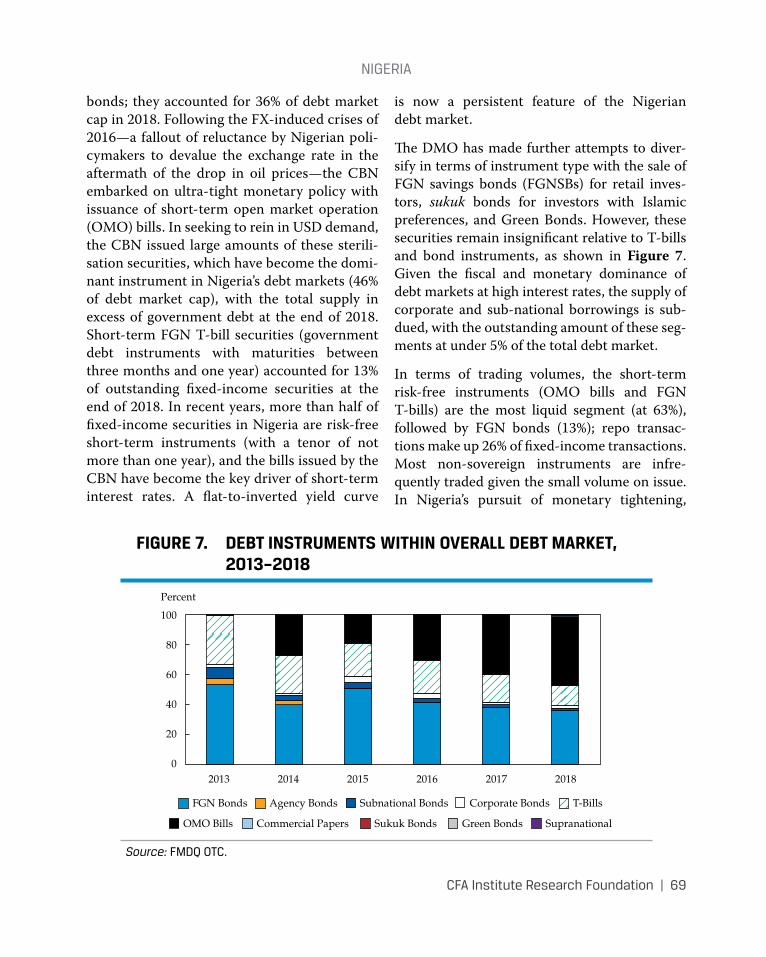
nIgeRIA
CFA Institute Research Foundation | 69
bonds; they accounted for 36% of debt market cap in 2018. Following the FX-induced crises of 2016—a fallout of reluctance by Nigerian poli-cymakers to devalue the exchange rate in the aftermath of the drop in oil prices—the CBN embarked on ultra-tight monetary policy with issuance of short-term open market operation (OMO) bills. In seeking to rein in USD demand, the CBN issued large amounts of these sterili-sation securities, which have become the domi-nant instrument in Nigeria’s debt markets (46% of debt market cap), with the total supply in excess of government debt at the end of 2018. Short-term FGN T-bill securities (government debt instruments with maturities between three months and one year) accounted for 13% of outstanding fixed-income securities at the end of 2018. In recent years, more than half of fixed-income securities in Nigeria are risk-free short-term instruments (with a tenor of not more than one year), and the bills issued by the CBN have become the key driver of short-term interest rates. A flat-to-inverted yield curve
is now a persistent feature of the Nigerian debt market.
The DMO has made further attempts to diver-sify in terms of instrument type with the sale of FGN savings bonds (FGNSBs) for retail inves-tors, sukuk bonds for investors with Islamic preferences, and Green Bonds. However, these securities remain insignificant relative to T-bills and bond instruments, as shown in Figure 7. Given the fiscal and monetary dominance of debt markets at high interest rates, the supply of corporate and sub-national borrowings is sub-dued, with the outstanding amount of these seg-ments at under 5% of the total debt market.
In terms of trading volumes, the short-term risk-free instruments (OMO bills and FGN T-bills) are the most liquid segment (at 63%), followed by FGN bonds (13%); repo transac-tions make up 26% of fixed-income transactions. Most non-sovereign instruments are infre-quently traded given the small volume on issue. In Nigeria’s pursuit of monetary tightening,
FIGURE 7. DEBT INSTRUMENTS WITHIN OVERALL DEBT MARKET, 2013–2018
Commercial Papers Sukuk Bonds Green Bonds SupranationalOMO Bills
FGN Bonds Agency Bonds Subnational Bonds Corporate Bonds T-Bills
Percent
100
80
60
40
20
02014 2015 201820172013 2016
Source: FmdQ otC.
nIgeRIA
70 | CFA Institute Research Foundation
the elevated yields on government instruments have attracted significant offshore holdings of short-term risk-free securities in Nigeria, with foreign portfolio investors accounting for 34% of outstanding OMO bill instruments at the end of 2018.
Given low external debt ratios (in 2018, 5.1% of GDP), Nigeria became active in the euro-bond market, with a debut USD500 million issue in 2011. Further forays followed in 2013 (USD1 billion), 2017 (USD4.8 billion), and 2018 (USD5.4 billion). The decision to tap for-eign debt markets reflects cost considerations; the weighted average interest expense on these bonds is presently 7.5%, compared with 14.2% for Naira bond issuances. The presence of a sov-ereign USD curve catalysed a wave of issuances by Nigerian corporates (especially banks) that sought to finance M&A activity in the energy sector. However, following the economic crisis of 2014–2016, the corporate eurobond space has seen a wave of redemptions with no desire by banks to refinance maturing issues.
CHALLENGES AND OPPORTUNITIESFiscal and monetary dominance of the debt market will result in an overconcentration of private savings in risk-free instruments, which will, in turn, curtail growth in other asset classes (equity, corporate debt, and alternatives) that are necessary for a deeper and more resilient capital market. As such, Nigeria’s economic policymakers must embark on comprehen-sive reforms that address the underlying driv-ers of imbalances that necessitate large paper issuance—particularly, reducing fiscal deficits and reforming FX market architecture toward a framework that is consistent with long-run economic aspirations. Successful reforms across
both fronts will help reduce incentives for lim-ited risk taking by local fund managers, which will encourage developments of financial prod-ucts across equity and debt market segments for both surplus savings and deficit units.
Pension fund reform in Nigeria greatly bol-stered the demand for investment products, and following that success, further attempts at creating institutional capital pools should be pursued. Relative to pension funds and banks, Nigeria’s insurance industry remains small, with total industry assets of USD3.6 billion at the end of 2018 (pension funds: USD25 billion; banks: USD107 billion). Improved compliance with laws that mandate general and group life insur-ance across the public and private sector, as well as moves to consolidate the sector (presently composed of close to 60 participants), would help widen the breadth of the long-term institu-tional buy side of the capital market.
Furthermore, policies should seek to reduce overconcentration on risk-free instruments—for instance, via the implementation of mini-mum holdings of variable-income instruments to reduce overconcentration in fixed income as well to drive the adoption of fair value account-ing treatment of fixed-income instruments ver-sus redemptive value treatments. In addition, working toward the development and promo-tion of standard benchmarks as the basis for performance evaluation will greatly level the playing field among fund managers.
Nigerian equities have seen a wave of delist-ing activity in recent years alongside a drought in primary market activities. To improve stock market depth in the near term, more work is required to incentivise listings of the Nigerian subsidiaries of international companies located in critical economic segments on the NSE, such as in the upstream oil and gas space. In the immediate term, proposed plans to sell down
nIgeRIA
CFA Institute Research Foundation | 71
joint venture assets of the Nigerian government should include stock market listing as part of the deal, which will help improve transparency around the notoriously opaque oil sector. Over the medium term, a policy of conducting exits of government stakes in public corporations during a privatisation round on the stock mar-ket should be adopted. In addition, policies that increase trading (e.g., securities lending) should be encouraged while transparency around own-ership and related-party activities is improved.
The importance of a transparent, consistent, and fair regulatory process to handle market infractions by issuers and investors is crucial for improving market confidence. Also needed is a constant rapport on ethical practices and self-regulation through industry groupings (pension fund operators, asset managers, bro-kerages, banks, and so forth) to ensure that the market develops a preference for ethical and fair competition.
Finally, a focus on improving the financial edu-cation and sophistication of market participants is crucial. Toward this end, a standard course of financial literacy that provides an adequate understanding of the workings of capital mar-kets should be incorporated into the educa-tional curriculum at secondary and tertiary levels. In addition, financial institutions should
be encouraged to hire undergraduate interns in market-facing roles to further demystify invest-ment securities to the retail public. These steps should be supplemented by regular events that create awareness and deepen appreciation of capital markets.
Policy reforms should seek to improve the abil-ity of investors to provide sound corporate gov-ernance oversight and sustainability practices in firms seeking to raise capital. To ensure that investors are incentivised, Nigerian regulators should look to adopt a stewardship code for pension fund managers and other institutional investors in the market.
The recent listing of the two telecommunica-tions giants in Nigeria—MTN Nigeria and Airtel Africa—at a combined market cap of about USD10 billion could be a sign of things to come for the Nigerian market. The listing of other large-cap companies in the energy and oil sectors could see the exchange easily top-ping the USD100 billion mark in market cap. In addition, an increase in equity holdings by the top 10 pension fund managers in Nigeria could potentially lead to an additional inflow of USD3 billion of fresh capital into the market. Africa’s largest economy could soon be punching close to its weight in its stock market cap.

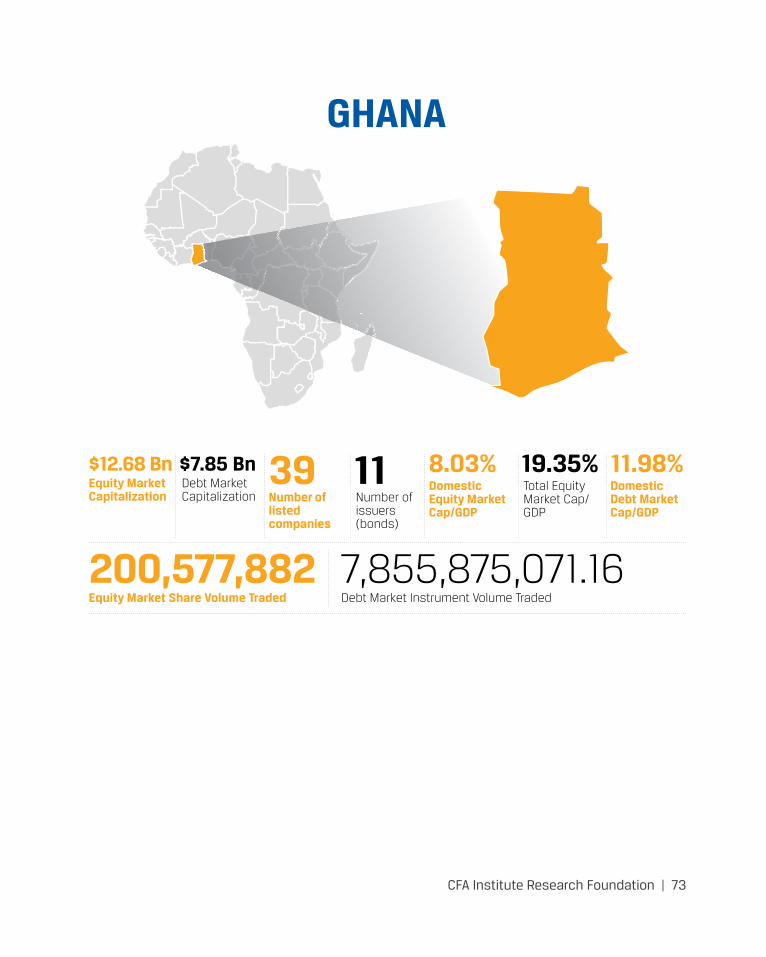
CFA Institute Research Foundation | 73
GHANA
Equity Market Capitalization
Equity Market Share Volume Traded
Debt Market Capitalization
Debt Market Instrument Volume Traded
Number of issuers (bonds)
Total Equity Market Cap/GDP
Number of listed companies
Domestic Equity Market Cap/GDP
Domestic Debt Market Cap/GDP
$12.68 Bn
200,577,882
39 8.03% 11.98% $7.85 Bn
7,855,875,071.16
11 19.35%
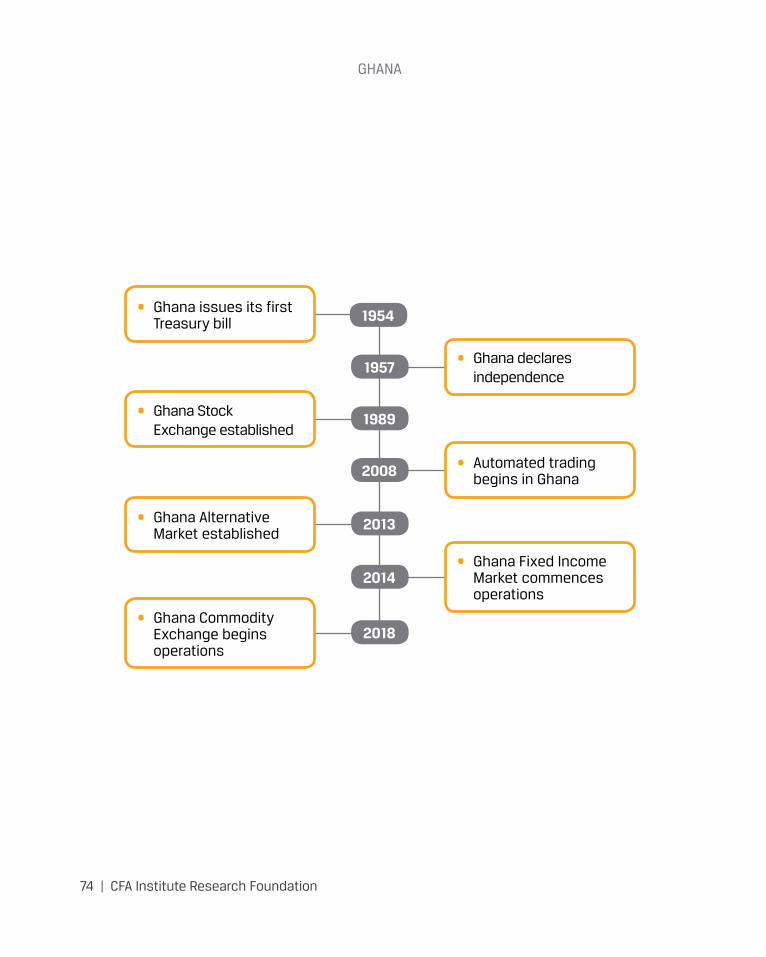
gHAnA
74 | CFA Institute Research Foundation
1954
1957
1989
2013
2018
2008
2014
• Ghana issues its first Treasury bill
• Ghana declares independence
• Automated trading begins in Ghana
• Ghana Fixed Income Market commences operations
• Ghana Stock Exchange established
• Ghana Alternative Market established
• Ghana Commodity Exchange begins operations
CFA Institute Research Foundation | 75
GHANAIvy Hesse, CFA, CIPMFounder and Principal Consultant, Synercate
The drive to establish a formal exchange in Ghana dates back to the mid-1950s, as evi-denced by various government initiatives, such as the issuance of the first Treasury bill, worth GBP500,000, in 1954, the incorporation of the Accra Securities Market Limited in the 1960s, and the enactment of the Stock Exchange Act, 1971 (Act 384), with the intent to establish a formal securities exchange. The ensuing politi-cal instability that characterized these periods hampered initial efforts until July 1989, when the Ghana Stock Exchange (GSE) was for-mally incorporated under the Stock Exchange Act of 197128 and commenced operations in November 1990.
Trading initially occurred via a call-over sys-tem within one equity market segment, with three initial brokers, 11 equity securities, one Government of Ghana (GoG) commemorative bond, and an initial market capitalisation of USD0.66 million in current terms.29 In March 2000, the GSE migrated to the manual continu-ous auction trading system, where trades were posted and matched on designated physical boards for each security. Nearly 30 years after its inception, the GSE has transitioned to a fully automated auction market consisting of three market segments, 41 listed equities, 76 GoG notes and bonds, corporate notes and bonds issued by 10 institutions, one exchange-traded fund (ETF), 22 brokerage houses, an equity
28Now repealed.29Based on the average beginning and ending rates for 2018.
market capitalisation of USD13.3 billion,30 and issued bonds valued at USD7.6 billion as of December 2018.
Table 1 outlines key initiatives targeted at improving the functions, operations, and rele-vance of the capital market and related financial subsectors since 2000.
The GSE has earned international recognition—for example, by winning the Africa investor (Ai) “Most Innovative African Stock Exchange” award in 2009 and 2018. It has been a prominent member of the African Securities Exchanges Association (ASEA) and has applied to become an affiliate member of the World Federation of Exchanges. The GSE has been a key driver of the initiative to harmonize regional capital mar-kets and is currently integrated into the West African capital market under the West African Capital Markets Integration (WACMI) frame-work, granting participating countries varying degrees of access rights to offer and invest in securities across the subregion.
There are four main regulatory institutions responsible for different segments of the finan-cial sector in Ghana—namely, the Bank of Ghana (BOG), the Securities and Exchange Commission (SEC), the National Pensions Regulatory Authority (NPRA), and the National Insurance Commission (NIC). The growth of assets under management (AUM) within the pensions industry has been a key driver of
30Exchange conversions are based on the average of the beginning and ending exchange rates reported in the Bank of Ghana annual reports.
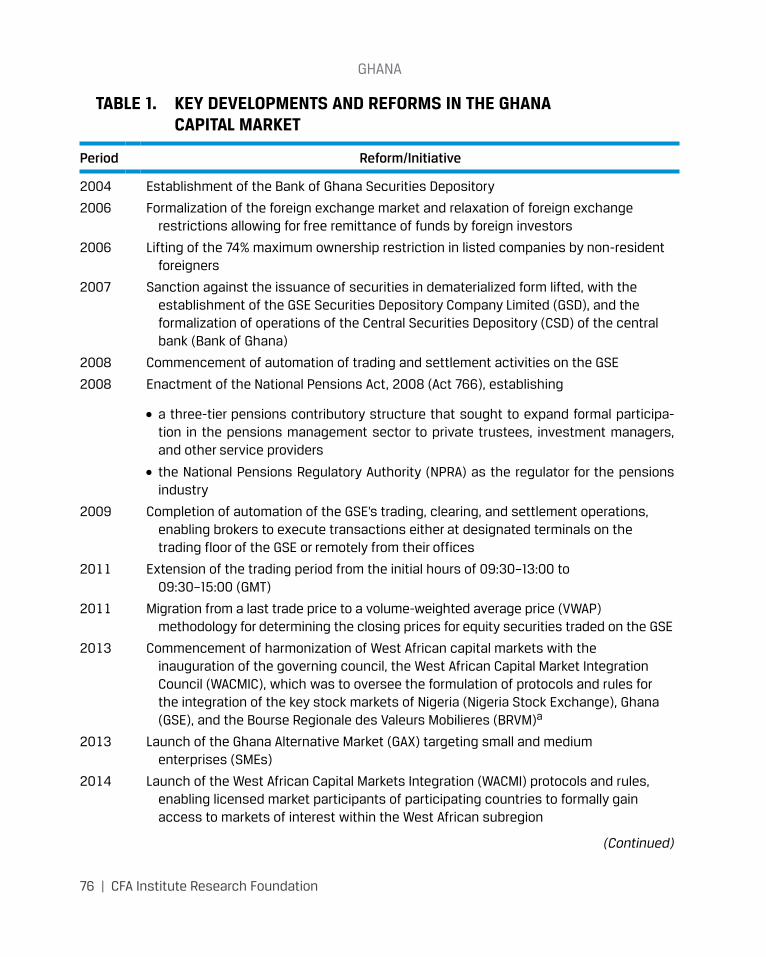
gHAnA
76 | CFA Institute Research Foundation
TABLE 1. KEY DEVELOPMENTS AND REFORMS IN THE GHANA CAPITAL MARKET
Period Reform/Initiative
2004 establishment of the Bank of ghana securities depository
2006 Formalization of the foreign exchange market and relaxation of foreign exchange restrictions allowing for free remittance of funds by foreign investors
2006 Lifting of the 74% maximum ownership restriction in listed companies by non-resident foreigners
2007 sanction against the issuance of securities in dematerialized form lifted, with the establishment of the gse securities depository Company Limited (gsd), and the formalization of operations of the Central securities depository (Csd) of the central bank (Bank of ghana)
2008 Commencement of automation of trading and settlement activities on the gse
2008 enactment of the national pensions Act, 2008 (Act 766), establishing
• a three-tier pensions contributory structure that sought to expand formal participa-tion in the pensions management sector to private trustees, investment managers, and other service providers
• the national pensions Regulatory Authority (npRA) as the regulator for the pensions industry
2009 Completion of automation of the gse’s trading, clearing, and settlement operations, enabling brokers to execute transactions either at designated terminals on the trading floor of the gse or remotely from their offices
2011 extension of the trading period from the initial hours of 09:30–13:00 to 09:30–15:00 (gmt)
2011 migration from a last trade price to a volume-weighted average price (VwAp) methodology for determining the closing prices for equity securities traded on the gse
2013 Commencement of harmonization of west African capital markets with the inauguration of the governing council, the west African Capital market Integration Council (wACmIC), which was to oversee the formulation of protocols and rules for the integration of the key stock markets of nigeria (nigeria stock exchange), ghana (gse), and the Bourse Regionale des Valeurs mobilieres (BRVm)a
2013 Launch of the ghana Alternative market (gAX) targeting small and medium enterprises (smes)
2014 Launch of the west African Capital markets Integration (wACmI) protocols and rules, enabling licensed market participants of participating countries to formally gain access to markets of interest within the west African subregion
(Continued)
gHAnA
CFA Institute Research Foundation | 77
activities within Ghana’s capital market, partic-ularly the bond market of the GSE (i.e., GFIM). At the end of 2017, total pension industry assets were USD7.11 billion, compared with USD5.35 billion in 2012.
The GSE currently has three market segments:
1. the Main Equity Market, where all equity securities and ETFs are listed
2. the GFIM, where all government and non-government notes and bonds are listed and traded
3. the Ghana Alternative Market (GAX), which is the segment that encourages SME listings
The GSE has seen its equity market capitali-sation grow from USD0.66 million31 in 1990 to over USD13 billion as of the end of 2018. Despite several initiatives to promote listings and trading activities, the number of listed secu-rities on the Main Equity Market and the GAX
31Converted at the average beginning and ending rates for 2018.
and trading activity measured by volume and values traded have stayed generally stable over the past five years ending 2018.
Annual value traded on the GFIM has almost tripled since it formally commenced opera-tions in 2014, from USD2.8 billion in 2015 to USD8.2 billion as of the end of 2018. These numbers far exceed the equity market trade val-ues of USD71 million–USD143 million over the same period.
The total market size—measured by the market capitalisation for the equity market and outstand-ing debt value for the debt market—may point to a number of factors, such as (a) the growing preference for debt over equity as a result of the impact of the financial sector reforms and the associated flight to safety from investor uncer-tainty, away from equities; (b) the impact of del-istings of nonperforming companies in recent times; and (c) negative USD returns on equity because of worsening exchange rates.
On the supply side (especially institutional investors), reforms in pensions law, proliferation
Period Reform/Initiative
2015 establishment of the ghana Fixed Income market (gFIm) as the formal secondary market segment for fixed-income instruments issued by corporate, government, and government-related institutions
2016 enactment of the new securities Industry Act, 2016 (Act 929), which, among other things, allows the issuance of derivative securities
2018 Launch of operations of the ghana Commodity exchange (gCX) to provide an efficient platform for the trading of major commodities used within the economy (the commodity currently actively traded is maize)
aA regional exchange located in Côte d’Ivoire covering Benin, Burkina Faso, guinea-Bissau, Côte d’Ivoire, mali, niger, senegal, and togo.
Sources: npRA, Bog, and gse.
TABLE 1. KEY DEVELOPMENTS AND REFORMS IN THE GHANA CAPITAL MARKET (CONTINUED)
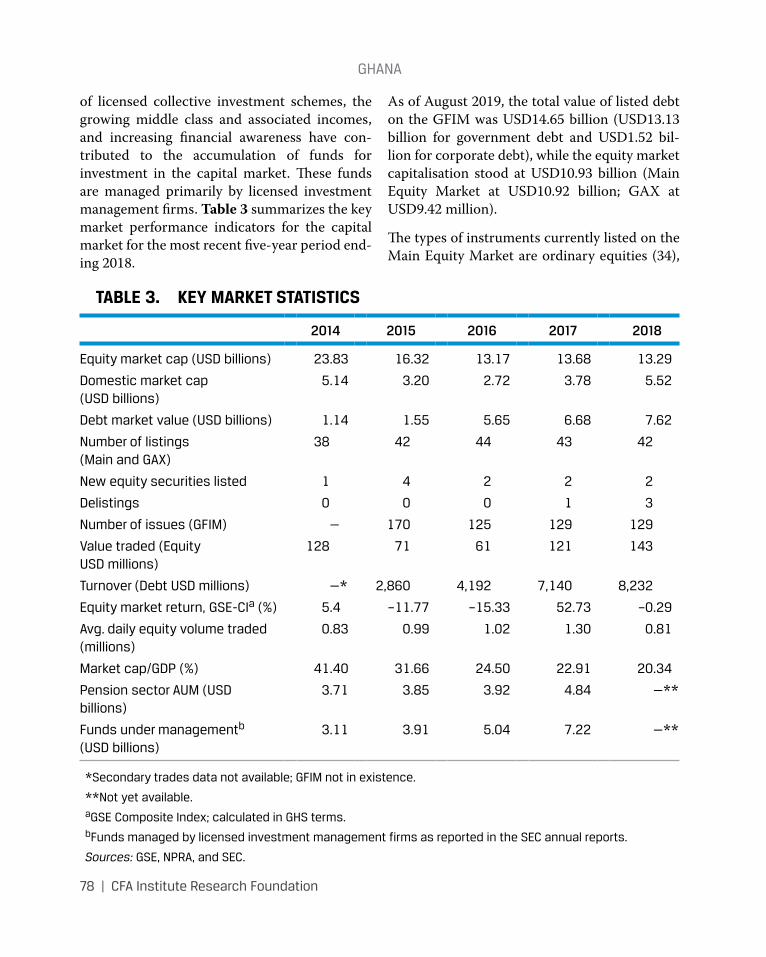
gHAnA
78 | CFA Institute Research Foundation
of licensed collective investment schemes, the growing middle class and associated incomes, and increasing financial awareness have con-tributed to the accumulation of funds for investment in the capital market. These funds are managed primarily by licensed investment management firms. Table 3 summarizes the key market performance indicators for the capital market for the most recent five-year period end-ing 2018.
As of August 2019, the total value of listed debt on the GFIM was USD14.65 billion (USD13.13 billion for government debt and USD1.52 bil-lion for corporate debt), while the equity market capitalisation stood at USD10.93 billion (Main Equity Market at USD10.92 billion; GAX at USD9.42 million).
The types of instruments currently listed on the Main Equity Market are ordinary equities (34),
TABLE 3. KEY MARKET STATISTICS
2014 2015 2016 2017 2018
equity market cap (usd billions) 23.83 16.32 13.17 13.68 13.29
domestic market cap (usd billions)
5.14 3.20 2.72 3.78 5.52
debt market value (usd billions) 1.14 1.55 5.65 6.68 7.62
number of listings (main and gAX)
38 42 44 43 42
new equity securities listed 1 4 2 2 2
delistings 0 0 0 1 3
number of issues (gFIm) — 170 125 129 129
Value traded (equity usd millions)
128 71 61 121 143
turnover (debt usd millions) —* 2,860 4,192 7,140 8,232
equity market return, gse-CIa (%) 5.4 –11.77 –15.33 52.73 –0.29
Avg. daily equity volume traded (millions)
0.83 0.99 1.02 1.30 0.81
market cap/gdp (%) 41.40 31.66 24.50 22.91 20.34
pension sector Aum (usd billions)
3.71 3.85 3.92 4.84 —**
Funds under managementb (usd billions)
3.11 3.91 5.04 7.22 —**
*secondary trades data not available; gFIm not in existence.
**not yet available.agse Composite Index; calculated in gHs terms.bFunds managed by licensed investment management firms as reported in the seC annual reports.
Sources: gse, npRA, and seC.
gHAnA
CFA Institute Research Foundation | 79
preference shares (1), depository shares (1), and ETFs (1). At the end of 2018, the GAX had five listed equities with a market capitalisation of USD11.91 million, representing 0.09% of the combined market cap of USD13.29 billion for the Main Equity Market and GAX.
The average number of listings on the Main Equity Market and GAX has remained stable over the past five years, with an average number of 42 listings. Although there have been a few new list-ings (11) over this period, the impact of delistings (4) has kept the total number generally stable.
The equities listed on the Main Equity Market and GAX represent 11 sectors of the economy. The two dominant sectors in terms of market size have been mining (69%) and finance (21%)—accounting for over 90% of average market cap over the past five years. The dominant sectors in terms of number of listings have been finance (with 12 listings, which are mainly banks and insurance companies) and manufacturing (with 10 listings), and these sectors have constituted 28% and 25%, respectively, of total average list-ings over the past five years. The finance sector has dominated trading activity, accounting for 53% of average volume traded and 51% of aver-age value traded for the five years ending 2018.
The performance of the equity market is cur-rently measured by the GSE Composite Index (GSE-CI) for the entire market and the GSE-Financial Stocks Index (GSE-FSI) for the finan-cial stocks segment.
The debt instruments listed on the GFIM include government Treasury securities, euro-bonds, and corporate bills, notes, and bonds. The maturities of these instruments, includ-ing both local currency and USD-denominated securities, range from 91 or 182 days to one year on the shorter end and from 2 years (notes) to 31 years (bonds) on the longer end.
Secondary market trading in equities is con-ducted on the Capizar EZ Trading System of the GSE, which is an automated continuous auction system with the capacity to support trading of other securities, such as bonds and derivatives. Trades settle within a T+3 cycle. Secondary mar-ket trading on the GFIM is conducted on any of the following three trading platforms: the Capizar EZ Trading System, the CSD Platform, or the Bloomberg E-Bond Platform. The trading time window on the GFIM is 09:30–16:00 (GMT), with a trade settlement cycle of T+2.32 On the GFIM, debt instruments are classified as notes, bills, and bonds based on maturity period as follows:
• bills—less than one year,
• notes—one to two years, and
• bonds—maturities of three years and above.
The closing price for each instrument after each trading day is the last transaction price (yield) for the issue.
Although government bonds have been in issu-ance before the establishment of the GSE and were listed on the GSE post-issuance, only pri-mary dealers (predominantly, banks licensed by the Bank of Ghana) participated in primary issuances and a large portion of secondary mar-ket dealings in these securities until 2015, when the GFIM segment was formally established under the GSE.
Only primary dealers33 qualify to participate in primary market issuances of government secu-rities, but both primary dealers and licensed dealing members34 can participate in secondary
32See the GFIM Manual (https://gse.com.gh/readfile/?file= https://gse.com.gh/wp-content/uploads/2018/11/GFIM-Manual-August-2016.pdf).33Financial institutions meeting qualification requirements and designated as such by the central bank.34Brokers licensed by the GSE and the SEC.
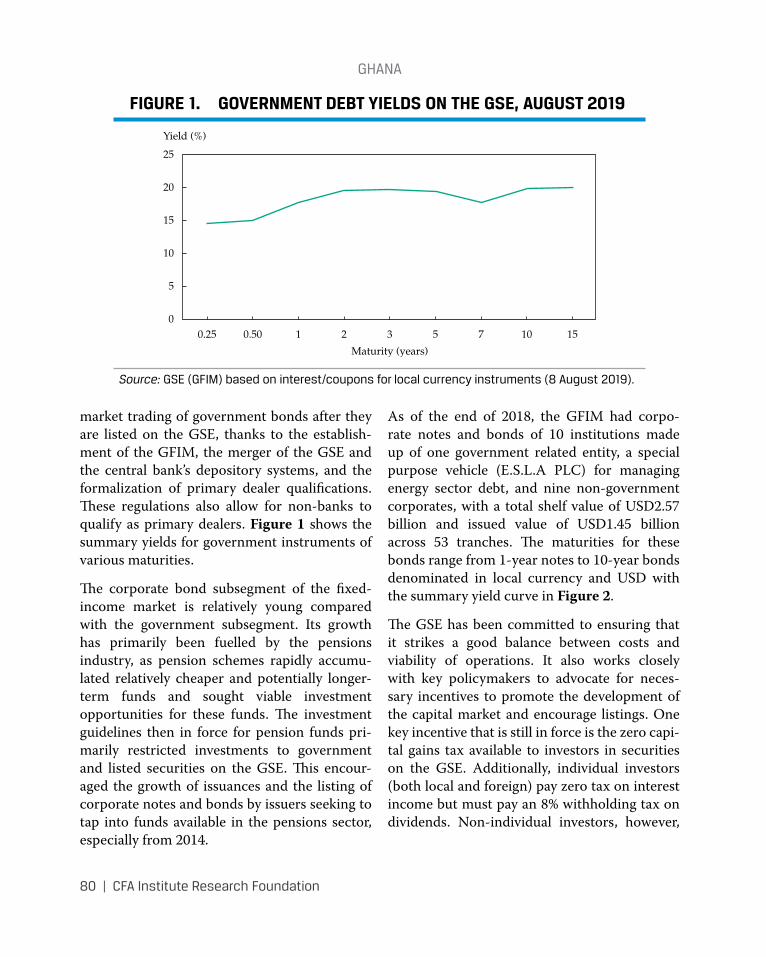
gHAnA
80 | CFA Institute Research Foundation
market trading of government bonds after they are listed on the GSE, thanks to the establish-ment of the GFIM, the merger of the GSE and the central bank’s depository systems, and the formalization of primary dealer qualifications. These regulations also allow for non-banks to qualify as primary dealers. Figure 1 shows the summary yields for government instruments of various maturities.
The corporate bond subsegment of the fixed-income market is relatively young compared with the government subsegment. Its growth has primarily been fuelled by the pensions industry, as pension schemes rapidly accumu-lated relatively cheaper and potentially longer-term funds and sought viable investment opportunities for these funds. The investment guidelines then in force for pension funds pri-marily restricted investments to government and listed securities on the GSE. This encour-aged the growth of issuances and the listing of corporate notes and bonds by issuers seeking to tap into funds available in the pensions sector, especially from 2014.
As of the end of 2018, the GFIM had corpo-rate notes and bonds of 10 institutions made up of one government related entity, a special purpose vehicle (E.S.L.A PLC) for managing energy sector debt, and nine non-government corporates, with a total shelf value of USD2.57 billion and issued value of USD1.45 billion across 53 tranches. The maturities for these bonds range from 1-year notes to 10-year bonds denominated in local currency and USD with the summary yield curve in Figure 2.
The GSE has been committed to ensuring that it strikes a good balance between costs and viability of operations. It also works closely with key policymakers to advocate for neces-sary incentives to promote the development of the capital market and encourage listings. One key incentive that is still in force is the zero capi-tal gains tax available to investors in securities on the GSE. Additionally, individual investors (both local and foreign) pay zero tax on interest income but must pay an 8% withholding tax on dividends. Non-individual investors, however,
FIGURE 1. GOVERNMENT DEBT YIELDS ON THE GSE, AUGUST 2019
Yield (%)
25
20
15
10
5
01 20.500.25 5 10 153 7
Maturity (years)
Source: gse (gFIm) based on interest/coupons for local currency instruments (8 August 2019).
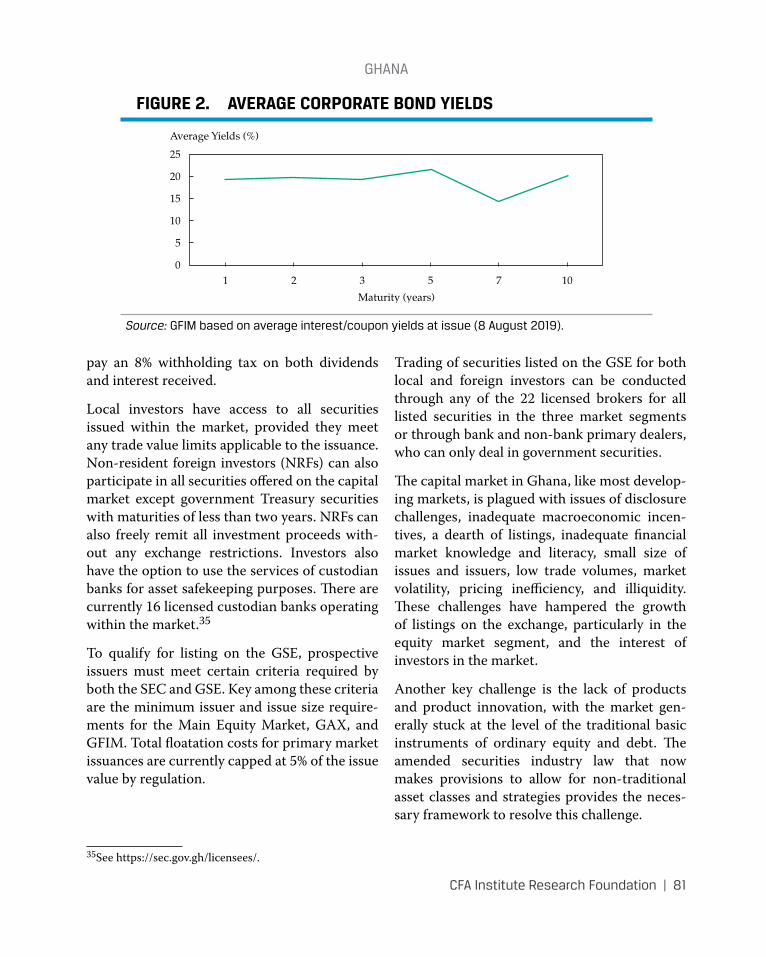
gHAnA
CFA Institute Research Foundation | 81
pay an 8% withholding tax on both dividends and interest received.
Local investors have access to all securities issued within the market, provided they meet any trade value limits applicable to the issuance. Non-resident foreign investors (NRFs) can also participate in all securities offered on the capital market except government Treasury securities with maturities of less than two years. NRFs can also freely remit all investment proceeds with-out any exchange restrictions. Investors also have the option to use the services of custodian banks for asset safekeeping purposes. There are currently 16 licensed custodian banks operating within the market.35
To qualify for listing on the GSE, prospective issuers must meet certain criteria required by both the SEC and GSE. Key among these criteria are the minimum issuer and issue size require-ments for the Main Equity Market, GAX, and GFIM. Total floatation costs for primary market issuances are currently capped at 5% of the issue value by regulation.
35See https://sec.gov.gh/licensees/.
Trading of securities listed on the GSE for both local and foreign investors can be conducted through any of the 22 licensed brokers for all listed securities in the three market segments or through bank and non-bank primary dealers, who can only deal in government securities.
The capital market in Ghana, like most develop-ing markets, is plagued with issues of disclosure challenges, inadequate macroeconomic incen-tives, a dearth of listings, inadequate financial market knowledge and literacy, small size of issues and issuers, low trade volumes, market volatility, pricing inefficiency, and illiquidity. These challenges have hampered the growth of listings on the exchange, particularly in the equity market segment, and the interest of investors in the market.
Another key challenge is the lack of products and product innovation, with the market gen-erally stuck at the level of the traditional basic instruments of ordinary equity and debt. The amended securities industry law that now makes provisions to allow for non-traditional asset classes and strategies provides the neces-sary framework to resolve this challenge.
FIGURE 2. AVERAGE CORPORATE BOND YIELDS
Average Yields (%)
25
20
15
10
5
01 2 5 103 7
Maturity (years)
Source: gFIm based on average interest/coupon yields at issue (8 August 2019).
gHAnA
82 | CFA Institute Research Foundation
Key areas where innovative solutions are required are
• product development, to expand offerings to include products such as REITS and ETFs;
• development of the corporate bond market as the preferred source of funding for cor-porates as well as government entities and agencies, such as districts and municipal authorities;
• development of optimal policies and incen-tives to fuel the increasing use of capital market channels by issuers and to positively transform the savings and investment habits of investors as they are the source of invest-ment funds for the capital market;
• increased activity and availability of private equity funds as a key source of alternative funding, especially for early-stage compa-nies in preparation for their participation in the broader public capital markets, as well as other investment vehicles;
• increased use of financial technologies (fintech) to deepen financial inclusion and reach of financial services and products; and
• widening of the reach of financial literacy to create awareness about the purpose and benefits of the capital market for issuers and
the benefits of saving and investing on the part of investors.
A crucial development that will be a catalyst to help transform the capital market will be the growing pensions industry and middle-class incomes and the asset muscle these are rapidly building.
One key way that the GSE is looking to chal-lenge the status quo in resolving these chal-lenges is to leverage technology to (1) enable more prospective investors to gain access to information, (2) improve financial literacy, and (3) broaden inclusion in primary and secondary market activities within Ghana’s capital market.
All these opportunities can only be attracted and implemented sustainably in a stable macro-economic environment, with well-functioning regulatory institutions that prioritize ethical behaviour and compliance by all market partici-pants and protect the interests of investors. The foundations for such an enabling environment are also being laid with the ongoing financial sector reforms that the relevant financial sector regulators have been rolling out in recent times. The opportunities lie in the ability of market participants to find innovative ways to position the capital market in Ghana as the preferred destination and source of capital within the subregion.
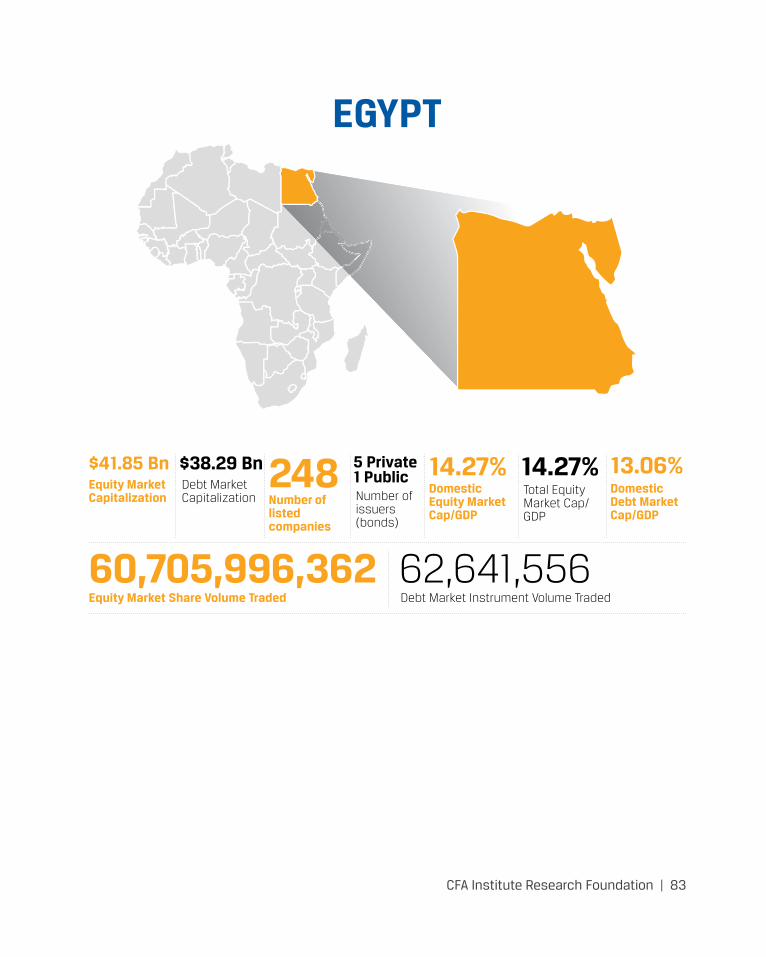
CFA Institute Research Foundation | 83
EGYPT
Equity Market Capitalization
Equity Market Share Volume Traded
Debt Market Capitalization
Debt Market Instrument Volume Traded
Number of issuers (bonds)
Total Equity Market Cap/GDP
Number of listed companies
Domestic Equity Market Cap/GDP
Domestic Debt Market Cap/GDP
$41.85 Bn
60,705,996,362
248 14.27% 13.06%$38.29 Bn
62,641,556
5 Private 1 Public 14.27%
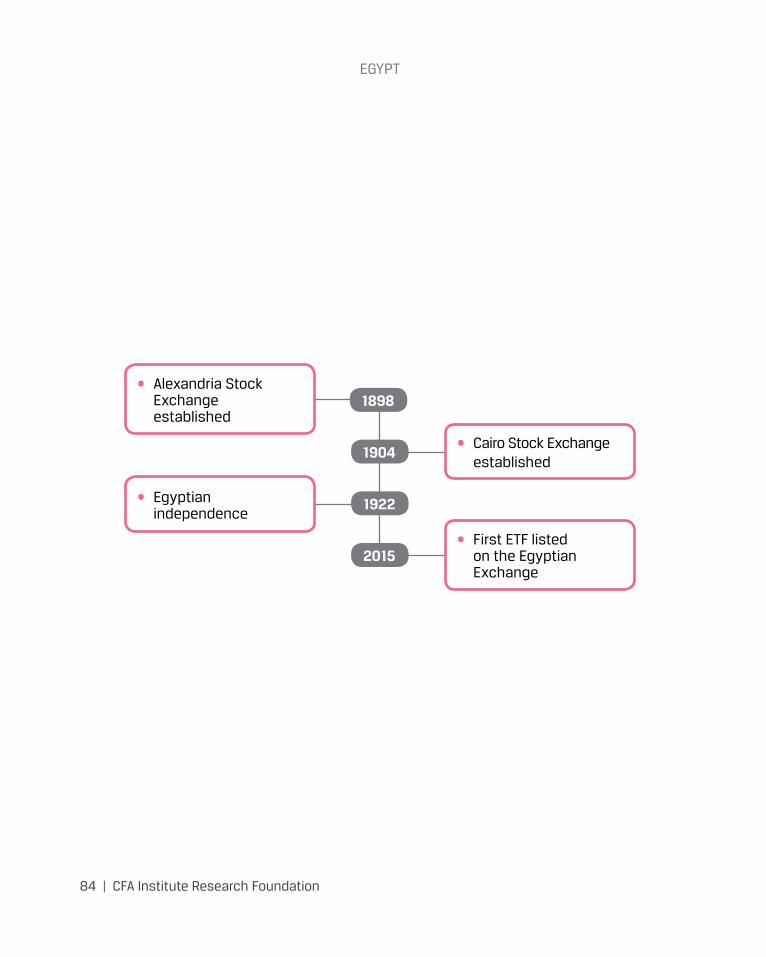
egypt
84 | CFA Institute Research Foundation
1898
1904
1922
2015
• Alexandria Stock Exchange established
• Cairo Stock Exchange established
• First ETF listed on the Egyptian Exchange
• Egyptian independence
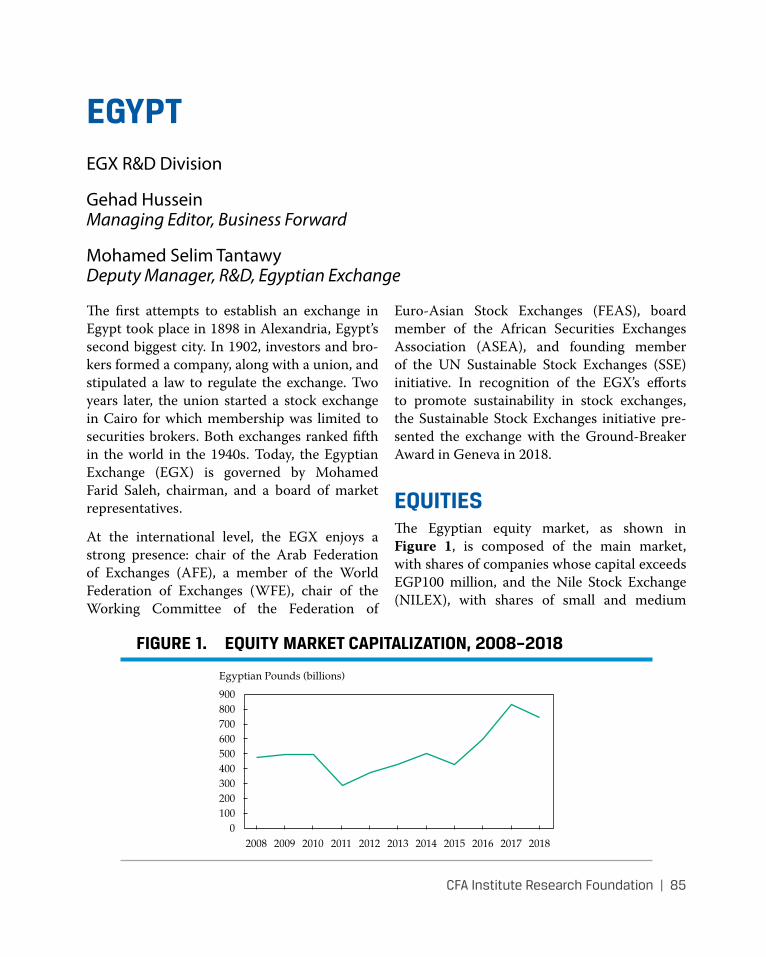
CFA Institute Research Foundation | 85
EGYPTEGX R&D Division
Gehad HusseinManaging Editor, Business Forward
Mohamed Selim TantawyDeputy Manager, R&D, Egyptian Exchange
The first attempts to establish an exchange in Egypt took place in 1898 in Alexandria, Egypt’s second biggest city. In 1902, investors and bro-kers formed a company, along with a union, and stipulated a law to regulate the exchange. Two years later, the union started a stock exchange in Cairo for which membership was limited to securities brokers. Both exchanges ranked fifth in the world in the 1940s. Today, the Egyptian Exchange (EGX) is governed by Mohamed Farid Saleh, chairman, and a board of market representatives.
At the international level, the EGX enjoys a strong presence: chair of the Arab Federation of Exchanges (AFE), a member of the World Federation of Exchanges (WFE), chair of the Working Committee of the Federation of
Euro-Asian Stock Exchanges (FEAS), board member of the African Securities Exchanges Association (ASEA), and founding member of the UN Sustainable Stock Exchanges (SSE) initiative. In recognition of the EGX’s efforts to promote sustainability in stock exchanges, the Sustainable Stock Exchanges initiative pre-sented the exchange with the Ground-Breaker Award in Geneva in 2018.
EQUITIESThe Egyptian equity market, as shown in Figure 1, is composed of the main market, with shares of companies whose capital exceeds EGP100 million, and the Nile Stock Exchange (NILEX), with shares of small and medium
FIGURE 1. EQUITY MARKET CAPITALIZATION, 2008–2018
Egyptian Pounds (billions)
900800700
500400
200100
300
600
020112008 20152010 20142009 20132012 2016 2017 2018
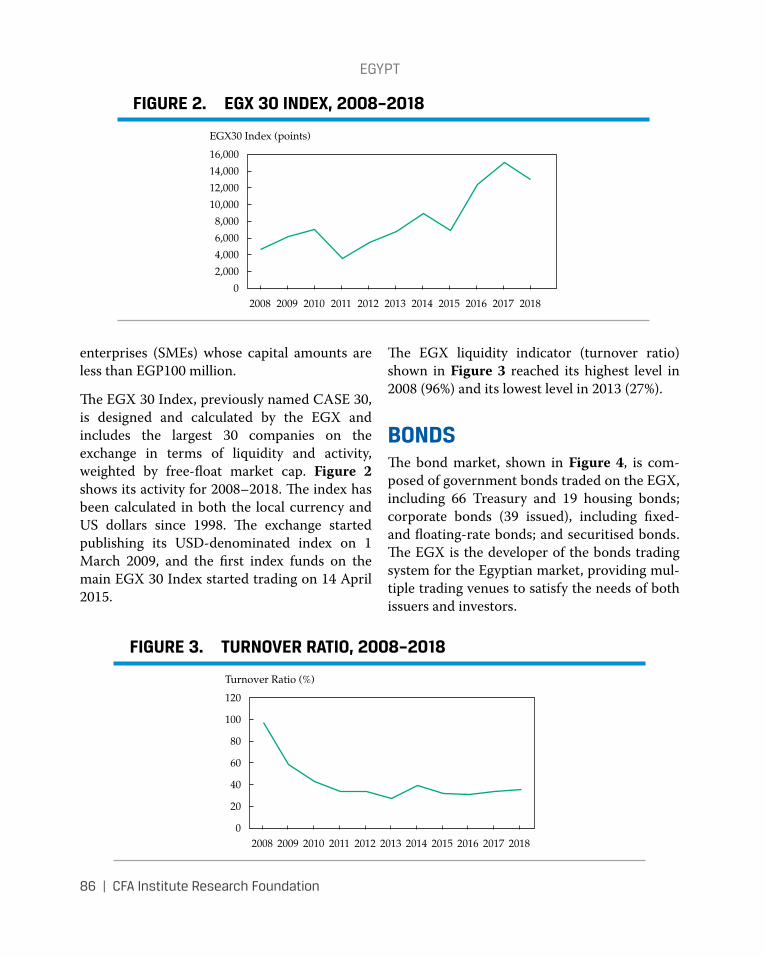
egypt
86 | CFA Institute Research Foundation
FIGURE 2. EGX 30 INDEX, 2008–2018
EGX30 Index (points)
16,000
14,000
12,000
8,000
6,000
2,000
4,000
10,000
020112008 20152010 20142009 20132012 2016 2017 2018
FIGURE 3. TURNOVER RATIO, 2008–2018
Turnover Ratio (%)
120
100
80
40
20
60
020112008 20152010 20142009 20132012 2016 2017 2018
enterprises (SMEs) whose capital amounts are less than EGP100 million.
The EGX 30 Index, previously named CASE 30, is designed and calculated by the EGX and includes the largest 30 companies on the exchange in terms of liquidity and activity, weighted by free-float market cap. Figure 2 shows its activity for 2008–2018. The index has been calculated in both the local currency and US dollars since 1998. The exchange started publishing its USD-denominated index on 1 March 2009, and the first index funds on the main EGX 30 Index started trading on 14 April 2015.
The EGX liquidity indicator (turnover ratio) shown in Figure 3 reached its highest level in 2008 (96%) and its lowest level in 2013 (27%).
BONDSThe bond market, shown in Figure 4, is com-posed of government bonds traded on the EGX, including 66 Treasury and 19 housing bonds; corporate bonds (39 issued), including fixed- and floating-rate bonds; and securitised bonds. The EGX is the developer of the bonds trading system for the Egyptian market, providing mul-tiple trading venues to satisfy the needs of both issuers and investors.
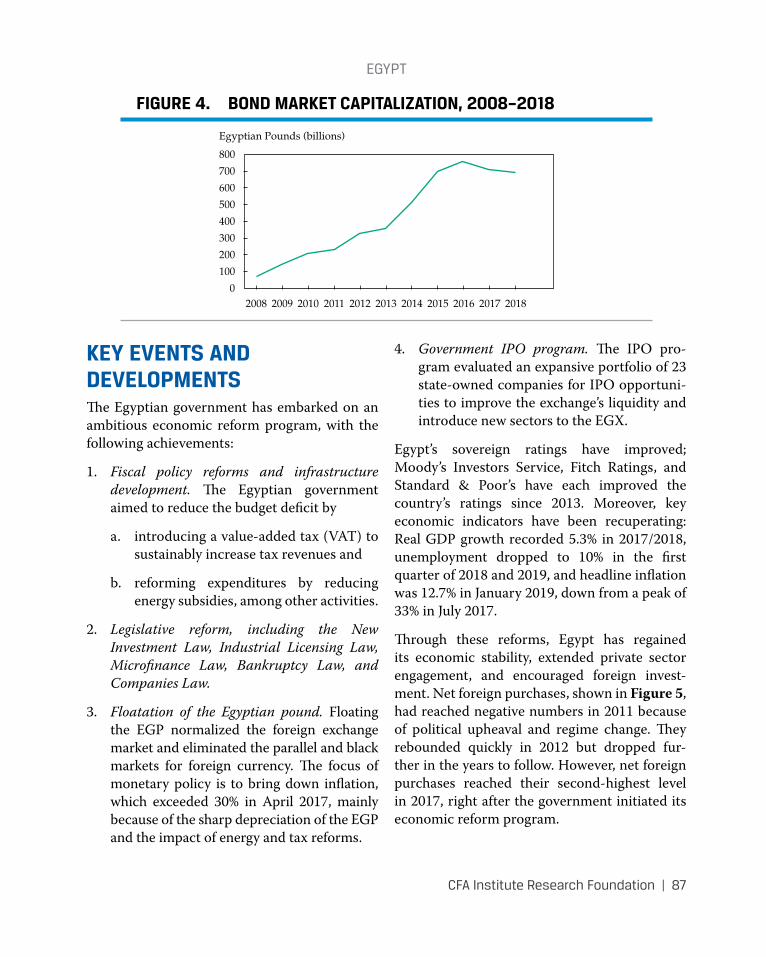
egypt
CFA Institute Research Foundation | 87
KEY EVENTS AND DEVELOPMENTSThe Egyptian government has embarked on an ambitious economic reform program, with the following achievements:
1. Fiscal policy reforms and infrastructure development. The Egyptian government aimed to reduce the budget deficit by
a. introducing a value-added tax (VAT) to sustainably increase tax revenues and
b. reforming expenditures by reducing energy subsidies, among other activities.
2. Legislative reform, including the New Investment Law, Industrial Licensing Law, Microfinance Law, Bankruptcy Law, and Companies Law.
3. Floatation of the Egyptian pound. Floating the EGP normalized the foreign exchange market and eliminated the parallel and black markets for foreign currency. The focus of monetary policy is to bring down inflation, which exceeded 30% in April 2017, mainly because of the sharp depreciation of the EGP and the impact of energy and tax reforms.
4. Government IPO program. The IPO pro-gram evaluated an expansive portfolio of 23 state-owned companies for IPO opportuni-ties to improve the exchange’s liquidity and introduce new sectors to the EGX.
Egypt’s sovereign ratings have improved; Moody’s Investors Service, Fitch Ratings, and Standard & Poor’s have each improved the country’s ratings since 2013. Moreover, key economic indicators have been recuperating: Real GDP growth recorded 5.3% in 2017/2018, unemployment dropped to 10% in the first quarter of 2018 and 2019, and headline inflation was 12.7% in January 2019, down from a peak of 33% in July 2017.
Through these reforms, Egypt has regained its economic stability, extended private sector engagement, and encouraged foreign invest-ment. Net foreign purchases, shown in Figure 5, had reached negative numbers in 2011 because of political upheaval and regime change. They rebounded quickly in 2012 but dropped fur-ther in the years to follow. However, net foreign purchases reached their second-highest level in 2017, right after the government initiated its economic reform program.
FIGURE 4. BOND MARKET CAPITALIZATION, 2008–2018
Egyptian Pounds (billions)
800
700
500
400
200
100
300
600
020112008 20152010 20142009 20132012 2016 2017 2018
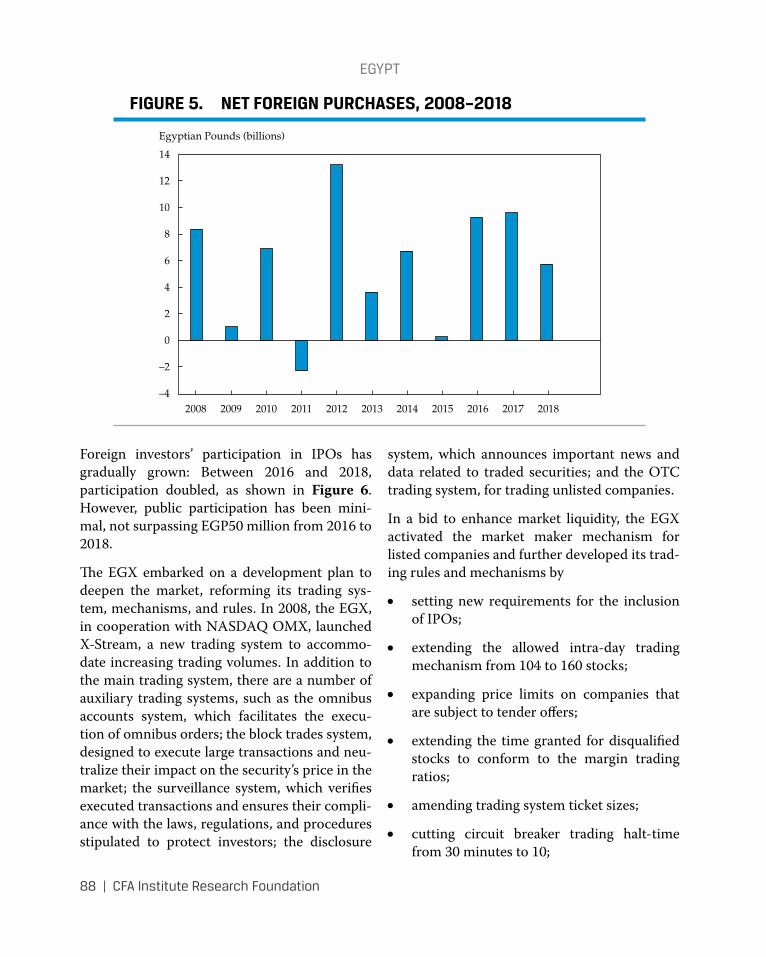
egypt
88 | CFA Institute Research Foundation
Foreign investors’ participation in IPOs has gradually grown: Between 2016 and 2018, participation doubled, as shown in Figure 6. However, public participation has been mini-mal, not surpassing EGP50 million from 2016 to 2018.
The EGX embarked on a development plan to deepen the market, reforming its trading sys-tem, mechanisms, and rules. In 2008, the EGX, in cooperation with NASDAQ OMX, launched X-Stream, a new trading system to accommo-date increasing trading volumes. In addition to the main trading system, there are a number of auxiliary trading systems, such as the omnibus accounts system, which facilitates the execu-tion of omnibus orders; the block trades system, designed to execute large transactions and neu-tralize their impact on the security’s price in the market; the surveillance system, which verifies executed transactions and ensures their compli-ance with the laws, regulations, and procedures stipulated to protect investors; the disclosure
system, which announces important news and data related to traded securities; and the OTC trading system, for trading unlisted companies.
In a bid to enhance market liquidity, the EGX activated the market maker mechanism for listed companies and further developed its trad-ing rules and mechanisms by
• setting new requirements for the inclusion of IPOs;
• extending the allowed intra-day trading mechanism from 104 to 160 stocks;
• expanding price limits on companies that are subject to tender offers;
• extending the time granted for disqualified stocks to conform to the margin trading ratios;
• amending trading system ticket sizes;
• cutting circuit breaker trading halt-time from 30 minutes to 10;
FIGURE 5. NET FOREIGN PURCHASES, 2008–2018
Egyptian Pounds (billions)
14
12
10
8
6
4
2
0
–2
–420112008 2013 2016 2018201720152014201220102009
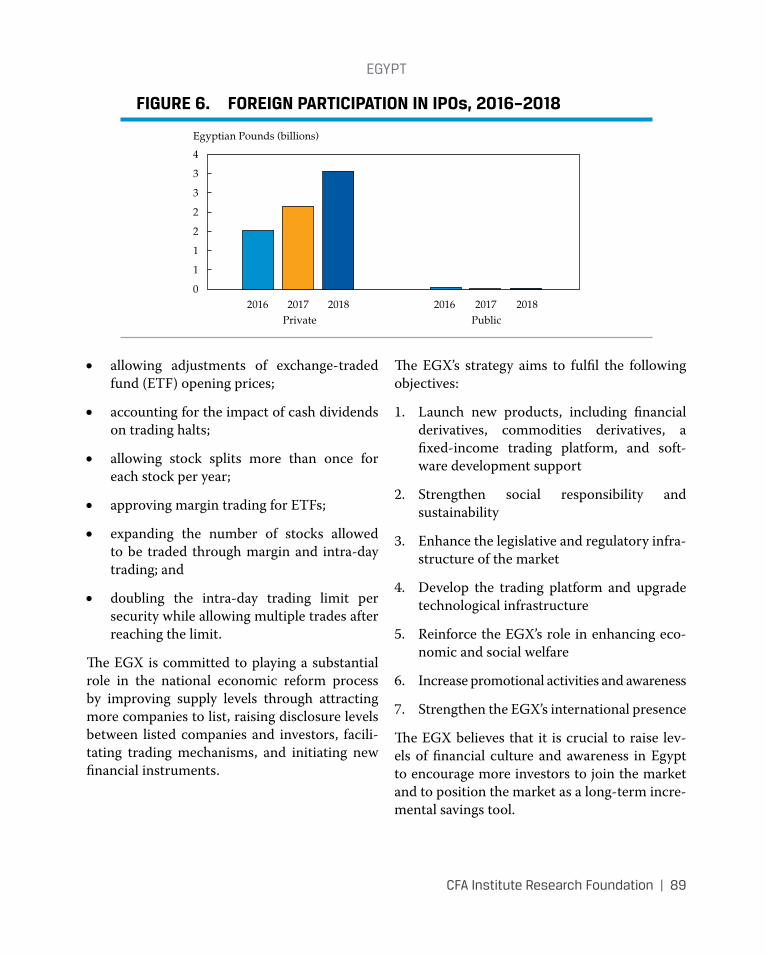
egypt
CFA Institute Research Foundation | 89
• allowing adjustments of exchange-traded fund (ETF) opening prices;
• accounting for the impact of cash dividends on trading halts;
• allowing stock splits more than once for each stock per year;
• approving margin trading for ETFs;
• expanding the number of stocks allowed to be traded through margin and intra-day trading; and
• doubling the intra-day trading limit per security while allowing multiple trades after reaching the limit.
The EGX is committed to playing a substantial role in the national economic reform process by improving supply levels through attracting more companies to list, raising disclosure levels between listed companies and investors, facili-tating trading mechanisms, and initiating new financial instruments.
The EGX’s strategy aims to fulfil the following objectives:
1. Launch new products, including financial derivatives, commodities derivatives, a fixed-income trading platform, and soft-ware development support
2. Strengthen social responsibility and sustainability
3. Enhance the legislative and regulatory infra-structure of the market
4. Develop the trading platform and upgrade technological infrastructure
5. Reinforce the EGX’s role in enhancing eco-nomic and social welfare
6. Increase promotional activities and awareness
7. Strengthen the EGX’s international presence
The EGX believes that it is crucial to raise lev-els of financial culture and awareness in Egypt to encourage more investors to join the market and to position the market as a long-term incre-mental savings tool.
FIGURE 6. FOREIGN PARTICIPATION IN IPOs, 2016–2018
Egyptian Pounds (billions)
Private Public
4
3
3
2
2
1
1
020172016 2018 2016 20182017
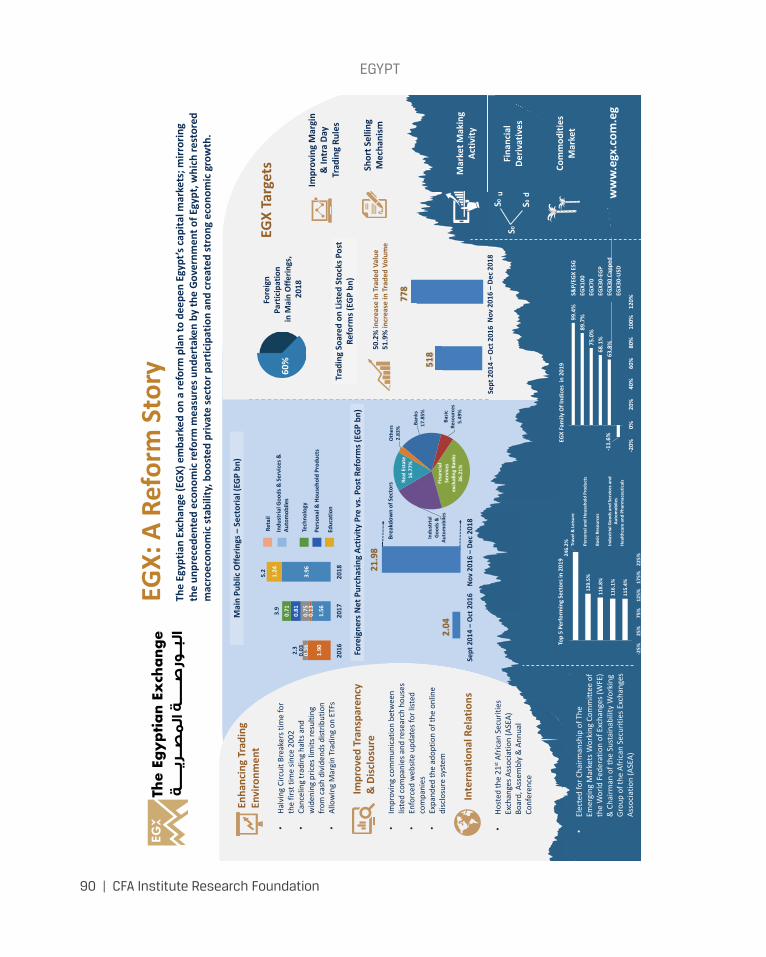
egypt
90 | CFA Institute Research Foundation
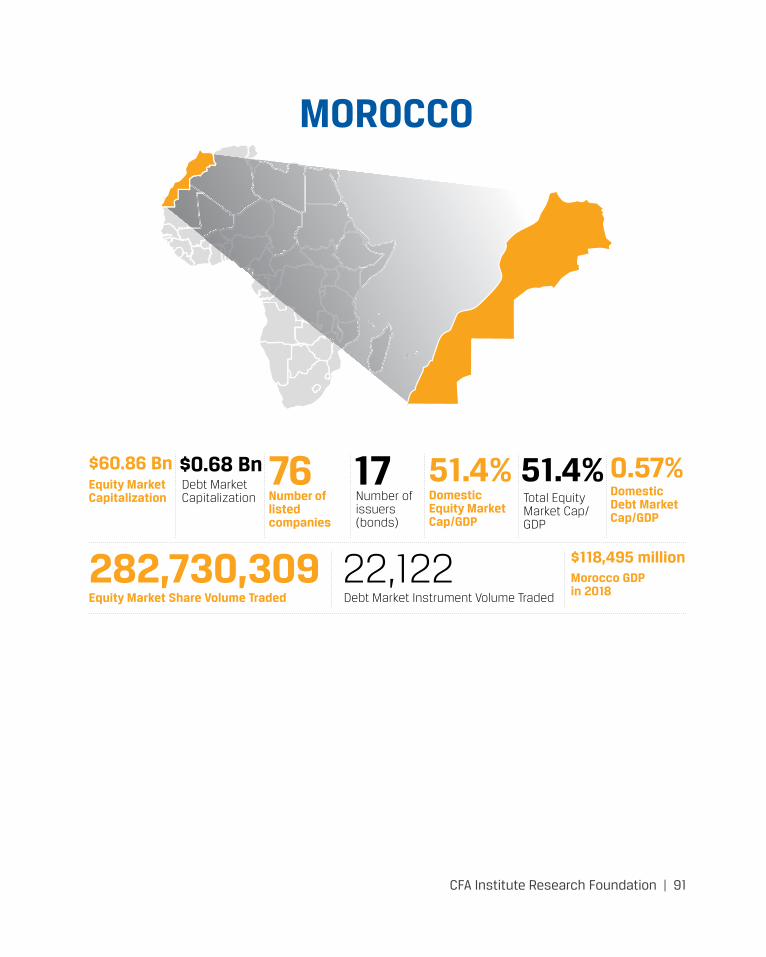
CFA Institute Research Foundation | 91
MOROCCO
Equity Market Capitalization
Equity Market Share Volume Traded
Debt Market Capitalization
Debt Market Instrument Volume Traded
Number of issuers (bonds)
Total Equity Market Cap/GDP
Number of listed companies
Domestic Equity Market Cap/GDP
Domestic Debt Market Cap/GDP
Morocco GDP in 2018
$60.86 Bn
282,730,309
76 51.4% 0.57%
$118,495 million
$0.68 Bn
22,122
17 51.4%
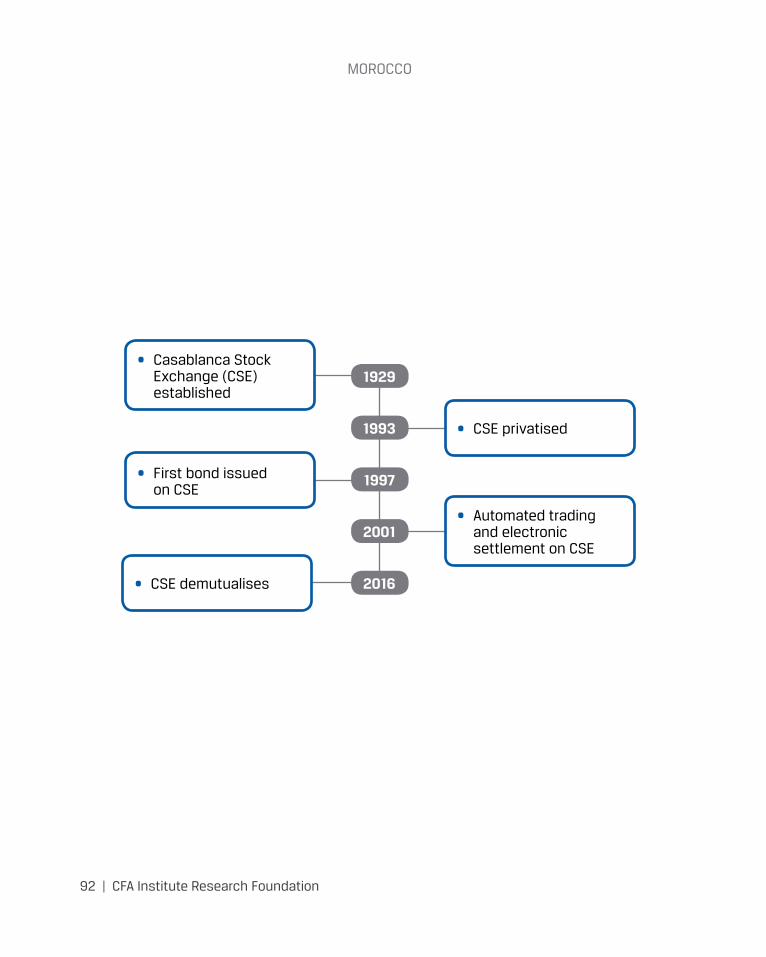
moRoCCo
92 | CFA Institute Research Foundation
• CSE demutualises
1929
1993
1997
2001
2016
• Casablanca Stock Exchange (CSE) established
• CSE privatised
• Automated trading and electronic settlement on CSE
• First bond issued on CSE
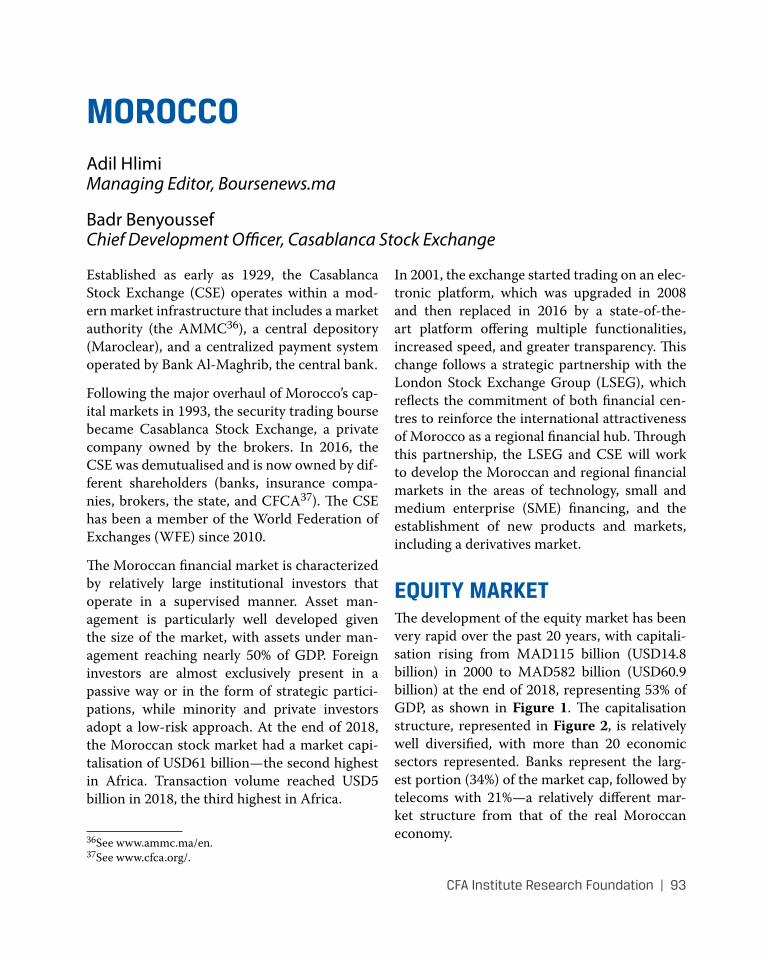
CFA Institute Research Foundation | 93
MOROCCOAdil HlimiManaging Editor, Boursenews.ma
Badr BenyoussefChief Development Officer, Casablanca Stock Exchange
Established as early as 1929, the Casablanca Stock Exchange (CSE) operates within a mod-ern market infrastructure that includes a market authority (the AMMC36), a central depository (Maroclear), and a centralized payment system operated by Bank Al-Maghrib, the central bank.
Following the major overhaul of Morocco’s cap-ital markets in 1993, the security trading bourse became Casablanca Stock Exchange, a private company owned by the brokers. In 2016, the CSE was demutualised and is now owned by dif-ferent shareholders (banks, insurance compa-nies, brokers, the state, and CFCA37). The CSE has been a member of the World Federation of Exchanges (WFE) since 2010.
The Moroccan financial market is characterized by relatively large institutional investors that operate in a supervised manner. Asset man-agement is particularly well developed given the size of the market, with assets under man-agement reaching nearly 50% of GDP. Foreign investors are almost exclusively present in a passive way or in the form of strategic partici-pations, while minority and private investors adopt a low-risk approach. At the end of 2018, the Moroccan stock market had a market capi-talisation of USD61 billion—the second highest in Africa. Transaction volume reached USD5 billion in 2018, the third highest in Africa.
36See www.ammc.ma/en.37See www.cfca.org/.
In 2001, the exchange started trading on an elec-tronic platform, which was upgraded in 2008 and then replaced in 2016 by a state-of-the-art platform offering multiple functionalities, increased speed, and greater transparency. This change follows a strategic partnership with the London Stock Exchange Group (LSEG), which reflects the commitment of both financial cen-tres to reinforce the international attractiveness of Morocco as a regional financial hub. Through this partnership, the LSEG and CSE will work to develop the Moroccan and regional financial markets in the areas of technology, small and medium enterprise (SME) financing, and the establishment of new products and markets, including a derivatives market.
EQUITY MARKETThe development of the equity market has been very rapid over the past 20 years, with capitali-sation rising from MAD115 billion (USD14.8 billion) in 2000 to MAD582 billion (USD60.9 billion) at the end of 2018, representing 53% of GDP, as shown in Figure 1. The capitalisation structure, represented in Figure 2, is relatively well diversified, with more than 20 economic sectors represented. Banks represent the larg-est portion (34%) of the market cap, followed by telecoms with 21%—a relatively different mar-ket structure from that of the real Moroccan economy.
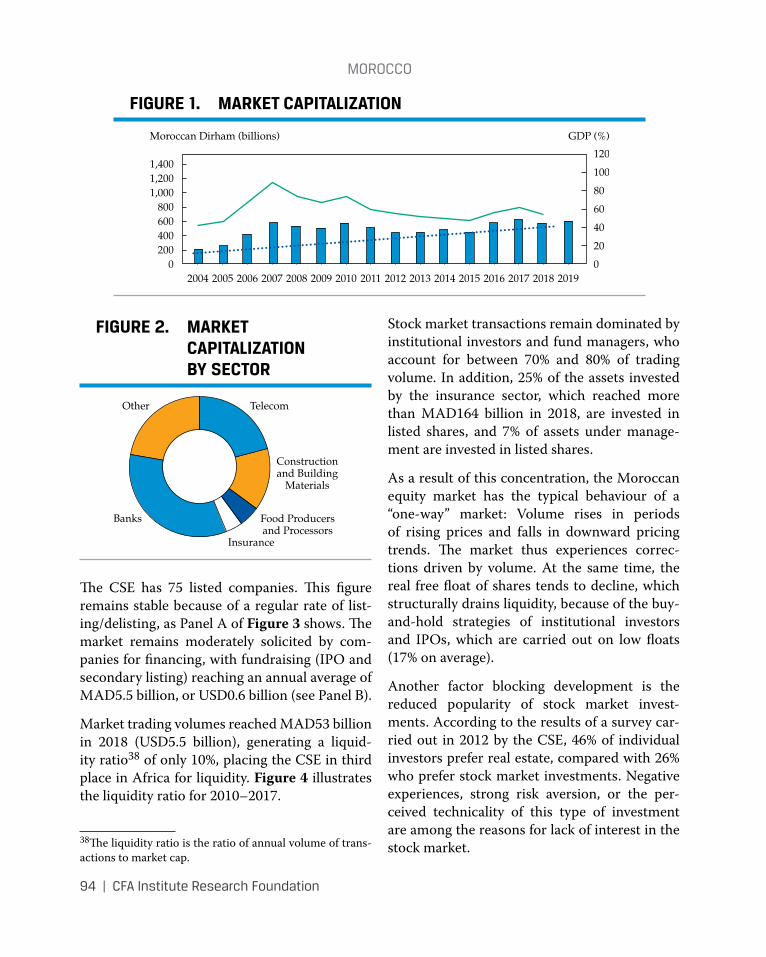
moRoCCo
94 | CFA Institute Research Foundation
The CSE has 75 listed companies. This figure remains stable because of a regular rate of list-ing/delisting, as Panel A of Figure 3 shows. The market remains moderately solicited by com-panies for financing, with fundraising (IPO and secondary listing) reaching an annual average of MAD5.5 billion, or USD0.6 billion (see Panel B).
Market trading volumes reached MAD53 billion in 2018 (USD5.5 billion), generating a liquid-ity ratio38 of only 10%, placing the CSE in third place in Africa for liquidity. Figure 4 illustrates the liquidity ratio for 2010–2017.
38The liquidity ratio is the ratio of annual volume of trans-actions to market cap.
Stock market transactions remain dominated by institutional investors and fund managers, who account for between 70% and 80% of trading volume. In addition, 25% of the assets invested by the insurance sector, which reached more than MAD164 billion in 2018, are invested in listed shares, and 7% of assets under manage-ment are invested in listed shares.
As a result of this concentration, the Moroccan equity market has the typical behaviour of a “one-way” market: Volume rises in periods of rising prices and falls in downward pricing trends. The market thus experiences correc-tions driven by volume. At the same time, the real free float of shares tends to decline, which structurally drains liquidity, because of the buy-and-hold strategies of institutional investors and IPOs, which are carried out on low floats (17% on average).
Another factor blocking development is the reduced popularity of stock market invest-ments. According to the results of a survey car-ried out in 2012 by the CSE, 46% of individual investors prefer real estate, compared with 26% who prefer stock market investments. Negative experiences, strong risk aversion, or the per-ceived technicality of this type of investment are among the reasons for lack of interest in the stock market.
FIGURE 1. MARKET CAPITALIZATION
Moroccan Dirham (billions) GDP (%)
2004 2005 2006 2007 2008 2009 2010 2011 2012 2013 2014 2015 2016 2017 2018 2019
1,4001,2001,000
800600400200
0
120
60
80
100
40
20
0
FIGURE 2. MARKET CAPITALIZATION BY SECTOR
Telecom
Constructionand Building
Materials
Food Producersand Processors
Insurance
Banks
Other
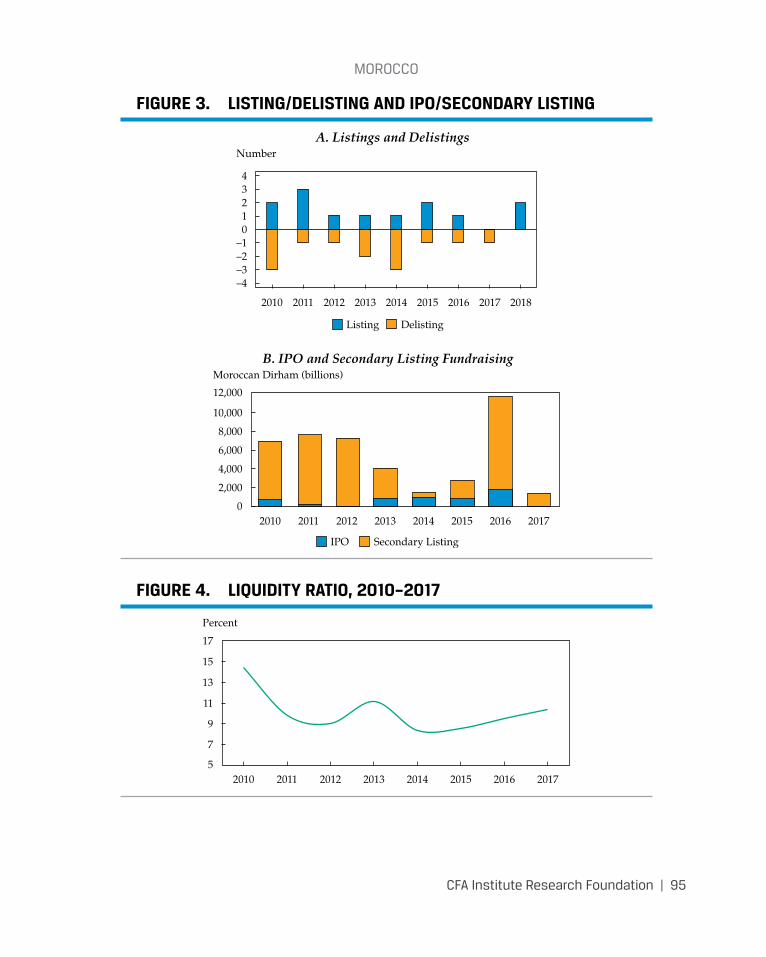
moRoCCo
CFA Institute Research Foundation | 95
FIGURE 3. LISTING/DELISTING AND IPO/SECONDARY LISTING
NumberA. Listings and Delistings
20132010 2011 2012 2014 2017 201820162015
Listing
Moroccan Dirham (billions)B. IPO and Secondary Listing Fundraising
20132010 2011 2012 2014 201720162015
Delisting
IPO Secondary Listing
12,000
10,000
8,000
6,000
2,000
4,000
0
3
12
4
0–1–2–3–4
FIGURE 4. LIQUIDITY RATIO, 2010–2017
Percent
20122010 2011 2013 2015 20162014 2017
11
9
13
7
5
15
17
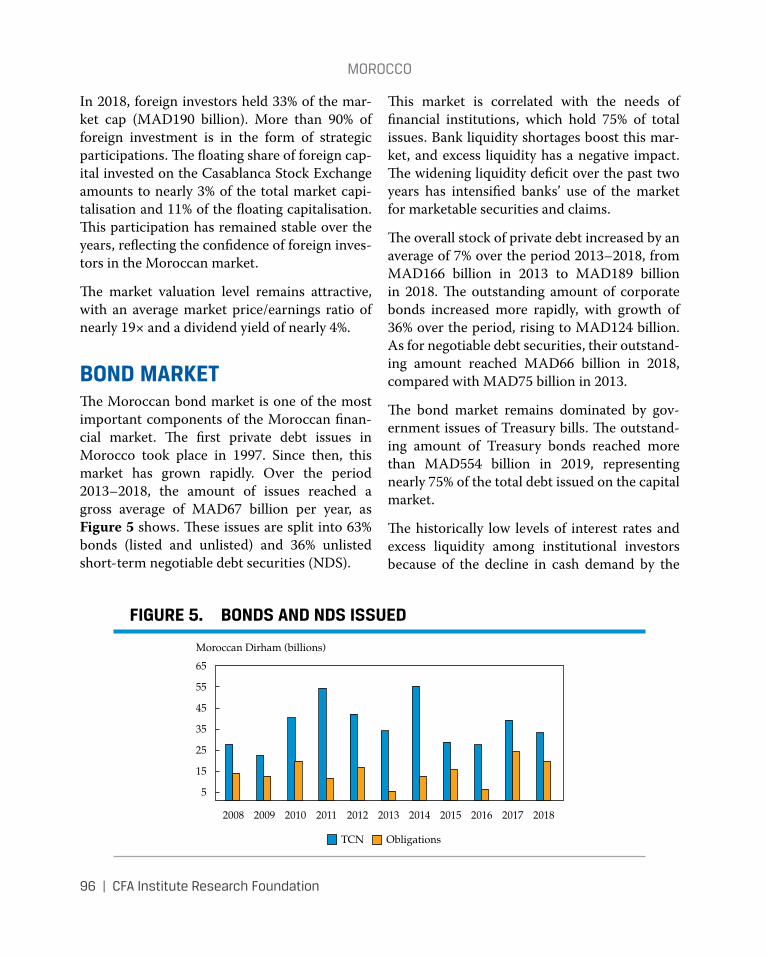
moRoCCo
96 | CFA Institute Research Foundation
In 2018, foreign investors held 33% of the mar-ket cap (MAD190 billion). More than 90% of foreign investment is in the form of strategic participations. The floating share of foreign cap-ital invested on the Casablanca Stock Exchange amounts to nearly 3% of the total market capi-talisation and 11% of the floating capitalisation. This participation has remained stable over the years, reflecting the confidence of foreign inves-tors in the Moroccan market.
The market valuation level remains attractive, with an average market price/earnings ratio of nearly 19× and a dividend yield of nearly 4%.
BOND MARKETThe Moroccan bond market is one of the most important components of the Moroccan finan-cial market. The first private debt issues in Morocco took place in 1997. Since then, this market has grown rapidly. Over the period 2013–2018, the amount of issues reached a gross average of MAD67 billion per year, as Figure 5 shows. These issues are split into 63% bonds (listed and unlisted) and 36% unlisted short-term negotiable debt securities (NDS).
This market is correlated with the needs of financial institutions, which hold 75% of total issues. Bank liquidity shortages boost this mar-ket, and excess liquidity has a negative impact. The widening liquidity deficit over the past two years has intensified banks’ use of the market for marketable securities and claims.
The overall stock of private debt increased by an average of 7% over the period 2013–2018, from MAD166 billion in 2013 to MAD189 billion in 2018. The outstanding amount of corporate bonds increased more rapidly, with growth of 36% over the period, rising to MAD124 billion. As for negotiable debt securities, their outstand-ing amount reached MAD66 billion in 2018, compared with MAD75 billion in 2013.
The bond market remains dominated by gov-ernment issues of Treasury bills. The outstand-ing amount of Treasury bonds reached more than MAD554 billion in 2019, representing nearly 75% of the total debt issued on the capital market.
The historically low levels of interest rates and excess liquidity among institutional investors because of the decline in cash demand by the
FIGURE 5. BONDS AND NDS ISSUED
Moroccan Dirham (billions)
2011 2014 2017 20182010 2013 20162008 2009 2012 2015
TCN Obligations
65
55
45
35
25
15
5
moRoCCo
CFA Institute Research Foundation | 97
Moroccan Treasury enable a competitive bond market. Average issue spreads have shown an overall decrease of 50 bps between 2013 and 2018. Currently, 10-year Treasury bonds are issued at a rate of 3%.
The bond market is an OTC market, and listed bonds remain limited in number, not exceeding 46 at the end of 2018 and generating a volume of MAD1.7 billion—down 38% compared with 2017.
CAPITAL MARKET DEVELOPMENTIn order to respond to Morocco’s strategic ori-entation to become the financial hub of Africa, the CSE has launched a new development plan for the period 2018–2021. It is called Ambition 2021 and is structured around three axes: mar-ket infrastructure, economic financing, and regional outreach.
Ambition 2021, which mobilizes all stakehold-ers (the regulatory authority, regulators, and market professionals), has three key objectives:
1. Build a high-performance infrastructure with the
a. transformation of the CSE into a stock exchange group and
b. the creation of a clearinghouse and a derivatives market using a multi-product IT platform and a solid inte-grated risk management framework.
2. Better contribute to financing the economy by stimulating the supply of paper on the equity and bond markets, enhancing the attractiveness of the CSE to local and inter-national investors, and accelerating the development of market liquidity.
3. Promote the CSE by listing foreign securi-ties, improving connectivity with interna-tional financial markets, creating a 100% African fund, and deploying the ELITE pro-gram in West and Central Africa.
Several projects designed to help achieve these objectives are already at an advanced stage:
• The CSE has adopted a new law enabling it to create new markets and boards better adapted to the financing needs of compa-nies, to list new products such as REITs and ETFs, and to create the status of investment adviser.
• New rules for financial transactions and information have been introduced, mak-ing it possible to initiate the obligation for issuers to report quarterly, to produce half-yearly and annual financial reports, and to include non-financial information.
• The state has relaunched the privatiza-tion program, giving priority to the use of the stock market and integration of new companies.
• Several of the 110 companies that have joined the ELITE program in Morocco and West Africa have already started reforms (report-ing, governance, and so forth) and are pre-paring to carry out operations on the CSE.
• Events to promote the international mar-ketplace are regularly organized and enable listed companies to meet international investors.
• Financial education for individual inves-tors is developing through the training of more than 7,000 people per year, directly or through the e-learning platform developed by the CSE.
moRoCCo
98 | CFA Institute Research Foundation
• The central counterparty clearinghouse (CCP) and the derivatives market are being set up.
• Security and compliance with international standards continue, with the CSE and Maroclear obtaining ISO 9001 certification for service quality and ISO 27001 for infor-mation systems security. More recently, the bourse has also certified its business conti-nuity management system.
Aware of the role of the capital market in eco-nomic development and the attractiveness of foreign investment, the authorities and opera-tors have initiated structural reforms to develop the supply side, making it easier for compa-nies to finance themselves, diversify demand, improve access for foreign and individual inves-tors, and secure the market by regulating and operating to international standards.
AmeritechAnonymousRobert D. ArnottTheodore R. Aronson, CFAAsahi Mutual Life Insurance CompanyBatterymarch Financial ManagementBoston CompanyBoston Partners Asset Management, L.P.Gary P. Brinson, CFABrinson Partners, Inc.Capital Group International, Inc.Concord Capital ManagementDai-Ichi Life Insurance CompanyDaiwa SecuritiesMr. and Mrs. Jeffrey DiermeierGifford Fong AssociatesJohn A. Gunn, CFAInvestment Counsel Association of America, Inc.Jacobs Levy Equity ManagementJon L. Hagler FoundationLong-Term Credit Bank of Japan, Ltd.Lynch, Jones & Ryan, LLCMeiji Mutual Life Insurance Company
Miller Anderson & Sherrerd, LLPJohn B. Neff, CFANikko Securities Co., Ltd.Nippon Life Insurance Company of JapanNomura Securities Co., Ltd.Payden & RygelProvident National BankFrank K. Reilly, CFASalomon BrothersSassoon Holdings Pte. Ltd.Scudder Stevens & ClarkSecurity Analysts Association of JapanShaw Data Securities, Inc.Sit Investment Associates, Inc.Standish, Ayer & Wood, Inc.State Farm Insurance CompanySumitomo Life America, Inc.T. Rowe Price Associates, Inc.Templeton Investment Counsel Inc.Frank Trainer, CFATravelers Insurance Co.USF&G CompaniesYamaichi Securities Co., Ltd.
Named EndowmentsCFA Institute Research Foundation acknowledges with sincere gratitude the generous contributions of the Named Endowment participants listed below.
Gifts of at least US$100,000 qualify donors for membership in the Named Endowment category, which recognizes in perpetuity the commitment toward unbiased, practitioner-oriented, relevant research that these firms and individuals have expressed through their generous support of the CFA Institute Research Foundation.
For more on upcoming CFA Institute Research Foundation publications and webcasts, please visit www.cfainstitute.org/research/foundation.
Senior Research FellowsFinancial Services Analyst Association
CFA InstituteResearch Foundation
Board of Trustees2019–2020
Officers and Directors
ChairTed Aronson, CFA
AJO
Heather Brilliant, CFADiamond Hill
Margaret Franklin, CFACFA Institute
Bill Fung, PhDAventura, FL
Daniel Gamba, CFABlackRock
JT Grier, CFA*Virginia Retirement System
Joanne HillCBOE Vest Financial
Roger Ibbotson*Yale School of Management
Joachim Klement, CFAIndependent
Vikram Kuriyan, PhD, CFAGWA and Indian School of Business
Aaron Low, CFALUMIQ
Mauro Miranda, CFAPanda Investimentos AAI Ltda.
Lotta Moberg, CFAWilliam Blair
Sophie Palmer, CFAJarislowsky Fraser
Dave Uduanu, CFASigma Pensions Ltd
Executive Director
Bud Haslett, CFACFA Institute
Gary P. Brinson Director of ResearchLaurence B. Siegel
Blue Moon Communications
Associate Research DirectorLuis Garcia-Feijóo, CFA, CIPM
Coral Gables, Florida
Secretary
Jessica LawsonCFA Institute
TreasurerKim Maynard
CFA Institute
Research Foundation Review Board
*Emeritus
William J. BernsteinEfficient Frontier Advisors
Elroy DimsonLondon Business School
Stephen FiglewskiNew York University
William N. GoetzmannYale School of Management
Elizabeth R. HilpmanBarlow Partners, Inc.
Paul D. Kaplan, CFAMorningstar, Inc.
Robert E. Kiernan IIIAdvanced Portfolio Management
Andrew W. LoMassachusetts Institute of Technology
Alan MarcusBoston College
Paul O’ConnellFDO Partners
Krishna RamaswamyUniversity of Pennsylvania
Andrew RuddAdvisor Software, Inc.
Stephen SexauerAllianz Global Investors Solutions
Lee R. ThomasPacific Investment Management Company

Available online at www.cfainstitute.org 9 781944 960872
ISBN 978-1-944960-87-2