Embed Size (px)
Citation preview

18th Australasian Fluid Mechanics ConferenceLaunceston, Australia3-7 December 2012
Reynolds-Averaged Navier-Stokes and Wall-Modelled Large -Eddy Simulations of SonicHydrogen Injection into Hypersonic Crossflow
R. M. Gehre, V. Wheatley, R. R. Boyce, D. M. Peterson and S. Bri eschenk
Centre for HypersonicsUniversity of Queensland, QLD 4072, Australia
Abstract
The combustion efficiency in supersonic combustion ramjets(scramjets) is strongly dependent on the fuel injection process.This paper investigates the transverse injection of hydrogeninto a hypersonic air crossflow at Mach 6 . The flow physicsare investigated using both Reynolds-averaged Navier-Stokes(RANS) simulations and wall-modelled large-eddy simulations(WMLES). We focus on the comparison of the results of thesetwo methods and their agreement with experimental tempera-ture measurements. Assessing the performance of RANS andits shortcomings in this context is of particular interest due toits significantly reduced computational costs and its widespreaduse in the hypersonics community compared to WMLES.
Introduction
The need to increase the efficiency of propulsion systems athigh Mach numbers has lead to the development of supersoniccombustion ramjets (scramjets). One of the major challengesin supersonic combustion is achieving a high combustion effi-ciency, which is often limited by the mixing efficiency. A stoi-chiometric fuel-air mixture is desirable for combustion [7], andachieving a high mixing efficiency is important. The mixingprocess and thus the mixing efficiency are strongly dependenton the fuel injection method. Commonly, porthole injectionisused to supply the scramjet with fuel [14, 9, 6, 2, 17]; however,a large variety of other injection methods, such as slot injection,injection behind a backward facing step and injection througha hypermixer have been investigated as well [7, 12]. This pa-per focuses on porthole injection, in particular on the numericalsimulation of the fuel-air mixing process employing two differ-ent numerical simulation techniques, Reynold-averaged Navier-Stokes (RANS) simulations and wall-modeled large-eddy sim-ulations (WMLES). RANS simulations are widespread in thehypersonic community due to their low computational resourcerequirements. Viti et al. [19] used RANS to investigate themain flow physics that are governing the porthole injection pro-cess and has shown that quasi-steady flow phenomena, such asshock structures and mean vortical structures, can be resolvedwell with RANS. Several studies that investigate porthole in-jection experimentally [1, 18] or with high fidelity numericalmethods, such as large-eddy simulation (LES) [8, 13], showthat inherently unsteady flow processes, such as vortex shed-ding, are occurring during the injection process. These unsteadyflow features cannot be captured with RANS and must be mod-eled. Hence, analyzing injection flow fields solely with RANScan lead to a distorted perception of the true flow physics and,depending on modeling accuracy, can result in discrepancies be-tween numerical and experimental results.
To address this issue, sonic hydrogen injection into Mach 6crossflow has been analyzed employing two numerical meth-ods, RANS and WMLES. The resulting averaged temperaturedistributions at the jet symmetry plane are compared with ex-perimental data. In particular, the distribution of hydrogen is ofimportance, since it has a major influence on the temperature
nozzle exit
compression ramp
field of view
plenum
ramp shock
injector bow shock
0 [mm] 100 200
cowl
120
UV laser sheet
Figure 1: Experimental arrangement to scale [3].
distribution and further downstream on the combustion process.We focus on features of the hydrogen distribution that RANSmodeling fails to predict accurately.
Experimental setup
Figure 1 shows the sonic hydrogen injection experiment, whichis part of a scramjet experiment. For clarity, only a brief descrip-tion of the experimental details relevant to the injection exper-iment is given. The experimental campaign was conducted inthe T-ADFA free piston shock-tunnel at the University of NewSouth Wales, Australian Defence Force Academy. The shock-tunnel provides high enthalpy flow, which is accelerated thougha conical nozzle, displayed in Figure 1, to hypersonic speeds.At the nozzle exit the freestream reaches a temperatureT∞ of140 K, a pressurep∞ of 675 Pa, a velocityu∞ of 2063 m/s anda Mach numberM∞ of ∼ 9. The hypersonic freestream im-pinges on the 9◦ compression ramp of the scramjet generatingan oblique shock wave as depicted in Figure 1. The flow con-ditions behind the shock wave are the following:T = 275 K,p = 3850 Pa,u = 1995 m/s andM ∼ 6. A 1.6 mm diameterporthole, which is located 120 mm downstream of the scramjetleading edge, angled at 81◦ to the flow along the compressionramp is used to inject sonic hydrogen with a plenum pressureof ppl = 2075 Pa into supersonic crossflow. The planar laser-induced fluorescence (PLIF) technique is used measure temper-atures at the jet symmetry plane by using the NO-moleculespresent in the freestream (NO-PLIF). This measurement tech-nique is non-intrusive and thus well suited for this particularapplication. Figure 2 displays the ensemble averaged tempera-ture measurements. For more information, the reader is referredto Brieschenk et al.[3].
Numerical method
The injector experiment is simulated using US3D, a researchcode developed at the University of Minnesota [11]. BothRANS and WMLES method are incorporated into the code. Theimproved delayed detached-eddy-simulation (IDDES) method,

x [m]
y[m
]
-0.01 0 0.01 0.02 0.03 0.04 0.05
0
0.005
0.01
0.015
0.02
0.025
0.03
0.035T
800
750
700
650
600
550
500
450
400
350
300
250
200
150
100
2
3
6
5
7
8
94
10
1
Figure 2: Experimental temperature distribution generated withNO-PLIF.which is described in detail by Peterson et al. [13], is usedfor WMLES. The Spalart-Allmaras turbulence model [15] isused to close the RANS equations and as the backgroundRANS model for IDDES [16]. To account for chemical non-equilibrium effects, the 12-species Evans-Schexnayder finite-rate chemistry model [5] is incorporated into US3D.
To achieve the best agreement with the experimental data thenozzle flow has been simulated to generate accurate inflow con-ditions for the scramjet model. Also, the entire scramjet inlethas been modeled. A preliminary investigation has shown thatthe corner vortices, which develop at the intersection betweenthe inlet compression ramp and the sidewalls, do not influencethe jet interaction flow field at the centerline. Therefore, onlythe region near the centerline, where the jet plume is present,is well resolved. With increasing distance from the centerlinethe spanwise resolution decreases to reduce the computationalcosts. The mesh has a total of 29,061,028 cells. At the injec-tor orifice the cell sizes (edge length) are smaller than 0.04 mm.With increasing distance from the injector the cell sizes increaseto 0.15mm. The chosen grid spacing ensures that more than80% of the turbulence kinetic energy is resolved, which indi-cates sufficient spacial resolution [10]. The mesh is clusteredtowards the walls to achievey+ < 1, resolving the develop-ing boundary layer. The time step used for WMLES is set to5× 10−9s to time accurately resolve the shear-layer develop-ment region. The time-average of the WMLES is calculatedover 50,000 iteration, thus over 250µs.
Results
This section analyses the temperature distribution generated bythe jet interaction. Furthermore, a comparison between thenu-merical and experimental data is conducted.
Figure 2 shows the experimentally determined ensemble-average temperature distribution at the jet symmetry plane. Toaid discussion, Fig. 2 is annotated with numbers from 1 to 10,each representing a specific zone in the temperature map. Therelative position of the temperature map in reference to theover-all experiment can be seen in Fig. 1. The flow enters the do-main on the left hand side. Zone 1 and 2 are positioned in thefreestream and in the post-leading-edge-shock region, respec-tively. The hydrogen injection creates a blockage in the flowfield, causing a bow-shock, a barrel shock (4) and an upstreamseparation zone (3). The volume enclosed by the barrel shock(4) contains pure hydrogen, which means that no meaningfultemperatures can be measured in the region using NO-PLIF. ASimilar problem occurs for region 8, which represents the hy-drogen plume region. Hence, large errors in the temperaturesare induced due to the marginal amounts of NO present. Thelarge temperature gradient observable in zone 7 is caused bythecooling effect of the hydrogen plume. The measurement sensi-tivity for this transition region is, however, very low [3],whichis inherent to the way the experimental measurements are ob-
x [m]
y [m
]
-0.01 0 0.01 0.02 0.03 0.04 0.05
0
0.005
0.01
0.015
0.02
0.025
0.03
0.035T
800750700650600550500450400350300250200150100
Figure 3: Time-averaged numerical (WMLES) translational-rotational temperature distributions in the jet symmetry plane.
x [m]
y[m
]
-0.01 0 0.01 0.02 0.03 0.04 0.05
0
0.005
0.01
0.015
0.02
0.025
0.03
0.035εRANS
(T)
1
0.9
0.8
0.7
0.6
0.5
0.4
0.3
0.2
0.1
0
Figure 4: Relative error between the experimental and numeri-cal (RANS) translational-rotational temperature distributions inthe jet symmetry plane.
x [m]
y[m
]
-0.01 0 0.01 0.02 0.03 0.04 0.05
0
0.005
0.01
0.015
0.02
0.025
0.03
0.035εWMLES
(T)
1
0.9
0.8
0.7
0.6
0.5
0.4
0.3
0.2
0.1
0
Figure 5: Relative error between the experimental and numeri-cal (WMLES) translational-rotational temperature distributionsin the jet symmetry plane.
tained. Further measurements would be necessary to increasethe sensitivity in this region. Hence, the temperatures in zone 7are unreliable and thus not usable for comparison, which is un-fortunate since the effect of vortex shedding on the temperaturedistribution can not be analyzed. Region 10 shows the influenceof the scramjet cowl, present in the experiment, which has notbeen incorporated into the numerical simulation. Therefore, thetemperature measurements in this region should be disregarded.Furthermore, the area underneath the cowl is not penetratedbythe laser sheet resulting in no temperature information.
Figure 3 shows the numerically generated temperature distribu-tion, using WMLES, in the jet symmetry plane, which agreeswell with the experimental data. For better comparison, Fig. 4and 5 display the relative error between the numerical and ex-perimental temperature distribution for RANS and WMLES, re-spectively. The qualitative agreement between the numericaland experimental results is excellent. The shock shapes, shockpositions and size of the separation zone are captured well byboth RANS and WMLES. The quantitative temperature com-parison, however, shows discrepancies. Taking the limitationsof the experimental setup into consideration, leaves zones1, 2,3, 5, 6 and 9 for comparison. The quantitative agreement of thenumerical data with the experimental data is excellent for zone1, 2 and 6, considering the experimental uncertainties [3].Therelative error in the remaining zones is increased; however, the
x [m]
y [m
]
-0.01 0 0.01 0.02 0.03 0.04 0.05
0
0.005
0.01
0.015
0.02
0.025
0.03
0.035αH2
1
0.9
0.8
0.7
0.6
0.5
0.4
0.3
0.2
0.1
0
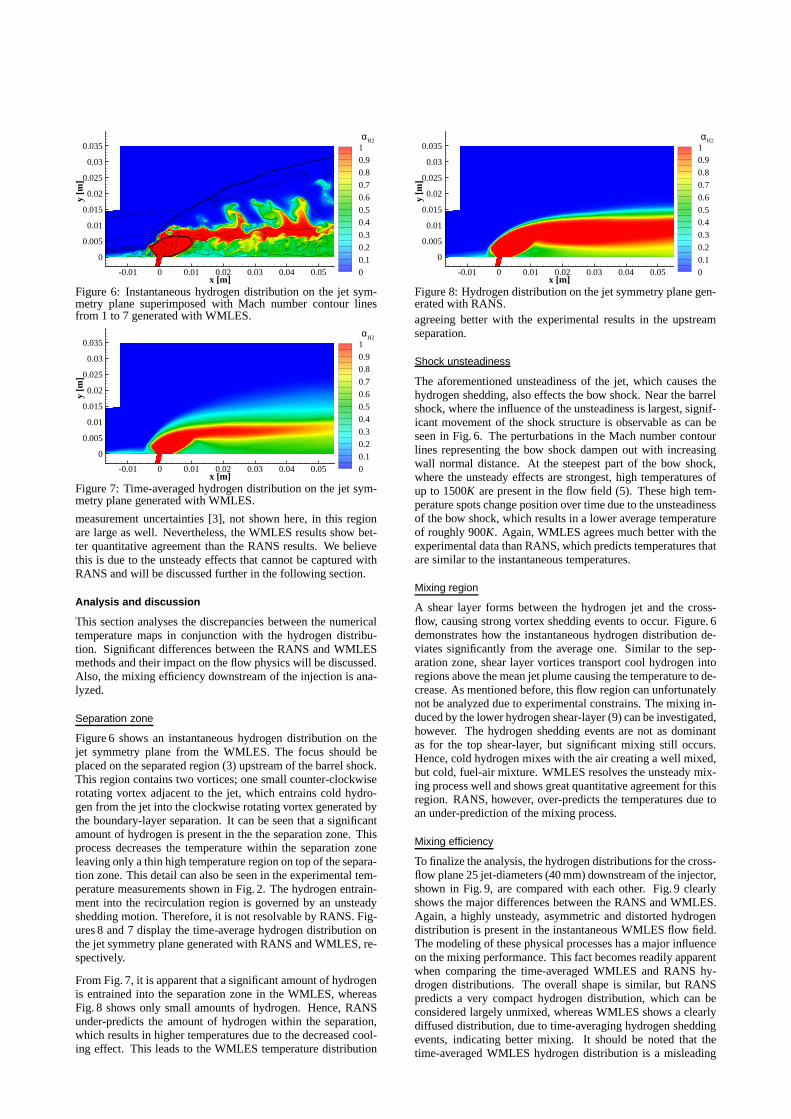
Figure 6: Instantaneous hydrogen distribution on the jet sym-metry plane superimposed with Mach number contour linesfrom 1 to 7 generated with WMLES.
x [m]
y [m
]
-0.01 0 0.01 0.02 0.03 0.04 0.05
0
0.005
0.01
0.015
0.02
0.025
0.03
0.035αH2
1
0.9
0.8
0.7
0.6
0.5
0.4
0.3
0.2
0.1
0
Figure 7: Time-averaged hydrogen distribution on the jet sym-metry plane generated with WMLES.
measurement uncertainties [3], not shown here, in this regionare large as well. Nevertheless, the WMLES results show bet-ter quantitative agreement than the RANS results. We believethis is due to the unsteady effects that cannot be captured withRANS and will be discussed further in the following section.
Analysis and discussion
This section analyses the discrepancies between the numericaltemperature maps in conjunction with the hydrogen distribu-tion. Significant differences between the RANS and WMLESmethods and their impact on the flow physics will be discussed.Also, the mixing efficiency downstream of the injection is ana-lyzed.
Separation zone
Figure 6 shows an instantaneous hydrogen distribution on thejet symmetry plane from the WMLES. The focus should beplaced on the separated region (3) upstream of the barrel shock.This region contains two vortices; one small counter-clockwiserotating vortex adjacent to the jet, which entrains cold hydro-gen from the jet into the clockwise rotating vortex generated bythe boundary-layer separation. It can be seen that a significantamount of hydrogen is present in the the separation zone. Thisprocess decreases the temperature within the separation zoneleaving only a thin high temperature region on top of the separa-tion zone. This detail can also be seen in the experimental tem-perature measurements shown in Fig. 2. The hydrogen entrain-ment into the recirculation region is governed by an unsteadyshedding motion. Therefore, it is not resolvable by RANS. Fig-ures 8 and 7 display the time-average hydrogen distributiononthe jet symmetry plane generated with RANS and WMLES, re-spectively.
From Fig. 7, it is apparent that a significant amount of hydrogenis entrained into the separation zone in the WMLES, whereasFig. 8 shows only small amounts of hydrogen. Hence, RANSunder-predicts the amount of hydrogen within the separation,which results in higher temperatures due to the decreased cool-ing effect. This leads to the WMLES temperature distribution
x [m]
y [m
]
-0.01 0 0.01 0.02 0.03 0.04 0.05
0
0.005
0.01
0.015
0.02
0.025
0.03
0.035αH2
1
0.9
0.8
0.7
0.6
0.5
0.4
0.3
0.2
0.1
0
Figure 8: Hydrogen distribution on the jet symmetry plane gen-erated with RANS.agreeing better with the experimental results in the upstreamseparation.
Shock unsteadiness
The aforementioned unsteadiness of the jet, which causes thehydrogen shedding, also effects the bow shock. Near the barrelshock, where the influence of the unsteadiness is largest, signif-icant movement of the shock structure is observable as can beseen in Fig. 6. The perturbations in the Mach number contourlines representing the bow shock dampen out with increasingwall normal distance. At the steepest part of the bow shock,where the unsteady effects are strongest, high temperatures ofup to 1500K are present in the flow field (5). These high tem-perature spots change position over time due to the unsteadinessof the bow shock, which results in a lower average temperatureof roughly 900K. Again, WMLES agrees much better with theexperimental data than RANS, which predicts temperatures thatare similar to the instantaneous temperatures.
Mixing region
A shear layer forms between the hydrogen jet and the cross-flow, causing strong vortex shedding events to occur. Figure. 6demonstrates how the instantaneous hydrogen distributionde-viates significantly from the average one. Similar to the sep-aration zone, shear layer vortices transport cool hydrogenintoregions above the mean jet plume causing the temperature to de-crease. As mentioned before, this flow region can unfortunatelynot be analyzed due to experimental constrains. The mixing in-duced by the lower hydrogen shear-layer (9) can be investigated,however. The hydrogen shedding events are not as dominantas for the top shear-layer, but significant mixing still occurs.Hence, cold hydrogen mixes with the air creating a well mixed,but cold, fuel-air mixture. WMLES resolves the unsteady mix-ing process well and shows great quantitative agreement forthisregion. RANS, however, over-predicts the temperatures duetoan under-prediction of the mixing process.
Mixing efficiency
To finalize the analysis, the hydrogen distributions for thecross-flow plane 25 jet-diameters (40 mm) downstream of the injector,shown in Fig. 9, are compared with each other. Fig. 9 clearlyshows the major differences between the RANS and WMLES.Again, a highly unsteady, asymmetric and distorted hydrogendistribution is present in the instantaneous WMLES flow field.The modeling of these physical processes has a major influenceon the mixing performance. This fact becomes readily apparentwhen comparing the time-averaged WMLES and RANS hy-drogen distributions. The overall shape is similar, but RANSpredicts a very compact hydrogen distribution, which can beconsidered largely unmixed, whereas WMLES shows a clearlydiffused distribution, due to time-averaging hydrogen sheddingevents, indicating better mixing. It should be noted that thetime-averaged WMLES hydrogen distribution is a misleading

z [m]
y [m
]
-0.01 0 0.010
0.01
0.02
0.03 (b)
z [m]
y [m
]
-0.01 0 0.010
0.01
0.02
0.03 (a)
z [m]
y [m
]
-0.01 0 0.010
0.01
0.02
0.03 (c)
αH2: 0 0.05 0.1 0.15 0.2 0.25 0.3 0.35 0.4 0.45 0.5 0.55 0.6 0.65 0.7 0.75 0.8 0.85 0.9 0.95 1
Figure 9: An a) instantaneous (WMLES) b) averaged WMLES and c) RANS hydrogen distribution at a cross-flow plane 25 jet-diameters downstream of injector.
representation of the mixing process [18], but yet helpful toidentify mixing regions. The mixing efficiency [4] at the afore-mentioned crossflow plane is 14.9% and 9.1% using WMLESand RANS, respectively. Thus RANS under-predicts the mixingefficiency, compared to WMLES, by more than 60%, which isan unphysical representation of the mixing process. The RANSresults can be improved by adjusting the turbulent Schmidt-number to increase the turbulent transport and thus increase themixing rate. This measure would, however, be dependent on thespecific test case and cause rather unphysical diffusive mixing,since the turbulent mass transport is modeled through a turbu-lent mass diffusion model.
Conclusions
The results presented clearly show the advantage of WMLESover RANS for the simulation of a jet in supersonic crossflow.The overall qualitative distributions are very similar, but quan-titatively large discrepancies arise where unsteady effects dom-inate the flow physics. RANS is not capable of capturing vortexshedding, which affects the temperature distribution in the sep-aration zone and the mixing region. Furthermore, the mixingprocess is largely under-predicted resulting in low mixingef-ficiencies, at least for the computational modeling used in thisstudy. These results indicate that WMLES is necessary to cor-rectly predict the mixing processes in scramjets.
Acknowledgements
The authors would like to thank Professor Graham Candler’s re-search group for providing the CFD research code. The researchis funded by the Australian Space Research Program. This workwas supported by an award under the Merit Allocation Schemeon the NCI National Facility at the ANU.
References
[1] Ben-Yakar, A. and Hanson, R. K., Ultra-fast-framingschlieren system for studies of the time evolution of jetsin supersonic crossflows,Experiments in Fluids, 32, 2002,652–666.
[2] Boyce, R. R., Schloegel, F., McIntyre, T. J. and Tirtey,S. C., Pressure-scaling of inlet-injection radical-farmingscramjets, in20th International Symposium on Airbreath-ing Engines, 2011.
[3] Brieschenk, S., Gehre, R. M., Wheatley, V., Boyce, R. R.,Kleine, H. and OByrne, S., Jet interaction in a hyper-sonic flow: A comparison between plif thermometry andcomputational simulation, ICAS, 2012, 28th InternationalCongress of the Aeronautical Sciences.
[4] Doster, J. C., King, P. I., Gruber, M. R., Carter, C. D.,Ryan, M. and K.Hsu, In-stream hypermixer fueling pylons
in supersonic flow,Journal of Propulsion and Power, 25,2009, 885–901.
[5] Evans, J. S. and Schexnayder, Jr., C. J., Influence ofChemical Kinetics and Unmixedness on Burning in Su-personic Hydrogen Flames,AIAA Journal, 18, 1980, 188–193.
[6] Gardner, A., Paull, A. and McIntyre, T., Upstream port-hole injection in a 2-d scramjet model,Shock Waves, 11,2002, 369375.
[7] Heiser, W. H. and Pratt, D. T.,Hypersonic AirbreathingPropulsion, AIAA Education Series, 1994.
[8] Kawai, S. and Lele, S. K., Large-eddy simulation of jetmixing in supersonic crossflows,AIAA Journal.
[9] McGuire, J. R., Boyce, R. R. and Mudford, N. R., Radi-cal farm ignition processes in two-dimensional supersoniccombustion,Journal of Propulsion and Power, 24, 2008,1248–1257.
[10] Naudin, A., Vervisch, L. and Domingo, P., A turbulent-energy based mesh refinement procedure for large eddysimulation, inAdvances in Turbulence XI, editors J. Palmaand A. S. Lopes, Springer Berlin Heidelberg, 2007, vol-ume 117 ofSpringer Proceedings in Physics, 413–415,10.1007/978-3-540-72604-3130.
[11] Nompelis, I., Drayna, T. W. and Candler, G. V., Develop-ment of a hybrid unstructured implicit solver for the sim-ulation of reacting flows over complex geometries, in 34th
AIAA Fluid Dynamics Conference, Portland, 2004.[12] Pandey, K. and Sivasakthivel, T., Recent advances in
scramjet fuel injection - a review,International Journalof Chemical Engineering and Applications, 1, 2010, 294–301.
[13] Peterson, D. M. and Candler, G. V., Hybrid reynolds-averaged and large-eddy simulation of normal injectioninto a supersonic crossflow,Journal of Propulsion andPower, 26, 2010, 533–544.
[14] Smart, M. K. and Hass, N. E., Flight data analysis of thehyshot 2 scramjet flight experiment,AIAA Journal, 44,2006, 2366–2375.
[15] Spalart, P. R. and Allmaras, S. R., One-equation turbu-lence model for aerodynamic flows,Rech Aerosp, 5–21.
[16] Subbareddy, P. K. V.,Stable Low-Dissipation Schemes forTurbulent Compressible Flows, Ph.D. thesis, University ofMinnesota, 2007.
[17] Turner, J. C. T.,An Experimental Investigation of InletFuel Injection in a Three-Dimensional Scramjet Engine,Ph.D. thesis, University of Queensland, Brisbane, Aus-tralia, 2010.
[18] VanLerberghe, W. M., Santiago, J. G., Dutton, J. C. andLucht, R. P., Mixing of a sonic transverse jet injected intoa supersonic flow,AIAA Journal, 38, 2000, 470–479.
[19] Viti, V., Neel, R. and Schetz, J. A., Detailed flow physicsof the supersonic jet interaction flow field,Physics of Flu-ids, 21, 2009, 046101.