Embed Size (px)
Citation preview
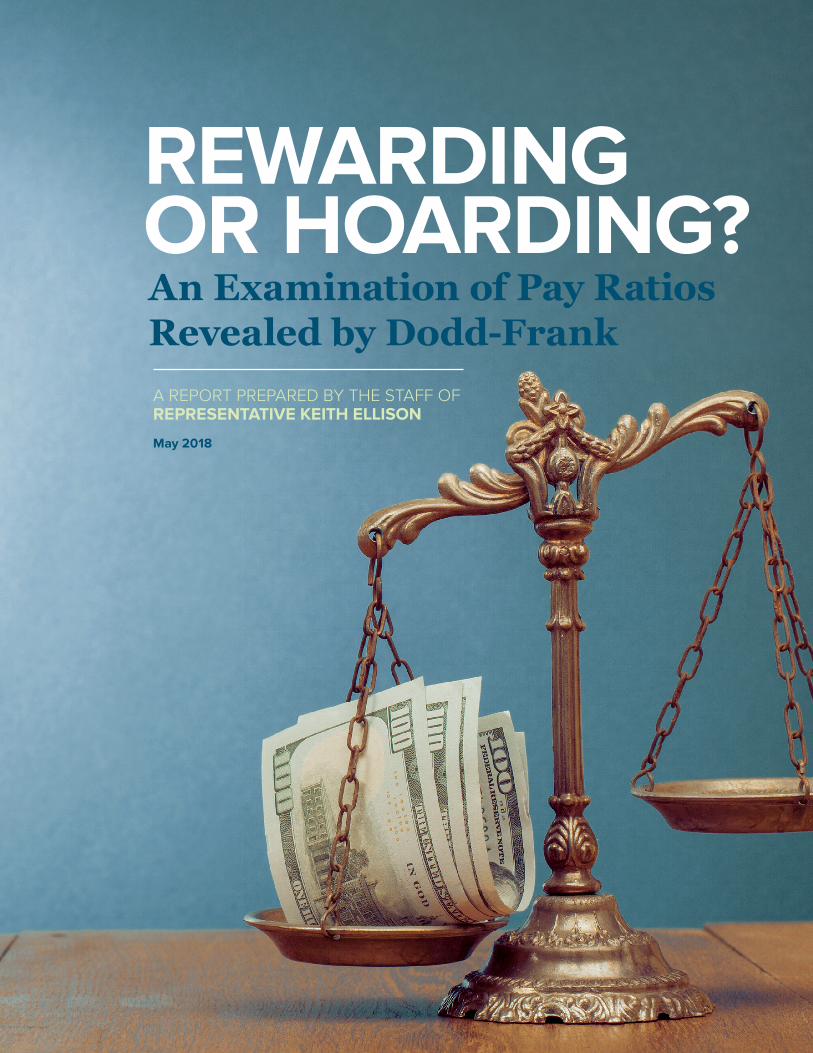
An Examination of Pay Ratios Revealed by Dodd-FrankA REPORT PREPARED BY THE STAFF OF REPRESENTATIVE KEITH ELLISONMay 2018
REWARDING OR HOARDING?

CONGRESSMAN KEITH ELLISON Representing Minnesota’s 5th District

Executive Summary
If your boss made your annual salary in less than a single day, how would you feel? Demoralized? Disgusted? Many Americans are now learning how pay is shared (or not).
For the first time in history, U.S. publicly held corporations are now required to report how much their CEO makes in comparison to the median salary of the other workers at the company. This new data source is the result of a hard-fought regulation mandated by Congress in the Dodd-Frank Wall Street Reform and Consumer Protection Act of 2010.
The CEO-worker pay ratio is a dramatic indicator of our country’s extreme economic divide. Beginning in the late 1970s, income inequality in the United States began to spiral upwards. However, this inequality was not driven by falling wages at the bottom of the income distribution. In fact, incomes for most Americans have been stagnant for four decades. Instead, this increase in income inequality was almost entirely driven by soaring compensation levels for the top 1% of income earners. Because about two-thirds of the top 1% of American households are headed by corporate executives, examining CEO pay is one key to understanding the takeoff in income inequality in the United States.
Top income earners increasingly earn their income at the expense of everyone else. In the 1970s, the top 1% of families earned less than 10% of the total national income earned by all workers; today, their share is greater than 20%. Despite increases in worker productivity over the course of the last four decades, workers are simply not earning a larger share of the output they produce.1
REWARDING OR HOARDING? An Examination of Pay Ratios Revealed by Dodd-Frank 1

CEO pay in the United States is also far out of line with CEO pay in other countries. According to a new Bloomberg analysis of twenty-two major countries, the United States’ average gap between CEO and worker pay far outpaces that of other industrialized nations. The average U.S. CEO makes more than four times the average pay of a CEO abroad.2
To better understand how pay rates for CEOs of the largest companies in America compare to the salaries of workers in the middle of the pay scale, Representative Ellison requested that his staff compile and analyze the ratios of the first 225 Fortune 500 companies to publicly disclose this information. These 225 companies combined employ more than 14 million workers and generate at least $6.3 trillion in revenue, which is more than a 25% of 2017’s fourth quarter GDP.3 This report finds:
Pay ratios of Fortune 500 companies range from 2:1 at the low end to nearly 5,000:1 at the high end. The average CEO to median worker pay ratio among all 225 companies is 339:1. For historical context, in 1965, the average CEO made 20 times the average worker.4
In 188 of the 225 companies in our database a single CEO’s pay could be used to pay more than 100 workers. A company’s ratio can also be read as the number of “median” workers who could be hired for the amount their CEO makes annually. At McDonalds, for example, the CEO’s annual salary could be used to pay the yearly wages of 3,101 workers making the median pay.5
Median employees in all but six companies in our database would need to work at least one 45-year career to earn what their CEO makes in a single year. For example, it would take the median employee at PepsiCo who works for a full 45-year career (age 18 to 63) more than 14 full careers (650 years) to make what their CEO makes annually (650/45=14.4).
The industry with the highest average ratio of CEO to worker pay is the consumer discretionary industry with a ratio of 977:1. This category includes companies that sell clothing and food such as McDonalds, Gap, and Kohl’s.
MAY 2237
$ 11.32977:1
105:1
2 Executive Summary
Introduction
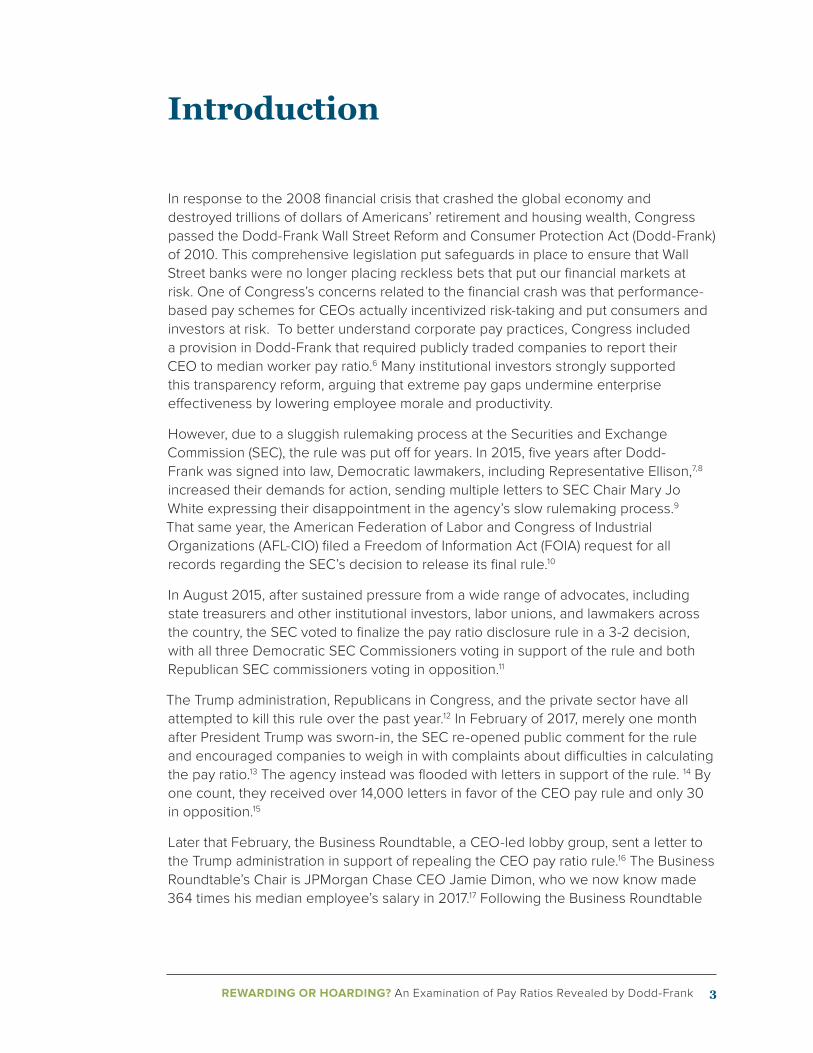
In response to the 2008 financial crisis that crashed the global economy and destroyed trillions of dollars of Americans’ retirement and housing wealth, Congress passed the Dodd-Frank Wall Street Reform and Consumer Protection Act (Dodd-Frank) of 2010. This comprehensive legislation put safeguards in place to ensure that Wall Street banks were no longer placing reckless bets that put our financial markets at risk. One of Congress’s concerns related to the financial crash was that performance-based pay schemes for CEOs actually incentivized risk-taking and put consumers and investors at risk. To better understand corporate pay practices, Congress included a provision in Dodd-Frank that required publicly traded companies to report their CEO to median worker pay ratio.6 Many institutional investors strongly supported this transparency reform, arguing that extreme pay gaps undermine enterprise effectiveness by lowering employee morale and productivity.
However, due to a sluggish rulemaking process at the Securities and Exchange Commission (SEC), the rule was put off for years. In 2015, five years after Dodd-Frank was signed into law, Democratic lawmakers, including Representative Ellison,7,8 increased their demands for action, sending multiple letters to SEC Chair Mary Jo White expressing their disappointment in the agency’s slow rulemaking process.9 That same year, the American Federation of Labor and Congress of Industrial Organizations (AFL-CIO) filed a Freedom of Information Act (FOIA) request for all records regarding the SEC’s decision to release its final rule.10
In August 2015, after sustained pressure from a wide range of advocates, including state treasurers and other institutional investors, labor unions, and lawmakers across the country, the SEC voted to finalize the pay ratio disclosure rule in a 3-2 decision, with all three Democratic SEC Commissioners voting in support of the rule and both Republican SEC commissioners voting in opposition.11
The Trump administration, Republicans in Congress, and the private sector have all attempted to kill this rule over the past year.12 In February of 2017, merely one month after President Trump was sworn-in, the SEC re-opened public comment for the rule and encouraged companies to weigh in with complaints about difficulties in calculating the pay ratio.13 The agency instead was flooded with letters in support of the rule. 14 By one count, they received over 14,000 letters in favor of the CEO pay rule and only 30 in opposition.15
Later that February, the Business Roundtable, a CEO-led lobby group, sent a letter to the Trump administration in support of repealing the CEO pay ratio rule.16 The Business Roundtable’s Chair is JPMorgan Chase CEO Jamie Dimon, who we now know made 364 times his median employee’s salary in 2017.17 Following the Business Roundtable
REWARDING OR HOARDING? An Examination of Pay Ratios Revealed by Dodd-Frank 3

letter, the Treasury Department recommended that the SEC repeal the rule.18 In March 2017, the Financial Services Roundtable, under then-President and CEO Tim Pawlenty, sent a letter to the SEC in support of further delaying the rule one year, to “allow time for Congress to review and repeal the mandate for the Pay Ratio Rule.”19
Despite powerful attempts to kill this rule, popular will prevailed. The first CEO-median worker pay ratio disclosures have been submitted to the SEC. This report is the first comprehensive analysis of CEO pay ratios of large, publicly traded companies.
4 Introduction

Calculating CEO Compensation
The SEC’s rule requires that a CEO’s compensation be identified in the Principal Executive Officer (PEO)’s “Total Compensation” column of a company’s publicly-available Summary Compensation Table (SCT) for the last completed fiscal year in a company’s annual proxy statement (DEF 14A).20 The terms “PEO” and “CEO” are used interchangeably here.21 This column includes salary, bonus, stock awards, option awards, non-equity incentive plan compensation, and change in pension value and nonqualified deferred compensation earnings. If a company has two or more subsequent PEOs in a single year, the company may add the multiple PEOs’ compensation together.22 Alternatively, a company may annualize one of their PEO’s salaries.23 For example, if a PEO worked at a company for six months and made $1,000,000 a company could report the PEO’s annualized compensation as $2,000,000.24
For consistency’s sake, calculating the annual total compensation of a PEO for the purpose of determining the pay ratio must “reflect the same approach”25 used to determine the median employee’s salary. The same approach only needs to be applied to the median employee, not all employees at the company.
Calculating Median Employee Compensation
The final pay ratio rule itself, and the SEC-issued interpretive guidance on the rule,26 allow for companies to calculate median employee salary using a number of different methods, including by using a statistical sample of the company’s workforce. To determine its CEO-median employee pay ratio, a company must identify a single employee whose compensation is at the midpoint of all employees in the sample who are not the company’s CEO.27
Although companies are required to report their ratios annually, a company can determine its median employee’s compensation once every three years if it
“reasonably believes”28 that there has been no change in the company’s employee population, and if the company’s employee compensation arrangements have not changed significantly from the previous year. An “employee” is defined as a person employed at any date of the company’s choosing in the last three months of the company’s last completed fiscal year.29 A company must identify the date used to determine its median employee.30 Part-time, temporary, seasonal, and full-time employees are required to be counted.31 Annualization is only permitted for full-time employees who have not worked the full fiscal year.32
Industry groups, particularly the National Retail Federation, pushed hard, and continue to push33 the SEC to allow companies to fully exclude part-time and seasonal workers in the calculation of median worker pay or allow firms to make their pay appear higher than it actually is by converting these precarious jobs into full-time equivalents. The
Methodology
REWARDING OR HOARDING? An Examination of Pay Ratios Revealed by Dodd-Frank 5
SEC refused,34 arguing that including actual pay figures “is more reflective of the actual composition of the registrant’s workforce and thus furthers the purpose of providing shareholders with useful information about a registrant’s overall compensation practices.”
A company’s median employee can be identified by using “reasonable estimates.”35 Companies are required to apply the same compensation measure across all employees. If a company identifies characteristics in their median employee’s salary that would skew their pay ratio, like a large one-time bonus, the company “may substitute another employee with substantially similar compensation to the original identified median employee based on the compensation measure it used to select the median employee.” 36 In identifying the median employee, companies may also make cost of living adjustments (COLA) to employee compensation when the employees live in a jurisdiction other than the one where the CEO resides.37
Although the rule requires both U.S. and non-U.S. employees to be counted, it allows a company to exempt non-U.S. employees where they make up five percent or less of the total number of employees.38 If a company’s total number of non-U.S. employees exceeds five percent of its total employees, that company may exclude up to five percent of its total non-U.S. employees. If a company excludes any non-U.S. employees, it needs to disclose the number of employees being excluded from each jurisdiction, and which jurisdictions are excluded.39 Additionally, it must disclose the total number of U.S. and non-U.S. employees working for it, regardless of any exemption. So, in order to exempt non-U.S. workers from its pay ratio reporting, a company must disclose additional data regarding their overseas employees, enhancing the transparency benefits of the regulation.40
Companies may present supplemental ratios and information in addition to the required ratio if they wish to do so, such as in cases where a large percentage of overseas employees creates a significantly different ratio. However, this is not required. If a
6 Methodology

company presents additional ratios or supplemental information, it must be identified as such, and cannot be misleading or more prominently displayed than the required ratio.41
Third-party contractors and leased workers may be excluded if they are employees of companies that are not “consolidated subsidiaries.”42 If the reporting company owns less than 50% of outstanding voting shares of the third-party company, its contractors or leased employees may generally be excluded.43 According to the SEC, excluding these workers is appropriate because their pay is determined outside the company itself.44
Compiling the Data
These data were compiled by Bloomberg from the SEC’s EDGAR database.45 We have limited our data to the first 225 Fortune 500 companies to file with the SEC. Bloomberg’s reported ratios are rounded to the nearest integer. For example, Bloomberg has reported Berkshire-Hathaway’s CEO pay ratio as “2,”46 while the calculated ratio is “1.87.”47 To check for discrepancies, we have included a “calculated ratio” tab in our full database online, using the calculated ratio of median employee salary and CEO pay as reported by Bloomberg.
In some cases, a company’s ratio as reported by Bloomberg and our “calculated ratio” differ. This could be due to a company changing the CEO’s pay from the SCT to be consistent with the measures used to calculate their median employee salary. They could also be due to rounding or reporting error by Bloomberg. The companies that fall into this category in our database are W.W. Grainger, Alaska Air, American Financial Group, Abbott Laboratories, and Archer Daniels Midland.
The “employee population” column is compiled from companies’ 10k filings. The total employee population that is used by companies in their proxy statements to calculate CEO to median employee pay ratio may differ. For instance, ManpowerGroup uses an employee pool that is substantially larger than the number of full-time employees reported in its 10k48 filing to calculate its median employee to CEO pay ratio.
Companies Exempted from the Rule
According to the SEC, approximately 3,571 companies are required to file ratio disclosures.49 Small reporting companies and companies defined as “emerging growth” under the Jumpstart Our Business Startups Act (JOBS Act) [15 U.S.C. 78c(a).] are exempted from filing a pay ratio disclosure.50 To meet the “emerging growth” threshold, the company (“issuer”) needs to have had total annual gross revenues of less than $1 billion in its most recently completed fiscal year. Snap Chat, for example, is considered an emerging growth company and therefore did not have to report a CEO-worker pay ratio this year, despite the fact that the firm’s CEO, Evan Spiegel, made $638 million.51 Companies based overseas are not required to file a pay ratio disclosure.
REWARDING OR HOARDING? An Examination of Pay Ratios Revealed by Dodd-Frank 7

“RONALD L. HAVNER, CEO, PUBLIC STORAGE61
Comparing what I do to the median employee is not even apples and oranges. It’s more like fruit compared to Star Wars. They don’t know how to allocate capital, and their educational level and skill set is vastly different…People have decisions to make as to whether they want to improve themselves and get higher paying jobs. Some people decide to do that and others don’t.”
MCDONALDS 14A FILING63
“McDonald’s is committed to a strong pay for performance culture that stresses “at risk” compensation in order to closely align their interests with those of shareholders.”
“[The pay ratio rule] is a cooked-up thing to embarrass firms with a lot of
part-time workers.” ALAN JOHNSON, MANAGING DIRECTOR OF THE PAY
CONSULTING FIRM JOHNSON ASSOCIATES62
CEOS AND FIRMS RESPOND TO PAY RATIO DISCLOSURES:
8 CEOs and Firms Respond to Pay Ratio Disclosures

The company with the smallest ratio in our database is Warren Buffett’s Berkshire Hathaway, with a ratio of 2:1. The company with the largest ratio is Mattel, a toy manufacturing company, with a ratio of 4,987:1.
The other companies in our database with ratios of over 1,000:1 are Mattel, McDonald’s, Gap, Live Nation Entertainment, Yum China Holdings, ManpowerGroup, Hanesbrands, Liberty Interactive, Yum! Brands, VF, Ross Stores, Kohl’s, and Walmart. The company with the highest-paid CEO is the event promoter and venue operator, Live Nation Entertainment, whose CEO made $70,615,760 in 2017. Berkshire Hathaway’s CEO, Warren Buffett, the country’s third-richest man, had the lowest pay in 2017 of any CEO in our database. He made $100,000 last year. The company with the highest-paid median worker in our database is Valero Energy, with annual earnings of $192,837. The company with the lowest-paid median worker is Yum China Holdings, whose median employee makes only $3,396 per year. Their median employee’s salary is so low because nearly all of their workers are in China, where worker pay is significantly lower than the United States. Additionally, roughly 60% of their 420,000 crewmembers are part-time and hourly workers.52
Findings
Companies with Top 25 CEO to median worker pay ratios
Company Name CEO Pay Median Worker Pay
Reported Ratio (:1) Employees Industry
Mattel $31,275,289 $6,271 4,987 28,000 Consumer Discretionary
McDonald’s $21,761,052 $7,017 3,101 235,000 Consumer Discretionary
Gap $15,587,186 $5,375 2,900 135,000 Consumer Discretionary
Live Nation Entertainment $70,615,760 $24,406 2,893 8,800 Consumer Discretionary
Yum China Holdings $9,571,017 $3,396 2,818 450,000 Consumer Discretionary
ManpowerGroup $11,987,783 $4,828 2,483 29,000 Industrials
Hanesbrands $9,581,985 $5,237 1,830 67,200 Consumer Discretionary
Liberty Interactive $47,809,756 $26,407 1,810 N/A Consumer Discretionary
Yum Brands $12,368,607 $9,111 1,358 60,000 Consumer Discretionary
VF $13,736,655 $10,151 1,353 69,000 Consumer Discretionary
Ross Stores $12,400,574 $9,437 1,314 82,700 Consumer Discretionary
Kohl’s $11,339,206 $8,976 1,264 33,000 Consumer Discretionary
REWARDING OR HOARDING? An Examination of Pay Ratios Revealed by Dodd-Frank 9
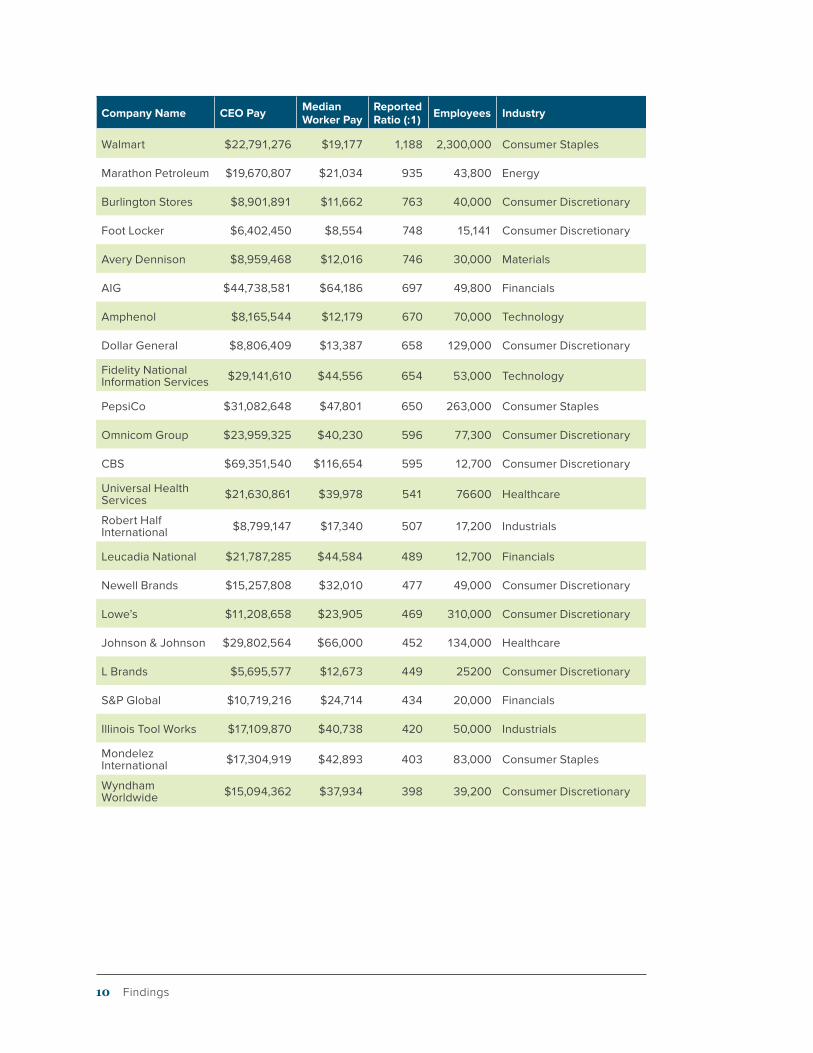
Company Name CEO Pay Median Worker Pay
Reported Ratio (:1) Employees Industry
Walmart $22,791,276 $19,177 1,188 2,300,000 Consumer Staples
Marathon Petroleum $19,670,807 $21,034 935 43,800 Energy
Burlington Stores $8,901,891 $11,662 763 40,000 Consumer Discretionary
Foot Locker $6,402,450 $8,554 748 15,141 Consumer Discretionary
Avery Dennison $8,959,468 $12,016 746 30,000 Materials
AIG $44,738,581 $64,186 697 49,800 Financials
Amphenol $8,165,544 $12,179 670 70,000 Technology
Dollar General $8,806,409 $13,387 658 129,000 Consumer Discretionary
Fidelity National Information Services $29,141,610 $44,556 654 53,000 Technology
PepsiCo $31,082,648 $47,801 650 263,000 Consumer Staples
Omnicom Group $23,959,325 $40,230 596 77,300 Consumer Discretionary
CBS $69,351,540 $116,654 595 12,700 Consumer Discretionary
Universal Health Services $21,630,861 $39,978 541 76600 Healthcare
Robert Half International $8,799,147 $17,340 507 17,200 Industrials
Leucadia National $21,787,285 $44,584 489 12,700 Financials
Newell Brands $15,257,808 $32,010 477 49,000 Consumer Discretionary
Lowe’s $11,208,658 $23,905 469 310,000 Consumer Discretionary
Johnson & Johnson $29,802,564 $66,000 452 134,000 Healthcare
L Brands $5,695,577 $12,673 449 25200 Consumer Discretionary
S&P Global $10,719,216 $24,714 434 20,000 Financials
Illinois Tool Works $17,109,870 $40,738 420 50,000 Industrials
Mondelez International $17,304,919 $42,893 403 83,000 Consumer Staples
Wyndham Worldwide $15,094,362 $37,934 398 39,200 Consumer Discretionary
10 Findings

A company’s CEO-to-median employee pay ratio can also be interpreted as the number of median employees a company can pay with their CEO’s salary. At the vast majority of companies in our database, you could pay 100 median employees or more with a CEO’s annual pay.
At over one-third of the companies in our database, you could pay between 100-199 median employees with a single CEO’s pay. A little less than half the CEOs in our database are paid in one year the amount it would take to employ between 200 and 4,987 median employees.
How many median employees could one CEO’s salary employ?
In all but six companies in our database, it would take the median employee more than one full career to make what their CEO makes in a single year.
For this calculation, we assume that a full career is 45 years of work (ages 18-63). At CVS Health, for example, the median worker would need to be on the job for 319 years, or more than seven full careers, to make their CEO’s annual salary. Old Republic International, Berkshire Hathaway, Host Hotels and Resorts, salesforce.com, XPO Logistics, and CMS Energy are the only six companies with CEOs who make less than a single career’s worth of work for their median employee.
How many careers would a median employee need to work to earn a CEO’s annual salary?
Mattel
McDonald’s
Gap
ManpowerGroup
Hanesbrands
Yum Brands
VF
Ross Stores
Kohl’s
111
69
64
55
41
30
30
29
28
Walmart 26
500-5000
12%
200-299
20%
100-199
36%
300-499
16%
Ratio:1-99
16% of companiesin database
MAY 2237
REWARDING OR HOARDING? An Examination of Pay Ratios Revealed by Dodd-Frank 11
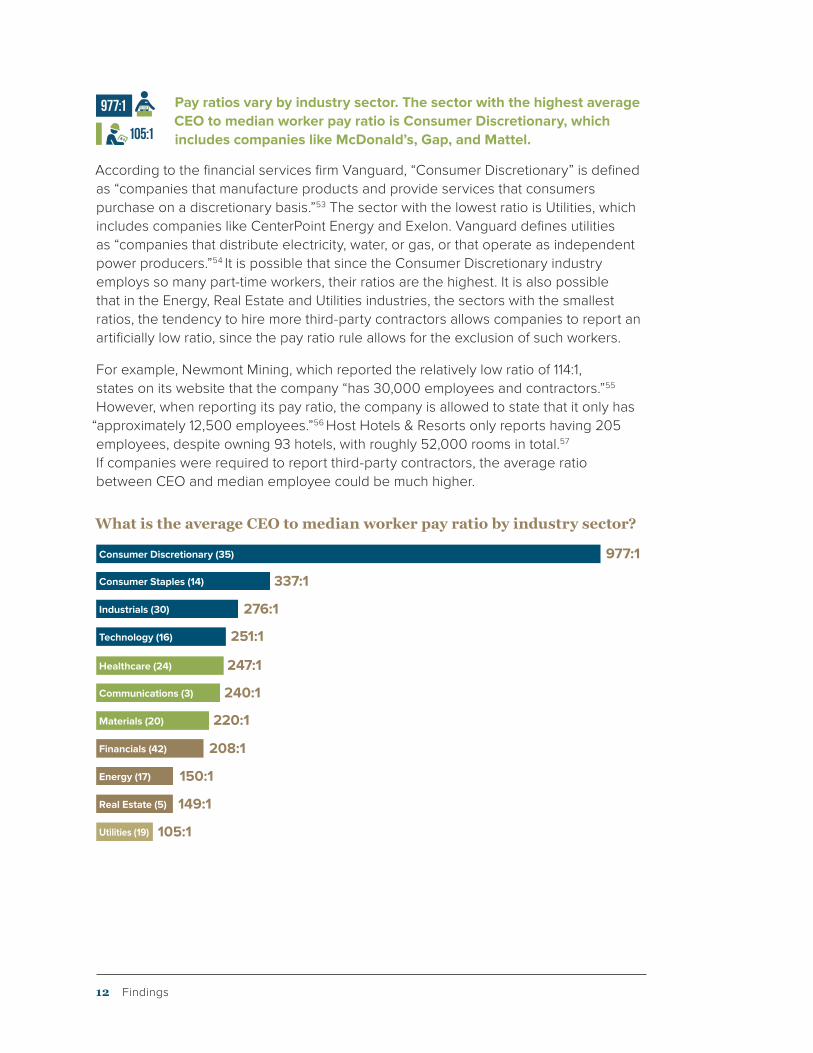
Pay ratios vary by industry sector. The sector with the highest average CEO to median worker pay ratio is Consumer Discretionary, which includes companies like McDonald’s, Gap, and Mattel.
According to the financial services firm Vanguard, “Consumer Discretionary” is defined as “companies that manufacture products and provide services that consumers purchase on a discretionary basis.”53 The sector with the lowest ratio is Utilities, which includes companies like CenterPoint Energy and Exelon. Vanguard defines utilities as “companies that distribute electricity, water, or gas, or that operate as independent power producers.”54 It is possible that since the Consumer Discretionary industry employs so many part-time workers, their ratios are the highest. It is also possible that in the Energy, Real Estate and Utilities industries, the sectors with the smallest ratios, the tendency to hire more third-party contractors allows companies to report an artificially low ratio, since the pay ratio rule allows for the exclusion of such workers.
For example, Newmont Mining, which reported the relatively low ratio of 114:1, states on its website that the company “has 30,000 employees and contractors.”55
However, when reporting its pay ratio, the company is allowed to state that it only has “approximately 12,500 employees.”56 Host Hotels & Resorts only reports having 205 employees, despite owning 93 hotels, with roughly 52,000 rooms in total.57 If companies were required to report third-party contractors, the average ratio between CEO and median employee could be much higher.
What is the average CEO to median worker pay ratio by industry sector?
977:1
276:1
337:1
247:1
251:1
240:1
220:1
208:1
150:1
Consumer Discretionary (35)
Industrials (30)
Consumer Staples (14)
Healthcare (24)
Technology (16)
Communications (3)
Materials (20)
Financials (42)
Energy (17)
Real Estate (5)
Utilities (19)
149:1
105:1
$ 11.32977:1
105:1
12 Findings

Academics and policymakers have come up with a number of ideas that could help curtail skyrocketing CEO pay and make our nation more equal. The most recent example comes from Portland, Oregon, where in 2016 the city council created a tax penalty for publicly traded companies with pay gaps higher than 100:1. The tax penalty increases proportionately for pay gaps higher than 100:1. This new ordinance went into effect this year. Several other city and state governments are looking at similar legislation.58
Other policymakers, including state legislators in Rhode Island, are considering an approach that would give companies with low CEO to worker pay ratios preferential treatment when bidding for government contracts. The President has broad discretion to set policies for federal contractors. During President Obama’s tenure his administration began requiring government contractors to pay a minimum wage of $10.10 (the federal minimum wage is only $7.25). The federal government also denies contracts to companies that contribute to racial and gender inequality through discrimination in their hiring and employment practices. Federal corporate subsidy policies could also be reformed to encourage companies to narrow their gaps.
Another policy option includes increasing taxes on top incomes. Prior to the Reagan administration, top marginal tax rates were more than 70%, and, not surprisingly, executive compensation levels were substantially lower. CEOs had no incentive to demand sky-high pay, since much of it would be taxed away anyway. Some economists have suggested that the optimal tax marginal rate for U.S. incomes today would be about 83%.59 Unfortunately, the recently passed Tax Cuts and Jobs Act of 2017 moves in the opposite direction, lowering the current top tax rate of 39.6% to 37% for tax years beginning in 2018.
REWARDING OR HOARDING? An Examination of Pay Ratios Revealed by Dodd-Frank 13
Policy Solutions
Before these data were published, we knew that on average, the CEO-worker pay gap had grown since the 1970s, and that the gap between CEO and median worker pay was severe. These new data give us a much clearer picture as to which corporations are sharing the wealth and which are not. Astoundingly, they tell us that that some Chief Executives make up to thousands of times what over half their employees make and that pay ratios are particularly large in the consumer discretionary industry. Additionally, the ability for companies to exclude third-party contractors, which sometimes count for over half of a company’s workforce, suggests that the true level of inequality between CEO pay and median worker pay is even higher than we observe in this report. This report demonstrates an urgent need for lawmakers to enact policies to address the historically severe gap between CEO and worker pay.
14 Conclusion
Conclusion

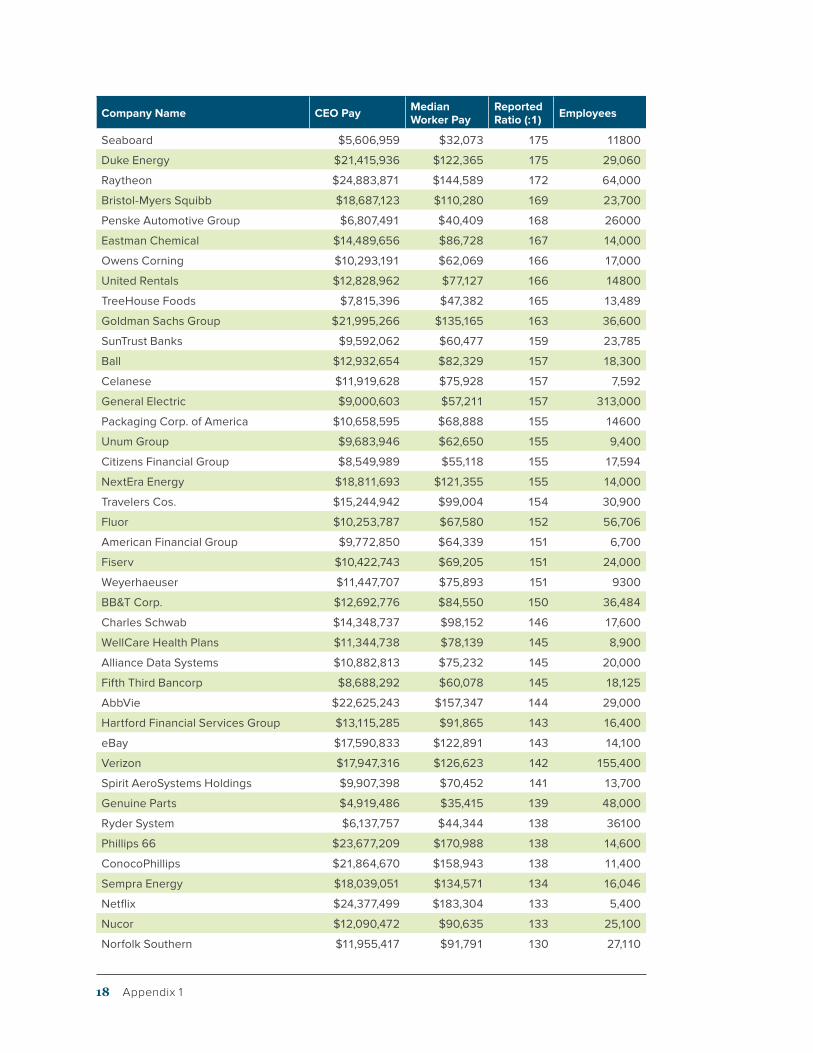
Full database
Company Name CEO Pay Median Worker Pay
Reported Ratio (:1) Employees
Mattel $31,275,289 $6,271 4,987 28,000
McDonald’s $21,761,052 $7,017 3,101 235,000
Gap $15,587,186 $5,375 2,900 135,000
Live Nation Entertainment $70,615,760 $24,406 2,893 8,800
Yum China Holdings $9,571,017 $3,396 2,818 450,000
ManpowerGroup $11,987,783 $4,828 2,483 29,000
Hanesbrands $9,581,985 $5,237 1,830 67,200
Liberty Interactive $47,809,756 $26,407 1,810 N/A
Yum Brands $12,368,607 $9,111 1,358 60,000
VF $13,736,655 $10,151 1,353 69,000
Ross Stores $12,400,574 $9,437 1,314 82,700
Kohl’s $11,339,206 $8,976 1,264 33,000
Walmart $22,791,276 $19,177 1,188 2,300,000
Marathon Petroleum $19,670,807 $21,034 935 43,800
Burlington Stores $8,901,891 $11,662 763 40,000
Foot Locker $6,402,450 $8,554 748 15,141
Avery Dennison $8,959,468 $12,016 746 30,000
AIG $44,738,581 $64,186 697 49,800
Amphenol $8,165,544 $12,179 670 70,000
Dollar General $8,806,409 $13,387 658 129,000
Fidelity National Information Services $29,141,610 $44,556 654 53,000
PepsiCo $31,082,648 $47,801 650 263,000
Omnicom Group $23,959,325 $40,230 596 77,300
CBS $69,351,540 $116,654 595 12,700
Universal Health Services $21,630,861 $39,978 541 76600
Robert Half International $8,799,147 $17,340 507 17,200
Leucadia National $21,787,285 $44,584 489 12,700
Newell Brands $15,257,808 $32,010 477 49,000
Lowe’s $11,208,658 $23,905 469 310,000
Johnson & Johnson $29,802,564 $66,000 452 134,000
L Brands $5,695,577 $12,673 449 25200
S&P Global $10,719,216 $24,714 434 20,000
Illinois Tool Works $17,109,870 $40,738 420 50,000
Mondelez International $17,304,919 $42,893 403 83,000
Wyndham Worldwide $15,094,362 $37,934 398 39,200
Appendix 1
REWARDING OR HOARDING? An Examination of Pay Ratios Revealed by Dodd-Frank 15

Company Name CEO Pay Median Worker Pay
Reported Ratio (:1) Employees
MGM Resorts International $14,579,720 $36,785 396 51,000
Cognizant Technology Solutions $12,478,392 $31,998 390 260,000
PPG Industries $14,249,861 $37,307 382 47,200
Centene $25,269,468 $66,600 379 33700
Hershey $10,600,386 $28,173 376 15,360
Citigroup $17,814,131 $48,249 369 209,000
AT&T $28,720,720 $78,437 366 254,000
J.P. Morgan Chase $28,320,175 $77,799 364 252,539
Stanley Black & Decker $16,236,936 $45,449 357 57,765
Whirlpool $7,082,024 $19,906 356 92,000
Corning $16,868,575 $47,410 356 46,200
Baxter International $14,933,664 $42,008 355 47,000
Bank of New York Mellon Corp. $19,837,535 $55,970 354 52,500
Humana $19,768,525 $57,385 344 47,900
Murphy USA $5,777,908 $16,831 343 5,400
Honeywell International $16,753,438 $50,296 333 131,000
Kimberly-Clark $16,209,534 $48,866 332 42000
Advance Auto Parts $6,127,997 $18,460 329 40,000
American Express $18,611,373 $56,873 327 55,000
Thermo Fisher Scientific $22,275,176 $68,732 324 70,000
3M $20,494,285 $63,338 324 91,536
Sherwin-Williams $13,513,194 $41,827 323 52,695
CVS Health $12,266,076 $38,372 320 160,000
Crown Holdings $11,939,960 $37,800 316 24,000
Pfizer $27,913,775 $89,206 313 90,200
Aflac $22,830,984 $76,089 300 11,318
UnitedHealth Group $17,404,604 $58,378 298 260,000
Western Union $9,726,400 $33,278 292 11,500
Wells Fargo $17,564,014 $60,446 291 262,700
Laboratory Corp. of America $11,646,254 $41,609 280 60,000
Cigna $17,595,792 $63,010 279 46,000
Tractor Supply $6,701,831 $24,108 278 14,000
Freeport-McMoRan $18,396,037 $66,490 277 25,200
Archer Daniels Midland $15,875,055 $57,345 276 31,300
Cummins $16,387,661 $59,682 275 58,600
PayPal Holdings $19,218,634 $70,228 274 18,700
UPS $14,619,684 $53,443 274 454,000
AutoNation $12,186,944 $45,543 268 26000
Prudential Financial $27,120,220 $101,067 268 49,705
Interpublic Group $16,883,818 $63,936 264 50,200
Anthem $18,578,802 $70,867 262 56,000
16 Appendix 1

Company Name CEO Pay Median Worker Pay
Reported Ratio (:1) Employees
Capital One Financial $16,175,770 $62,037 261 49,300
American Tower $13,119,417 $50,384 260 4,752
Abbott Laboratories $16,784,892 $75,679 251 99,000
Bank of America Corp. $21,791,812 $87,115 250 209,376
Univar $15,245,285 $60,904 250 8600
BorgWarner $14,085,523 $57,127 247 29,000
Ecolab $14,383,229 $60,556 238 48,400
Dover $9,952,918 $41,943 237 29,000
State Street Corp. $19,497,361 $82,760 236 36,643
Aetna $18,750,816 $79,720 235 47,950
United Technologies $17,027,493 $72,433 235 205,000
Huntsman $16,816,057 $72,506 232 10,000
International Paper $19,446,293 $84,701 230 56000
Coca-Cola $10,874,694 $47,312 230 61,800
Ameriprise Financial $23,914,109 $107,082 223 13,000
Assurant $9,274,743 $41,853 222 14,750
Lincoln National $14,963,035 $68,299 219 5,000
General Dynamics $21,501,429 $98,563 218 98,600
Quest Diagnostics $10,368,835 $48,194 215 45,000
Merck $17,643,087 $82,173 215 69,000
NCR $12,435,018 $58,506 213 34000
CenturyLink $14,715,560 $69,252 212 51,000
Intel $21,544,700 $102,210 211 102,700
Texas Instruments $16,573,019 $78,951 210 29,714
Dr Pepper Snapple Group $8,921,147 $42,689 209 21000
Stryker $14,005,086 $66,901 209 33,000
Goodyear Tire & Rubber $10,845,759 $52,704 206 64000
U.S. Bancorp $11,960,654 $58,269 205 72,402
Regions Financial $12,733,913 $63,174 202 21,714
PNC Financial Services Group $13,917,986 $69,190 201 50,358
Reliance Steel & Aluminum $11,357,647 $51,172 199 14,900
BlackRock $27,743,233 $141,987 195 13,900
American Airlines Group $12,175,486 $62,394 195 126,600
Jones Lang LaSalle $9,219,001 $48,000 192 82,000
Morgan Stanley $24,509,722 $127,863 192 57,633
AES $9,354,683 $49,229 190 N/A
Nordstrom $5,634,701 $30,105 187 72,500
Lockheed Martin $22,866,843 $123,231 186 100,000
Kellogg $7,344,238 $40,163 183 33,000
Chevron $24,781,568 $137,849 180 51,900
Sealed Air $10,900,704 $61,031 179 15,000
REWARDING OR HOARDING? An Examination of Pay Ratios Revealed by Dodd-Frank 17
Company Name CEO Pay Median Worker Pay
Reported Ratio (:1) Employees
Seaboard $5,606,959 $32,073 175 11800
Duke Energy $21,415,936 $122,365 175 29,060
Raytheon $24,883,871 $144,589 172 64,000
Bristol-Myers Squibb $18,687,123 $110,280 169 23,700
Penske Automotive Group $6,807,491 $40,409 168 26000
Eastman Chemical $14,489,656 $86,728 167 14,000
Owens Corning $10,293,191 $62,069 166 17,000
United Rentals $12,828,962 $77,127 166 14800
TreeHouse Foods $7,815,396 $47,382 165 13,489
Goldman Sachs Group $21,995,266 $135,165 163 36,600
SunTrust Banks $9,592,062 $60,477 159 23,785
Ball $12,932,654 $82,329 157 18,300
Celanese $11,919,628 $75,928 157 7,592
General Electric $9,000,603 $57,211 157 313,000
Packaging Corp. of America $10,658,595 $68,888 155 14600
Unum Group $9,683,946 $62,650 155 9,400
Citizens Financial Group $8,549,989 $55,118 155 17,594
NextEra Energy $18,811,693 $121,355 155 14,000
Travelers Cos. $15,244,942 $99,004 154 30,900
Fluor $10,253,787 $67,580 152 56,706
American Financial Group $9,772,850 $64,339 151 6,700
Fiserv $10,422,743 $69,205 151 24,000
Weyerhaeuser $11,447,707 $75,893 151 9300
BB&T Corp. $12,692,776 $84,550 150 36,484
Charles Schwab $14,348,737 $98,152 146 17,600
WellCare Health Plans $11,344,738 $78,139 145 8,900
Alliance Data Systems $10,882,813 $75,232 145 20,000
Fifth Third Bancorp $8,688,292 $60,078 145 18,125
AbbVie $22,625,243 $157,347 144 29,000
Hartford Financial Services Group $13,115,285 $91,865 143 16,400
eBay $17,590,833 $122,891 143 14,100
Verizon $17,947,316 $126,623 142 155,400
Spirit AeroSystems Holdings $9,907,398 $70,452 141 13,700
Genuine Parts $4,919,486 $35,415 139 48,000
Ryder System $6,137,757 $44,344 138 36100
Phillips 66 $23,677,209 $170,988 138 14,600
ConocoPhillips $21,864,670 $158,943 138 11,400
Sempra Energy $18,039,051 $134,571 134 16,046
Netflix $24,377,499 $183,304 133 5,400
Nucor $12,090,472 $90,635 133 25,100
Norfolk Southern $11,955,417 $91,791 130 27,110
18 Appendix 1
Company Name CEO Pay Median Worker Pay
Reported Ratio (:1) Employees
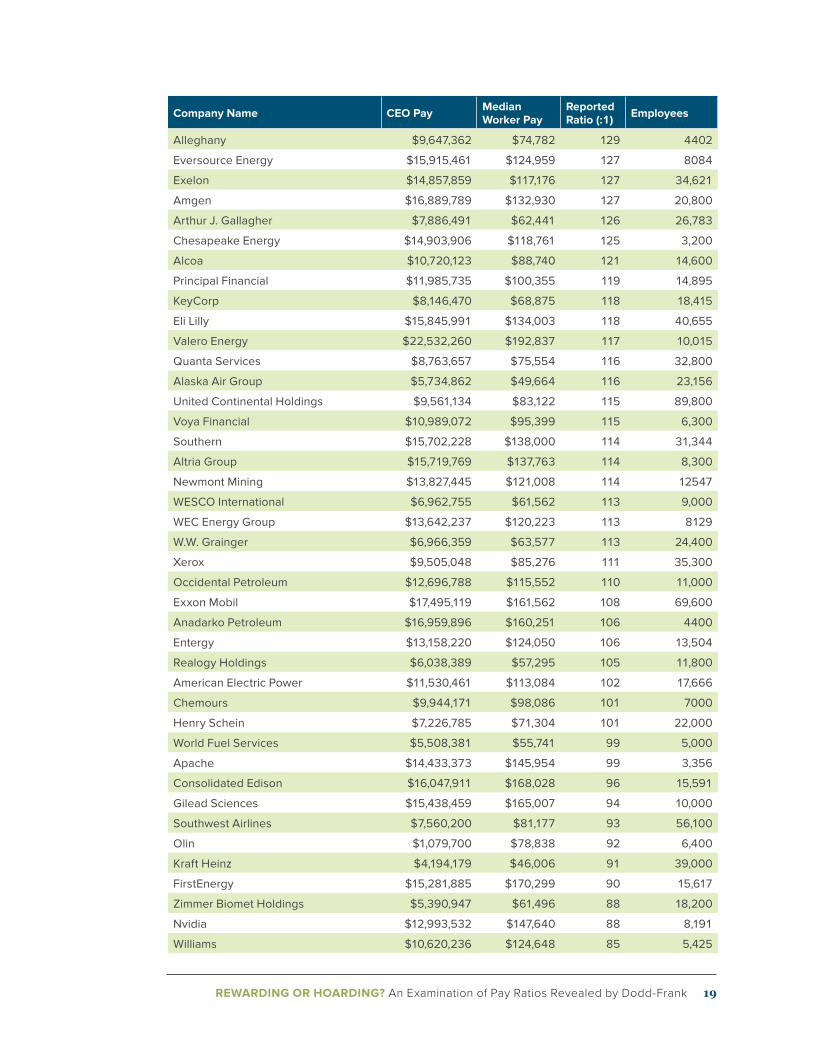
Alleghany $9,647,362 $74,782 129 4402
Eversource Energy $15,915,461 $124,959 127 8084
Exelon $14,857,859 $117,176 127 34,621
Amgen $16,889,789 $132,930 127 20,800
Arthur J. Gallagher $7,886,491 $62,441 126 26,783
Chesapeake Energy $14,903,906 $118,761 125 3,200
Alcoa $10,720,123 $88,740 121 14,600
Principal Financial $11,985,735 $100,355 119 14,895
KeyCorp $8,146,470 $68,875 118 18,415
Eli Lilly $15,845,991 $134,003 118 40,655
Valero Energy $22,532,260 $192,837 117 10,015
Quanta Services $8,763,657 $75,554 116 32,800
Alaska Air Group $5,734,862 $49,664 116 23,156
United Continental Holdings $9,561,134 $83,122 115 89,800
Voya Financial $10,989,072 $95,399 115 6,300
Southern $15,702,228 $138,000 114 31,344
Altria Group $15,719,769 $137,763 114 8,300
Newmont Mining $13,827,445 $121,008 114 12547
WESCO International $6,962,755 $61,562 113 9,000
WEC Energy Group $13,642,237 $120,223 113 8129
W.W. Grainger $6,966,359 $63,577 113 24,400
Xerox $9,505,048 $85,276 111 35,300
Occidental Petroleum $12,696,788 $115,552 110 11,000
Exxon Mobil $17,495,119 $161,562 108 69,600
Anadarko Petroleum $16,959,896 $160,251 106 4400
Entergy $13,158,220 $124,050 106 13,504
Realogy Holdings $6,038,389 $57,295 105 11,800
American Electric Power $11,530,461 $113,084 102 17,666
Chemours $9,944,171 $98,086 101 7000
Henry Schein $7,226,785 $71,304 101 22,000
World Fuel Services $5,508,381 $55,741 99 5,000
Apache $14,433,373 $145,954 99 3,356
Consolidated Edison $16,047,911 $168,028 96 15,591
Gilead Sciences $15,438,459 $165,007 94 10,000
Southwest Airlines $7,560,200 $81,177 93 56,100
Olin $1,079,700 $78,838 92 6,400
Kraft Heinz $4,194,179 $46,006 91 39,000
FirstEnergy $15,281,885 $170,299 90 15,617
Zimmer Biomet Holdings $5,390,947 $61,496 88 18,200
Nvidia $12,993,532 $147,640 88 8,191
Williams $10,620,236 $124,648 85 5,425
REWARDING OR HOARDING? An Examination of Pay Ratios Revealed by Dodd-Frank 19

Company Name CEO Pay Median Worker Pay
Reported Ratio (:1) Employees
Ally Financial $8,848,062 $105,515 84 7900
CenterPoint Energy $8,024,525 $96,573 83 8000
CDW $6,987,003 $85,701 82 8726
Public Service Enterprise Group $10,621,115 $132,480 80 12,945
NRG Energy $9,049,662 $112,446 80 5490
United States Steel $5,618,557 $72,635 77 29,200
HollyFrontier $9,907,151 $131,612 75 3,522
M&T Bank Corp. $4,167,972 $57,571 72 16,794
EOG Resources $10,573,685 $146,016 72 2664
Ameren $8,080,790 $122,003 66 8615
Edison International $9,794,301 $157,112 62 12,521
PG&E Corp. $8,597,220 $140,263 61 23000
PBF Energy $8,923,488 $149,953 60 3,165
Huntington Ingalls Industries $7,974,179 $132,546 60 38,000
Amazon.com $1,681,840 $28,446 59 566,000
Markel $2,369,922 $41,285 57 15,600
Cincinnati Financial $4,978,956 $91,647 54 4,925
Oneok $5,608,945 $105,847 53 2,470
Targa Resources $5,321,895 $103,207 52 2130
NVR $3,538,600 $69,147 51 5200
CMS Energy $6,862,295 $167,636 41 7,822
XPO Logistics $1,384,021 $36,885 38 95,000
Old Republic International $2,644,635 $71,948 37 8,700
Host Hotels & Resorts $6,224,265 $179,574 35 205
salesforce.com $4,653,362 $155,284 30 29,401
Berkshire Hathaway $100,000 $53,510 2 377,000
20 Appendix 1

Sector Definitions from Vanguard:60
Consumer Discretionary Companies that manufacture products and provide services that consumers purchase on a discretionary basis.
Consumer Staples Companies that provide direct-to-consumer products that, based on consumer purchasing habits, are typically considered nondiscretionary.
Energy Companies involved in the exploration and production of energy products, such as oil, natural gas, and coal.
Financials Companies that provide financial services.
Health Care Companies involved in providing medical or health care products, services, technology, or equipment.
Industrials Companies that convert unfinished goods into finished durables used to manufacture other goods or provide services. A product which lasts 1–3 years is considered
“durable.”
Information Technology (Technology) Companies that serve the electronics and computer industries or that manufacture products based on the latest applied science.
Materials Companies that extract or process raw materials.
Telecommunication Services Companies that provide telephone, data-transmission, cellular, or wireless communication services.
Utilities Companies that distribute electricity, water, or gas, or that operate as independent power producers.
Appendix 2
REWARDING OR HOARDING? An Examination of Pay Ratios Revealed by Dodd-Frank 21

1 Anderson, S. “Policy Brief: The CEO-Worker Pay Gap.” Institute for Policy Studies. (February 18). Online at: https://inequality.org/wp-content/uploads/2018/02/CEO-worker-pay-ratio-policy-brief.pdf.
2 Melin, A. “CEOs in US, India earn the most compared with average workers.” Bloomberg. (December 28, 2017). Online at: https://www.bloomberg.com/news/articles/2017-12-28/ceos-in-u-s-india-earn-the-most-compared-with-average-workers.
3 “Gross Domestic Product (GDP).” Federal Reserve Bank of St. Louis. (2018). Online at: https://fred.stlouisfed.org/series/GDP.
4 Mishel, L. “Report: CEO pay remains high relative to the pay of typical workers and high-wage earners.” Economic Policy Institute. p. 2. (July 20, 2017). Online at: https://www.epi.org/files/pdf/130354.pdf.
5 “Ellison CEO-Worker Pay Ratio Database.” Staff of Congressman Keith Ellison. (2018).
6 “Timeline: the pay ratio regulation’s long and bumpy road.” Public Citizen. (February 13, 2018). Online at: https://www.citizen.org/media/press-releases/ceo-worker-pay-ratio-data-being-revealed-first-time.
7 “Letter to SEC Chair Mary Jo White.” Congressman Keith Ellison. (March 18, 2015). Online at: https://ellison.house.gov/sites/ellison.house.gov/files/wysiwyg_uploaded/2015%20March%2017%20Ellison%20Grijalva%20Waters%20CEO-median%20worker%20pay%20ratio%20letter....pdf.
8 “Letter to SEC Chair Mary Jo White.” Congressman Keith Ellison. (July 27, 2015). Online at: https://ellison.house.gov/sites/ellison.house.gov/files/wysiwyg_uploaded/2015%20July%2027%20Ellison%20Waters%20Grijalva%20et%20al%20letter%20to%20Chair%20White%20on%20CEO%20Median%20Worker%20pay%20ratio.pdf.
9 Ibid. 10 “FOIA request from AFL-CIO.” AFL-CIO. (July
9, 2015). Online at: https://drive.google.com/file/d/0B1hw4csNsPTBbFRZdFlVUGpnZWs/view.
11 “SEC Adopts Rule for Pay Ratio Disclosure.” Securities and Exchange Commission. (August 15, 2015). Online at: https://www.sec.gov/news/pressrelease/2015-160.html.
12 “Reconsideration of Pay Ratio Rule Implementation.” Securities and Exchange Commission. (Feb. 6, 2017). Online at: https://www.sec.gov/news/statement/reconsideration-of-pay-ratio-rule-implementation.html.
13 Ibid.14 “Comments on the Statement on the
Commission’s Pay Ratio Rule.” Securities and Exchange Commission. (2017) Online at: https://www.sec.gov/comments/pay-ratio-statement/payratiostatement.htm.
15 Hoang, C. “SEC Commissioner Addresses Prospects for CEO Pay Ratio.” JD Supra. (July 3, 2017). Online at: https://www.jdsupra.com/legalnews/sec-commissioner-addresses-prospects-92975/.
16 “Concern Letter and List to Gary Cohn.” Business Roundtable. (February 22, 2017). Online at: https://businessroundtable.org/sites/default/files/Regulations%20of%20Concern%20Letter%20and%20List%20170222.pdf.
17 “Ellison CEO-Worker Pay Ratio Database.” Staff of Congressman Keith Ellison. (2018).
18 “A Financial System That Creates Economic Opportunities: Capital Markets.” U.S. Department of the Treasury. (October 2017). Online at: https://www.treasury.gov/press-center/press-releases/Documents/A-Financial-System-Capital-Markets-FINAL-FINAL.pdf.
19 “Re: Reconsideration of Pay Ratio Rule Implementation.” Financial Services Roundtable. (March 23, 2017). Online at: https://www.sec.gov/comments/pay-ratio-statement/cll3-1664367-148914.pdf.
20 “Pay Ratio Disclosure Final Rule.” Securities and Exchange Commission. p. 128. (October 19, 2015). Online at: https://www.sec.gov/rules/final/2015/33-9877.pdf.
21 Ibid. p. 922 Ibid. p. 8823 Ibid. p. 8824 Ibid. p. 9025 Ibid. p. 13326 “Commission Guidance on Pay Ratio
Disclosure.” Securities and Exchange Commission. (September 27, 2017). Online at: https://www.sec.gov/rules/interp/2017/33-10415.pdf.
Endnotes
22 Endnotes
27 “Pay Ratio Disclosure Final Rule.” Securities and Exchange Commission, p. 36. (October 19, 2015). Online at: https://www.sec.gov/rules/final/2015/33-9877.pdf.
28 “Pay Ratio Disclosure Final Rule.” Securities and Exchange Commission. p. 95. (October 19, 2015). Online at: https://www.sec.gov/rules/final/2015/33-9877.pdf.
29 Ibid. p. 3230 Ibid. p. 3231 Ibid. p. 5032 Ibid. p. 9333 Shay, M. Pay-ratio rule dings retail industry
for the opportunities it creates for part-time workers. CNBC.com (March 15, 2018). Online at: https://www.cnbc.com/2018/03/15/pay-ratio-rule-dings-retailers-for-its-part-time-work-force.html.
34 “Pay Ratio Disclosure Final Rule.” Securities and Exchange Commission. p. 128. (October 19, 2015). Online at: https://www.sec.gov/rules/final/2015/33-9877.pdf.
35 “Commission Guidance on Pay Ratio Disclosure.” Securities and Exchange Commission. (September 27, 2017). Online at: https://www.sec.gov/rules/interp/2017/33-10415.pdf.
36 Ibid. p. 537 “Pay Ratio Disclosure Final Rule.” Securities
and Exchange Commission. p. 14. (October 19, 2015). Online at: https://www.sec.gov/rules/final/2015/33-9877.pdf.
38 Ibid. p. 2839 Ibid. p. 2940 Ibid. p. 2941 Ibid. p. 5142 Ibid. p. 5043 Ibid. p. 8644 Ibid. p. 8745 Ritcey, A. “McDonald’s CEO Earned 3,101
Times More Than Median Employee.” Bloomberg. (February 12, 2018). Online at: https://www.bloomberg.com/graphics/ceo-pay-ratio/.
46 Ibid. 47 “Ellison CEO-Worker Pay Ratio Database.”
Staff of Congressman Keith Ellison. (2018).48 “ManpowerGroup 10K Filing.” Securities
and Exchange Commission. p. 9. Online at: https://www.sec.gov/Archives/edgar/data/871763/000087176318000070/man-123117x10k.htm.
49 “Pay Ratio Disclosure Final Rule.” Securities and Exchange Commission. p. 172. (October 19, 2015). Online at: https://www.sec.gov/rules/final/2015/33-9877.pdf.
50 Ibid p. 4351 Snap Chat 10-K report. Online at:
https://www.sec.gov/Archives/edgar/data/1564408/000156459018002721/snap-10k_20171231.htm
52 “Yum China Holdings 14A filing.” Securities and Exchange Commission. p. 59. Online at: https://www.sec.gov/Archives/edgar/data/1673358/000119312518102722/d478873ddef14a.htm.
53 “Sector Overviews.” Vanguard. Online at: https://personal.vanguard.com/us/content/Funds/FundsToolsSectorDefinitionJSP.jsp.
54 Ibid. 55 “About Us.” Newmont Mining Corporation.
Online at: https://www.newmont.com/about-us/default.aspx.
56 “Newmont Mining 14A filing” Securities and Exchange Commission. Online at: https://www.sec.gov/Archives/edgar/data/1164727/000120677418000734/newmont3275831-def14a.htm#pg99.
57 “Host Hotels and Resorts, Inc. 2017 Form 10-K Annual Report” Securities and Exchange Commission. (2018) Online at: https://www.sec.gov/Archives/edgar/data/1061937/000156459018003330/hst-10k_20171231.htm.
58 For updated links to legislation, see: https://inequality.org/action/corporate-pay-equity.
59 Piketty, T. “Optimal Taxation of Top Labor Incomes: A Tale of Three Elasticities.” American Journal of Economic Policy. p. 233. (2014). Online at: https://eml.berkeley.edu/~saez/piketty-saez-stantchevaAEJ14.pdf.
60 “Sector Overviews.” Vanguard. Online at: https://personal.vanguard.com/us/content/Funds/FundsToolsSectorDefinitionJSP.jsp.
61 Roosevelt, M. “How much does your CEO make compared to you? Now, that ratio is public.” The Mercury News. (April 13, 2018). Online at: https://www.mercurynews.com/2018/04/13/how-much-does-your-ceo-make-compared-to-you-now-that-ratio-is-public/.
62 Goldstein, M. “As C.E.O. Pay Packages Grow, Top Executives Have the President’s Ear.” The New York Times. (May 26, 2017). Online at: https://www.nytimes.com/2017/05/26/business/ceo-compensation-pay-president-donald-trump.html.
63 “McDonald’s 14A Filing.” Securities and Exchange Commission. p. 13. Online at: https://www.sec.gov/Archives/edgar/data/63908/000120677418001176/mcd3291681-def14a.htm.
REWARDING OR HOARDING? An Examination of Pay Ratios Revealed by Dodd-Frank 23

CONGRESSMAN KEITH ELLISON Representing Minnesota’s 5th District
ellison.house.gov facebook.com/keith.ellison @keithellison