Embed Size (px)
Citation preview
“Understanding net benefits and cost for different energy efficient refrigeration design options ” Save the date: 22nd July 2020
Time: 15:00 CEST
Speaker: Omar Abdelaziz, Ph.D.,
Member ASHRAE, Assistant Professor of Thermofluids at Zewail City of Science and Technology
Moderator: Nigel CottonTwitter: @nigeldrcotton
Starting soon
#EERefrigeration20
1
Nigel CottonModerator@nigeldrcotton
2
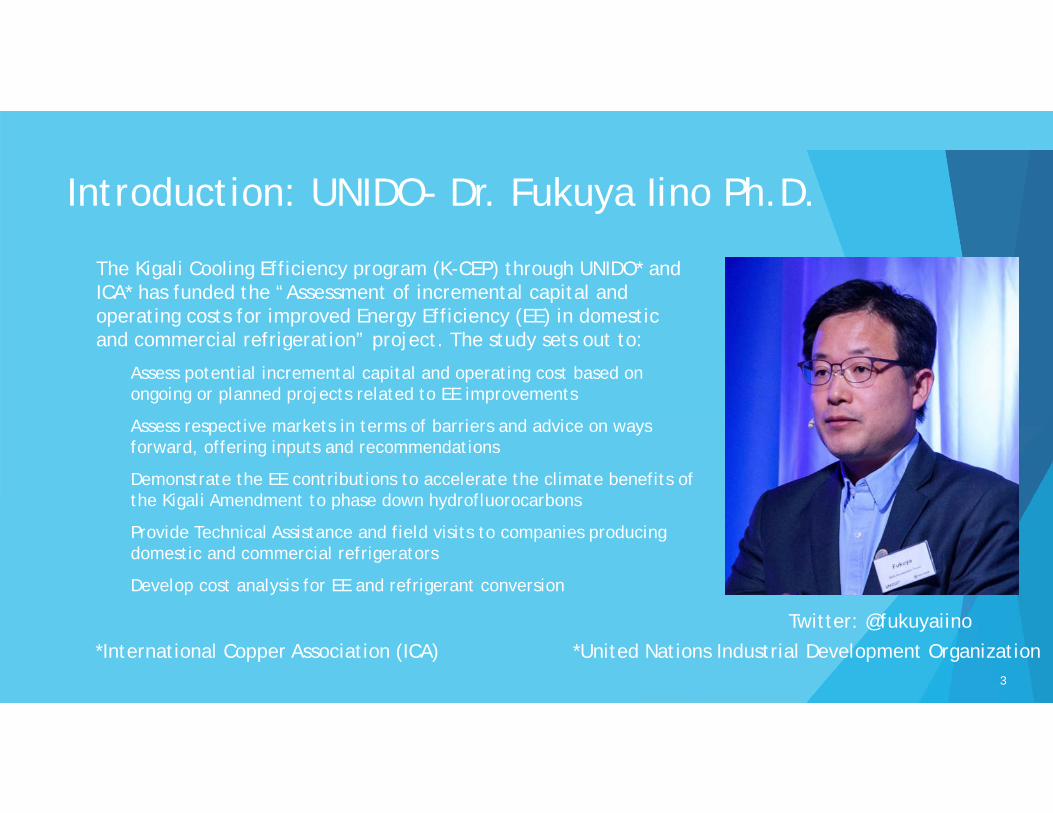
Introduction: UNIDO- Dr. Fukuya Iino Ph.D.
The Kigali Cooling Efficiency program (K-CEP) through UNIDO* and ICA* has funded the “Assessment of incremental capital and operating costs for improved Energy Efficiency (EE) in domestic and commercial refrigeration” project. The study sets out to:
Assess potential incremental capital and operating cost based on ongoing or planned projects related to EE improvements
Assess respective markets in terms of barriers and advice on ways forward, offering inputs and recommendations
Demonstrate the EE contributions to accelerate the climate benefits of the Kigali Amendment to phase down hydrofluorocarbons
Provide Technical Assistance and field visits to companies producing domestic and commercial refrigerators
Develop cost analysis for EE and refrigerant conversion
*International Copper Association (ICA) *United Nations Industrial Development Organization3
Twitter: @fukuyaiino
“Understanding net benefits and cost for different energy efficient refrigeration design options ”
Dr. Omar Abdelaziz #EERefrigeration20
4
Poll Question # 1
Please select the category that best describes your role:a) Domestic refrigerator manufacturer
b) Commercial refrigerator manufacturer
c) OEM (compressors, heat exchangers, fans, motors, etc.)
d) R&D consultant
e) Academia
5
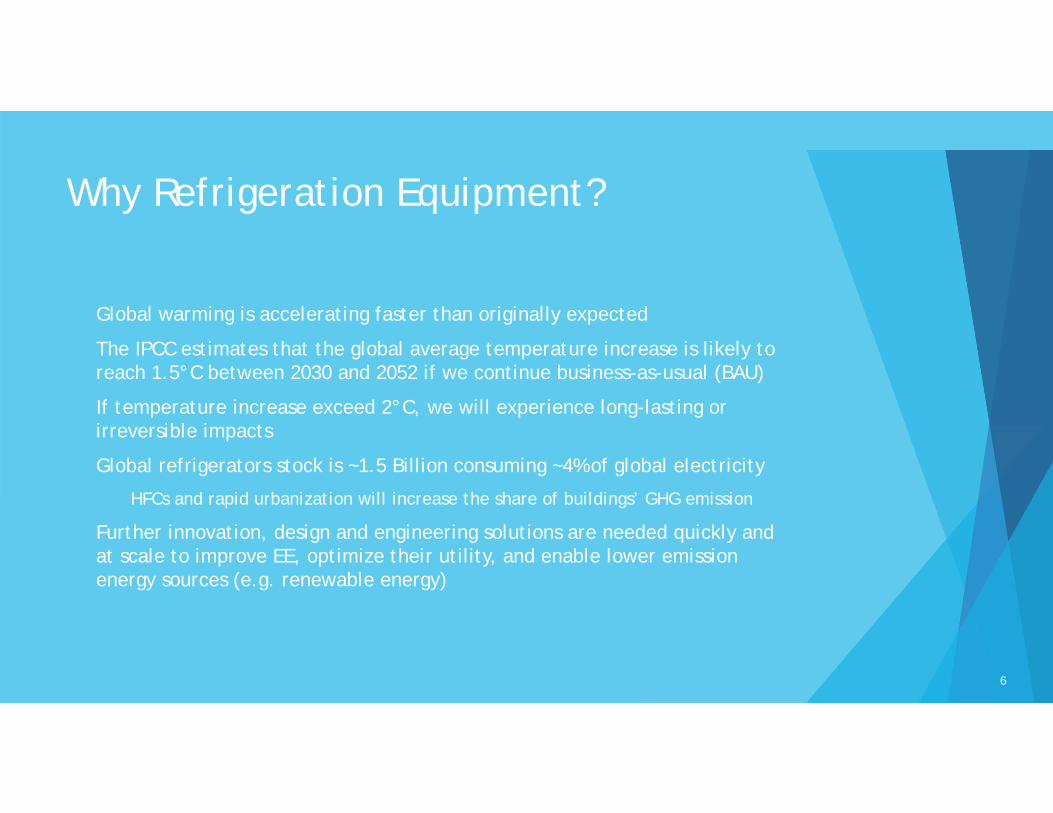
Why Refrigeration Equipment?
Global warming is accelerating faster than originally expected
The IPCC estimates that the global average temperature increase is likely to reach 1.5°C between 2030 and 2052 if we continue business-as-usual (BAU)
If temperature increase exceed 2°C, we will experience long-lasting or irreversible impacts
Global refrigerators stock is ~1.5 Billion consuming ~4% of global electricity
HFCs and rapid urbanization will increase the share of buildings’ GHG emission
Further innovation, design and engineering solutions are needed quickly and at scale to improve EE, optimize their utility, and enable lower emission energy sources (e.g. renewable energy)
6
“Assessment of incremental capital and operating costs for improved Energy Efficiency (EE) in domestic and commercial refrigeration” Document?
The Project Guidance document includes:
Methodology- Desk research, site visit and simulation studies.
Manufacturers Development Index
CERA software, Cost efficiency Curves
Barriers
Recommendations
7
Manufacturer Development Index
In order to avoid revealing manufacturer’s proprietary information while presenting the study; the manufacturers were characterized using a Manufacturer Development Index (MDI) that accounts for:
Manufacturer development capacity (modelling capabilities, experimental facilities, and product development team capabilities and management)
Manufacturer production volume (regional leadership, national leadership, medium scale manufacturer, small producing manufacturers)
Manufacturer proximity to and relationship with component's OEM (access to components and the ability to work with the supplier)
Market maturity (based on the consumer awareness, MEPS in place, and product competition
Country's energy efficiency score (World Bank RISE index normalised to 10)
8
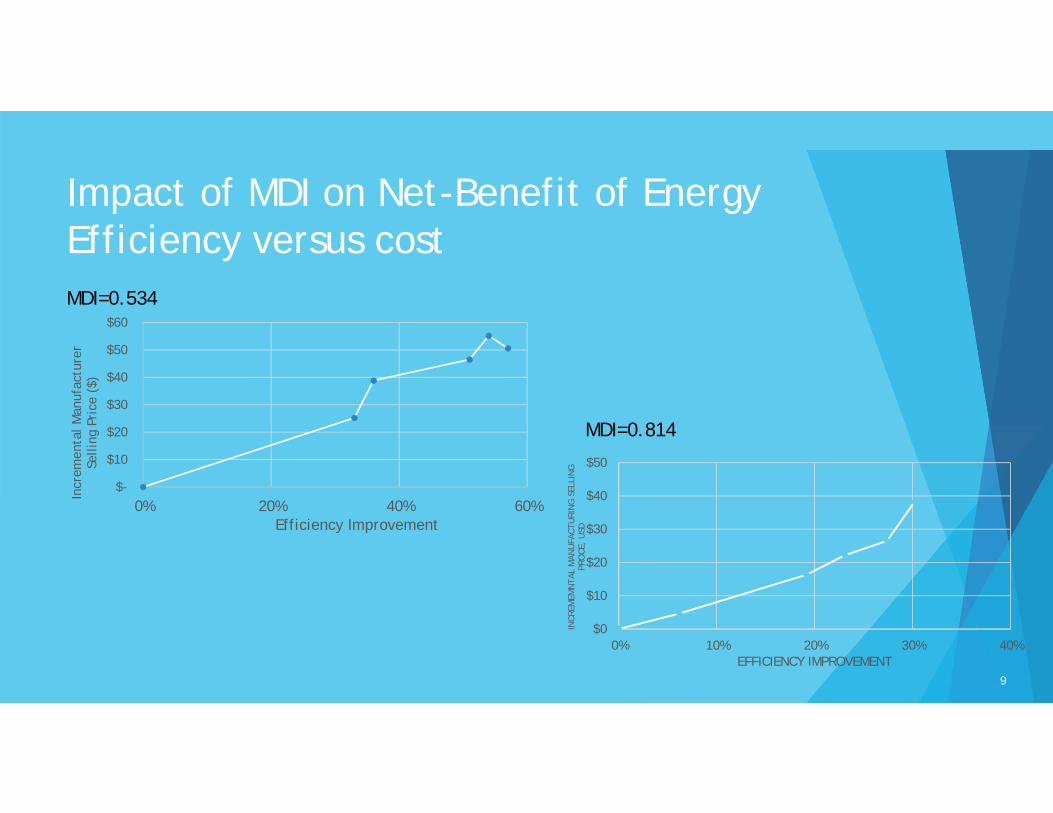
Impact of MDI on Net-Benefit of Energy Efficiency versus cost
$-
$10
$20
$30
$40
$50
$60
0% 20% 40% 60%
Incr
emen
tal M
anuf
actu
rer
Selli
ng P
rice
($)
Efficiency Improvement
$0
$10
$20
$30
$40
$50
0% 10% 20% 30% 40%
INCR
EMEM
NTA
L M
ANU
FACT
URI
NG
SEL
LIN
G
PRO
CE,
USD
EFFICIENCY IMPROVEMENT
MDI=0.534
MDI=0.814
9
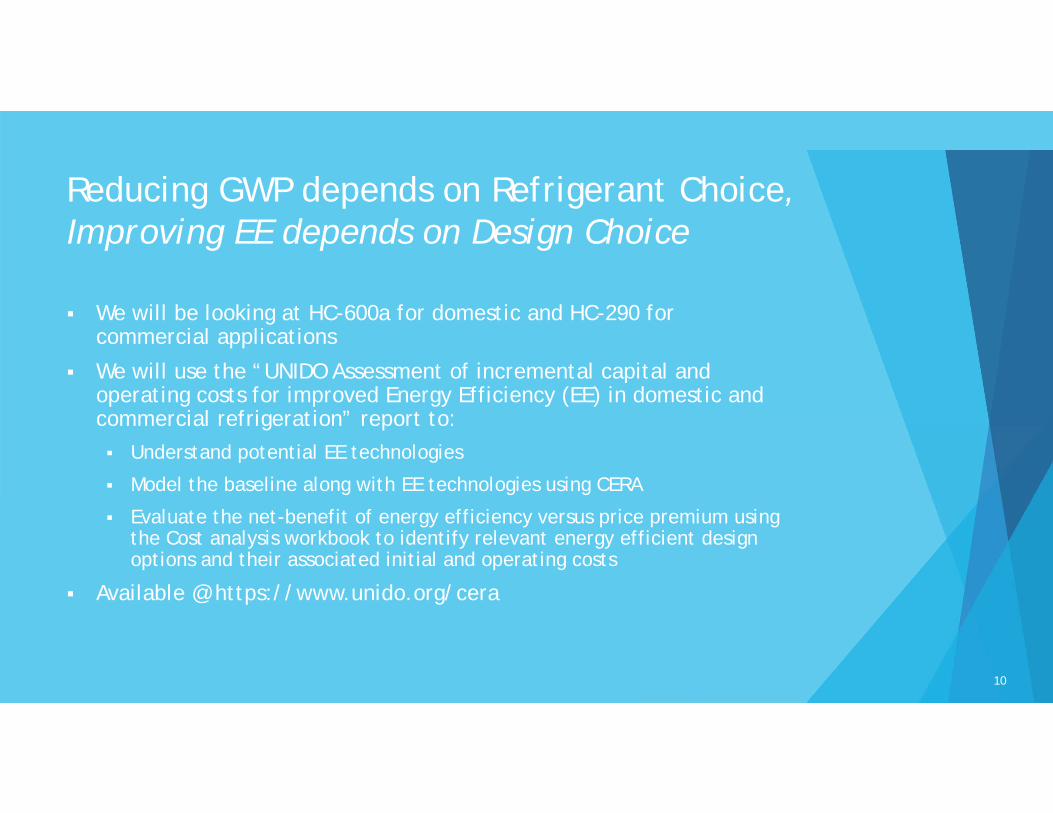
Reducing GWP depends on Refrigerant Choice, Improving EE depends on Design Choice
We will be looking at HC-600a for domestic and HC-290 for commercial applications
We will use the “UNIDO Assessment of incremental capital and operating costs for improved Energy Efficiency (EE) in domestic and commercial refrigeration” report to: Understand potential EE technologies
Model the baseline along with EE technologies using CERA
Evaluate the net-benefit of energy efficiency versus price premium using the Cost analysis workbook to identify relevant energy efficient design options and their associated initial and operating costs
Available @ https://www.unido.org/cera
10
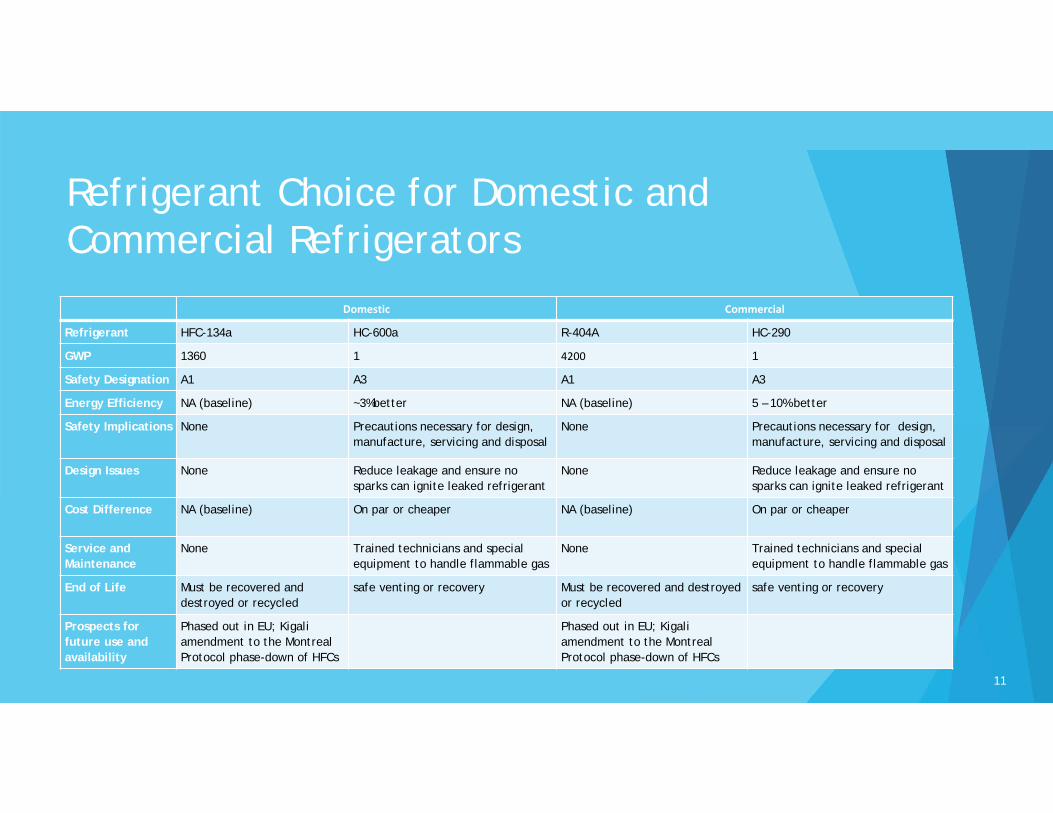
Refrigerant Choice for Domestic and Commercial Refrigerators
Domestic Commercial
Refrigerant HFC-134a HC-600a R-404A HC-290
GWP 1360 1 4200 1
Safety Designation A1 A3 A1 A3
Energy Efficiency NA (baseline) ~3%better NA (baseline) 5 – 10% better
Safety Implications None Precautions necessary for design, manufacture, servicing and disposal
None Precautions necessary for design, manufacture, servicing and disposal
Design Issues None Reduce leakage and ensure no sparks can ignite leaked refrigerant
None Reduce leakage and ensure no sparks can ignite leaked refrigerant
Cost Difference NA (baseline) On par or cheaper NA (baseline) On par or cheaper
Service and Maintenance
None Trained technicians and special equipment to handle flammable gas
None Trained technicians and special equipment to handle flammable gas
End of Life Must be recovered and destroyed or recycled
safe venting or recovery Must be recovered and destroyed or recycled
safe venting or recovery
Prospects for future use and availability
Phased out in EU; Kigali amendment to the Montreal Protocol phase-down of HFCs
Phased out in EU; Kigali amendment to the Montreal Protocol phase-down of HFCs
11
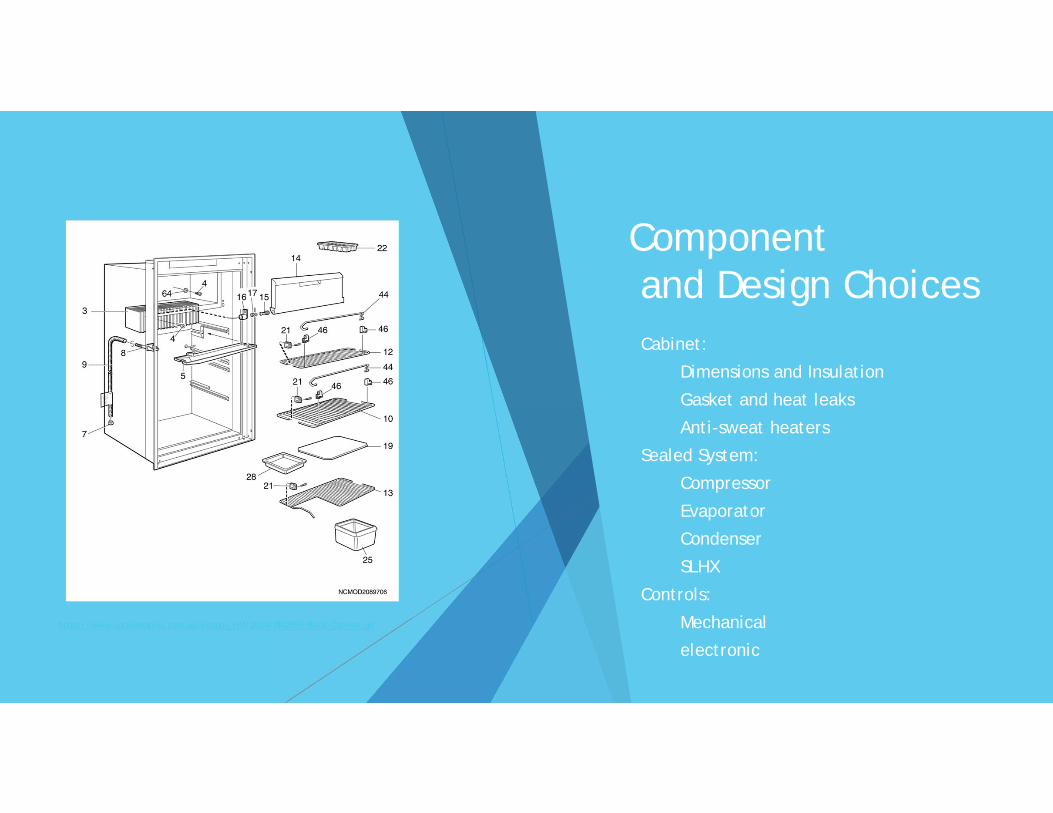
Componentand Design Choices
Cabinet:
Dimensions and Insulation
Gasket and heat leaks
Anti-sweat heaters
Sealed System:
Compressor
Evaporator
Condenser
SLHX
Controls:
Mechanical
electronic
https://www.caravansplus.com.au/images_tiff/2014/RM2555-Black-Cabinet.gif
12
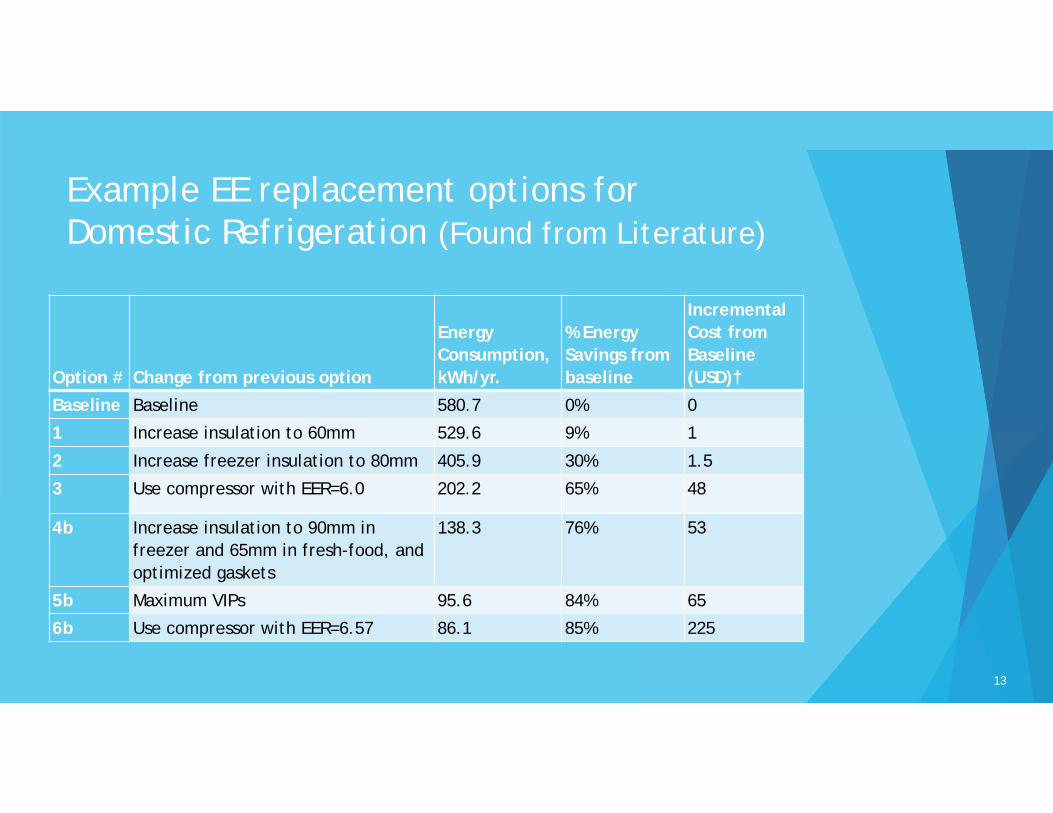
Example EE replacement options for Domestic Refrigeration (Found from Literature)
Option # Change from previous option
Energy Consumption, kWh/yr.
% Energy Savings from baseline
Incremental Cost from Baseline (USD)†
Baseline Baseline 580.7 0% 0
1 Increase insulation to 60mm 529.6 9% 1
2 Increase freezer insulation to 80mm 405.9 30% 1.5
3 Use compressor with EER=6.0 202.2 65% 48
4b Increase insulation to 90mm in freezer and 65mm in fresh-food, and optimized gaskets
138.3 76% 53
5b Maximum VIPs 95.6 84% 65
6b Use compressor with EER=6.57 86.1 85% 225
13
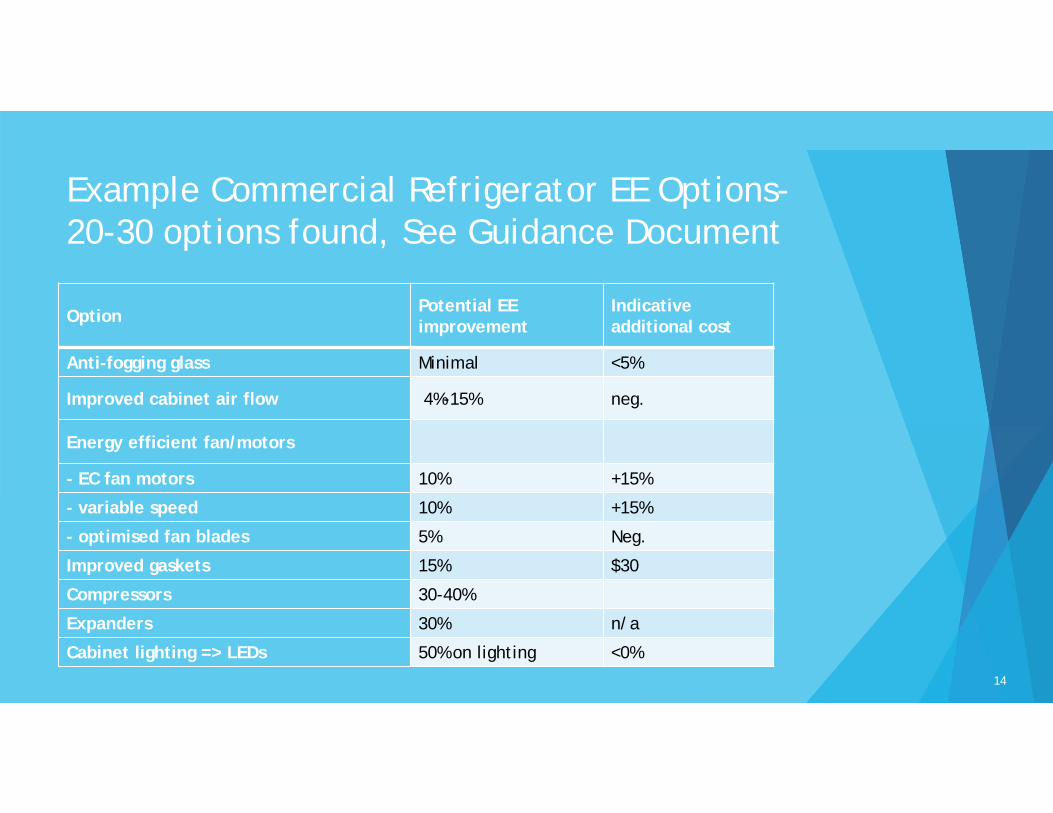
Example Commercial Refrigerator EE Options-20-30 options found, See Guidance Document
Option Potential EE improvement
Indicative additional cost
Anti-fogging glass Minimal <5%
Improved cabinet air flow 4%-15% neg.
Energy efficient fan/motors
- EC fan motors 10% +15%
- variable speed 10% +15%
- optimised fan blades 5% Neg.
Improved gaskets 15% $30
Compressors 30-40%
Expanders 30% n/a
Cabinet lighting => LEDs 50% on lighting <0%14
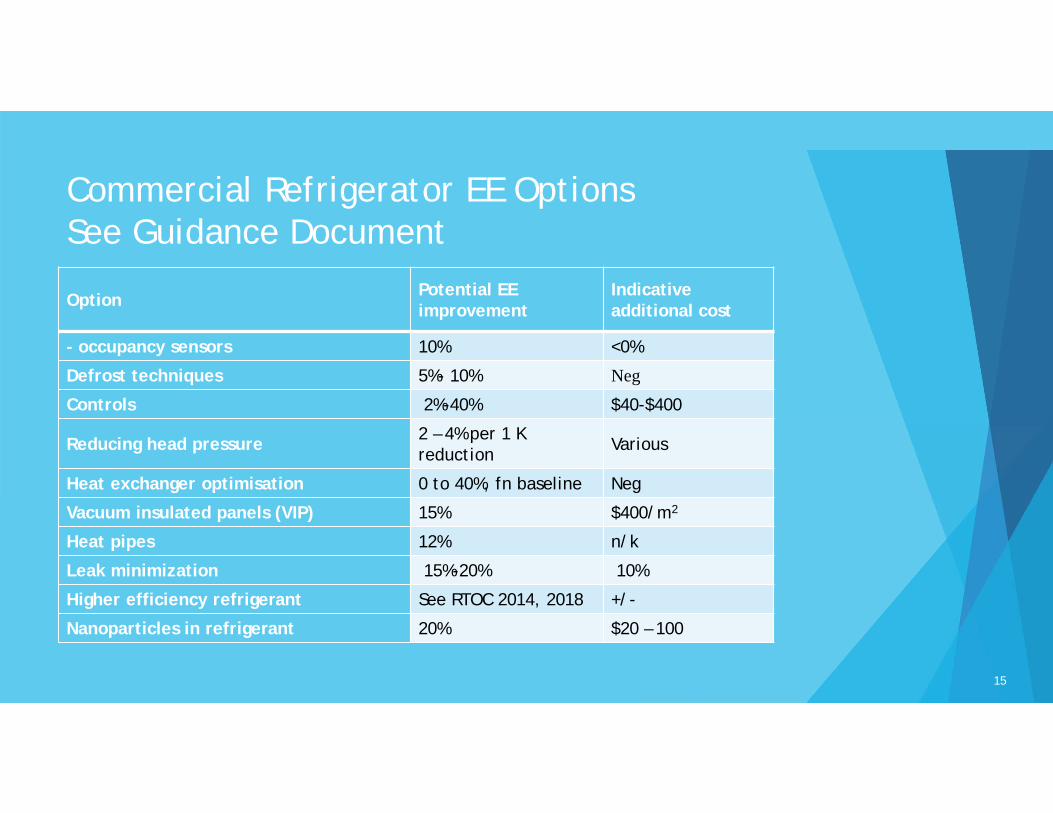
Commercial Refrigerator EE OptionsSee Guidance Document
Option Potential EE improvement
Indicative additional cost
- occupancy sensors 10% <0%
Defrost techniques 5%- 10% Neg
Controls 2%-40% $40-$400
Reducing head pressure 2 – 4% per 1 K reduction Various
Heat exchanger optimisation 0 to 40%, fn baseline Neg
Vacuum insulated panels (VIP) 15% $400/m2
Heat pipes 12% n/k
Leak minimization 15%-20% 10%
Higher efficiency refrigerant See RTOC 2014, 2018 +/-
Nanoparticles in refrigerant 20% $20 – 100
15
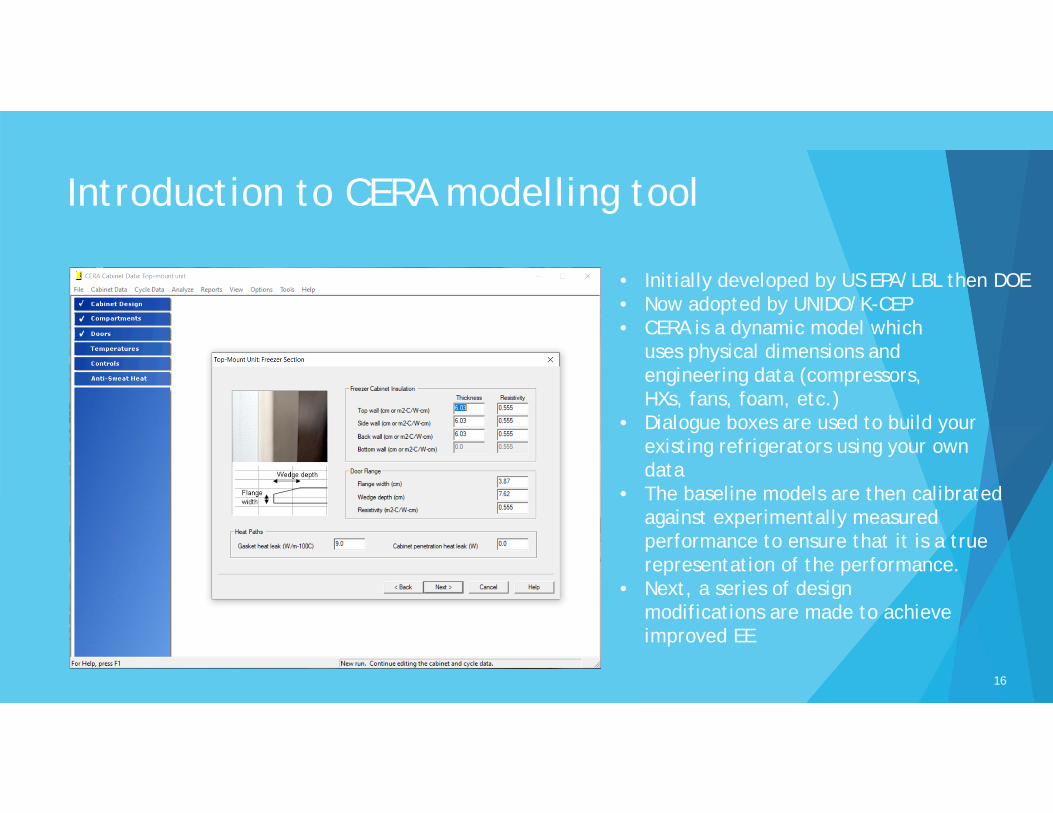
Introduction to CERA modelling tool
Set Up Baseline• Initially developed by US EPA/LBL then DOE• Now adopted by UNIDO/K-CEP• CERA is a dynamic model which
uses physical dimensions and engineering data (compressors, HXs, fans, foam, etc.)
• Dialogue boxes are used to build your existing refrigerators using your own data
• The baseline models are then calibrated against experimentally measured performance to ensure that it is a true representation of the performance.
• Next, a series of design modifications are made to achieve improved EE
16
CERA Software and Running Simulations
• Allocate time and engineering staff to project
• Download CERA @ https://github.com/unido
• Download Cost Analysis workbook @ https://github.com/unido
• Gather data using questionnaire
• Run simulation base case
• Replace components
• Re-run simulation to verify improvements in EE.
17
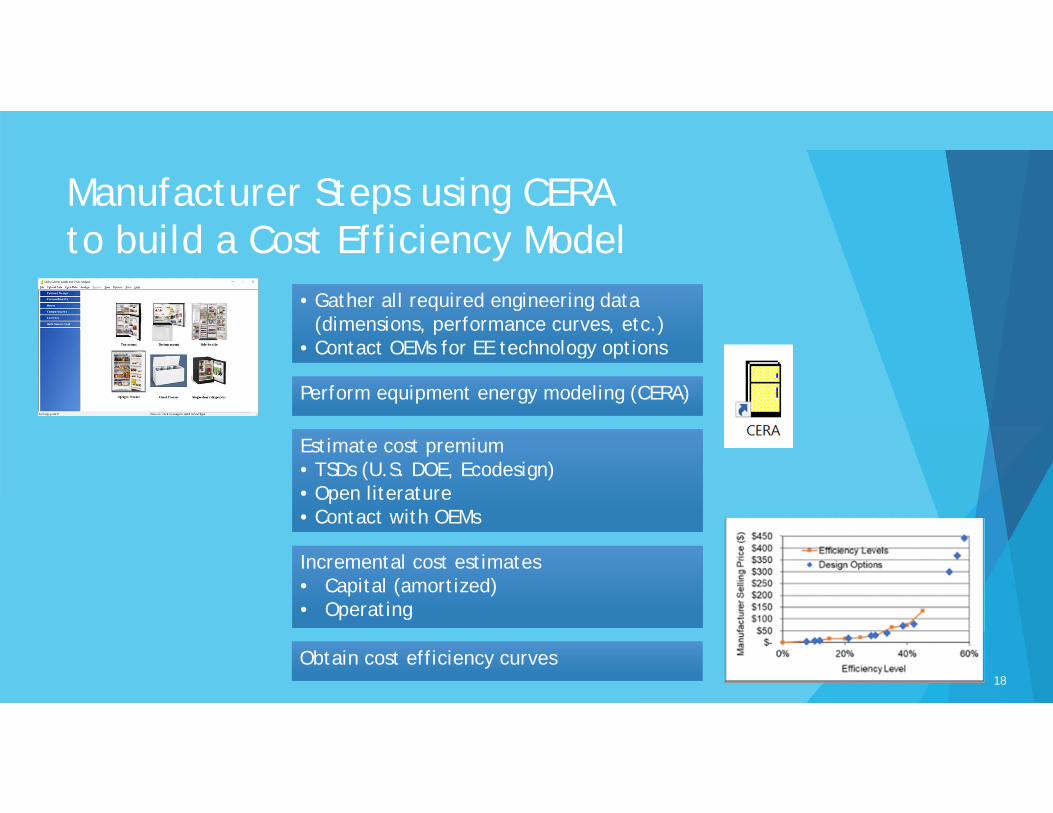
Manufacturer Steps using CERAto build a Cost Efficiency Model
• Gather all required engineering data (dimensions, performance curves, etc.)
• Contact OEMs for EE technology options
Perform equipment energy modeling (CERA)
Estimate cost premium• TSDs (U.S. DOE, Ecodesign) • Open literature• Contact with OEMs
Incremental cost estimates• Capital (amortized)• Operating
Obtain cost efficiency curves18
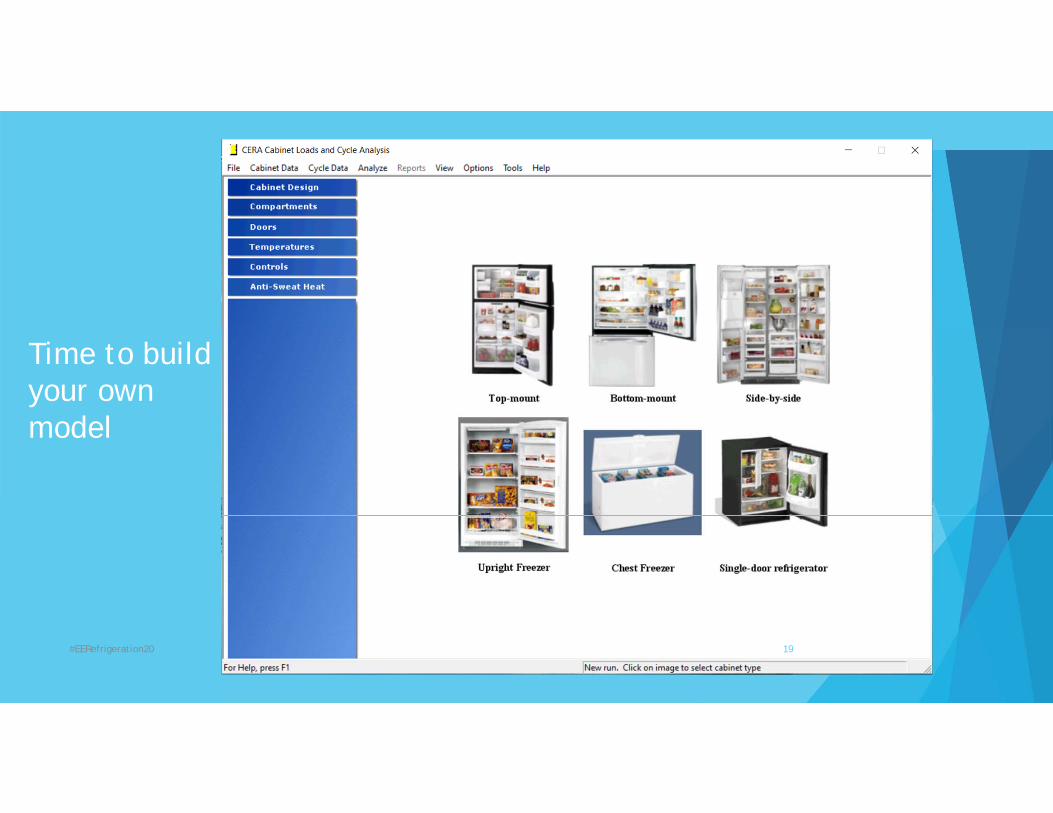
Time to build your own model
19#EERefrigeration20
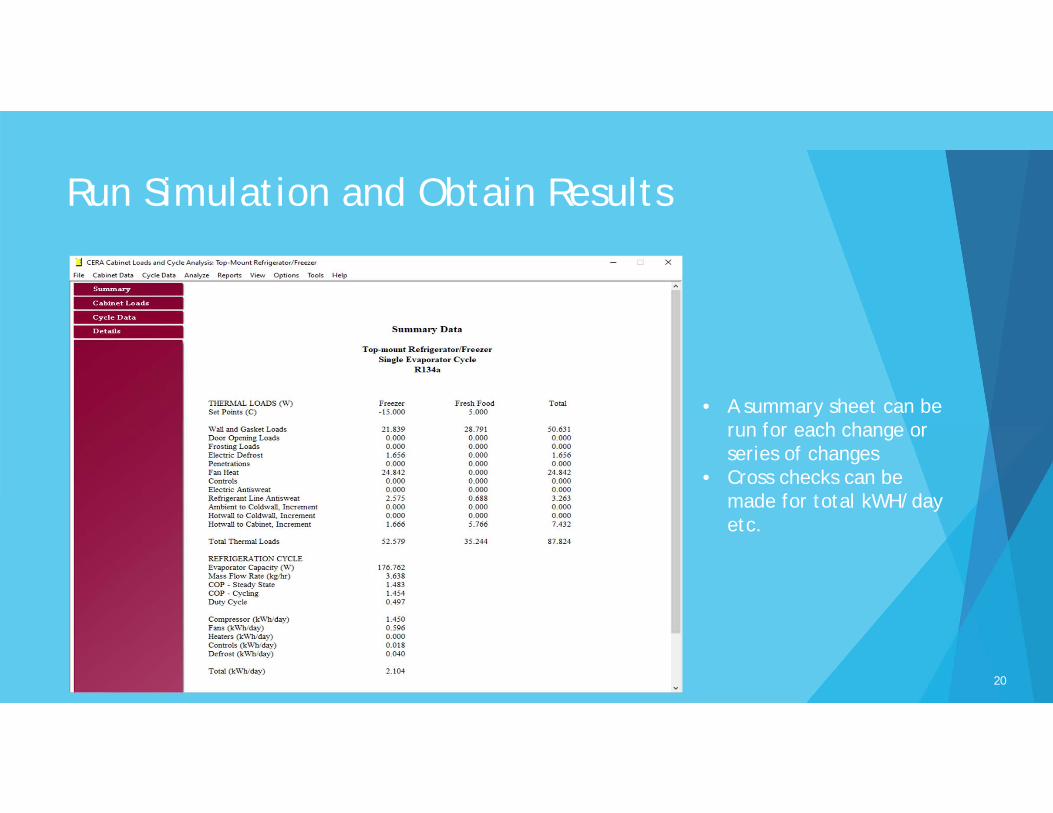
Run Simulation and Obtain Results
• A summary sheet can be run for each change or series of changes
• Cross checks can be made for total kWH/day etc.
20
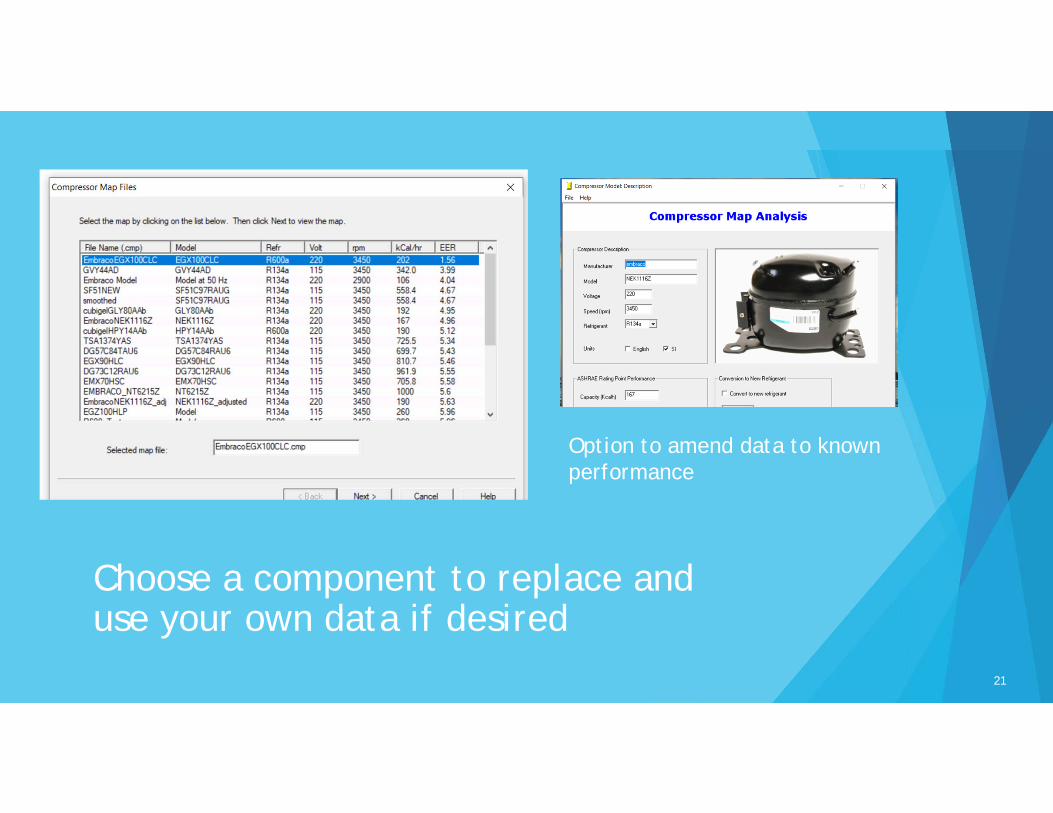
Choose a component to replace anduse your own data if desired
Option to amend data to known performance
21
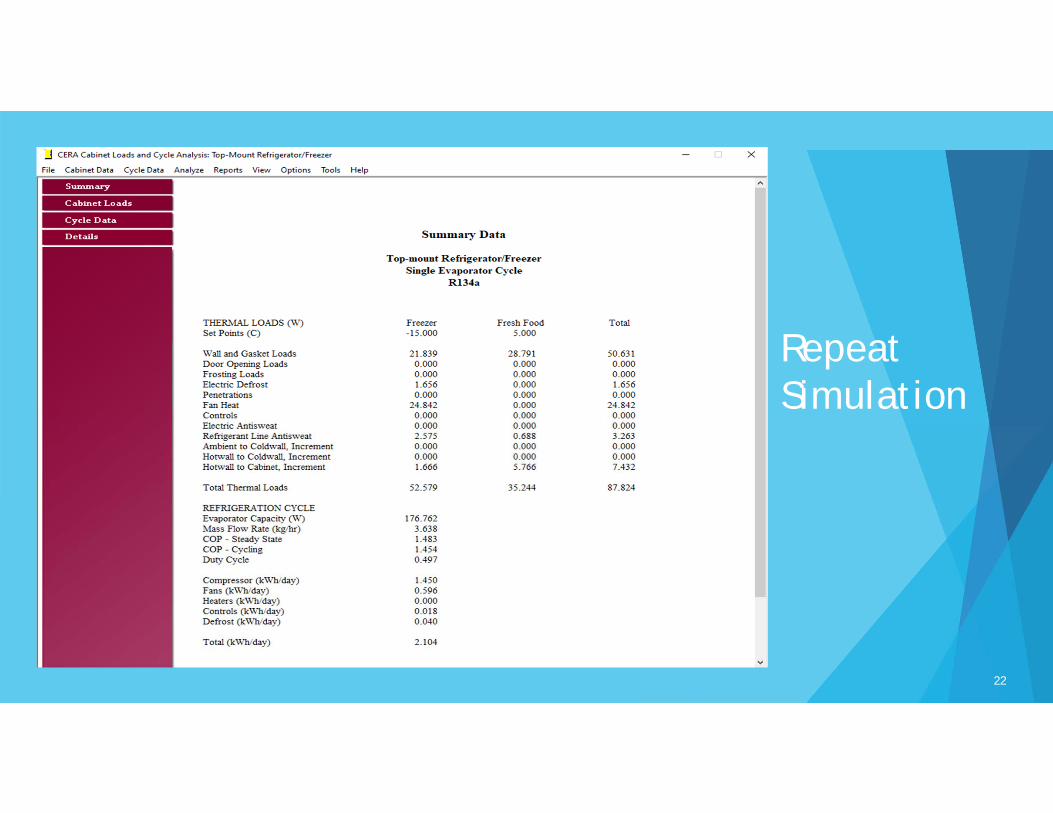
Repeat Simulation
22

Live Demo
# 23
Results –Incremental Operating Costs
24
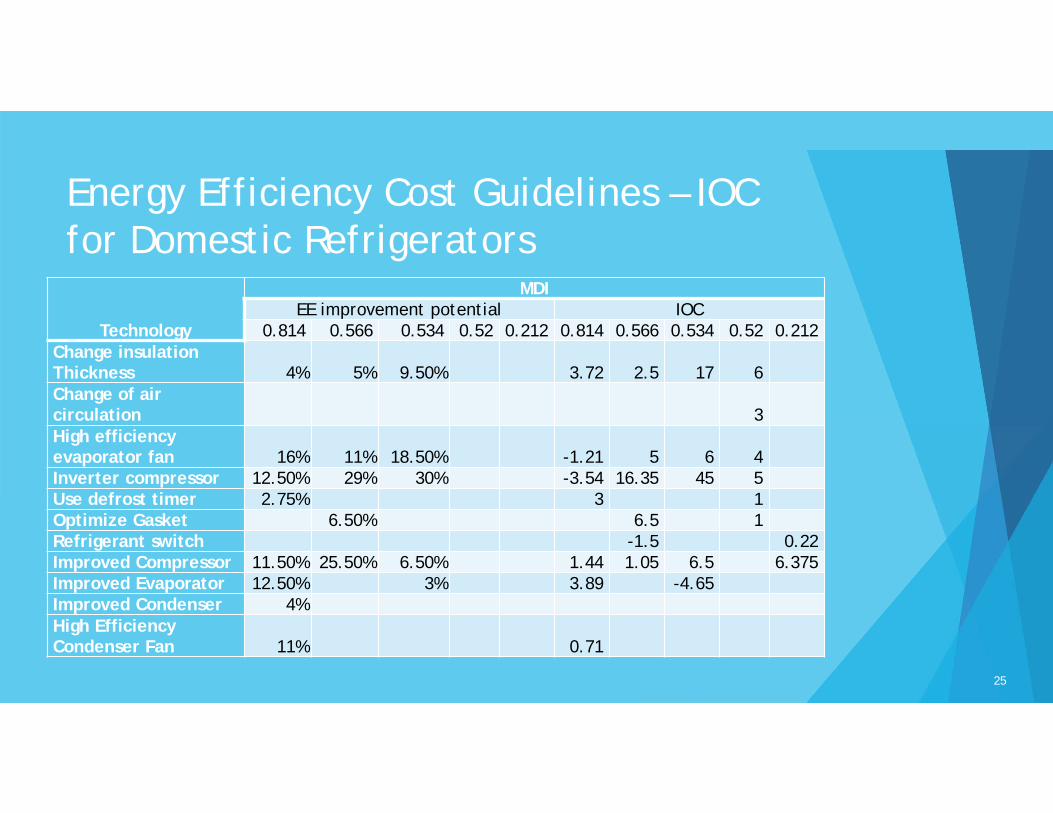
Energy Efficiency Cost Guidelines – IOC for Domestic Refrigerators
Technology
MDIEE improvement potential IOC
0.814 0.566 0.534 0.52 0.212 0.814 0.566 0.534 0.52 0.212Change insulation Thickness 4% 5% 9.50% 3.72 2.5 17 6Change of air circulation 3High efficiency evaporator fan 16% 11% 18.50% -1.21 5 6 4Inverter compressor 12.50% 29% 30% -3.54 16.35 45 5Use defrost timer 2.75% 3 1Optimize Gasket 6.50% 6.5 1Refrigerant switch -1.5 0.22Improved Compressor 11.50% 25.50% 6.50% 1.44 1.05 6.5 6.375Improved Evaporator 12.50% 3% 3.89 -4.65Improved Condenser 4%High Efficiency Condenser Fan 11% 0.71
25
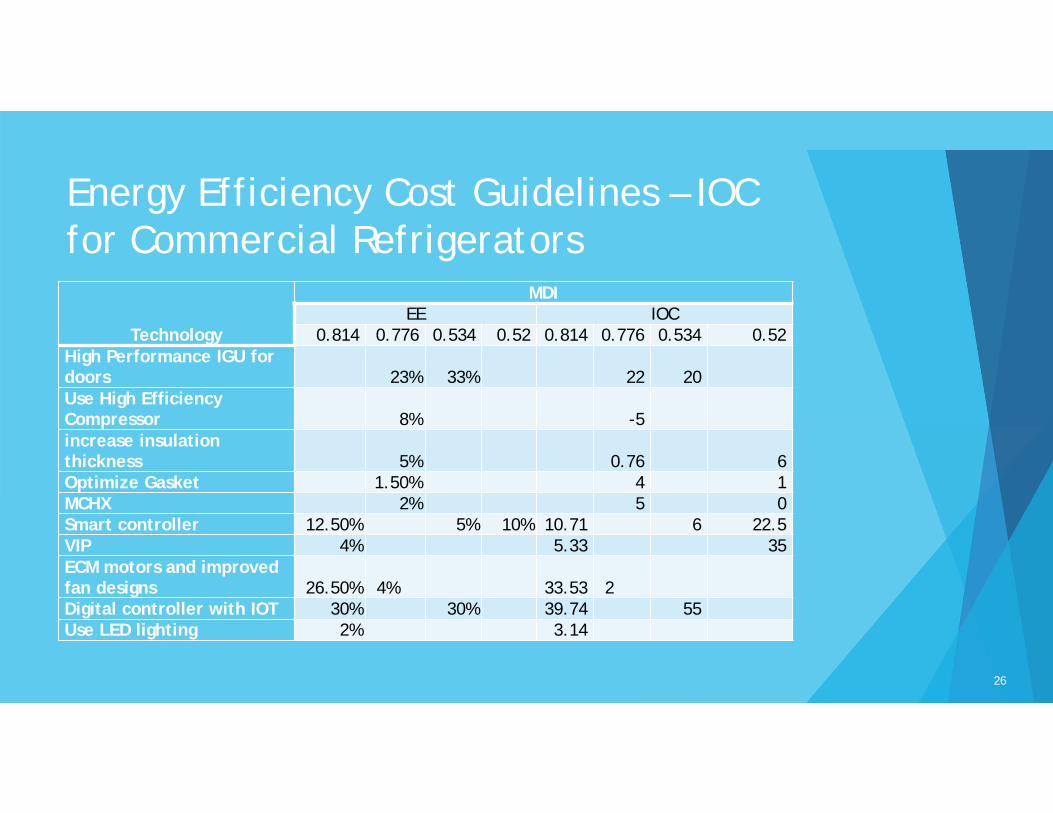
Energy Efficiency Cost Guidelines – IOC for Commercial Refrigerators
Technology
MDIEE IOC
0.814 0.776 0.534 0.52 0.814 0.776 0.534 0.52High Performance IGU for doors 23% 33% 22 20Use High Efficiency Compressor 8% -5increase insulation thickness 5% 0.76 6Optimize Gasket 1.50% 4 1MCHX 2% 5 0Smart controller 12.50% 5% 10% 10.71 6 22.5VIP 4% 5.33 35ECM motors and improved fan designs 26.50% 4% 33.53 2Digital controller with IOT 30% 30% 39.74 55Use LED lighting 2% 3.14
26
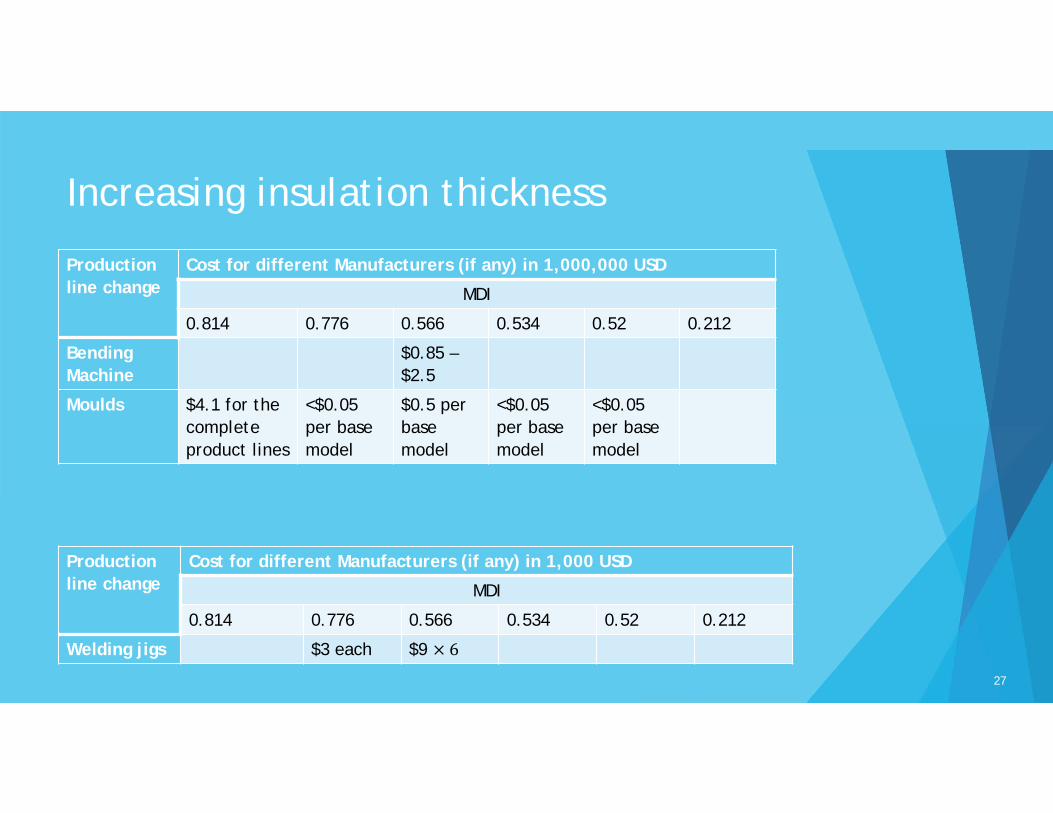
Increasing insulation thickness
Production line change
Cost for different Manufacturers (if any) in 1,000,000 USD
MDI
0.814 0.776 0.566 0.534 0.52 0.212
Bending Machine
$0.85 –$2.5
Moulds $4.1 for the complete product lines
<$0.05 per base model
$0.5 per base model
<$0.05 per base model
<$0.05 per base model
Production line change
Cost for different Manufacturers (if any) in 1,000 USD
MDI
0.814 0.776 0.566 0.534 0.52 0.212
Welding jigs $3 each $9 6
Improving the door gaskets
27
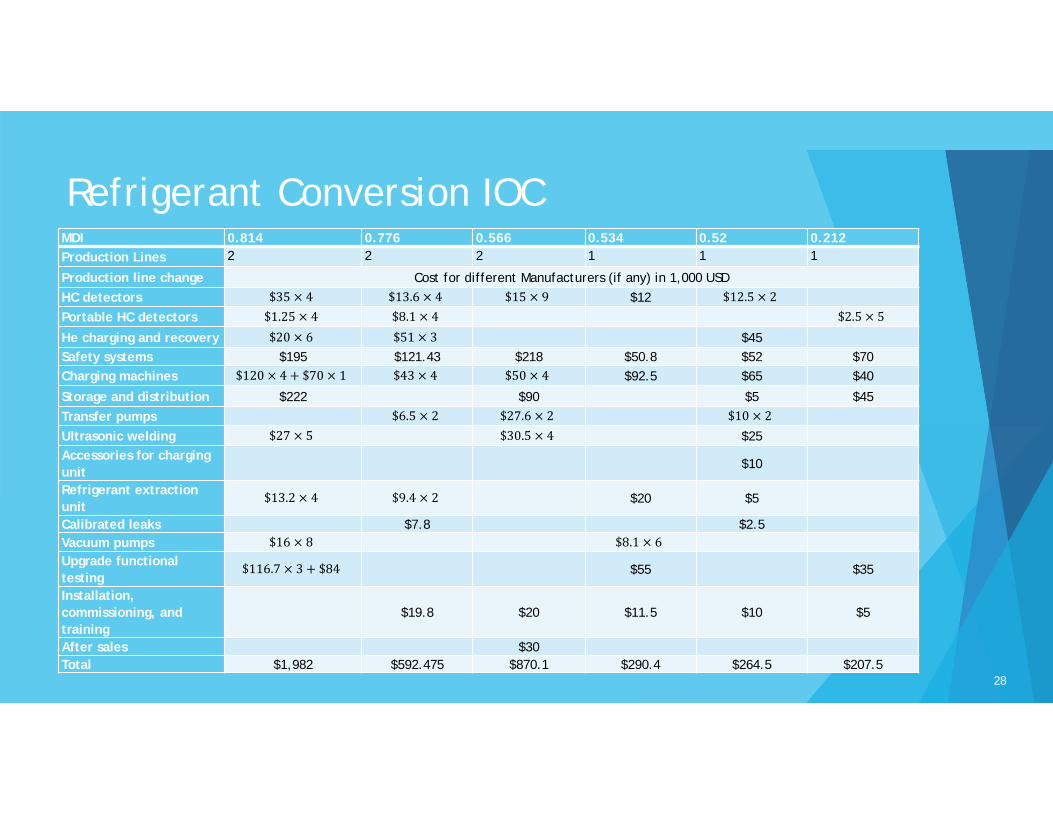
Refrigerant Conversion IOCMDI 0.814 0.776 0.566 0.534 0.52 0.212Production Lines 2 2 2 1 1 1
Production line change Cost for different Manufacturers (if any) in 1,000 USDHC detectors $35 4 $13.6 4 $15 9 $12 $12.5 2Portable HC detectors $1.25 4 $8.1 4 $2.5 5He charging and recovery $20 6 $51 3 $45Safety systems $195 $121.43 $218 $50.8 $52 $70Charging machines $120 4 $70 1 $43 4 $50 4 $92.5 $65 $40
Storage and distribution $222 $90 $5 $45Transfer pumps $6.5 2 $27.6 2 $10 2Ultrasonic welding $27 5 $30.5 4 $25Accessories for charging unit
$10
Refrigerant extraction unit
$13.2 4 $9.4 2 $20 $5
Calibrated leaks $7.8 $2.5Vacuum pumps $16 8 $8.1 6Upgrade functional testing
$116.7 3 $84 $55 $35
Installation, commissioning, and training
$19.8 $20 $11.5 $10 $5
After sales $30Total $1,982 $592.475 $870.1 $290.4 $264.5 $207.5
28
Poll Question # 2
a) In your opinion, which technology option would be the most relevant to improve your refrigerator’s energy efficiency?a) Changing to a more efficient compressor
b) Reduce door gasket heat leaks
c) Changing the refrigerant
d) Changing insulation thickness and type
e) Replacing the evaporator fan to more efficient fans
29
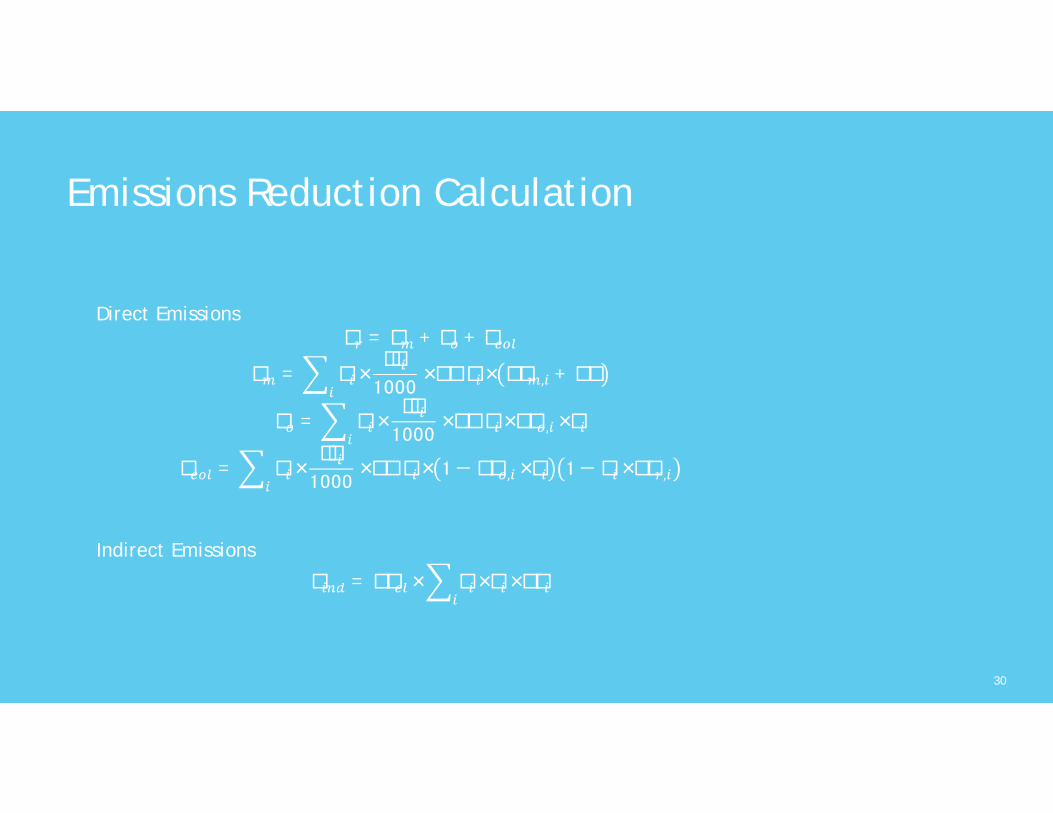
Emissions Reduction Calculation
Direct Emissions𝐸 𝐸 𝐸 𝐸
𝐸 𝑛𝐼𝐶1000 𝐺𝑊𝑃 𝐸𝐹 , 𝐸𝐷
𝐸 𝑛𝐼𝐶1000 𝐺𝑊𝑃 𝐸𝐹 , 𝐿
𝐸 𝑛𝐼𝐶1000 𝐺𝑊𝑃 1 𝐸𝐹 , 𝐿 1 𝑅 𝐸𝐹 ,
Indirect Emissions
𝐸 𝐸𝐹 𝐿 𝑛 𝐸𝐶
Emissions Reduction Calculation
Direct Emissions= + +
= ×1000
× × , +
= ×1000
× × , ×
= ×1000
× ×1 − , × 1 − × ,
Indirect Emissions
= × × ×
30
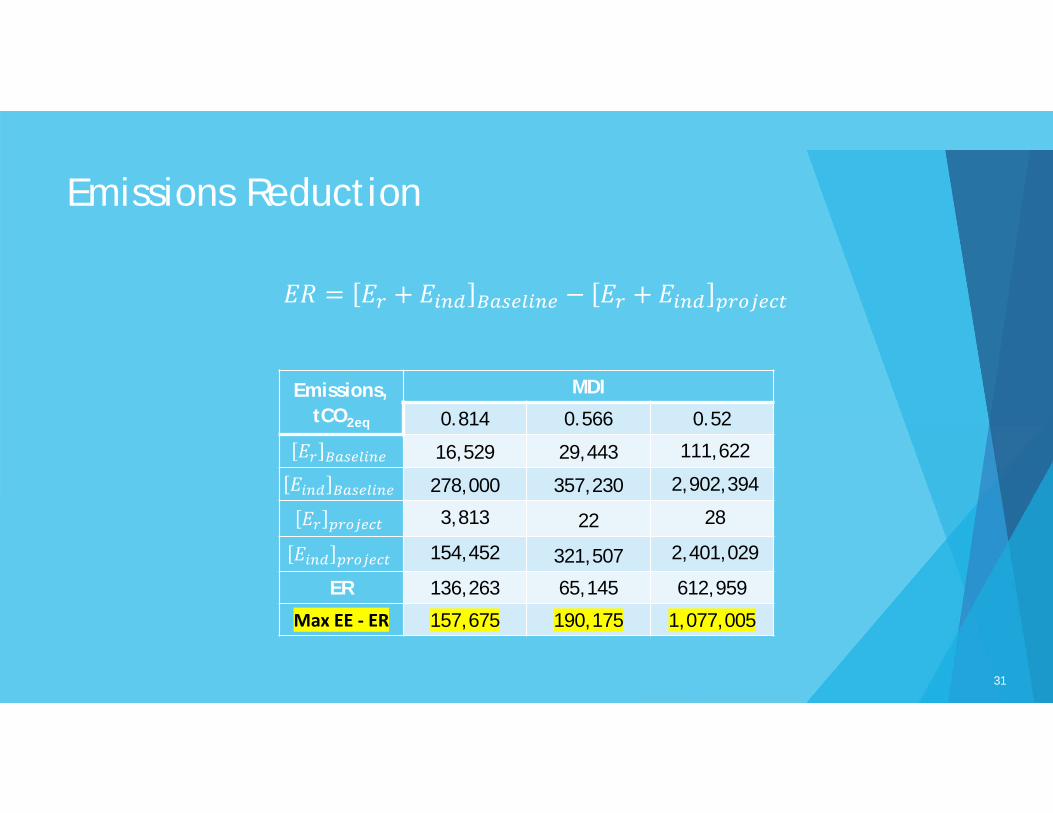
Emissions Reduction
Emissions, tCO2eq
MDI
0.814 0.566 0.52
𝐸 16,529 29,443 111,622
𝐸 278,000 357,230 2,902,394
𝐸 3,813 22 28
𝐸 154,452 321,507 2,401,029
ER 136,263 65,145 612,959
Max EE ‐ ER 157,675 190,175 1,077,005
𝐸𝑅 𝐸 𝐸 𝐸 𝐸
31

Market Barriers
32
Market Barriers – DomesticExamples See Guidance Document for full list
Consumer behaviour:
Driven mainly, or exclusively, by first cost
Not aware of EE benefits to themselves or society
Energy labels, if available, are not well appreciated (small annual electricity cost) Need for educational campaigns
Consumers are looking for more reliable refrigerators (resilience over EE) in areas with unstable electric grid or limited electricity penetration
Lack of MEPS in some regions
Need to comply to different regional MEPS which are not harmonized and required different testing methodologies
Lack of governmental financial incentives for EE appliances
Electric subsidies, lower electricity rates, result in increased payback periods and as such have adverse impact on EE adoption
33
Market Barriers CommercialExamples See Guidance Document for full list
Sales controlled by business-to-business (B-2-B) sales
Driven by client’s specifications/guidelines and test methods more progressive than national or regional MEPS, if they exist
Customer consolidation rendered the commercial refrigerator market a “buyers” market increased client purchase power smaller margins but guaranteed volumes
Manufacturers cannot afford the increase of $20 in components unless the B-2-B customers modify their specifications or accept the higher price
Non-institutional customers are primarily driven by first cost and have limited appreciation of the lifecycle monetary and societal benefits of EE
Acceptable payback is 18 months
Some shop owners put electricity sub meters ($20 per device) on their vending machines
34
Poll Question #3
a) Beyond cost, which barrier is the most important to overcome?a) Imports from large overseas manufacturers
b) Lack of awareness about the benefit of energy efficiency
c) Lack of financial support for design and development
35
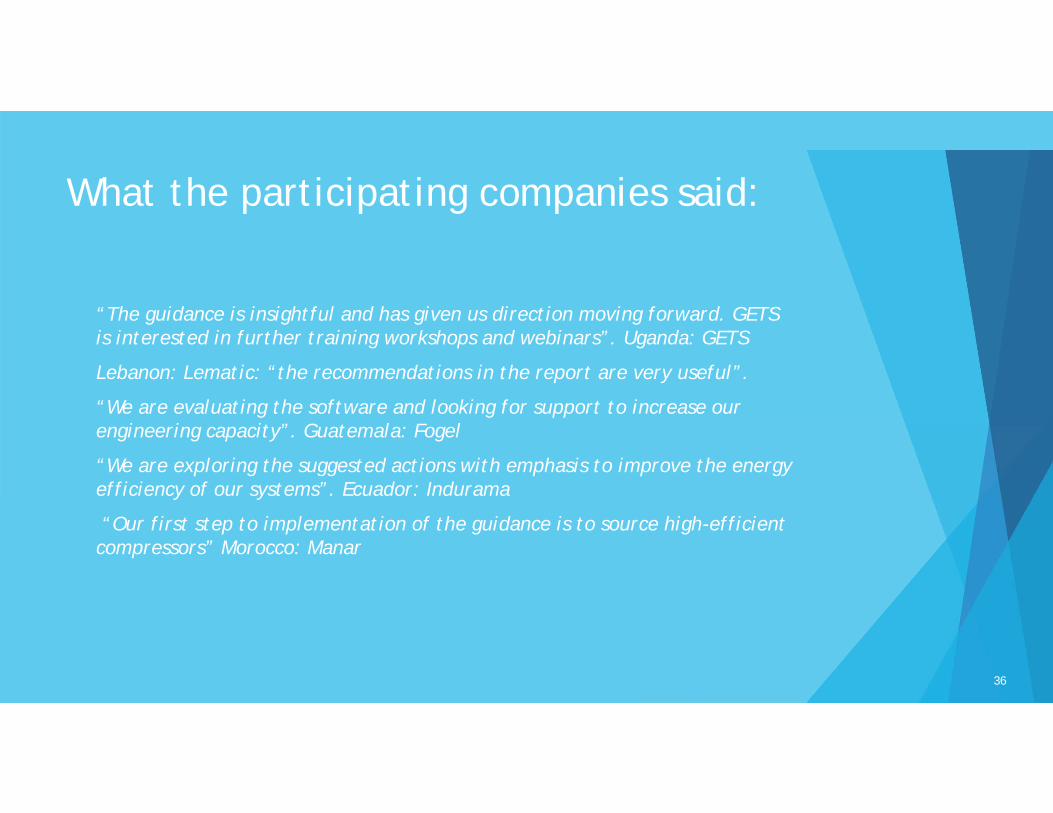
What the participating companies said:
“The guidance is insightful and has given us direction moving forward. GETS is interested in further training workshops and webinars”. Uganda: GETS
Lebanon: Lematic: “the recommendations in the report are very useful”.
“We are evaluating the software and looking for support to increase our engineering capacity”. Guatemala: Fogel
“We are exploring the suggested actions with emphasis to improve the energy efficiency of our systems”. Ecuador: Indurama
“Our first step to implementation of the guidance is to source high-efficient compressors” Morocco: Manar
36
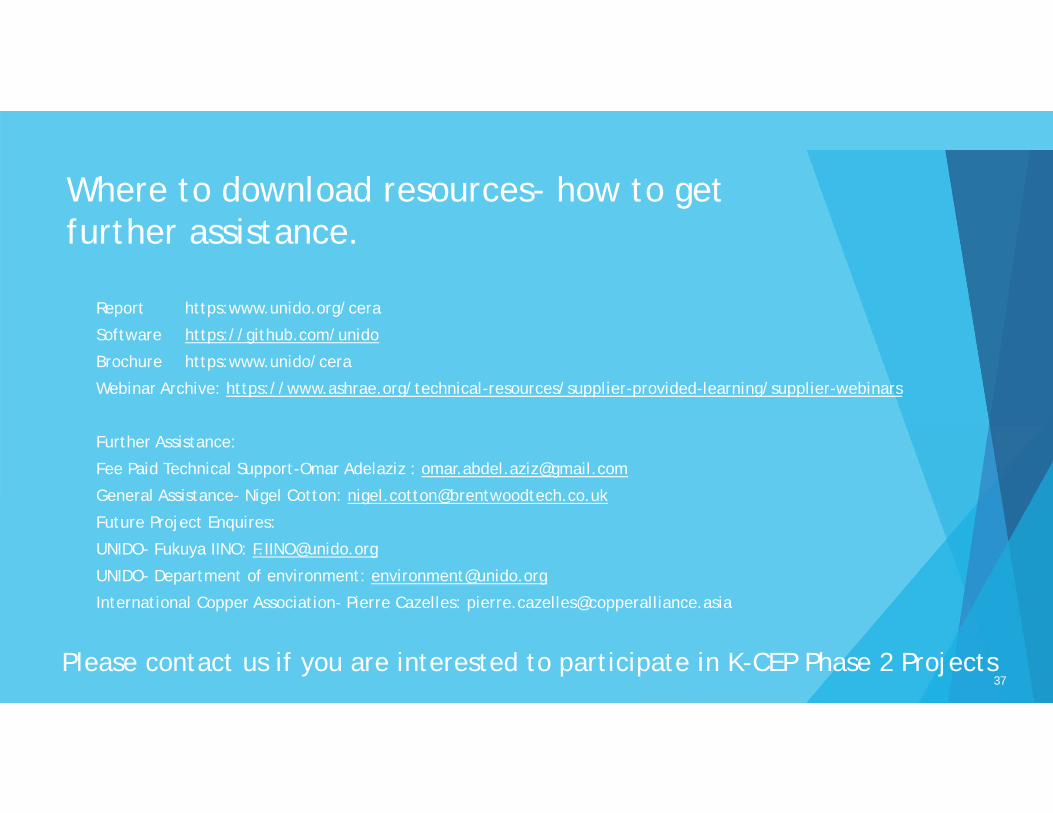
Where to download resources- how to get further assistance.
Report https:www.unido.org/cera
Software https://github.com/unido
Brochure https:www.unido/cera
Webinar Archive: https://www.ashrae.org/technical-resources/supplier-provided-learning/supplier-webinars
Further Assistance:
Fee Paid Technical Support-Omar Adelaziz : [email protected]
General Assistance- Nigel Cotton: [email protected]
Future Project Enquires:
UNIDO- Fukuya IINO: [email protected]
UNIDO- Department of environment: [email protected]
International Copper Association- Pierre Cazelles: [email protected]
Please contact us if you are interested to participate in K-CEP Phase 2 Projects37
Poll Question #4
How useful did you find the study and CERA?
Answer: The study and CERA are useful
Answer: The study is useful, CERA is limited
Answer: The study is limited, CERA is useful
Answer: I need more time to evaluate
Answer: I don’t think that the study nor CERA are useful
38
Q&A
Please feel free to use the questions box to ask your questions
Due to the large number of attendees please provide only written questions
See right hand side dialogue box
39
Thank you for attending
You will shortly receive an email from ASHRAE with details of where to find all the information related to this webinar.
Report https:www.unido.org/cera
Software https:github.com/unido
Brochure https:www.unido/cera
Webinar Archive: https://www.ashrae.org/technical-resources/supplier-provided-learning/supplier-webinars
41