Embed Size (px)
Citation preview
Revitalizing SFSA Marketing
Terry DeckerSpokane Industries
SFSA Marketing Committee Chair
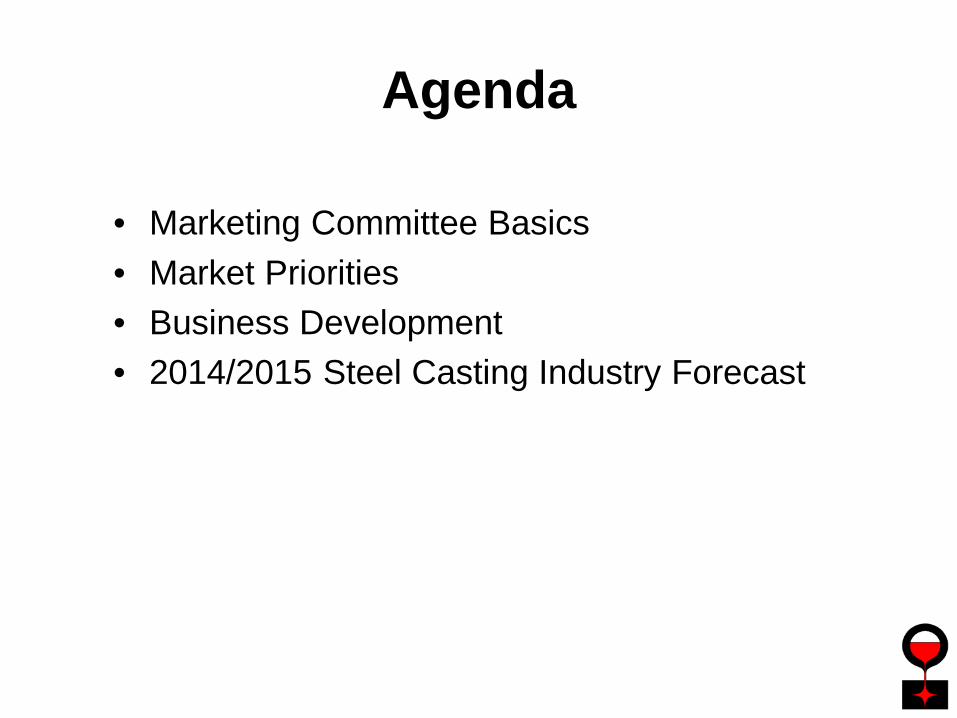
Agenda
• Marketing Committee Basics• Market Priorities • Business Development• 2014/2015 Steel Casting Industry Forecast
Marketing Committee Roleas defined by SFSA Board
The function of the Marketing Committee is to broaden the market for and promote the use of steel castings by investigating and developing new markets, developing and implementing an effective marketing program, and communicating the advantages of steel castings to present and prospective consumers in an effective manner.
To carry out its mission, the committee maintains liaison with other committees of the Society through the staff, identifies technical, business and market topics of interest to customers and SFSA members, directs development of the material and delivery of the information. The committee develops the deliverables for the marketing program such as messaging, competitive input, target market, and specific planning, The committee also performs related market research to help guide the work of the Society and prepares each year for the Society an annual forecast of steel casting demand…..
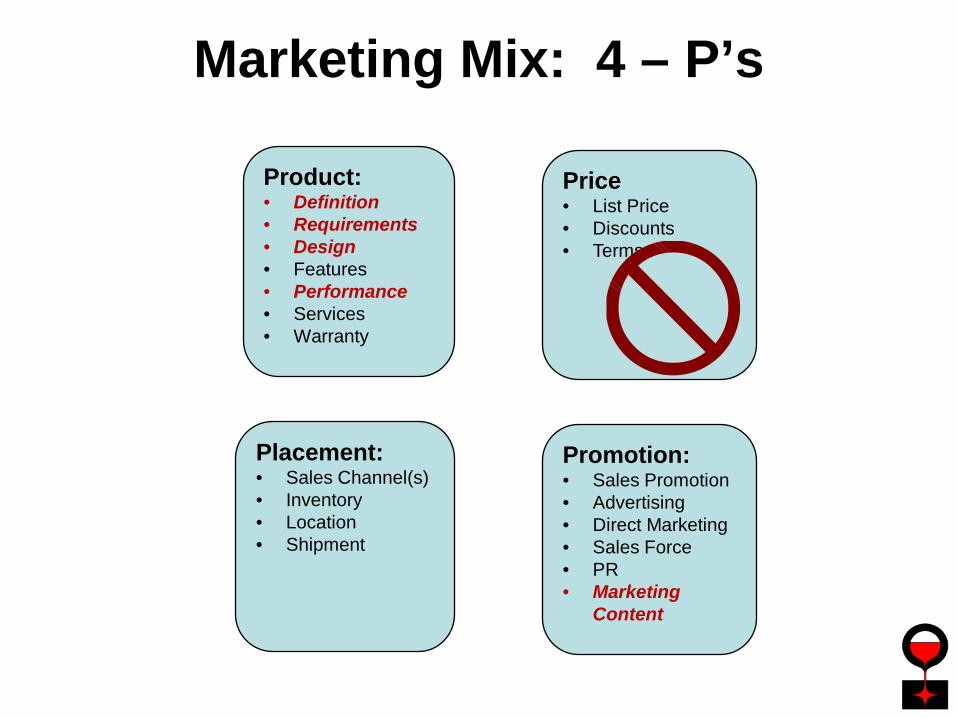
Marketing Mix: 4 – P’s
Product:• Definition• Requirements• Design• Features• Performance• Services• Warranty
Price• List Price• Discounts• Terms
Placement:• Sales Channel(s)• Inventory• Location• Shipment
Promotion:• Sales Promotion• Advertising• Direct Marketing• Sales Force• PR• Marketing
Content
Marketing as Defined by Scott Adams
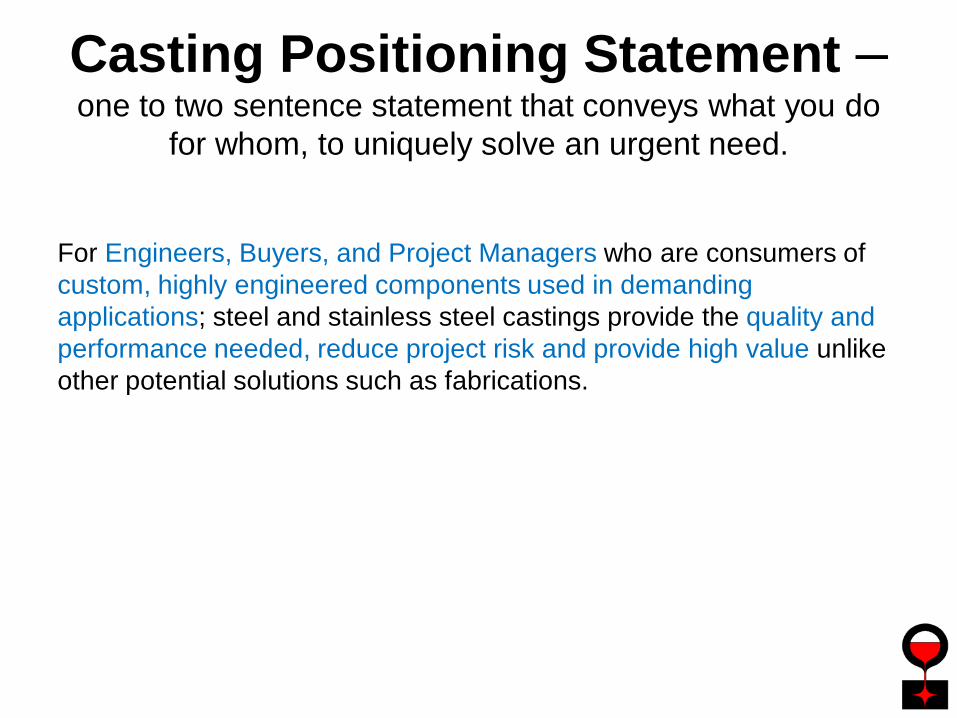
Casting Positioning Statement –one to two sentence statement that conveys what you do
for whom, to uniquely solve an urgent need.
For Engineers, Buyers, and Project Managers who are consumers of custom, highly engineered components used in demanding applications; steel and stainless steel castings provide the quality and performance needed, reduce project risk and provide high value unlike other potential solutions such as fabrications.
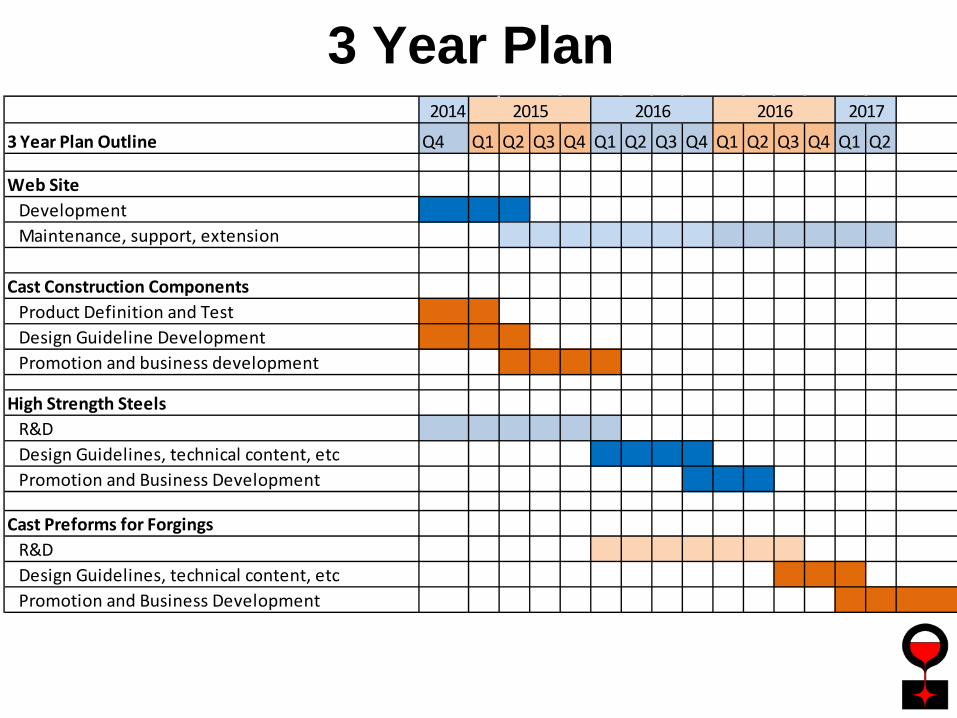
3 Year Plan2014
3 Year Plan Outline Q4 Q1 Q2 Q3 Q4 Q1 Q2 Q3 Q4 Q1 Q2 Q3 Q4 Q1 Q2
Web SiteDevelopmentMaintenance, support, extension
Cast Construction ComponentsProduct Definition and TestDesign Guideline DevelopmentPromotion and business development
High Strength SteelsR&DDesign Guidelines, technical content, etcPromotion and Business Development
Cast Preforms for ForgingsR&DDesign Guidelines, technical content, etcPromotion and Business Development
2015 2016 2016 2017
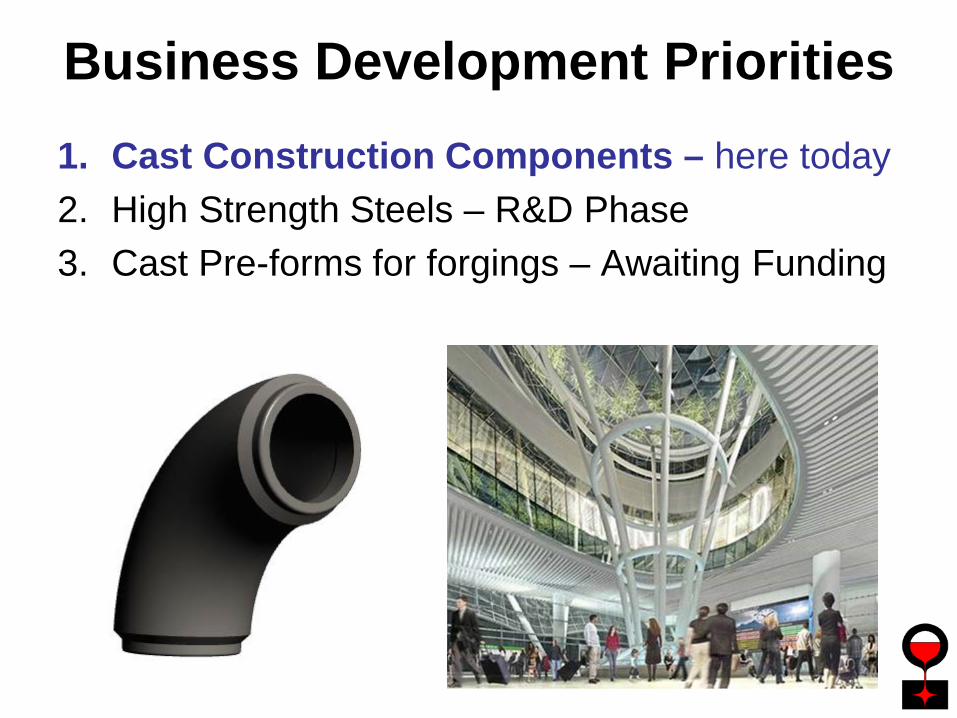
Business Development Priorities1. Cast Construction Components – here today2. High Strength Steels – R&D Phase3. Cast Pre-forms for forgings – Awaiting Funding
High Strength Steel Summary• FeMnAl and Cast Eglin Steel• Currently in the R&D Phase
– Also Working on heat treat processes to improve properties for low alloy steels that will improve their properties
• Marketing Plan – 24 months out• Marketing foundational material needed: Material specifications,
Chemistries, Heat Treat Procedures, Weld Procedures • Key potential targets for commercialization: Titanium conversion, building
construction, weight reduction applications, etc.
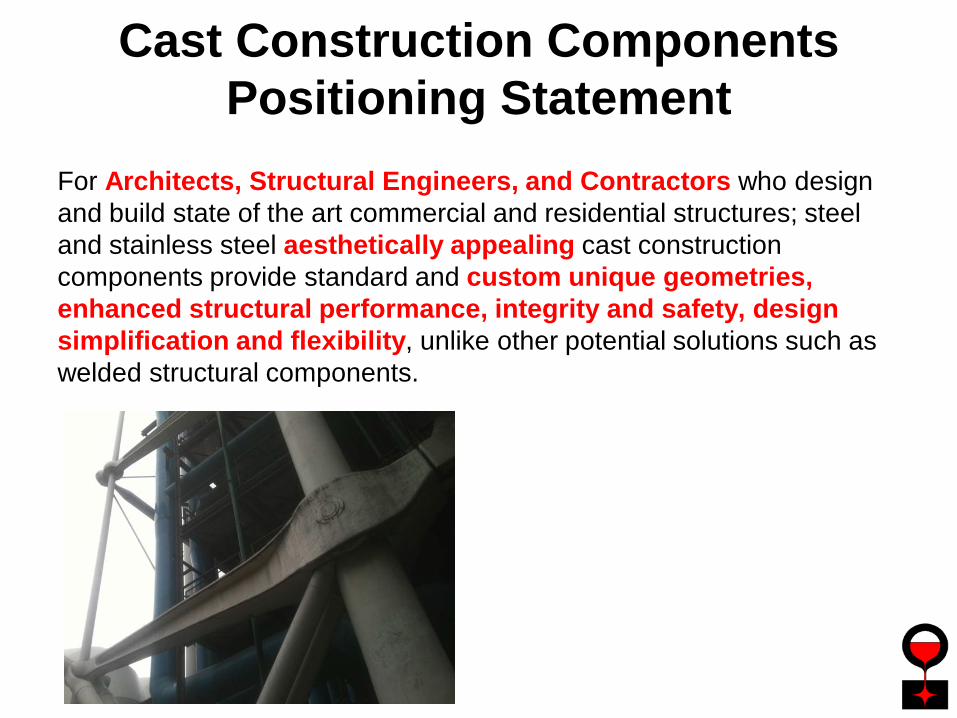
Cast Construction Components Positioning Statement
For Architects, Structural Engineers, and Contractors who design and build state of the art commercial and residential structures; steel and stainless steel aesthetically appealing cast construction components provide standard and custom unique geometries, enhanced structural performance, integrity and safety, design simplification and flexibility, unlike other potential solutions such as welded structural components.
SFSA Business Development
• Quantify the market• Identify the competition, current solutions• Define the solutions/products• Position the product• Identify and address barriers• Create Awareness
Cast Construction ComponentsBarriers
• Perception – “Castings are brittle and unreliable.” • Lack of AISC standards
– Defined standard shapes– Test results to support standards and ensure performance – AISC guidelines for selecting cast components
• Variety and availability of standard components• Awareness - architects, engineers, builders,
consumers, academics. • Lack of familiarity and understanding of castings
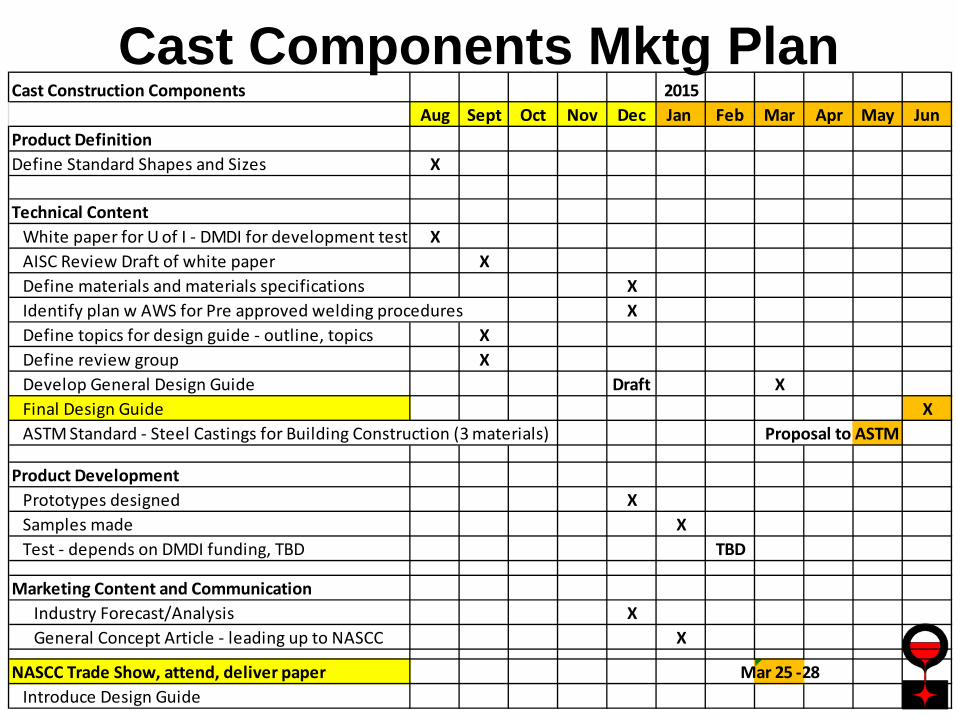
Cast Components Mktg PlanCast Construction Components 2015
Aug Sept Oct Nov Dec Jan Feb Mar Apr May JunProduct DefinitionDefine Standard Shapes and Sizes X
Technical ContentWhite paper for U of I - DMDI for development testi X
AISC Review Draft of white paper XDefine materials and materials specifications XIdentify plan w AWS for Pre approved welding procedures XDefine topics for design guide - outline, topics XDefine review group XDevelop General Design Guide Draft XFinal Design Guide XASTM Standard - Steel Castings for Building Construction (3 materials) Proposal to ASTM
Product DevelopmentPrototypes designed XSamples made XTest - depends on DMDI funding, TBD TBD
Marketing Content and CommunicationIndustry Forecast/Analysis XGeneral Concept Article - leading up to NASCC X
NASCC Trade Show, attend, deliver paper Mar 25 -28Introduce Design Guide
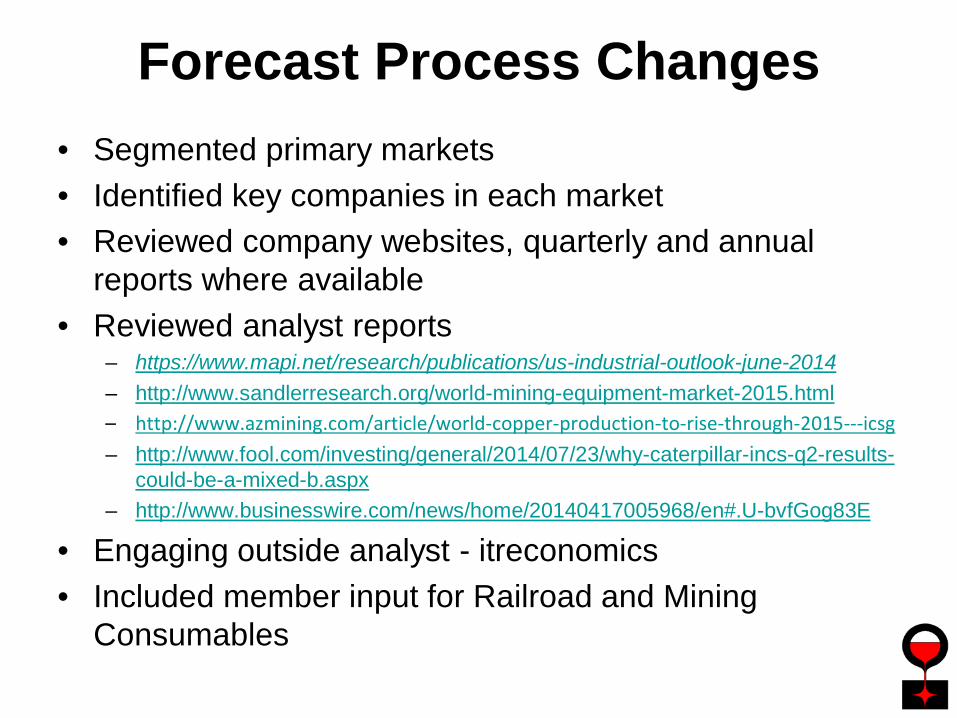
Forecast Process Changes• Segmented primary markets• Identified key companies in each market• Reviewed company websites, quarterly and annual
reports where available• Reviewed analyst reports
– https://www.mapi.net/research/publications/us-industrial-outlook-june-2014– http://www.sandlerresearch.org/world-mining-equipment-market-2015.html– http://www.azmining.com/article/world-copper-production-to-rise-through-2015---icsg– http://www.fool.com/investing/general/2014/07/23/why-caterpillar-incs-q2-results-
could-be-a-mixed-b.aspx– http://www.businesswire.com/news/home/20140417005968/en#.U-bvfGog83E
• Engaging outside analyst - itreconomics• Included member input for Railroad and Mining
Consumables
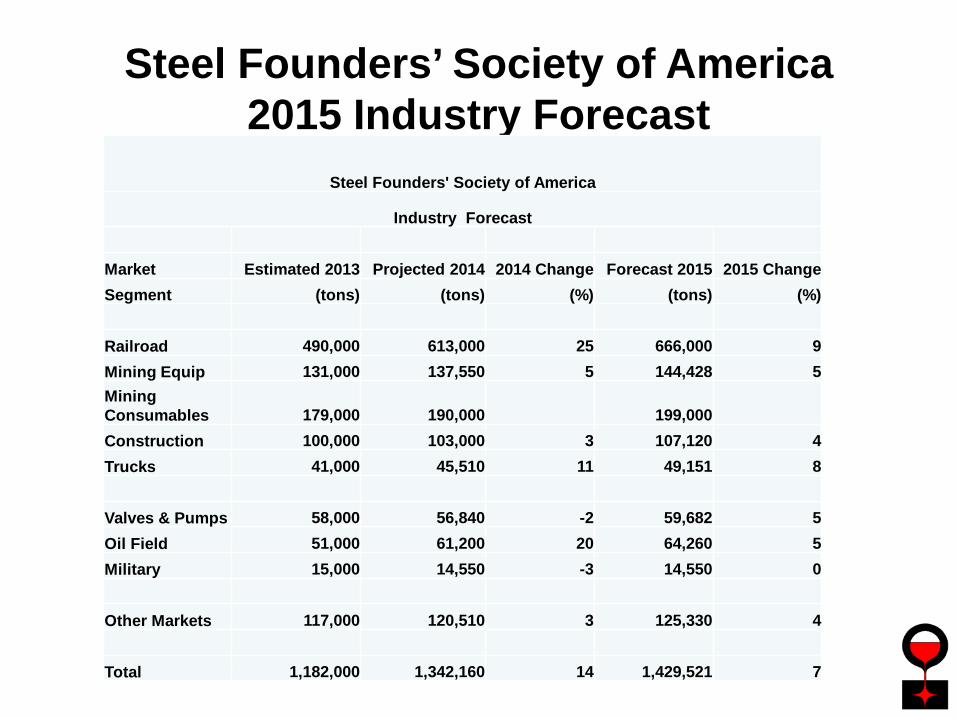
Steel Founders’ Society of America 2015 Industry Forecast
Steel Founders' Society of America
Industry Forecast
Market Estimated 2013 Projected 2014 2014 Change Forecast 2015 2015 ChangeSegment (tons) (tons) (%) (tons) (%)
Railroad 490,000 613,000 25 666,000 9Mining Equip 131,000 137,550 5 144,428 5Mining Consumables 179,000 190,000 199,000Construction 100,000 103,000 3 107,120 4Trucks 41,000 45,510 11 49,151 8
Valves & Pumps 58,000 56,840 -2 59,682 5Oil Field 51,000 61,200 20 64,260 5Military 15,000 14,550 -3 14,550 0
Other Markets 117,000 120,510 3 125,330 4
Total 1,182,000 1,342,160 14 1,429,521 7
Business Impact Factors2015
• Economic forecast is for faster growth in 2015• Housing starts should be strong • Oil prices should continue strong enough to encourage
investment. Future fracking activity uncertain.• Mining should remain stable• Energy, housing, and transportation should boost
investment in capital equipment• Large projects are planned but still on hold
– Railroad forecast includes imports as well as domestic production
– Mining forecast adds consumables
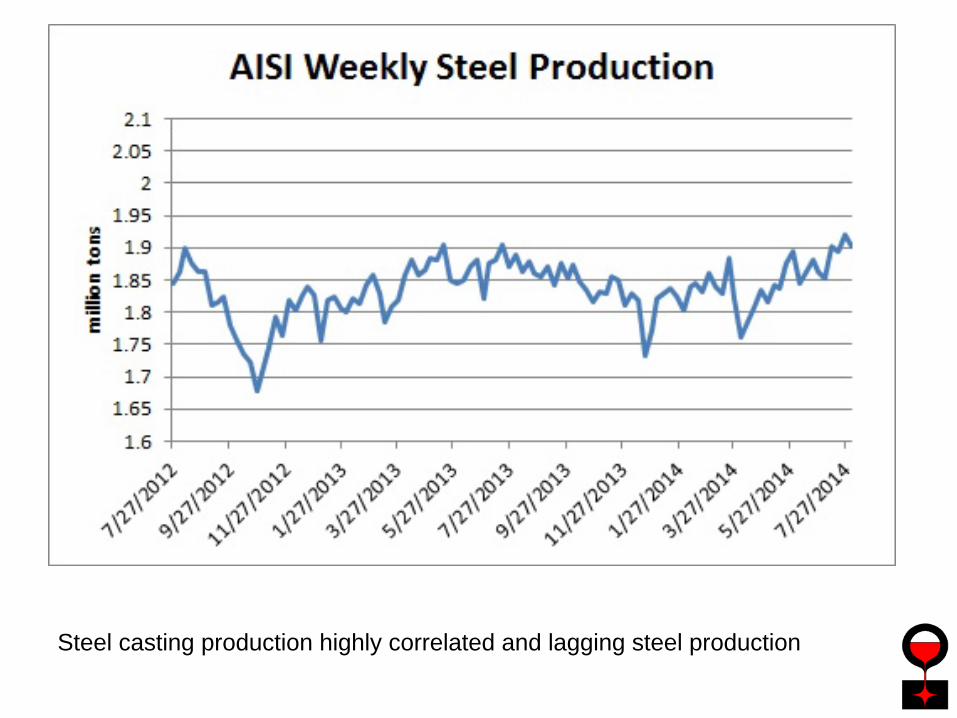
Steel casting production highly correlated and lagging steel production
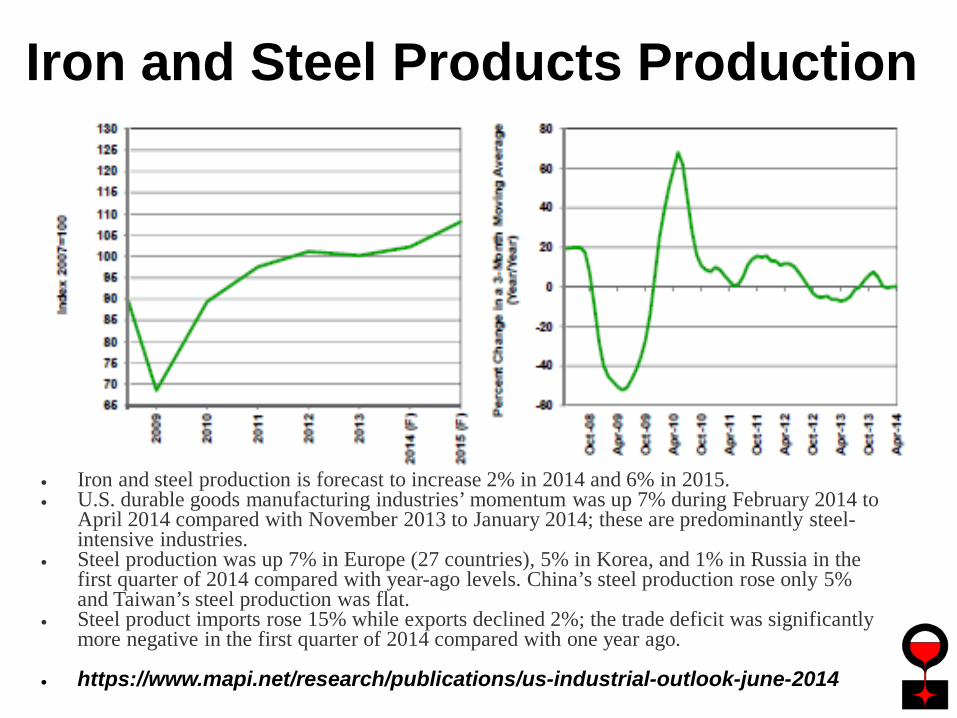
• Iron and steel production is forecast to increase 2% in 2014 and 6% in 2015.• U.S. durable goods manufacturing industries’ momentum was up 7% during February 2014 to
April 2014 compared with November 2013 to January 2014; these are predominantly steel-intensive industries.
• Steel production was up 7% in Europe (27 countries), 5% in Korea, and 1% in Russia in the first quarter of 2014 compared with year-ago levels. China’s steel production rose only 5% and Taiwan’s steel production was flat.
• Steel product imports rose 15% while exports declined 2%; the trade deficit was significantly more negative in the first quarter of 2014 compared with one year ago.
• https://www.mapi.net/research/publications/us-industrial-outlook-june-2014
Iron and Steel Products Production
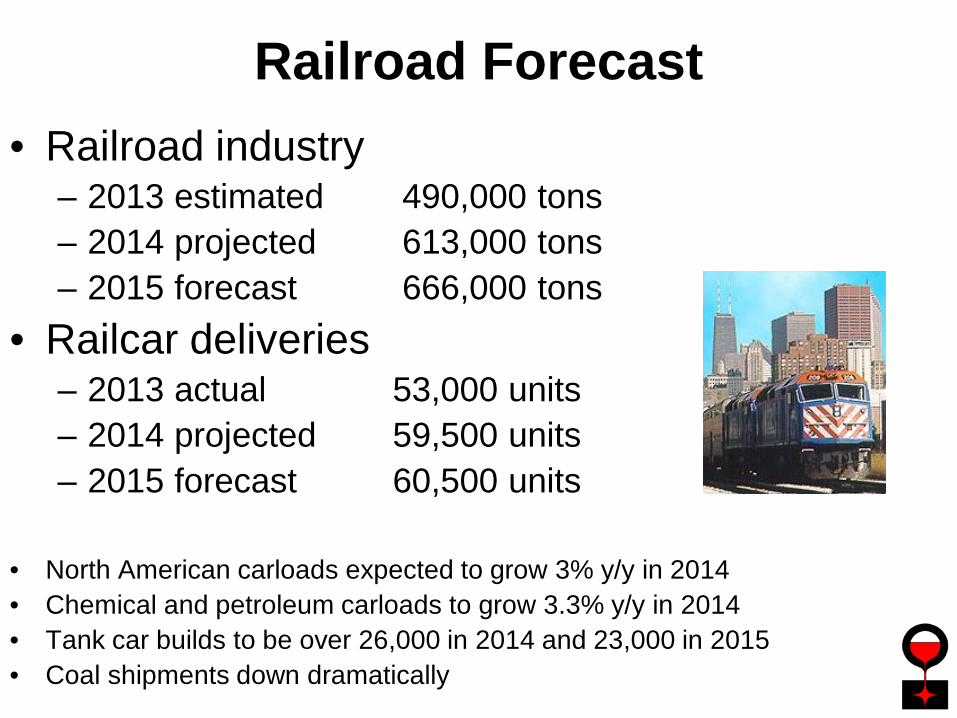
• Railroad industry– 2013 estimated 490,000 tons– 2014 projected 613,000 tons– 2015 forecast 666,000 tons
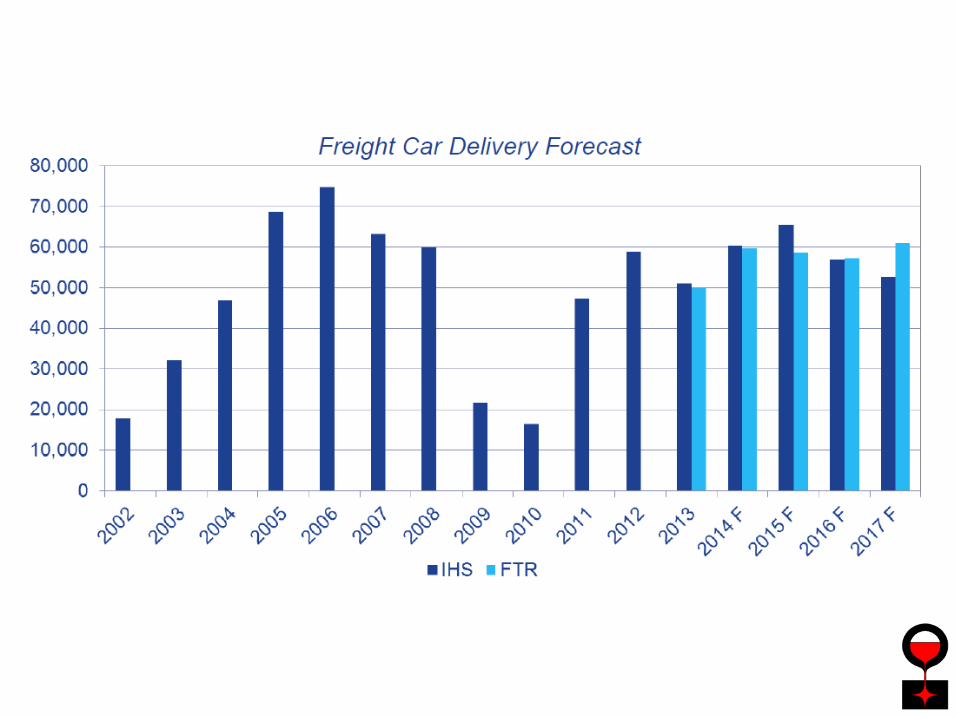
• Railcar deliveries– 2013 actual 53,000 units– 2014 projected 59,500 units– 2015 forecast 60,500 units
• North American carloads expected to grow 3% y/y in 2014• Chemical and petroleum carloads to grow 3.3% y/y in 2014• Tank car builds to be over 26,000 in 2014 and 23,000 in 2015• Coal shipments down dramatically
Railroad Forecast
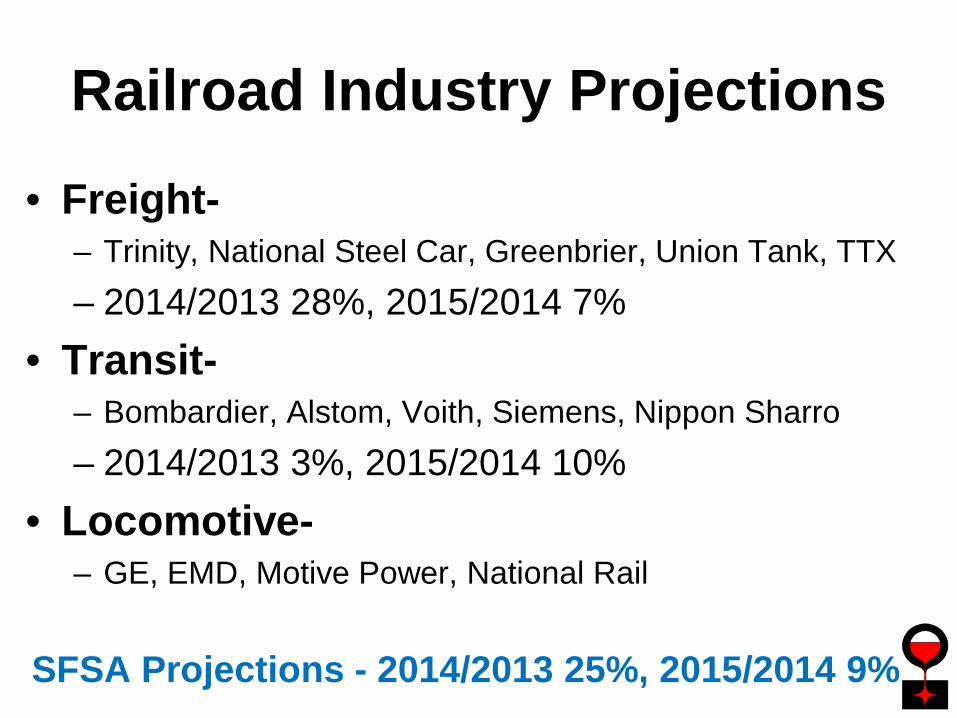
Railroad Industry Projections• Freight-
– Trinity, National Steel Car, Greenbrier, Union Tank, TTX– 2014/2013 28%, 2015/2014 7%
• Transit-– Bombardier, Alstom, Voith, Siemens, Nippon Sharro– 2014/2013 3%, 2015/2014 10%
• Locomotive-– GE, EMD, Motive Power, National Rail
SFSA Projections - 2014/2013 25%, 2015/2014 9%
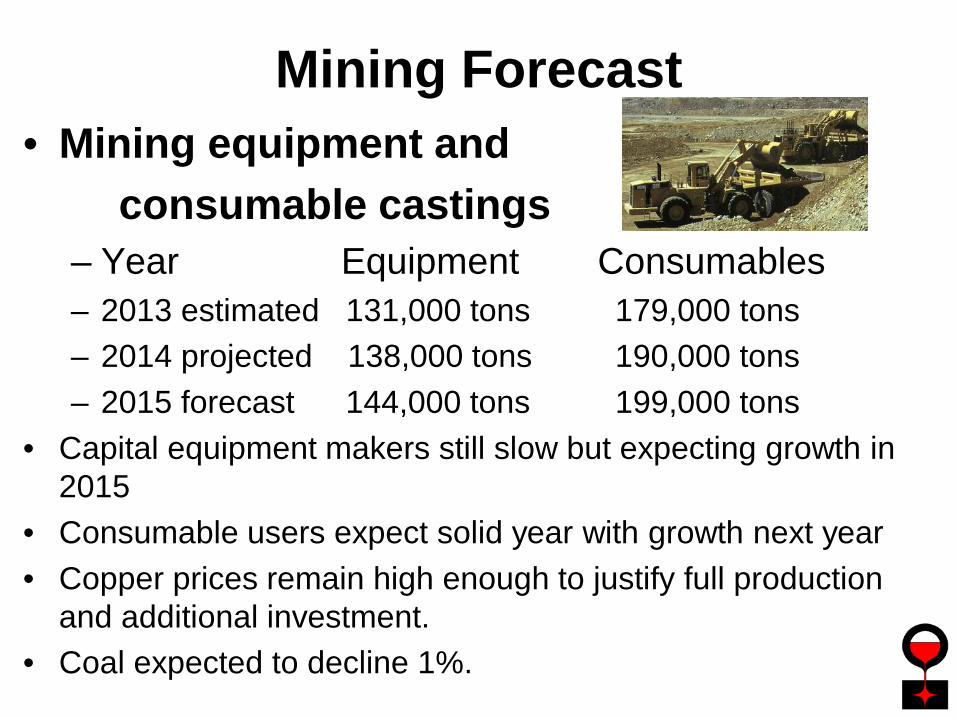
Mining Forecast• Mining equipment and
consumable castings– Year Equipment Consumables– 2013 estimated 131,000 tons 179,000 tons– 2014 projected 138,000 tons 190,000 tons– 2015 forecast 144,000 tons 199,000 tons
• Capital equipment makers still slow but expecting growth in 2015
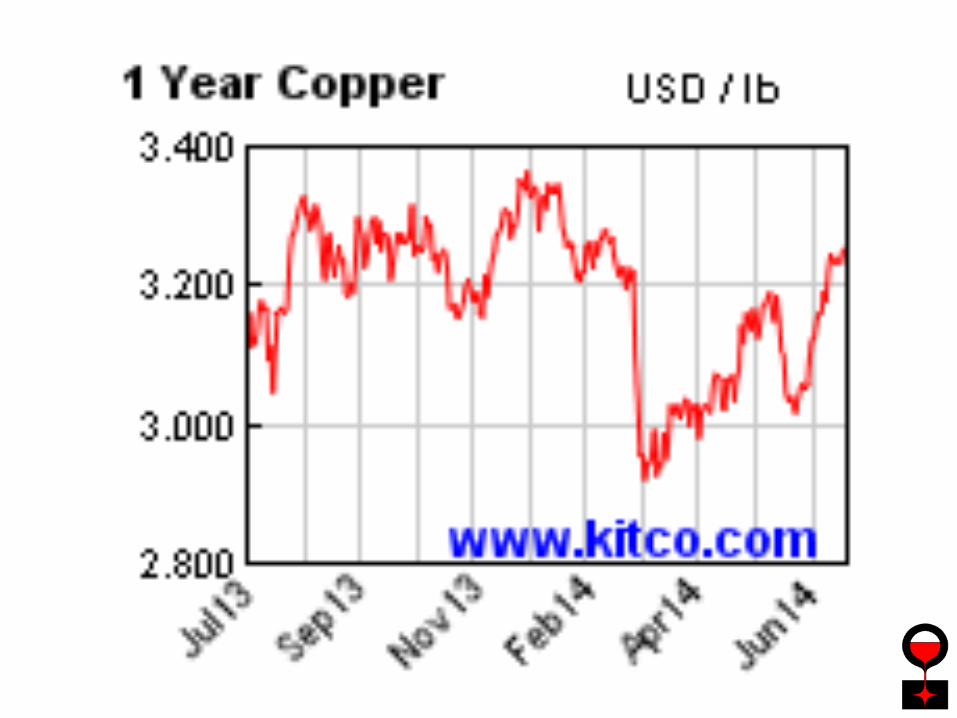
• Consumable users expect solid year with growth next year• Copper prices remain high enough to justify full production
and additional investment.• Coal expected to decline 1%.
http://www.sandlerresearch.org/world-mining-equipment-market-2015.html
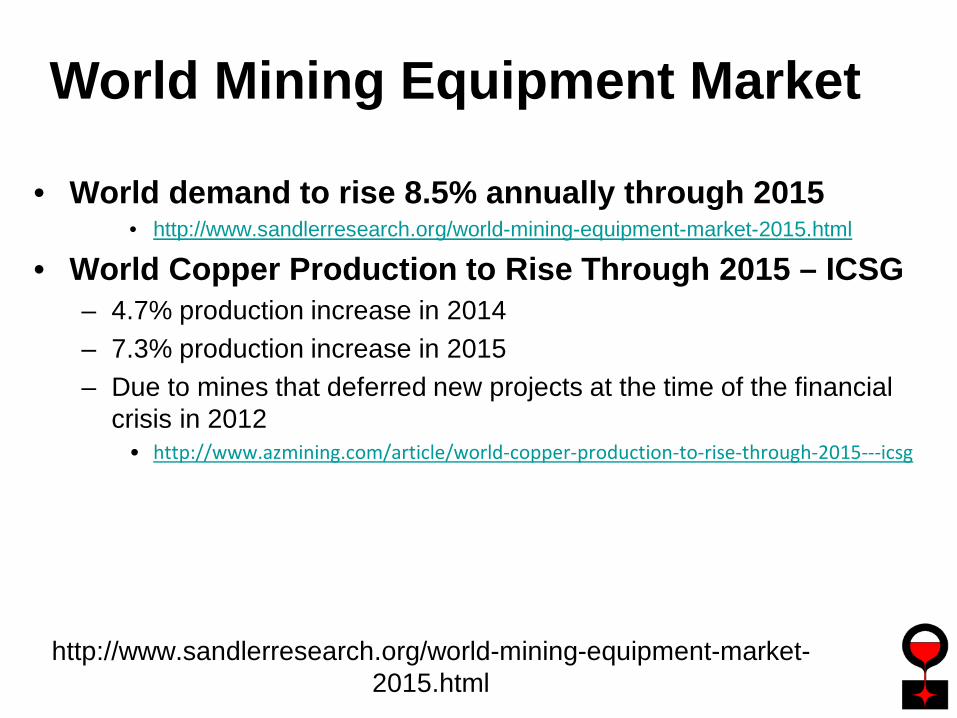
• World demand to rise 8.5% annually through 2015• http://www.sandlerresearch.org/world-mining-equipment-market-2015.html
• World Copper Production to Rise Through 2015 – ICSG– 4.7% production increase in 2014– 7.3% production increase in 2015– Due to mines that deferred new projects at the time of the financial
crisis in 2012• http://www.azmining.com/article/world-copper-production-to-rise-through-2015---icsg
World Mining Equipment Market
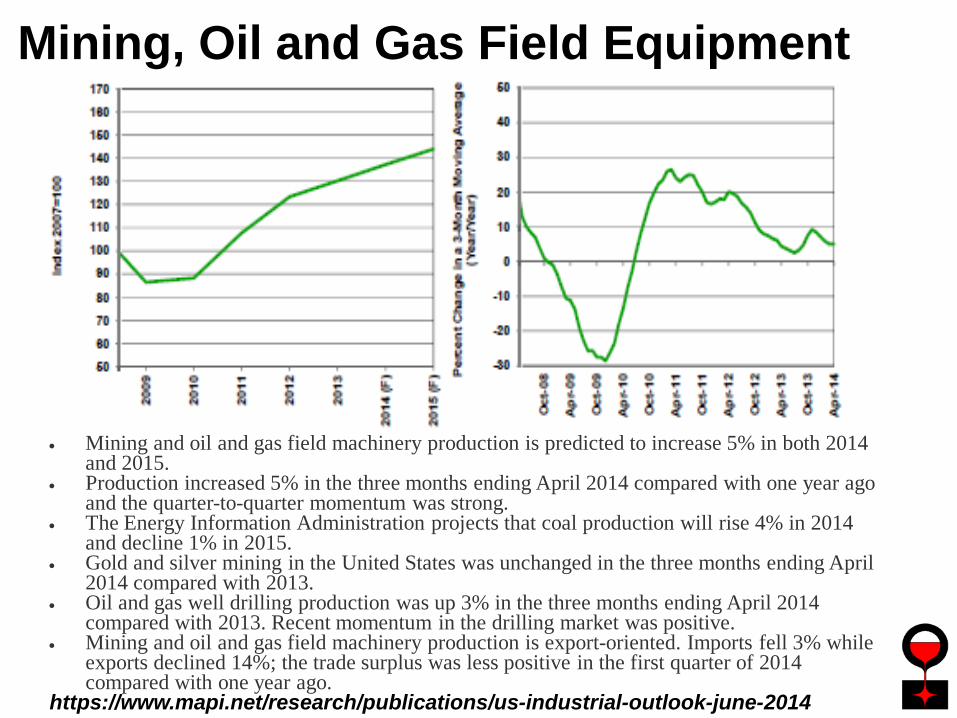
• Mining and oil and gas field machinery production is predicted to increase 5% in both 2014 and 2015.
• Production increased 5% in the three months ending April 2014 compared with one year ago and the quarter-to-quarter momentum was strong.
• The Energy Information Administration projects that coal production will rise 4% in 2014 and decline 1% in 2015.
• Gold and silver mining in the United States was unchanged in the three months ending April 2014 compared with 2013.
• Oil and gas well drilling production was up 3% in the three months ending April 2014 compared with 2013. Recent momentum in the drilling market was positive.
• Mining and oil and gas field machinery production is export-oriented. Imports fell 3% while exports declined 14%; the trade surplus was less positive in the first quarter of 2014 compared with one year ago.
https://www.mapi.net/research/publications/us-industrial-outlook-june-2014
Mining, Oil and Gas Field Equipment
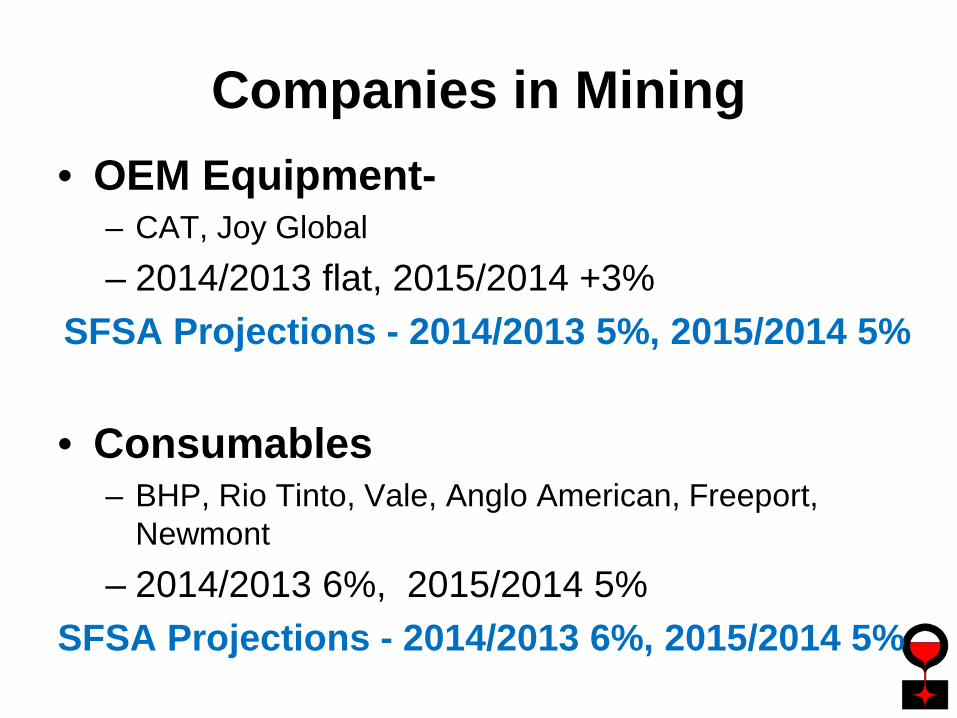
Companies in Mining• OEM Equipment-
– CAT, Joy Global– 2014/2013 flat, 2015/2014 +3%
SFSA Projections - 2014/2013 5%, 2015/2014 5%
• Consumables– BHP, Rio Tinto, Vale, Anglo American, Freeport,
Newmont– 2014/2013 6%, 2015/2014 5%
SFSA Projections - 2014/2013 6%, 2015/2014 5%
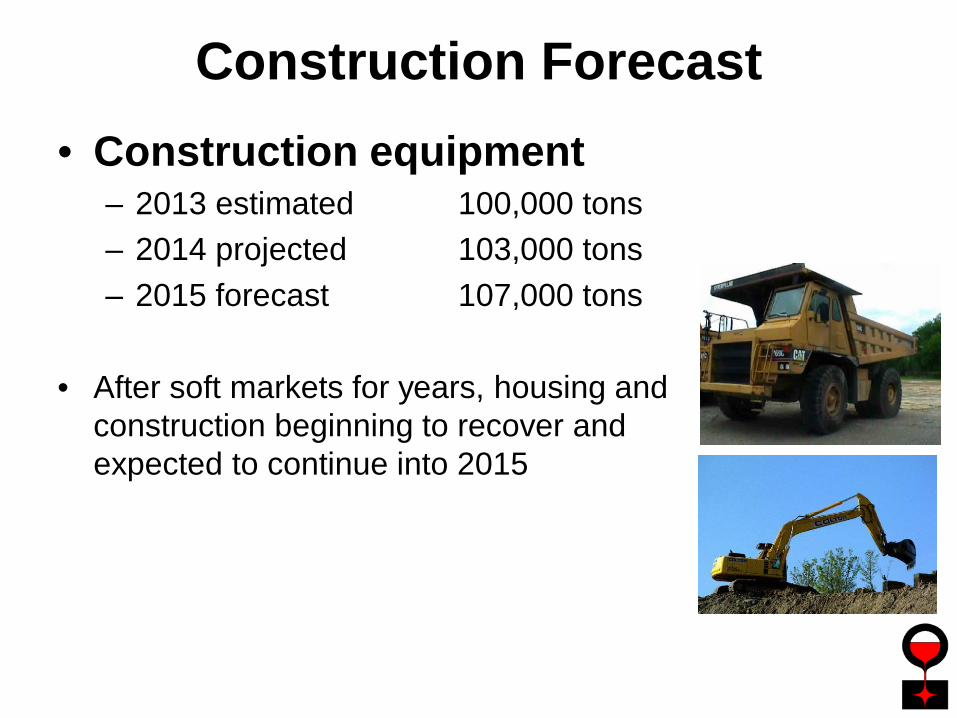
Construction Forecast• Construction equipment
– 2013 estimated 100,000 tons– 2014 projected 103,000 tons– 2015 forecast 107,000 tons
• After soft markets for years, housing and construction beginning to recover and expected to continue into 2015
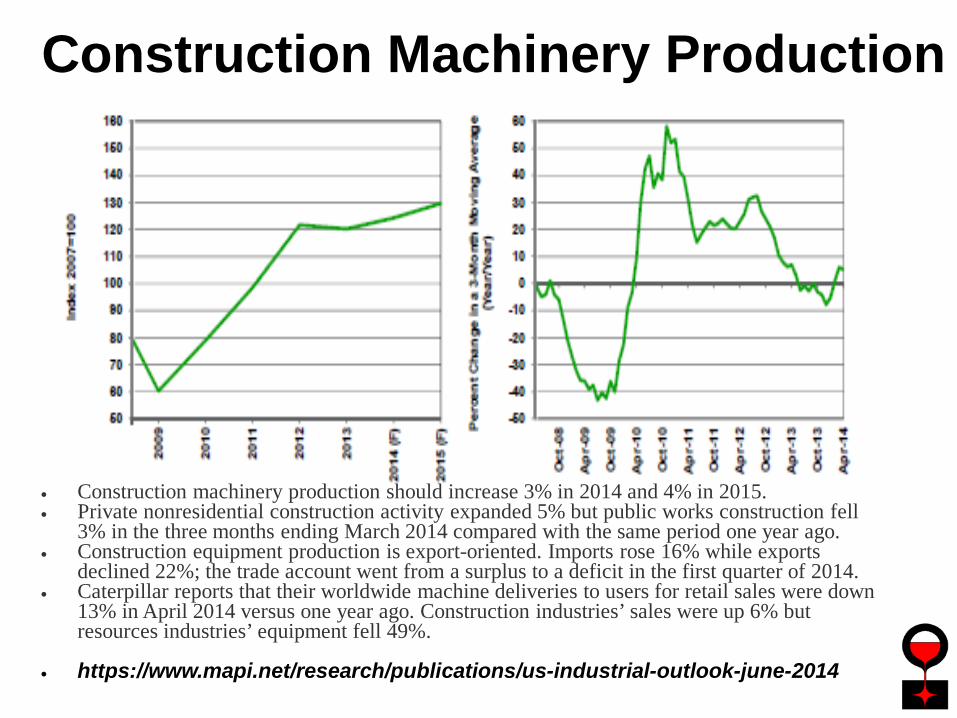
• Construction machinery production should increase 3% in 2014 and 4% in 2015.• Private nonresidential construction activity expanded 5% but public works construction fell
3% in the three months ending March 2014 compared with the same period one year ago.• Construction equipment production is export-oriented. Imports rose 16% while exports
declined 22%; the trade account went from a surplus to a deficit in the first quarter of 2014.• Caterpillar reports that their worldwide machine deliveries to users for retail sales were down
13% in April 2014 versus one year ago. Construction industries’ sales were up 6% but resources industries’ equipment fell 49%.
• https://www.mapi.net/research/publications/us-industrial-outlook-june-2014
Construction Machinery Production
CaterpillarMining:• Depressed sales in resources segment for 8 quarters• >37% contraction in sales• Management predicts another 20% decline in 2014• Asia Pacific down 69%• EMEA down 47%• Latin America down 62%• North America recovered modestly due to coal stabilizing
US Construction – “brightest spot”• Picking up in the US – multi family housing, automotive,
hospitals, schools, data centers• Dealers showing double digit growth, up 17%• Weakness in Europe• Signs of concern in Asia Pacific
http://www.fool.com/investing/general/2014/07/23/why-caterpillar-incs-q2-results-could-be-a-mixed-b.aspx
Companies in Construction
• Small Earth Moving-– CAT, Bobcat, John Deere
• Road Construction-– CAT, Komatsu, Terex, Hitachi
• Aggregate Crushing-– Terex, Metso, FLS
• 2014/2013 3%, 2015/2014 2%
SFSA Projections - 2014/2013 5%, 2015/2014 5%
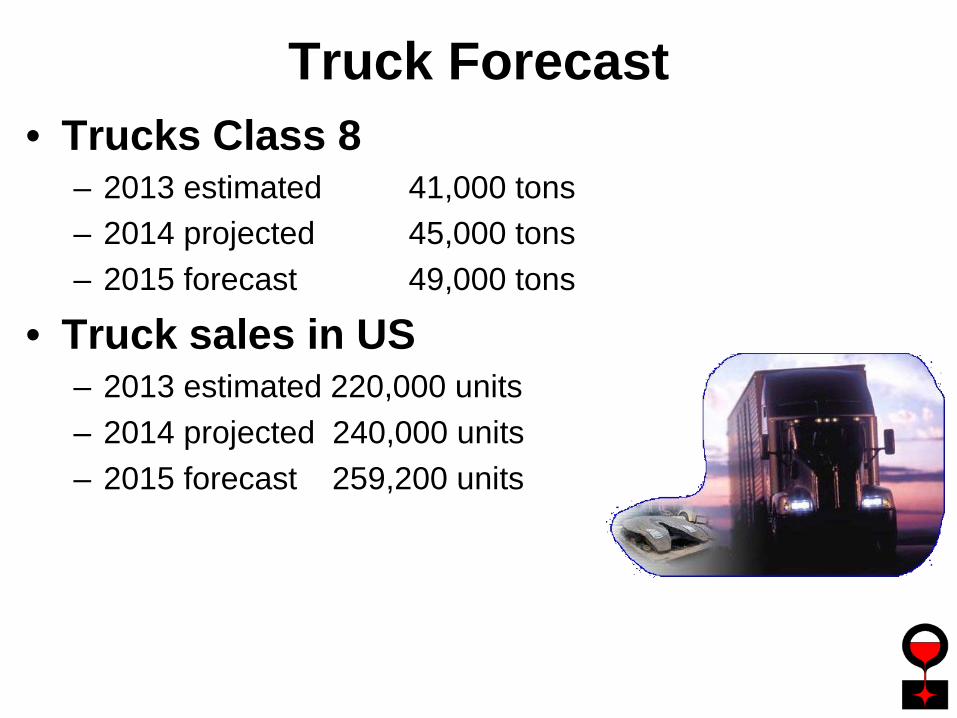
Truck Forecast• Trucks Class 8
– 2013 estimated 41,000 tons– 2014 projected 45,000 tons– 2015 forecast 49,000 tons
• Truck sales in US– 2013 estimated 220,000 units– 2014 projected 240,000 units– 2015 forecast 259,200 units
15%
Companies in Trucking
• Class 8 Trucks-– Freightliner, Volvo, PACCAR– 2014/2013 3%, 2015/2014 2%
SFSA Projections - 2014/2013 11%, 2015/2014 8%
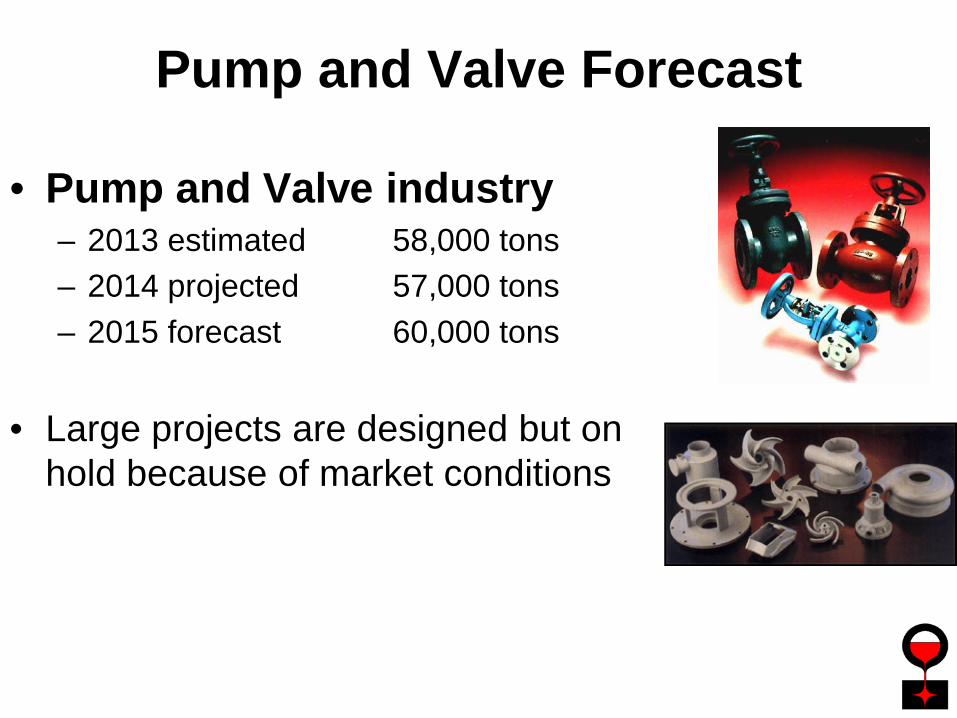
Pump and Valve Forecast
• Pump and Valve industry– 2013 estimated 58,000 tons– 2014 projected 57,000 tons– 2015 forecast 60,000 tons
• Large projects are designed but on hold because of market conditions
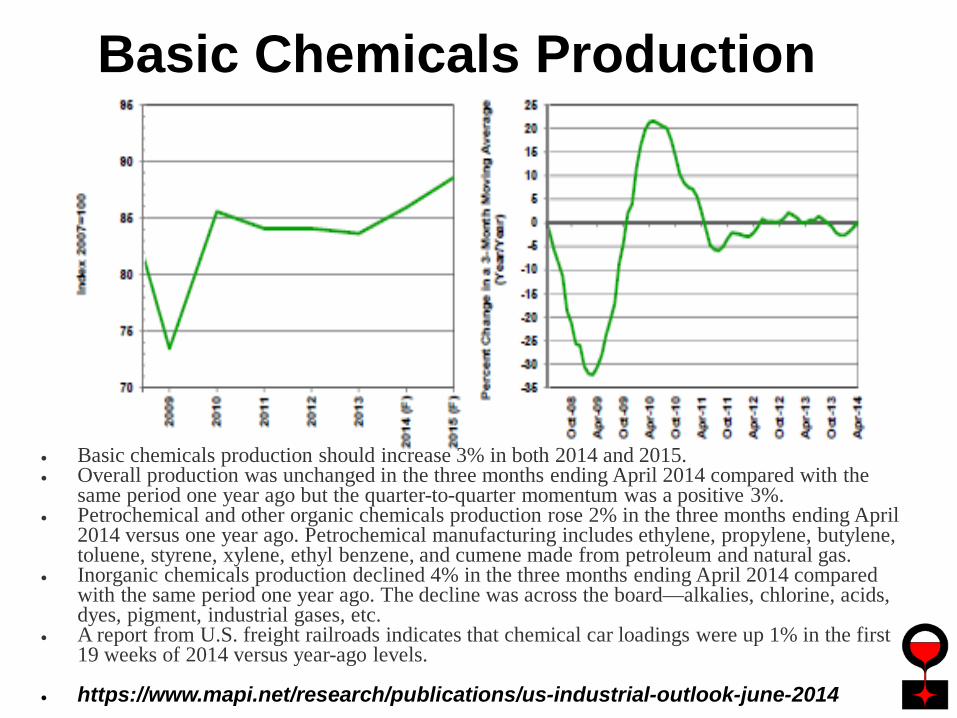
• Basic chemicals production should increase 3% in both 2014 and 2015.• Overall production was unchanged in the three months ending April 2014 compared with the
same period one year ago but the quarter-to-quarter momentum was a positive 3%.• Petrochemical and other organic chemicals production rose 2% in the three months ending April
2014 versus one year ago. Petrochemical manufacturing includes ethylene, propylene, butylene, toluene, styrene, xylene, ethyl benzene, and cumene made from petroleum and natural gas.
• Inorganic chemicals production declined 4% in the three months ending April 2014 compared with the same period one year ago. The decline was across the board—alkalies, chlorine, acids, dyes, pigment, industrial gases, etc.
• A report from U.S. freight railroads indicates that chemical car loadings were up 1% in the first 19 weeks of 2014 versus year-ago levels.
• https://www.mapi.net/research/publications/us-industrial-outlook-june-2014
Basic Chemicals Production
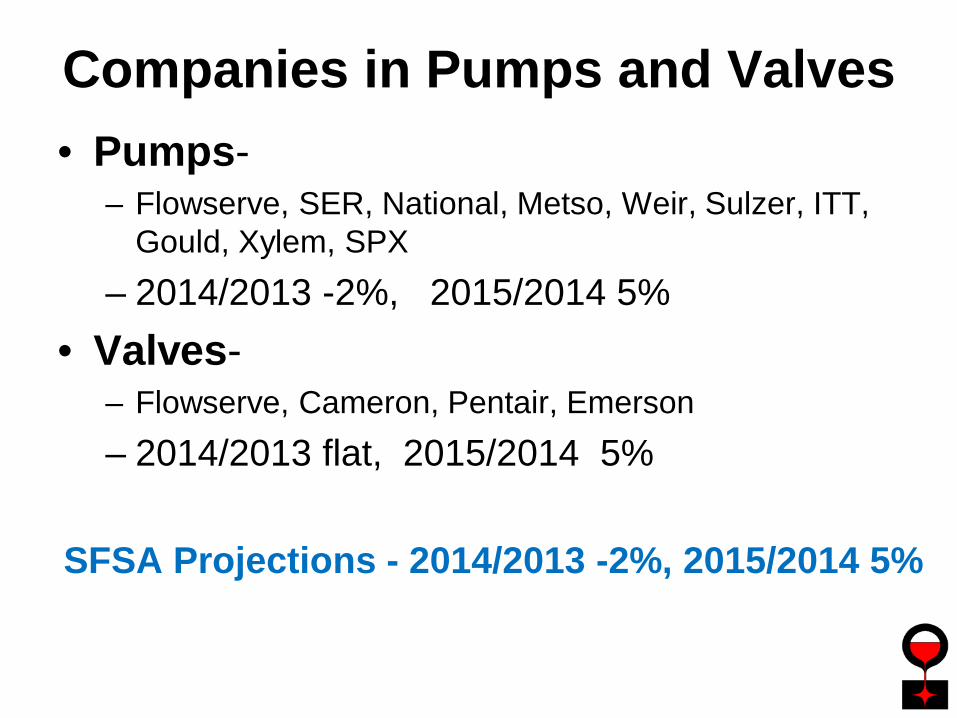
Companies in Pumps and Valves• Pumps-
– Flowserve, SER, National, Metso, Weir, Sulzer, ITT, Gould, Xylem, SPX
– 2014/2013 -2%, 2015/2014 5%• Valves-
– Flowserve, Cameron, Pentair, Emerson– 2014/2013 flat, 2015/2014 5%
SFSA Projections - 2014/2013 -2%, 2015/2014 5%
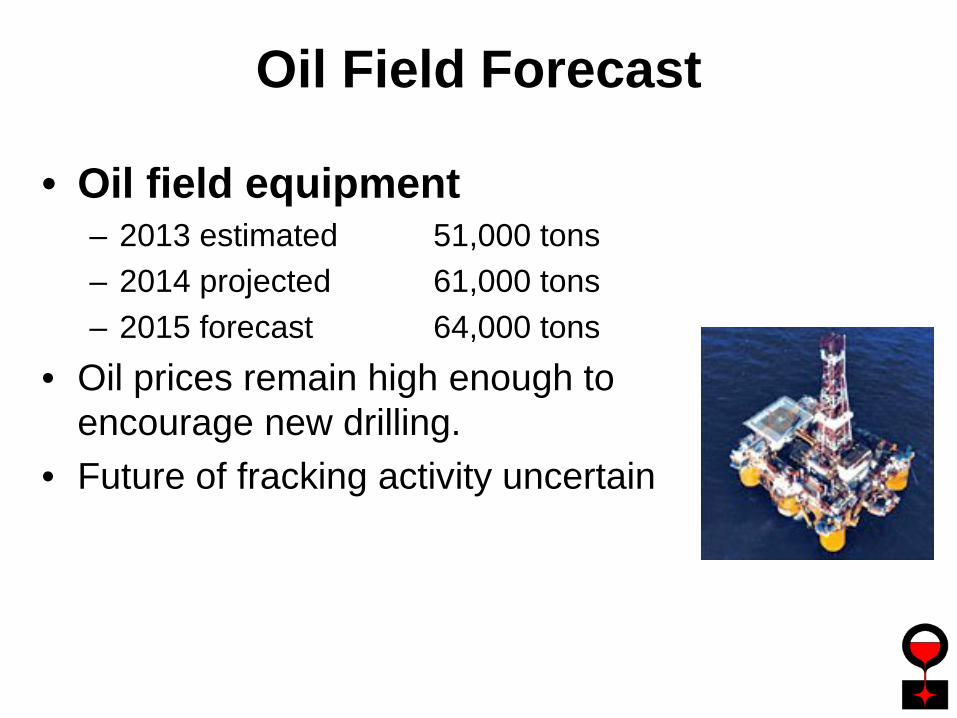
Oil Field Forecast
• Oil field equipment– 2013 estimated 51,000 tons– 2014 projected 61,000 tons– 2015 forecast 64,000 tons
• Oil prices remain high enough to encourage new drilling.
• Future of fracking activity uncertain
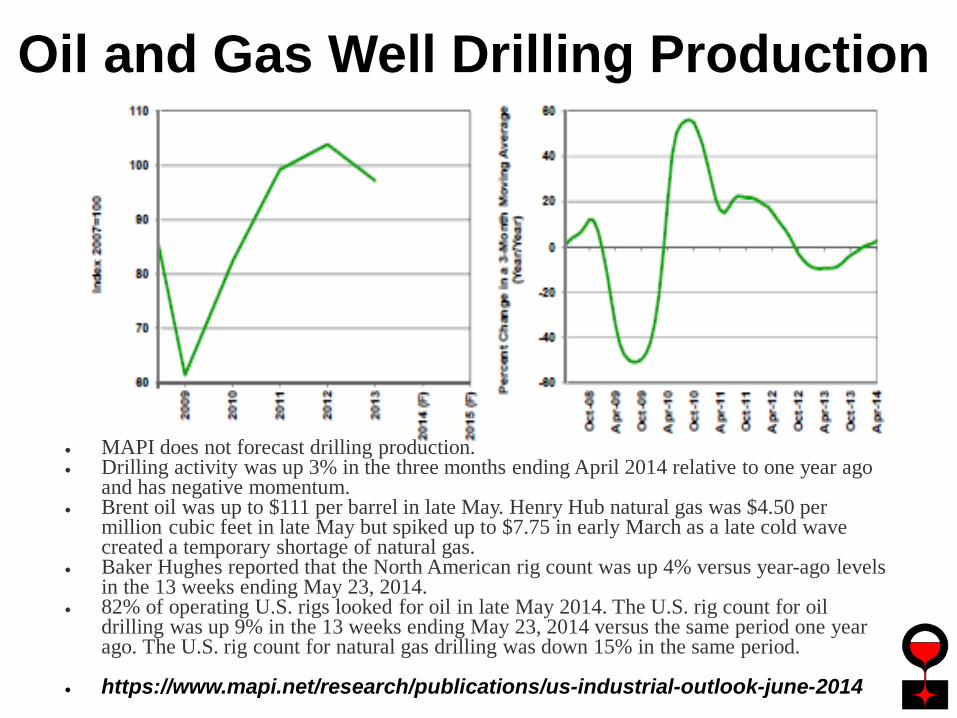
• MAPI does not forecast drilling production.• Drilling activity was up 3% in the three months ending April 2014 relative to one year ago
and has negative momentum.• Brent oil was up to $111 per barrel in late May. Henry Hub natural gas was $4.50 per
million cubic feet in late May but spiked up to $7.75 in early March as a late cold wave created a temporary shortage of natural gas.
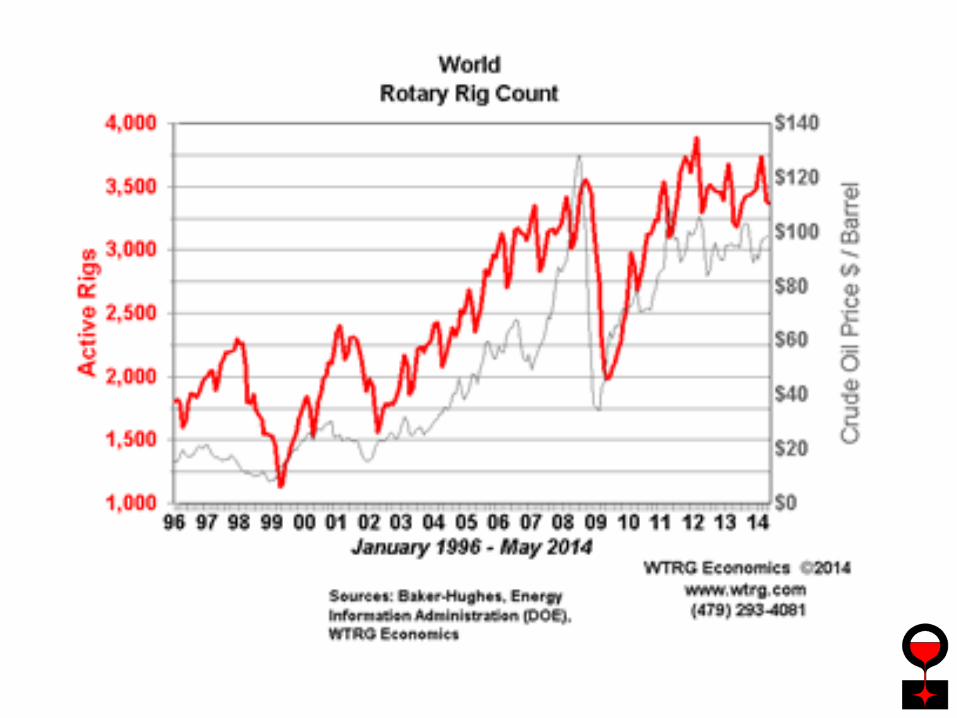
• Baker Hughes reported that the North American rig count was up 4% versus year-ago levels in the 13 weeks ending May 23, 2014.
• 82% of operating U.S. rigs looked for oil in late May 2014. The U.S. rig count for oil drilling was up 9% in the 13 weeks ending May 23, 2014 versus the same period one year ago. The U.S. rig count for natural gas drilling was down 15% in the same period.
• https://www.mapi.net/research/publications/us-industrial-outlook-june-2014
Oil and Gas Well Drilling Production
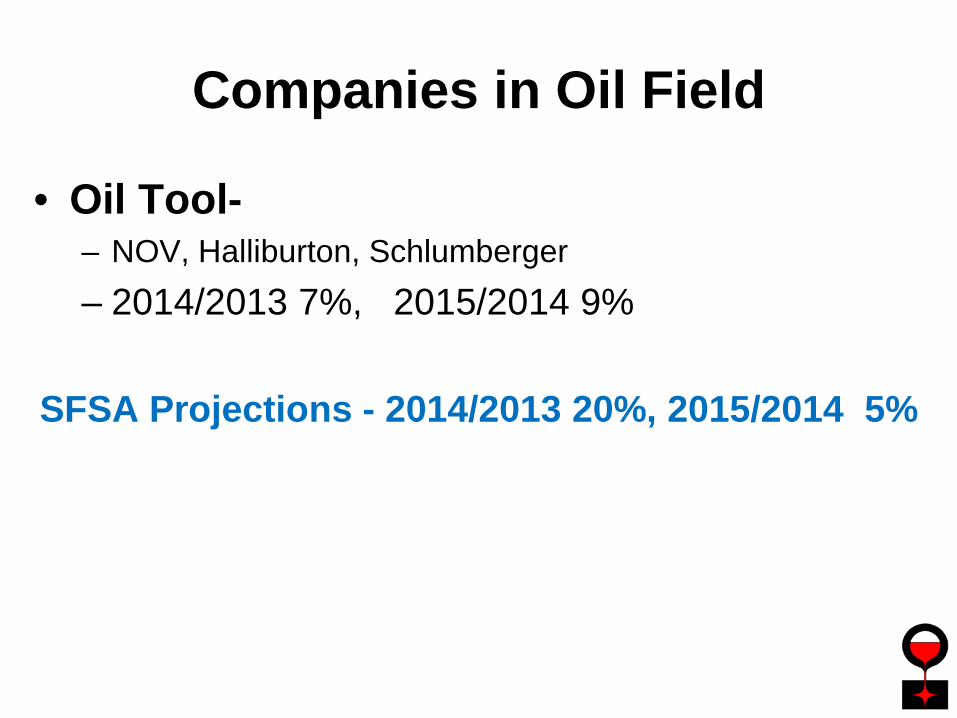
Companies in Oil Field
• Oil Tool-– NOV, Halliburton, Schlumberger– 2014/2013 7%, 2015/2014 9%
SFSA Projections - 2014/2013 20%, 2015/2014 5%
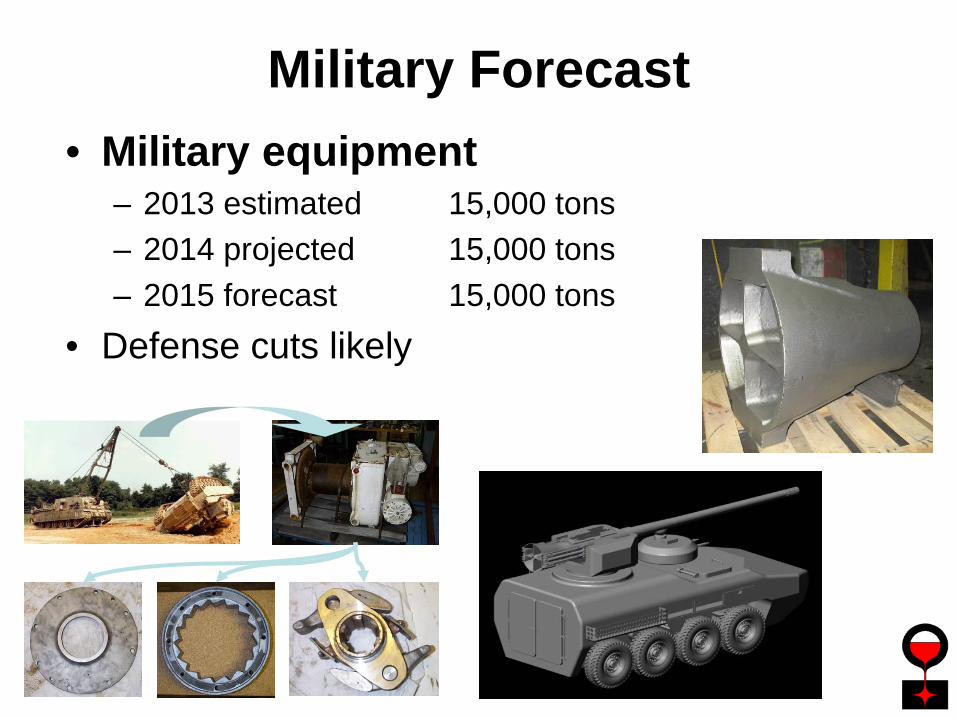
Military Forecast• Military equipment
– 2013 estimated 15,000 tons– 2014 projected 15,000 tons– 2015 forecast 15,000 tons
• Defense cuts likely
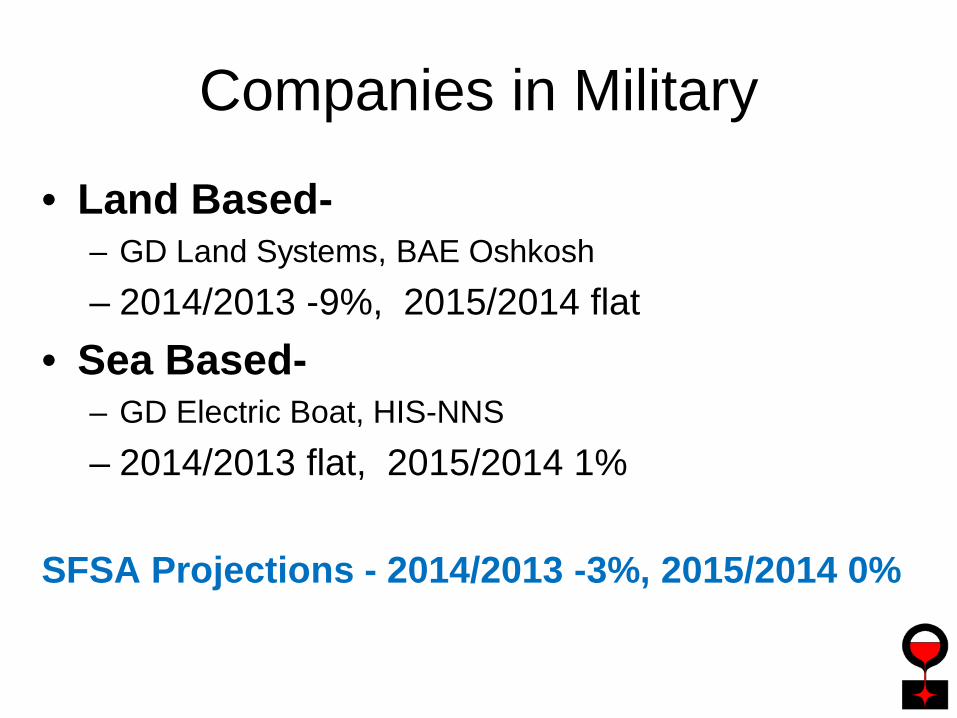
Companies in Military
• Land Based-– GD Land Systems, BAE Oshkosh– 2014/2013 -9%, 2015/2014 flat
• Sea Based-– GD Electric Boat, HIS-NNS– 2014/2013 flat, 2015/2014 1%
SFSA Projections - 2014/2013 -3%, 2015/2014 0%
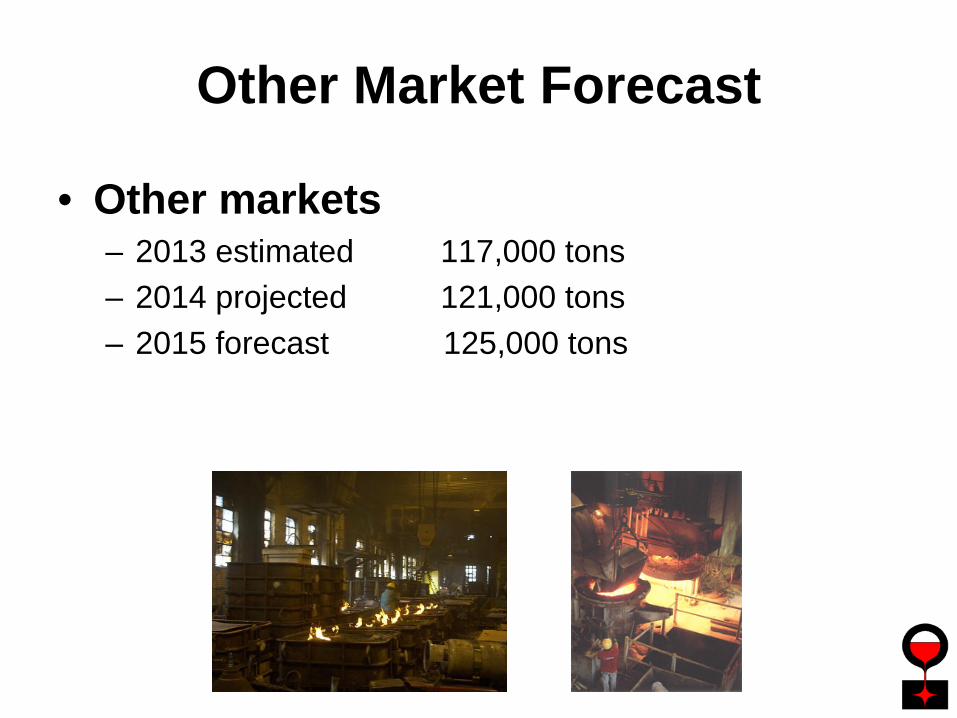
Other Market Forecast
• Other markets– 2013 estimated 117,000 tons– 2014 projected 121,000 tons– 2015 forecast 125,000 tons
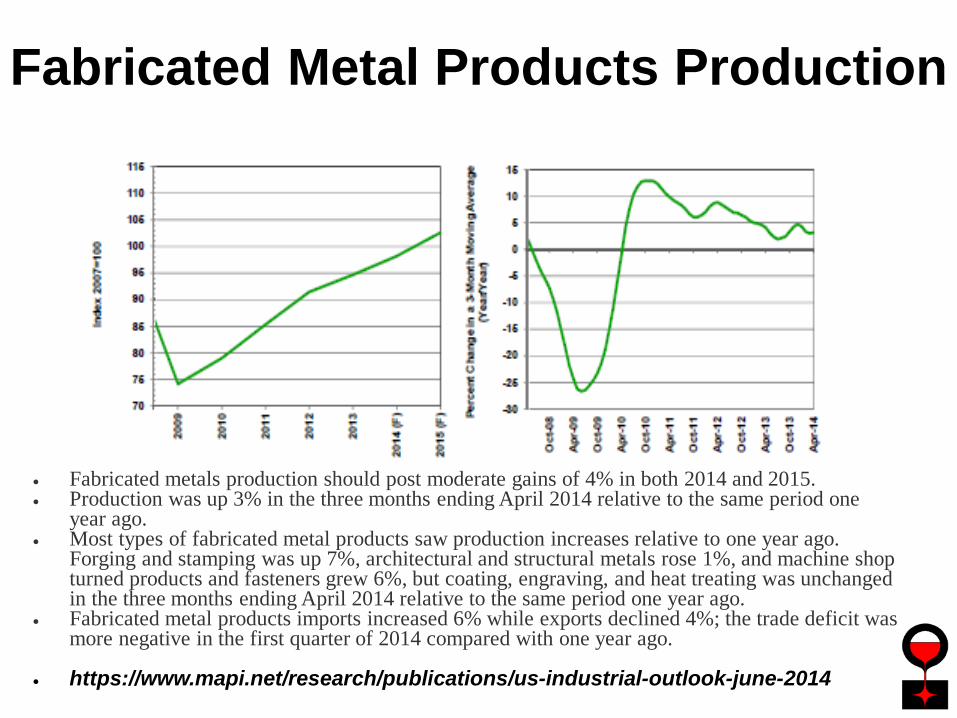
• Fabricated metals production should post moderate gains of 4% in both 2014 and 2015.• Production was up 3% in the three months ending April 2014 relative to the same period one
year ago.• Most types of fabricated metal products saw production increases relative to one year ago.
Forging and stamping was up 7%, architectural and structural metals rose 1%, and machine shop turned products and fasteners grew 6%, but coating, engraving, and heat treating was unchanged in the three months ending April 2014 relative to the same period one year ago.
• Fabricated metal products imports increased 6% while exports declined 4%; the trade deficit was more negative in the first quarter of 2014 compared with one year ago.
• https://www.mapi.net/research/publications/us-industrial-outlook-june-2014
Fabricated Metal Products Production
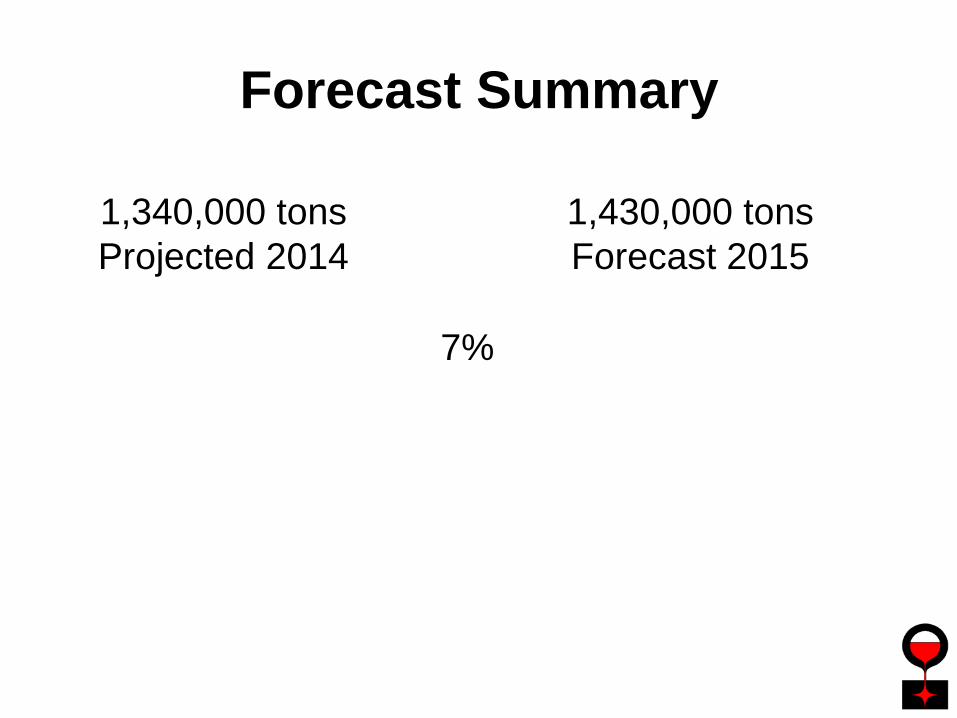
Forecast Summary
1,430,000 tonsForecast 2015
1,340,000 tonsProjected 2014
7%
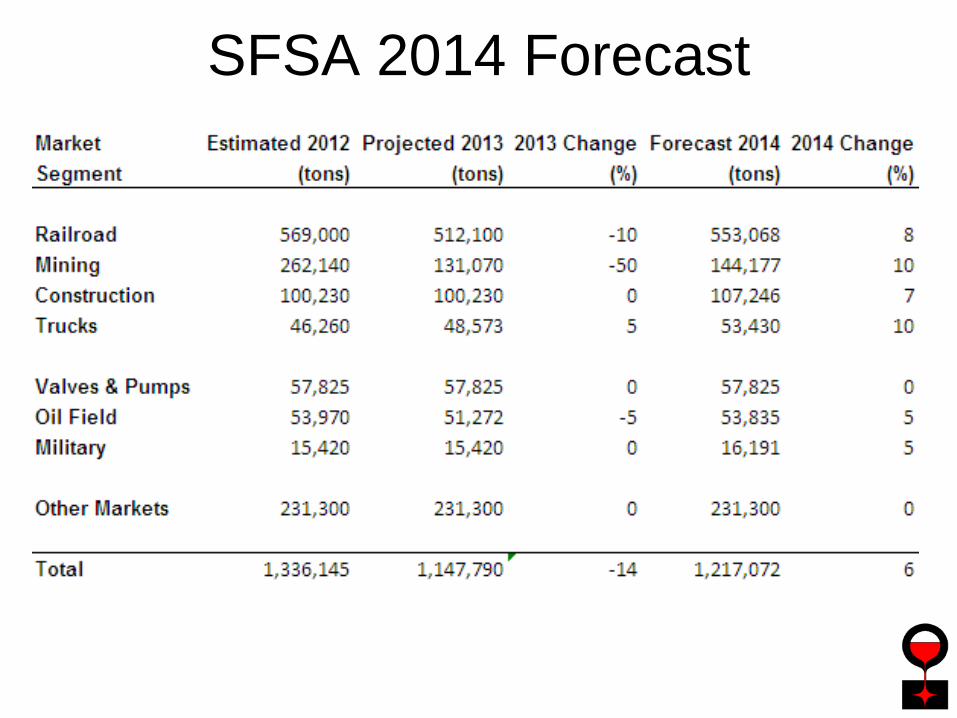
SFSA 2014 Forecast