Embed Size (px)
Citation preview

Simulation of diets for dairy goats and growing doelings using nonlinear optimization procedures
Leonardo Siqueira Glória1, Matheus Lima Corrêa Abreu2, Norberto Silva Rocha3, Tadeu Silva de Oliveira4, Raphael dos Santos Gomes2, Nardele Moreno Rohem Júnior2, Laila
Cecília Ramos Bendia2, Alberto Magno Fernandes4
1 Universidade Federal de Viçosa, Programa de Pós-graduação em Genética e Melhoramento, Viçosa, MG, Brasil.2 Universidade Estadual do Norte Fluminense Darcy Ribeiro, Programa de Pós-graduação em Ciência Animal, Campos dos Goytacazes, RJ, Brasil.3 Universidade Federal dos Vales do Jequitinhonha e Mucuri, Departamento de Zootecnia, Unaí, MG, Brasil.4 Universidade Estadual do Norte Fluminense Darcy Ribeiro, Laboratório de Zootecnia, Campos dos Goytacazes, RJ, Brasil.
ABSTRACT - The objective of this study was to simulate total dry matter intake and cost of diets optimized by nonlinear programming to meet the nutritional requirements of dairy does and growing doelings. The mathematical model was programmed in a Microsoft Excel® spreadsheet. Increasing values of body mass and average daily weight gain for growing doelings and increasing body mass values and milk yield for dairy does were used as inputs for optimizations. Three objective functions were considered: minimization of the dietary cost, dry matter intake maximization, and maximization of the efficiency of use of theingested crude protein. To solve the proposed problems we used the Excel® Solver® algorithm. The Excel® Solver® was able to balance diets containing different objective functions and provided different spaces of feasible solutions. The best solutions are obtained by least-cost formulations; the other two objective functions, namely maximize dry matter intake and maximize crude protein use, do not produce favorable diets in terms of costs.
Key Words: decision support system, diet formulation, diet optimization, goat nutrition
Revista Brasileira de Zootecnia© 2016 Sociedade Brasileira de ZootecniaISSN 1806-9290 www.sbz.org.br
R. Bras. Zootec., 45(2):71-84, 2016
Received June 19, 2015 and accepted August 3, 2015.Corresponding author: [email protected]
http://dx.doi.org/10.1590/S1806-92902016000200005
Copyright © 2016 Sociedade Brasileira de Zootecnia. This is an Open Access article distributed under the terms of the Creative Commons Attribution License (http://creativecommons.org/licenses/by/4.0/), which permits unrestricted use, distribution, and reproduction in any medium, provided the original work is properly cited.
Introduction
Feeding is one of the most important components of the livestock activity. The productive animal must be fed properly to express its genetic potential, and feeding represents a high proportion of the total production costs. In two small dairy goat production systems in North-western Rio de Janeiro State, Brazil, 41 to 73% of the total effective operating costs consisted of concentrates (Vieira et al., 2009). Least-cost optimization procedures are used to find the most suited combination of foods that meetsanimal requirements (Agrawal and Heady, 1972). Linear programming tools generally able to solve the problem of diet formulation, such as the Simplex method (Agrawal and Heady, 1972; Tedeschi et al., 2000). Nevertheless, the complexity of the animal physiology and the interactions among the food eaten and digestive and metabolic processes that occur in the animal organism (Dijkstra et al., 2005)
demand the use of nonlinear programming to obtain more accurate diet formulations (Jardim et al., 2013; 2015).
Nonlinear programming can be used to simulate scenarios from input data (De Los Campos et al., 2013). On the other hand, simulation studies can be used to predict specific virtual situations before making decisions or toimprove our understanding of certain phenomena. From this perspective, the aim of this study was to simulate scenarios where three objective functions were optimized: least-cost of diets were minimized, dry matter intake of simulated diets were maximized, and ratios of metabolizable protein intake to crude protein intake were maximized. These problems were considered as general nonlinear programming problems, in which target performances and nutritional requirements of dairy does and growing doelings and usual dairy goat feeds were used as inputs.
Material and Methods
The Microsoft Excel® spreadsheet was used to program a mathematical model that combines the conceptual and mathematical structures of the CNCPS - Cornell Net Carbohydrate and Protein System (Fox et al., 2004) to estimate nutritive value of feeds, and the NRC (2007) equations to calculate nutrient requirement of growing doelings and lactating does. The steady-state pool size and

72 Glória et al.
R. Bras. Zootec., 45(2):71-84, 2016
digestibility of fiber in the ruminoreticulum were modeledaccording to Vieira et al. (2008a,b). Acronyms and symbols used in equations that describe the system are listed in Tables 1 and 2.
The diets for growing doelings and lactating does were formulated as a general nonlinear programming problem subjected to constraints of equalities and inequalities. Three different problems were optimized by considering three different objective functions separately:
Minimize: (1)
Maximize: (2)
Maximize: (3)
Subjected to:
MEI ≥ MEt (4)
MPI ≥ MPt (5)
RFMmax = 8.5 × BW (6)
EFI = 200 + FIj (7)
The objective function Z (Eq. 1) is represented by the linear combination of constant ci, i.e., the unitary dry matter cost of the i-th ingredient; xi represents the unknown dry matter intake of the i-th ingredient. The objective function W (Eq. 2) is the total dry matter intake, and the objective function K (Eq. 3) is the proportion of the crude protein ingested (CPI) transformed into metabolizable protein; MEI and MPI are the intakes of metabolizable energy (MJ/day) and metabolizable protein (g/day) intakes, respectively; MEt is the metabolizable energy required (MJ/day); and MPt is the metabolizable protein required (g/day; Table 3). The term RFMmax corresponds to the maximum fiber retention capacity of the rumen(g/day); EFI is the effective fiber concentration of the diet (g/kg of dry matter); and FIj is the fiber increment added to the minimum fiber content set (200 g/kg of drymatter). FIj values were increased successively by adding 50 g/kg of dry matter constant increments to the minimum concentration of effective fiber for dairy does, and 25 g/kg of dry matter constant increments for growing doelings until feasible solutions were no longer achieved.
Constraints to the use of urea were also added. It is recommended that the urea supply should not exceed 40 g per 100 kg of body weight (BW), and two hypothetical situations were considered to balance rumen ammonia nitrogen (RANB, g/d):
RANB ≥ 0 (8)or RANB ≥ −200 (9)
The RANB is a relationship between ammonia and carbohydrates available to the rumen microorganisms (Russel et al., 1992; AFRC, 1993; Fox, 2004). In addition, a maximum limit of 50 g/kg of diet dry matter for crude fat concentration was set for all simulations (NRC, 2001).
Simulations for growing doelings were made by varying the mass of the animal from 17 to 35 kg of BW with 3 kg BW increments. The diets were optimized to meet maintenance requirements and nutrient demands generated by daily weight gains ranging from 0 to 150 g/day, with 25 g/day constant increments. The simulations for lactating does were made by varying the weight of the animal from 50 to 80 kg with 5 kg BW increments, and milk production ranging from 2 to 9 kg/day with 0.5 kg/day increments.
We solved the presented problems by using the Excel® Solver® spreadsheet. This tool uses a generalized reduced gradient algorithm to optimize nonlinear problems (Lasdon et al., 1978).
The prices of the feed ingredients used in the model (Table 4) were taken in December 2010, as current market prices in the northern and northwestern regions of Rio de Janeiro State. The nutritional composition of the feeds was obtained from tables contained in CNCPS (Sniffen et al., 1992), Nutrient Requirements of Beef Cattle (NRC, 1996), and Nutrient Requirements of Dairy Cattle (NRC, 2001).
Results
The Excel® Solver® was efficient to obtain feasiblesolutions to the proposed problems. Simulations with increments for daily gain and milk yield resulted in positive linear relationships between production levels and MEI, and production levels and MPI (Figures 1a, 1b, 1c and 1d). Sometimes, the space of feasible solutions differed remarkably. However, the increments in the fibercontent of the diet caused an increased dry matter intake until a maximum point was achieved. Afterwards, a sharp decrease in the solution space was observed at higher fiber concentrations in the diet (Figures 1e and 1f). Thenumber of feasible solutions was higher for fiber contents≤500 g/kg of diet dry matter for lactating does (Figure 1e). However, for growing doelings, only the level of 725 g/kg of fiber in the diet reduced the space of feasible solutionsconsiderably (Figure 1f).
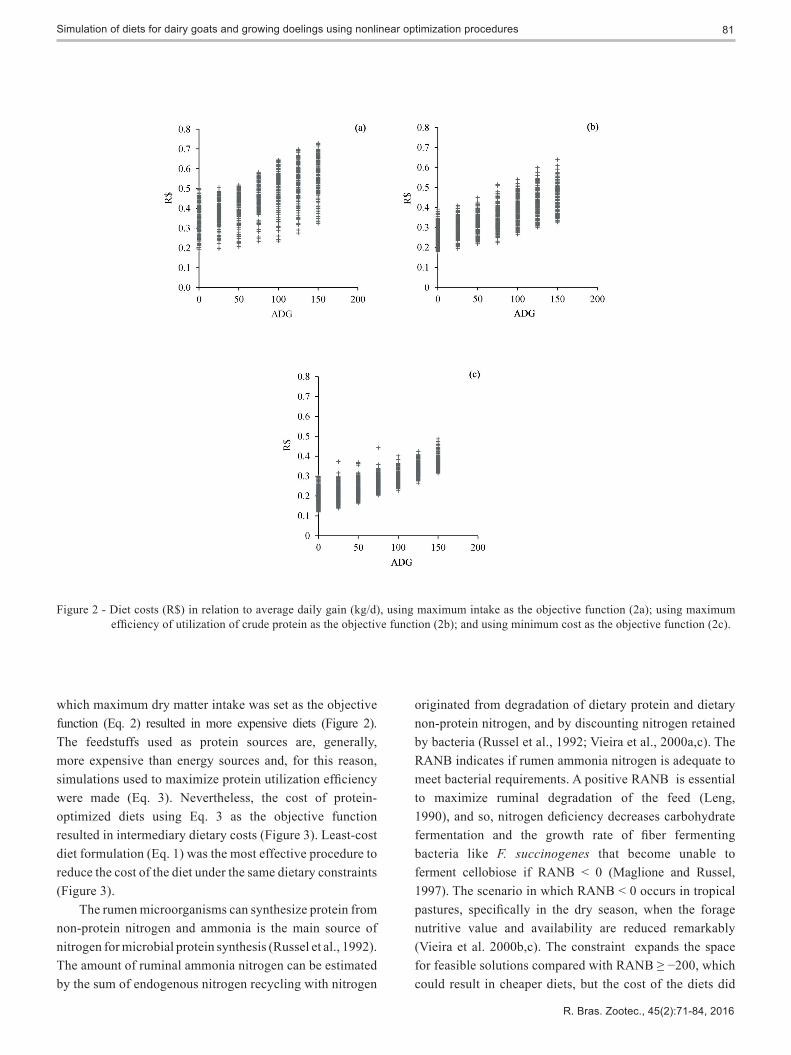
The optimization for maximum dry matter intake, i.e., objective function W or Eq. 2, resulted in more expensive diets for growing doelings in comparison with the other objective functions (Figure 2a). The maximization of the crude protein utilization or objective function K (Eq. 3, Figure 2b) produced diets with intermediate costs and,

73Simulation of diets for dairy goats and growing doelings using nonlinear optimization procedures
R. Bras. Zootec., 45(2):71-84, 2016
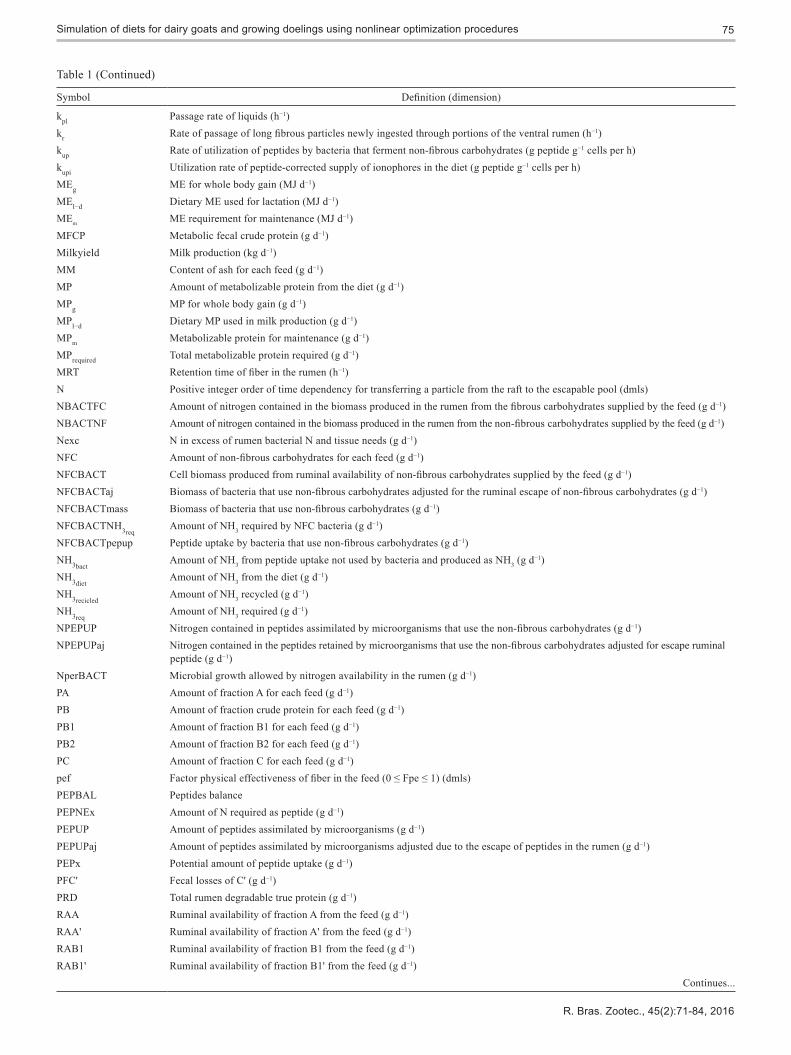
Table 1 - Definitions of symbols and acronyms used in the text1
Symbol Definition (dimension)
[TDNa] Content of total apparently digestible nutrients from the diet (dmls)[DE] Digestible energy content (MJ kg−1)[ME] Metabolizable energy content (MJ kg−1)λr Asymptotic age-dependent fractional rate for transference of particles from the raft to the escapable pool (h−1)A Protein fraction A for each feed (g kg−1 DM)A' Carbohydrate fraction A' (simple sugars) (g kg−1 DM)ADE Amount of digestible energy available to the animal provided by feed (MJ d−1)ADG Average daily gain (kg d−1)AIM Amount of indigestible dry matter (g d−1)AME Amount of metabolizable energy available to the animal provided by feed (MJ d−1)AMNBACTFC Ammonia nitrogen retained by microorganisms that use fibrous carbohydrates (g d−1)AMNBACTNF Ammonia nitrogen retained by microorganisms that use the non-fibrous carbohydrates (g d−1)Apef Amount of physically effective fiber from the feed (g d−1)Ash Amount of ash for each feed (g d−1)B1 Protein B1 fraction for each feed (g kg−1 DM)B1' Carbohydrate B1' fraction (starch and soluble fibers) (g kg−1 DM)B2 Protein B2 fraction for each feed (g kg−1 DM)B2' Carbohydrate B2' fraction (available NDF) (g kg−1 DM)BACT Cell biomass produced from total ruminal availability of carbohydrates supplied by feed (g d−1)BactNBAL Ruminal bacteria N balanceBACTred Reduction in the amount of bacteria due to nitrogen deficiency in the rumen (g d−1)BW Animal body weight (kg)C Protein C fraction for each feed (g kg−1 DM)C' Carbohydrate C' fraction (indigestible) (g kg−1 DM)CA' Amount of A' for each feed (g d−1)CB1' Amount of B1' for each feed (g d−1)CB2' Amount of B2' for each feed (g d−1)CC' Amount of C' for each feed (g d−1)Cd Coefficient of intestinal digestibility of B1' (dmls)CF Content of crude fat for each feed (g kg−1 DM)CPEPUP Number of peptides degraded by bacteria that used more peptides that escaped the rumen (g d−1)CPI Crude protein intake (g)DA' Degradability of A' (g d−1)DB2' Potentially digestible NDF fraction available to rumen microbes (g d−1 DMI)DB1 Degradability of B1 (g d−1)DB1' Degradability of B1' (g d−1)DB2 Degradability of B2 (g d−1)DisappTime Time required for the ruminal disappearance of bacteria and peptides (h)DMI Dry matter intake (g d−1)DRPEPh Rate of release of peptides in the rumen (g h−1)EBACTratio Proportion of bacteria produced from the i-th feed in relation to total bacteria produced (dmls)EFCBACT Amount of FC bacteria when energy is limiting (g d−1)ENFCBACT Amount of NFC bacteria when energy is limiting (g d−1)Fat Amount of fat for each feed (g d−1)FC Amount of fibrous carbohydrates for each feed (g d−1)FCBACT Biomass of microbial cells produced from ruminal availability of fibrous carbohydrates supplied by the feed (g d−1)FCBACTratio Proportion of bacteria that use fibrous carbohydrates in relation to total bacteria (dmls)FCBACTred Reduction in the amount of bacteria that use fibrous carbohydrates due to nitrogen deficiency in the rumen (g d−1)FCM 4% fat-corrected milk (g kg−1)FCNH3eq
Amount of NH3 required by FC bacteria (g d−1)Continues...

74 Glória et al.
R. Bras. Zootec., 45(2):71-84, 2016
Table 1 (Continued)
Symbol Definition (dimension)
FCNH3avail Amount of NH3 available for FC bacteria usage
FCRed Amount of fraction B2' not degraded by bacteria that use fibrous carbohydrates (g d−1)FCRedratio Ratio between the total FCRed and the total RAB2' (dmls)Fiber Amount of fiber for each feed (g d−1)FLAsh Fecal losses of ash derived from the feed (g d−1)FLAshM Fecal losses of ash of microbial origin (g d−1)FLB1' Fecal losses of B1' (g d−1)FLB2 Fecal losses of B2 (g d−1)FLB2' Fecal losses of B2' (g d−1)FLBACT Fecal losses of microbial mass (g d−1) FLC Fecal losses of C (g d−1) FLC' Fecal losses of C' (g d−1)FLEAsh Endogenous fecal losses of ash (g d−1)FLEFat Endogenous losses of fat over feed intake (g d−1)FLEP Endogenous fecal losses of protein over feed intake (g d−1).FLMC Fecal losses relative to total microbial carbohydrate (g d−1)FLMCW Fecal losses of microbial cell wall (g d−1)FLMFat Microbial fecal losses of fat (g d−1)FLPA Fecal losses of feed protein (g d−1)FLTAsh Fecal losses of ash from the diet (g d−1)FLTCF Fecal losses of carbohydrate from the feed (g d−1)FLTCT Fecal losses of carbohydrate from the diet (g d−1)FLTFat Fecal losses of fat from the diet (g d−1)FLTMP Total fecal losses of microbial protein (g d−1) FLTPRO Fecal losses of protein from the diet (g d−1)FNDF NDF intake (kg d−1)Growth Time Time required for bacteria growth assuming liquid turnover time (h)i Subscript denoting diet ingredientI Subscript applied to variables denoting the order of time dependency that varies from 1 to N or Na (dmls)IDB1 Intestinal digestibility of fraction B1 that escapes rumen degradation (g d−1)IDB2 Intestinal digestibility of fraction B2 that escapes rumen degradation (g d−1)IDCF Intestinal digestibility of carbohydrates of feed origin (g d−1)IDF Intestinal digestibility of fat (g d−1)IDFF Intestinal digestibility of fat of dietary origin (g d−1)IDMC Intestinal digestibility of microbial carbohydrates (g d−1)IDMF Intestinal digestibility of microbial fat (g d−1)IDMNA Intestinal digestibility of microbial nucleic acids (g d−1)IDP Intestinal digestibility of protein (g d−1)IDPF Intestinal digestibility of total protein feed source (g d−1)IDTC Intestinal digestibility of total carbohydrates (g d−1)IDTMP Intestinal digestibility of microbial true protein (g d−1)IMP Percentage growth improvement due to the availability of peptides in relation to fractions A' and B1' (%)k'd1 Rate of digestion of fraction A' (h−1)kd2 Rate of digestion of fraction B2 (h−1)k'd2 Rate of digestion of fraction B1' (h−1)k'd3 Rate of digestion of fraction B2' (h−1)ke Ruminal escape rate of fibrous particles to the remainder of the gastrointestinal tract (h−1)kl−d Efficiency of use of MEl−d (dmls)km Efficiency of ME utilization for maintenance (dmls)km1 Ratio of maintenance of bacteria that use the fibrous carbohydrates (dmls)km2 Ratio of maintenance of bacteria that use the non-fibrous carbohydrates (dmls)
Continues...
75Simulation of diets for dairy goats and growing doelings using nonlinear optimization procedures
R. Bras. Zootec., 45(2):71-84, 2016
Symbol Definition (dimension)
kpl Passage rate of liquids (h−1)kr Rate of passage of long fibrous particles newly ingested through portions of the ventral rumen (h−1)kup Rate of utilization of peptides by bacteria that ferment non-fibrous carbohydrates (g peptide g−1 cells per h)kupi Utilization rate of peptide-corrected supply of ionophores in the diet (g peptide g−1 cells per h)MEg ME for whole body gain (MJ d−1)MEl−d Dietary ME used for lactation (MJ d−1)MEm ME requirement for maintenance (MJ d−1)MFCP Metabolic fecal crude protein (g d−1)Milkyield Milk production (kg d−1)MM Content of ash for each feed (g d−1)MP Amount of metabolizable protein from the diet (g d−1)MPg MP for whole body gain (g d−1)MPl−d Dietary MP used in milk production (g d−1)MPm Metabolizable protein for maintenance (g d−1)MPrequired Total metabolizable protein required (g d−1)MRT Retention time of fiber in the rumen (h−1)N Positive integer order of time dependency for transferring a particle from the raft to the escapable pool (dmls)NBACTFC Amount of nitrogen contained in the biomass produced in the rumen from the fibrous carbohydrates supplied by the feed (g d−1)NBACTNF Amount of nitrogen contained in the biomass produced in the rumen from the non-fibrous carbohydrates supplied by the feed (g d−1)Nexc N in excess of rumen bacterial N and tissue needs (g d−1)NFC Amount of non-fibrous carbohydrates for each feed (g d−1)NFCBACT Cell biomass produced from ruminal availability of non-fibrous carbohydrates supplied by the feed (g d−1)NFCBACTaj Biomass of bacteria that use non-fibrous carbohydrates adjusted for the ruminal escape of non-fibrous carbohydrates (g d−1)NFCBACTmass Biomass of bacteria that use non-fibrous carbohydrates (g d−1)NFCBACTNH3req
Amount of NH3 required by NFC bacteria (g d−1) NFCBACTpepup Peptide uptake by bacteria that use non-fibrous carbohydrates (g d−1)NH3bact
Amount of NH3 from peptide uptake not used by bacteria and produced as NH3 (g d−1)NH3diet
Amount of NH3 from the diet (g d−1)NH3recicled
Amount of NH3 recycled (g d−1)NH3req
Amount of NH3 required (g d−1)NPEPUP Nitrogen contained in peptides assimilated by microorganisms that use the non-fibrous carbohydrates (g d−1)NPEPUPaj Nitrogen contained in the peptides retained by microorganisms that use the non-fibrous carbohydrates adjusted for escape ruminal peptide (g d−1)NperBACT Microbial growth allowed by nitrogen availability in the rumen (g d−1)PA Amount of fraction A for each feed (g d−1)PB Amount of fraction crude protein for each feed (g d−1)PB1 Amount of fraction B1 for each feed (g d−1)PB2 Amount of fraction B2 for each feed (g d−1)PC Amount of fraction C for each feed (g d−1)pef Factor physical effectiveness of fiber in the feed (0 ≤ Fpe ≤ 1) (dmls)PEPBAL Peptides balancePEPNEx Amount of N required as peptide (g d−1)PEPUP Amount of peptides assimilated by microorganisms (g d−1)PEPUPaj Amount of peptides assimilated by microorganisms adjusted due to the escape of peptides in the rumen (g d−1)PEPx Potential amount of peptide uptake (g d−1)PFC' Fecal losses of C' (g d−1)PRD Total rumen degradable true protein (g d−1)RAA Ruminal availability of fraction A from the feed (g d−1)RAA' Ruminal availability of fraction A' from the feed (g d−1)RAB1 Ruminal availability of fraction B1 from the feed (g d−1)RAB1' Ruminal availability of fraction B1' from the feed (g d−1)
Continues...
Table 1 (Continued)

76 Glória et al.
R. Bras. Zootec., 45(2):71-84, 2016
Symbol Definition (dimension)
RAB1aj Ruminal availability of fraction B1 adjusted due to escaping ruminal peptide (g d−1)RAB2 Ruminal availability of fraction B2 from the feed (g d−1)RAB2' Ruminal availability of fraction B2' from the feed (g d−1)RAB2aj Ruminal availability of fraction B2 adjusted due to escaping ruminal peptide (g d−1)RAB2'aj Ruminal availability of fraction B2' adjusted due to a deficiency of rumen nitrogen (g d−1)RANB Rumen ammonia nitrogen balance (g d−1)RAPEP Ruminal availability of peptides supplied by the feed (g d−1)RATIO Availability of peptides in relation to carbohydrate fractions A' and B1' (dmls)REA' Ruminally escaped carbohydrate A' (g d−1)REAM' Ruminally escaped microbial A' (g d−1)REAsh Ruminally escaped ash (g d−1)REAshM Ruminal escape of ash associated with the microbial biomass (g d−1)REB1 Ruminally escaped B1 (g d−1)REB1' Ruminally escaped B1' (g d−1)REB1aj Adjusted ruminally escaped B1 (g d−1)REB1M' Ruminally escaped microbial B1' (g d−1)REB2 Ruminally escaped B2 (g d−1)REB2' Ruminally escaped B2' (g d−1)REB2aj Adjusted ruminally escaped B2 (g d−1)REB2'aj Adjusted ruminally escaped B2' (g d−1)REC Ruminally escaped C (g d−1)REC' Ruminally escaped C' (g d−1)RECF Ruminally escaped fat (g d−1)REMCP Ruminally escaped microbial crude protein (g d−1)REMTC Ruminally escaped microbial carbohydrate (g d−1)REMF Ruminally escaped rumen microbial fat (g d−1)REMNA Ruminally escaped microbial nucleic acids (g d−1)REPEP Ruminally escaped peptides (g d−1)REPMCW Ruminally escaped protein linked to microbial cell wall (g d−1)RFMmax Retention capacity of fiber in the rumen (g kg−1W)RMF Rumen mass of fiber (g kg−1W)RNPEPUP Retention of nitrogen by microorganisms that use the non-fibrous carbohydrates (g d−1)TC Amount of total carbohydrates for each feed (g d−1)TDNa Total apparently digestible nutrients (g d−1)TPD True protein digestibility (g d−1)VFA Amount of volatile fatty acids produced from the feed (g d−1)X Content of crude protein from the diet (%)x Quantity of the i-th ingredient of the total diet optimized (g d−1)Y Recycling endogenous ammonia (g d−1)Y1 Growth efficiency of microorganisms that use carbohydrates (fraction B2') supplied by the feed (g cells g−1 fibrous carbohydrate digested)Y2 Growth efficiency of microorganisms that use non-fiber carbohydrates (fraction A') provided by food (g cells g−1 fibrous carbohydrate digested)Y2' Efficiency of microbial growth corrected for IMP (g cells g−1 NFC digested) Y3 Growth efficiency of microorganisms that use non-fiber carbohydrates (fraction B1') provided by food (g cells g−1 fibrous carbohydrate digested)Y3' Efficiency of microbial growth corrected for IMP (g cells g−1 NFC digested)YG1 Theoretical maximum yield of fiber carbohydrate bacteria, 0.4; g of bacteria per g of carbohydrate digested per h (g cells g−1 NFC digested)YG2 Theoretical maximum yield of non-fibrous carbohydrates bacteria, 0.4; g of bacteria per g of carbohydrate digested per h (g cells g−1
NFC digested)
Table 1 (Continued)
1 All symbols and acronyms were based on definitions: Russel et al. (1992), Fox et al. (2004), NCR (2007), Vieira et al. (2008ab).dmls - dimensionless.

77Simulation of diets for dairy goats and growing doelings using nonlinear optimization procedures
R. Bras. Zootec., 45(2):71-84, 2016
Table 2 - Equations and variables used in the simulation to estimate the nutritive value of feeds. Acronyms are listed in Table 1.
No. Equation No. Equation
1 PAi = xi × 0.001 × Ai 37 REA' i = CA'i × RAA'i2 PB1i = xi × 0.001 × B1i 38 REB1'i = CB1'i × RAB1'i3 PB2i = xi × 0.001 × B2i 39 REB2'i = CB2'i × RAB2'i4 PCi = xi × 0.001 × Ci 40 REB2'aji = FCRed + REB2'
5 PBi = PAi + PB1i + PB2i + PCi 41 REC'i = CC'i6 CA'i = xi × 0.001 × A'i 42 YG1 = 0.4
7 CB1'i = xi × 0.001 × B1'i 43
8 CB2'i = xi × 0.001 × B2'i 44
9 CC'i = xi × 0.001 × C'i 45 IMPi = exp0.404ln(100 × RATIOi) + 1.942, ∀IMP ⊂ [0,18]
10 TCi = CA'i + CB1'i + CB2'i + CC'i 46 FCBACTi = Y1i × RAB2'i11 NFCi = CA'i + CB1'i 47 Y2'i = Y2i × (1 + IMPi × 0.01)
12 FCi = CB2'i + CC'i 48 Y3'i = Y3i × (1 + IMPi × 0.01)
13 TCi = NFC + FC 49 NFCBACTi = Y2'i × RAA'i + Y3'i × RAB1'i14 Fati = xi × 0.001 × CFi 50 BACTi = FCBACTi + NFCBACTi
15 Ashi = xi × 0.001 × MMi 51 NBACTFCi = 0.1 × FCBACTi
16 Fiberi = xi × 0.001 × Fi 52 NBACTNFi = 0.1 × NFCBACTi
17 Apefi = pef × Fiberi 53
18 RAAi = PAi 54 kup = 0.07
19 RAB1i = PB1i.DB1i 55PEPUPaj = DRPEPh × 24, if NFCBACTpepup × DisappTime > DRPEPh
20 RAB1aji = Maximum(0;RAB1 − REPEP × RAB1/RAPEP) 56 PEPUPaj = NFCBACTpepup × DisappTime × 24, otherwiseNFCBACTpepup × DisappTime ≤ DRPEPh
21 RAB2i = PB2i × DB2i 57
22 58 CPEPUP = PEPUPaji + REPEP
23 RAB2aji = Maximum(0;RAB2 − REPEP × RAB2/RAPEP) 59 NPEPUPaj = PEPUPaj ⁄ 6.25
24 MRT = N/kri + 1⁄kei 60
25 RAPEPi = RAB1i + RAB2i 61
26 REB1i = PB1i− RAB1i 62 NPEPUPi = PEPUPi ⁄ 6.25
27 REB1aji = REB1 + (REPEP × RAB1/RAPEP) 63 RNPEPUPi = NPEPUP, if NBACTNFi ≥ NPEPUPi ⁄ 0.66
28 REB2i = PB2i − RAB2i 64 RNPEPUPi = 0.66 × NBACTNFi, if NBACTNFi < NPEPUPi ⁄ 0.66
29 REB2aji = REB2 + (REPEP × RAB2/RAPEP) 65 AMNBACTFCi = NBACTFCi
30 RECi = PCi 66 AMNBACTNFi = NBACTNFi − RNPEPUP
31 RAA'i = CA'i × DA'i 67
32 DA'i = kd1'i ⁄ kd1'i + kpl 68 Y = 12.7 − 12.01x + 0.325x2
33 RAB1'i = CB1'i × DB1'i 69
34 70
35 RAB2'i = CB2'i × DB2i' 71 REB1aji = PB1i − RAB1aji
36 72 REB2aji = PB2i − RAB2aji
Continues...

78 Glória et al.
R. Bras. Zootec., 45(2):71-84, 2016
Table 2 (Continued)
No. Equation No. Equation
73 NperBACTi = (NPEPUP + NH3recicled + NH3diet)/0.1 110 IDMNAi = REMNAi
74 111 IDPi = IDPFi + IDTMPi + IDMNAi
75 NperBACTi = NperBACT × EBACTratioi 112 VFAi = RAA'i + RAB1'i + RAB2'aji
76 BACTredi = (FCBACTi + BACTCNFi ) − NperBACTi 113 IDCFi = REA'i + Cdi × REB1'i + 0.2 + REB2'aji
77 114 IDMCi = 0.95 × REMTCi
78 FCBACTredi = BACTredi × FCBACTratioi 115 IDTCi = VFAi + IDCFi + IDMCi
79 NFCBACTaj = NFCBACT − BACTred × (1 − FCBACTratio) 116 RECFi = Fati
80 FCred = FCBACTredi ⁄ Y1i 117 IDFFi = RECFi
81 FCRedRatio = 100 × ∑ FCRed / ∑ RAB2'i 118 IDMFi = 0.95 × REMFi
82 RAB2'aji = RAB2'i − FCRedi 119 IDFi = IDFFi + IDMFi
83 REB2'aji = REB2'i − FCRedi 120 FLB2i = (1 − 0.8) × REB2aji
84 PEPx = NFCBACTpepup × DisappTime 121 FLCi = RECi
85 PEPNEx = 0.66 × ∑ NFCBACT × 0.1 122 FLPAi = FLB2i + FLCi
86 PEPBAL = NPEPUP − PEPNEx 123 FLB1'i = (1 − cdi ) × REB1'i87 NFBACT(NH3req) = 0.34 × ∑ NFCBACT × 0.625 ⁄ 6.25 124 FLB2'i = (1 − 0.2) × REB2'aji
88 NH3bact = Maximum(0, BALPEP) 125 FLC' = REC'
89 NH3diet = RAAi ⁄ 6.25 126 FLTCFi = FLB1'i + FLB2'i + FLC'i90 127 FLAshi = Ashi
91 128 FLMCWi = REPMCWi
92FCNH3eq
avail = Maximum(0, (NH3bact + NH3diet
+ NH3recicled) −NFCBACTNH3req)
129 FLTMPi = FLMCWi
93 FC(NH3eq) = FCBACT × 0.625 ⁄ 6.25 130 FLAshMi = REAshMi
94 BactNBal = (NPEPUP + NH3diet + NH3recicled) − (PEPNEx +NFCBACTNH3req + FCNH3
eq) 131 FLBACTi = FLTMPi + FLMCi + FLMFati + FLAshMi
95 BactNBal = (NPEPUP + NH3diet + NH3recicled) − (PEPNEx +NFCBACTNH3eq + FCNH3eq )
132 FLMFati = (1 − 0.95) × REMFi
96 EFCBACT = FCBACT 133 FLEPi = 0.0387 × CPi
97 ENFCBACT = NFCBACT 134 FLEFati = 0.017 × Fati
98 REMCPi = 0.6 × 0.625 × Minimum(BACTi, NperBACTi) 135 FLEAshi = FLEFati = 0.0119 × Ashi
99 REPMCWi = 0.25 × 0.625 × Minimum(BACTi, NperBACTi) 136 FLTPROi = FLPAi + FLTMPi+ FLEPi
100 REMNAi = 0.15 × 0.625 × Minimum(BACTi, NperBACTi) 137 FLTCi = FLTCFi + FLMCi
101 REAM' = 0.211 × 0.8 × Minimum(NperBACT; EFCBACT +ENFCBACT) 138 FLTFati = FLMCi + FLEFati
102 REB1M' = 0.211 × 0.2 × Minimum(NperBACT; EFCBACT + ENFCBACT) 139 FLTAshi = FLAshi + FLAshMi + FLEAshi
103 REMTCi = 0.21 × Minimum(BACTi, NperBACTi) 140 AIMi = FLTPROi + FLTCTi + FLTAshi + FLTFati
104 REMFi = 0.12 × Minimum(BACTi, NperBACTi) 141 TDNai = (CPi − FLTPROi ) + (TCi − FLTCTi ) + 2.25 × (Fati − FLTFati )
105 REAshi = 0.044 × Minimum(BACTi, NperBACTi) 142
106 IDB1i = REB1aji 143 Urea formation = [(RANB − NH3recicled + Nexc) × 0.0073] × 4.184
107 IDB2i = 0.8 × REB2aji 144
108 IDPFi = IDB1i + IDB2i 145
109 IDTMPi = REMCPi 146 Continues...
79Simulation of diets for dairy goats and growing doelings using nonlinear optimization procedures
R. Bras. Zootec., 45(2):71-84, 2016
Table 2 (Continued)
No. Equation No. Equation
147 156 RATIOi = RAPEPi ⁄ RAPEPi + RAA'i + RAB1'i
148 157 FLMCWi = (1 − 0.95) × REMTCi
149 MPi = IDPi − IDMNAi 158 kupi = kup × 0.66
150 159 NFCBACTmass = NFCBACTi × MRTi ⁄ 24
151 Y1i = kd3'i × YG1 ⁄ km1 × YG1 × kd3'i 160
152 Y2i = kd1'i × YG2 ⁄ km2 × YG2 × kd1'i 161
153 Y3i = kd2'i × YG2 ⁄ km2 × YG2 × kd2'i 162 Growth time = 1 ⁄ 1 − kpl
154 km1 = 0.05 163 DisappTime = 1 ⁄ (3600 × {(log[(Growth time − 1) ⁄ (3600 × DRPEPh)] ⁄ (BACTNFpepup ⁄ 3600) + 1 / log[1 + (Growth time − 1)/3600] )}
155 km2 = 0.15
Table 3 - Equations used in simulations to compute nutritional requirements1
No. Equation
164 RFMmax = 8.5 × BW165 MPg = 0.290 × ADG, for growing animals166 MFCP = 0.0267 × DMI167 TPD = 0.88 × CPI168 km = 0.35 × [AME ⁄ ∑ (x) × 0.001 ⁄ 18.8]169 MEm = (315 + 31.5 × BW0.75)/ km, for mature animals170 MPl−d = 1.45 × MP × MPm × 1000, for mature animals171 MEl−d = (1.4694 + 0.4025 × FCM) × Milkyield × kl−d, for mature animals172 kl−d = 0.624173 MEm = 580 × BW0.75, for growing animals 174 MEg = 23.1 × ADG, for growing animals175 EUCP = 1.031 × BW0.75
176 MPm = MFCP + EUCP + 0.2 × BW0.6, for mature animals177 MEg = 28.5 × ADG, for mature animals1 All symbols and acronyms are based on definitions of AFRC (1993).
obviously, the minimum cost optimization (objective function Z, Eq. 1) was the most efficient objective functionto minimize diet costs (Figure 2c). For all simulations, the increase in the production performance (milk yield or daily gain) increased diet costs (Figures 2 and 3). The RANB constraints (RANB ≥ 0 and RANB ≥ −200) did not influence the cost of the diets (Figures 3a, 3b, 3c and 3d). The space of feasible solutions was insensitive to the RANB constraint, and although the dietary cost increased with more challenging performance levels, the same solution space can be observed by comparing Figure 3a with 3b for milk yield, and Figure 3c with 3d for average daily gain.
Discussion
Linear optimization systems require an estimate of the dry matter intake as an input to solve the problem of least-cost diets (Tedeschi et al., 2000). However, the nonlinear nature of diet formulation is characterized by the interdependence between animal requirements and the food consumed (Jardim et al., 2013; 2015).Therefore, the solution or the optimized diet and its expected dry matter intake influences the values of the components of theconstraints. In the model proposed in this study, intake is an output of the nonlinear optimization procedure.
The metabolizable protein and metabolizable energy intakes increase as animal production increases, because of higher demands for nutrients generated by growth, milk yield, and pregnancy (NRC, 2007). However, dry matter intake has a physical limit, imposed by the dietary fibercontent, and the maximal capacity of fiber retention in therumen (Mertens, 1994; Vieira et al., 2008b). The rumen size limits animal capacity due to fill, and because fibergenerally passes from the reticulorumen more slowly, it has a great filling effect because of the distension itcauses in rumen walls (Allen, 1996). The simulations with higher fiber content in the diet limits the space of feasiblesolutions (Figures 1e and 1f). According to Mertens (1987), higher milk productions constrain the fiber content in dairycow diets, and this was observed here for dairy does diets (Gonçalves et al., 2001).
Speculations are made about the advantage of maximizing the dry matter intake of farm animals. Mertens (1987) developed simple mathematical models that can be used to predict maximum intake. However, simulations in

80 Glória et al.
R. Bras. Zootec., 45(2):71-84, 2016
Figure 1 - Metabolizable energy intake (MEI, MJ/d) in relation to milk yield (MY, kg/d) (1a); metabolizable protein intake (MPI, g/d) in relation to MY( kg/d) (1b); MEI (MJ/d) in relation to average daily gain (ADG, g/d) (1c); MPI (g/d) in relation to ADG (g/d) (1d); dry matter intake (DMI, g/kg0.75 per day) in relation to diet fiber content (NDF) for dairy goat (g/kg) (1e); DMI (g/kg0.75 per day) in relation to NDF for growing goat (g/kg) (1f).
81Simulation of diets for dairy goats and growing doelings using nonlinear optimization procedures
R. Bras. Zootec., 45(2):71-84, 2016
Figure 2 - Diet costs (R$) in relation to average daily gain (kg/d), using maximum intake as the objective function (2a); using maximum efficiency of utilization of crude protein as the objective function (2b); and using minimum cost as the objective function (2c).
which maximum dry matter intake was set as the objective function (Eq. 2) resulted in more expensive diets (Figure 2). The feedstuffs used as protein sources are, generally, more expensive than energy sources and, for this reason, simulations used to maximize protein utilization efficiencywere made (Eq. 3). Nevertheless, the cost of protein-optimized diets using Eq. 3 as the objective function resulted in intermediary dietary costs (Figure 3). Least-cost diet formulation (Eq. 1) was the most effective procedure to reduce the cost of the diet under the same dietary constraints (Figure 3).
The rumen microorganisms can synthesize protein from non-protein nitrogen and ammonia is the main source of nitrogen for microbial protein synthesis (Russel et al., 1992). The amount of ruminal ammonia nitrogen can be estimated by the sum of endogenous nitrogen recycling with nitrogen
originated from degradation of dietary protein and dietary non-protein nitrogen, and by discounting nitrogen retained by bacteria (Russel et al., 1992; Vieira et al., 2000a,c). The RANB indicates if rumen ammonia nitrogen is adequate to meet bacterial requirements. A positive RANB is essential to maximize ruminal degradation of the feed (Leng, 1990), and so, nitrogen deficiency decreases carbohydratefermentation and the growth rate of fiber fermentingbacteria like F. succinogenes that become unable to ferment cellobiose if RANB < 0 (Maglione and Russel, 1997). The scenario in which RANB < 0 occurs in tropical pastures, specifically in the dry season, when the foragenutritive value and availability are reduced remarkably (Vieira et al. 2000b,c). The constraint expands the space for feasible solutions compared with RANB ≥ −200, which could result in cheaper diets, but the cost of the diets did

82 Glória et al.
R. Bras. Zootec., 45(2):71-84, 2016
not differ between these two constraints (Figure 3). The CNCPS fractionation scheme is a useful tool to estimate the nutritive availability of protein and carbohydrate fractions in feeds and has been used to estimate the ruminal availability of protein and carbohydrates of tropical feeds (Cabral et al., 2000).
Dairy goat farming is an important activity that can generate income and wealth for farmers. This activity can produce enough wealth to the succession of the family business, which is an important tool for generating jobs and income (Vieira et al., 2009), mainly in the state of Rio de Janeiro, because of its unique goat milk production systems that favor the development of special products for specific
markets (Santos Junior et al., 2008). Therefore, the control of production costs is mandatory. In that sense, nutrition models would assist in the optimization of small ruminant production scenarios (Tedeschi et al., 2010). Among all variables regarding nutrition of ruminants, passage rate estimates affect the utilization of fiber by small ruminantstoo; therefore, models based on the retention of fiber inthe rumen are needed to properly formulate goat diets (Tedeschi et al., 2012; Regadas Filho et al., 2014a,b; Jardim et al., 2013; 2015). In this regard, the simulation of different scenarios could help in the decision-making process and to improve the understanding of the dynamics of goat nutrition and feeding.
Figure 3 - Diet costs (R$) in relation to milk yield (kg/d) using RANB ≥ 0 (3a); in relation to milk yield (kg/d) using RANB ≥ –200 (3b); in relation to average daily gain (kg/d) using RANB ≥ 0 (3c); and in relation to average daily gain (kg/d) using RANB ≥ –200 (3d).
83Simulation of diets for dairy goats and growing doelings using nonlinear optimization procedures
R. Bras. Zootec., 45(2):71-84, 2016
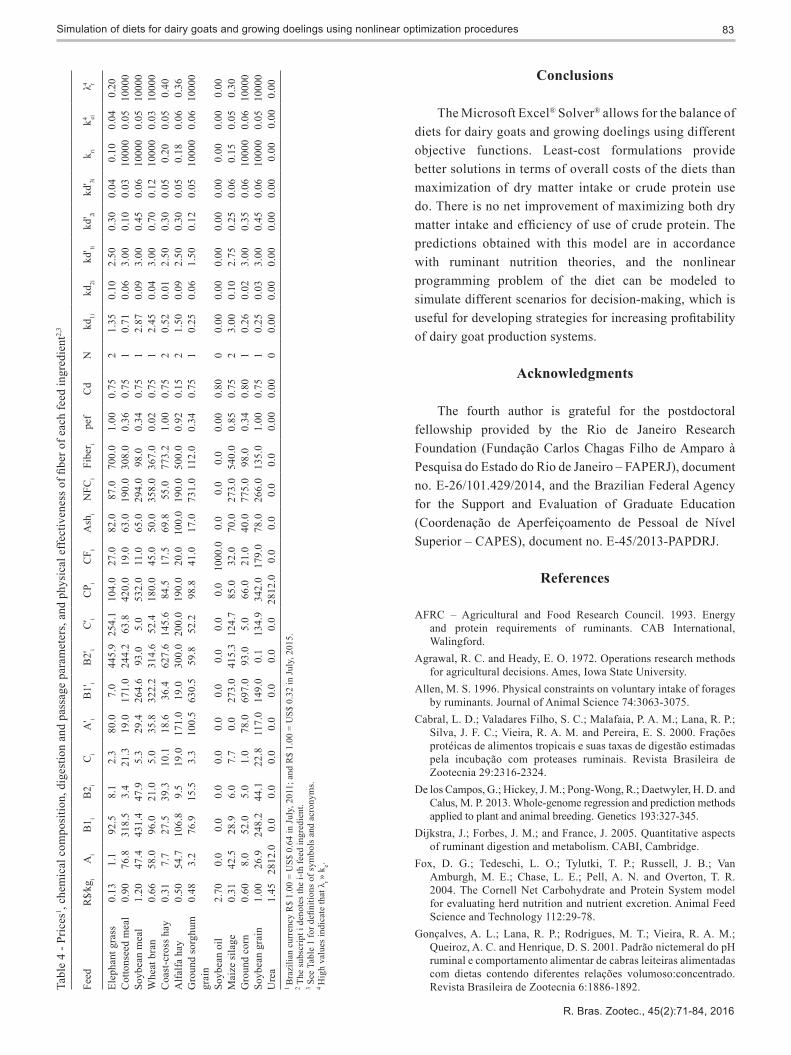
Tabl
e 4
- Pric
es1 ,
chem
ical
com
posi
tion,
dig
estio
n an
d pa
ssag
e pa
ram
eter
s, a
nd p
hysi
cal e
ffec
tiven
ess
of fi
bero
feac
hfe
edin
gred
ient
2,3
Feed
R$⁄
kgi
Ai
B1 i
B2 i
Ci
A' i
B1'
iB
2'i
C' i
CP i
CF i
Ash
iN
FCi
Fibe
r ipe
fC
dN
kd1i
kd2i
kd' 1i
kd' 2i
kd' 3i
k rik4 ei
λ4 r
Elep
hant
gra
ss
0.13
1.
1 92
.5
8.1
2.3
80.0
7.
0 44
5.9
254.
1 10
4.0
27.0
82
.0
87.
0
700.
0
1.0
0
0.7
5 2
1.35
0.
10
2.50
0.30
0
.04
0
.10
0.04
0.
20C
otto
nsee
d m
eal
0.90
76
.8
318.
5 3.
4 21
.3
19.0
17
1.0
244.
2 63
.8
420.
0 19
.0
63.0
1
90.0
30
8.0
0
.36
0.75
1
0.71
0.
06
3.00
0.10
0
.03
1000
0 0.
05
1000
0So
ybea
n m
eal
1.20
47
.4
431.
4 47
.9
5.3
29.4
26
4.6
93.0
5.
0 53
2.0
11.0
65
.0
294
.0
98.
0
0.3
4 0.
75
1 2.
87
0.09
3.
00
0.
45
0.0
6 10
000
0.05
10
000
Whe
at b
ran
0.66
58
.0
96.0
21
.0
5.0
35.8
32
2.2
314.
6 52
.4
180.
0 45
.0
50.0
3
58.0
36
7.0
0
.02
0.75
1
2.45
0.
04
3.00
0.70
0
.12
1000
0 0.
03
1000
0C
oast
-cro
ss h
ay
0.31
7.
7 27
.5
39.3
10
.1
18.6
36
.4
627.
6 14
5.6
84.5
17
.5
69.8
5
5.0
77
3.2
1
.00
0.75
2
0.52
0.
01
2.50
0.30
0
.05
0.20
0.
05
0.40
Alfa
lfa h
ay
0.50
54
.7
106.
8 9.
5 19
.0
171.
0 19
.0
300.
0 20
0.0
190.
0 20
.0
100.
0 1
90.0
50
0.0
0
.92
0.15
2
1.50
0.
09
2.50
0.30
0
.05
0.18
0.
06
0.36
Gro
und
sorg
hum
0.
48
3.2
76.9
15
.5
3.3
100.
5 63
0.5
59.8
52
.2
98.8
41
.0
17.0
7
31.0
11
2.0
0
.34
0.75
1
0.25
0.
06
1.50
0.12
0
.05
1000
0 0.
06
1000
0gr
ain
Soyb
ean
oil
2.70
0.
0 0.
0 0.
0 0.
0 0.
0 0.
0 0.
0 0.
0 0.
0 10
00.0
0.
0
0
.0
0.
0
0.
00
0.80
0
0.00
0.
00
0.00
0.00
0
.00
0
.00
0.
00
0.00
Mai
ze s
ilage
0.
31
42.5
28
.9
6.0
7.7
0.0
273.
0 41
5.3
124.
7 85
.0
32.0
70
.0
273
.0
540.
0
0.8
5 0.
75
2 3.
00
0.10
2.
75
0.
25
0.0
6 0.
15
0.05
0.
30G
roun
d co
rn
0.60
8.
0 52
.0
5.0
1.0
78.0
69
7.0
93.0
5.
0 66
.0
21.0
40
.0
775
.0
98.
0
0.3
4 0.
80
1 0.
26
0.02
3.
00
0.
35
0.0
6 10
000
0.06
10
000
Soyb
ean
grai
n 1.
00
26.9
24
8.2
44.1
22
.8
117.
0 14
9.0
0.1
134.
9 34
2.0
179.
0 78
.0
266
.0
135.
0
1.0
0 0.
75
1 0.
25
0.03
3.
00
0.
45
0.0
6 10
000
0.05
10
000
Ure
a 1.
45
2812
.0
0.0
0.0
0.0
0.0
0.0
0.0
0.0
2812
.0
0.0
0.0
0.0
0
.0
0
.00
0
.00
0
0.
00
0.0
0 0.
00
0.
00
0.0
0 0
.00
0
.00
0.
001
Bra
zilia
n cu
rren
cy R
$ 1.
00 =
US$
0.6
4 in
Jul
y, 2
011;
and
R$
1.00
= U
S$ 0
.32
in J
uly,
201
5.2 T
he s
ubsc
ript i
den
otes
the
i-th
feed
ingr
edie
nt.
3 See
Tab
le 1
for d
efini
tions
ofsy
mbo
lsan
dac
rony
ms.
4 H
igh
valu
es in
dica
te th
at λ
r » k
e.
Conclusions
The Microsoft Excel® Solver® allows for the balance of diets for dairy goats and growing doelings using different objective functions. Least-cost formulations provide better solutions in terms of overall costs of the diets than maximization of dry matter intake or crude protein use do. There is no net improvement of maximizing both dry matter intake and efficiency of use of crude protein. Thepredictions obtained with this model are in accordance with ruminant nutrition theories, and the nonlinear programming problem of the diet can be modeled to simulate different scenarios for decision-making, which is useful for developing strategies for increasing profitabilityof dairy goat production systems.
Acknowledgments
The fourth author is grateful for the postdoctoral fellowship provided by the Rio de Janeiro Research Foundation (Fundação Carlos Chagas Filho de Amparo à Pesquisa do Estado do Rio de Janeiro – FAPERJ), document no. E-26/101.429/2014, and the Brazilian Federal Agency for the Support and Evaluation of Graduate Education (Coordenação de Aperfeiçoamento de Pessoal de Nível Superior – CAPES), document no. E-45/2013-PAPDRJ.
References
AFRC – Agricultural and Food Research Council. 1993. Energy and protein requirements of ruminants. CAB International, Walingford.
Agrawal, R. C. and Heady, E. O. 1972. Operations research methods for agricultural decisions. Ames, Iowa State University.
Allen, M. S. 1996. Physical constraints on voluntary intake of forages by ruminants. Journal of Animal Science 74:3063-3075.
Cabral, L. D.; Valadares Filho, S. C.; Malafaia, P. A. M.; Lana, R. P.; Silva, J. F. C.; Vieira, R. A. M. and Pereira, E. S. 2000. Frações protéicas de alimentos tropicais e suas taxas de digestão estimadas pela incubação com proteases ruminais. Revista Brasileira de Zootecnia 29:2316-2324.
De los Campos, G.; Hickey, J. M.; Pong-Wong, R.; Daetwyler, H. D. and Calus, M. P. 2013. Whole-genome regression and prediction methods applied to plant and animal breeding. Genetics 193:327-345.
Dijkstra, J.; Forbes, J. M.; and France, J. 2005. Quantitative aspects of ruminant digestion and metabolism. CABI, Cambridge.
Fox, D. G.; Tedeschi, L. O.; Tylutki, T. P.; Russell, J. B.; Van Amburgh, M. E.; Chase, L. E.; Pell, A. N. and Overton, T. R. 2004. The Cornell Net Carbohydrate and Protein System model for evaluating herd nutrition and nutrient excretion. Animal Feed Science and Technology 112:29-78.
Gonçalves, A. L.; Lana, R. P.; Rodrigues, M. T.; Vieira, R. A. M.; Queiroz, A. C. and Henrique, D. S. 2001. Padrão nictemeral do pH ruminal e comportamento alimentar de cabras leiteiras alimentadas com dietas contendo diferentes relações volumoso:concentrado. Revista Brasileira de Zootecnia 6:1886-1892.

84 Glória et al.
R. Bras. Zootec., 45(2):71-84, 2016
Jardim, J. G.; Vieira, R. A. M.; Fernandes, A. M.; Araujo, R. P.; Glória, L. S., Rohem Júnior, N. M.; Rocha, N. S. and Abreu, M. L. C. 2013. Application of a nonlinear optimization tool to balance diets with constant metabolizability. Livestock Science 158:106-117.
Jardim, J. G.; Vieira, R. A. M.; Fernandes, A. M.; Araujo, R. P.; Glória, L. S.; Rohem Júnior, N. M.; Rocha, N. S. and Abreu, M. L. C. 2015. Corrigendum to “Application of a nonlinear optimization tool to balance diets with constant metabolizability”. Livestock Science 173:119-120.
Lasdon, L. S.; Waren, A. D.; Jain, A. and Ratner, M. 1978. Design and testing of a generalized reduced gradient code for nonlinear programming. ACM Transactions on Mathematical Software 4:34-50.
Leng, R. A. 1990. Factors affecting the utilization of “poor-quality” forages by ruminants particularly under tropical conditions. Nutrition Research Reviews 3:277-303.
Maglione, G. and Russell, J. B. 1997. The adverse effect of nitrogen limitation and excess-cellobiose on Fibrobacter succinogenes S85. Applied Microbiology and Biotechnology 48:720-725.
Mertens, D. R. 1987. Predicting intake and digestibility using mathematical models of ruminal function. Journal Animal Science 64:1548-1558.
Mertens, D. R. 1994. Regulation of forage intake. p.450-493. In: Forage quality, evaluation and utilization. Fahey Jr., G. C., ed. The American Society of Agronomy Inc., Crop Science Society of America Inc., and Soil Science Society of America Inc., Madison.
NRC - National Research Council. 1996. Nutrient requirements of beef cattle. 7th ed. National Academy Press, Washington, DC.
NRC - National Research Council. 2001. Nutrient requirements of dairy cattle. 7th ed. National Academy Press, Washington, DC.
NRC - National Research Council. 2007. Nutrient requirements of small ruminants: sheep, goats, cervids, and New World camelids. National Academies Press, Washington, DC.
Regadas Filho, J. G. L.; Tedeschi, L. O.; Cannas, A.; Vieira, R. A. M. and Rodrigues, M. T. 2014a. Using the Small Ruminant Nutrition System to develop and evaluate an alternative approach to estimating the dry matter intake of goats when accounting for ruminal fiberstratification. Journal of Dairy Science 97:7185-7196.
Regadas Filho, J. G. L.; Tedeschi, L. O.; Vieira, R. A. M. and Rodrigues, M. T. 2014b. Assessment of the heterogeneous ruminal fiber pool and development of a mathematical approach for predicting the mean retention time of feeds in goats. Journal of Animal Science 92:1099-1109.
Russell, J. B.; O’Connor, J. D.; Fox, D. G.; Van Soest, P. J. and Sniffen, C. J. 1992. A net carbohydrate and protein system for evaluating cattle diets: I. Ruminal fermentation. Journal of Animal Science 70:3551-3561.
Santos Junior, E.; Vieira, R. A. M.; Henrique, D. S. and Fernandes, A. M. 2008. Characteristics of the dairy goat primary sector at the Rio de Janeiro State, Brazil. Revista Brasileira de Zootecnia 37:773-781.
Sniffen, C. J.; O’Connor, J. D.; Van Soest, P. J.; Fox, D. G. and Russell, J. B. 1992. A net carbohydrate and protein system for evaluating cattle diets: II. Carbohydrate and protein availability. Journal of Animal Science 70:3562-3577.
Tedeschi, L. O.; Cannas, A. and Fox, D. G. 2010. A nutrition mathematical model to account for dietary supply and requirements of energy and other nutrients for domesticated small ruminants: The development and evaluation of the Small Ruminant Nutrition System. Small Ruminant Research 89:174-184.
Tedeschi, L. O.; Cannas, A.; Solaiman, S. G.; Vieira, R. A. M. and Gurung, N. K. 2012. Development and evaluation of empirical equations to predict ruminal fractional passage rate of forages in goats. Journal of Agricultural Science 150:95-107.
Tedeschi, L. O.; Fox, D. G. and Russell, J. B. 2000. Accounting for ruminal deficiencies of nitrogen and branched-chain amino acidsin the structure of the Cornell net carbohydrate and protein system. p.224-238. In: Proceedings of Cornell Nutrition Conference for Feed Manufacturers. New York State College of Agriculture & Life Sciences, Cornell University, Rochester.
Vieira, R. A. M.; Cabral, A. J.; Souza, P. M. D.; Fernandes, A. M.; Henrique, D. S. and Real, G. S. C. P. C. 2009. Dairy goat husbandry amongst the household agriculture: herd and economic indexes from a case study in Rio de Janeiro, Brazil. Revista Brasileira de Zootecnia 38:203-213.
Vieira, R. A. M.; Pereira, J. C.; Malafaia, P. A. M.; Queiroz, A. C. and Gonçalves, A. L. 2000a. Fracionamento e cinética de degradação in vitro dos compostos nitrogenados da extrusa de bovinos a pasto. Revista Brasileira de Zootecnia 29:880-888.
Vieira, R. A. M.; Pereira, J. C.; Malafaia, P. A. M.; Queiroz, A. C. and Gonçalves, A. L. 2000b. Fracionamento dos carboidratos e cinética de degradação in vitro da fibra em detergente neutro da extrusa de bovinos a pasto. Revista Brasileira de Zootecnia 29:889-897.
Vieira, R. A. M.; Pereira, J. C.; Malafaia, P. A. M.; Queiroz, A. C.; Jordão, C. P. and Gonçalves, A. L. 2000c. Simulação da dinâmica de nutrientes no trato gastrintestinal: aplicação e validação de um modelo matemático para bovinos a pasto. Revista Brasileira de Zootecnia 29:898-909.
Vieira, R. A. M.; Tedeschi, L. O. and Cannas, A. 2008a. A generalized compartmental model to estimate the fibre mass in theruminoreticulum: 1. Estimating parameters of digestion. Journal of Theoretical Biology 255:345-356.
Vieira, R. A. M.; Tedeschi, L. O. and Cannas, A. 2008b. A generalized compartmental model to estimate the fibre mass in theruminoreticulum: 2. Integrating digestion and passage. Journal of Theoretical Biology 255:357-368.