Embed Size (px)
Citation preview
REEVALUATION OF THE SEISMIC PERFORMANCE OF UPPER SAN FERNANDO DAM USING UNDRAINED SHEAR STRENGTH
Phu Huynh, Mark Schultz and Wallace Lam
ABSTRACT
The San Fernando earthquake of February 9, 1971 in southern California initiated a
major slide on the downstream slope of Upper San Fernando Dam. Nearby Lower San Fernando Dam was damaged even more severely, and would have probably led to an uncontrolled release if the reservoir elevation had not been restricted prior to the earthquake. Both dams have since been removed from service. The performance of both dams has been studied by numerous experts and has been used to calibrate various dynamic soil models. This paper presents the results of an approach to seismic analysis based on an undrained shear strength model, combined with a rigorous study of the geotechnical data. The embankment section is uniquely divided into a large number of material zones to more accurately model the pattern of soil properties resulting from hydraulic fill placement.
Previous forensic studies of Upper San Fernando Dam were typically based on two or
three distinct zones of core or shell materials, and a dynamic soil model based on cyclic stress. This nonlinear analysis is based on a more detailed section model, with slope displacements calculated from a modified Newmark method as a function of varying yield acceleration. A FLAC nonlinear numerical model was also developed using the same detailed section model, and a strain softening/hardening soil model similar to the yield function and Newmark scheme. The two methods predict displacements that are in reasonable agreement with measured displacements and, equally important, both match the observed deformation patterns. The results of these analyses, and similar forensic studies conducted by the California Division of Safety of Dams, demonstrate that an undrained shear strength soil model can reasonably predict the seismic performance of embankment dams, even those constructed of loosely-placed hydraulic fill materials. INTRODUCTION
The California Division of Safety of Dams (DSOD) regulates approximately 1,250 dams,
of which many are located near large urban populations subject to intense ground shaking from highly active faults. Consequently, DSOD conducts seismic analyses for new dams, and seismic reevaluations of existing dams. DSOD recently initiated a comprehensive review of case histories of dams subject to strong earthquake motion in order to assess various dynamic analysis methods. This paper is a result of one such case study, one which has been evaluated by many experts using a variety of methods (References 1-3).
Previous analyses of Upper San Fernando Dam have typically used liquefaction soil
models, usually based on strength loss due to cyclic pore pressure generation assumptions. The soil model presented in this paper is a different approach, based on the undrained shear strength obtained from isotropically consolidated undrained triaxial tests with pore pressure measurement. The underlying assumption of this soil model is that pore pressures change as a direct result of shearing, rather than from cyclic loading. Thus, the essential dynamic soil
behavior of the failure plane (shear zone), including strength changes due to pore pressure, can be captured in a standard monotonic load test.
YIELD FUNCTION METHOD
The yield function method (Reference 4) used in this paper assumes the soil above the failure plane behaves as a block subject to horizontal inertial forces, as is assumed for limit equilibrium and Newmark displacement methods. The shear strength of the failure zone material degrades or increases (softens or hardens) as a function of shear strain. The shear strength vs percent strain relationship is based on the triaxial shear test results, which captures the change in pore pressure due to straining of the material. Any slope stability program, based simply on limit equilibrium principles, is used to calculate the yield acceleration for the corresponding shear strengths at various levels of strain. The yield acceleration is established for a range of strain values, typically 0.5%, 1%, 3%, 5%, and 10%, depending on material.
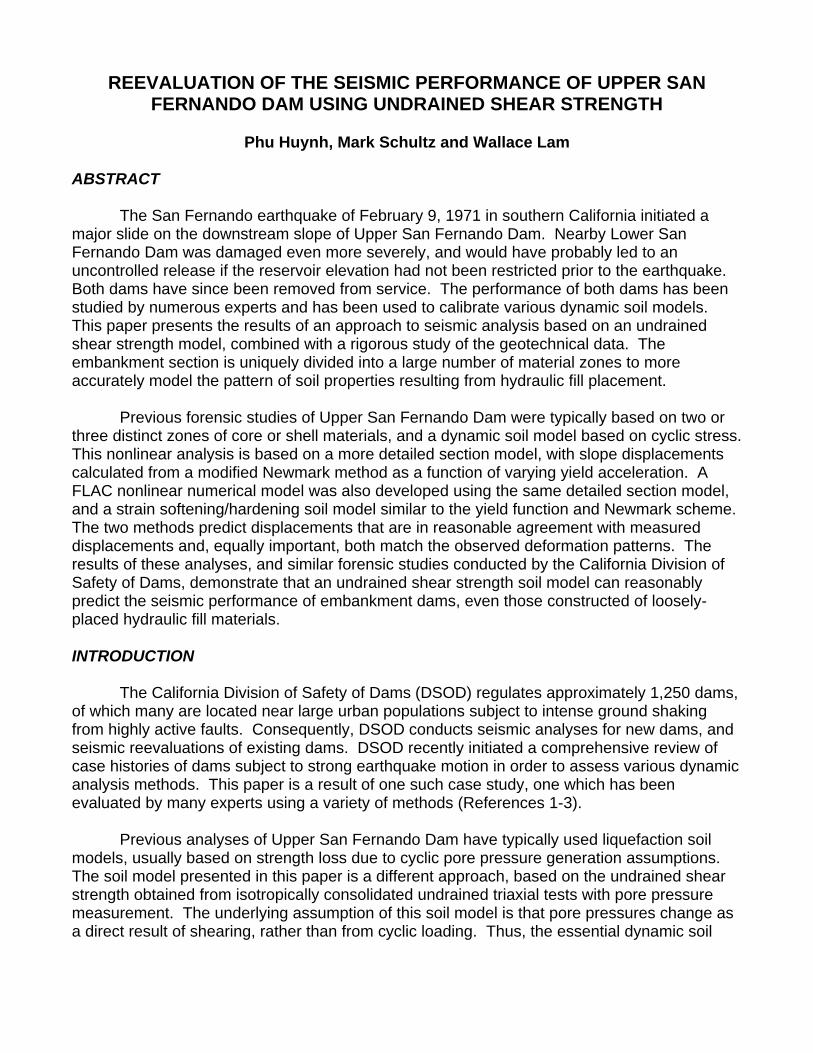
The percent strain is converted to displacement along the sliding plane based on the
shear zone thickness. Zone thickness can be estimated from cracking patterns, slip circles, or finite element analyses. For Upper San Fernando, the shear zone thickness was estimated from measurements of the longitudinal cracking zone exposed on the upstream slope. Once the percent strain is converted to displacement, the yield acceleration vs displacement relationship can be established. The resulting curve is defined as the yield function (Reference 4), shown below in Figure 1.
0
0.05
0.1
0.15
0.2
0.25
0.3
0.35
0.4
0.45
0.0001 0.001 0.01 0.1 1 10
Displacement (ft)
Ky
(g)
u/s slope
d/s slope
assumed shear zone thickness:d/s - 40'u/s - 5'
Figure 1: Yield Function Curve
The yield function can then be used in a modified Newmark analysis to calculate total
slope displacement for any acceleration time history record. The vertical and horizontal components of each slope are then combined to determine the final position of the crest. The details of the method are further described in the appendix to a companion paper in these ASDSO Proceedings entitled, “Earthquake Performance of Austrian Dam During the Loma Prieta Earthquake.”
HYDRAULIC FILL CONSTRUCTION AND MATERIAL PROPERTIES
Characterization of the material properties of a dam requires an understanding of how
the embankment was constructed. The Upper San Fernando Dam was constructed in 1920 by
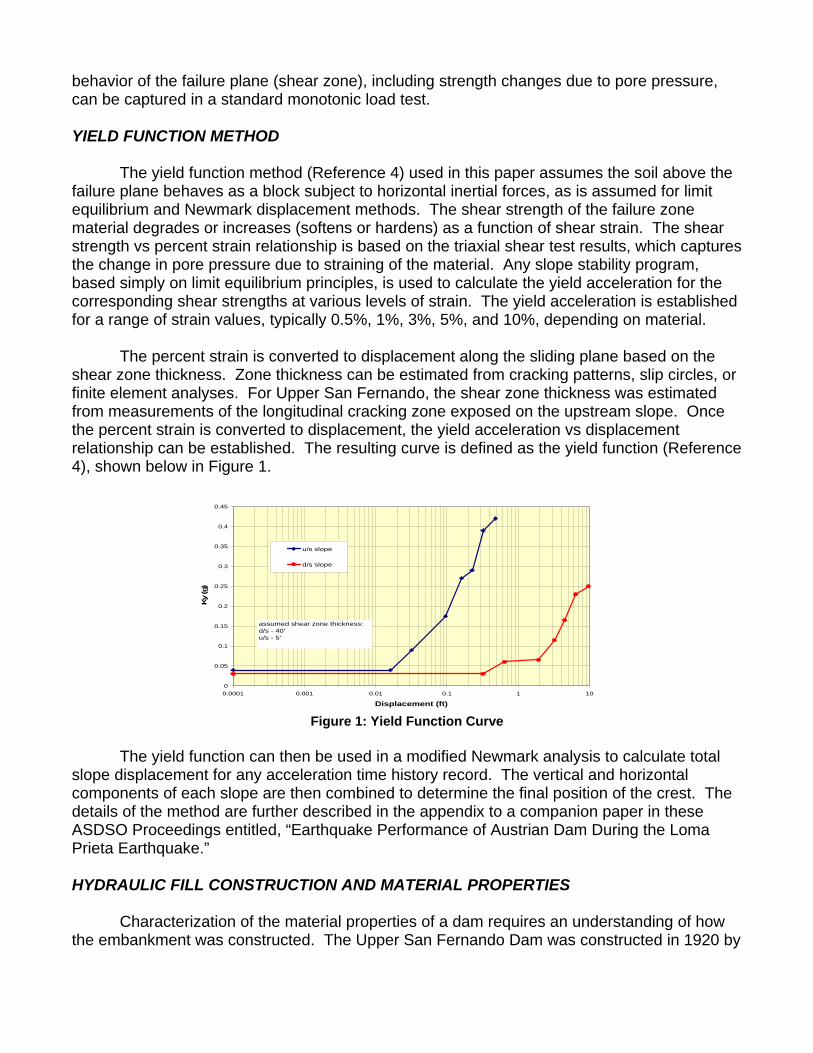
the “semi-hydraulic” method (Reference 3). The method consisted of constructing dikes at the outer limits of the embankment to provide containment of the pool. Fill material was excavated from the borrow area by steam shovels and transported to the dam, either by train or wagons, and then dumped on the inner slope of the dikes. The material was then dispersed by water cannons from barges floating in the center of the pool. The jetting action resulted in coarser-grained particles quickly settling in the outer portions of the section in a relatively dense state. Finer-grained materials migrated toward the center pool and settled out later. Consequently, the section transitions from stronger outer material, to weaker material towards the center. This gradual material gradient is typically ignored by modeling a few distinct zones of similar material. This analysis captured the material gradient by dividing the section into 11 vertical zones, based on a detailed evaluation of available geotechnical information.
Dam Axis
Figure 2: Typical Embankment Cross Section
The dam has a maximum height of 80 feet, at a crest elevation of 1,217.5 feet. The 1,300-foot long embankment impounded 1,850 acre-feet of water. It was originally planned to have a maximum height of 100 feet, but was revised to a lower height during construction. The dam was constructed of hydraulic fill to Elevation 1,200. A rolled fill section was added at the upstream side to Elevation 1217.5 feet, creating a 100-foot wide bench on the downstream side, as shown above in Figure 2. Upstream and downstream slopes were 2½:1.
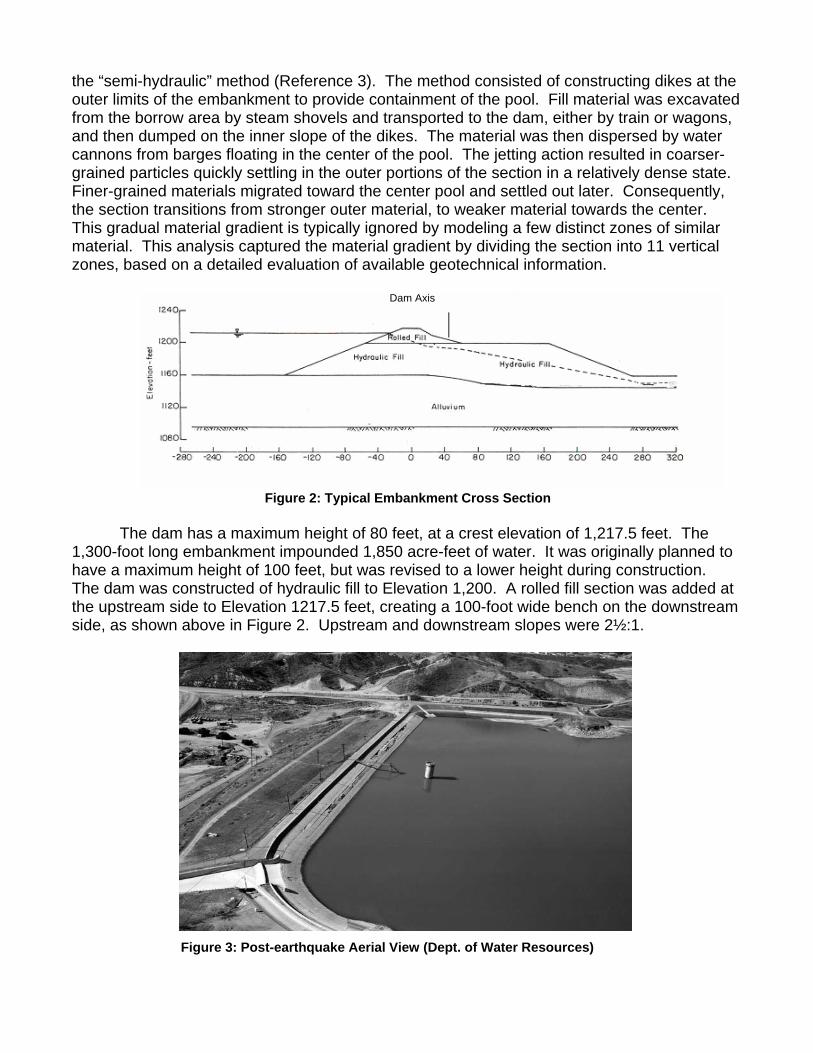
Figure 3: Post-earthquake Aerial View (Dept. of Water Resources)
The spillway was located on the left abutment with crest elevation of 1212.5 feet, providing 5 feet of freeboard. A 3.5-foot high parapet wall was added in 1935 to provide additional freeboard. The aerial view shown in Figure 3 illustrates the major components of the dam, and the extent of longitudinal cracking on the upstream face. The cracked zone thickness was used to calculate the shear zone thickness for the yield function.
ANALYSIS OF GEOTECHNICAL DATA
An extensive field and laboratory investigation program was initiated shortly after the earthquake. The program included exploration borings, standard penetration tests, exploration trenches, in-situ densities, seismic surveys, sampling, and laboratory testing.
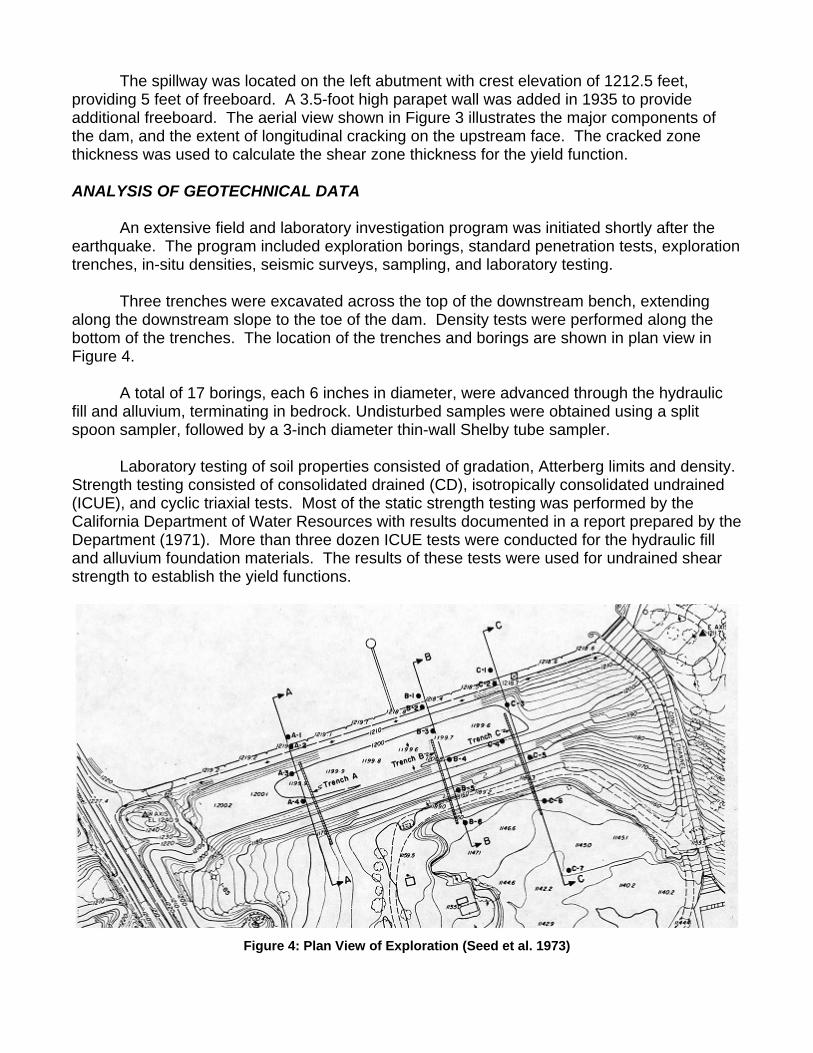
Three trenches were excavated across the top of the downstream bench, extending
along the downstream slope to the toe of the dam. Density tests were performed along the bottom of the trenches. The location of the trenches and borings are shown in plan view in Figure 4.
A total of 17 borings, each 6 inches in diameter, were advanced through the hydraulic
fill and alluvium, terminating in bedrock. Undisturbed samples were obtained using a split spoon sampler, followed by a 3-inch diameter thin-wall Shelby tube sampler.
Laboratory testing of soil properties consisted of gradation, Atterberg limits and density.
Strength testing consisted of consolidated drained (CD), isotropically consolidated undrained (ICUE), and cyclic triaxial tests. Most of the static strength testing was performed by the California Department of Water Resources with results documented in a report prepared by the Department (1971). More than three dozen ICUE tests were conducted for the hydraulic fill and alluvium foundation materials. The results of these tests were used for undrained shear strength to establish the yield functions.
Figure 4: Plan View of Exploration (Seed et al. 1973)
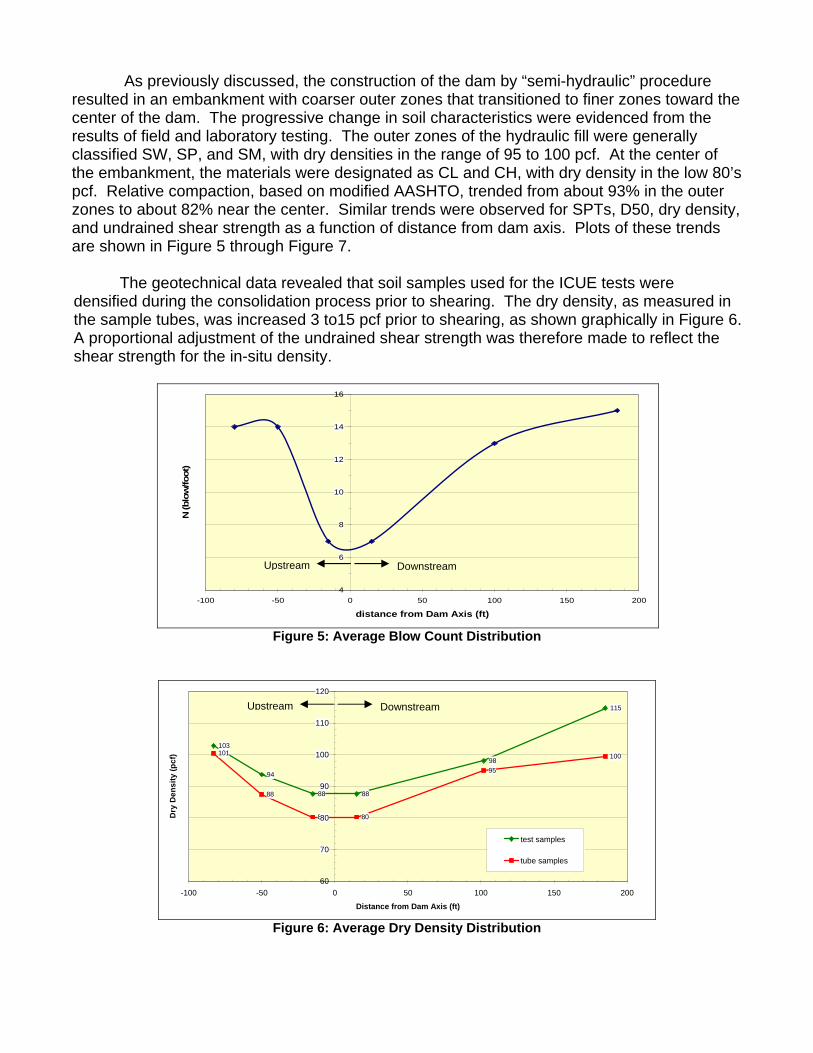
As previously discussed, the construction of the dam by “semi-hydraulic” procedure resulted in an embankment with coarser outer zones that transitioned to finer zones toward the center of the dam. The progressive change in soil characteristics were evidenced from the results of field and laboratory testing. The outer zones of the hydraulic fill were generally classified SW, SP, and SM, with dry densities in the range of 95 to 100 pcf. At the center of the embankment, the materials were designated as CL and CH, with dry density in the low 80’s pcf. Relative compaction, based on modified AASHTO, trended from about 93% in the outer zones to about 82% near the center. Similar trends were observed for SPTs, D50, dry density, and undrained shear strength as a function of distance from dam axis. Plots of these trends are shown in Figure 5 through Figure 7.
The geotechnical data revealed that soil samples used for the ICUE tests were
densified during the consolidation process prior to shearing. The dry density, as measured in the sample tubes, was increased 3 to15 pcf prior to shearing, as shown graphically in Figure 6. A proportional adjustment of the undrained shear strength was therefore made to reflect the shear strength for the in-situ density.
4
6
8
10
12
14
16
-100 -50 0 50 100 150 200
distance from Dam Axis (ft)
N (b
low
/foot
)
Upstream Downstream
Figure 5: Average Blow Count Distribution
103
94
88 88
98
115
101
88
80 80
95
100
60
70
80
90
100
110
120
-100 -50 0 50 100 150 200
Distance from Dam Axis (ft)
Dry
Den
sity
(pcf
)
test samples
tube samples
Upstream Downstream
Figure 6: Average Dry Density Distribution
5
10
15
20
25
30
35
40
45
-100 -50 0 50 100 150 200Distance from Dam Axis (ft)
Φ (d
egre
e)
0.5% 1%
3% 5%
7% 10%
15%
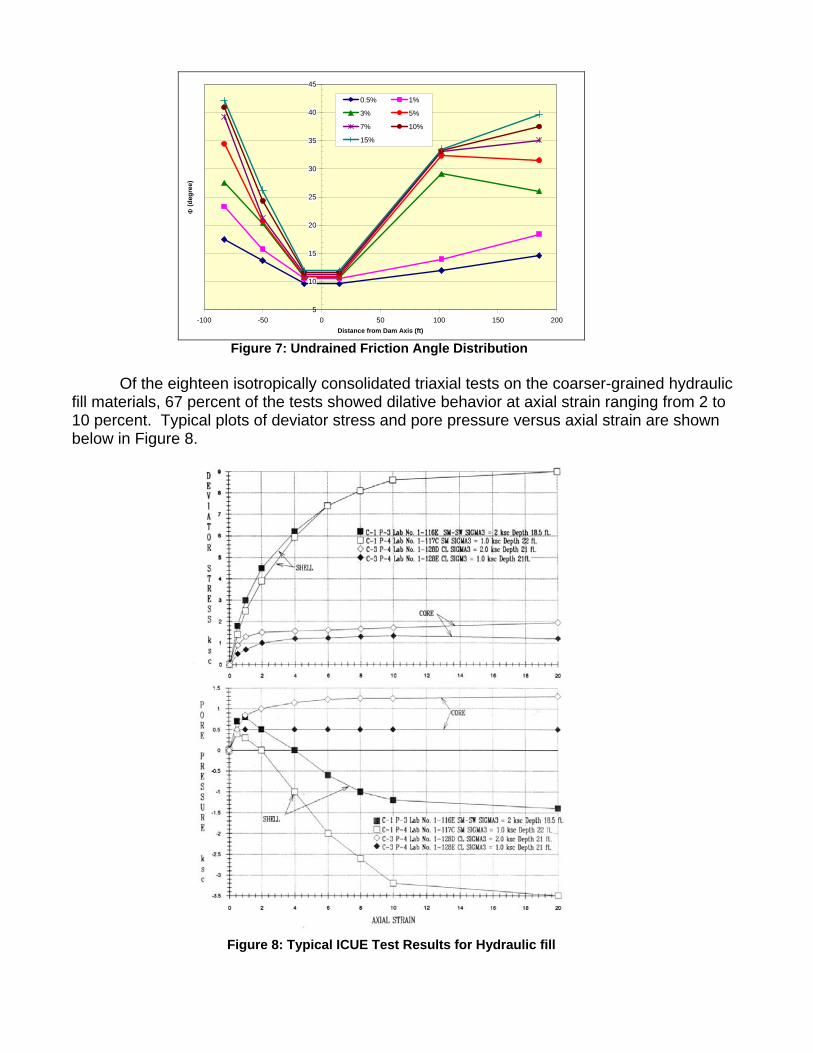
Figure 7: Undrained Friction Angle Distribution
Of the eighteen isotropically consolidated triaxial tests on the coarser-grained hydraulic fill materials, 67 percent of the tests showed dilative behavior at axial strain ranging from 2 to 10 percent. Typical plots of deviator stress and pore pressure versus axial strain are shown below in Figure 8.
Figure 8: Typical ICUE Test Results for Hydraulic fill
The dilation of the coarser-grained materials indicates that these materials were generally dense. This behavior is contrasted by the pore pressure sustained at very large strains for the finer grained materials sampled from the center of the dam. As for the foundation alluvium, 82 percent of the eleven ICUE tests predicted dilation at axial strain from 2 to 8 percent.
The undrained shear strength soil model results in opposite soil behavior from what
might be predicted by a cyclic stress – liquefaction model. The clay zones undergo significant loss of undrained shear strength due to increased pore pressure, which may or may not be captured in a liquefaction model. The coarse grained outer zones and alluvium actually increase in strength at large strains due to the dilative nature of the material.
The undrained soil model predicts a deep-seated slip circle coincident with the static
failure plane, consistent with inertial effects dominating the dynamic behavior. Fortunately, there is ample evidence at Upper San Fernando Dam to closely examine the embankment behavior, and piezometric pressure, in order to test the undrained shear strength approach.
INPUT GROUND MOTIONS
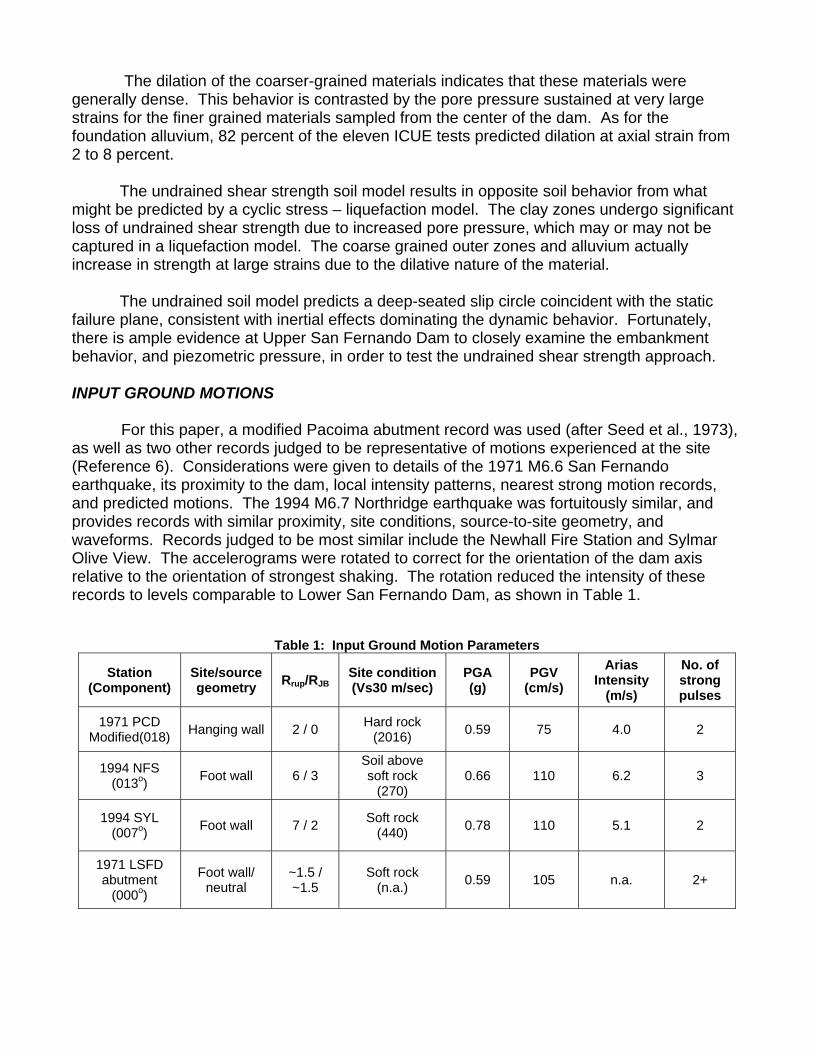
For this paper, a modified Pacoima abutment record was used (after Seed et al., 1973), as well as two other records judged to be representative of motions experienced at the site (Reference 6). Considerations were given to details of the 1971 M6.6 San Fernando earthquake, its proximity to the dam, local intensity patterns, nearest strong motion records, and predicted motions. The 1994 M6.7 Northridge earthquake was fortuitously similar, and provides records with similar proximity, site conditions, source-to-site geometry, and waveforms. Records judged to be most similar include the Newhall Fire Station and Sylmar Olive View. The accelerograms were rotated to correct for the orientation of the dam axis relative to the orientation of strongest shaking. The rotation reduced the intensity of these records to levels comparable to Lower San Fernando Dam, as shown in Table 1.
Table 1: Input Ground Motion Parameters
Station (Component)
Site/source geometry Rrup/RJB
Site condition (Vs30 m/sec)
PGA (g)
PGV (cm/s)
Arias Intensity
(m/s)
No. of strong pulses
1971 PCD Modified(018) Hanging wall 2 / 0 Hard rock
(2016) 0.59 75 4.0 2
1994 NFS (013o) Foot wall 6 / 3
Soil above soft rock
(270) 0.66 110 6.2 3
1994 SYL (007o) Foot wall 7 / 2 Soft rock
(440) 0.78 110 5.1 2
1971 LSFD abutment
(000o)
Foot wall/ neutral
~1.5 / ~1.5
Soft rock (n.a.) 0.59 105 n.a. 2+
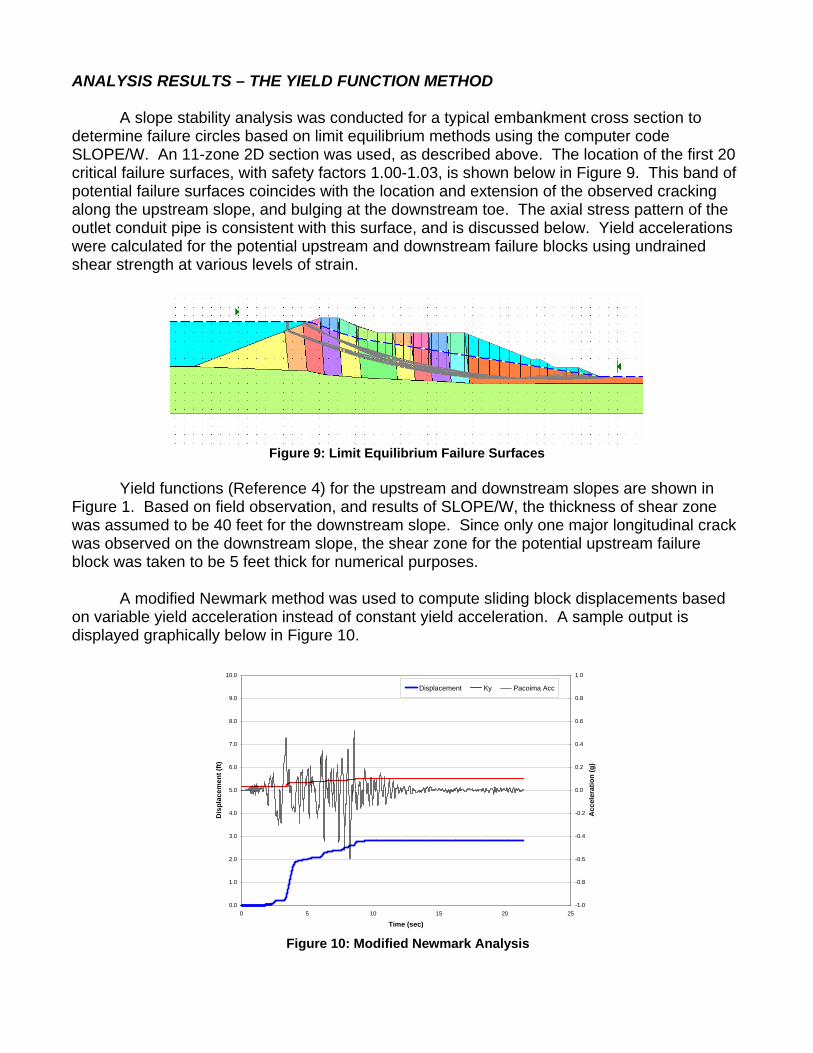
ANALYSIS RESULTS – THE YIELD FUNCTION METHOD
A slope stability analysis was conducted for a typical embankment cross section to determine failure circles based on limit equilibrium methods using the computer code SLOPE/W. An 11-zone 2D section was used, as described above. The location of the first 20 critical failure surfaces, with safety factors 1.00-1.03, is shown below in Figure 9. This band of potential failure surfaces coincides with the location and extension of the observed cracking along the upstream slope, and bulging at the downstream toe. The axial stress pattern of the outlet conduit pipe is consistent with this surface, and is discussed below. Yield accelerations were calculated for the potential upstream and downstream failure blocks using undrained shear strength at various levels of strain.
Figure 9: Limit Equilibrium Failure Surfaces
Yield functions (Reference 4) for the upstream and downstream slopes are shown in
Figure 1. Based on field observation, and results of SLOPE/W, the thickness of shear zone was assumed to be 40 feet for the downstream slope. Since only one major longitudinal crack was observed on the downstream slope, the shear zone for the potential upstream failure block was taken to be 5 feet thick for numerical purposes.
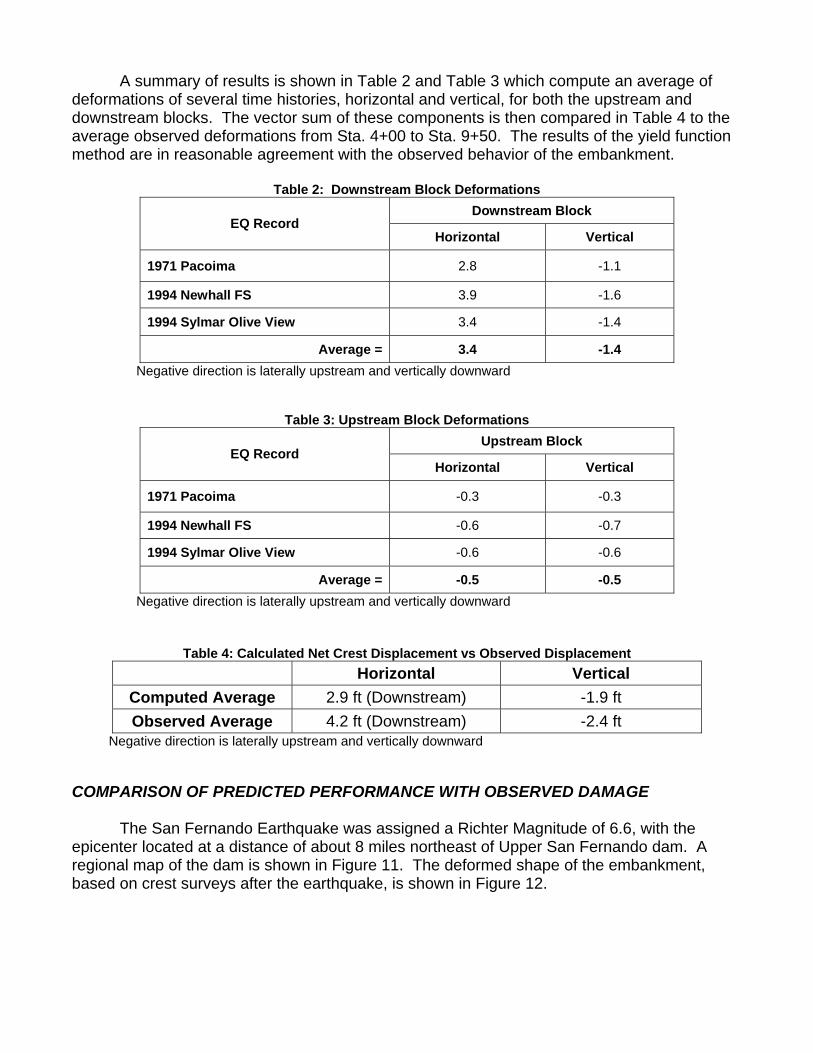
A modified Newmark method was used to compute sliding block displacements based
on variable yield acceleration instead of constant yield acceleration. A sample output is displayed graphically below in Figure 10.
0.0
1.0
2.0
3.0
4.0
5.0
6.0
7.0
8.0
9.0
10.0
0 5 10 15 20 25
Time (sec)
Dis
plac
emen
t (ft)
-1.0
-0.8
-0.6
-0.4
-0.2
0.0
0.2
0.4
0.6
0.8
1.0
Acc
eler
atio
n (g
)
Displacement Ky Pacoima Acc
Figure 10: Modified Newmark Analysis
A summary of results is shown in Table 2 and Table 3 which compute an average of deformations of several time histories, horizontal and vertical, for both the upstream and downstream blocks. The vector sum of these components is then compared in Table 4 to the average observed deformations from Sta. 4+00 to Sta. 9+50. The results of the yield function method are in reasonable agreement with the observed behavior of the embankment.
Table 2: Downstream Block Deformations Downstream Block
EQ Record Horizontal Vertical
1971 Pacoima 2.8 -1.1
1994 Newhall FS 3.9 -1.6
1994 Sylmar Olive View 3.4 -1.4
Average = 3.4 -1.4 Negative direction is laterally upstream and vertically downward
Table 3: Upstream Block Deformations Upstream Block
EQ Record Horizontal Vertical
1971 Pacoima -0.3 -0.3
1994 Newhall FS -0.6 -0.7
1994 Sylmar Olive View -0.6 -0.6
Average = -0.5 -0.5 Negative direction is laterally upstream and vertically downward
Table 4: Calculated Net Crest Displacement vs Observed Displacement Horizontal Vertical
Computed Average 2.9 ft (Downstream) -1.9 ft Observed Average 4.2 ft (Downstream) -2.4 ft
Negative direction is laterally upstream and vertically downward
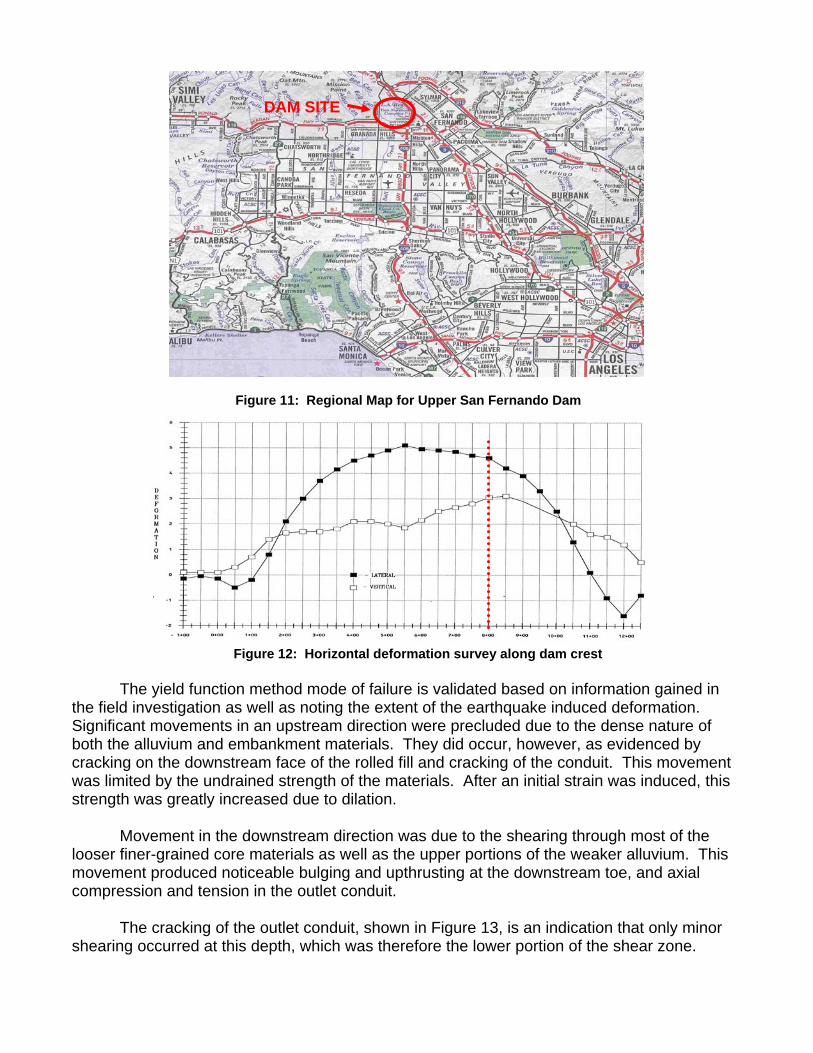
COMPARISON OF PREDICTED PERFORMANCE WITH OBSERVED DAMAGE
The San Fernando Earthquake was assigned a Richter Magnitude of 6.6, with the
epicenter located at a distance of about 8 miles northeast of Upper San Fernando dam. A regional map of the dam is shown in Figure 11. The deformed shape of the embankment, based on crest surveys after the earthquake, is shown in Figure 12.
DAM SITE
Figure 11: Regional Map for Upper San Fernando Dam
Figure 12: Horizontal deformation survey along dam crest
The yield function method mode of failure is validated based on information gained in the field investigation as well as noting the extent of the earthquake induced deformation. Significant movements in an upstream direction were precluded due to the dense nature of both the alluvium and embankment materials. They did occur, however, as evidenced by cracking on the downstream face of the rolled fill and cracking of the conduit. This movement was limited by the undrained strength of the materials. After an initial strain was induced, this strength was greatly increased due to dilation.
Movement in the downstream direction was due to the shearing through most of the
looser finer-grained core materials as well as the upper portions of the weaker alluvium. This movement produced noticeable bulging and upthrusting at the downstream toe, and axial compression and tension in the outlet conduit.
The cracking of the outlet conduit, shown in Figure 13, is an indication that only minor
shearing occurred at this depth, which was therefore the lower portion of the shear zone.
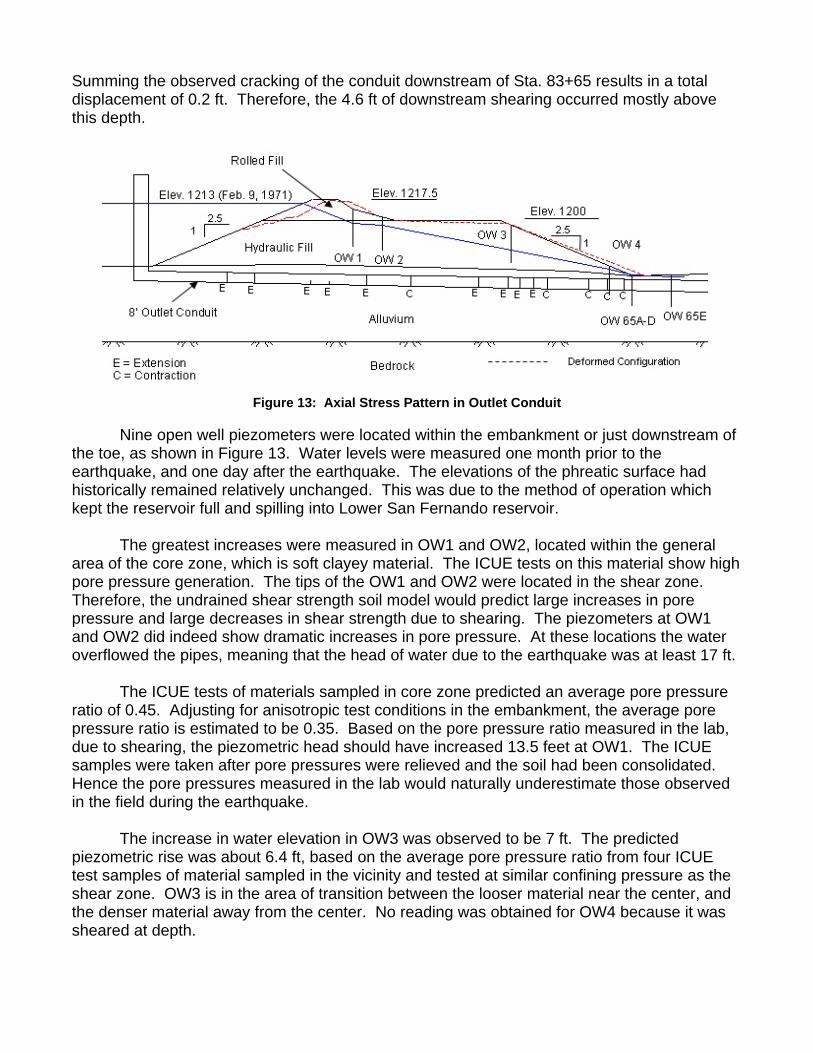
Summing the observed cracking of the conduit downstream of Sta. 83+65 results in a total displacement of 0.2 ft. Therefore, the 4.6 ft of downstream shearing occurred mostly above this depth.
Figure 13: Axial Stress Pattern in Outlet Conduit
Nine open well piezometers were located within the embankment or just downstream of
the toe, as shown in Figure 13. Water levels were measured one month prior to the earthquake, and one day after the earthquake. The elevations of the phreatic surface had historically remained relatively unchanged. This was due to the method of operation which kept the reservoir full and spilling into Lower San Fernando reservoir.
The greatest increases were measured in OW1 and OW2, located within the general
area of the core zone, which is soft clayey material. The ICUE tests on this material show high pore pressure generation. The tips of the OW1 and OW2 were located in the shear zone. Therefore, the undrained shear strength soil model would predict large increases in pore pressure and large decreases in shear strength due to shearing. The piezometers at OW1 and OW2 did indeed show dramatic increases in pore pressure. At these locations the water overflowed the pipes, meaning that the head of water due to the earthquake was at least 17 ft.
The ICUE tests of materials sampled in core zone predicted an average pore pressure
ratio of 0.45. Adjusting for anisotropic test conditions in the embankment, the average pore pressure ratio is estimated to be 0.35. Based on the pore pressure ratio measured in the lab, due to shearing, the piezometric head should have increased 13.5 feet at OW1. The ICUE samples were taken after pore pressures were relieved and the soil had been consolidated. Hence the pore pressures measured in the lab would naturally underestimate those observed in the field during the earthquake.
The increase in water elevation in OW3 was observed to be 7 ft. The predicted
piezometric rise was about 6.4 ft, based on the average pore pressure ratio from four ICUE test samples of material sampled in the vicinity and tested at similar confining pressure as the shear zone. OW3 is in the area of transition between the looser material near the center, and the denser material away from the center. No reading was obtained for OW4 because it was sheared at depth.
The undrained strength tests of materials sampled in the area of the toe of the embankment show dilative behavior for both the embankment and the alluvium. The dilative behavior is due in part to the hydraulic fill placement method, which creates a higher density outer shell compared to the core. The predicted drop in piezometer head for this material is approximately -2.0 feet, based on pore pressure measurements from the ICUE tests. There are several open well piezometers in this vicinity, all of which showed a drop in head of between -1.0 to -3.0 feet following the earthquake, which brackets the predicted value from the undrained shear strength soil model.
The fluctuation of water elevations as a result of the earthquake-induced shearing
matched the pore pressure characteristics determined from the ICUE tests. The looser materials in the center contracted, causing an increase in pressure. Moving away from the center, this increase in pressure became smaller and then became negative at the toe of the dam. These observations fit the undrained shear strength soil model remarkably well.
FLAC MODEL RESULTS BASED ON UNDRAINED SHEAR STRENGTH
A nonlinear finite element analysis was performed using the computer code FLAC, which uses an explicit solution scheme. The nonlinear soil strength is calculated from a built-in Mohr-Coulomb strain softening/hardening constitutive soil model. For each time step, the cohesion and friction angle are adjusted to match input table data, based on the amount of shear strain at the end of the previous time step. The user inputs two tables relating cohesion to strain, and friction angle to strain.
The input tables for cohesion and friction angle were based on undrained shear strength
for axial strain from 0.5 to 15 percent. Typical dynamic analysis properties of K2max, damping, and density are also required. A K2max of 50 and saturated density of 127 pcf were used for hydraulic fill materials, while a K2max of 100 and saturated density of 130 were used for the alluvium foundation.
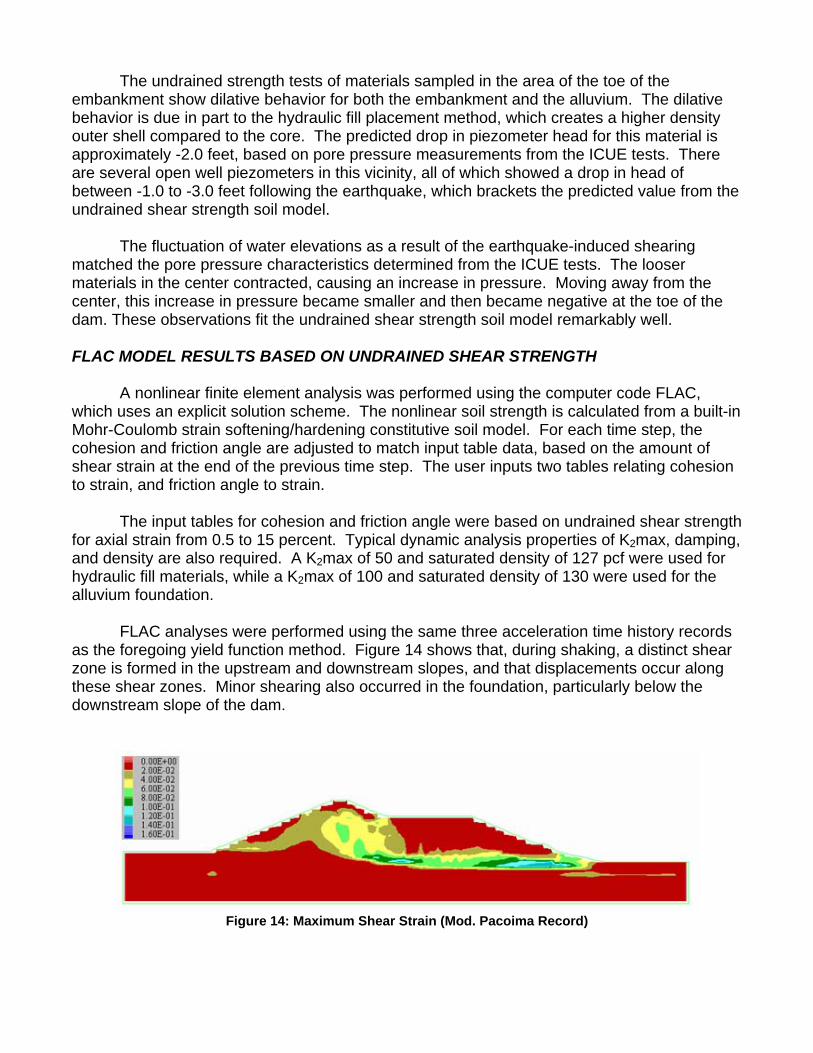
FLAC analyses were performed using the same three acceleration time history records
as the foregoing yield function method. Figure 14 shows that, during shaking, a distinct shear zone is formed in the upstream and downstream slopes, and that displacements occur along these shear zones. Minor shearing also occurred in the foundation, particularly below the downstream slope of the dam.
Figure 14: Maximum Shear Strain (Mod. Pacoima Record)
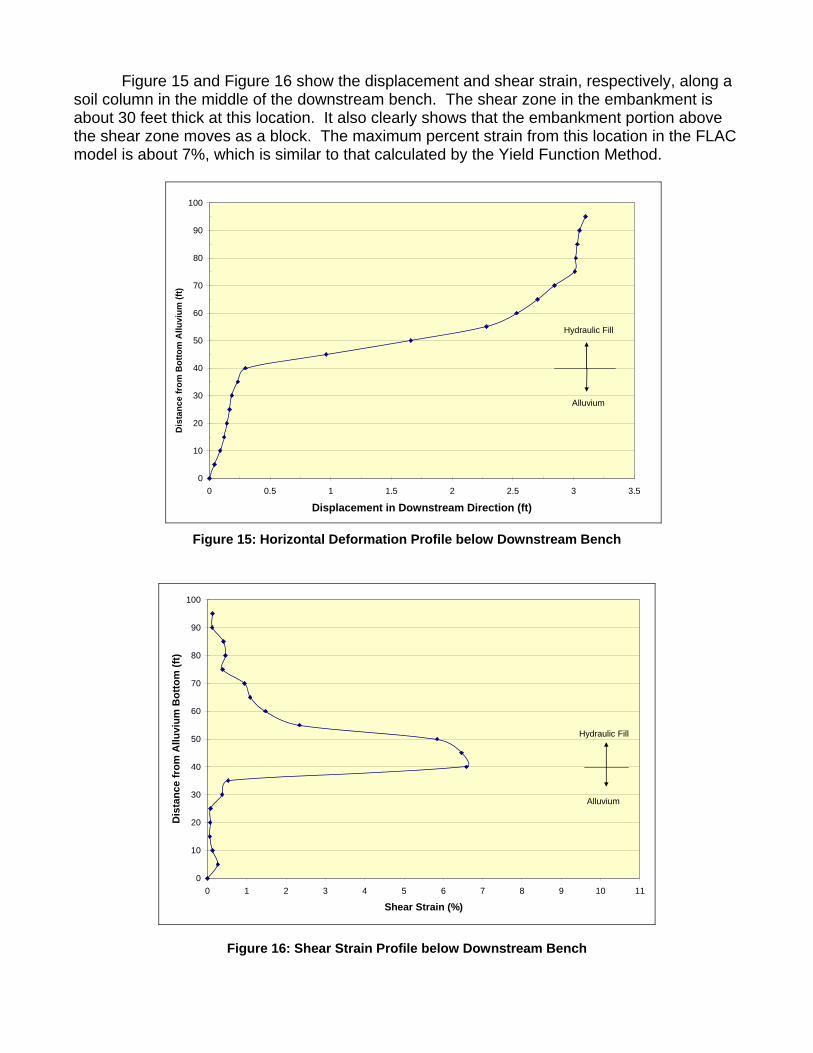
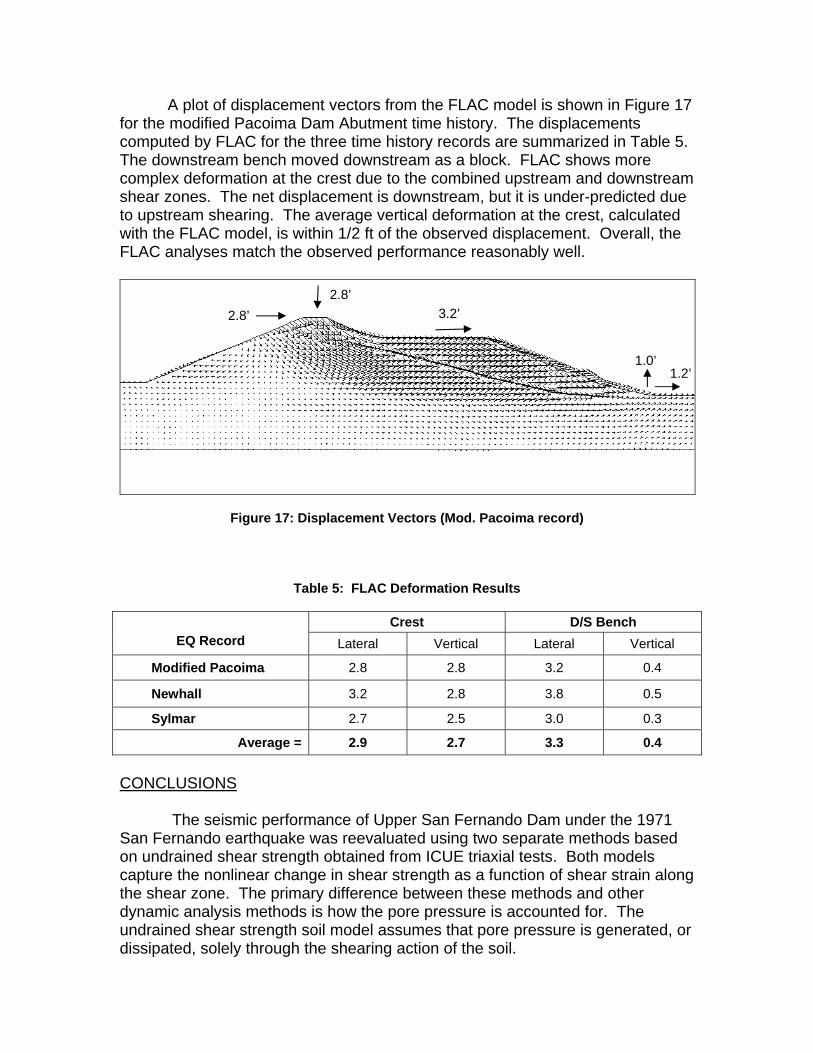
Figure 15 and Figure 16 show the displacement and shear strain, respectively, along a soil column in the middle of the downstream bench. The shear zone in the embankment is about 30 feet thick at this location. It also clearly shows that the embankment portion above the shear zone moves as a block. The maximum percent strain from this location in the FLAC model is about 7%, which is similar to that calculated by the Yield Function Method.
0
10
20
30
40
50
60
70
80
90
100
0 0.5 1 1.5 2 2.5 3 3.
Displacement in Downstream Direction (ft)
Dis
tanc
e fr
om B
otto
m A
lluvi
um (f
t)
5
Alluvium
Hydraulic Fill
Figure 15: Horizontal Deformation Profile below Downstream Bench
0
10
20
30
40
50
60
70
80
90
100
0 1 2 3 4 5 6 7 8 9 10 1
Shear Strain (%)
Dis
tanc
e fr
om A
lluvi
um B
otto
m (f
t)
1
Alluvium
Hydraulic Fill
Figure 16: Shear Strain Profile below Downstream Bench
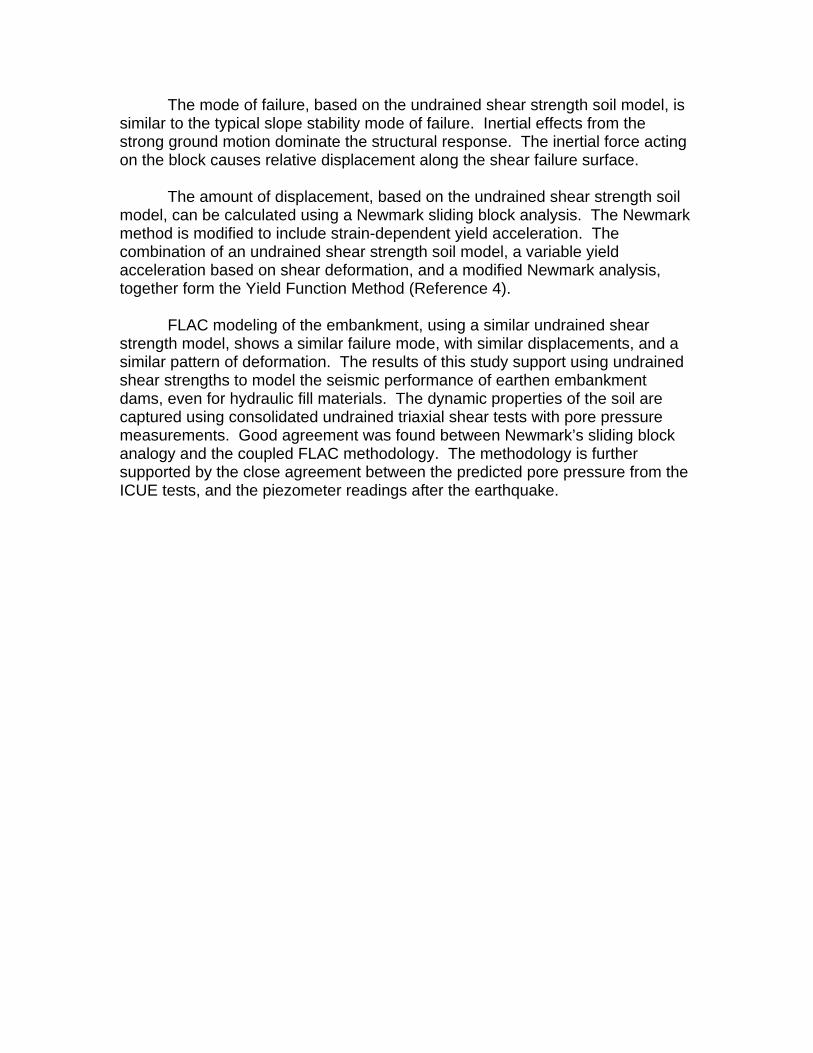
A plot of displacement vectors from the FLAC model is shown in Figure 17 for the modified Pacoima Dam Abutment time history. The displacements computed by FLAC for the three time history records are summarized in Table 5. The downstream bench moved downstream as a block. FLAC shows more complex deformation at the crest due to the combined upstream and downstream shear zones. The net displacement is downstream, but it is under-predicted due to upstream shearing. The average vertical deformation at the crest, calculated with the FLAC model, is within 1/2 ft of the observed displacement. Overall, the FLAC analyses match the observed performance reasonably well.
2.8’3.2’2.8’
1.0’1.2’
Figure 17: Displacement Vectors (Mod. Pacoima record)
Table 5: FLAC Deformation Results
Crest D/S Bench EQ Record Lateral Vertical Lateral Vertical
Modified Pacoima 2.8 2.8 3.2 0.4
Newhall 3.2 2.8 3.8 0.5
Sylmar 2.7 2.5 3.0 0.3
Average = 2.9 2.7 3.3 0.4
CONCLUSIONS The seismic performance of Upper San Fernando Dam under the 1971
San Fernando earthquake was reevaluated using two separate methods based on undrained shear strength obtained from ICUE triaxial tests. Both models capture the nonlinear change in shear strength as a function of shear strain along the shear zone. The primary difference between these methods and other dynamic analysis methods is how the pore pressure is accounted for. The undrained shear strength soil model assumes that pore pressure is generated, or dissipated, solely through the shearing action of the soil.
The mode of failure, based on the undrained shear strength soil model, is similar to the typical slope stability mode of failure. Inertial effects from the strong ground motion dominate the structural response. The inertial force acting on the block causes relative displacement along the shear failure surface.
The amount of displacement, based on the undrained shear strength soil
model, can be calculated using a Newmark sliding block analysis. The Newmark method is modified to include strain-dependent yield acceleration. The combination of an undrained shear strength soil model, a variable yield acceleration based on shear deformation, and a modified Newmark analysis, together form the Yield Function Method (Reference 4).
FLAC modeling of the embankment, using a similar undrained shear
strength model, shows a similar failure mode, with similar displacements, and a similar pattern of deformation. The results of this study support using undrained shear strengths to model the seismic performance of earthen embankment dams, even for hydraulic fill materials. The dynamic properties of the soil are captured using consolidated undrained triaxial shear tests with pore pressure measurements. Good agreement was found between Newmark’s sliding block analogy and the coupled FLAC methodology. The methodology is further supported by the close agreement between the predicted pore pressure from the ICUE tests, and the piezometer readings after the earthquake.
REFERENCES
1. Moriwaki et al., “Seismic Deformation Analysis of the Upper San Fernando Dam Under the 1971 San Fernando Earthquake”, Geotechnical Earthquake Engineering and Soil Dynamics III, ASCE 1998.
2. Wolfgang et al., “Upper San Fernando Dam 1971 Revisited”, 10th Annual
Conference ASDSO, September 1993.
3. Seed et al., “Analysis of the Slides In the San Fernando Dams During the Earthquake of Feb. 9, 1971”. Report No. EERC 73-2, June 1973.
4. Vrymoed, J., “Earthquake Performance of Austrian Dam During the Loma
Prieta Earthquake”. ASDSO 2006 Proceedings. 5. Report titled “Report of Soils Testing of Upper San Fernando Dam” by
Department of Water Resources, State of California.
6. “Geologic Recommendations for Analysis Time Histories, Upper San Fernando Dam”, by J.K. Howard of Division of Safety of Dams, State of California, April 2003.
7. FLAC Version 5.00.346 by Itasca Consulting Group, Inc.