Embed Size (px)
Citation preview
POLICY BRIEF MAY 2019
Impact of the 2017 sanctions on VenezuelaRevisiting the evidence
Dany BaharSebastian BustosJose R. MoralesMiguel A. Santos
1
Dany Bahar (Brookings Institution)
Sebastian Bustos (Harvard Center for International Development)
Jose R. Morales (Harvard Center for International Development)
Miguel A. Santos (Harvard Center for International Development)
SUMMARY FINDINGS
In a paper titled “Economic sanctions as collective punishment: The case of Venezuela” (Weisbrot and
Sachs, 2019), the authors—henceforth referred to as WS—set out to assess the causal effects of the
financial sanctions imposed by the United States on Venezuela in August 2017. The authors conclude
that “sanctions reduced the public’s caloric intake, increased disease and mortality (for both adults and
infants), and displaced millions of Venezuelans who fled the country as a result of the worsening
economic depression and hyperinflation.” WS also claim that “sanctions have inflicted […] very serious
harm to human life and health, including an estimated more than 40,000 deaths from 2017-2018.”
In this paper, we revisit the evidence for these claims and present several findings. We find the
methodology used by WS is unfit to estimate the causal effect of the 2017 sanctions on the Venezuelan
economy, and thus their conclusions are invalid, for two main reasons. First, in the absence of a proper
counterfactual, economic trends in Venezuela since the sanctions were imposed cannot be separated
from the powerfully negative trends that preceded them. Second, several important confounding factors
beyond sanctions, which any rigorous empirical exercise should account for, could also explain the
deterioration studied by Weisbrot and Sachs (2019).
Our other, perhaps even more important finding is that, when analyzing several socio-economic
outcomes in Venezuela across time, it becomes clear that the bulk of the deterioration in living
standards occurred long before the sanctions were enacted in 2017. Relatedly, we find rapidly
worsening trends across all of the socio-economic indicators we analyze well before the sanctions were
imposed in August 2017. Therefore, in the presence of these strong pre-trends, it is impossible to
attribute the current performance of these socio-economic indicators to the sanctions.
The trends displayed by these socio-economic indicators prior to the sanctions are quite striking. For
instance, by 2016—the year before sanctions were imposed—food imports in the country had fallen by
71 percent from their 2013 peak. Imports of medicines and medical equipment fell by 68 percent
between 2013 and 2016. In terms of calorie intake, we find that by August 2017 Venezuelans earning
the minimum wage could only afford a maximum of 6,132 of the cheapest available calories per day—
equivalent to 56 percent of the minimum dietary needs of a family of five. This is 92 percent fewer
calories than the minimum wage could purchase in January 2010. Infant mortality, a good proxy for the
quality of public health services, grew by 44 percent between 2013 and 2016 and has continued to do
so since.
No matter what socio-economic indicator one chooses to look at, it is clear that the sharp deterioration
in Venezuela’s living standards started long before August 2017. The further deterioration observed
since 2017—whether caused by the sanctions or by alternative factors—by no means constitutes the
bulk of the collapse that has caused widespread suffering, death, and displacement to millions of
Venezuelans.
2
ACCESS TO INTERNATIONAL FINANCIAL MARKETS
WS claim that the 2017 sanctions “prohibited the Venezuelan government from borrowing in U.S.
financial markets” thereby preventing debt restructuring, “because debt restructuring requires the
issuance of new bonds in exchange for the existing debt.” To determine whether one can attribute the
inability of the Venezuelan government to raise debt solely to the sanctions, it is important to analyze
some of the underlying trends in Venezuela’s access to finance before these were enacted.
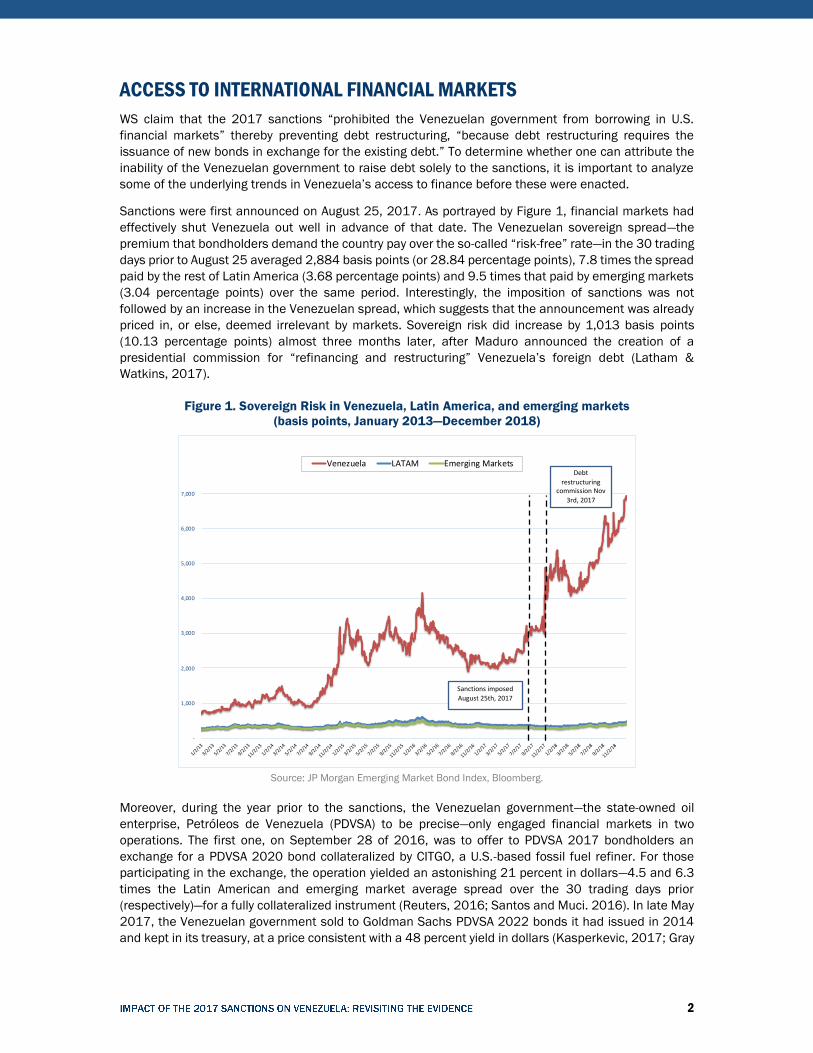
Sanctions were first announced on August 25, 2017. As portrayed by Figure 1, financial markets had
effectively shut Venezuela out well in advance of that date. The Venezuelan sovereign spread—the
premium that bondholders demand the country pay over the so-called “risk-free” rate—in the 30 trading
days prior to August 25 averaged 2,884 basis points (or 28.84 percentage points), 7.8 times the spread
paid by the rest of Latin America (3.68 percentage points) and 9.5 times that paid by emerging markets
(3.04 percentage points) over the same period. Interestingly, the imposition of sanctions was not
followed by an increase in the Venezuelan spread, which suggests that the announcement was already
priced in, or else, deemed irrelevant by markets. Sovereign risk did increase by 1,013 basis points
(10.13 percentage points) almost three months later, after Maduro announced the creation of a
presidential commission for “refinancing and restructuring” Venezuela’s foreign debt (Latham &
Watkins, 2017).
Figure 1. Sovereign Risk in Venezuela, Latin America, and emerging markets
(basis points, January 2013—December 2018)
Source: JP Morgan Emerging Market Bond Index, Bloomberg.
Moreover, during the year prior to the sanctions, the Venezuelan government—the state-owned oil
enterprise, Petróleos de Venezuela (PDVSA) to be precise—only engaged financial markets in two
operations. The first one, on September 28 of 2016, was to offer to PDVSA 2017 bondholders an
exchange for a PDVSA 2020 bond collateralized by CITGO, a U.S.-based fossil fuel refiner. For those
participating in the exchange, the operation yielded an astonishing 21 percent in dollars—4.5 and 6.3
times the Latin American and emerging market average spread over the 30 trading days prior
(respectively)—for a fully collateralized instrument (Reuters, 2016; Santos and Muci. 2016). In late May
2017, the Venezuelan government sold to Goldman Sachs PDVSA 2022 bonds it had issued in 2014
and kept in its treasury, at a price consistent with a 48 percent yield in dollars (Kasperkevic, 2017; Gray
-
1,000
2,000
3,000
4,000
5,000
6,000
7,000
1/2/1
3
3/2/1
3
5/2/1
3
7/2/1
3
9/2/1
3
11/2/1
3
1/2/1
4
3/2/1
4
5/2/1
4
7/2/1
4
9/2/1
4
11/2/1
4
1/2/1
5
3/2/1
5
5/2/1
5
7/2/1
5
9/2/1
5
11/2/1
5
1/2/1
6
3/2/1
6
5/2/1
6
7/2/1
6
9/2/1
6
11/2/1
6
1/2/1
7
3/2/1
7
5/2/1
7
7/2/1
7
9/2/1
7
11/2/1
7
1/2/1
8
3/2/1
8
5/2/1
8
7/2/1
8
9/2/1
8
11/2/1
8
Venezuela LATAM Emerging Markets
Sanctions imposed
August 25th, 2017
Debt
restructuring commission Nov
3rd, 2017
3
and Long, 2017). That is 13.3 and 15.9 times the average Latin American and Emerging Market Bond
Index spread, respectively, over the month of May 2017.
In sum, the evidence indicates that by August 25, the ability of the Venezuelan government to issue
debt was already severely limited if not inexistent, and that investors had either anticipated sanctions
or considered their impact immaterial.
OIL PRODUCTION
To determine the impact of the August 2017 sanctions on Venezuela’s oil production, WS use Colombia
as a counterfactual. For Colombia’s oil production to offer an appropriate counterfactual for
Venezuela’s, at the very least one would need to claim that the trend in Venezuela’s oil production in
the absence of sanctions would have been similar to that of Colombia after August 2017. While this is,
in theory, an unprovable claim, there are best practices that would allow a researcher to make such an
assumption more credibly. One of the most common practices is to carefully examine the trends prior
to the “treatment” under consideration, which in this case corresponds to the 2017 sanctions. How
backward-looking should the pre-trend analysis be? As a rule of thumb, as much as the data allows. In
theory, the correct counterfactual would show no difference in pre-treatment trends regardless of how
far back one takes the data. Any significant differences in pre-treatment trends ought to raise eyebrows.
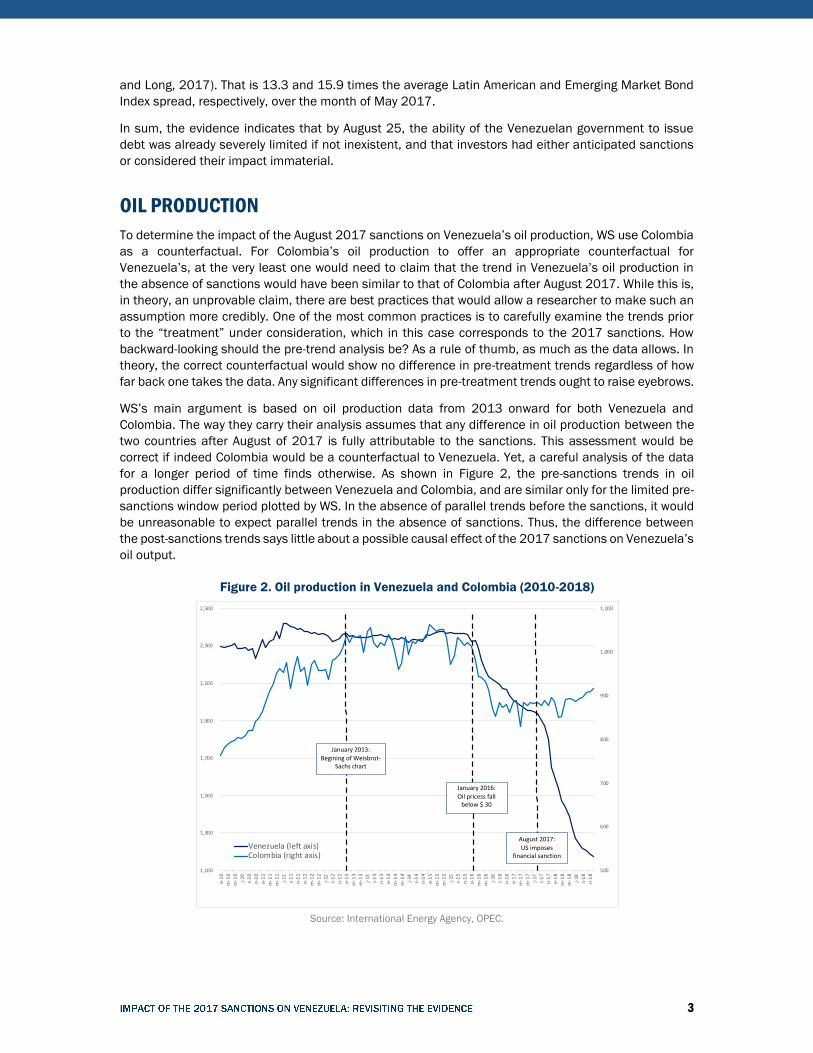
WS’s main argument is based on oil production data from 2013 onward for both Venezuela and
Colombia. The way they carry their analysis assumes that any difference in oil production between the
two countries after August of 2017 is fully attributable to the sanctions. This assessment would be
correct if indeed Colombia would be a counterfactual to Venezuela. Yet, a careful analysis of the data
for a longer period of time finds otherwise. As shown in Figure 2, the pre-sanctions trends in oil
production differ significantly between Venezuela and Colombia, and are similar only for the limited pre-
sanctions window period plotted by WS. In the absence of parallel trends before the sanctions, it would
be unreasonable to expect parallel trends in the absence of sanctions. Thus, the difference between
the post-sanctions trends says little about a possible causal effect of the 2017 sanctions on Venezuela’s
oil output.
Figure 2. Oil production in Venezuela and Colombia (2010-2018)
Source: International Energy Agency, OPEC.
500
600
700
800
900
1,000
1,100
1,100
1,300
1,500
1,700
1,900
2,100
2,300
2,500
e-1
0
m-1
0
m-1
0
j-10
s-1
0
n-1
0
e-1
1m
-11
m-1
1
j-11
s-1
1
n-1
1
e-1
2
m-1
2
m-1
2
j-12
s-1
2
n-1
2e-
13
m-1
3
m-1
3
j-13
s-1
3
n-1
3
e-1
4m
-14
m-1
4
j-14
s-1
4n
-14
e-1
5
m-1
5m
-15
j-15
s-1
5
n-1
5e-
16
m-1
6
m-1
6
j-16
s-1
6
n-1
6
e-1
7m
-17
m-1
7
j-17
s-1
7n
-17
e-1
8
m-1
8m
-18
j-18
s-1
8
n-1
8
Venezuela (left axis)Colombia (right axis)
August 2017:
US imposes financial sanction
January 2016:
Oil pricess fall below $ 30
January 2013:
Begining of Weisbrot-Sachs chart
4
In fact, trends are different because the evolution of Colombia’s oil output is driven by very different
underlying factors; given that, the country would likely respond differently to common shocks, such as
price fluctuations. Establishing with certainty the factors driving the observed trends in oil production of
both Venezuela and Colombia is beyond the scope of this report. However, we lay out some possible
explanations for the observed trends.
In Venezuela, for example, many analysts agree that the fall in oil production is but the continuation of
a long-standing decline whose origins can be traced back to President Hugo Chavez’s firing more than
18,000 oil workers after the national strike of 2003, which resulted in a large loss of management and
technical capacity to Venezuela’s oil industry (Forero, 2003). Other accounts also mention
mismanagement, negligence, and corruption as possible explanations. In spite of the prolonged
commodity bonanza of the early 2000s, Venezuela’s daily oil output declined by 24 percent between
2005 and 2016. This decline became even more pronounced during the first half of 2017 when
production decreased by 242,000 barrels per day relative to the same period in the previous year.
In Colombia, by contrast, many oil experts suggest that a combination of policies initiated in the mid-
2000s boosted production between 2005 and its peak in 2015 by an astounding 91 percent.1 These
policies included regulatory changes, fiscal incentives, and a national security policy aimed at driving
the guerrillas out of oil fields. Output subsequently declined by 14.6 percent between 2015 and 2017
and stabilized at a lower level, owing to the depletion of oil reserves and lower exploration activity driven
by lower prices.
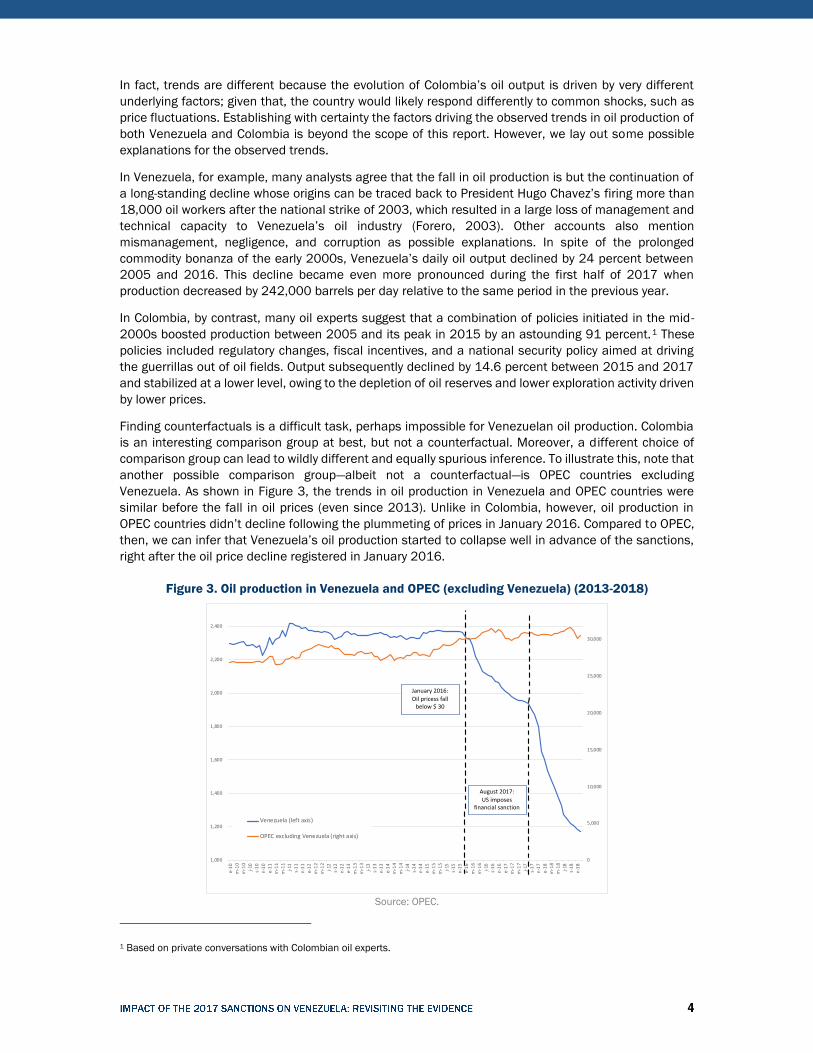
Finding counterfactuals is a difficult task, perhaps impossible for Venezuelan oil production. Colombia
is an interesting comparison group at best, but not a counterfactual. Moreover, a different choice of
comparison group can lead to wildly different and equally spurious inference. To illustrate this, note that
another possible comparison group—albeit not a counterfactual—is OPEC countries excluding
Venezuela. As shown in Figure 3, the trends in oil production in Venezuela and OPEC countries were
similar before the fall in oil prices (even since 2013). Unlike in Colombia, however, oil production in
OPEC countries didn’t decline following the plummeting of prices in January 2016. Compared to OPEC,
then, we can infer that Venezuela’s oil production started to collapse well in advance of the sanctions,
right after the oil price decline registered in January 2016.
Figure 3. Oil production in Venezuela and OPEC (excluding Venezuela) (2013-2018)
Source: OPEC.
1 Based on private conversations with Colombian oil experts.
0
5,000
10,000
15,000
20,000
25,000
30,000
1,000
1,200
1,400
1,600
1,800
2,000
2,200
2,400
e-1
0m
-10
m-1
0j-
10s-
10
n-1
0e-
11
m-1
1m
-11
j-11
s-1
1n
-11
e-1
2m
-12
m-1
2j-
12s-
12
n-1
2e-
13
m-1
3m
-13
j-13
s-1
3n
-13
e-1
4m
-14
m-1
4j-
14s-
14
n-1
4e-
15
m-1
5m
-15
j-15
s-1
5
n-1
5e-
16
m-1
6m
-16
j-16
s-1
6n
-16
e-1
7m
-17
m-1
7j-
17s-
17
n-1
7e-
18
m-1
8m
-18
j-18
s-1
8n
-18
Venezuela (left axis)
OPEC excluding Venezuela (right axis)
January 2016:
Oil pricess fall below $ 30
August 2017:
US imposes financial sanction

5
Can we conclude that the divergence in oil production between OPEC and Venezuela after 2017 is a
result of sanctions? In light of the pre-sanctions downward trend in Venezuela’s oil production, the
answer is no. Neither can the steadily steeper decline in production since August 2017 be attributed to
the sanctions—certainly not using this data, and not without first accounting for other possible
confounding factors, which we explore below.
Some analysts would dismiss our previous thought experiment by claiming that OPEC is not as good a
comparison group to Venezuela as is Colombia because it aggregates countries with both high and low
marginal production costs, and countries with different marginal production costs respond differently to
fluctuations in oil prices. We agree: just as Colombia is not a good counterfactual for Venezuela, neither
is OPEC. More generally, as stated above, there is no such thing as an adequate counterfactual for
Venezuela’s seemingly idiosyncratic oil production.
However, the claim regarding marginal costs is worth looking into. To analyze it in detail, we break down
Venezuela’s annual oil production into four different types of oil: Heavy-Extra-heavy, Medium, Light, and
Condensates. Figure 4 describes the breakdown and shows some interesting features. First, light oil,
whose lower production costs presumably makes them less vulnerable to price fluctuations, has been
precisely the one that has fallen at a faster speed. Indeed, between 2010 and 2018 Venezuela’s output
of light oil dropped by 64.9 percent. In contrast, over the same period, heavy and extra-heavy crude oil
dropped at a much lower 38.1 percent. The inability of Venezuela to maintain—let alone increase—its
production of light oil even in those years where oil prices were at peak suggests that there were
underlying factors negatively impacting the industry before the 2017 sanctions were imposed. According
to the clear trends we see prior to the 2017 sanctions in all our data, those same underlying factors—
whatever they are—would have continued to drive output down even in the absence of sanctions.
Figure 4. Oil production by oil type in Venezuela (2010-2018)
Source: MENPET PODE 1999-2011, PDVSA Annual Report 2012-2016 y IPD 2017-2018.
Note: Data is proprietary.
0
500
1,000
1,500
2,000
2,500
3,000
3,500
2010 2011 2012 2013 2014 2015 2016 2017 2018
Heavy / Extraheavy Medium Light Condensates
6
Another crucial point to consider is whether there are confounding factors that could have affected oil
production around August 2017, which could also explain an acceleration in the rate at which Venezuela
reduced its oil production. For instance, three months after sanctions were imposed, the Venezuelan
regime arrested 65 executives of the state-owned oil company, including the former head of PDVSA and
Minister of Energy, Eulogio del Pino, and PDVSA’s President Nelson Martinez (the latter died in strange
circumstances on December 12, 2018, while in custody) (BBC, 2017; Herrero and Casey, 2017;
Reuters, 2018). At the same time, the Venezuelan regime appointed Major General Nelson Quevedo to
Minister of Energy and President of PDVSA, an official with no prior relevant experience for the job. These
events, which most likely shaped the oil production capabilities of PDVSA, cannot be ignored in any
analysis of trends that prevailed around August 2017. Thus, our point is that it is quite impossible to
attribute the fall in oil production to one single event (i.e., the sanctions), when many other confounding
events were happening at the same time.
SOCIO-ECONOMIC OUTCOMES
WS attribute the negative performance of most socio-economic indicators in Venezuela entirely to the
August 2017 sanctions. Because of the sanctions-induced drop in oil revenue and loss of access to
capital markets, they claim, Venezuela lacks enough foreign currency to import the food and medicine
to satisfy the population’s basic needs. While it is possible that the sanctions adversely affected oil
production, we conclude it is impossible to disentangle (and thus measure) that effect from the pre-
sanctions output decline observed. Similarly, this pre-sanctions drop in oil production was accompanied
by a sharp deterioration in socio-economic conditions starting in at least 2013 that was not observed
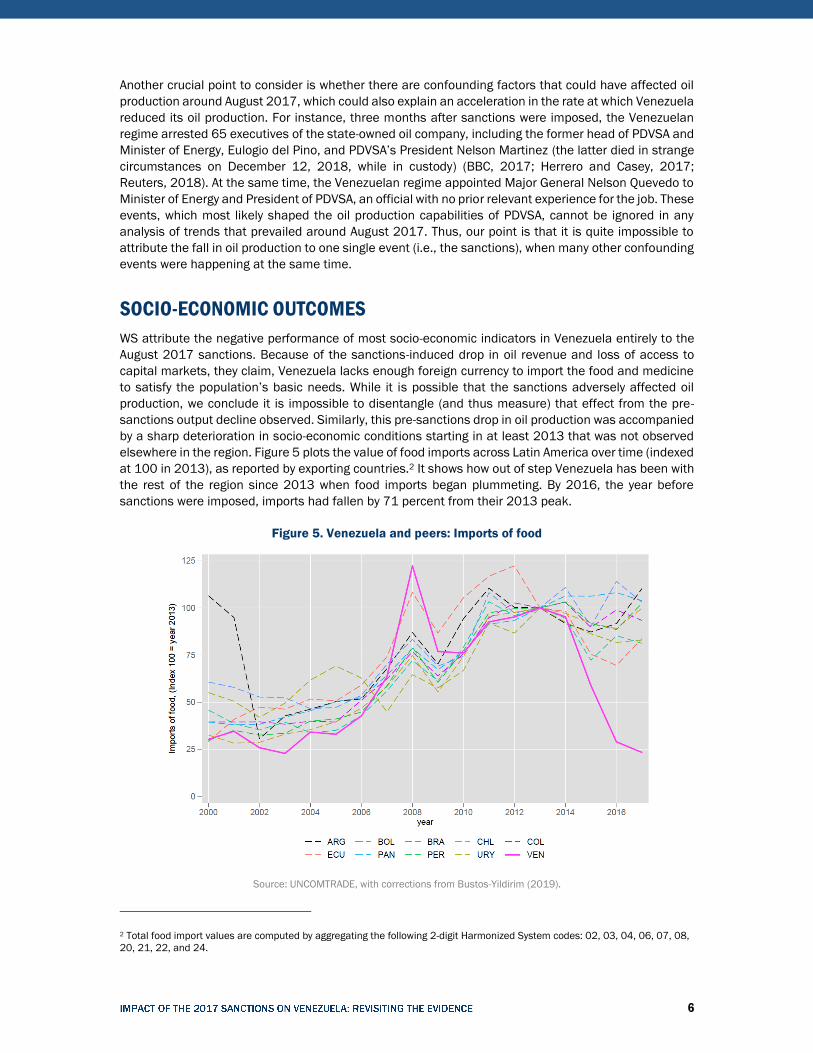
elsewhere in the region. Figure 5 plots the value of food imports across Latin America over time (indexed
at 100 in 2013), as reported by exporting countries.2 It shows how out of step Venezuela has been with
the rest of the region since 2013 when food imports began plummeting. By 2016, the year before
sanctions were imposed, imports had fallen by 71 percent from their 2013 peak.
Figure 5. Venezuela and peers: Imports of food
Source: UNCOMTRADE, with corrections from Bustos-Yildirim (2019).
2 Total food import values are computed by aggregating the following 2-digit Harmonized System codes: 02, 03, 04, 06, 07, 08,
20, 21, 22, and 24.
7
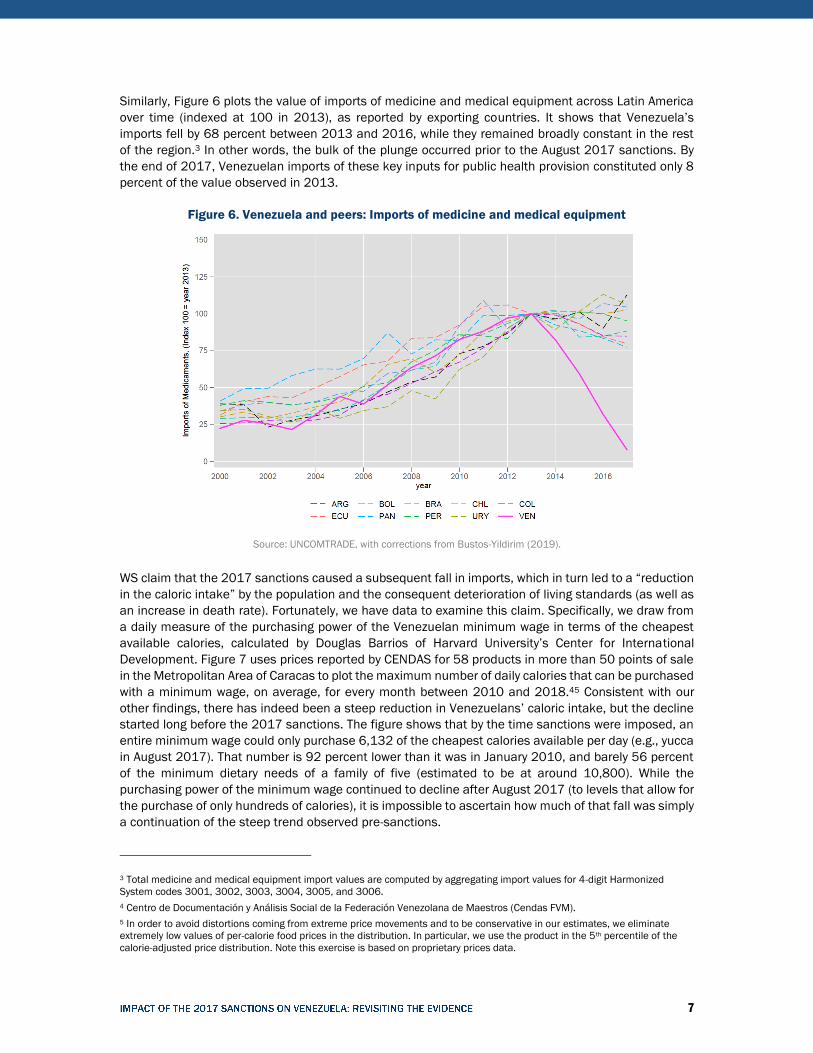
Similarly, Figure 6 plots the value of imports of medicine and medical equipment across Latin America
over time (indexed at 100 in 2013), as reported by exporting countries. It shows that Venezuela’s
imports fell by 68 percent between 2013 and 2016, while they remained broadly constant in the rest
of the region.3 In other words, the bulk of the plunge occurred prior to the August 2017 sanctions. By
the end of 2017, Venezuelan imports of these key inputs for public health provision constituted only 8
percent of the value observed in 2013.
Figure 6. Venezuela and peers: Imports of medicine and medical equipment
Source: UNCOMTRADE, with corrections from Bustos-Yildirim (2019).
WS claim that the 2017 sanctions caused a subsequent fall in imports, which in turn led to a “reduction
in the caloric intake” by the population and the consequent deterioration of living standards (as well as
an increase in death rate). Fortunately, we have data to examine this claim. Specifically, we draw from
a daily measure of the purchasing power of the Venezuelan minimum wage in terms of the cheapest
available calories, calculated by Douglas Barrios of Harvard University’s Center for International
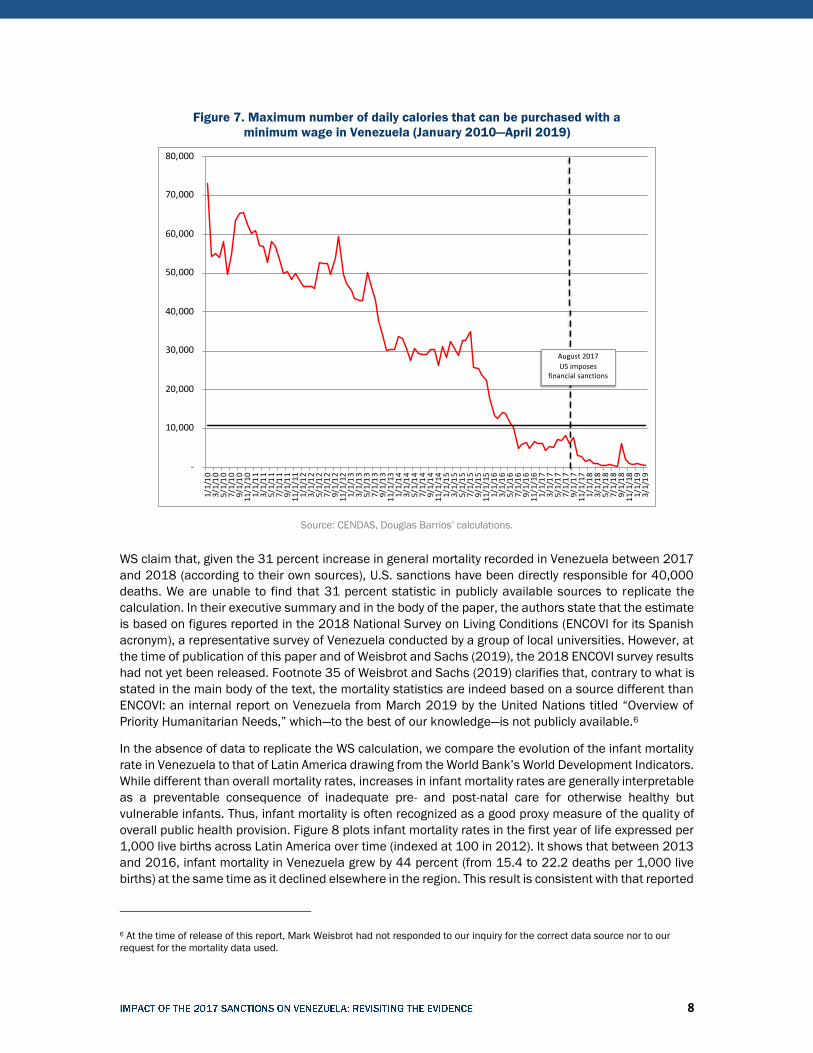
Development. Figure 7 uses prices reported by CENDAS for 58 products in more than 50 points of sale
in the Metropolitan Area of Caracas to plot the maximum number of daily calories that can be purchased
with a minimum wage, on average, for every month between 2010 and 2018.45 Consistent with our
other findings, there has indeed been a steep reduction in Venezuelans’ caloric intake, but the decline
started long before the 2017 sanctions. The figure shows that by the time sanctions were imposed, an
entire minimum wage could only purchase 6,132 of the cheapest calories available per day (e.g., yucca
in August 2017). That number is 92 percent lower than it was in January 2010, and barely 56 percent
of the minimum dietary needs of a family of five (estimated to be at around 10,800). While the
purchasing power of the minimum wage continued to decline after August 2017 (to levels that allow for
the purchase of only hundreds of calories), it is impossible to ascertain how much of that fall was simply
a continuation of the steep trend observed pre-sanctions.
3 Total medicine and medical equipment import values are computed by aggregating import values for 4-digit Harmonized
System codes 3001, 3002, 3003, 3004, 3005, and 3006.
4 Centro de Documentación y Análisis Social de la Federación Venezolana de Maestros (Cendas FVM).
5 In order to avoid distortions coming from extreme price movements and to be conservative in our estimates, we eliminate
extremely low values of per-calorie food prices in the distribution. In particular, we use the product in the 5th percentile of the
calorie-adjusted price distribution. Note this exercise is based on proprietary prices data.
8
Figure 7. Maximum number of daily calories that can be purchased with a
minimum wage in Venezuela (January 2010—April 2019)
Source: CENDAS, Douglas Barrios’ calculations.
WS claim that, given the 31 percent increase in general mortality recorded in Venezuela between 2017
and 2018 (according to their own sources), U.S. sanctions have been directly responsible for 40,000
deaths. We are unable to find that 31 percent statistic in publicly available sources to replicate the
calculation. In their executive summary and in the body of the paper, the authors state that the estimate
is based on figures reported in the 2018 National Survey on Living Conditions (ENCOVI for its Spanish
acronym), a representative survey of Venezuela conducted by a group of local universities. However, at
the time of publication of this paper and of Weisbrot and Sachs (2019), the 2018 ENCOVI survey results
had not yet been released. Footnote 35 of Weisbrot and Sachs (2019) clarifies that, contrary to what is
stated in the main body of the text, the mortality statistics are indeed based on a source different than
ENCOVI: an internal report on Venezuela from March 2019 by the United Nations titled “Overview of
Priority Humanitarian Needs,” which—to the best of our knowledge—is not publicly available.6
In the absence of data to replicate the WS calculation, we compare the evolution of the infant mortality
rate in Venezuela to that of Latin America drawing from the World Bank’s World Development Indicators.
While different than overall mortality rates, increases in infant mortality rates are generally interpretable
as a preventable consequence of inadequate pre- and post-natal care for otherwise healthy but
vulnerable infants. Thus, infant mortality is often recognized as a good proxy measure of the quality of
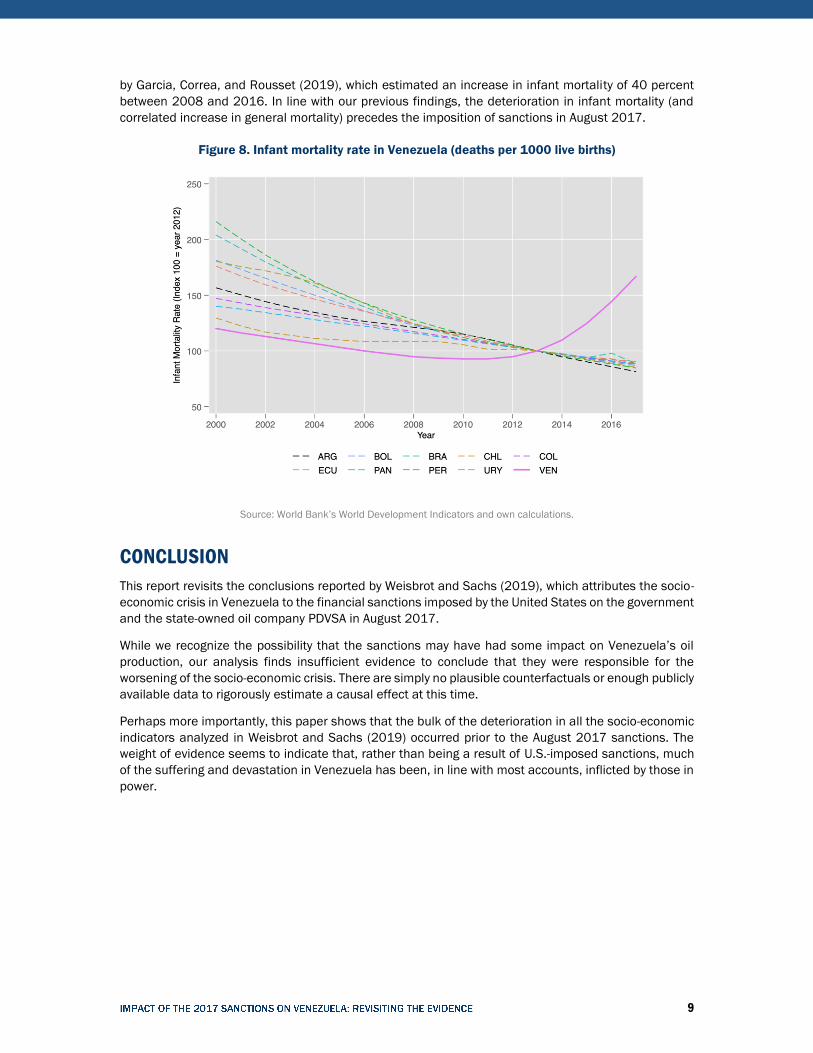
overall public health provision. Figure 8 plots infant mortality rates in the first year of life expressed per
1,000 live births across Latin America over time (indexed at 100 in 2012). It shows that between 2013
and 2016, infant mortality in Venezuela grew by 44 percent (from 15.4 to 22.2 deaths per 1,000 live
births) at the same time as it declined elsewhere in the region. This result is consistent with that reported
6 At the time of release of this report, Mark Weisbrot had not responded to our inquiry for the correct data source nor to our
request for the mortality data used.
-
10,000
20,000
30,000
40,000
50,000
60,000
70,000
80,000
1/1
/10
3/1
/10
5/1
/10
7/1
/10
9/1
/10
11/1
/10
1/1
/11
3/1
/11
5/1
/11
7/1
/11
9/1
/11
11/1
/11
1/1
/12
3/1
/12
5/1
/12
7/1
/12
9/1
/12
11/1
/12
1/1
/13
3/1
/13
5/1
/13
7/1
/13
9/1
/13
11/1
/13
1/1
/14
3/1
/14
5/1
/14
7/1
/14
9/1
/14
11/1
/14
1/1
/15
3/1
/15
5/1
/15
7/1
/15
9/1
/15
11/1
/15
1/1
/16
3/1
/16
5/1
/16
7/1
/16
9/1
/16
11/1
/16
1/1
/17
3/1
/17
5/1
/17
7/1
/17
9/1
/17
11/1
/17
1/1
/18
3/1
/18
5/1
/18
7/1
/18
9/1
/18
11/1
/18
1/1
/19
3/1
/19
August 2017
US imposes financial sanctions
9
by Garcia, Correa, and Rousset (2019), which estimated an increase in infant mortality of 40 percent
between 2008 and 2016. In line with our previous findings, the deterioration in infant mortality (and
correlated increase in general mortality) precedes the imposition of sanctions in August 2017.
Figure 8. Infant mortality rate in Venezuela (deaths per 1000 live births)
Source: World Bank’s World Development Indicators and own calculations.
CONCLUSION
This report revisits the conclusions reported by Weisbrot and Sachs (2019), which attributes the socio-
economic crisis in Venezuela to the financial sanctions imposed by the United States on the government
and the state-owned oil company PDVSA in August 2017.
While we recognize the possibility that the sanctions may have had some impact on Venezuela’s oil
production, our analysis finds insufficient evidence to conclude that they were responsible for the
worsening of the socio-economic crisis. There are simply no plausible counterfactuals or enough publicly
available data to rigorously estimate a causal effect at this time.
Perhaps more importantly, this paper shows that the bulk of the deterioration in all the socio-economic
indicators analyzed in Weisbrot and Sachs (2019) occurred prior to the August 2017 sanctions. The
weight of evidence seems to indicate that, rather than being a result of U.S.-imposed sanctions, much
of the suffering and devastation in Venezuela has been, in line with most accounts, inflicted by those in
power.
10
REFERENCES
BBC. 2017. "Venezuela: detienen por corrupción al exministro de Petróleo Eulogio del Pino y al expresidente
de PDVSA Nelson Martínez." BBC Mundo, November 30, 2017. https://www.bbc.com/mundo/noticias-
america-latina-42186955.
Bartenstein, Ben, Katia Porzecanski, and Patricia Laya. 2017. "Venezuela’s Bondholder Meeting Is a Bust
as S&P Declares Default." Bloomberg, November 14, 2017.
https://www.bloomberg.com/news/articles/2017-11-14/venezuela-s-bondholder-meeting-is-a-bust-as-s-p-
declares-default.
Bustos, Sebastian and Muhammed Yildirim. 2019. “Uncovering trade flows”, Unpublished mimeo, available
upon request.
Casey, Nicholas. 2019. "Secret Venezuela Files Warn About Maduro Confidant." The New York Times, May
2, 2019. https://www.nytimes.com/2019/05/02/world/americas/venezuela-maduro-hezbollah-drugs.html
Forero, Juan. 2003. "Venezuela Tries to Lure Oil Investors." The New York Times, December 19, 2003.
https://www.nytimes.com/2003/12/19/business/venezuela-tries-to-lure-oil-investors.html
García, Jenny, Gerardo Correa, and Brenda Rousset. 2019. "Trends in infant mortality in Venezuela between
1985 and 2016: A systematic analysis of demographic data". January 24, 2019
http://dx.doi.org/10.1016/S2214-109X(18)30479-0.
Gray, Alistair and Gideon Long. 2017. "Goldman Sachs’ Venezuela bond purchase sparks anger." Financial
Times, May 30, 2017. https://www.ft.com/content/fc8d4ce6-4537-11e7-8d27-59b4dd6296b8.
Herrero, Ana Vanessa and Nicholas Casey. 2017. "Venezuela Arrests 2 Former Oil Officials, Claiming
Corruption." The New York Times, November 30, 2017.
https://www.nytimes.com/2017/11/30/world/americas/venezuela-maduro-oil-corruption-arrests.html.
Kasperkevic, Jana. 2017. "What you need to know about Venezuela’s 'hunger bonds'." Marketplace, May
31, 2017. https://www.marketplace.org/2017/05/31/world/what-you-need-know-about-venezuela-s-
hunger-bonds.
Latham & Watkins. 2017 "Venezuela Restructuring: A Long Road Ahead?" Client Alert, Number 2239.
November 8, 2017. https://www.lw.com/thoughtLeadership/lw-venezuela-restructuring-a-long-road-ahead.
Reuters. 2016. "UPDATE 3-Venezuela's PDVSA offers 2020 bond swap, with 8.5 pct coupon." September 6,
2016. https://www.reuters.com/article/venezuela-pdvsa-debt-idUSL2N1BS1P9.
Reuters. 2018. "Ex-Venezuela oil minister Martinez dies in state custody." December 12, 2018.
https://www.reuters.com/article/us-venezuela-oil-martinez/ex-venezuela-oil-minister-martinez-dies-in-state-
custody-idUSKBN1OB2PP.
Santos, Miguel and Frank Muci. 2016 "Se vende país con vista al mar". ProDavinci, October 5, 2016.
http://historico.prodavinci.com/blogs/se-vende-pais-con-vista-al-mar-por-miguel-angel-santos-y-frank-muci.
U.S. Department of the Treasury. 2017. "Treasury Sanctions Prominent Venezuelan Drug Trafficker Tareck
El Aissami and His Primary Frontman Samark Lopez Bello." February 3, 2017.
https://www.treasury.gov/press-center/press-releases/Pages/as0005.aspx.
Weisbrot, Mark and Jeffrey Sachs. 2019. "Economic Sanctions as Collective Punishment: The Case of
Venezuela." Center for Economic and Policy Research.
11
Acknowledgements The authors would like to thank Julio Castro, Gerardo Correa, Luis Pedro España, Joel Guedes, Francisco
Monaldi, Luis Pacheco, Sebastian Strauss, and Merrell Tuck-Primdahl for useful comments and
suggestions. The usual disclaimers apply.
The Brookings Institution is a nonprofit organization devoted to independent research and policy
solutions. Its mission is to conduct high-quality, independent research and, based on that research, to
provide innovative, practical recommendations for policymakers and the public. The conclusions and
recommendations of any Brookings publication are solely those of its author(s), and do not reflect the
views of the Institution, its management, or its other scholars.
Brookings recognizes that the value it provides is in its absolute commitment to quality, independence
and impact. Activities supported by its donors reflect this commitment and the analysis and
recommendations are not determined or influenced by any donation. A full list of contributors to the
Brookings Institution can be found in the Annual Report at https://www.brookings.edu/about-
us/annual-report/.