Embed Size (px)
Citation preview
April 26-27, 2017
The Hackett Group
Revisiting the Core Principles of Strategic
Sourcing: Best Practices for Success
The Hackett Group
Statement of Confidentiality and Usage Restrictions
This document contains trade secrets and other information that is company sensitive, proprietary, and confidential, the disclosure of which would
provide a competitive advantage to others. As a result, the reproduction, copying, or redistribution of this document or the contents contained herein,
in whole or in part, for any purpose is strictly prohibited without the prior written consent of The Hackett Group.
Copyright © 2017 The Hackett Group, Inc. All rights reserved. World-Class Defined and Enabled.
Business Advisory Services | 3© 2015 The Hackett Group, Inc. All rights reserved. Reproduction of this document or any portion thereof without prior written consent is prohibited.
Kurt Albertson is a Principal with The Hackett Group with program responsibility for North
American Strategic Advisory programs focusing on client relationships, business
development, research and program delivery. Mr. Albertson works with over one hundred
Global 1000 companies leveraging research and thought leadership to provide strategic
direction and best practice business advice within Procurement and Finance.
Prior to joining the Hackett Group Mr. Albertson spent six years as a management
consultant in Sourcing and Procurement during which he worked with executives from
dozens of large corporations on sourcing, business and technical strategies,
organizational and business process design, and cultural change.
Mr. Albertson also has five years of automotive experience working in manufacturing,
quality, and operations. In this role he designed and implemented global manufacturing
processes and supervised production operations.
Mr. Albertson has been quoted in the Wall Street Journal and other major publications,
has been the key note speaker at many national events, and travels globally to support
client objectives.
Kurt Albertson, Principal – Procurement Advisory
Contact Information:
770-225-7570
Business Advisory Services | 4© 2015 The Hackett Group, Inc. All rights reserved. Reproduction of this document or any portion thereof without prior written consent is prohibited.
Session objectives
Review the core steps of the strategic sourcing process and deliverables
Review some of the critical enablers for success
Understand the key tools associated with strategic sourcing and a
review on how to apply TCO and Porter’s Analysis
Procurement’s Strategic
Sourcing Process
6© 2015 The Hackett Group, Inc. All rights reserved. Reproduction of this document or any portion thereof without prior written consent is prohibited. 2016 Enterprise Key Issues -PR
Definition of strategic sourcing
Strategic sourcing is an approach to supply chain management that
formalizes the way information is gathered and used so that an
organization can leverage its consolidated purchasing power to find the
best possible values in the marketplace.
Source: whatis.com
7© 2015 The Hackett Group, Inc. All rights reserved. Reproduction of this document or any portion thereof without prior written consent is prohibited. 2016 Enterprise Key Issues -PR
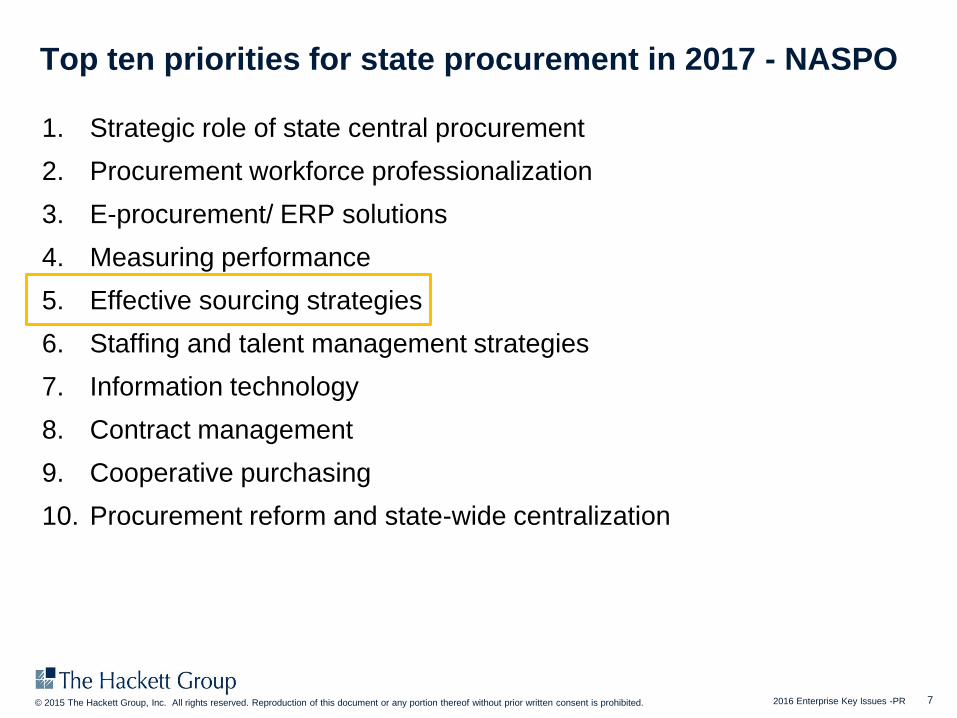
Top ten priorities for state procurement in 2017 - NASPO
1. Strategic role of state central procurement
2. Procurement workforce professionalization
3. E-procurement/ ERP solutions
4. Measuring performance
5. Effective sourcing strategies
6. Staffing and talent management strategies
7. Information technology
8. Contract management
9. Cooperative purchasing
10. Procurement reform and state-wide centralization
Business Advisory Services | 8© 2015 The Hackett Group, Inc. All rights reserved. Reproduction of this document or any portion thereof without prior written consent is prohibited.
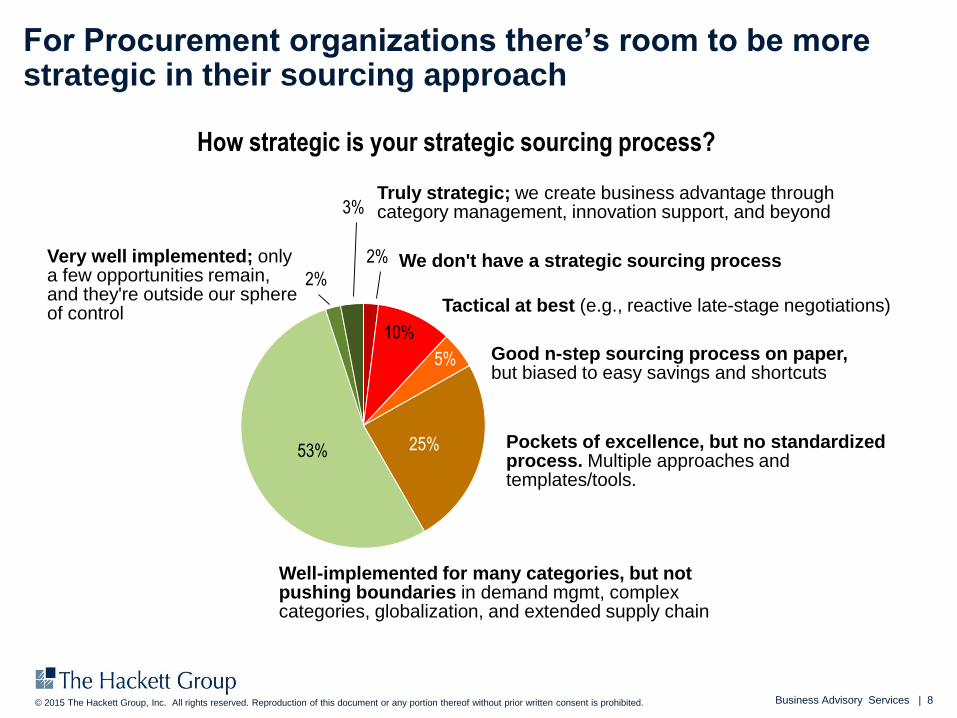
For Procurement organizations there’s room to be more strategic in their sourcing approach
How strategic is your strategic sourcing process?
Well-implemented for many categories, but not pushing boundaries in demand mgmt, complex categories, globalization, and extended supply chain
Pockets of excellence, but no standardized process. Multiple approaches and templates/tools.
Very well implemented; only a few opportunities remain, and they're outside our sphere of control
Truly strategic; we create business advantage through category management, innovation support, and beyond
We don't have a strategic sourcing process
Tactical at best (e.g., reactive late-stage negotiations)
53% 25%
5%
10%
2%
3%
2%
Good n-step sourcing process on paper, but biased to easy savings and shortcuts
Business Advisory Services | 9© 2015 The Hackett Group, Inc. All rights reserved. Reproduction of this document or any portion thereof without prior written consent is prohibited.
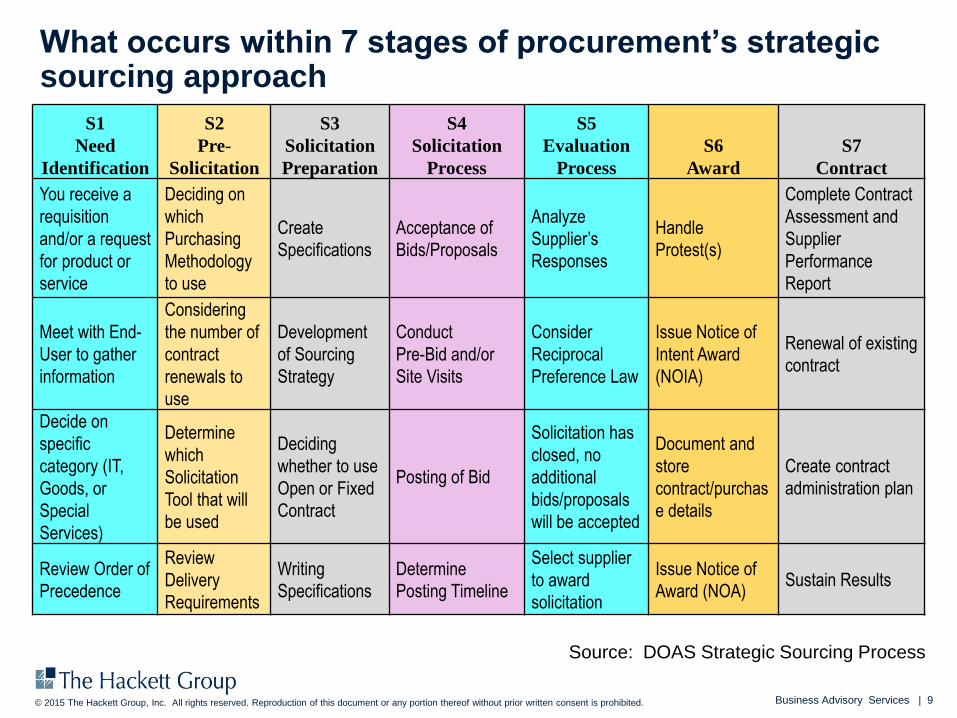
What occurs within 7 stages of procurement’s strategic sourcing approach
S1
Need
Identification
S2
Pre-
Solicitation
S3
Solicitation
Preparation
S4
Solicitation
Process
S5
Evaluation
Process
S6
Award
S7
Contract
You receive a
requisition
and/or a request
for product or
service
Deciding on
which
Purchasing
Methodology
to use
Create
Specifications
Acceptance of
Bids/Proposals
Analyze
Supplier’s
Responses
Handle
Protest(s)
Complete Contract
Assessment and
Supplier
Performance
Report
Meet with End-
User to gather
information
Considering
the number of
contract
renewals to
use
Development
of Sourcing
Strategy
Conduct
Pre-Bid and/or
Site Visits
Consider
Reciprocal
Preference Law
Issue Notice of
Intent Award
(NOIA)
Renewal of existing
contract
Decide on
specific
category (IT,
Goods, or
Special
Services)
Determine
which
Solicitation
Tool that will
be used
Deciding
whether to use
Open or Fixed
Contract
Posting of Bid
Solicitation has
closed, no
additional
bids/proposals
will be accepted
Document and
store
contract/purchas
e details
Create contract
administration plan
Review Order of
Precedence
Review
Delivery
Requirements
Writing
Specifications
Determine
Posting Timeline
Select supplier
to award
solicitation
Issue Notice of
Award (NOA)Sustain Results
Source: DOAS Strategic Sourcing Process
Business Advisory Services | 10© 2015 The Hackett Group, Inc. All rights reserved. Reproduction of this document or any portion thereof without prior written consent is prohibited.
Key
Ob
ject
ive
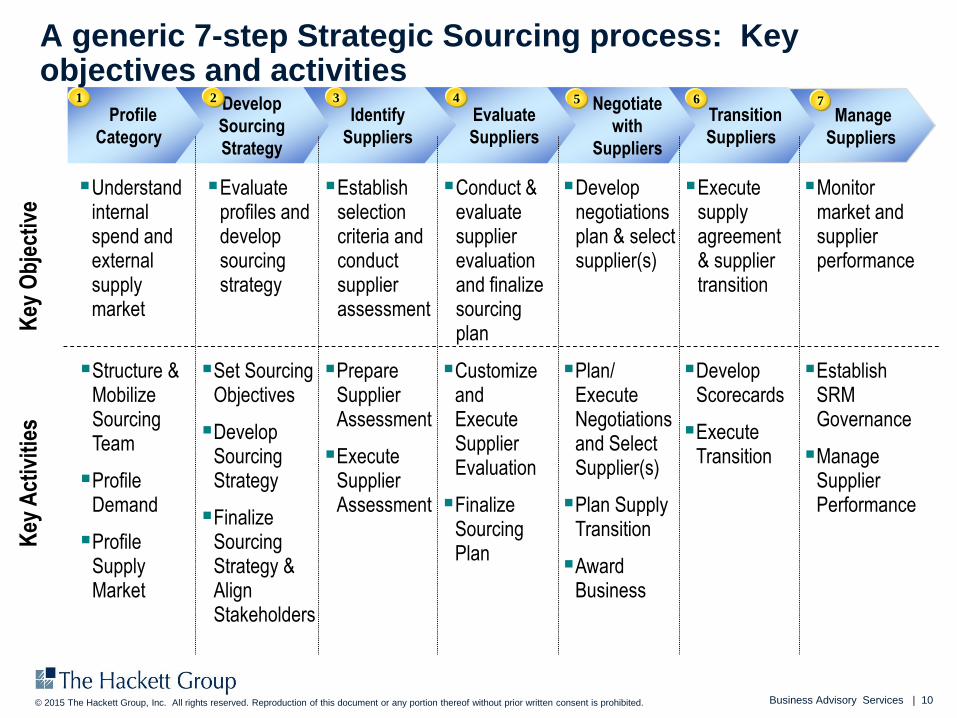
Structure & Mobilize Sourcing Team
Profile Demand
Profile Supply Market
Set Sourcing Objectives
Develop Sourcing Strategy
Finalize Sourcing Strategy & Align Stakeholders
Prepare Supplier Assessment
Execute Supplier Assessment
Customize and Execute Supplier Evaluation
Finalize Sourcing Plan
Plan/ Execute Negotiations and Select Supplier(s)
Plan Supply Transition
Award Business
Develop Scorecards
Execute Transition
Understand internal spend and external supply market
Establish selection criteria and conduct supplier assessment
Conduct & evaluate supplier evaluation and finalize sourcing plan
Develop negotiations plan & select supplier(s)
Execute supply agreement & supplier transition
Evaluate profiles and develop sourcing strategy
Monitor market and supplier performance
Establish SRM Governance
Manage Supplier Performance
Manage
Suppliers
Transition
Suppliers
Negotiate
with
Suppliers
Evaluate
Suppliers
Identify
Suppliers
Develop
Sourcing
Strategy
Profile
Category
1 2 3 4 5 6 7
Key
Act
ivit
ies
A generic 7-step Strategic Sourcing process: Key objectives and activities
Business Advisory Services | 11© 2015 The Hackett Group, Inc. All rights reserved. Reproduction of this document or any portion thereof without prior written consent is prohibited.
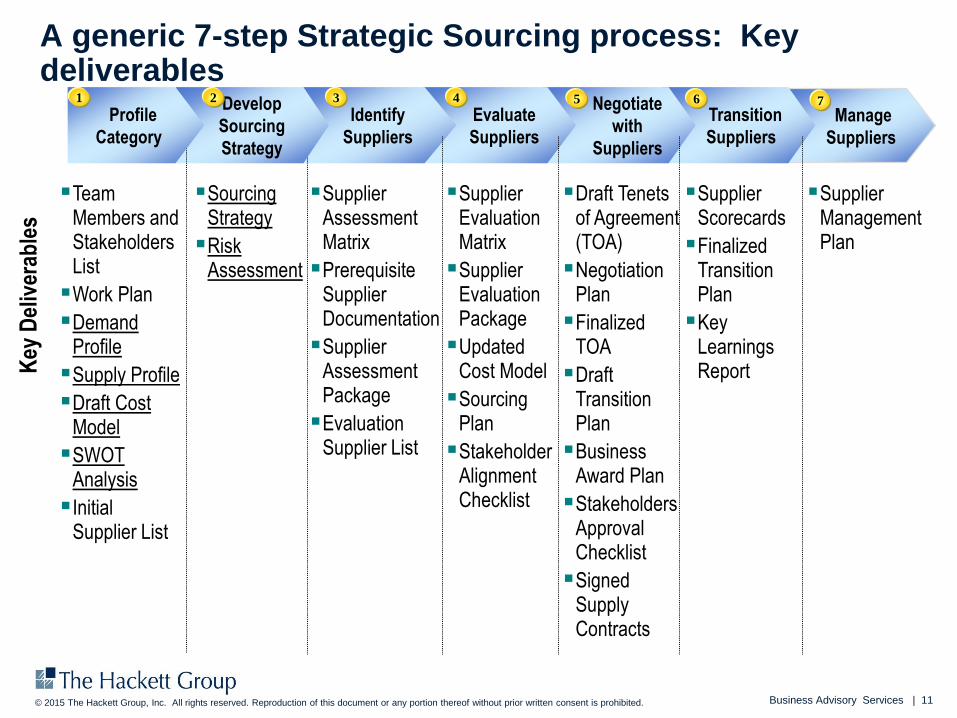
Key
Del
iver
able
s
Team Members and Stakeholders List
Work Plan
Demand Profile
Supply Profile
Draft Cost Model
SWOT Analysis
Initial Supplier List
Supplier Assessment Matrix
Prerequisite Supplier Documentation
Supplier Assessment Package
Evaluation Supplier List
Supplier Evaluation Matrix
Supplier Evaluation Package
Updated Cost Model
Sourcing Plan
Stakeholder Alignment Checklist
Draft Tenets of Agreement (TOA)
Negotiation Plan
Finalized TOA
Draft Transition Plan
Business Award Plan
Stakeholders Approval Checklist
Signed Supply Contracts
Supplier Scorecards
Finalized Transition Plan
Key Learnings Report
Sourcing Strategy
Risk Assessment
Supplier Management Plan
Manage
Suppliers
Transition
Suppliers
Negotiate
with
Suppliers
Evaluate
Suppliers
Identify
Suppliers
3 4 5 6 7
A generic 7-step Strategic Sourcing process: Key deliverables
Develop
Sourcing
Strategy
Profile
Category
1 2
Business Advisory Services | 12© 2015 The Hackett Group, Inc. All rights reserved. Reproduction of this document or any portion thereof without prior written consent is prohibited.
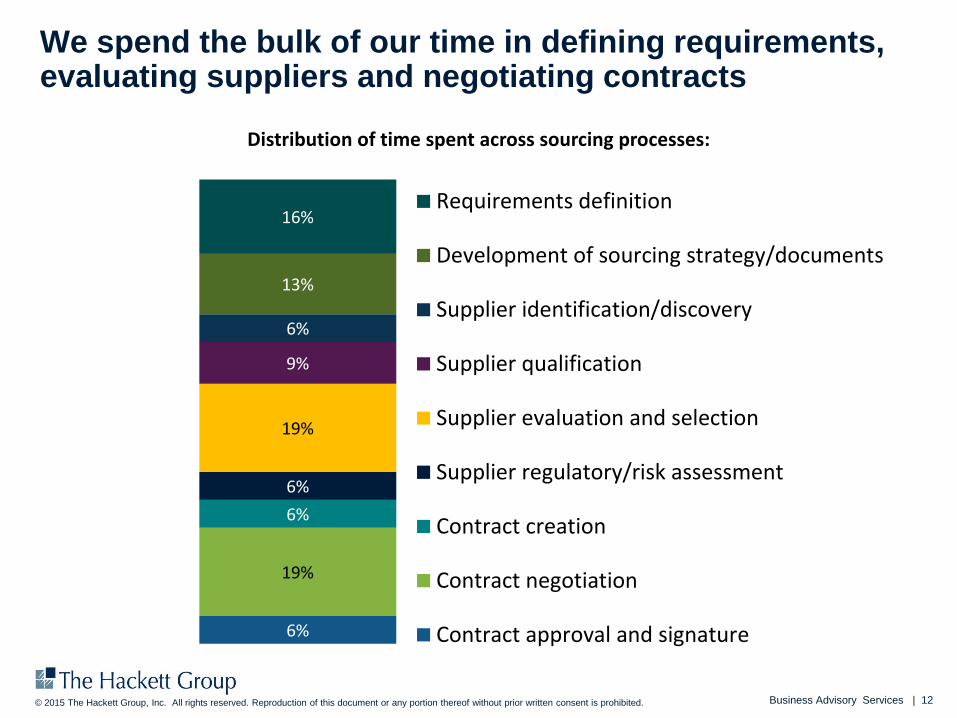
We spend the bulk of our time in defining requirements, evaluating suppliers and negotiating contracts
6%
19%
6%
6%
19%
9%
6%
13%
16%
Distribution of time spent across sourcing processes:
Requirements definition
Development of sourcing strategy/documents
Supplier identification/discovery
Supplier qualification
Supplier evaluation and selection
Supplier regulatory/risk assessment
Contract creation
Contract negotiation
Contract approval and signature
Critical Enablers of the
Strategic Sourcing
Process
Business Advisory Services | 14© 2015 The Hackett Group, Inc. All rights reserved. Reproduction of this document or any portion thereof without prior written consent is prohibited.
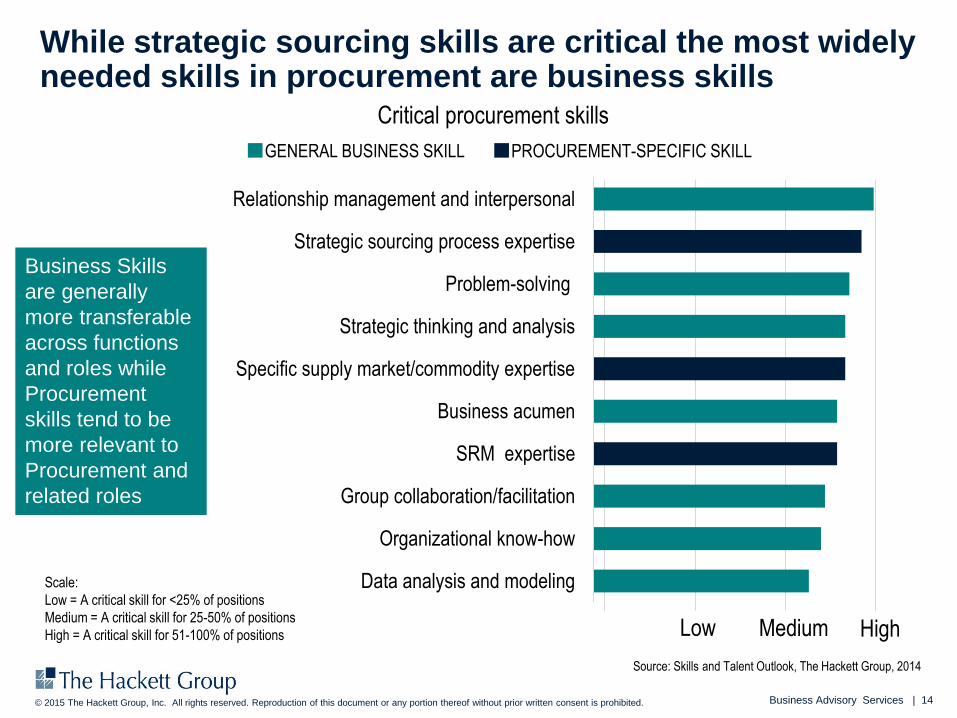
Data analysis and modeling
Organizational know-how
Group collaboration/facilitation
SRM expertise
Business acumen
Specific supply market/commodity expertise
Strategic thinking and analysis
Problem-solving
Strategic sourcing process expertise
Relationship management and interpersonal
Critical procurement skills
While strategic sourcing skills are critical the most widely needed skills in procurement are business skills
Low Medium High
GENERAL BUSINESS SKILL PROCUREMENT-SPECIFIC SKILL
Scale:
Low = A critical skill for <25% of positions
Medium = A critical skill for 25-50% of positions
High = A critical skill for 51-100% of positions
Source: Skills and Talent Outlook, The Hackett Group, 2014
Business Skills
are generally
more transferable
across functions
and roles while
Procurement
skills tend to be
more relevant to
Procurement and
related roles
Business Advisory Services | 15© 2015 The Hackett Group, Inc. All rights reserved. Reproduction of this document or any portion thereof without prior written consent is prohibited.
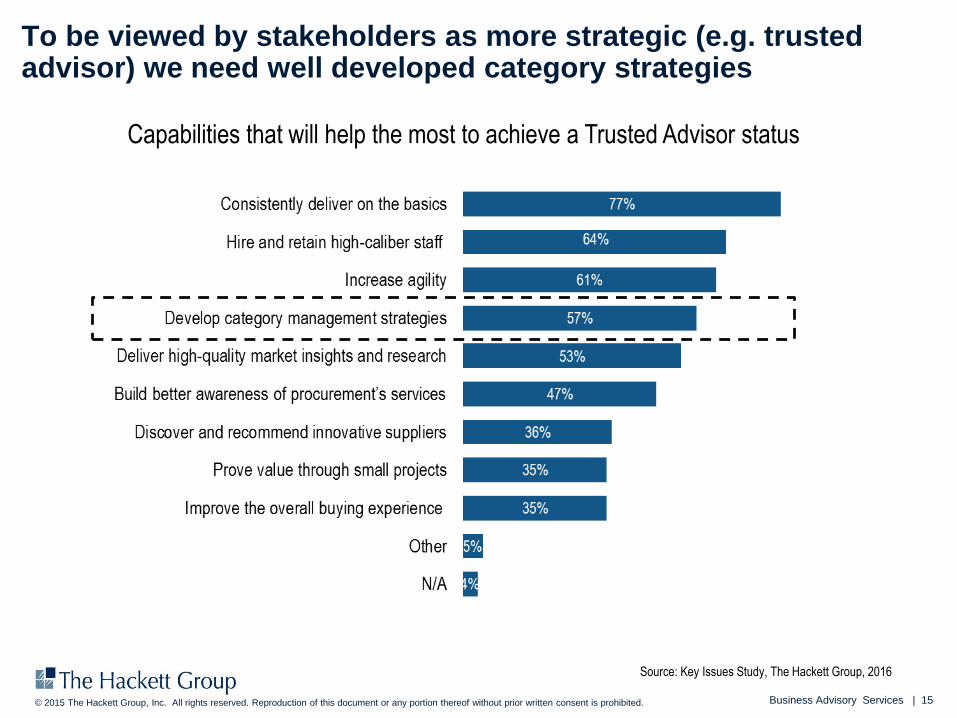
To be viewed by stakeholders as more strategic (e.g. trusted advisor) we need well developed category strategies
Capabilities that will help the most to achieve a Trusted Advisor status
Source: Key Issues Study, The Hackett Group, 2016
Business Advisory Services | 16© 2015 The Hackett Group, Inc. All rights reserved. Reproduction of this document or any portion thereof without prior written consent is prohibited.
Senior
Management
-Category
-RM
-VO
-Supplier
Diversity
Research &
Development
Finance &
LegalOperations
Marketing Team
LeadMember
Member
Member
Member
Member
Sponsor
SME
SME
SME
SME
SME
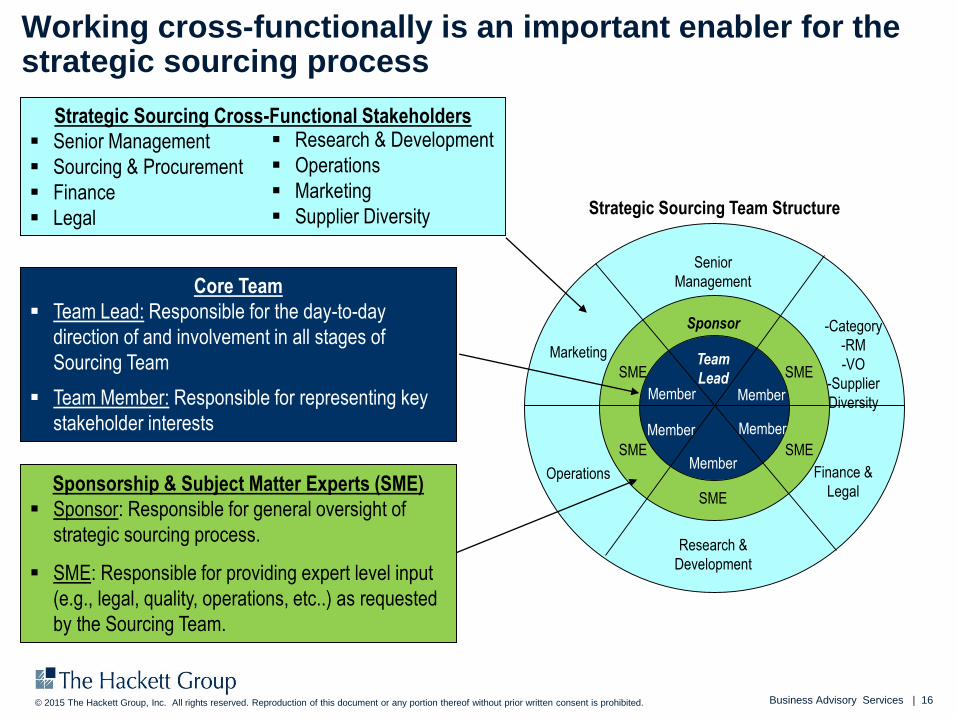
Core Team
Team Lead: Responsible for the day-to-day
direction of and involvement in all stages of
Sourcing Team
Team Member: Responsible for representing key
stakeholder interests
Strategic Sourcing Cross-Functional Stakeholders
Senior Management
Sourcing & Procurement
Finance
LegalStrategic Sourcing Team Structure
Sponsorship & Subject Matter Experts (SME)
Sponsor: Responsible for general oversight of
strategic sourcing process.
SME: Responsible for providing expert level input
(e.g., legal, quality, operations, etc..) as requested
by the Sourcing Team.
Working cross-functionally is an important enabler for the strategic sourcing process
Research & Development
Operations
Marketing
Supplier Diversity
Business Advisory Services | 17© 2015 The Hackett Group, Inc. All rights reserved. Reproduction of this document or any portion thereof without prior written consent is prohibited.
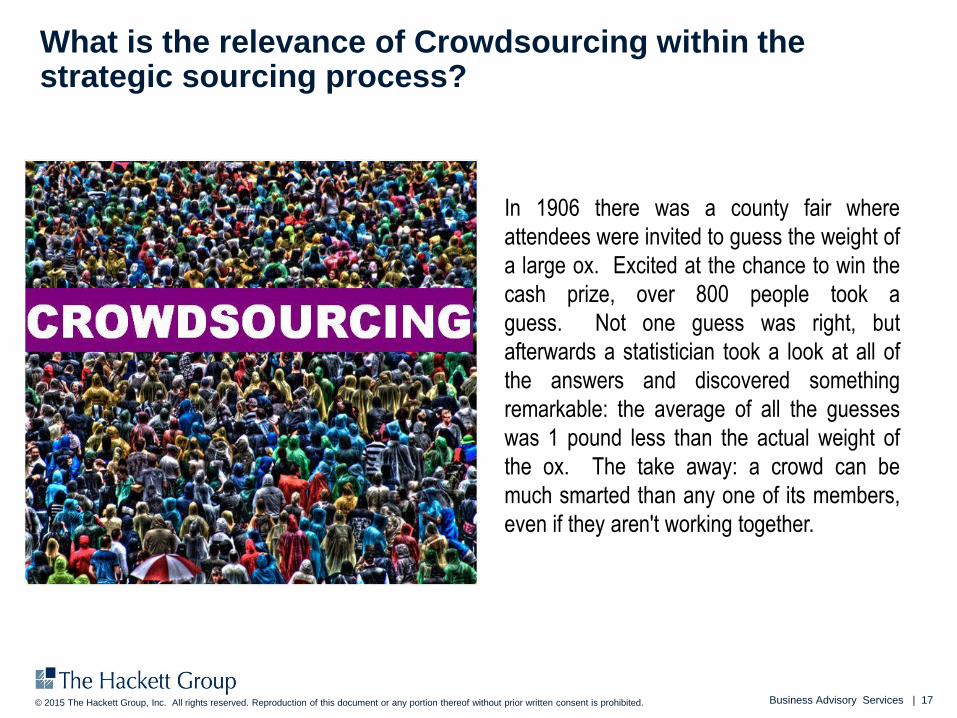
What is the relevance of Crowdsourcing within the strategic sourcing process?
In 1906 there was a county fair where
attendees were invited to guess the weight of
a large ox. Excited at the chance to win the
cash prize, over 800 people took a
guess. Not one guess was right, but
afterwards a statistician took a look at all of
the answers and discovered something
remarkable: the average of all the guesses
was 1 pound less than the actual weight of
the ox. The take away: a crowd can be
much smarted than any one of its members,
even if they aren't working together.
Critical Tools for Taking
a Strategic Approach

Business Advisory Services | 19© 2015 The Hackett Group, Inc. All rights reserved. Reproduction of this document or any portion thereof without prior written consent is prohibited.
Tools that help drive a successful strategic sourcing process
Spend Analysis (Demand Profile)
Market Analysis
Strengths, Weaknesses, Opportunities, and Threats (SWOT)
Total Cost of Ownership (TCO)*
Risk Assessment
Porters Five Forces (Quadrant Analysis)*
*We will walk through an exercise
These tools build upon one another to arrive at the category strategy and are best
applied through facilitated exercises with stakeholders
Business Advisory Services | 20© 2015 The Hackett Group, Inc. All rights reserved. Reproduction of this document or any portion thereof without prior written consent is prohibited.
Desired Output
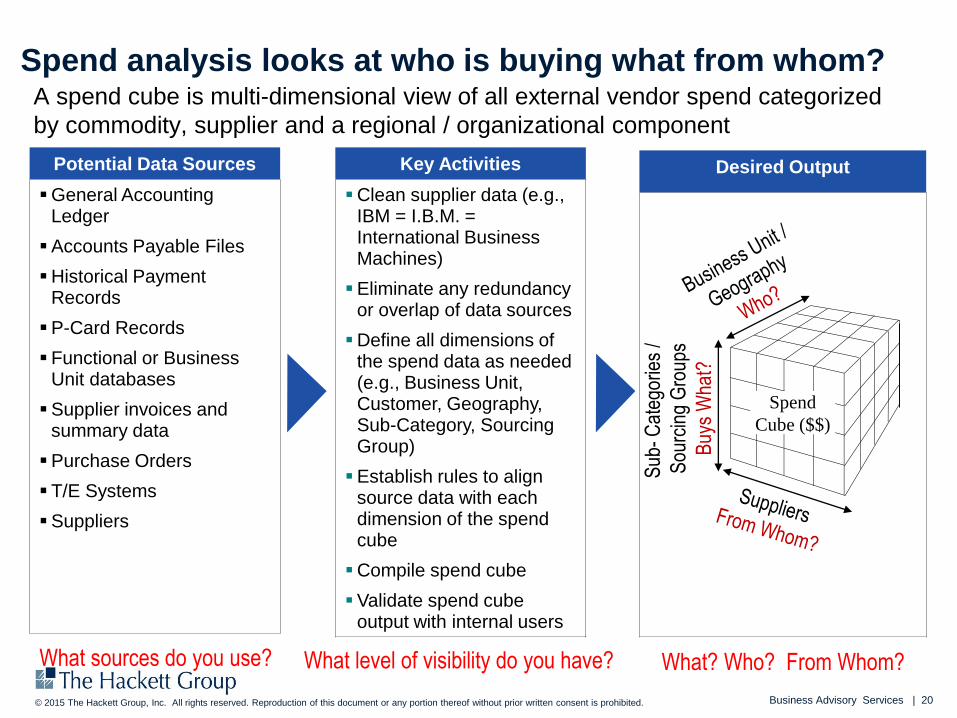
Spend analysis looks at who is buying what from whom?A spend cube is multi-dimensional view of all external vendor spend categorized
by commodity, supplier and a regional / organizational component
Spend
Cube ($$)
Sub
-C
ateg
orie
s /
Sou
rcin
g G
roup
s
Buy
s W
hat?
Potential Data Sources
General Accounting Ledger
Accounts Payable Files
Historical Payment Records
P-Card Records
Functional or Business Unit databases
Supplier invoices and summary data
Purchase Orders
T/E Systems
Suppliers
Key Activities
Clean supplier data (e.g., IBM = I.B.M. = International Business Machines)
Eliminate any redundancy or overlap of data sources
Define all dimensions of the spend data as needed (e.g., Business Unit, Customer, Geography, Sub-Category, Sourcing Group)
Establish rules to align source data with each dimension of the spend cube
Compile spend cube
Validate spend cube output with internal users
What sources do you use? What level of visibility do you have? What? Who? From Whom?
Business Advisory Services | 21© 2015 The Hackett Group, Inc. All rights reserved. Reproduction of this document or any portion thereof without prior written consent is prohibited.
Market analysis seek to understand key aspects of the external supply market that provides the category
1. Industry Level Analysis – explores the trends, technologies,
cost drivers, etc.. of the supply market
2. Supplier Level Analysis – identifies key and niche suppliers,
profiles capabilities, strengths, and weaknesses of suppliers
3. Sourcing Strategy Best Practices – document sourcing
strategy levers being used by other companies with supply
market
Business Advisory Services | 22© 2015 The Hackett Group, Inc. All rights reserved. Reproduction of this document or any portion thereof without prior written consent is prohibited.
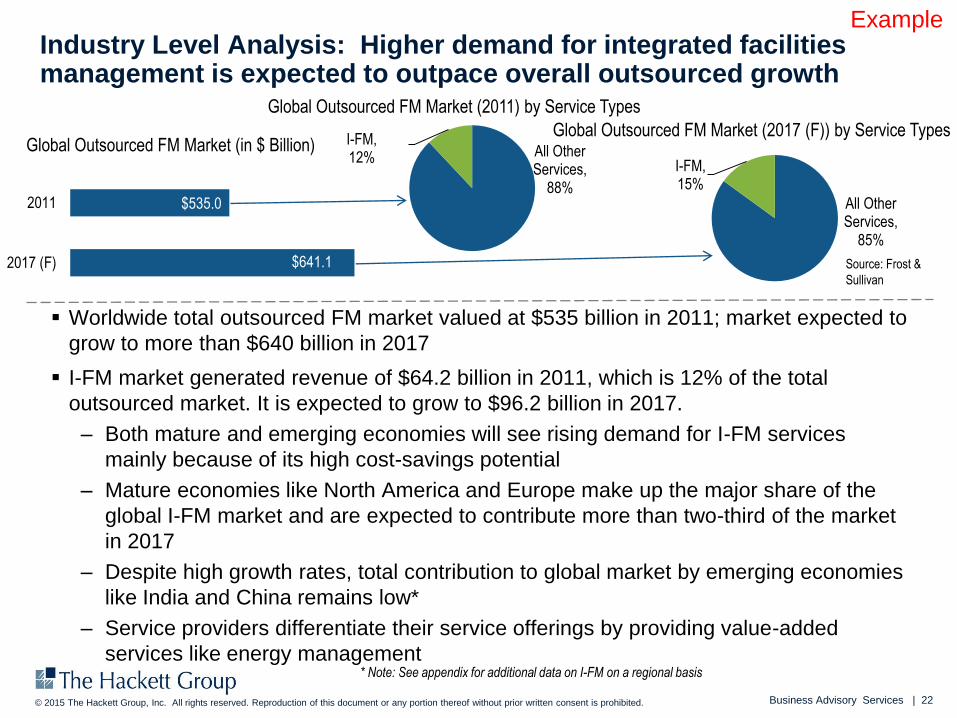
Industry Level Analysis: Higher demand for integrated facilities management is expected to outpace overall outsourced growth
Worldwide total outsourced FM market valued at $535 billion in 2011; market expected to
grow to more than $640 billion in 2017
I-FM market generated revenue of $64.2 billion in 2011, which is 12% of the total
outsourced market. It is expected to grow to $96.2 billion in 2017.
– Both mature and emerging economies will see rising demand for I-FM services
mainly because of its high cost-savings potential
– Mature economies like North America and Europe make up the major share of the
global I-FM market and are expected to contribute more than two-third of the market
in 2017
– Despite high growth rates, total contribution to global market by emerging economies
like India and China remains low*
– Service providers differentiate their service offerings by providing value-added
services like energy management
$535.0
$641.1
2011
2017 (F)
Global Outsourced FM Market (in $ Billion) All Other Services,
88%
I-FM, 12%
All Other Services,
85%
I-FM, 15%
Global Outsourced FM Market (2011) by Service Types
Global Outsourced FM Market (2017 (F)) by Service Types
Source: Frost &
Sullivan
* Note: See appendix for additional data on I-FM on a regional basis
Example
Business Advisory Services | 23© 2015 The Hackett Group, Inc. All rights reserved. Reproduction of this document or any portion thereof without prior written consent is prohibited.
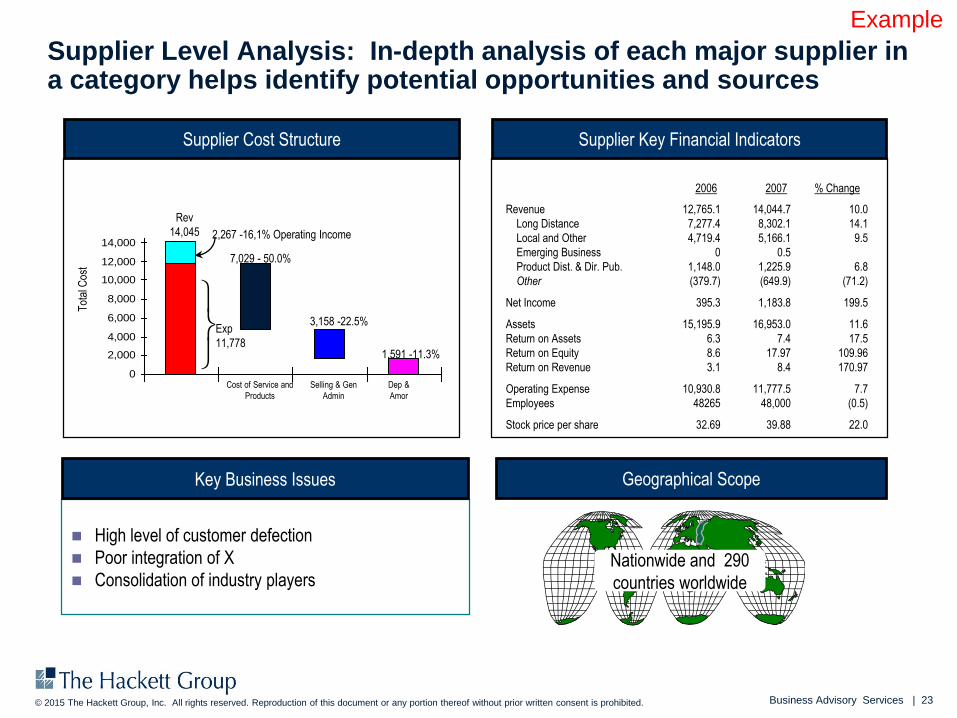
Supplier Level Analysis: In-depth analysis of each major supplier in a category helps identify potential opportunities and sources
0
2,000
4,000
6,000
8,000
10,000
12,000
14,000
Tot
al C
ost
Nationwide and 290
countries worldwide
High level of customer defection
Poor integration of X
Consolidation of industry players
Rev
14,045
Exp
11,778
7,029 - 50.0%
2,267 -16,1% Operating Income
Cost of Service and
Products
Dep &
Amor
Selling & Gen
Admin
3,158 -22.5%
1,591 -11.3%
12,765.1
7,277.4
4,719.4
0
1,148.0
(379.7)
395.3
15,195.9
6.3
8.6
3.1
10,930.8
48265
32.69
Revenue
Long Distance
Local and Other
Emerging Business
Product Dist. & Dir. Pub.
Other
Net Income
Assets
Return on Assets
Return on Equity
Return on Revenue
Operating Expense
Employees
Stock price per share
2006 2007 % Change
14,044.7
8,302.1
5,166.1
0.5
1,225.9
(649.9)
1,183.8
16,953.0
7.4
17.97
8.4
11,777.5
48,000
39.88
10.0
14.1
9.5
6.8
(71.2)
199.5
11.6
17.5
109.96
170.97
7.7
(0.5)
22.0
Key Business Issues
Supplier Cost Structure Supplier Key Financial Indicators
Geographical Scope
Example
Business Advisory Services | 24© 2015 The Hackett Group, Inc. All rights reserved. Reproduction of this document or any portion thereof without prior written consent is prohibited.
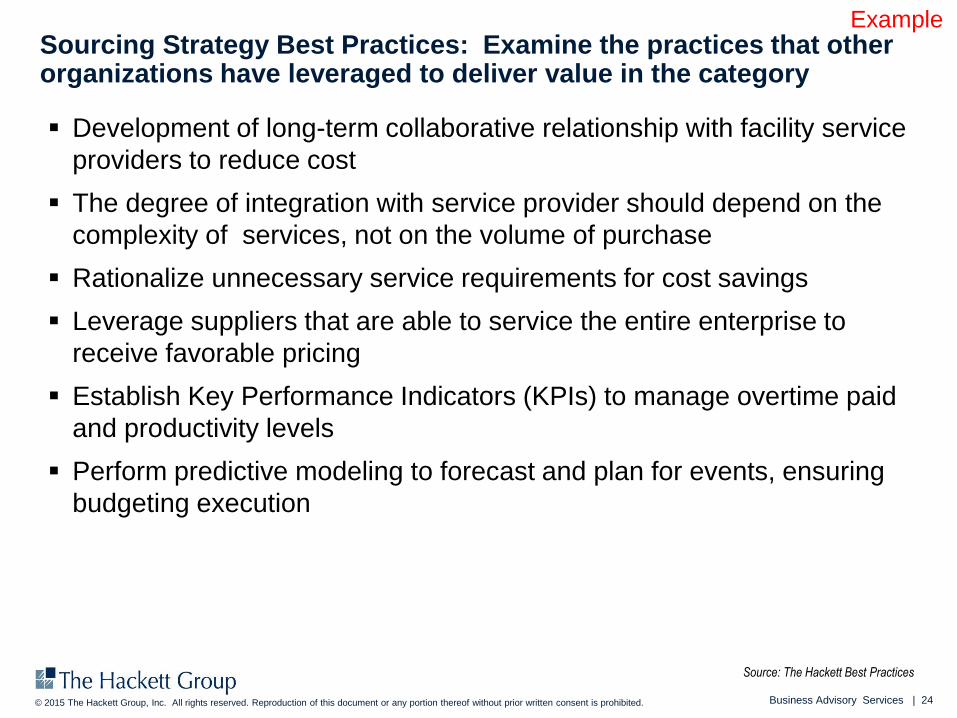
Sourcing Strategy Best Practices: Examine the practices that other organizations have leveraged to deliver value in the category
Source: The Hackett Best Practices
Development of long-term collaborative relationship with facility service
providers to reduce cost
The degree of integration with service provider should depend on the
complexity of services, not on the volume of purchase
Rationalize unnecessary service requirements for cost savings
Leverage suppliers that are able to service the entire enterprise to
receive favorable pricing
Establish Key Performance Indicators (KPIs) to manage overtime paid
and productivity levels
Perform predictive modeling to forecast and plan for events, ensuring
budgeting execution
Example
Business Advisory Services | 25© 2015 The Hackett Group, Inc. All rights reserved. Reproduction of this document or any portion thereof without prior written consent is prohibited.
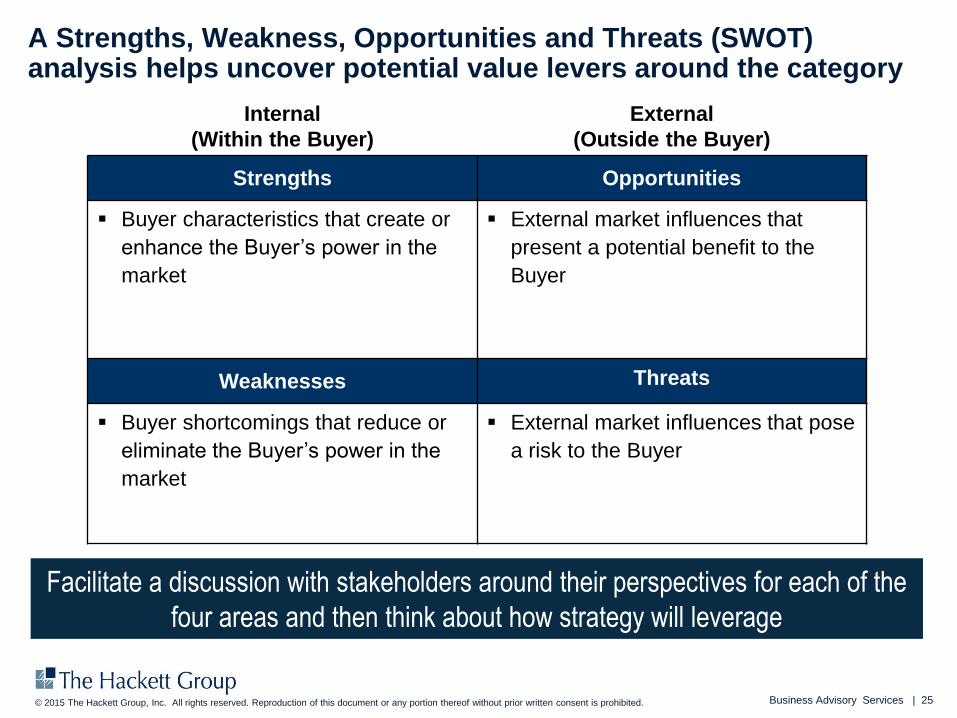
Internal
(Within the Buyer)
External
(Outside the Buyer)
Strengths Opportunities
Buyer characteristics that create or
enhance the Buyer’s power in the
market
External market influences that
present a potential benefit to the
Buyer
Weaknesses Threats
Buyer shortcomings that reduce or
eliminate the Buyer’s power in the
market
External market influences that pose
a risk to the Buyer
A Strengths, Weakness, Opportunities and Threats (SWOT) analysis helps uncover potential value levers around the category
Facilitate a discussion with stakeholders around their perspectives for each of the
four areas and then think about how strategy will leverage
Business Advisory Services | 26© 2015 The Hackett Group, Inc. All rights reserved. Reproduction of this document or any portion thereof without prior written consent is prohibited.
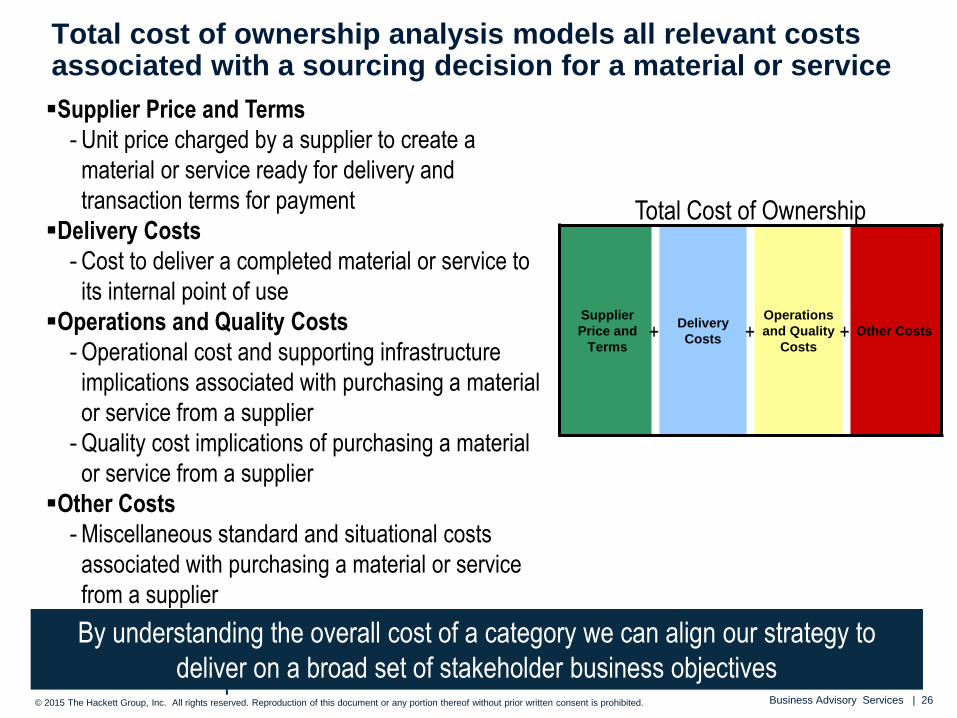
Total cost of ownership analysis models all relevant costs associated with a sourcing decision for a material or service
Supplier Price and Terms
- Unit price charged by a supplier to create a
material or service ready for delivery and
transaction terms for payment
Delivery Costs
- Cost to deliver a completed material or service to
its internal point of use
Operations and Quality Costs
- Operational cost and supporting infrastructure
implications associated with purchasing a material
or service from a supplier
- Quality cost implications of purchasing a material
or service from a supplier
Other Costs
- Miscellaneous standard and situational costs
associated with purchasing a material or service
from a supplier
Supplier
Price and
Terms
Delivery
Costs
Operations
and Quality
Costs
Other Costs
Total Cost of Ownership
+ ++
By understanding the overall cost of a category we can align our strategy to
deliver on a broad set of stakeholder business objectives
Business Advisory Services | 27© 2015 The Hackett Group, Inc. All rights reserved. Reproduction of this document or any portion thereof without prior written consent is prohibited.
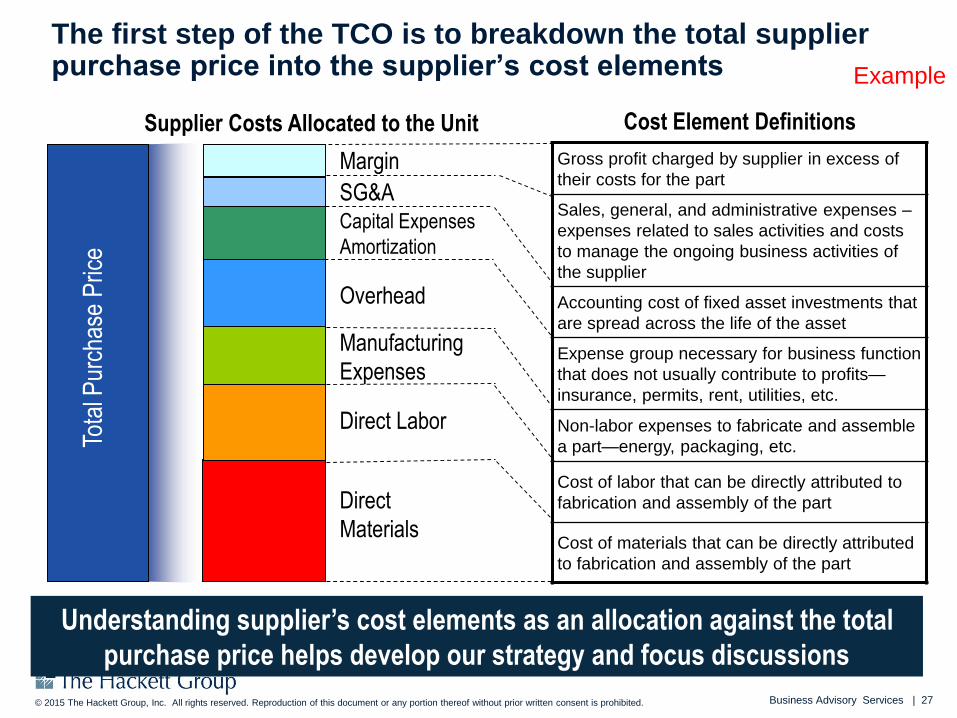
The first step of the TCO is to breakdown the total supplier purchase price into the supplier’s cost elements
Direct
Materials
Direct Labor
Manufacturing
Expenses
Capital Expenses
Amortization
Overhead
SG&A
Margin
Tota
l Pur
chas
e P
rice
Gross profit charged by supplier in excess of
their costs for the part
Sales, general, and administrative expenses –
expenses related to sales activities and costs
to manage the ongoing business activities of
the supplier
Accounting cost of fixed asset investments that
are spread across the life of the asset
Expense group necessary for business function
that does not usually contribute to profits—
insurance, permits, rent, utilities, etc.
Non-labor expenses to fabricate and assemble
a part—energy, packaging, etc.
Cost of labor that can be directly attributed to
fabrication and assembly of the part
Cost of materials that can be directly attributed
to fabrication and assembly of the part
Cost Element DefinitionsSupplier Costs Allocated to the Unit
Example
Understanding supplier’s cost elements as an allocation against the total
purchase price helps develop our strategy and focus discussions
Business Advisory Services | 28© 2015 The Hackett Group, Inc. All rights reserved. Reproduction of this document or any portion thereof without prior written consent is prohibited.
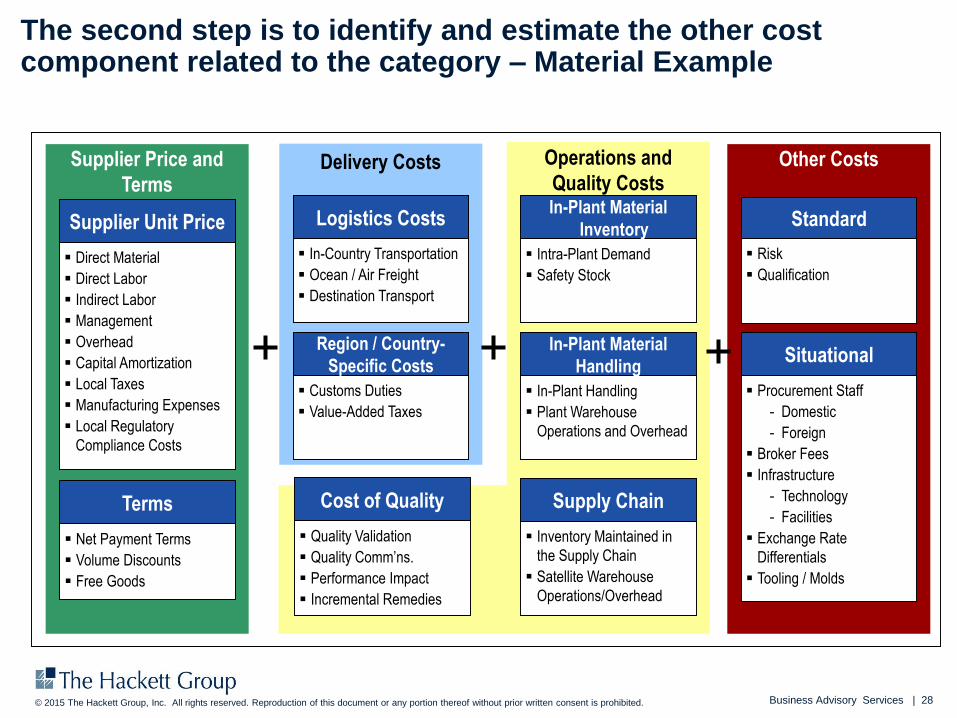
The second step is to identify and estimate the other cost component related to the category – Material Example
Direct Material
Direct Labor
Indirect Labor
Management
Overhead
Capital Amortization
Local Taxes
Manufacturing Expenses
Local Regulatory
Compliance Costs
Supplier Unit Price
In-Country Transportation
Ocean / Air Freight
Destination Transport
Logistics Costs
Customs Duties
Value-Added Taxes
Region / Country-
Specific Costs
Quality Validation
Quality Comm’ns.
Performance Impact
Incremental Remedies
Cost of Quality
Intra-Plant Demand
Safety Stock
In-Plant Material
Inventory
In-Plant Handling
Plant Warehouse
Operations and Overhead
In-Plant Material
Handling
Inventory Maintained in
the Supply Chain
Satellite Warehouse
Operations/Overhead
Supply Chain
Risk
Qualification
Standard
Procurement Staff
- Domestic
- Foreign
Broker Fees
Infrastructure
- Technology
- Facilities
Exchange Rate
Differentials
Tooling / Molds
Situational
Supplier Price and
TermsDelivery Costs Operations and
Quality CostsOther Costs
Net Payment Terms
Volume Discounts
Free Goods
Terms
Business Advisory Services | 29© 2015 The Hackett Group, Inc. All rights reserved. Reproduction of this document or any portion thereof without prior written consent is prohibited.
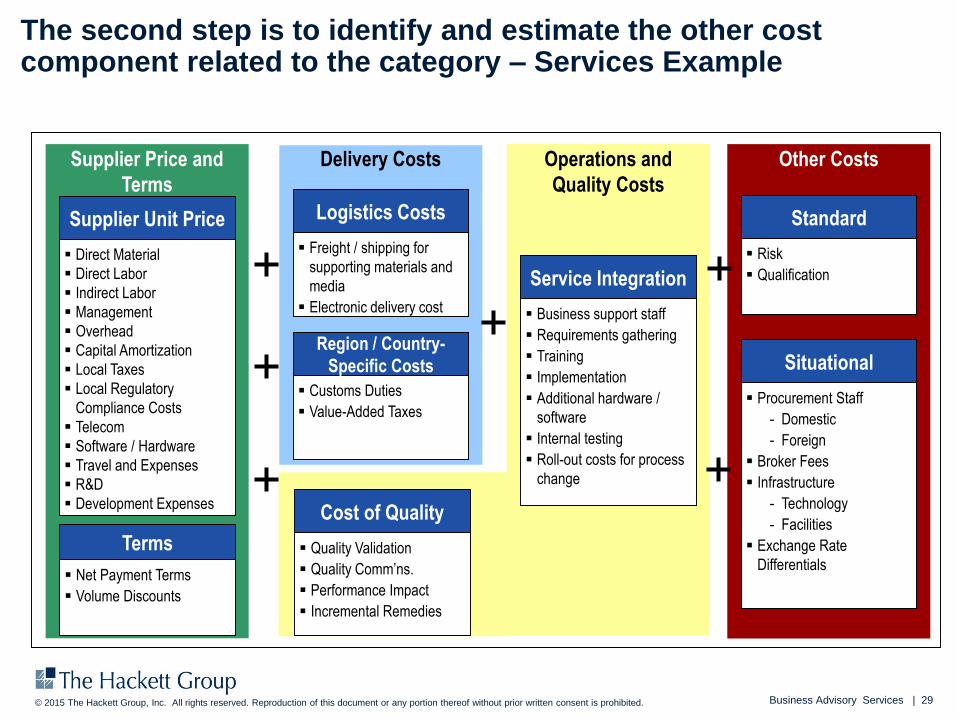
The second step is to identify and estimate the other cost component related to the category – Services Example
Direct Material
Direct Labor
Indirect Labor
Management
Overhead
Capital Amortization
Local Taxes
Local Regulatory
Compliance Costs
Telecom
Software / Hardware
Travel and Expenses
R&D
Development Expenses
Supplier Unit Price
Freight / shipping for
supporting materials and
media
Electronic delivery cost
Logistics Costs
Customs Duties
Value-Added Taxes
Region / Country-
Specific Costs
Quality Validation
Quality Comm’ns.
Performance Impact
Incremental Remedies
Cost of Quality
Business support staff
Requirements gathering
Training
Implementation
Additional hardware /
software
Internal testing
Roll-out costs for process
change
Service Integration
Supplier Price and
Terms
Delivery Costs Operations and
Quality Costs
Other Costs
Risk
Qualification
Standard
Procurement Staff
- Domestic
- Foreign
Broker Fees
Infrastructure
- Technology
- Facilities
Exchange Rate
Differentials
Situational
Net Payment Terms
Volume Discounts
Terms
Business Advisory Services | 30© 2015 The Hackett Group, Inc. All rights reserved. Reproduction of this document or any portion thereof without prior written consent is prohibited.
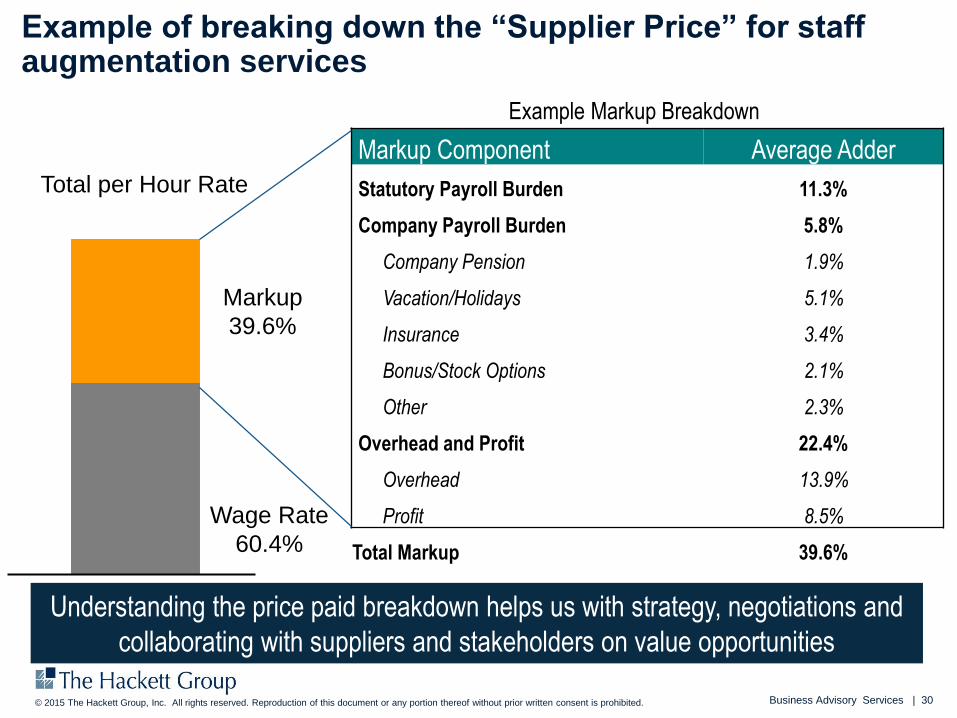
Example of breaking down the “Supplier Price” for staff augmentation services
Markup Component Average Adder
Statutory Payroll Burden 11.3%
Company Payroll Burden 5.8%
Company Pension 1.9%
Vacation/Holidays 5.1%
Insurance 3.4%
Bonus/Stock Options 2.1%
Other 2.3%
Overhead and Profit 22.4%
Overhead 13.9%
Profit 8.5%
Total Markup 39.6%
Example Markup Breakdown
Markup
39.6%
Wage Rate
60.4%
Total per Hour Rate
Understanding the price paid breakdown helps us with strategy, negotiations and
collaborating with suppliers and stakeholders on value opportunities
Business Advisory Services | 31© 2015 The Hackett Group, Inc. All rights reserved. Reproduction of this document or any portion thereof without prior written consent is prohibited.
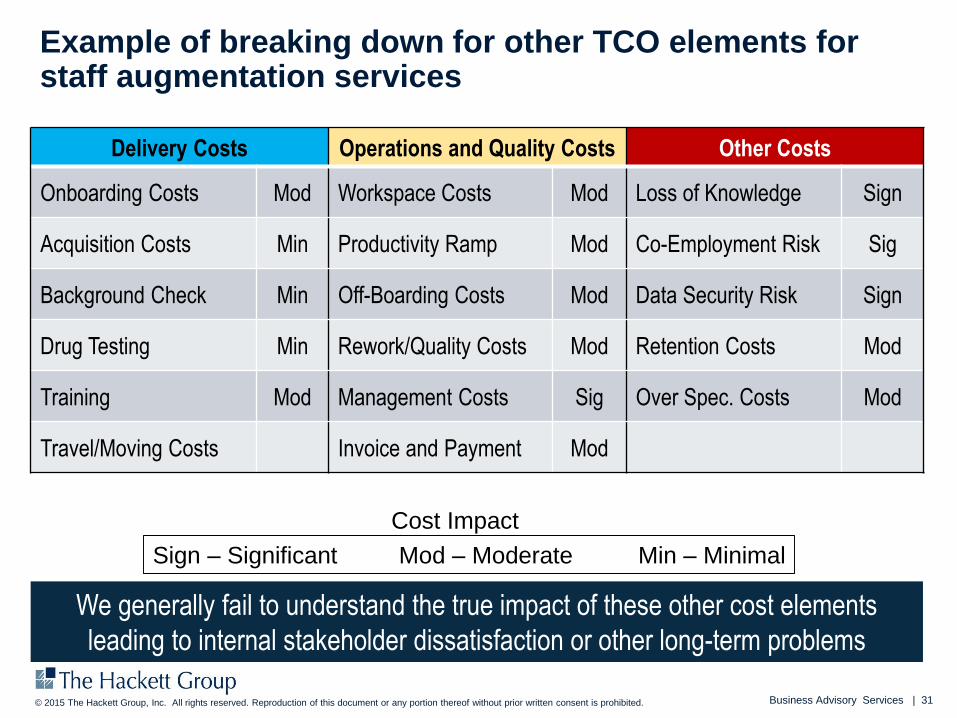
Example of breaking down for other TCO elements for staff augmentation services
Delivery Costs Operations and Quality Costs Other Costs
Onboarding Costs Mod Workspace Costs Mod Loss of Knowledge Sign
Acquisition Costs Min Productivity Ramp Mod Co-Employment Risk Sig
Background Check Min Off-Boarding Costs Mod Data Security Risk Sign
Drug Testing Min Rework/Quality Costs Mod Retention Costs Mod
Training Mod Management Costs Sig Over Spec. Costs Mod
Travel/Moving Costs Invoice and Payment Mod
We generally fail to understand the true impact of these other cost elements
leading to internal stakeholder dissatisfaction or other long-term problems
Sign – Significant Mod – Moderate Min – Minimal
Cost Impact
Business Advisory Services | 32© 2015 The Hackett Group, Inc. All rights reserved. Reproduction of this document or any portion thereof without prior written consent is prohibited.
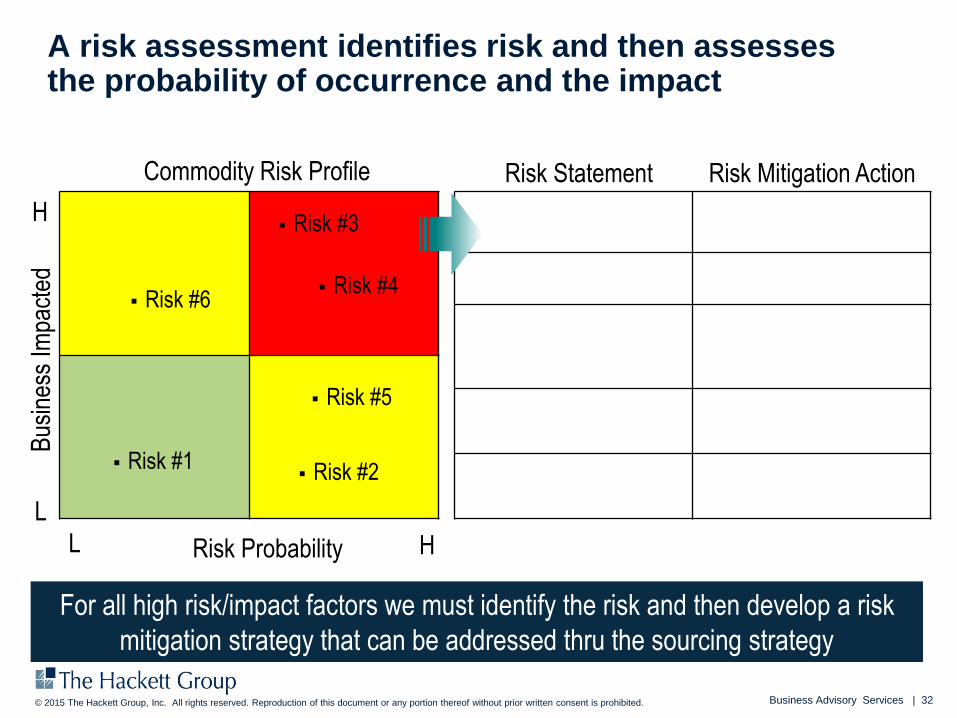
A risk assessment identifies risk and then assesses the probability of occurrence and the impact
Commodity Risk Profile
H
L
L H
Bus
ines
s Im
pact
ed
Risk Probability
Risk Statement
Risk #3
Risk #4
Risk Mitigation Action
Risk #1 Risk #2
Risk #5
Risk #6
For all high risk/impact factors we must identify the risk and then develop a risk
mitigation strategy that can be addressed thru the sourcing strategy
Business Advisory Services | 33© 2015 The Hackett Group, Inc. All rights reserved. Reproduction of this document or any portion thereof without prior written consent is prohibited.
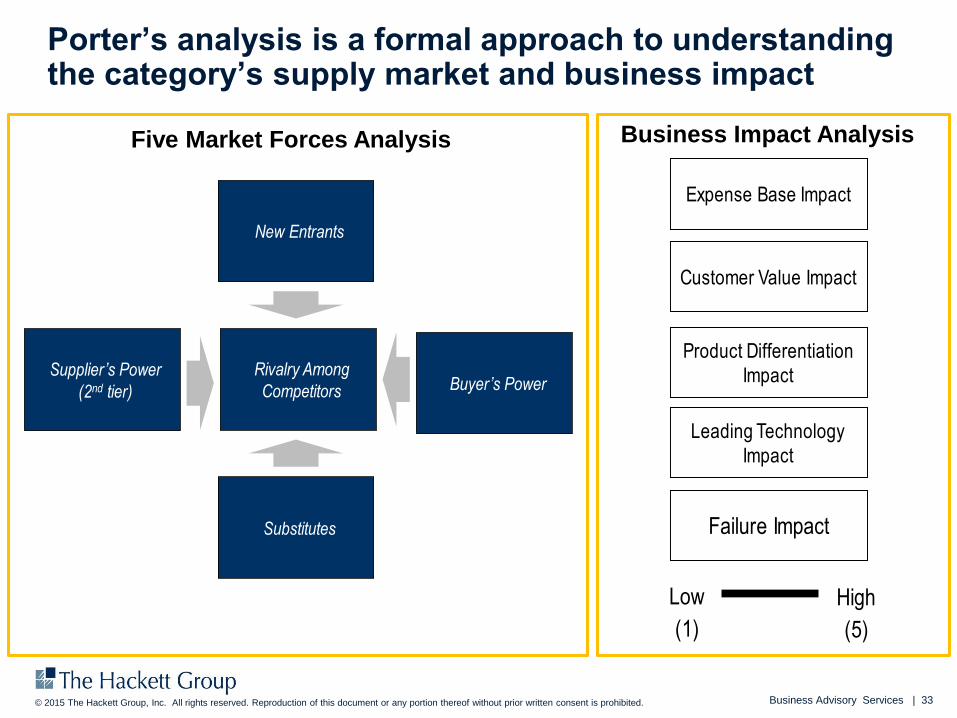
Porter’s analysis is a formal approach to understanding the category’s supply market and business impact
Five Market Forces Analysis
Rivalry Among
Competitors
New Entrants
Supplier’s Power
(2nd tier) Buyer’s Power
Substitutes
Low
(1)
High
(5)
Expense Base Impact
Customer Value Impact
Product Differentiation
Impact
Leading Technology
Impact
Failure Impact
Business Impact Analysis
Business Advisory Services | 34© 2015 The Hackett Group, Inc. All rights reserved. Reproduction of this document or any portion thereof without prior written consent is prohibited.
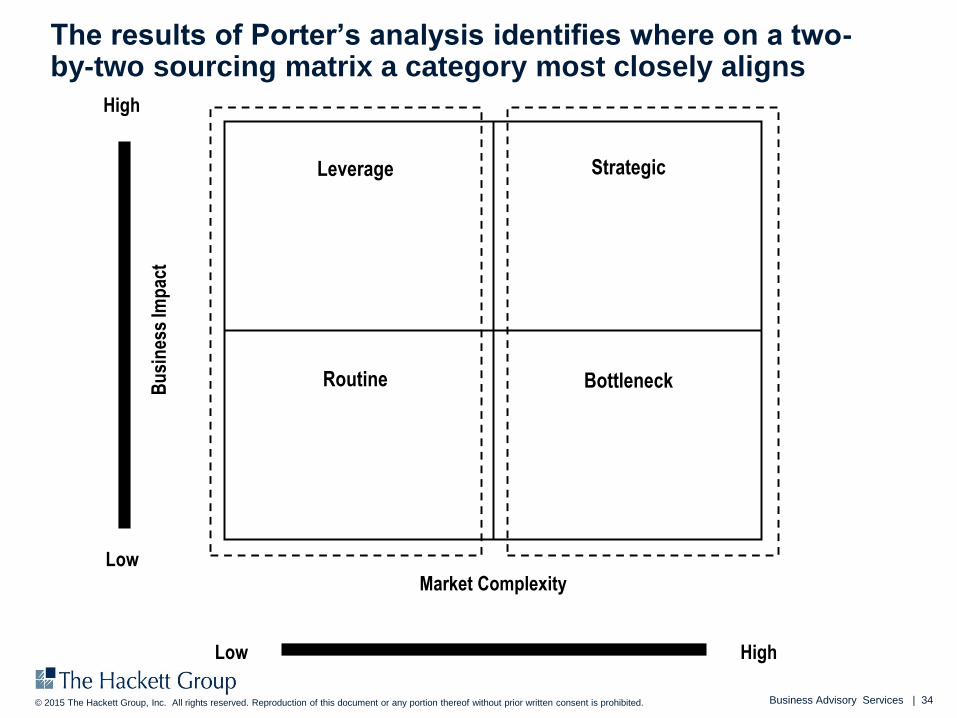
The results of Porter’s analysis identifies where on a two-by-two sourcing matrix a category most closely aligns
High
Low
Bu
sin
ess
Imp
act
HighLow
Market Complexity
CategoryPerformance Management
CategoryStrategyExecution
CategoryGovernance
CategoryStrategy
CategorySegmentation
Strategic
BottleneckRoutine
Leverage
Business Advisory Services | 35© 2015 The Hackett Group, Inc. All rights reserved. Reproduction of this document or any portion thereof without prior written consent is prohibited.
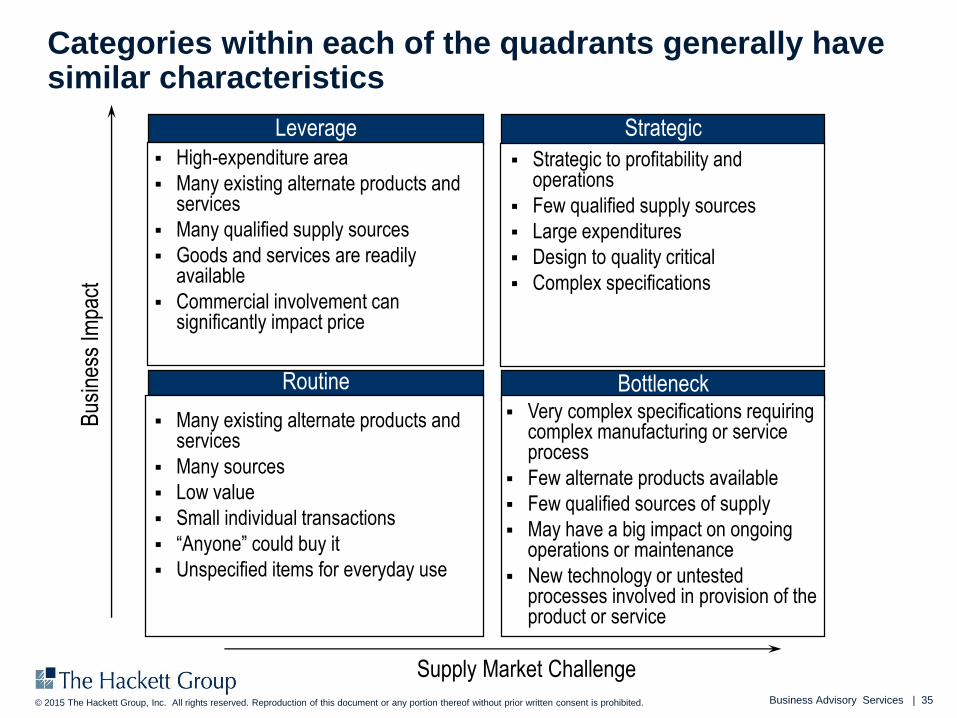
Categories within each of the quadrants generally have similar characteristics
Routine
Many existing alternate products and services
Many sources
Low value
Small individual transactions
“Anyone” could buy it
Unspecified items for everyday use
Leverage
High-expenditure area
Many existing alternate products and services
Many qualified supply sources
Goods and services are readily available
Commercial involvement can significantly impact price
Strategic
Strategic to profitability and operations
Few qualified supply sources
Large expenditures
Design to quality critical
Complex specifications
Bottleneck Very complex specifications requiring
complex manufacturing or service process
Few alternate products available
Few qualified sources of supply
May have a big impact on ongoing operations or maintenance
New technology or untested processes involved in provision of the product or service
Bus
ines
s Im
pact
Supply Market Challenge
Business Advisory Services | 36© 2015 The Hackett Group, Inc. All rights reserved. Reproduction of this document or any portion thereof without prior written consent is prohibited.
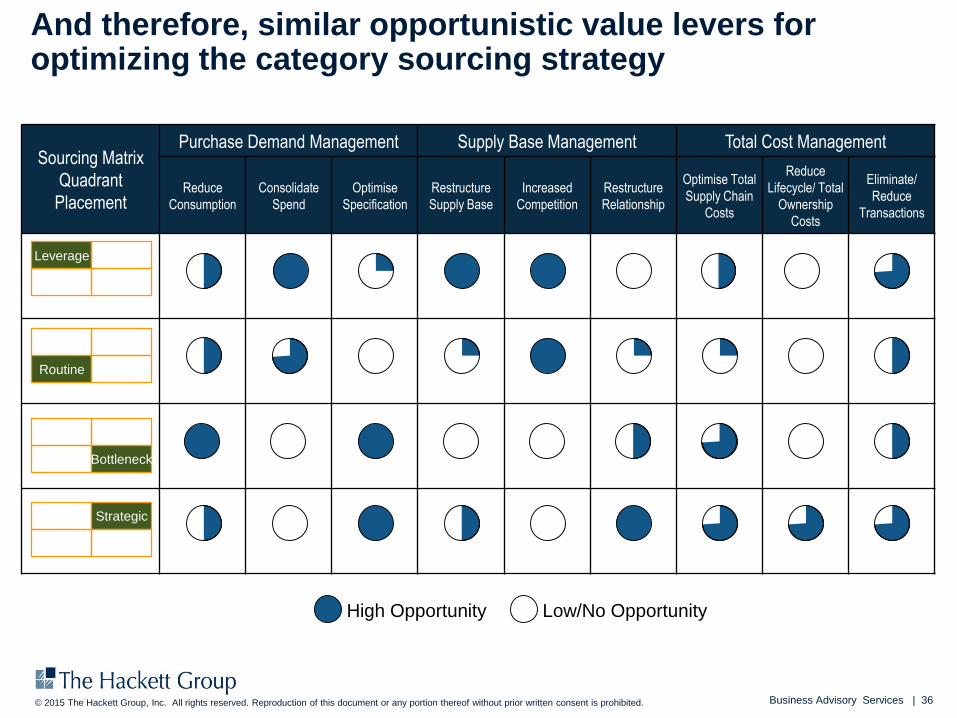
And therefore, similar opportunistic value levers for optimizing the category sourcing strategy
High Opportunity Low/No Opportunity
Sourcing Matrix
Quadrant
Placement
Purchase Demand Management Supply Base Management Total Cost Management
Reduce
Consumption
Consolidate
Spend
Optimise
Specification
Restructure
Supply Base
Increased
Competition
Restructure
Relationship
Optimise Total
Supply Chain
Costs
Reduce
Lifecycle/ Total
Ownership
Costs
Eliminate/
Reduce
Transactions
Leverage
Routine
Bottleneck
Strategic
Business Advisory Services | 37© 2015 The Hackett Group, Inc. All rights reserved. Reproduction of this document or any portion thereof without prior written consent is prohibited.
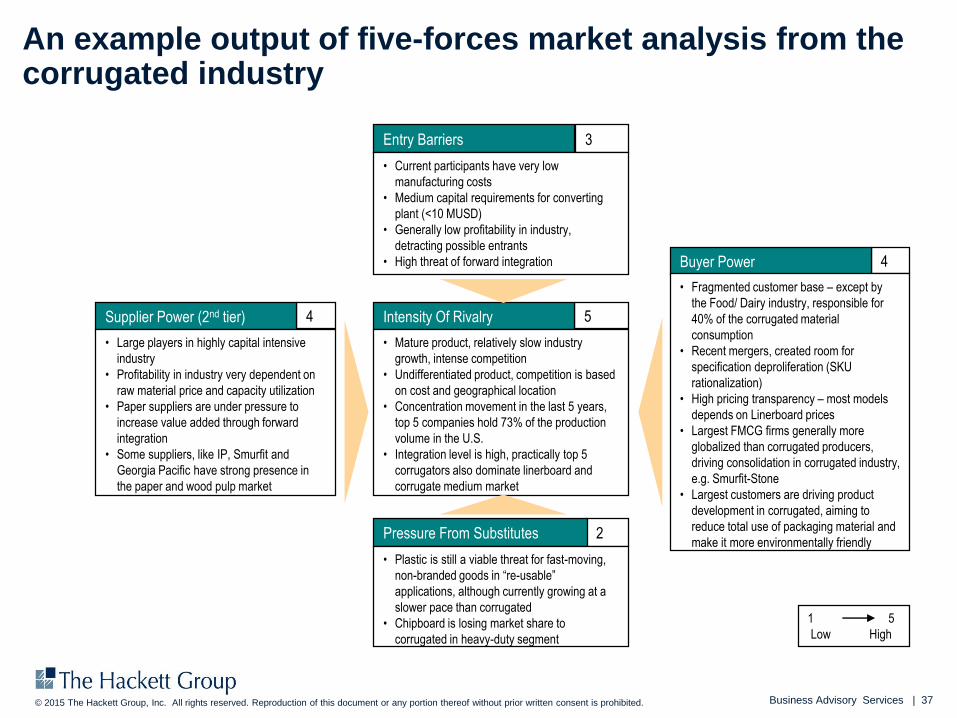
An example output of five-forces market analysis from the corrugated industry
3Entry Barriers
• Current participants have very low
manufacturing costs
• Medium capital requirements for converting
plant (<10 MUSD)
• Generally low profitability in industry,
detracting possible entrants
• High threat of forward integration
5Intensity Of Rivalry
• Mature product, relatively slow industry
growth, intense competition
• Undifferentiated product, competition is based
on cost and geographical location
• Concentration movement in the last 5 years,
top 5 companies hold 73% of the production
volume in the U.S.
• Integration level is high, practically top 5
corrugators also dominate linerboard and
corrugate medium market
2Pressure From Substitutes
• Plastic is still a viable threat for fast-moving,
non-branded goods in “re-usable”
applications, although currently growing at a
slower pace than corrugated
• Chipboard is losing market share to
corrugated in heavy-duty segment
4Supplier Power (2nd tier)
• Large players in highly capital intensive
industry
• Profitability in industry very dependent on
raw material price and capacity utilization
• Paper suppliers are under pressure to
increase value added through forward
integration
• Some suppliers, like IP, Smurfit and
Georgia Pacific have strong presence in
the paper and wood pulp market
4Buyer Power
• Fragmented customer base – except by
the Food/ Dairy industry, responsible for
40% of the corrugated material
consumption
• Recent mergers, created room for
specification deproliferation (SKU
rationalization)
• High pricing transparency – most models
depends on Linerboard prices
• Largest FMCG firms generally more
globalized than corrugated producers,
driving consolidation in corrugated industry,
e.g. Smurfit-Stone
• Largest customers are driving product
development in corrugated, aiming to
reduce total use of packaging material and
make it more environmentally friendly
Low High
1 5
Business Advisory Services | 38© 2015 The Hackett Group, Inc. All rights reserved. Reproduction of this document or any portion thereof without prior written consent is prohibited.
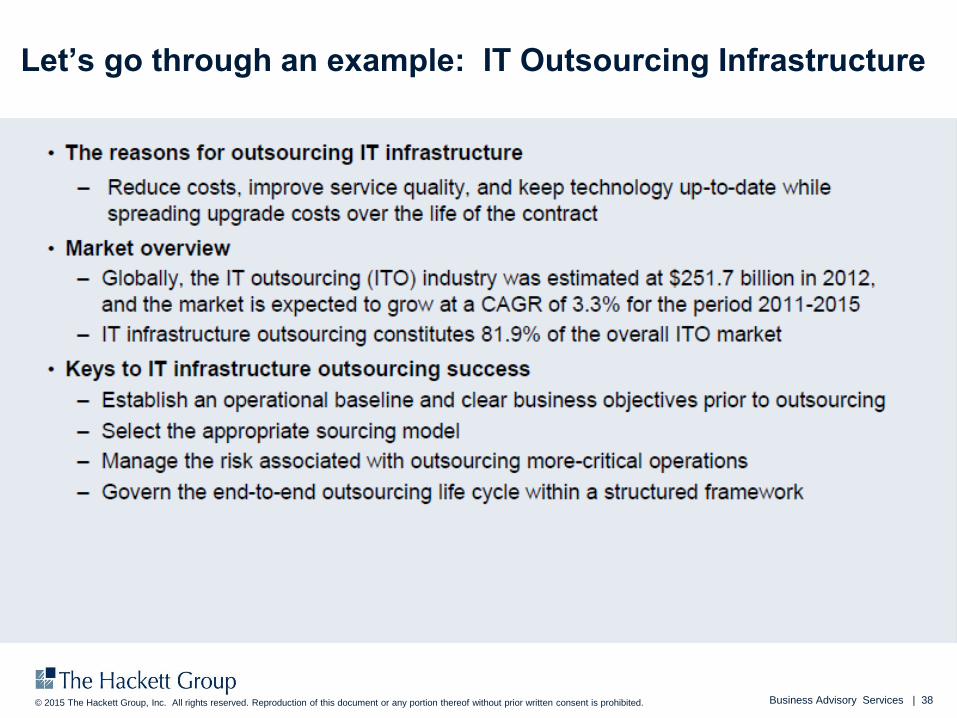
Let’s go through an example: IT Outsourcing Infrastructure
Business Advisory Services | 39© 2015 The Hackett Group, Inc. All rights reserved. Reproduction of this document or any portion thereof without prior written consent is prohibited.
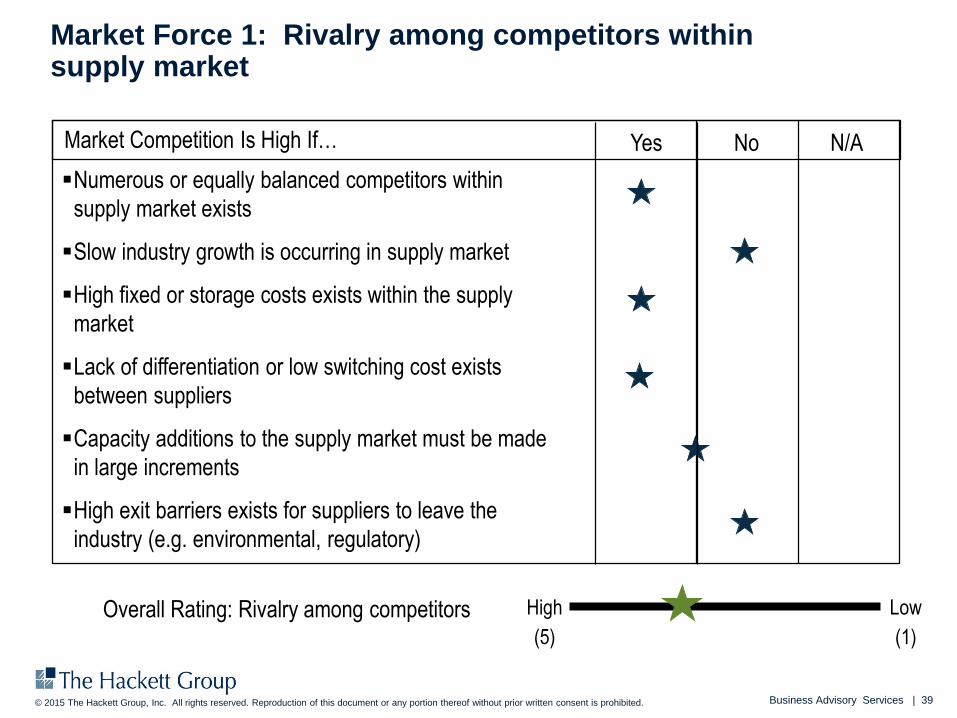
Market Force 1: Rivalry among competitors within supply market
Market Competition Is High If…
Numerous or equally balanced competitors within
supply market exists
Slow industry growth is occurring in supply market
High fixed or storage costs exists within the supply
market
Lack of differentiation or low switching cost exists
between suppliers
Capacity additions to the supply market must be made
in large increments
High exit barriers exists for suppliers to leave the
industry (e.g. environmental, regulatory)
High
(5)
Low
(1)
Yes No N/A
Overall Rating: Rivalry among competitors
Business Advisory Services | 40© 2015 The Hackett Group, Inc. All rights reserved. Reproduction of this document or any portion thereof without prior written consent is prohibited.
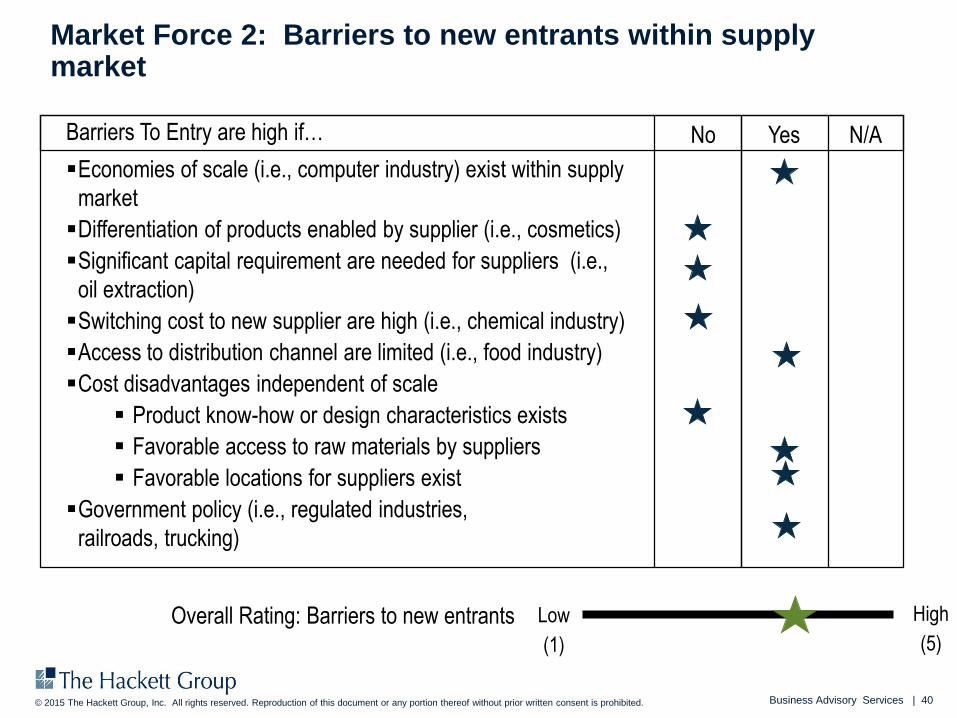
Market Force 2: Barriers to new entrants within supply market
Barriers To Entry are high if…
Economies of scale (i.e., computer industry) exist within supply
market
Differentiation of products enabled by supplier (i.e., cosmetics)
Significant capital requirement are needed for suppliers (i.e.,
oil extraction)
Switching cost to new supplier are high (i.e., chemical industry)
Access to distribution channel are limited (i.e., food industry)
Cost disadvantages independent of scale
Product know-how or design characteristics exists
Favorable access to raw materials by suppliers
Favorable locations for suppliers exist
Government policy (i.e., regulated industries,
railroads, trucking)
Overall Rating: Barriers to new entrants Low
(1)
High
(5)
No Yes N/A
Business Advisory Services | 41© 2015 The Hackett Group, Inc. All rights reserved. Reproduction of this document or any portion thereof without prior written consent is prohibited.
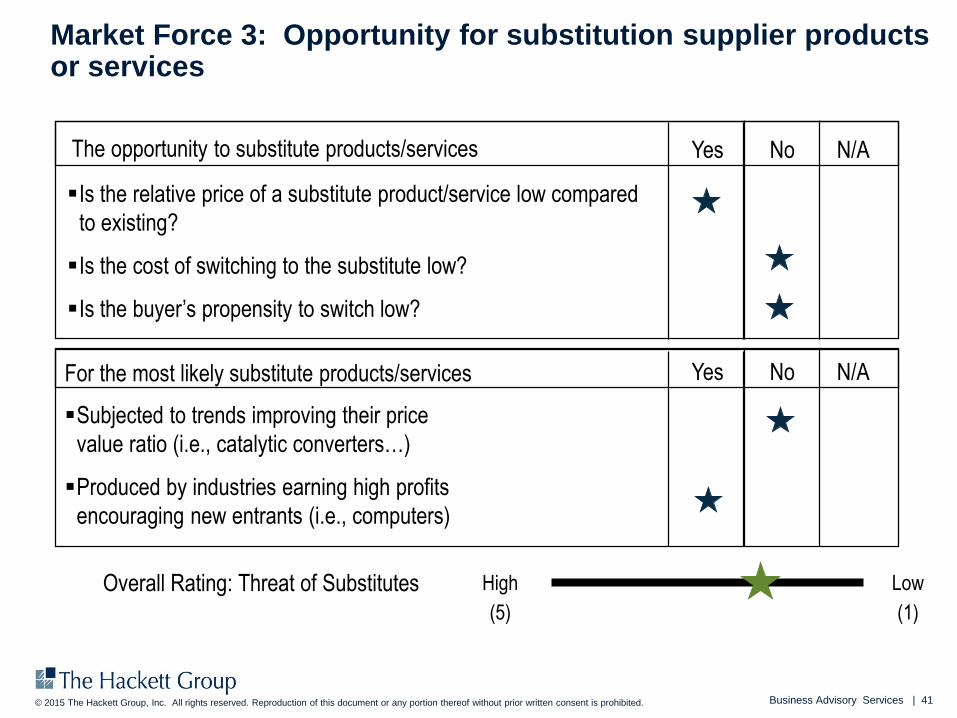
Market Force 3: Opportunity for substitution supplier products or services
The opportunity to substitute products/services
Is the relative price of a substitute product/service low compared
to existing?
Is the cost of switching to the substitute low?
Is the buyer’s propensity to switch low?
Overall Rating: Threat of Substitutes High
(5)
Low
(1)
Yes No N/A
For the most likely substitute products/services
Subjected to trends improving their price
value ratio (i.e., catalytic converters…)
Produced by industries earning high profits
encouraging new entrants (i.e., computers)
Yes No N/A
Business Advisory Services | 42© 2015 The Hackett Group, Inc. All rights reserved. Reproduction of this document or any portion thereof without prior written consent is prohibited.
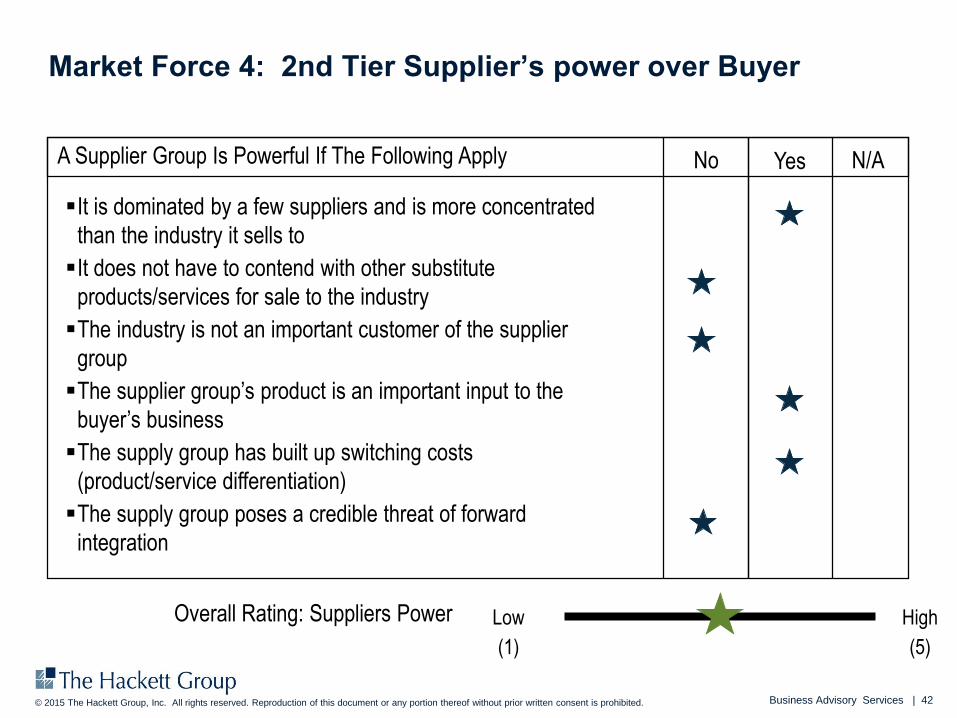
Market Force 4: 2nd Tier Supplier’s power over Buyer
A Supplier Group Is Powerful If The Following Apply
It is dominated by a few suppliers and is more concentrated
than the industry it sells to
It does not have to contend with other substitute
products/services for sale to the industry
The industry is not an important customer of the supplier
group
The supplier group’s product is an important input to the
buyer’s business
The supply group has built up switching costs
(product/service differentiation)
The supply group poses a credible threat of forward
integration
Overall Rating: Suppliers Power Low
(1)
High
(5)
No Yes N/A
Business Advisory Services | 43© 2015 The Hackett Group, Inc. All rights reserved. Reproduction of this document or any portion thereof without prior written consent is prohibited.
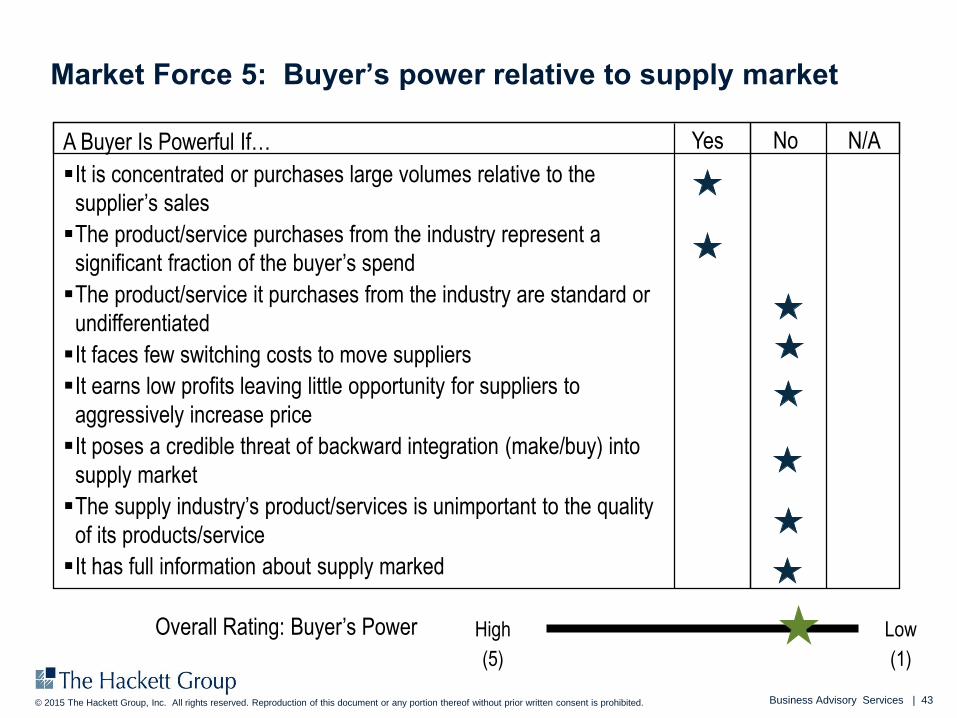
Market Force 5: Buyer’s power relative to supply market
A Buyer Is Powerful If…
It is concentrated or purchases large volumes relative to the
supplier’s sales
The product/service purchases from the industry represent a
significant fraction of the buyer’s spend
The product/service it purchases from the industry are standard or
undifferentiated
It faces few switching costs to move suppliers
It earns low profits leaving little opportunity for suppliers to
aggressively increase price
It poses a credible threat of backward integration (make/buy) into
supply market
The supply industry’s product/services is unimportant to the quality
of its products/service
It has full information about supply marked
High
(5)
Low
(1)
Yes No N/A
Overall Rating: Buyer’s Power
Business Advisory Services | 44© 2015 The Hackett Group, Inc. All rights reserved. Reproduction of this document or any portion thereof without prior written consent is prohibited.
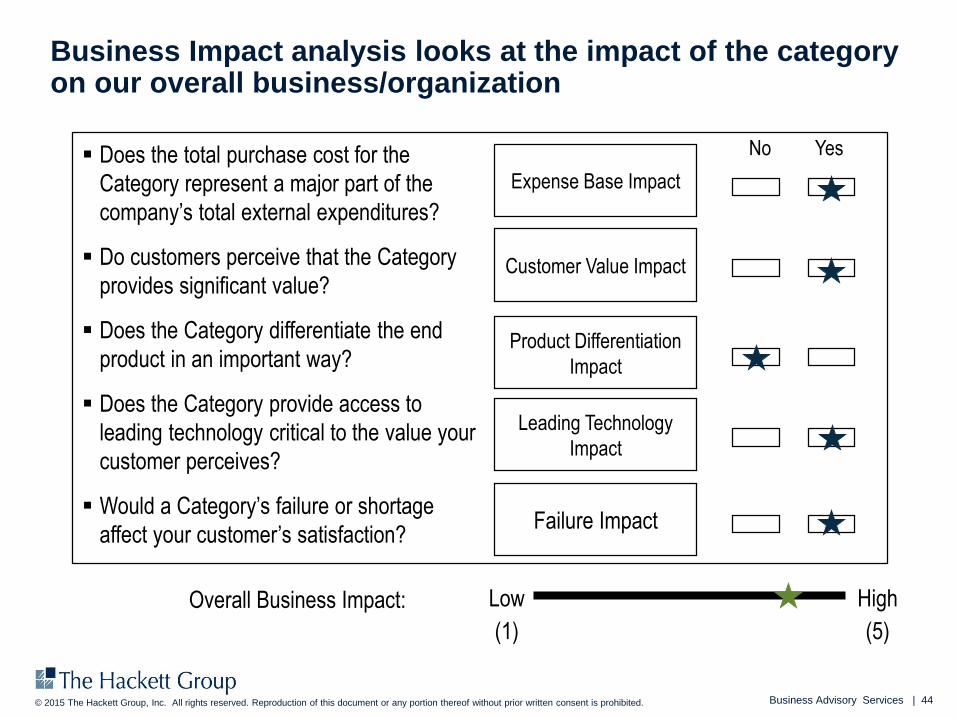
Business Impact analysis looks at the impact of the category on our overall business/organization
Overall Business Impact: Low
(1)
High
(5)
Does the total purchase cost for the
Category represent a major part of the
company’s total external expenditures?
Do customers perceive that the Category
provides significant value?
Does the Category differentiate the end
product in an important way?
Does the Category provide access to
leading technology critical to the value your
customer perceives?
Would a Category’s failure or shortage
affect your customer’s satisfaction?
Expense Base Impact
Customer Value Impact
Product Differentiation
Impact
Leading Technology
Impact
Failure Impact
No Yes
Business Advisory Services | 45© 2015 The Hackett Group, Inc. All rights reserved. Reproduction of this document or any portion thereof without prior written consent is prohibited.
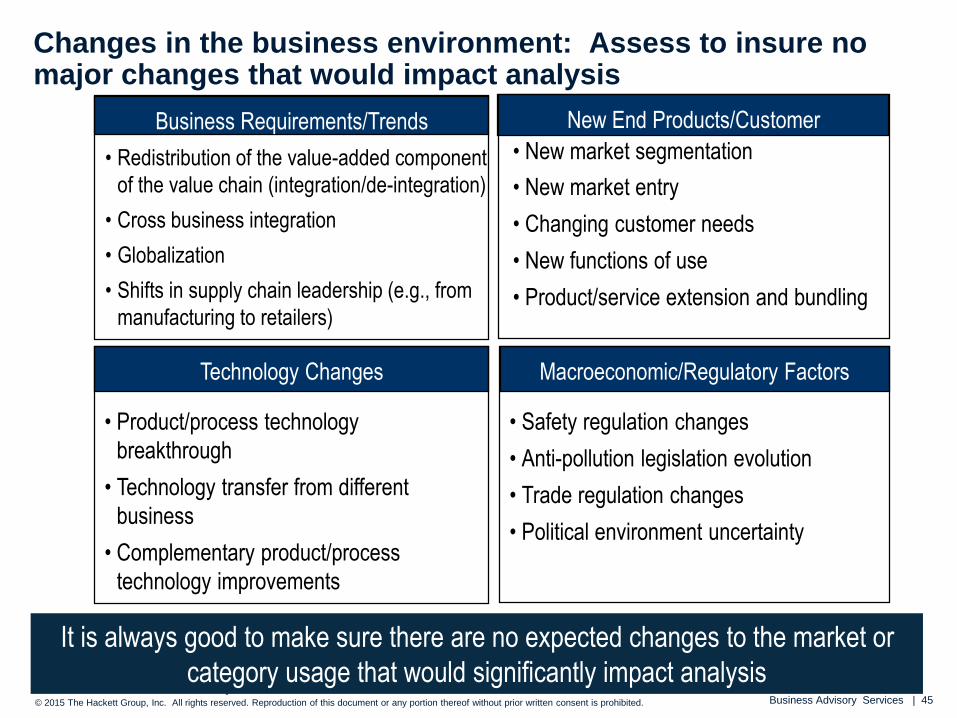
Changes in the business environment: Assess to insure no major changes that would impact analysis
Business Requirements/Trends New End Products/Customer
Requirements
Macroeconomic/Regulatory FactorsTechnology Changes
• Redistribution of the value-added component
of the value chain (integration/de-integration)
• Cross business integration
• Globalization
• Shifts in supply chain leadership (e.g., from
manufacturing to retailers)
• New market segmentation
• New market entry
• Changing customer needs
• New functions of use
• Product/service extension and bundling
• Product/process technology
breakthrough
• Technology transfer from different
business
• Complementary product/process
technology improvements
• Safety regulation changes
• Anti-pollution legislation evolution
• Trade regulation changes
• Political environment uncertainty
It is always good to make sure there are no expected changes to the market or
category usage that would significantly impact analysis
Business Advisory Services | 46© 2015 The Hackett Group, Inc. All rights reserved. Reproduction of this document or any portion thereof without prior written consent is prohibited.
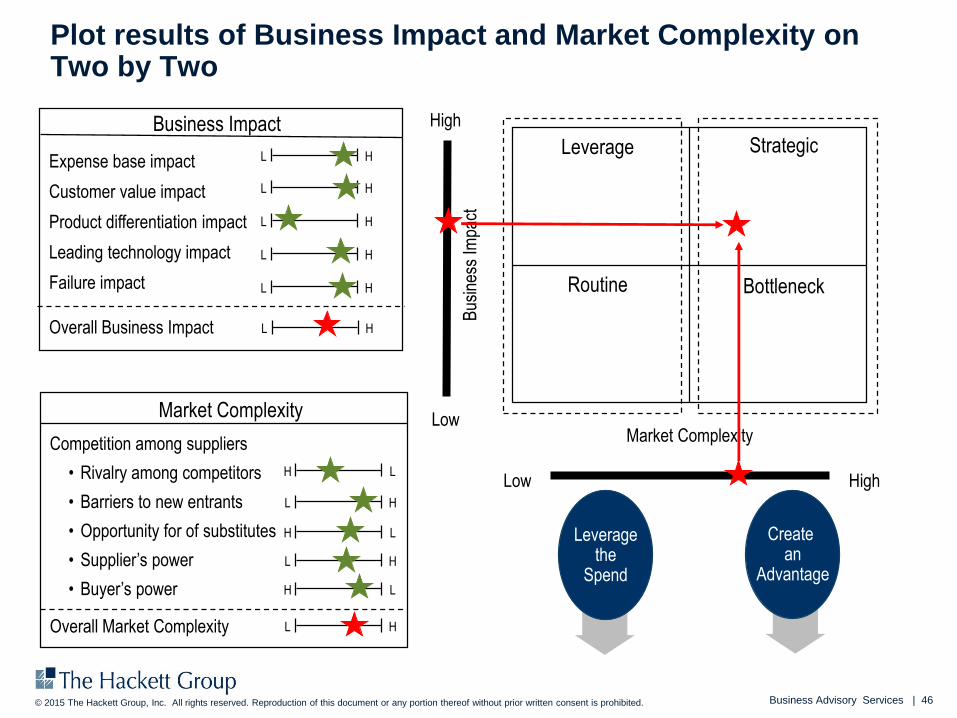
Plot results of Business Impact and Market Complexity on Two by Two
Expense base impact
Customer value impact
Product differentiation impact
Leading technology impact
Failure impact
Overall Business Impact
L H
L H
L H
L H
L H
Business Impact High
Low
Bus
ines
s Im
pact
HighLow
Market ComplexityCompetition among suppliers
• Rivalry among competitors
• Barriers to new entrants
• Opportunity for of substitutes
• Supplier’s power
• Buyer’s power
Overall Market Complexity
Market Complexity
H L
L H
H L
L H
H L
L H
Leveragethe
Spend
Create an
Advantage
L H
Strategic
BottleneckRoutine
Leverage
Business Advisory Services | 47© 2015 The Hackett Group, Inc. All rights reserved. Reproduction of this document or any portion thereof without prior written consent is prohibited. 47
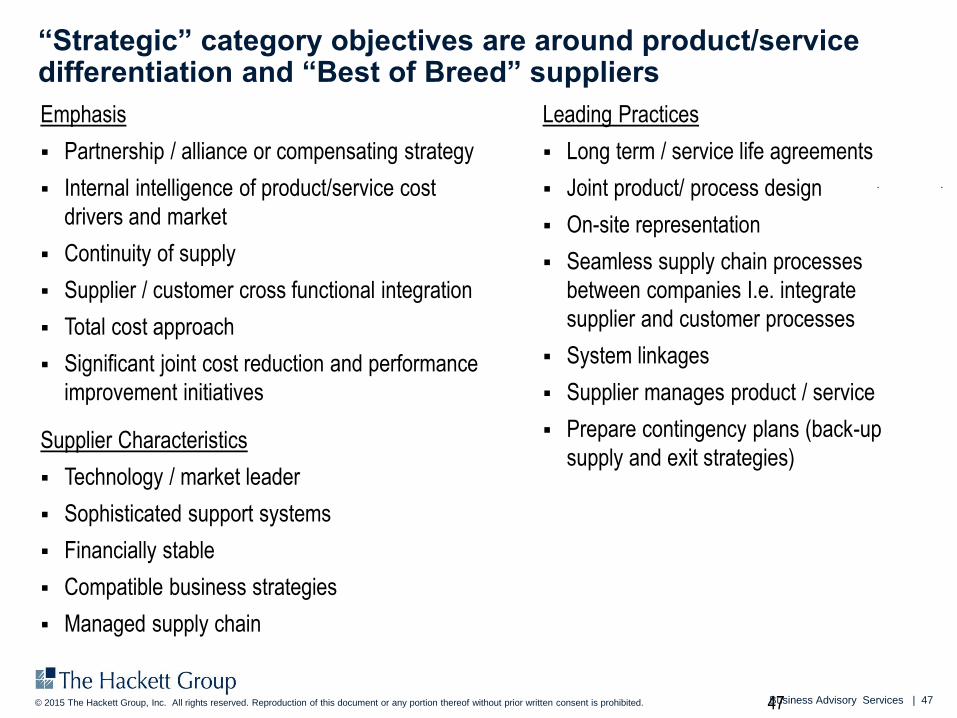
Leading Practices
Long term / service life agreements
Joint product/ process design
On-site representation
Seamless supply chain processes
between companies I.e. integrate
supplier and customer processes
System linkages
Supplier manages product / service
Prepare contingency plans (back-up
supply and exit strategies)
Emphasis
Partnership / alliance or compensating strategy
Internal intelligence of product/service cost
drivers and market
Continuity of supply
Supplier / customer cross functional integration
Total cost approach
Significant joint cost reduction and performance
improvement initiatives
Supplier Characteristics
Technology / market leader
Sophisticated support systems
Financially stable
Compatible business strategies
Managed supply chain
“Strategic” category objectives are around product/service differentiation and “Best of Breed” suppliers
Business Advisory Services | 48© 2015 The Hackett Group, Inc. All rights reserved. Reproduction of this document or any portion thereof without prior written consent is prohibited.
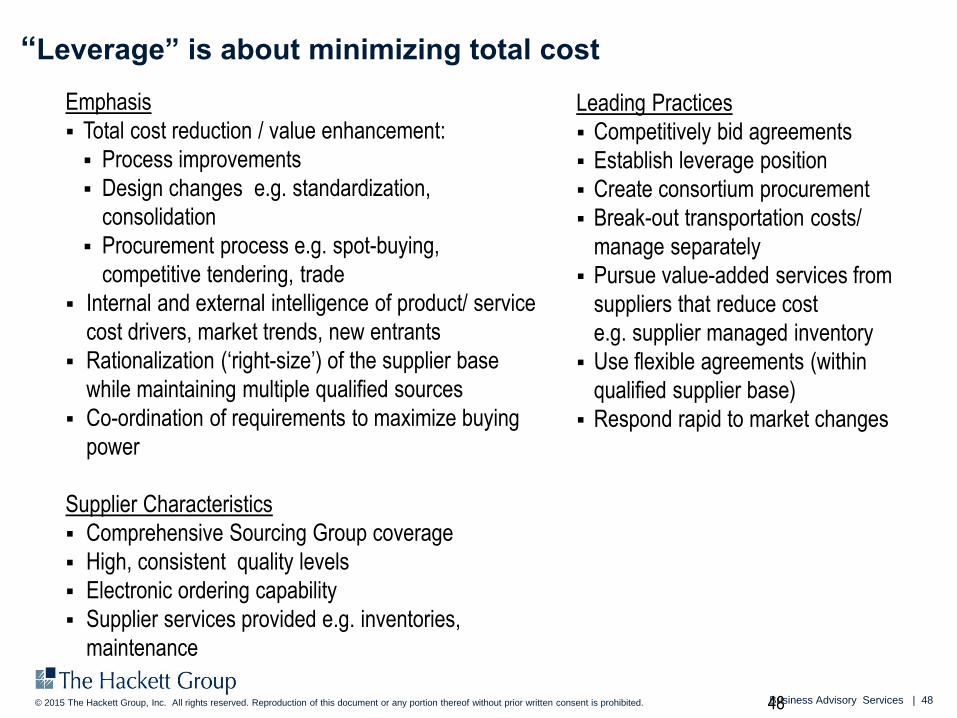
“Leverage” is about minimizing total cost
48
Leading Practices
Competitively bid agreements
Establish leverage position
Create consortium procurement
Break-out transportation costs/
manage separately
Pursue value-added services from
suppliers that reduce cost
e.g. supplier managed inventory
Use flexible agreements (within
qualified supplier base)
Respond rapid to market changes
Emphasis
Total cost reduction / value enhancement:
Process improvements
Design changes e.g. standardization,
consolidation
Procurement process e.g. spot-buying,
competitive tendering, trade
Internal and external intelligence of product/ service
cost drivers, market trends, new entrants
Rationalization (‘right-size’) of the supplier base
while maintaining multiple qualified sources
Co-ordination of requirements to maximize buying
power
Supplier Characteristics
Comprehensive Sourcing Group coverage
High, consistent quality levels
Electronic ordering capability
Supplier services provided e.g. inventories,
maintenance
Business Advisory Services | 49© 2015 The Hackett Group, Inc. All rights reserved. Reproduction of this document or any portion thereof without prior written consent is prohibited.
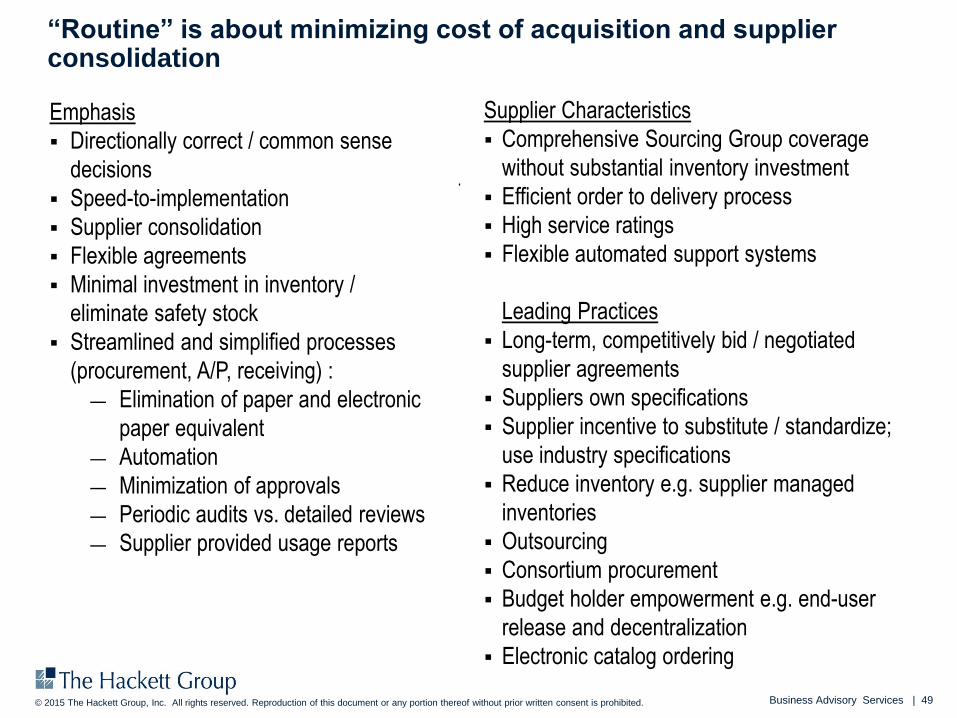
“Routine” is about minimizing cost of acquisition and supplier consolidation
Supplier Characteristics
Comprehensive Sourcing Group coverage
without substantial inventory investment
Efficient order to delivery process
High service ratings
Flexible automated support systems
Leading Practices
Long-term, competitively bid / negotiated
supplier agreements
Suppliers own specifications
Supplier incentive to substitute / standardize;
use industry specifications
Reduce inventory e.g. supplier managed
inventories
Outsourcing
Consortium procurement
Budget holder empowerment e.g. end-user
release and decentralization
Electronic catalog ordering
Emphasis
Directionally correct / common sense
decisions
Speed-to-implementation
Supplier consolidation
Flexible agreements
Minimal investment in inventory /
eliminate safety stock
Streamlined and simplified processes
(procurement, A/P, receiving) :
— Elimination of paper and electronic
paper equivalent
— Automation
— Minimization of approvals
— Periodic audits vs. detailed reviews
— Supplier provided usage reports
Business Advisory Services | 50© 2015 The Hackett Group, Inc. All rights reserved. Reproduction of this document or any portion thereof without prior written consent is prohibited. 50
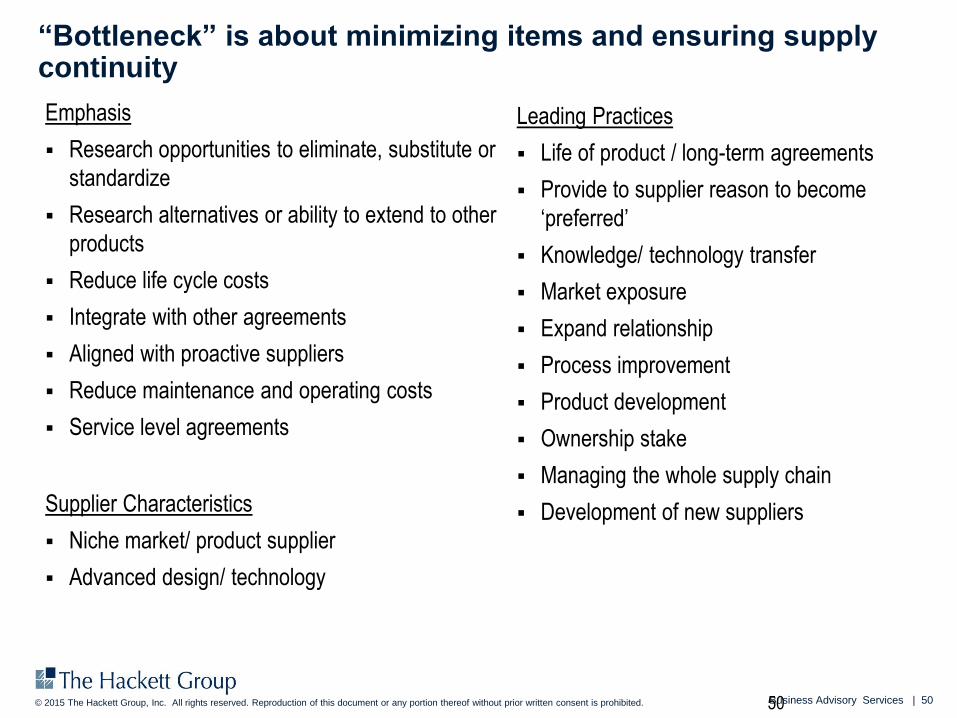
Leading Practices
Life of product / long-term agreements
Provide to supplier reason to become
‘preferred’
Knowledge/ technology transfer
Market exposure
Expand relationship
Process improvement
Product development
Ownership stake
Managing the whole supply chain
Development of new suppliers
Emphasis
Research opportunities to eliminate, substitute or
standardize
Research alternatives or ability to extend to other
products
Reduce life cycle costs
Integrate with other agreements
Aligned with proactive suppliers
Reduce maintenance and operating costs
Service level agreements
Supplier Characteristics
Niche market/ product supplier
Advanced design/ technology
“Bottleneck” is about minimizing items and ensuring supply continuity
Business Advisory Services | 51© 2015 The Hackett Group, Inc. All rights reserved. Reproduction of this document or any portion thereof without prior written consent is prohibited.
Key take-aways
Strategic sourcing provides a formal approach to optimizing value of a
sourcing approach
In addition to a foundational understanding of the strategic sourcing
approach relationship management skills are a critical enabler
The power of the strategic sourcing process is in facilitating fact-based
discussions with a cross-functional team using proven tools that drive
towards recommended strategies
Understanding the total cost of ownership for a category will help deliver
greater overall value to stakeholders as well as understand where
greater cost reduction opportunities may exist
Porter’s analysis is a powerful tool for driving towards a recommended
category strategy in a thoughtful and fact-based approach helping create
buy-in from internal stakeholders
52© 2015 The Hackett Group, Inc. All rights reserved. Reproduction of this document or any portion thereof without prior written consent is prohibited.
Amsterdam | Atlanta | Chicago | Frankfurt | Hyderabad | London | Miami
Montevideo | New York | Paris | Philadelphia | San Francisco | Sydney | Vancouver
Contact information
Kurt Albertson
Principal – Procurement Advisory
770-225-7570