Embed Size (px)
Citation preview
Asia-Pacific Development Journal Vol. 18, No. 1, June 2011
73
REVISITING SECTORAL LIBERALIZATION:AN ALTERNATIVE TO THE FREE TRADE AREA
OF THE ASIA-PACIFIC? IMPLICATIONSFOR THE PHILIPPINES
George Manzano and Myrene Bedano*
This paper develops a modality of liberalization for APEC, based ona sectoral level, as an alternative to the Free Trade Area of theAsia-Pacific (FTAAP). This model, originally developed by Wonnacott(1994), argues for the liberalization, on a Most Favoured Nation (MFN)basis, of sectors where APEC members are principal suppliers. The mainadvantage of this option is that it skirts the free rider problem that usuallyafflicts MFN liberalization. While this approach would benefit APEC asa group, it impacts different members differently. The paper examines theimplications of such a liberalization modality in APEC on the Philippines,as a case study.
JEL Classification: F13, F14, F15.
Key words: Asia-Pacific Economic Cooperation (APEC), Early Voluntary SectoralLiberalization (EVSL), Free Trade Area of the Asia-Pacific (FTAAP), “principal supplier”approach, sectoral liberalization, trade liberalization.
I. INTRODUCTION
The concept of open regionalism is a fuzzy one. As echoed by Bergsten(1997), this concept was first understood as a concerted unilateral liberalization.
* George Manzano is an Assistant Professor at the School of Economics, University of Asia and thePacific (UA&P), Philippines and Myrene Bedaño is a Trade and Industry Development Specialist, Bureau ofInternational Trade Relations, Department of Trade and Industry (DTI), Philippines. The authors wish toacknowledge the research support of the Philippine APEC Study Center Network. This paper is a revisedversion of the paper presented at the ARTNeT Conference on 2-3 November 2009 at UNESCAP,Bangkok, at the 35th Annual Conference of the Federation of ASEAN Economics Associations at Bali,Indonesia on 1-3 December 2010 and at the APEC Study Center Consortium Conference in Singapore inJuly 2009. Please direct queries to George Manzano at [email protected] [email protected].
¨
Asia-Pacific Development Journal Vol. 18, No. 1, June 2011
74
However, the euphoria in the APEC process that emanated from the Bogor meetingswaned as the Asian financial crisis struck in 1997. As most of Asia grappled with thecrippling effects of the crisis, the political support for trade liberalization across APECfaltered or at least failed to match the rhetoric of the leaders’ declarations. Inaddition, as the Doha Round bogged down amid disagreements on agriculture trade,regional trade agreements (RTAs) proliferated. Even within APEC, a multitude of RTAsbloomed, threatening to overshadow APEC’s role as a driver of trade. In an effort toput the APEC profile back to its prominence, the Free Trade Area of the Asia-Pacific(FTAAP) was proposed in 2004. However, given the current trade tensions amongsome members, the political support for such an agreement has becomequestionable. Yet, there remains the imperative for fresh initiatives to keep the bicycleof trade liberalization moving. Given this backdrop, this paper presents anothermodality to support APEC’s trade liberalization pillar and to provide an alternative tothe FTAAP proposal.
This paper develops a modality based on sectoral liberalization, reminiscentof the Early Voluntary Sectoral Liberalization (EVSL). However, in contrast to theill-fated EVSL, where the “voluntary” nomination of sectors for early liberalization isbased, to some extent, on the mercantilist interests of individual members, theproposed modality will employ a more analytical method for identifying the sector tobe slated for liberalization. Central to this modality is the basis for selection ofsectors to be liberalized. Following Wonnacott’s (1994) methodology, the paper willuse the “principal supplier” criterion in identifying the sectors that can be consideredfor MFN liberalization. To highlight the implications of the sectoral liberalization onindividual members, a case study of the Philippines will be conducted.
II. TRADE LIBERALIZATION IN APEC AND THE FTAAP
There are concerns that APEC will miss the Bogor goals, launched in 1994.One initiative to push for the Bogor goals is via the preferential route, i.e., creatinga massive RTA encompassing all APEC members. The proposed RTA, dubbed as theFTAAP, represents a significant departure from APEC’s initial approach to tradeliberalization. APEC distinguishes itself from conventional preferential models with itsstrict adherence to “open regionalism”. Specifically, the organization subscribes tothe “concerted unilateralism” approach that entails the simultaneous unilateral actionon the part of APEC members to liberalize trading regimes in a less discriminatorymanner. This unique character of APEC seeks to ensure that it will serve asa “building block” to global trade liberalization, rather than a “stumbling block”.Clearly, an RTA would involve a complete overhaul of the APEC modality to tradeliberalization – from a non-discriminatory approach to trade liberalization underpinned
Asia-Pacific Development Journal Vol. 18, No. 1, June 2011
75
by voluntary and non-binding commitments, towards an explicit preferentialarrangement established through negotiations of reciprocal trade concessions thatare legally binding.
The interest in the APEC RTA concept is motivated by a set of reinforcingfactors. As mentioned earlier, the primary motive emanates from the challenge forAPEC to revitalize its faltering trade agenda. Critics point to the demise of the EVSLscheme and the ineffectiveness of the Individual Action Plan (IAP) process as thedrag on APEC’s credibility and momentum. The failure of the EVSL in the late1990s revealed that the mechanisms by which the organization operates, whilewell-received, are practicably flawed. Further, the experience demonstrated thatsignificant trade liberalization may not be easily achieved by the mere reliance onvoluntary action by members kept in check only by friendly reminders by peer groups.Thus, the FTAAP is considered to be an effective way to energize APEC and to get itright back on the trade liberalization track. A single RTA that would meld themultitude of RTAs in the region and rationalize the different provisions contained inthese arrangements could well be the solution to the “spaghetti bowl” or “noodlebowl” effect of overlapping RTAs. In addition, the FTAAP is a response to thegridlocked WTO negotiations.
While the FTAAP possesses certain merits there are serious questions aboutits feasibility in the foreseeable future. One difficulty pertains to the plethora ofinterests and sensitive political dynamics among major players, which makes itdifficult to peddle the FTAAP (Morrison, 2007; Aggarwal, 2007). There are alsoa number of practical difficulties in negotiating such a large-scale arrangement, whichcould dampen the expectations of a successful conclusion in the near future.Designing, negotiating and implementing RTAs consume significant policymaking andcapital resources and the capacity to take part in the RTA is not symmetric amongAPEC members.
More recently however, another modality that involves widening themembership of the Trans-Pacific Economic Partnership Agreement (TPP) topotentially include most APEC members has been proposed. All original members ofthe TPP are APEC members and there is active interest among other APEC membersto join.1 Because the scope for liberalization in the TPP agreement is comprehensive,an expansion of members to include all APEC members could then be a substitute tothe formation of the FTAAP.
1 Brunei Darussalam, Chile, New Zealand and Singapore, the four original members, signed the TPP in2005 which entered into force in May 2006. The United States of America, Australia, Peru and Viet Namexpressed interest in joining the TPP.
Asia-Pacific Development Journal Vol. 18, No. 1, June 2011
76
In view of these issues revolving around the FTAAP and the gridlock on themultilateral forums, the Doha Development Agenda (DDA), the search of a suitablealternative for trade liberalization agenda in the APEC looms large. Certainly,unilateral liberalization, liberally interpreted as open regionalism, is one. While theeconomic arguments for this modality are many, a negative feature is that it wouldamount to giving the rest of the world a “free ride” as non-members automaticallybenefit from the tariff reductions by APEC members without making correspondingliberalization measures. Another avenue is sectoral liberalization.
III. PRINCIPAL SUPPLIER APPROACH TO SECTORALLIBERALIZATION
Theoretical Foundations
To the knowledge of the authors, there is no paper in the literature thatspecifically provides a theoretical justification for sectoral liberalization on an MFNbasis, along the “principal supplier” criteria in Wonnacott (1994). There is a relatedliterature that explains the merits of a non-preferential trading club, which is oneinterpretation of “open regionalism”.
Raimondos-Moller and Woodland (2006) wrote the first paper that discussedthe theoretical foundation of the advantages of “open regionalism”. One variant of“open regionalism” is the non-preferential club which is a group of countries thatagree to coordinate their non-discriminatory tariff policies and to undertake internalincome transfers. They argue that a non-preferential trading club, by undertakingcoordinated tariff reforms, can improve the efficiency of the resource allocationand welfare of the members of the club, at the same time leave the welfare of thenon-members untouched, i.e. a Pareto-improvement. An important feature though isthat the “coordinated tariff reforms” of the club members requires some members toraise their tariffs and some to reduce theirs or even allow subsidies. They argue thata non-preferential club is consistent with the spirit of the WTO in that whateverarrangements members make to improve their welfare, does not harm the welfare ofthe rest of the world.2
The sectoral liberalization modality proposed in this paper, share manycharacteristics of a non-preferential trading club. First, the liberalization, beingundertaken on an MFN basis, is non-discriminatory. Second, it is to be undertaken bya subset of the global economy, in this case, APEC members. Third, it should not
2 This outcome is similar to Kemp-Wan (1976) proposition except that the latter pertains to customsunions.
Asia-Pacific Development Journal Vol. 18, No. 1, June 2011
77
make the rest of the world worse-off, by keeping the relative prices to non-membersunchanged despite the internal changes among club members. Obviously, worldprices would not be held constant in the process of the APEC sectoral liberalization,as the APEC members are dominant producers and consumers in the aforementionedsectors. However, one may argue that because the tariff movements of theAPEC members are, of course, downwards, and granted on an MFN basis, the non-members will not likely be harmed.
The “Principal Supplier” criteria
To lessen the possibility of outsiders free riding3 on the trade liberalizationefforts by APEC, the challenge is to identify those areas in which the benefits of tradeliberalization would redound mostly on APEC members than on non-members. Earlierwork that addressed the issue of free riding is by Wonnacott (1994) that suggesteda trade liberalization scheme on a selective product-by-product basis whereincountries choose the commodities for early liberalization based on a pre-definedcriteria. Specifically, the methodology by Wonnacott prescribes that, in order tominimize the free rider problem, tariff reduction should be undertaken on the goodswhere APEC is a dominant global supplier. Intuitively, the benefits of tariff reductions,in terms of enhanced market access, on these goods would largely accrue to APECmembers, simply, because non-APEC members are not major exporters of suchproducts.
In the selection of potential candidates for liberalization, the share of APEC inthe world exports of goods was used as basis. A large percentage share of exports istaken to indicate that “free riding” by non-members would be less problematic. As inWonnacott’s study, the export shares of APEC in total world trade are compared withtheir share in total world exports less intra-European Union trade. Trade betweenEuropean Union member countries is discounted, as stipulated in Wonnacott (1994)on the ground that it is becoming more and more intraregional. For this exercise,commodities are examined at the 6-digit level based on the Harmonized System (HS)Commodity Classification Code.
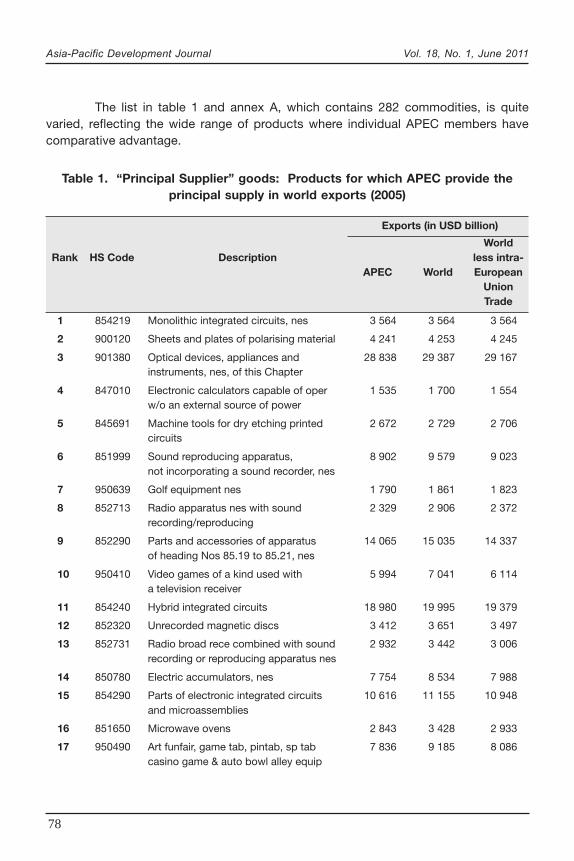
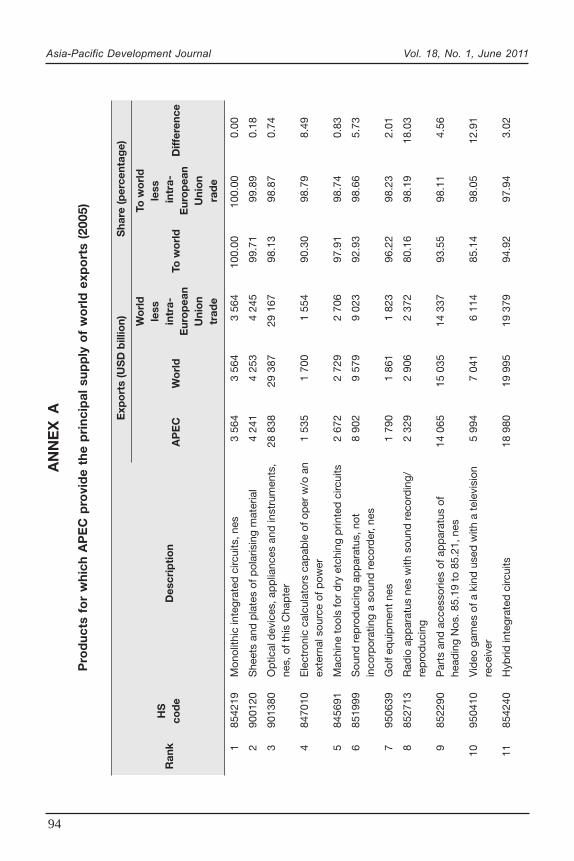
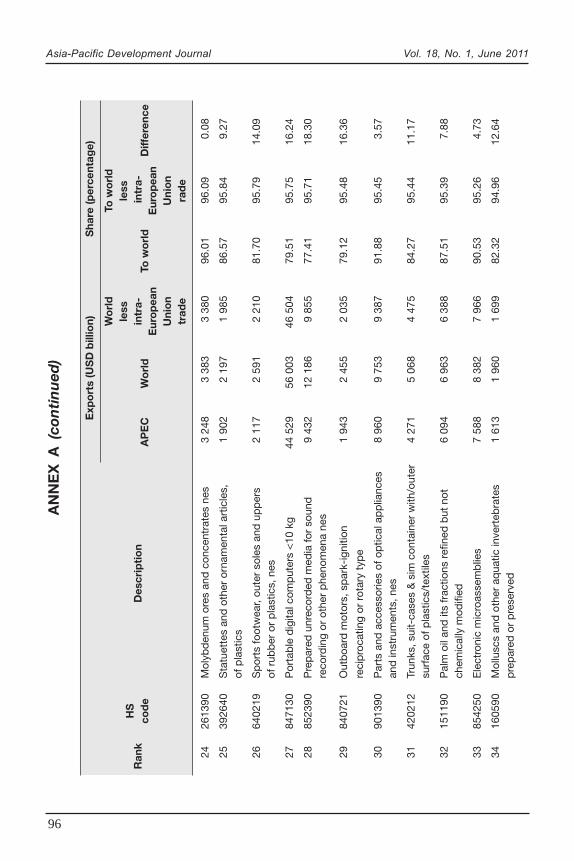
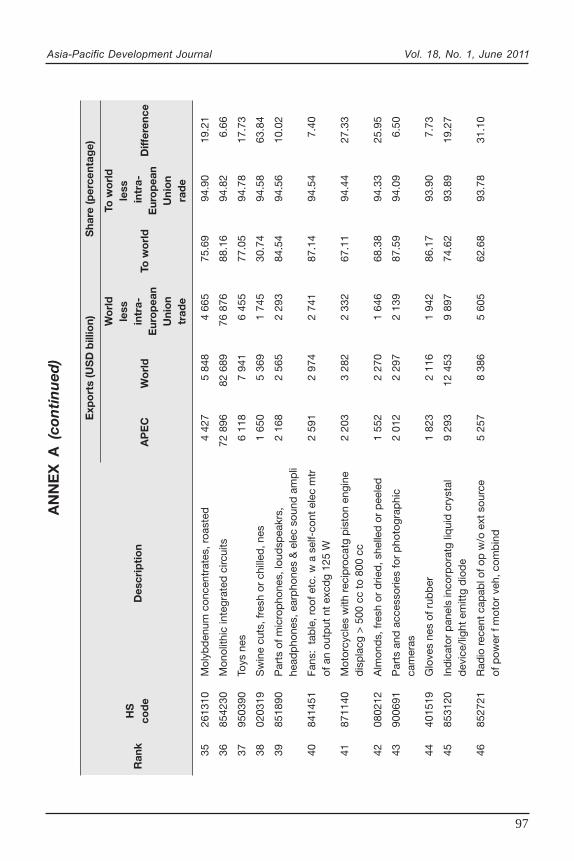
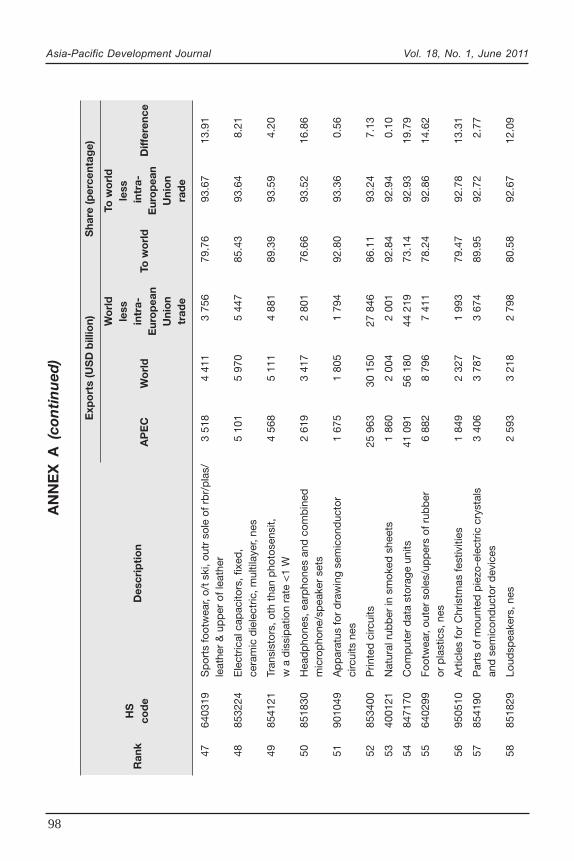
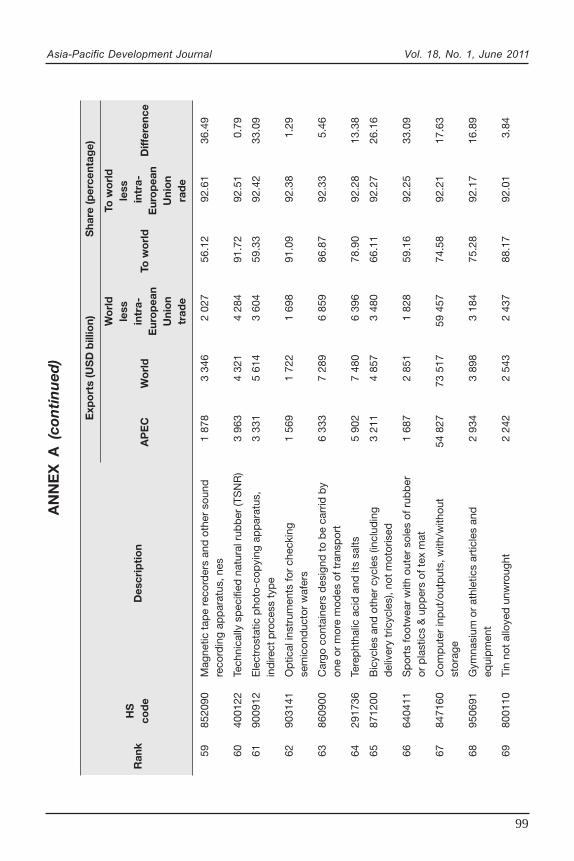
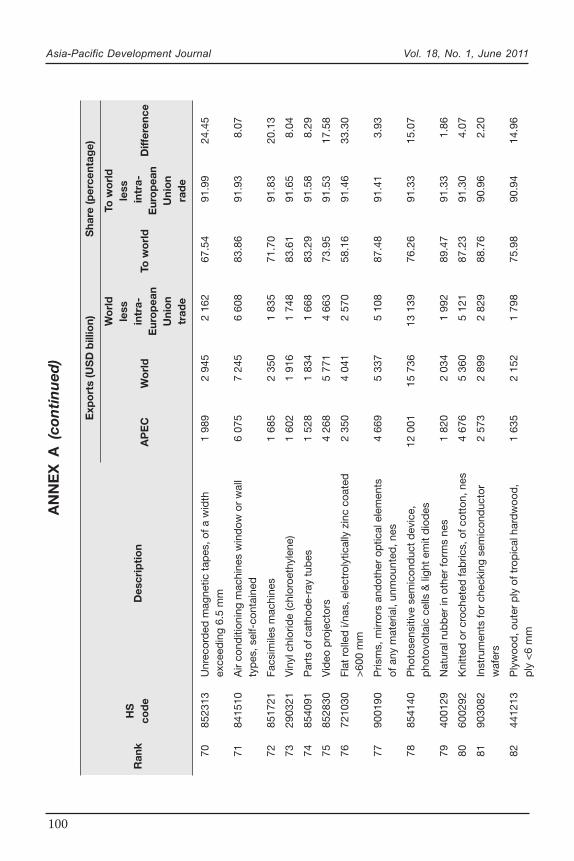
The products in which the APEC members are principal suppliers arereported in table 1. These are the products where APEC members, as a whole, enjoya share of at least 70 per cent of world exports in 2005 (not counting intra-EuropeanUnion trade).
3 Free riding is considered a cost because third countries will enjoy market acess without giving ‘quid-pro-quo’ concessions on access to their own markets.
Asia-Pacific Development Journal Vol. 18, No. 1, June 2011
78
The list in table 1 and annex A, which contains 282 commodities, is quitevaried, reflecting the wide range of products where individual APEC members havecomparative advantage.
Table 1. “Principal Supplier” goods: Products for which APEC provide theprincipal supply in world exports (2005)
Exports (in USD billion)
WorldRank HS Code Description less intra-
APEC World EuropeanUnionTrade
1 854219 Monolithic integrated circuits, nes 3 564 3 564 3 564
2 900120 Sheets and plates of polarising material 4 241 4 253 4 245
3 901380 Optical devices, appliances and 28 838 29 387 29 167instruments, nes, of this Chapter
4 847010 Electronic calculators capable of oper 1 535 1 700 1 554w/o an external source of power
5 845691 Machine tools for dry etching printed 2 672 2 729 2 706circuits
6 851999 Sound reproducing apparatus, 8 902 9 579 9 023not incorporating a sound recorder, nes
7 950639 Golf equipment nes 1 790 1 861 1 823
8 852713 Radio apparatus nes with sound 2 329 2 906 2 372recording/reproducing
9 852290 Parts and accessories of apparatus 14 065 15 035 14 337of heading Nos 85.19 to 85.21, nes
10 950410 Video games of a kind used with 5 994 7 041 6 114a television receiver
11 854240 Hybrid integrated circuits 18 980 19 995 19 379
12 852320 Unrecorded magnetic discs 3 412 3 651 3 497
13 852731 Radio broad rece combined with sound 2 932 3 442 3 006recording or reproducing apparatus nes
14 850780 Electric accumulators, nes 7 754 8 534 7 988
15 854290 Parts of electronic integrated circuits 10 616 11 155 10 948and microassemblies
16 851650 Microwave ovens 2 843 3 428 2 933
17 950490 Art funfair, game tab, pintab, sp tab 7 836 9 185 8 086casino game & auto bowl alley equip

Asia-Pacific Development Journal Vol. 18, No. 1, June 2011
79
18 950341 Stuffed toys representing animals 2 309 2 748 2 386or non-human creatures
19 852190 Video recording or reproducing 12 705 16 096 13 165apparatus nes
20 900211 Objective lenses f cameras, projectors/ 2 490 2 760 2 581photographic enlargers/reducers
21 741021 Foil of refined copper, backed 2 539 2 854 2 639
22 853222 Electrical capacitors, fixed, aluminium 2 874 3 329 2 989electrolytic, nes
23 390330 Acrylonitrile-butadiene-styrene (ABS) 6 022 6 954 6 266copolymers
24 261390 Molybdenum ores and concentrates nes 3 248 3 383 3 380
25 392640 Statuettes and other ornamental articles, 1 902 2 197 1 985of plastics
26 640219 Sports footwear, outer soles and uppers 2 117 2 591 2 210of rubber or plastics, nes
27 847130 Portable digital computers <10 kg 44 529 56 003 46 504
28 852390 Prepared unrecorded media for sound 9 432 12 186 9 855recording or other phenomena nes
29 840721 Outboard motors, spark-ignition 1 943 2 455 2 035reciprocating or rotary type
30 901390 Parts and accessories of optical 8 960 9 753 9 387appliances and instruments, nes
Source: Authors’ calculations using ITC TradeMap data.
Note: The complete list is reported in annex A.
Table 1. (continued)
Exports (in USD billion)
WorldRank HS Code Description less intra-
APEC World EuropeanUnionTrade
To analyse the importance of the selected products in the trade of individualAPEC members, these products are classified based on their trade shares. Panel A inannex B shows the imports of APEC partners above each cut-off level. The figuresreported in panel A in annex B give a rough approximation of the value of the marketthat would be opened for each APEC member indicated when APEC partners bringdown their tariffs on the items that lie above the chosen cut-off lines. Panels B and C
Asia-Pacific Development Journal Vol. 18, No. 1, June 2011
80
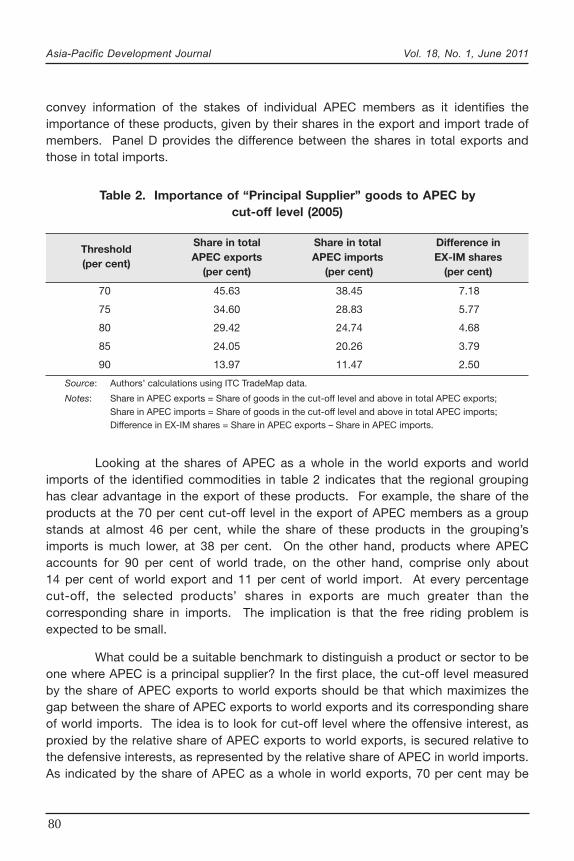
convey information of the stakes of individual APEC members as it identifies theimportance of these products, given by their shares in the export and import trade ofmembers. Panel D provides the difference between the shares in total exports andthose in total imports.
Table 2. Importance of “Principal Supplier” goods to APEC bycut-off level (2005)
ThresholdShare in total Share in total Difference in
(per cent)APEC exports APEC imports EX-IM shares
(per cent) (per cent) (per cent)
70 45.63 38.45 7.18
75 34.60 28.83 5.77
80 29.42 24.74 4.68
85 24.05 20.26 3.79
90 13.97 11.47 2.50
Source: Authors’ calculations using ITC TradeMap data.
Notes: Share in APEC exports = Share of goods in the cut-off level and above in total APEC exports;Share in APEC imports = Share of goods in the cut-off level and above in total APEC imports;Difference in EX-IM shares = Share in APEC exports – Share in APEC imports.
Looking at the shares of APEC as a whole in the world exports and worldimports of the identified commodities in table 2 indicates that the regional groupinghas clear advantage in the export of these products. For example, the share of theproducts at the 70 per cent cut-off level in the export of APEC members as a groupstands at almost 46 per cent, while the share of these products in the grouping’simports is much lower, at 38 per cent. On the other hand, products where APECaccounts for 90 per cent of world trade, on the other hand, comprise only about14 per cent of world export and 11 per cent of world import. At every percentagecut-off, the selected products’ shares in exports are much greater than thecorresponding share in imports. The implication is that the free riding problem isexpected to be small.
What could be a suitable benchmark to distinguish a product or sector to beone where APEC is a principal supplier? In the first place, the cut-off level measuredby the share of APEC exports to world exports should be that which maximizes thegap between the share of APEC exports to world exports and its corresponding shareof world imports. The idea is to look for cut-off level where the offensive interest, asproxied by the relative share of APEC exports to world exports, is secured relative tothe defensive interests, as represented by the relative share of APEC in world imports.As indicated by the share of APEC as a whole in world exports, 70 per cent may be
Asia-Pacific Development Journal Vol. 18, No. 1, June 2011
81
a reasonable cut-off level because going this far would cover almost half of APECexports. Additionally, as table 2 reports, it is at the 70 per cent cut-off level where thediscrepancy between the share of APEC exports and imports is greatest (fourthcolumn). The implication here is that the offensive interest of APEC, as a whole, iswell-served at the benchmark for the “principal supplier” at the 70 per cent level. Inaddition, it appears that there will be much to gain from a negotiation which coversproducts where APEC members provide 70 per cent or more of world exports. Asmentioned earlier, at a cut-off rate of 70 per cent, the percentage of APEC exportscovered is close to 46 per cent which is quite sizeable already. At the same time, theportion of APEC exports covered by a negotiation that only considers the next upperbracket of 75 per cent is only about 35 per cent of APEC exports. As the secondcolumn of table 2 shows, the average coverage of APEC exports that will not beincluded in the sectoral negotiations is greatest when the cut-off point is raised from70 per cent to 75 per cent. Specifically, the portion of APEC exports that is notcovered declines by 11.03 per cent, representing an average decrease of 2.21 percent per percentage rise of cut-off between 70 per cent and 75 per cent.
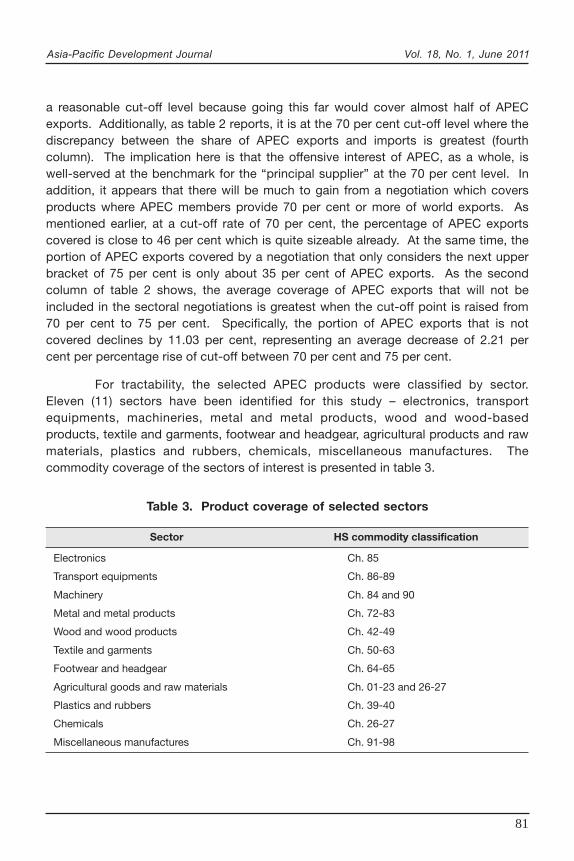
For tractability, the selected APEC products were classified by sector.Eleven (11) sectors have been identified for this study – electronics, transportequipments, machineries, metal and metal products, wood and wood-basedproducts, textile and garments, footwear and headgear, agricultural products and rawmaterials, plastics and rubbers, chemicals, miscellaneous manufactures. Thecommodity coverage of the sectors of interest is presented in table 3.
Table 3. Product coverage of selected sectors
Sector HS commodity classification
Electronics Ch. 85
Transport equipments Ch. 86-89
Machinery Ch. 84 and 90
Metal and metal products Ch. 72-83
Wood and wood products Ch. 42-49
Textile and garments Ch. 50-63
Footwear and headgear Ch. 64-65
Agricultural goods and raw materials Ch. 01-23 and 26-27
Plastics and rubbers Ch. 39-40
Chemicals Ch. 26-27
Miscellaneous manufactures Ch. 91-98
Asia-Pacific Development Journal Vol. 18, No. 1, June 2011
82
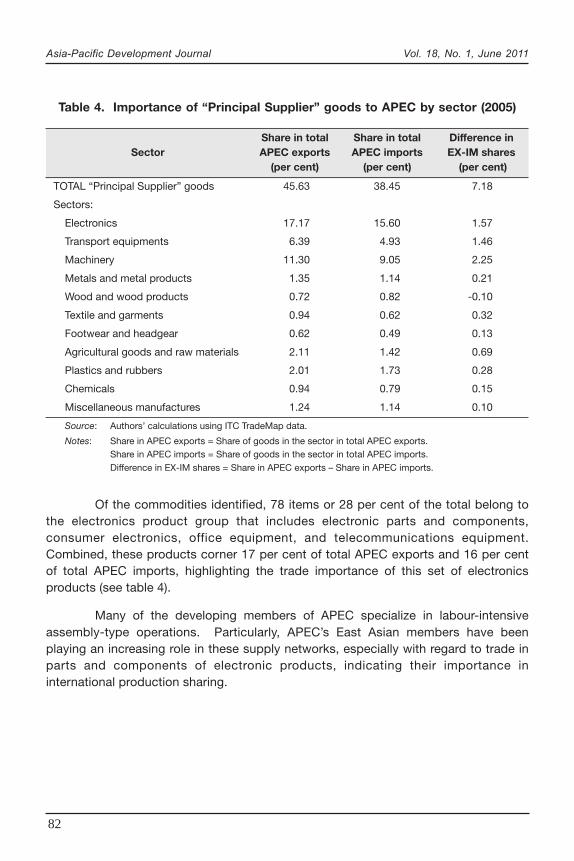
Of the commodities identified, 78 items or 28 per cent of the total belong tothe electronics product group that includes electronic parts and components,consumer electronics, office equipment, and telecommunications equipment.Combined, these products corner 17 per cent of total APEC exports and 16 per centof total APEC imports, highlighting the trade importance of this set of electronicsproducts (see table 4).
Many of the developing members of APEC specialize in labour-intensiveassembly-type operations. Particularly, APEC’s East Asian members have beenplaying an increasing role in these supply networks, especially with regard to trade inparts and components of electronic products, indicating their importance ininternational production sharing.
Table 4. Importance of “Principal Supplier” goods to APEC by sector (2005)
Share in total Share in total Difference inSector APEC exports APEC imports EX-IM shares
(per cent) (per cent) (per cent)
TOTAL “Principal Supplier” goods 45.63 38.45 7.18
Sectors:
Electronics 17.17 15.60 1.57
Transport equipments 6.39 4.93 1.46
Machinery 11.30 9.05 2.25
Metals and metal products 1.35 1.14 0.21
Wood and wood products 0.72 0.82 -0.10
Textile and garments 0.94 0.62 0.32
Footwear and headgear 0.62 0.49 0.13
Agricultural goods and raw materials 2.11 1.42 0.69
Plastics and rubbers 2.01 1.73 0.28
Chemicals 0.94 0.79 0.15
Miscellaneous manufactures 1.24 1.14 0.10
Source: Authors’ calculations using ITC TradeMap data.
Notes: Share in APEC exports = Share of goods in the sector in total APEC exports.Share in APEC imports = Share of goods in the sector in total APEC imports.Difference in EX-IM shares = Share in APEC exports – Share in APEC imports.
Asia-Pacific Development Journal Vol. 18, No. 1, June 2011
83
For each of the sectors identified in table 3, APEC’s share in world exports isgreater than its share in world imports. However, the discrepancy is very minimal atan average of 2 per cent for all sectors, indicating that while APEC members arestrong suppliers of these goods, they are also strong consumers of such items.4
IV. IMPLICATIONS FOR THE PHILIPPINE TRADENEGOTIATION STRATEGY: CASE STUDY
Earlier, it was argued that the sectoral liberalization based on the “principalsupplier” approach would be beneficial to APEC as a whole. However, the impact onthe individual members would vary as in the case of multilateral and regionalliberalization. What are the implications of the proposed modality of liberalization onthe trade negotiation of the Philippines? More specifically, to what extent does thesectoral liberalization serve its offensive and defensive interests?5
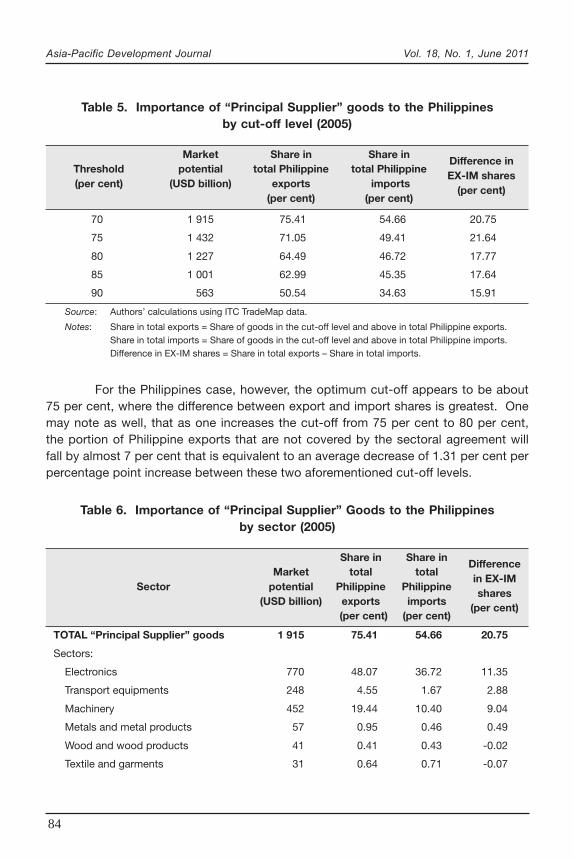
Based on table 5, for the products in which APEC members provide 70 percent and more of world exports (less intra-European Union trade), the Philippines’APEC partners imported $1,915 billion in 2005 from the world. This means thatthe Philippines along with everybody else have improved market access (due tosectoral liberalization) equivalent to the aforementioned value, keeping all otherfactors such as income constant. It could be seen that at the 90 per cent cut-offlevel, market potential available to the Philippines is significantly reduced by morethan two-thirds to $563 billion.
As annex B reports, the products where APEC supplies 70 per cent of theworld’s exports constitute close to 75 per cent of total Philippine exports in 2005.This indicates that the Philippines is a dominant supplier for the set of products wherethere is relatively little free riding if liberalized unilaterally. Furthermore, the differenceat the 70 per cent and 75 per cent between share of selected products in totalexports and imports respectively, are quite substantial.
4 A comparison of the ‘principal supplier’ goods with the products proposed for sectoral liberalization inthe WTO Non-Agricultural Market Access (NAMA) in August 2008 is reported in annex D. One notes that65 per cent of goods under the NAMA correspond to the items in the ‘principal supplier’ goods. Amongthe sectors with the highest incidence of correspondence are: electronics, machineries, wood, andchemicals. Annex D also reports the correspondence of the ‘principal supplier’ goods with the goodsproposed under the 1998 APEC EVSL. In contrast to the NAMA comparsion, only 45 per cent of the1998 APEC EVSL ‘goods’ are found in the list of the ‘principal supplier’ goods indicating that the latterhas a wider scope for liberalization than the EVSL.5 Gaining greater market access for exportables constitutes the ‘offensive interest’ in trade negotiationsin this paper. By ‘defensive interest’ is meant preventing the erosion of current levels of protection oncertain ‘sensitive’ sectors.
Asia-Pacific Development Journal Vol. 18, No. 1, June 2011
84
For the Philippines case, however, the optimum cut-off appears to be about75 per cent, where the difference between export and import shares is greatest. Onemay note as well, that as one increases the cut-off from 75 per cent to 80 per cent,the portion of Philippine exports that are not covered by the sectoral agreement willfall by almost 7 per cent that is equivalent to an average decrease of 1.31 per cent perpercentage point increase between these two aforementioned cut-off levels.
Table 5. Importance of “Principal Supplier” goods to the Philippinesby cut-off level (2005)
Market Share in Share inDifference in
Threshold potential total Philippine total PhilippineEX-IM shares
(per cent) (USD billion) exports imports(per cent)
(per cent) (per cent)
70 1 915 75.41 54.66 20.75
75 1 432 71.05 49.41 21.64
80 1 227 64.49 46.72 17.77
85 1 001 62.99 45.35 17.64
90 563 50.54 34.63 15.91
Source: Authors’ calculations using ITC TradeMap data.
Notes: Share in total exports = Share of goods in the cut-off level and above in total Philippine exports.Share in total imports = Share of goods in the cut-off level and above in total Philippine imports.Difference in EX-IM shares = Share in total exports – Share in total imports.
Table 6. Importance of “Principal Supplier” Goods to the Philippinesby sector (2005)
Share in Share inDifference
Market total totalin EX-IM
Sector potential Philippine Philippineshares
(USD billion) exports imports(per cent)
(per cent) (per cent)
TOTAL “Principal Supplier” goods 1 915 75.41 54.66 20.75
Sectors:
Electronics 770 48.07 36.72 11.35
Transport equipments 248 4.55 1.67 2.88
Machinery 452 19.44 10.40 9.04
Metals and metal products 57 0.95 0.46 0.49
Wood and wood products 41 0.41 0.43 -0.02
Textile and garments 31 0.64 0.71 -0.07
Asia-Pacific Development Journal Vol. 18, No. 1, June 2011
85
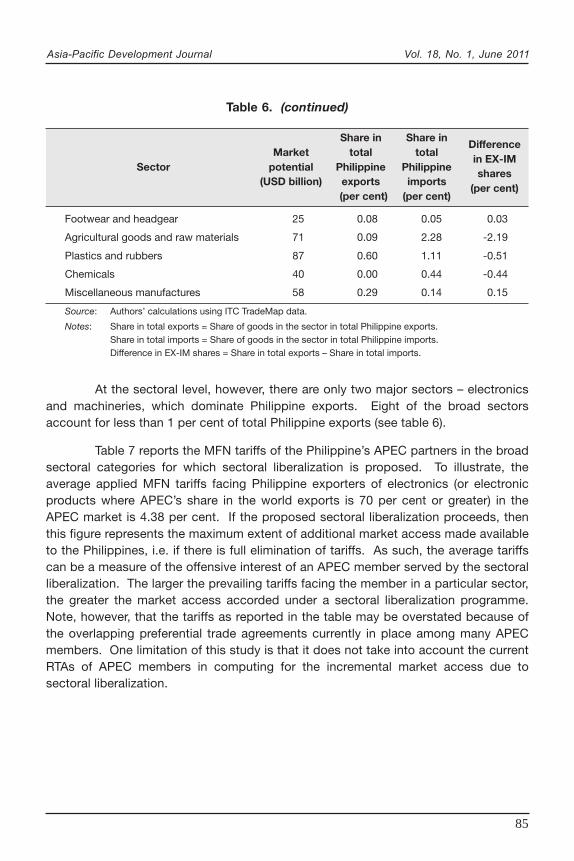
At the sectoral level, however, there are only two major sectors – electronicsand machineries, which dominate Philippine exports. Eight of the broad sectorsaccount for less than 1 per cent of total Philippine exports (see table 6).
Table 7 reports the MFN tariffs of the Philippine’s APEC partners in the broadsectoral categories for which sectoral liberalization is proposed. To illustrate, theaverage applied MFN tariffs facing Philippine exporters of electronics (or electronicproducts where APEC’s share in the world exports is 70 per cent or greater) in theAPEC market is 4.38 per cent. If the proposed sectoral liberalization proceeds, thenthis figure represents the maximum extent of additional market access made availableto the Philippines, i.e. if there is full elimination of tariffs. As such, the average tariffscan be a measure of the offensive interest of an APEC member served by the sectoralliberalization. The larger the prevailing tariffs facing the member in a particular sector,the greater the market access accorded under a sectoral liberalization programme.Note, however, that the tariffs as reported in the table may be overstated because ofthe overlapping preferential trade agreements currently in place among many APECmembers. One limitation of this study is that it does not take into account the currentRTAs of APEC members in computing for the incremental market access due tosectoral liberalization.
Footwear and headgear 25 0.08 0.05 0.03
Agricultural goods and raw materials 71 0.09 2.28 -2.19
Plastics and rubbers 87 0.60 1.11 -0.51
Chemicals 40 0.00 0.44 -0.44
Miscellaneous manufactures 58 0.29 0.14 0.15
Source: Authors’ calculations using ITC TradeMap data.
Notes: Share in total exports = Share of goods in the sector in total Philippine exports.Share in total imports = Share of goods in the sector in total Philippine imports.Difference in EX-IM shares = Share in total exports – Share in total imports.
Table 6. (continued)
Share in Share inDifference
Market total totalin EX-IM
Sector potential Philippine Philippineshares
(USD billion) exports imports(per cent)
(per cent) (per cent)
Asia-Pacific Development Journal Vol. 18, No. 1, June 2011
86
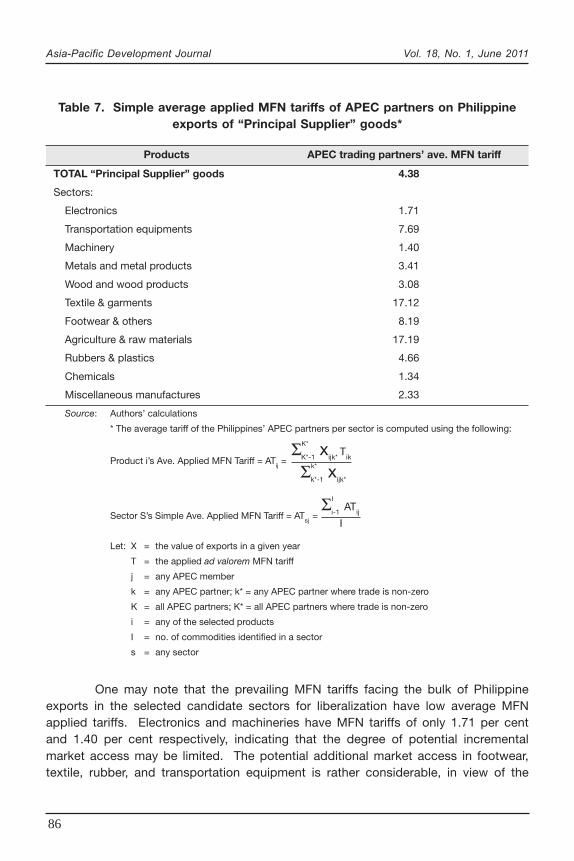
One may note that the prevailing MFN tariffs facing the bulk of Philippineexports in the selected candidate sectors for liberalization have low average MFNapplied tariffs. Electronics and machineries have MFN tariffs of only 1.71 per centand 1.40 per cent respectively, indicating that the degree of potential incrementalmarket access may be limited. The potential additional market access in footwear,textile, rubber, and transportation equipment is rather considerable, in view of the
Table 7. Simple average applied MFN tariffs of APEC partners on Philippineexports of “Principal Supplier” goods*
Products APEC trading partners’ ave. MFN tariff
TOTAL “Principal Supplier” goods 4.38
Sectors:
Electronics 1.71
Transportation equipments 7.69
Machinery 1.40
Metals and metal products 3.41
Wood and wood products 3.08
Textile & garments 17.12
Footwear & others 8.19
Agriculture & raw materials 17.19
Rubbers & plastics 4.66
Chemicals 1.34
Miscellaneous manufactures 2.33
Source: Authors’ calculations
* The average tariff of the Philippines’ APEC partners per sector is computed using the following:
Product i’s Ave. Applied MFN Tariff = ATij =
Sector S’s Simple Ave. Applied MFN Tariff = ATsj
=
Let: X = the value of exports in a given year
T = the applied ad valorem MFN tariff
j = any APEC member
k = any APEC partner; k* = any APEC partner where trade is non-zero
K = all APEC partners; K* = all APEC partners where trade is non-zero
i = any of the selected products
I = no. of commodities identified in a sector
s = any sector
Σk*-1
xijk*
k*
ΣK*-1
xijk*
Tik
K*
Σi-1 AT
ij
I
I
Asia-Pacific Development Journal Vol. 18, No. 1, June 2011
87
magnitude of tariffs that will be cut by the rest of the APEC members. However, thevolume of Philippine exports in the aforementioned sectors, save transportationequipment, is not very substantial (see table 6). Perhaps the reason for the lowvolume of exports of the Philippines in footwear, textile, etc. to other APECeconomies is due to high tariff barriers. Thus, the existing profile of tariffs facingPhilippine exports also influences the current distribution and volume of exportsamong the sectors.
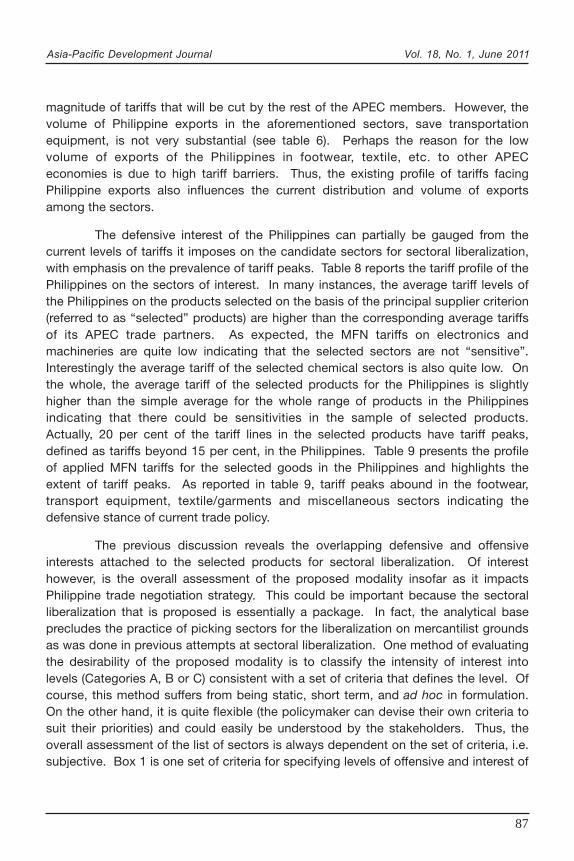
The defensive interest of the Philippines can partially be gauged from thecurrent levels of tariffs it imposes on the candidate sectors for sectoral liberalization,with emphasis on the prevalence of tariff peaks. Table 8 reports the tariff profile of thePhilippines on the sectors of interest. In many instances, the average tariff levels ofthe Philippines on the products selected on the basis of the principal supplier criterion(referred to as “selected” products) are higher than the corresponding average tariffsof its APEC trade partners. As expected, the MFN tariffs on electronics andmachineries are quite low indicating that the selected sectors are not “sensitive”.Interestingly the average tariff of the selected chemical sectors is also quite low. Onthe whole, the average tariff of the selected products for the Philippines is slightlyhigher than the simple average for the whole range of products in the Philippinesindicating that there could be sensitivities in the sample of selected products.Actually, 20 per cent of the tariff lines in the selected products have tariff peaks,defined as tariffs beyond 15 per cent, in the Philippines. Table 9 presents the profileof applied MFN tariffs for the selected goods in the Philippines and highlights theextent of tariff peaks. As reported in table 9, tariff peaks abound in the footwear,transport equipment, textile/garments and miscellaneous sectors indicating thedefensive stance of current trade policy.
The previous discussion reveals the overlapping defensive and offensiveinterests attached to the selected products for sectoral liberalization. Of interesthowever, is the overall assessment of the proposed modality insofar as it impactsPhilippine trade negotiation strategy. This could be important because the sectoralliberalization that is proposed is essentially a package. In fact, the analytical baseprecludes the practice of picking sectors for the liberalization on mercantilist groundsas was done in previous attempts at sectoral liberalization. One method of evaluatingthe desirability of the proposed modality is to classify the intensity of interest intolevels (Categories A, B or C) consistent with a set of criteria that defines the level. Ofcourse, this method suffers from being static, short term, and ad hoc in formulation.On the other hand, it is quite flexible (the policymaker can devise their own criteria tosuit their priorities) and could easily be understood by the stakeholders. Thus, theoverall assessment of the list of sectors is always dependent on the set of criteria, i.e.subjective. Box 1 is one set of criteria for specifying levels of offensive and interest of
Asia-Pacific Development Journal Vol. 18, No. 1, June 2011
88
Table 8. Simple average of applied MFN Tariffsof APEC members (2007)
ProductsSimple ave. of applied MFN tariffs
of APEC members
Ave. tariff 6.92
Ave. tariff (Agriculture) 13.35
Ave. tariff (Industrial) 6.11
Sector:
Animal products 11.99
Dairy products 31.86
Fruit, vegetables, plants 12.81
Coffee, tea 13.98
Cereals & preparations 20.51
Oilseeds, fats & oils 8.39
Sugars and confectionery 15.32
Beverages & tobacco 32.21
Cotton 3.27
Other agricultural products 5.19
Fish & fish products 9.10
Minerals & metals 4.81
Petroleum 3.66
Chemicals 3.76
Wood, paper, etc. 5.80
Textiles 8.48
Clothing 16.01
Leather, footwear, etc. 8.37
Non-electrical machinery 3.80
Electrical machinery 5.54
Transport equipment 8.24
Manufactures, n.e.s. 5.84
Source: WTO Tariff Profile 2006
Asia-Pacific Development Journal Vol. 18, No. 1, June 2011
89
Philippine trade policy as regards the prospects of liberalization on the principalsupplier basis.
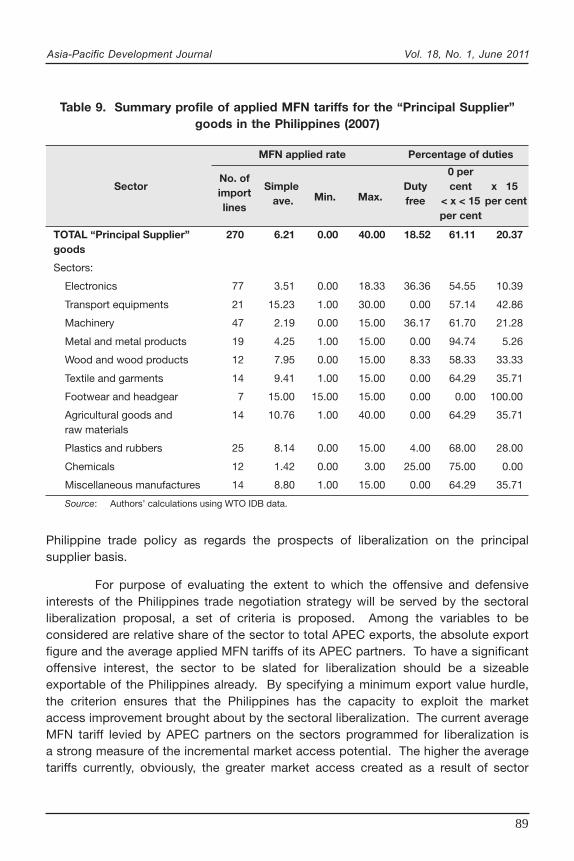
For purpose of evaluating the extent to which the offensive and defensiveinterests of the Philippines trade negotiation strategy will be served by the sectoralliberalization proposal, a set of criteria is proposed. Among the variables to beconsidered are relative share of the sector to total APEC exports, the absolute exportfigure and the average applied MFN tariffs of its APEC partners. To have a significantoffensive interest, the sector to be slated for liberalization should be a sizeableexportable of the Philippines already. By specifying a minimum export value hurdle,the criterion ensures that the Philippines has the capacity to exploit the marketaccess improvement brought about by the sectoral liberalization. The current averageMFN tariff levied by APEC partners on the sectors programmed for liberalization isa strong measure of the incremental market access potential. The higher the averagetariffs currently, obviously, the greater market access created as a result of sector
Table 9. Summary profile of applied MFN tariffs for the “Principal Supplier”goods in the Philippines (2007)
MFN applied rate Percentage of duties
No. of0 per
Sectorimport
SimpleMin. Max.
Duty cent x 15
lines ave. free < x < 15 per cent
per cent
TOTAL “Principal Supplier” 270 6.21 0.00 40.00 18.52 61.11 20.37goods
Sectors:
Electronics 77 3.51 0.00 18.33 36.36 54.55 10.39
Transport equipments 21 15.23 1.00 30.00 0.00 57.14 42.86
Machinery 47 2.19 0.00 15.00 36.17 61.70 21.28
Metal and metal products 19 4.25 1.00 15.00 0.00 94.74 5.26
Wood and wood products 12 7.95 0.00 15.00 8.33 58.33 33.33
Textile and garments 14 9.41 1.00 15.00 0.00 64.29 35.71
Footwear and headgear 7 15.00 15.00 15.00 0.00 0.00 100.00
Agricultural goods and 14 10.76 1.00 40.00 0.00 64.29 35.71raw materials
Plastics and rubbers 25 8.14 0.00 15.00 4.00 68.00 28.00
Chemicals 12 1.42 0.00 3.00 25.00 75.00 0.00
Miscellaneous manufactures 14 8.80 1.00 15.00 0.00 64.29 35.71
Source: Authors’ calculations using WTO IDB data.
Asia-Pacific Development Journal Vol. 18, No. 1, June 2011
90
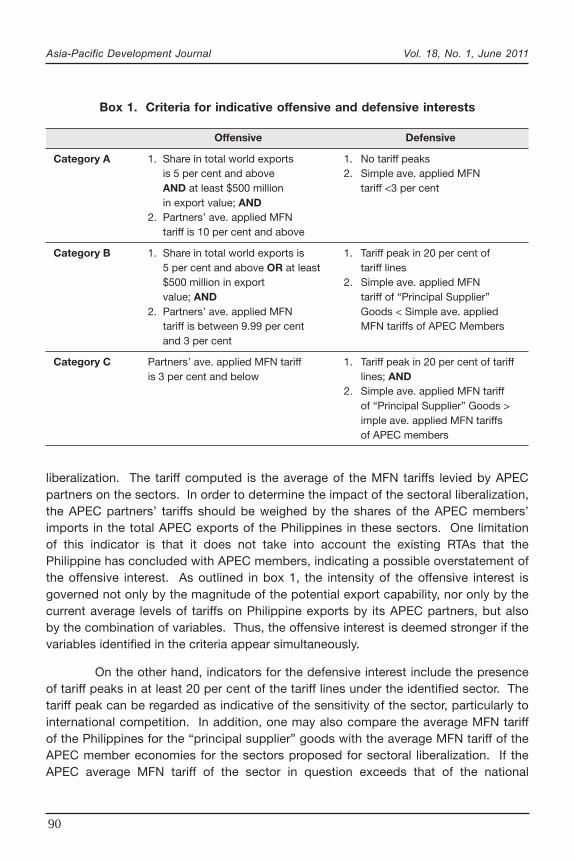
Box 1. Criteria for indicative offensive and defensive interests
Offensive Defensive
Category A 1. Share in total world exports 1. No tariff peaksis 5 per cent and above 2. Simple ave. applied MFNAND at least $500 million tariff <3 per centin export value; AND
2. Partners’ ave. applied MFNtariff is 10 per cent and above
Category B 1. Share in total world exports is 1. Tariff peak in 20 per cent of5 per cent and above OR at least tariff lines$500 million in export 2. Simple ave. applied MFNvalue; AND tariff of “Principal Supplier”
2. Partners’ ave. applied MFN Goods < Simple ave. appliedtariff is between 9.99 per cent MFN tariffs of APEC Membersand 3 per cent
Category C Partners’ ave. applied MFN tariff 1. Tariff peak in 20 per cent of tariffis 3 per cent and below lines; AND
2. Simple ave. applied MFN tariffof “Principal Supplier” Goods >imple ave. applied MFN tariffsof APEC members
liberalization. The tariff computed is the average of the MFN tariffs levied by APECpartners on the sectors. In order to determine the impact of the sectoral liberalization,the APEC partners’ tariffs should be weighed by the shares of the APEC members’imports in the total APEC exports of the Philippines in these sectors. One limitationof this indicator is that it does not take into account the existing RTAs that thePhilippine has concluded with APEC members, indicating a possible overstatement ofthe offensive interest. As outlined in box 1, the intensity of the offensive interest isgoverned not only by the magnitude of the potential export capability, nor only by thecurrent average levels of tariffs on Philippine exports by its APEC partners, but alsoby the combination of variables. Thus, the offensive interest is deemed stronger if thevariables identified in the criteria appear simultaneously.
On the other hand, indicators for the defensive interest include the presenceof tariff peaks in at least 20 per cent of the tariff lines under the identified sector. Thetariff peak can be regarded as indicative of the sensitivity of the sector, particularly tointernational competition. In addition, one may also compare the average MFN tariffof the Philippines for the “principal supplier” goods with the average MFN tariff of theAPEC member economies for the sectors proposed for sectoral liberalization. If theAPEC average MFN tariff of the sector in question exceeds that of the national
Asia-Pacific Development Journal Vol. 18, No. 1, June 2011
91
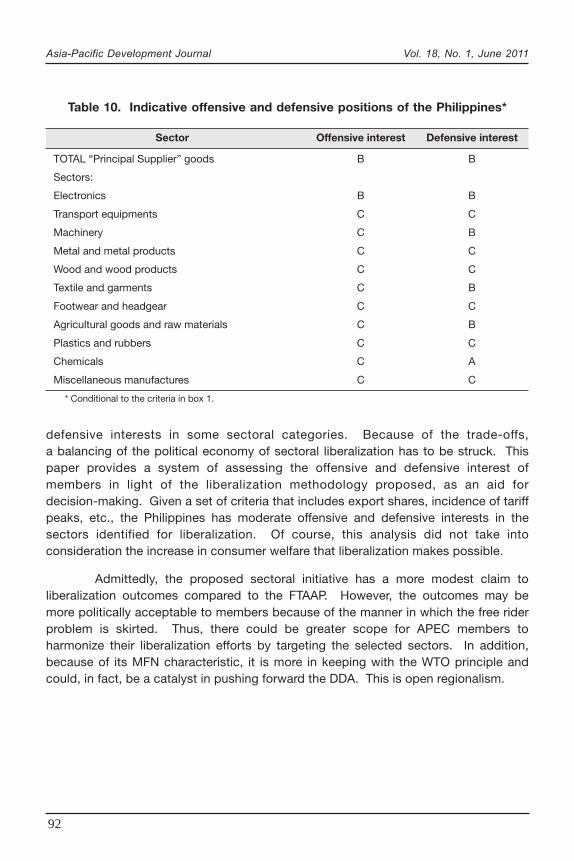
average, then one can infer that the defensive interest in that sector is relativelypronounced. As the box shows, the intensity of the defensive interest is a function ofthe prevalence of tariff peaks and relative magnitudes of the MFN tariffs of the sectorin the region against the national average. Under this scheme, defensive interest isconsidered strong when the criteria of the incidence of tariff peaks and the magnitudeof average sectoral tariffs are simultaneously met. The position is said to bemoderate or weak when either one of the criteria are met, but not simultaneously.Table 10 summarizes the degree of offensive and defensive interests of thePhilippines in each of the product groups identified for liberalization on a sectorallevel, according to categories and criteria outlined in box 1.
Again, the criteria outlined in the box can be modified depending on thepreference of the policymakers. Consequently, the definitions of strong, moderate orweak interest could vary depending on the criteria set. While this feature may renderthe process quite ad hoc, it nevertheless makes it quite flexible for purpose of policyresearch.
V. FINAL REMARKS
APEC has been at a crossroads for a number of years already. After theinitial enthusiasm of Bogor waned in the wake of the Asian financial crisis, APEC triedto revive the trade liberalization agenda. The current initiative, FTAAP, has not beenfully supported by all members. While ambitious, a multitude of political sensitivitiesand the general RTA “fatigue” factor prevent the FTAAP from advancing forwardstrongly. Yet, it is still one of the most concrete ideas tabled to advance the pillar oftrade liberalization.
This paper puts forward an alternative to FTAAP. The modality is sectoralliberalization on an MFN basis, founded on the analytical basis of “principal supplier”approach and a variant of the non-preferential trading club. In a departure from theill-fated EVSL, the proposed initiative chooses the sectors to be liberalized on thebasis of minimizing free riding by non-APEC members. Candidates for sectoralliberalization are those sectors where APEC economies supply a significant portion ofworld exports. Using a benchmark or cut-off rate of 70 per cent, over 282 productsare identified for sectoral liberalization. These products, in total, constitute close tohalf of all APEC exports and about 40 per cent of APEC imports in 2005.
Of course, while the APEC, as a collective, stands to benefit from theproposed sectoral liberalization, the impact on the individual member differs from oneeconomy to another. The case study on the Philippines showed that sectoralliberalization, whilst serving its offensive interests, have a negative impact on the
Asia-Pacific Development Journal Vol. 18, No. 1, June 2011
92
defensive interests in some sectoral categories. Because of the trade-offs,a balancing of the political economy of sectoral liberalization has to be struck. Thispaper provides a system of assessing the offensive and defensive interest ofmembers in light of the liberalization methodology proposed, as an aid fordecision-making. Given a set of criteria that includes export shares, incidence of tariffpeaks, etc., the Philippines has moderate offensive and defensive interests in thesectors identified for liberalization. Of course, this analysis did not take intoconsideration the increase in consumer welfare that liberalization makes possible.
Admittedly, the proposed sectoral initiative has a more modest claim toliberalization outcomes compared to the FTAAP. However, the outcomes may bemore politically acceptable to members because of the manner in which the free riderproblem is skirted. Thus, there could be greater scope for APEC members toharmonize their liberalization efforts by targeting the selected sectors. In addition,because of its MFN characteristic, it is more in keeping with the WTO principle andcould, in fact, be a catalyst in pushing forward the DDA. This is open regionalism.
Table 10. Indicative offensive and defensive positions of the Philippines*
Sector Offensive interest Defensive interest
TOTAL “Principal Supplier” goods B B
Sectors:
Electronics B B
Transport equipments C C
Machinery C B
Metal and metal products C C
Wood and wood products C C
Textile and garments C B
Footwear and headgear C C
Agricultural goods and raw materials C B
Plastics and rubbers C C
Chemicals C A
Miscellaneous manufactures C C
* Conditional to the criteria in box 1.
Asia-Pacific Development Journal Vol. 18, No. 1, June 2011
93
REFERENCES
Aggarwal, Vinod K. (2007). “The political economy of a free trade area of the Asia-Pacific: A USperspective”. In Charles Morrison and Eduardo Pedrosa, eds. An APEC Trade Agenda?:The Political Economy of a Free Trade Area of the Asia-Pacific. (Singapore: Institute ofSoutheast Asian Studies). Available from www.waseda-giari.jp/sysimg/imgs/200908_si_aggarwal_rp_2.pdf.
Asia-Pacific Economic Cooperation (1998). APEC SOM Chair’s report to the Ministers responsible fortrade, Kuching, Sarawak, Malaysia, 22-23 June.
Bergsten, C. Fred (1997). “Open regionalism”. Peterson Institute for International EconomicsWorking Paper 97-3. (Washington, D.C.: Peterson Institute for International Economics).Available from www.iie.com/publications/wp/wp.cfm?ResearchID=152.
(2007). “Towards a Free Trade Area of the Pacific”. Institute for International EconomicsPolicy Briefs in International Economics No. PB07-02. (Washington, D.C.: PetersonInstitute for International Economics). Available from http://www.piie.com/publications/pb/pb07-2.pdf.
Bhagwati, Jagdish and Arvind Panagariya (1996). “Preferential trading areas and multilateralism:strangers, friends or foes?” in Jagdish Bhagwati and Arvind Panagariya, eds., TheEconomics of Preferential Trade Agreements (Washington, D.C.: AEI Press).
International Trade Center (2010). TradeMap. Available from http://www.trademap.org
Kemp, Maurray C. and Henry Y. Wan (1976). “An elementary proposition concerning the formation ofcustoms unions”, Journal of International Economics, vol. 6 (February), pp. 95-97.Available from www2.econ.iastate.edu/classes/econ655/lapan/Readings/ElementaryPropositionConcerningCustomsUnionsKEMPWAN.pdf.
Raimondos-Moller, Pascalis and Alan Woodland (2006), “Non-preferential trading clubs”, Journal ofInternational Economics, vol. 68, No. 1 (January), pp 79-91.
United States Census Bureau (2010). “Foreign Trade Statistics”. Available from www.census.gov.
Wonnacott, Paul (1994). “Merchandise Trade in the APEC Region: is there scope for liberalization onan MFN basis?”, The World Economy, Special Issue on Global Trade Policy, pp. 33-51.
World Trade Organization (1998). APEC’s “Accelerated Tariff Liberalization” (ATL) Initiative –Communication from New Zealand. WT/GC/W/138/Add.1.
Negotiating Group on Market Access (2008). Draft Modalities for Non-agricultural MarketAccess, 3rd rev. TN/MA/W/103/Rev. 2 (10 July). Available from www.wto.org/english/tratop_e/markacc_e/markacc_chair_texts07_e.htm.
Asia-Pacific Development Journal Vol. 18, No. 1, June 2011
94
AN
NE
X A
Pro
du
cts
for
wh
ich
AP
EC
pro
vid
e th
e p
rin
cip
al s
up
ply
of
wo
rld
exp
ort
s (2
005)
Exp
ort
s (U
SD
bill
ion)
Sha
re (p
erce
ntag
e)
Wo
rld
To w
orl
d
HS
less
less
Ran
kco
de
Des
crip
tio
nA
PE
CW
orl
din
tra-
To w
orl
d in
tra-
Diff
eren
ceE
uro
pea
nE
uro
pea
nU
nio
nU
nio
ntr
ade
rad
e
185
4219
Mon
olith
ic in
tegr
ated
circ
uits
, nes
3 56
43
564
3 56
410
0.00
100.
000.
00
290
0120
She
ets
and
pla
tes
of p
olar
isin
g m
ater
ial
4 24
14
253
4 24
599
.71
99.8
90.
18
390
1380
Op
tical
dev
ices
, ap
plia
nces
and
inst
rum
ents
,28
838
29 3
8729
167
98.1
398
.87
0.74
nes,
of t
his
Cha
pte
r
484
7010
Ele
ctro
nic
calc
ulat
ors
cap
able
of o
per
w/o
an
1 53
51
700
1 55
490
.30
98.7
98.
49ex
tern
al s
ourc
e of
pow
er
584
5691
Mac
hine
too
ls fo
r d
ry e
tchi
ng p
rinte
d c
ircui
ts2
672
2 72
92
706
97.9
198
.74
0.83
685
1999
Sou
nd r
epro
duc
ing
app
arat
us, n
ot8
902
9 57
99
023
92.9
398
.66
5.73
inco
rpor
atin
g a
soun
d r
ecor
der
, nes
795
0639
Gol
f eq
uip
men
t ne
s1
790
1 86
11
823
96.2
298
.23
2.01
885
2713
Rad
io a
pp
arat
us n
es w
ith s
ound
rec
ord
ing/
2 32
92
906
2 37
280
.16
98.1
918
.03
rep
rod
ucin
g
985
2290
Par
ts a
nd a
cces
sorie
s of
ap
par
atus
of
14 0
6515
035
14 3
3793
.55
98.1
14.
56he
adin
g N
os. 8
5.19
to
85.2
1, n
es
1095
0410
Vid
eo g
ames
of a
kin
d u
sed
with
a t
elev
isio
n5
994
7 04
16
114
85.1
498
.05
12.9
1re
ceiv
er
1185
4240
Hyb
rid in
tegr
ated
circ
uits
18 9
8019
995
19 3
7994
.92
97.9
43.
02

Asia-Pacific Development Journal Vol. 18, No. 1, June 2011
95
AN
NE
X A
(co
nti
nu
ed)
Exp
ort
s (U
SD
bill
ion)
Sha
re (p
erce
ntag
e)
Wo
rld
To w
orl
d
HS
less
less
Ran
kco
de
Des
crip
tio
nA
PE
CW
orl
din
tra-
To w
orl
d in
tra-
Diff
eren
ceE
uro
pea
nE
uro
pea
nU
nio
nU
nio
ntr
ade
rad
e
1285
2320
Unr
ecor
ded
mag
netic
dis
cs3
412
3 65
13
497
93.4
697
.59
4.13
1385
2731
Rad
io b
road
rec
eive
r co
mb
ind
with
sou
nd2
932
3 44
23
006
85.1
897
.55
12.3
7re
cord
ing
or r
epro
duc
ing
app
arat
us n
es
1485
0780
Ele
ctric
acc
umul
ator
s, n
es7
754
8 53
47
988
90.8
697
.07
6.21
1585
4290
Par
ts o
f ele
ctro
nic
inte
grat
ed c
ircui
ts a
nd10
616
11 1
5510
948
95.1
796
.97
1.80
mic
roas
sem
blie
s
1685
1650
Mic
row
ave
oven
s2
843
3 42
82
933
82.9
396
.92
13.9
9
1795
0490
Art
funf
air,
gam
e ta
b, p
inta
b, s
p t
ab c
asin
o7
836
9 18
58
086
85.3
296
.91
11.5
9ga
me
& a
uto
bow
l alle
y eq
uip
1895
0341
Stu
ffed
toy
s re
pre
sent
ing
anim
als
or2
309
2 74
82
386
84.0
296
.75
12.7
3no
n-hu
man
cre
atur
es
1985
2190
Vid
eo r
ecor
din
g or
rep
rod
ucin
g ap
par
atus
nes
12 7
0516
096
13 1
6578
.93
96.5
117
.58
2090
0211
Ob
ject
ive
lens
es f
cam
eras
, pro
ject
ors/
2 49
02
760
2 58
190
.23
96.4
86.
25p
hoto
grap
hic
enla
rger
s/re
duc
ers
2174
1021
Foil
of r
efin
ed c
opp
er, b
acke
d2
539
2 85
42
639
88.9
696
.19
7.23
2285
3222
Ele
ctric
al c
apac
itors
, fix
ed, a
lum
iniu
m2
874
3 32
92
989
86.3
296
.12
9.80
elec
trol
ytic
, nes
2339
0330
Acr
ylon
itrile
-but
adie
ne-s
tyre
ne (A
BS
)6
022
6 95
46
266
86.6
096
.09
9.49
cop
olym
ers
Asia-Pacific Development Journal Vol. 18, No. 1, June 2011
96
AN
NE
X A
(co
nti
nu
ed)
Exp
ort
s (U
SD
bill
ion)
Sha
re (p
erce
ntag
e)
Wo
rld
To w
orl
d
HS
less
less
Ran
kco
de
Des
crip
tio
nA
PE
CW
orl
din
tra-
To w
orl
d in
tra-
Diff
eren
ceE
uro
pea
nE
uro
pea
nU
nio
nU
nio
ntr
ade
rad
e
2426
1390
Mol
ybd
enum
ore
s an
d c
once
ntra
tes
nes
3 24
83
383
3 38
096
.01
96.0
90.
08
2539
2640
Sta
tuet
tes
and
oth
er o
rnam
enta
l art
icle
s,1
902
2 19
71
985
86.5
795
.84
9.27
of p
last
ics
2664
0219
Sp
orts
foot
wea
r, ou
ter
sole
s an
d u
pp
ers
2 11
72
591
2 21
081
.70
95.7
914
.09
of r
ubb
er o
r p
last
ics,
nes
2784
7130
Por
tab
le d
igita
l com
put
ers
<10
kg
44 5
2956
003
46 5
0479
.51
95.7
516
.24
2885
2390
Pre
par
ed u
nrec
ord
ed m
edia
for
soun
d9
432
12 1
869
855
77.4
195
.71
18.3
0re
cord
ing
or o
ther
phe
nom
ena
nes
2984
0721
Out
boa
rd m
otor
s, s
par
k-ig
nitio
n1
943
2 45
52
035
79.1
295
.48
16.3
6
reci
pro
catin
g or
rot
ary
typ
e
3090
1390
Par
ts a
nd a
cces
sorie
s of
op
tical
ap
plia
nces
8 96
09
753
9 38
791
.88
95.4
53.
57an
d in
stru
men
ts, n
es
3142
0212
Trun
ks, s
uit-
case
s &
sim
con
tain
er w
ith/o
uter
4 27
15
068
4 47
584
.27
95.4
411
.17
surf
ace
of p
last
ics/
text
iles
3215
1190
Pal
m o
il an
d it
s fr
actio
ns r
efin
ed b
ut n
ot6
094
6 96
36
388
87.5
195
.39
7.88
chem
ical
ly m
odifi
ed
3385
4250
Ele
ctro
nic
mic
roas
sem
blie
s7
588
8 38
27
966
90.5
395
.26
4.73
3416
0590
Mol
lusc
s an
d o
ther
aq
uatic
inve
rteb
rate
s1
613
1 96
01
699
82.3
294
.96
12.6
4p
rep
ared
or
pre
serv
ed
Asia-Pacific Development Journal Vol. 18, No. 1, June 2011
97
AN
NE
X A
(co
nti
nu
ed)
Exp
ort
s (U
SD
bill
ion)
Sha
re (p
erce
ntag
e)
Wo
rld
To w
orl
d
HS
less
less
Ran
kco
de
Des
crip
tio
nA
PE
CW
orl
din
tra-
To w
orl
d in
tra-
Diff
eren
ceE
uro
pea
nE
uro
pea
nU
nio
nU
nio
ntr
ade
rad
e
3526
1310
Mol
ybd
enum
con
cent
rate
s, r
oast
ed4
427
5 84
84
665
75.6
994
.90
19.2
1
3685
4230
Mon
olith
ic in
tegr
ated
circ
uits
72 8
9682
689
76 8
7688
.16
94.8
26.
66
3795
0390
Toys
nes
6 11
87
941
6 45
577
.05
94.7
817
.73
3802
0319
Sw
ine
cuts
, fre
sh o
r ch
illed
, nes
1 65
05
369
1 74
530
.74
94.5
863
.84
3985
1890
Par
ts o
f mic
rop
hone
s, lo
udsp
eakr
s,2
168
2 56
52
293
84.5
494
.56
10.0
2he
adp
hone
s, e
arp
hone
s &
ele
c so
und
am
pli
4084
1451
Fans
: ta
ble
, roo
f etc
. w a
sel
f-co
nt e
lec
mtr
2 59
12
974
2 74
187
.14
94.5
47.
40of
an
outp
ut n
t ex
cdg
125
W
4187
1140
Mot
orcy
cles
with
rec
ipro
catg
pis
ton
engi
ne2
203
3 28
22
332
67.1
194
.44
27.3
3d
isp
lacg
> 5
00 c
c to
800
cc
4208
0212
Alm
ond
s, fr
esh
or d
ried
, she
lled
or
pee
led
1 55
22
270
1 64
668
.38
94.3
325
.95
4390
0691
Par
ts a
nd a
cces
sorie
s fo
r p
hoto
grap
hic
2 01
22
297
2 13
987
.59
94.0
96.
50ca
mer
as
4440
1519
Glo
ves
nes
of r
ubb
er1
823
2 11
61
942
86.1
793
.90
7.73
4585
3120
Ind
icat
or p
anel
s in
corp
orat
g liq
uid
cry
stal
9 29
312
453
9 89
774
.62
93.8
919
.27
dev
ice/
light
em
ittg
dio
de
4685
2721
Rad
io r
ecen
t ca
pab
l of o
p w
/o e
xt s
ourc
e5
257
8 38
65
605
62.6
893
.78
31.1
0of
pow
er f
mot
or v
eh, c
omb
ind
Asia-Pacific Development Journal Vol. 18, No. 1, June 2011
98
AN
NE
X A
(co
nti
nu
ed)
Exp
ort
s (U
SD
bill
ion)
Sha
re (p
erce
ntag
e)
Wo
rld
To w
orl
d
HS
less
less
Ran
kco
de
Des
crip
tio
nA
PE
CW
orl
din
tra-
To w
orl
d in
tra-
Diff
eren
ceE
uro
pea
nE
uro
pea
nU
nio
nU
nio
ntr
ade
rad
e
4764
0319
Sp
orts
foot
wea
r, o/
t sk
i, ou
tr s
ole
of r
br/
pla
s/3
518
4 41
13
756
79.7
693
.67
13.9
1le
athe
r &
up
per
of l
eath
er
4885
3224
Ele
ctric
al c
apac
itors
, fix
ed,
5 10
15
970
5 44
785
.43
93.6
48.
21ce
ram
ic d
iele
ctric
, mul
tilay
er, n
es
4985
4121
Tran
sist
ors,
oth
tha
n p
hoto
sens
it,4
568
5 11
14
881
89.3
993
.59
4.20
w a
dis
sip
atio
n ra
te <
1 W
5085
1830
Hea
dp
hone
s, e
arp
hone
s an
d c
omb
ined
2 61
93
417
2 80
176
.66
93.5
216
.86
mic
rop
hone
/sp
eake
r se
ts
5190
1049
Ap
par
atus
for
dra
win
g se
mic
ond
ucto
r1
675
1 80
51
794
92.8
093
.36
0.56
circ
uits
nes
5285
3400
Prin
ted
circ
uits
25 9
6330
150
27 8
4686
.11
93.2
47.
13
5340
0121
Nat
ural
rub
ber
in s
mok
ed s
heet
s1
860
2 00
42
001
92.8
492
.94
0.10
5484
7170
Com
put
er d
ata
stor
age
units
41 0
9156
180
44 2
1973
.14
92.9
319
.79
5564
0299
Foot
wea
r, ou
ter
sole
s/up
per
s of
rub
ber
6 88
28
796
7 41
178
.24
92.8
614
.62
or p
last
ics,
nes
5695
0510
Art
icle
s fo
r C
hris
tmas
fest
iviti
es1
849
2 32
71
993
79.4
792
.78
13.3
1
5785
4190
Par
ts o
f mou
nted
pie
zo-e
lect
ric c
ryst
als
3 40
63
787
3 67
489
.95
92.7
22.
77an
d s
emic
ond
ucto
r d
evic
es
5885
1829
Loud
spea
kers
, nes
2 59
33
218
2 79
880
.58
92.6
712
.09
Asia-Pacific Development Journal Vol. 18, No. 1, June 2011
99
AN
NE
X A
(co
nti
nu
ed)
Exp
ort
s (U
SD
bill
ion)
Sha
re (p
erce
ntag
e)
Wo
rld
To w
orl
d
HS
less
less
Ran
kco
de
Des
crip
tio
nA
PE
CW
orl
din
tra-
To w
orl
d in
tra-
Diff
eren
ceE
uro
pea
nE
uro
pea
nU
nio
nU
nio
ntr
ade
rad
e
5985
2090
Mag
netic
tap
e re
cord
ers
and
oth
er s
ound
1 87
83
346
2 02
756
.12
92.6
136
.49
reco
rdin
g ap
par
atus
, nes
6040
0122
Tech
nica
lly s
pec
ified
nat
ural
rub
ber
(TS
NR
)3
963
4 32
14
284
91.7
292
.51
0.79
6190
0912
Ele
ctro
stat
ic p
hoto
-cop
ying
ap
par
atus
,3
331
5 61
43
604
59.3
392
.42
33.0
9in
dire
ct p
roce
ss t
ype
6290
3141
Op
tical
inst
rum
ents
for
chec
king
1 56
91
722
1 69
891
.09
92.3
81.
29se
mic
ond
ucto
r w
afer
s
6386
0900
Car
go c
onta
iner
s d
esig
nd t
o b
e ca
rrid
by
6 33
37
289
6 85
986
.87
92.3
35.
46on
e or
mor
e m
odes
of t
rans
por
t
6429
1736
Tere
pht
halic
aci
d a
nd it
s sa
lts5
902
7 48
06
396
78.9
092
.28
13.3
8
6587
1200
Bic
ycle
s an
d o
ther
cyc
les
(incl
udin
g3
211
4 85
73
480
66.1
192
.27
26.1
6d
eliv
ery
tric
ycle
s), n
ot m
otor
ised
6664
0411
Sp
orts
foot
wea
r w
ith o
uter
sol
es o
f rub
ber
1 68
72
851
1 82
859
.16
92.2
533
.09
or p
last
ics
& u
pp
ers
of t
ex m
at
6784
7160
Com
put
er in
put
/out
put
s, w
ith/w
ithou
t54
827
73 5
1759
457
74.5
892
.21
17.6
3st
orag
e
6895
0691
Gym
nasi
um o
r at
hlet
ics
artic
les
and
2 93
43
898
3 18
475
.28
92.1
716
.89
equi
pm
ent
6980
0110
Tin
not
allo
yed
unw
roug
ht2
242
2 54
32
437
88.1
792
.01
3.84
Asia-Pacific Development Journal Vol. 18, No. 1, June 2011
100
AN
NE
X A
(co
nti
nu
ed)
Exp
ort
s (U
SD
bill
ion)
Sha
re (p
erce
ntag
e)
Wo
rld
To w
orl
d
HS
less
less
Ran
kco
de
Des
crip
tio
nA
PE
CW
orl
din
tra-
To w
orl
d in
tra-
Diff
eren
ceE
uro
pea
nE
uro
pea
nU
nio
nU
nio
ntr
ade
rad
e
7085
2313
Unr
ecor
ded
mag
netic
tap
es, o
f a w
idth
1 98
92
945
2 16
267
.54
91.9
924
.45
exce
edin
g 6.
5 m
m
7184
1510
Air
cond
ition
ing
mac
hine
s w
ind
ow o
r w
all
6 07
57
245
6 60
883
.86
91.9
38.
07ty
pes
, sel
f-co
ntai
ned
7285
1721
Facs
imile
s m
achi
nes
1 68
52
350
1 83
571
.70
91.8
320
.13
7329
0321
Vin
yl c
hlor
ide
(chl
oroe
thyl
ene)
1 60
21
916
1 74
883
.61
91.6
58.
04
7485
4091
Par
ts o
f cat
hod
e-ra
y tu
bes
1 52
81
834
1 66
883
.29
91.5
88.
29
7585
2830
Vid
eo p
roje
ctor
s4
268
5 77
14
663
73.9
591
.53
17.5
8
7672
1030
Flat
rol
led
i/na
s, e
lect
roly
tical
ly z
inc
coat
ed2
350
4 04
12
570
58.1
691
.46
33.3
0>
600
mm
7790
0190
Pris
ms,
mirr
ors
and
othe
r op
tical
ele
men
ts4
669
5 33
75
108
87.4
891
.41
3.93
of a
ny m
ater
ial,
unm
ount
ed, n
es
7885
4140
Pho
tose
nsiti
ve s
emic
ond
uct
dev
ice,
12 0
0115
736
13 1
3976
.26
91.3
315
.07
pho
tovo
ltaic
cel
ls &
ligh
t em
it d
iod
es
7940
0129
Nat
ural
rub
ber
in o
ther
form
s ne
s1
820
2 03
41
992
89.4
791
.33
1.86
8060
0292
Kni
tted
or
croc
hete
d fa
bric
s, o
f cot
ton,
nes
4 67
65
360
5 12
187
.23
91.3
04.
07
8190
3082
Inst
rum
ents
for
chec
king
sem
icon
duc
tor
2 57
32
899
2 82
988
.76
90.9
62.
20w
afer
s
8244
1213
Ply
woo
d, o
uter
ply
of t
rop
ical
har
dw
ood
,1
635
2 15
21
798
75.9
890
.94
14.9
6p
ly <
6 m
m

Asia-Pacific Development Journal Vol. 18, No. 1, June 2011
101
AN
NE
X A
(co
nti
nu
ed)
Exp
ort
s (U
SD
bill
ion)
Sha
re (p
erce
ntag
e)
Wo
rld
To w
orl
d
HS
less
less
Ran
kco
de
Des
crip
tio
nA
PE
CW
orl
din
tra-
To w
orl
d in
tra-
Diff
eren
ceE
uro
pea
nE
uro
pea
nU
nio
nU
nio
ntr
ade
rad
e
8347
0321
Che
mic
al w
ood
pul
p, s
oda
or s
ulp
hate
,6
538
9 61
67
209
68.0
090
.69
22.6
9co
nife
rous
, sem
i-b
l or
ble
ache
d, n
es
8444
0320
Logs
, pol
es, c
onife
rous
nes
3 89
25
515
4 29
470
.56
90.6
320
.07
8584
7180
Uni
ts o
f aut
omat
ic d
ata
pro
cess
ing
18 0
9327
349
20 0
0966
.16
90.4
224
.26
equi
pm
ent
nes
8685
1711
Line
tel
epho
ne s
ets
with
cor
dle
ss h
and
sets
4 01
05
369
4 44
374
.69
90.2
715
.58
8785
4110
Dio
des
, oth
er t
han
pho
tose
nsiti
ve o
r lig
ht5
496
6 80
86
094
80.7
390
.19
9.46
emitt
ing
dio
des
8885
2821
Col
or v
ideo
mon
itors
3 73
25
470
4 14
068
.23
90.1
621
.93
8985
4129
Tran
sist
ors,
oth
er t
han
pho
tose
nsiti
ve11
432
13 6
1412
688
83.9
790
.10
6.13
tran
sist
ors,
nes
9054
0752
Wov
en fa
bric
s, >
/= 8
5 p
er c
ent
of t
extu
red
3 93
04
696
4 36
683
.69
90.0
26.
33p
olye
ster
fila
men
ts, d
yed
, nes
9151
0111
Gre
asy
shor
n w
ool,
not
card
ed o
r co
mb
ed1
551
1 85
31
724
83.7
089
.96
6.26
9239
0740
Pol
ycar
bon
ates
5 24
96
748
5 84
077
.79
89.8
912
.10
9384
7330
Par
ts &
acc
esso
ries
of a
utom
atic
dat
a13
9 20
118
4 66
515
4 87
675
.38
89.8
814
.50
pro
cess
g m
achi
nes
& u
nits
the
reof
9484
0790
Eng
ines
, sp
ark-
igni
tion
typ
e ne
s1
701
2 12
31
895
80.1
489
.79
9.65
9590
0990
Par
ts a
nd a
cces
sorie
s fo
r p
hoto
-cop
ying
4 67
37
383
5 20
963
.29
89.7
126
.42
app
arat
us
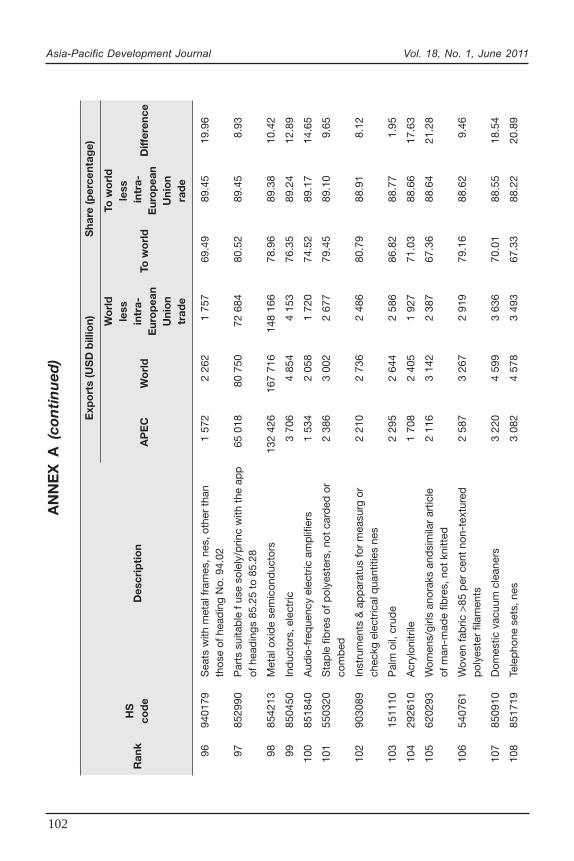
Asia-Pacific Development Journal Vol. 18, No. 1, June 2011
102
AN
NE
X A
(co
nti
nu
ed)
Exp
ort
s (U
SD
bill
ion)
Sha
re (p
erce
ntag
e)
Wo
rld
To w
orl
d
HS
less
less
Ran
kco
de
Des
crip
tio
nA
PE
CW
orl
din
tra-
To w
orl
d in
tra-
Diff
eren
ceE
uro
pea
nE
uro
pea
nU
nio
nU
nio
ntr
ade
rad
e
9694
0179
Sea
ts w
ith m
etal
fram
es, n
es, o
ther
tha
n1
572
2 26
21
757
69.4
989
.45
19.9
6th
ose
of h
ead
ing
No.
94.
02
9785
2990
Par
ts s
uita
ble
f us
e so
lely
/prin
c w
ith t
he a
pp
65 0
1880
750
72 6
8480
.52
89.4
58.
93of
hea
din
gs 8
5.25
to
85.2
8
9885
4213
Met
al o
xid
e se
mic
ond
ucto
rs13
2 42
616
7 71
614
8 16
678
.96
89.3
810
.42
9985
0450
Ind
ucto
rs, e
lect
ric3
706
4 85
44
153
76.3
589
.24
12.8
9
100
8518
40A
udio
-fre
que
ncy
elec
tric
am
plif
iers
1 53
42
058
1 72
074
.52
89.1
714
.65
101
5503
20S
tap
le fi
bre
s of
pol
yest
ers,
not
car
ded
or
2 38
63
002
2 67
779
.45
89.1
09.
65co
mb
ed
102
9030
89In
stru
men
ts &
ap
par
atus
for
mea
surg
or
2 21
02
736
2 48
680
.79
88.9
18.
12ch
eckg
ele
ctric
al q
uant
ities
nes
103
1511
10P
alm
oil,
cru
de
2 29
52
644
2 58
686
.82
88.7
71.
95
104
2926
10A
cryl
onitr
ile1
708
2 40
51
927
71.0
388
.66
17.6
3
105
6202
93W
omen
s/gi
rls a
nora
ks a
ndsi
mila
r ar
ticle
2 11
63
142
2 38
767
.36
88.6
421
.28
of m
an-m
ade
fibre
s, n
ot k
nitt
ed
106
5407
61W
oven
fab
ric >
85 p
er c
ent
non-
text
ured
2 58
73
267
2 91
979
.16
88.6
29.
46p
olye
ster
fila
men
ts
107
8509
10D
omes
tic v
acuu
m c
lean
ers
3 22
04
599
3 63
670
.01
88.5
518
.54
108
8517
19Te
lep
hone
set
s, n
es3
082
4 57
83
493
67.3
388
.22
20.8
9
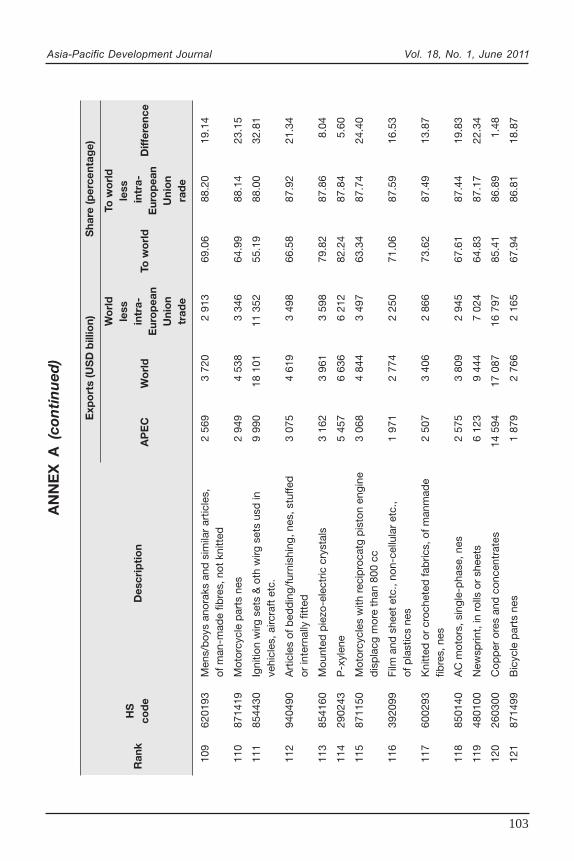
Asia-Pacific Development Journal Vol. 18, No. 1, June 2011
103
AN
NE
X A
(co
nti
nu
ed)
Exp
ort
s (U
SD
bill
ion)
Sha
re (p
erce
ntag
e)
Wo
rld
To w
orl
d
HS
less
less
Ran
kco
de
Des
crip
tio
nA
PE
CW
orl
din
tra-
To w
orl
d in
tra-
Diff
eren
ceE
uro
pea
nE
uro
pea
nU
nio
nU
nio
ntr
ade
rad
e
109
6201
93M
ens/
boy
s an
orak
s an
d s
imila
r ar
ticle
s,2
569
3 72
02
913
69.0
688
.20
19.1
4of
man
-mad
e fib
res,
not
kni
tted
110
8714
19M
otor
cycl
e p
arts
nes
2 94
94
538
3 34
664
.99
88.1
423
.15
111
8544
30Ig
nitio
n w
irg s
ets
& o
th w
irg s
ets
usd
in9
990
18 1
0111
352
55.1
988
.00
32.8
1ve
hicl
es, a
ircra
ft e
tc.
112
9404
90A
rtic
les
of b
edd
ing/
furn
ishi
ng, n
es, s
tuffe
d3
075
4 61
93
498
66.5
887
.92
21.3
4or
inte
rnal
ly fi
tted
113
8541
60M
ount
ed p
iezo
-ele
ctric
cry
stal
s3
162
3 96
13
598
79.8
287
.86
8.04
114
2902
43P
-xyl
ene
5 45
76
636
6 21
282
.24
87.8
45.
60
115
8711
50M
otor
cycl
es w
ith r
ecip
roca
tg p
isto
n en
gine
3 06
84
844
3 49
763
.34
87.7
424
.40
dis
pla
cg m
ore
than
800
cc
116
3920
99Fi
lm a
nd s
heet
etc
., no
n-ce
llula
r et
c.,
1 97
12
774
2 25
071
.06
87.5
916
.53
of p
last
ics
nes
117
6002
93K
nitt
ed o
r cr
oche
ted
fab
rics,
of m
anm
ade
2 50
73
406
2 86
673
.62
87.4
913
.87
fibre
s, n
es
118
8501
40A
C m
otor
s, s
ingl
e-p
hase
, nes
2 57
53
809
2 94
567
.61
87.4
419
.83
119
4801
00N
ewsp
rint,
in r
olls
or
shee
ts6
123
9 44
47
024
64.8
387
.17
22.3
4
120
2603
00C
opp
er o
res
and
con
cent
rate
s14
594
17 0
8716
797
85.4
186
.89
1.48
121
8714
99B
icyc
le p
arts
nes
1 87
92
766
2 16
567
.94
86.8
118
.87
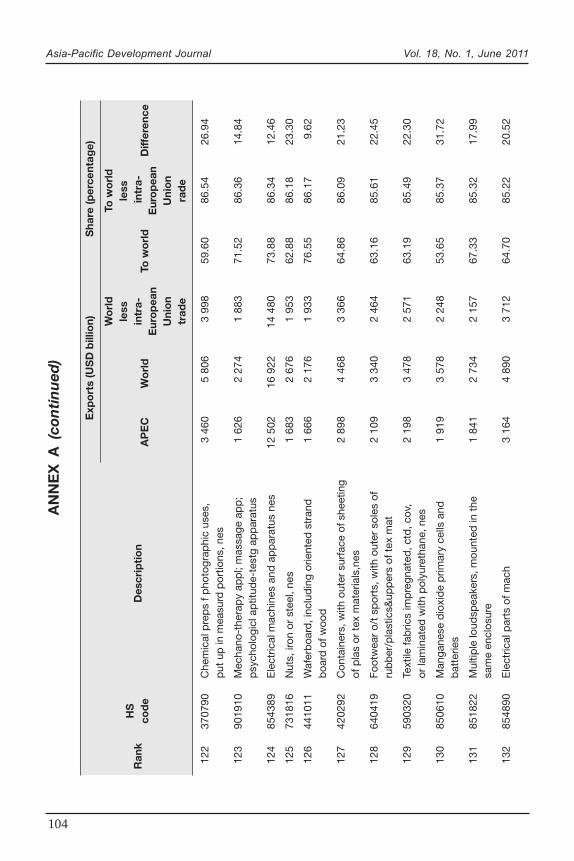
Asia-Pacific Development Journal Vol. 18, No. 1, June 2011
104
AN
NE
X A
(co
nti
nu
ed)
Exp
ort
s (U
SD
bill
ion)
Sha
re (p
erce
ntag
e)
Wo
rld
To w
orl
d
HS
less
less
Ran
kco
de
Des
crip
tio
nA
PE
CW
orl
din
tra-
To w
orl
d in
tra-
Diff
eren
ceE
uro
pea
nE
uro
pea
nU
nio
nU
nio
ntr
ade
rad
e
122
3707
90C
hem
ical
pre
ps
f pho
togr
aphi
c us
es,
3 46
05
806
3 99
859
.60
86.5
426
.94
put
up
in m
easu
rd p
ortio
ns, n
es
123
9019
10M
echa
no-t
hera
py
app
l; m
assa
ge a
pp
;1
626
2 27
41
883
71.5
286
.36
14.8
4p
sych
olog
icl a
ptit
ude-
test
g ap
par
atus
124
8543
89E
lect
rical
mac
hine
s an
d a
pp
arat
us n
es12
502
16 9
2214
480
73.8
886
.34
12.4
6
125
7318
16N
uts,
iron
or
stee
l, ne
s1
683
2 67
61
953
62.8
886
.18
23.3
0
126
4410
11W
afer
boa
rd, i
nclu
din
g or
ient
ed s
tran
d1
666
2 17
61
933
76.5
586
.17
9.62
boa
rd o
f woo
d
127
4202
92C
onta
iner
s, w
ith o
uter
sur
face
of s
heet
ing
2 89
84
468
3 36
664
.86
86.0
921
.23
of p
las
or t
ex m
ater
ials
,nes
128
6404
19Fo
otw
ear
o/t
spor
ts, w
ith o
uter
sol
es o
f2
109
3 34
02
464
63.1
685
.61
22.4
5ru
bb
er/p
last
ics&
upp
ers
of t
ex m
at
129
5903
20Te
xtile
fab
rics
imp
regn
ated
, ctd
, cov
,2
198
3 47
82
571
63.1
985
.49
22.3
0or
lam
inat
ed w
ith p
olyu
reth
ane,
nes
130
8506
10M
anga
nese
dio
xid
e p
rimar
y ce
lls a
nd1
919
3 57
82
248
53.6
585
.37
31.7
2b
atte
ries
131
8518
22M
ultip
le lo
udsp
eake
rs, m
ount
ed in
the
1 84
12
734
2 15
767
.33
85.3
217
.99
sam
e en
clos
ure
132
8548
90E
lect
rical
par
ts o
f mac
h3
164
4 89
03
712
64.7
085
.22
20.5
2
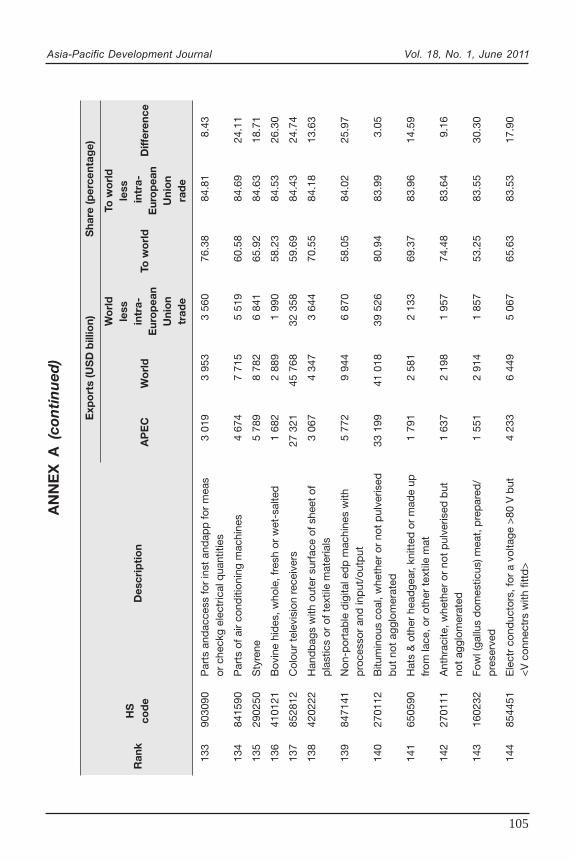
Asia-Pacific Development Journal Vol. 18, No. 1, June 2011
105
AN
NE
X A
(co
nti
nu
ed)
Exp
ort
s (U
SD
bill
ion)
Sha
re (p
erce
ntag
e)
Wo
rld
To w
orl
d
HS
less
less
Ran
kco
de
Des
crip
tio
nA
PE
CW
orl
din
tra-
To w
orl
d in
tra-
Diff
eren
ceE
uro
pea
nE
uro
pea
nU
nio
nU
nio
ntr
ade
rad
e
133
9030
90P
arts
and
acce
ss fo
r in
st a
ndap
p fo
r m
eas
3 01
93
953
3 56
076
.38
84.8
18.
43or
che
ckg
elec
tric
al q
uant
ities
134
8415
90P
arts
of a
ir co
nditi
onin
g m
achi
nes
4 67
47
715
5 51
960
.58
84.6
924
.11
135
2902
50S
tyre
ne5
789
8 78
26
841
65.9
284
.63
18.7
1
136
4101
21B
ovin
e hi
des
, who
le, f
resh
or
wet
-sal
ted
1 68
22
889
1 99
058
.23
84.5
326
.30
137
8528
12C
olou
r te
levi
sion
rec
eive
rs27
321
45 7
6832
358
59.6
984
.43
24.7
4
138
4202
22H
and
bag
s w
ith o
uter
sur
face
of s
heet
of
3 06
74
347
3 64
470
.55
84.1
813
.63
pla
stic
s or
of t
extil
e m
ater
ials
139
8471
41N
on-p
orta
ble
dig
ital e
dp
mac
hine
s w
ith5
772
9 94
46
870
58.0
584
.02
25.9
7p
roce
ssor
and
inp
ut/o
utp
ut
140
2701
12B
itum
inou
s co
al, w
heth
er o
r no
t p
ulve
rised
33 1
9941
018
39 5
2680
.94
83.9
93.
05b
ut n
ot a
gglo
mer
ated
141
6505
90H
ats
& o
ther
hea
dge
ar, k
nitt
ed o
r m
ade
up1
791
2 58
12
133
69.3
783
.96
14.5
9fr
om la
ce, o
r ot
her
text
ile m
at
142
2701
11A
nthr
acite
, whe
ther
or
not
pul
veris
ed b
ut1
637
2 19
81
957
74.4
883
.64
9.16
not
aggl
omer
ated
143
1602
32Fo
wl (
gallu
s d
omes
ticus
) mea
t, p
rep
ared
/1
551
2 91
41
857
53.2
583
.55
30.3
0p
rese
rved
144
8544
51E
lect
r co
nduc
tors
, for
a v
olta
ge >
80 V
but
4 23
36
449
5 06
765
.63
83.5
317
.90
<V
con
nect
rs w
ith fi
ttd
>
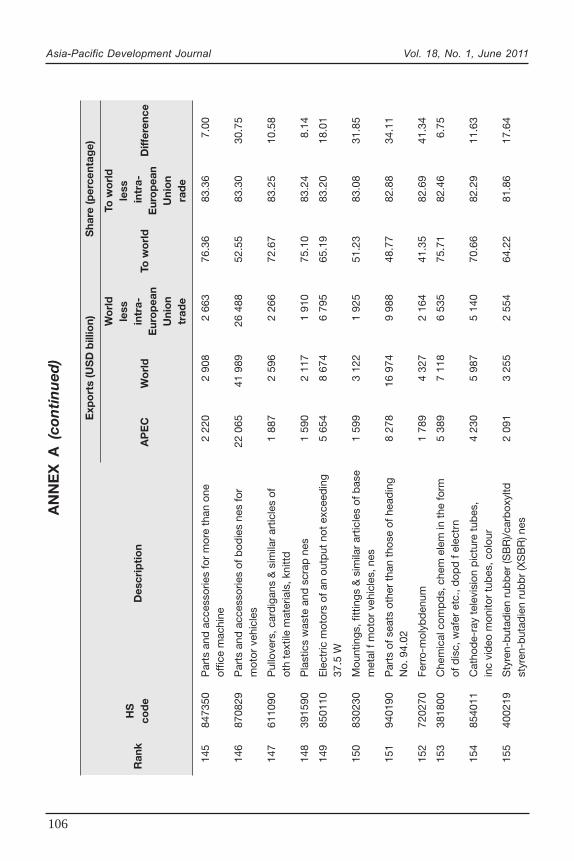
Asia-Pacific Development Journal Vol. 18, No. 1, June 2011
106
AN
NE
X A
(co
nti
nu
ed)
Exp
ort
s (U
SD
bill
ion)
Sha
re (p
erce
ntag
e)
Wo
rld
To w
orl
d
HS
less
less
Ran
kco
de
Des
crip
tio
nA
PE
CW
orl
din
tra-
To w
orl
d in
tra-
Diff
eren
ceE
uro
pea
nE
uro
pea
nU
nio
nU
nio
ntr
ade
rad
e
145
8473
50P
arts
and
acc
esso
ries
for
mor
e th
an o
ne2
220
2 90
82
663
76.3
683
.36
7.00
offic
e m
achi
ne
146
8708
29P
arts
and
acc
esso
ries
of b
odie
s ne
s fo
r22
065
41 9
8926
488
52.5
583
.30
30.7
5m
otor
veh
icle
s
147
6110
90P
ullo
vers
, car
dig
ans
& s
imila
r ar
ticle
s of
1 88
72
596
2 26
672
.67
83.2
510
.58
oth
text
ile m
ater
ials
, kni
ttd
148
3915
90P
last
ics
was
te a
nd s
crap
nes
1 59
02
117
1 91
075
.10
83.2
48.
14
149
8501
10E
lect
ric m
otor
s of
an
outp
ut n
ot e
xcee
din
g5
654
8 67
46
795
65.1
983
.20
18.0
137
.5 W
150
8302
30M
ount
ings
, fitt
ings
& s
imila
r ar
ticle
s of
bas
e1
599
3 12
21
925
51.2
383
.08
31.8
5m
etal
f m
otor
veh
icle
s, n
es
151
9401
90P
arts
of s
eats
oth
er t
han
thos
e of
hea
din
g8
278
16 9
749
988
48.7
782
.88
34.1
1N
o. 9
4.02
152
7202
70Fe
rro-
mol
ybd
enum
1 78
94
327
2 16
441
.35
82.6
941
.34
153
3818
00C
hem
ical
com
pd
s, c
hem
ele
m in
the
form
5 38
97
118
6 53
575
.71
82.4
66.
75of
dis
c, w
afer
etc
., d
opd
f el
ectr
n
154
8540
11C
atho
de-
ray
tele
visi
on p
ictu
re t
ubes
,4
230
5 98
75
140
70.6
682
.29
11.6
3in
c vi
deo
mon
itor
tub
es, c
olou
r
155
4002
19S
tyre
n-b
utad
ien
rub
ber
(SB
R)/
carb
oxyl
td2
091
3 25
52
554
64.2
281
.86
17.6
4st
yren
-but
adie
n ru
bb
r (X
SB
R) n
es
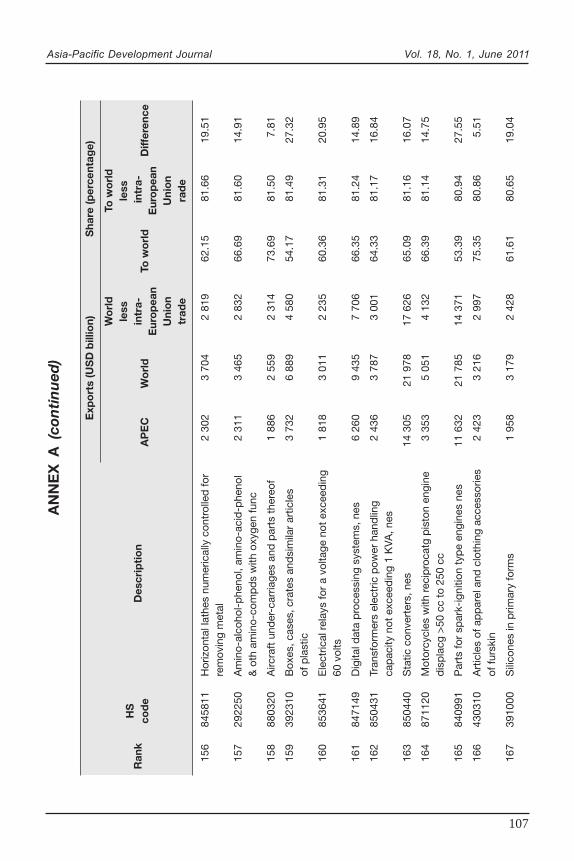
Asia-Pacific Development Journal Vol. 18, No. 1, June 2011
107
AN
NE
X A
(co
nti
nu
ed)
Exp
ort
s (U
SD
bill
ion)
Sha
re (p
erce
ntag
e)
Wo
rld
To w
orl
d
HS
less
less
Ran
kco
de
Des
crip
tio
nA
PE
CW
orl
din
tra-
To w
orl
d in
tra-
Diff
eren
ceE
uro
pea
nE
uro
pea
nU
nio
nU
nio
ntr
ade
rad
e
156
8458
11H
oriz
onta
l lat
hes
num
eric
ally
con
trol
led
for
2 30
23
704
2 81
962
.15
81.6
619
.51
rem
ovin
g m
etal
157
2922
50A
min
o-al
coho
l-p
heno
l, am
ino-
acid
-phe
nol
2 31
13
465
2 83
266
.69
81.6
014
.91
& o
th a
min
o-co
mp
ds
with
oxy
gen
func
158
8803
20A
ircra
ft u
nder
-car
riage
s an
d p
arts
the
reof
1 88
62
559
2 31
473
.69
81.5
07.
81
159
3923
10B
oxes
, cas
es, c
rate
s an
dsi
mila
r ar
ticle
s3
732
6 88
94
580
54.1
781
.49
27.3
2of
pla
stic
160
8536
41E
lect
rical
rel
ays
for
a vo
ltage
not
exc
eed
ing
1 81
83
011
2 23
560
.36
81.3
120
.95
60 v
olts
161
8471
49D
igita
l dat
a p
roce
ssin
g sy
stem
s, n
es6
260
9 43
57
706
66.3
581
.24
14.8
9
162
8504
31Tr
ansf
orm
ers
elec
tric
pow
er h
and
ling
2 43
63
787
3 00
164
.33
81.1
716
.84
cap
acity
not
exc
eed
ing
1 K
VA, n
es
163
8504
40S
tatic
con
vert
ers,
nes
14 3
0521
978
17 6
2665
.09
81.1
616
.07
164
8711
20M
otor
cycl
es w
ith r
ecip
roca
tg p
isto
n en
gine
3 35
35
051
4 13
266
.39
81.1
414
.75
dis
pla
cg >
50 c
c to
250
cc
165
8409
91P
arts
for
spar
k-ig
nitio
n ty
pe
engi
nes
nes
11 6
3221
785
14 3
7153
.39
80.9
427
.55
166
4303
10A
rtic
les
of a
pp
arel
and
clo
thin
g ac
cess
orie
s2
423
3 21
62
997
75.3
580
.86
5.51
of fu
rski
n
167
3910
00S
ilico
nes
in p
rimar
y fo
rms
1 95
83
179
2 42
861
.61
80.6
519
.04
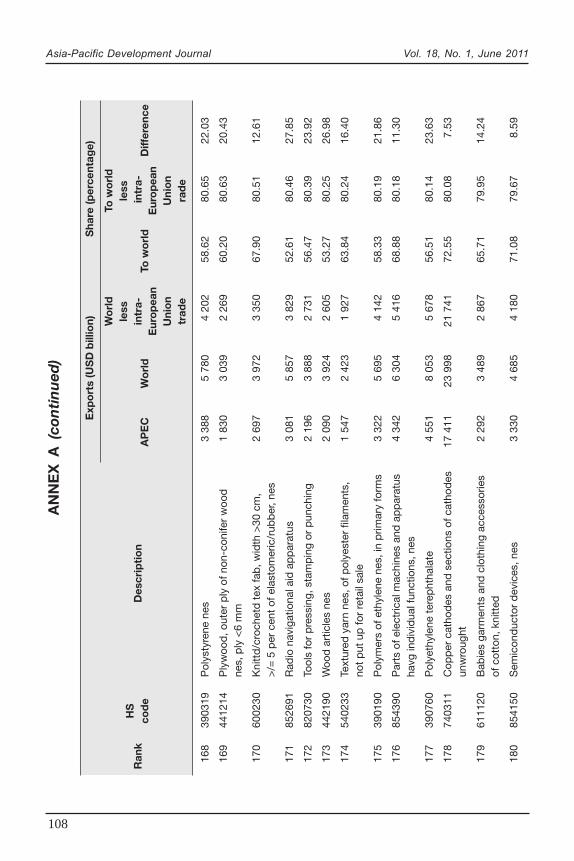
Asia-Pacific Development Journal Vol. 18, No. 1, June 2011
108
AN
NE
X A
(co
nti
nu
ed)
Exp
ort
s (U
SD
bill
ion)
Sha
re (p
erce
ntag
e)
Wo
rld
To w
orl
d
HS
less
less
Ran
kco
de
Des
crip
tio
nA
PE
CW
orl
din
tra-
To w
orl
d in
tra-
Diff
eren
ceE
uro
pea
nE
uro
pea
nU
nio
nU
nio
ntr
ade
rad
e
168
3903
19P
olys
tyre
ne n
es3
388
5 78
04
202
58.6
280
.65
22.0
3
169
4412
14P
lyw
ood
, out
er p
ly o
f non
-con
ifer
woo
d1
830
3 03
92
269
60.2
080
.63
20.4
3ne
s, p
ly <
6 m
m
170
6002
30K
nitt
d/c
roch
etd
tex
fab
, wid
th >
30 c
m,
2 69
73
972
3 35
067
.90
80.5
112
.61
>/=
5 p
er c
ent
of e
last
omer
ic/r
ubb
er, n
es
171
8526
91R
adio
nav
igat
iona
l aid
ap
par
atus
3 08
15
857
3 82
952
.61
80.4
627
.85
172
8207
30To
ols
for
pre
ssin
g, s
tam
pin
g or
pun
chin
g2
196
3 88
82
731
56.4
780
.39
23.9
2
173
4421
90W
ood
art
icle
s ne
s2
090
3 92
42
605
53.2
780
.25
26.9
8
174
5402
33Te
xtur
ed y
arn
nes,
of p
olye
ster
fila
men
ts,
1 54
72
423
1 92
763
.84
80.2
416
.40
not
put
up
for
reta
il sa
le
175
3901
90P
olym
ers
of e
thyl
ene
nes,
in p
rimar
y fo
rms
3 32
25
695
4 14
258
.33
80.1
921
.86
176
8543
90P
arts
of e
lect
rical
mac
hine
s an
d a
pp
arat
us4
342
6 30
45
416
68.8
880
.18
11.3
0ha
vg in
div
idua
l fun
ctio
ns, n
es
177
3907
60P
olye
thyl
ene
tere
pht
hala
te4
551
8 05
35
678
56.5
180
.14
23.6
3
178
7403
11C
opp
er c
atho
des
and
sec
tions
of c
atho
des
17 4
1123
998
21 7
4172
.55
80.0
87.
53un
wro
ught
179
6111
20B
abie
s ga
rmen
ts a
nd c
loth
ing
acce
ssor
ies
2 29
23
489
2 86
765
.71
79.9
514
.24
of c
otto
n, k
nitt
ed
180
8541
50S
emic
ond
ucto
r d
evic
es, n
es3
330
4 68
54
180
71.0
879
.67
8.59
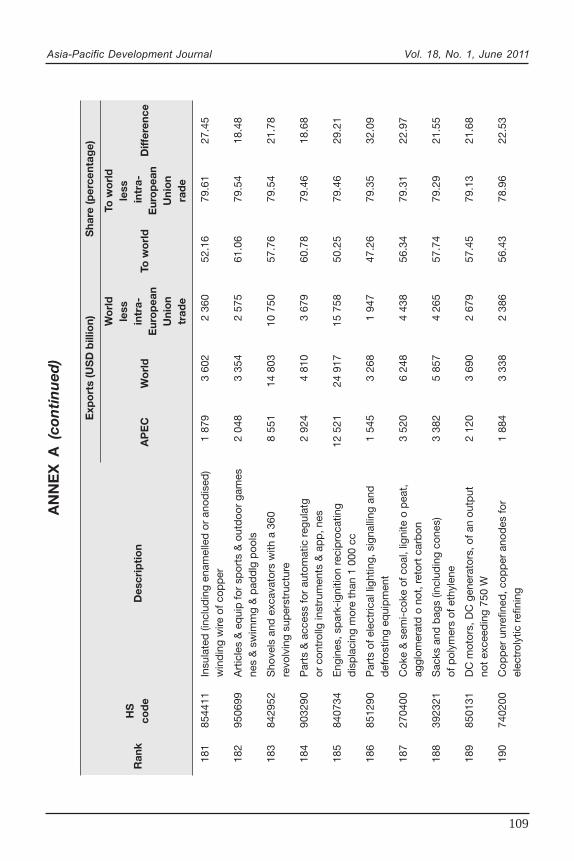
Asia-Pacific Development Journal Vol. 18, No. 1, June 2011
109
AN
NE
X A
(co
nti
nu
ed)
Exp
ort
s (U
SD
bill
ion)
Sha
re (p
erce
ntag
e)
Wo
rld
To w
orl
d
HS
less
less
Ran
kco
de
Des
crip
tio
nA
PE
CW
orl
din
tra-
To w
orl
d in
tra-
Diff
eren
ceE
uro
pea
nE
uro
pea
nU
nio
nU
nio
ntr
ade
rad
e
181
8544
11In
sula
ted
(inc
lud
ing
enam
elle
d o
r an
odis
ed)
1 87
93
602
2 36
052
.16
79.6
127
.45
win
din
g w
ire o
f cop
per
182
9506
99A
rtic
les
& e
qui
p fo
r sp
orts
& o
utd
oor
gam
es2
048
3 35
42
575
61.0
679
.54
18.4
8ne
s &
sw
imm
g &
pad
dlg
poo
ls
183
8429
52S
hove
ls a
nd e
xcav
ator
s w
ith a
360
8 55
114
803
10 7
5057
.76
79.5
421
.78
revo
lvin
g su
per
stru
ctur
e
184
9032
90P
arts
& a
cces
s fo
r au
tom
atic
reg
ulat
g2
924
4 81
03
679
60.7
879
.46
18.6
8or
con
trol
lg in
stru
men
ts &
ap
p, n
es
185
8407
34E
ngin
es, s
par
k-ig
nitio
n re
cip
roca
ting
12 5
2124
917
15 7
5850
.25
79.4
629
.21
dis
pla
cing
mor
e th
an 1
000
cc
186
8512
90P
arts
of e
lect
rical
ligh
ting,
sig
nalli
ng a
nd1
545
3 26
81
947
47.2
679
.35
32.0
9d
efro
stin
g eq
uip
men
t
187
2704
00C
oke
& s
emi-
coke
of c
oal,
ligni
te o
pea
t,3
520
6 24
84
438
56.3
479
.31
22.9
7ag
glom
erat
d o
not
, ret
ort
carb
on
188
3923
21S
acks
and
bag
s (in
clud
ing
cone
s)3
382
5 85
74
265
57.7
479
.29
21.5
5of
pol
ymer
s of
eth
ylen
e
189
8501
31D
C m
otor
s, D
C g
ener
ator
s, o
f an
outp
ut2
120
3 69
02
679
57.4
579
.13
21.6
8no
t ex
ceed
ing
750
W
190
7402
00C
opp
er u
nref
ined
, cop
per
ano
des
for
1 88
43
338
2 38
656
.43
78.9
622
.53
elec
trol
ytic
ref
inin
g
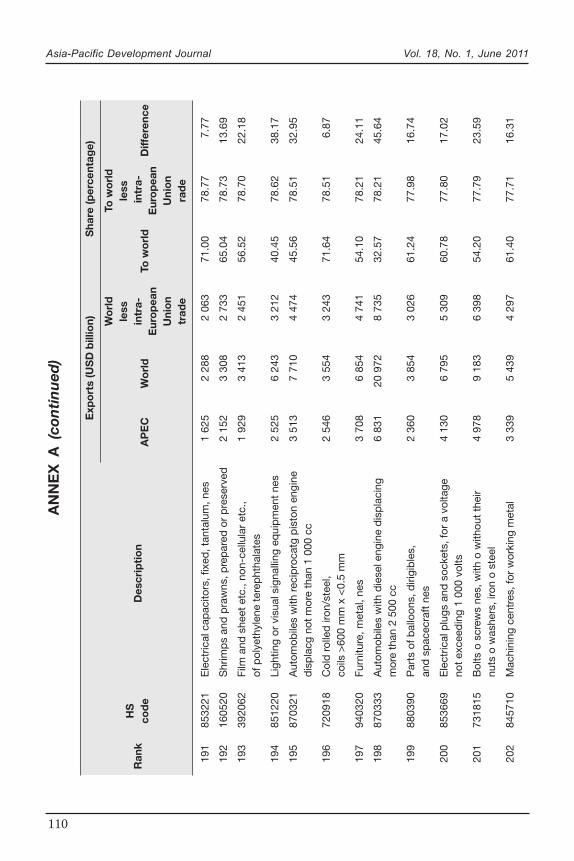
Asia-Pacific Development Journal Vol. 18, No. 1, June 2011
110
AN
NE
X A
(co
nti
nu
ed)
Exp
ort
s (U
SD
bill
ion)
Sha
re (p
erce
ntag
e)
Wo
rld
To w
orl
d
HS
less
less
Ran
kco
de
Des
crip
tio
nA
PE
CW
orl
din
tra-
To w
orl
d in
tra-
Diff
eren
ceE
uro
pea
nE
uro
pea
nU
nio
nU
nio
ntr
ade
rad
e
191
8532
21E
lect
rical
cap
acito
rs, f
ixed
, tan
talu
m, n
es1
625
2 28
82
063
71.0
078
.77
7.77
192
1605
20S
hrim
ps
and
pra
wns
, pre
par
ed o
r p
rese
rved
2 15
23
308
2 73
365
.04
78.7
313
.69
193
3920
62Fi
lm a
nd s
heet
etc
., no
n-ce
llula
r et
c.,
1 92
93
413
2 45
156
.52
78.7
022
.18
of p
olye
thyl
ene
tere
pht
hala
tes
194
8512
20Li
ghtin
g or
vis
ual s
igna
lling
eq
uip
men
t ne
s2
525
6 24
33
212
40.4
578
.62
38.1
7
195
8703
21A
utom
obile
s w
ith r
ecip
roca
tg p
isto
n en
gine
3 51
37
710
4 47
445
.56
78.5
132
.95
dis
pla
cg n
ot m
ore
than
1 0
00 c
c
196
7209
18C
old
rol
led
iron
/ste
el,
2 54
63
554
3 24
371
.64
78.5
16.
87co
ils >
600
mm
x <
0.5
mm
197
9403
20Fu
rnitu
re, m
etal
, nes
3 70
86
854
4 74
154
.10
78.2
124
.11
198
8703
33A
utom
obile
s w
ith d
iese
l eng
ine
dis
pla
cing
6 83
120
972
8 73
532
.57
78.2
145
.64
mor
e th
an 2
500
cc
199
8803
90P
arts
of b
allo
ons,
diri
gib
les,
2 36
03
854
3 02
661
.24
77.9
816
.74
and
sp
acec
raft
nes
200
8536
69E
lect
rical
plu
gs a
nd s
ocke
ts, f
or a
vol
tage
4 13
06
795
5 30
960
.78
77.8
017
.02
not
exce
edin
g 1
000
volts
201
7318
15B
olts
o s
crew
s ne
s, w
ith o
with
out
thei
r4
978
9 18
36
398
54.2
077
.79
23.5
9nu
ts o
was
hers
, iro
n o
stee
l
202
8457
10M
achi
ning
cen
tres
, for
wor
king
met
al3
339
5 43
94
297
61.4
077
.71
16.3
1
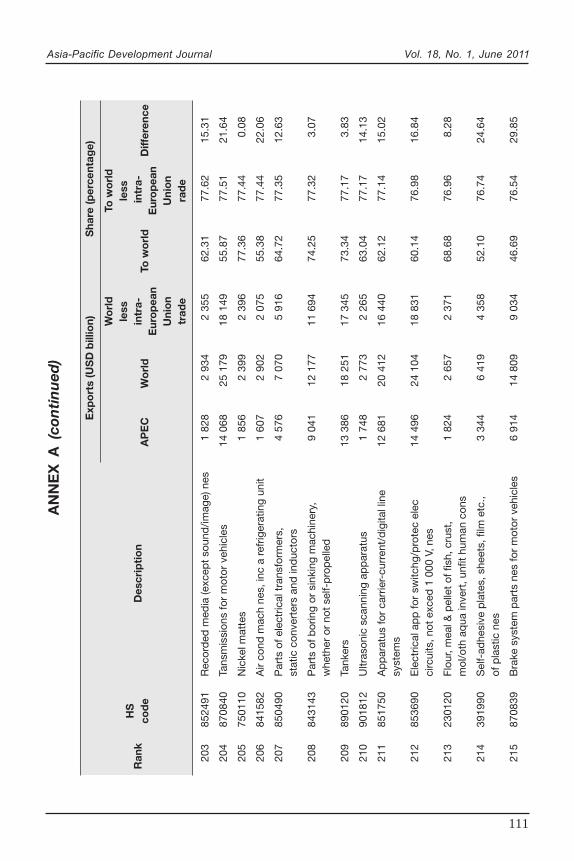
Asia-Pacific Development Journal Vol. 18, No. 1, June 2011
111
AN
NE
X A
(co
nti
nu
ed)
Exp
ort
s (U
SD
bill
ion)
Sha
re (p
erce
ntag
e)
Wo
rld
To w
orl
d
HS
less
less
Ran
kco
de
Des
crip
tio
nA
PE
CW
orl
din
tra-
To w
orl
d in
tra-
Diff
eren
ceE
uro
pea
nE
uro
pea
nU
nio
nU
nio
ntr
ade
rad
e
203
8524
91R
ecor
ded
med
ia (e
xcep
t so
und
/imag
e) n
es1
828
2 93
42
355
62.3
177
.62
15.3
1
204
8708
40Ta
nsm
issi
ons
for
mot
or v
ehic
les
14 0
6825
179
18 1
4955
.87
77.5
121
.64
205
7501
10N
icke
l mat
tes
1 85
62
399
2 39
677
.36
77.4
40.
08
206
8415
82A
ir co
nd m
ach
nes,
inc
a re
frig
erat
ing
unit
1 60
72
902
2 07
555
.38
77.4
422
.06
207
8504
90P
arts
of e
lect
rical
tra
nsfo
rmer
s,4
576
7 07
05
916
64.7
277
.35
12.6
3st
atic
con
vert
ers
and
ind
ucto
rs
208
8431
43P
arts
of b
orin
g or
sin
king
mac
hine
ry,
9 04
112
177
11 6
9474
.25
77.3
23.
07w
heth
er o
r no
t se
lf-p
rop
elle
d
209
8901
20Ta
nker
s13
386
18 2
5117
345
73.3
477
.17
3.83
210
9018
12U
ltras
onic
sca
nnin
g ap
par
atus
1 74
82
773
2 26
563
.04
77.1
714
.13
211
8517
50A
pp
arat
us fo
r ca
rrie
r-cu
rren
t/d
igita
l lin
e12
681
20 4
1216
440
62.1
277
.14
15.0
2sy
stem
s
212
8536
90E
lect
rical
ap
p fo
r sw
itchg
/pro
tec
elec
14 4
9624
104
18 8
3160
.14
76.9
816
.84
circ
uits
, not
exc
ed 1
000
V, n
es
213
2301
20Fl
our,
mea
l & p
elle
t of
fish
, cru
st,
1 82
42
657
2 37
168
.68
76.9
68.
28m
ol/o
th a
qua
inve
rt, u
nfit
hum
an c
ons
214
3919
90S
elf-
adhe
sive
pla
tes,
she
ets,
film
etc
.,3
344
6 41
94
358
52.1
076
.74
24.6
4of
pla
stic
nes
215
8708
39B
rake
sys
tem
par
ts n
es fo
r m
otor
veh
icle
s6
914
14 8
099
034
46.6
976
.54
29.8
5
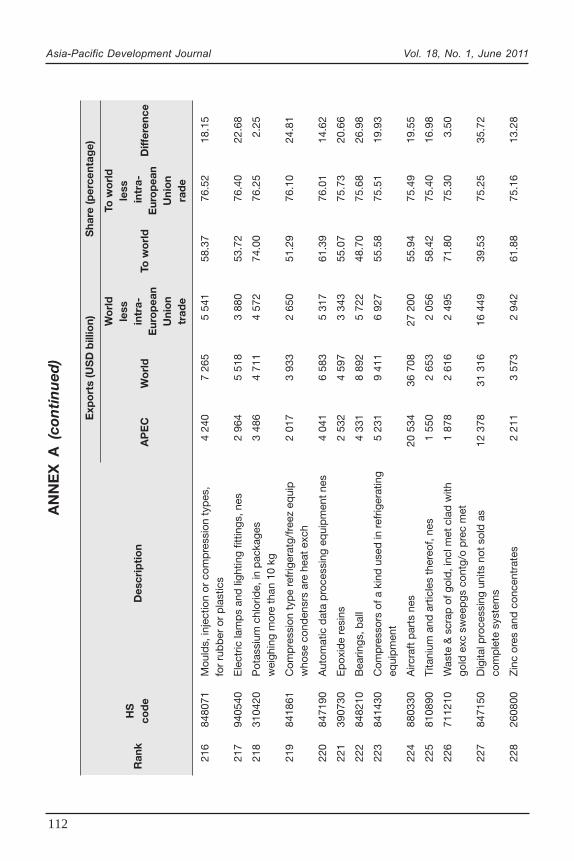
Asia-Pacific Development Journal Vol. 18, No. 1, June 2011
112
AN
NE
X A
(co
nti
nu
ed)
Exp
ort
s (U
SD
bill
ion)
Sha
re (p
erce
ntag
e)
Wo
rld
To w
orl
d
HS
less
less
Ran
kco
de
Des
crip
tio
nA
PE
CW
orl
din
tra-
To w
orl
d in
tra-
Diff
eren
ceE
uro
pea
nE
uro
pea
nU
nio
nU
nio
ntr
ade
rad
e
216
8480
71M
ould
s, in
ject
ion
or c
omp
ress
ion
typ
es,
4 24
07
265
5 54
158
.37
76.5
218
.15
for
rub
ber
or
pla
stic
s
217
9405
40E
lect
ric la
mp
s an
d li
ghtin
g fit
tings
, nes
2 96
45
518
3 88
053
.72
76.4
022
.68
218
3104
20P
otas
sium
chl
orid
e, in
pac
kage
s3
486
4 71
14
572
74.0
076
.25
2.25
wei
ghin
g m
ore
than
10
kg
219
8418
61C
omp
ress
ion
typ
e re
frig
erat
g/fr
eez
equi
p2
017
3 93
32
650
51.2
976
.10
24.8
1w
hose
con
den
srs
are
heat
exc
h
220
8471
90A
utom
atic
dat
a p
roce
ssin
g eq
uip
men
t ne
s4
041
6 58
35
317
61.3
976
.01
14.6
2
221
3907
30E
pox
ide
resi
ns2
532
4 59
73
343
55.0
775
.73
20.6
6
222
8482
10B
earin
gs, b
all
4 33
18
892
5 72
248
.70
75.6
826
.98
223
8414
30C
omp
ress
ors
of a
kin
d u
sed
in r
efrig
erat
ing
5 23
19
411
6 92
755
.58
75.5
119
.93
equi
pm
ent
224
8803
30A
ircra
ft p
arts
nes
20 5
3436
708
27 2
0055
.94
75.4
919
.55
225
8108
90Ti
tani
um a
nd a
rtic
les
ther
eof,
nes
1 55
02
653
2 05
658
.42
75.4
016
.98
226
7112
10W
aste
& s
crap
of g
old
, inc
l met
cla
d w
ith1
878
2 61
62
495
71.8
075
.30
3.50
gold
exc
sw
eep
gs c
ontg
/o p
rec
met
227
8471
50D
igita
l pro
cess
ing
units
not
sol
d a
s12
378
31 3
1616
449
39.5
375
.25
35.7
2co
mp
lete
sys
tem
s
228
2608
00Z
inc
ores
and
con
cent
rate
s2
211
3 57
32
942
61.8
875
.16
13.2
8
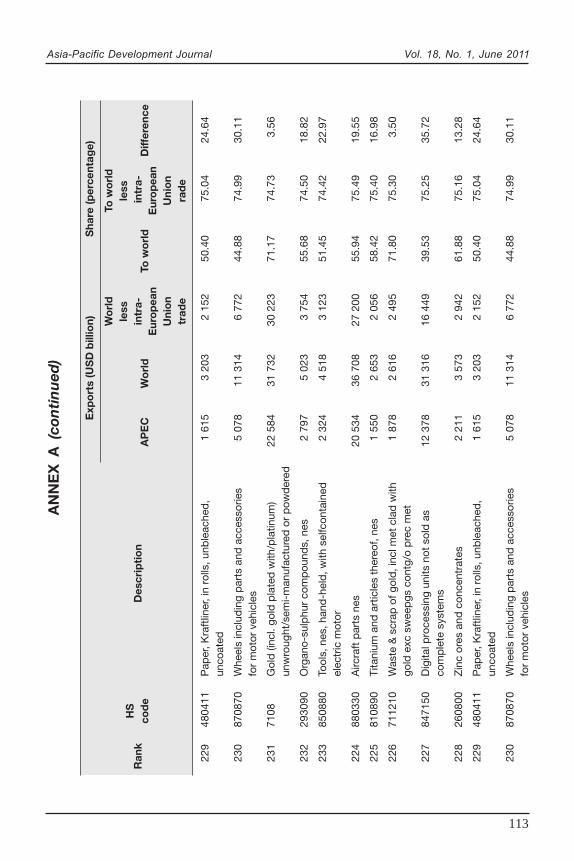
Asia-Pacific Development Journal Vol. 18, No. 1, June 2011
113
AN
NE
X A
(co
nti
nu
ed)
Exp
ort
s (U
SD
bill
ion)
Sha
re (p
erce
ntag
e)
Wo
rld
To w
orl
d
HS
less
less
Ran
kco
de
Des
crip
tio
nA
PE
CW
orl
din
tra-
To w
orl
d in
tra-
Diff
eren
ceE
uro
pea
nE
uro
pea
nU
nio
nU
nio
ntr
ade
rad
e
229
4804
11P
aper
, Kra
ftlin
er, i
n ro
lls, u
nble
ache
d,
1 61
53
203
2 15
250
.40
75.0
424
.64
unco
ated
230
8708
70W
heel
s in
clud
ing
par
ts a
nd a
cces
sorie
s5
078
11 3
146
772
44.8
874
.99
30.1
1fo
r m
otor
veh
icle
s
231
7108
Gol
d (i
ncl.
gold
pla
ted
with
/pla
tinum
)22
584
31 7
3230
223
71.1
774
.73
3.56
unw
roug
ht/s
emi-
man
ufac
ture
d o
r p
owd
ered
232
2930
90O
rgan
o-su
lphu
r co
mp
ound
s, n
es2
797
5 02
33
754
55.6
874
.50
18.8
2
233
8508
80To
ols,
nes
, han
d-h
eld
, with
sel
fcon
tain
ed2
324
4 51
83
123
51.4
574
.42
22.9
7el
ectr
ic m
otor
224
8803
30A
ircra
ft p
arts
nes
20 5
3436
708
27 2
0055
.94
75.4
919
.55
225
8108
90Ti
tani
um a
nd a
rtic
les
ther
eof,
nes
1 55
02
653
2 05
658
.42
75.4
016
.98
226
7112
10W
aste
& s
crap
of g
old
, inc
l met
cla
d w
ith1
878
2 61
62
495
71.8
075
.30
3.50
gold
exc
sw
eep
gs c
ontg
/o p
rec
met
227
8471
50D
igita
l pro
cess
ing
units
not
sol
d a
s12
378
31 3
1616
449
39.5
375
.25
35.7
2co
mp
lete
sys
tem
s
228
2608
00Z
inc
ores
and
con
cent
rate
s2
211
3 57
32
942
61.8
875
.16
13.2
8
229
4804
11P
aper
, Kra
ftlin
er, i
n ro
lls, u
nble
ache
d,
1 61
53
203
2 15
250
.40
75.0
424
.64
unco
ated
230
8708
70W
heel
s in
clud
ing
par
ts a
nd a
cces
sorie
s5
078
11 3
146
772
44.8
874
.99
30.1
1fo
r m
otor
veh
icle
s
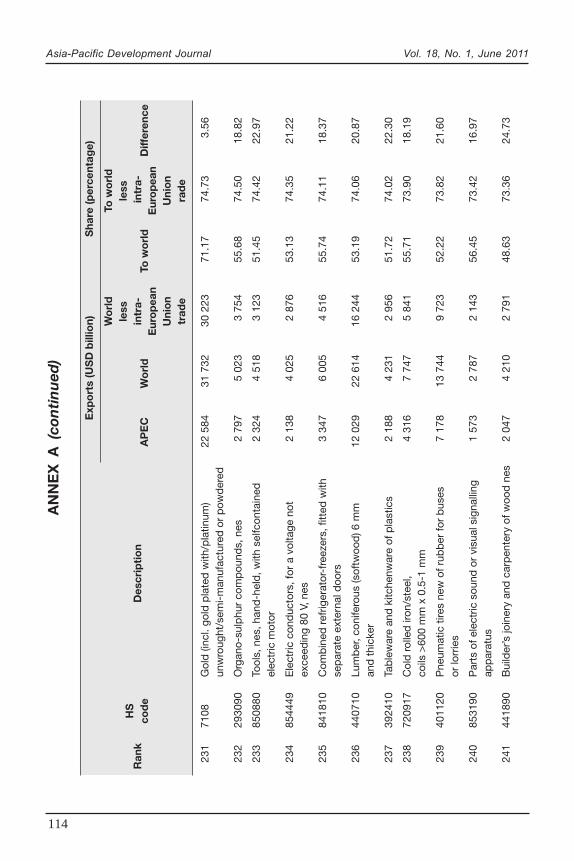
Asia-Pacific Development Journal Vol. 18, No. 1, June 2011
114
AN
NE
X A
(co
nti
nu
ed)
Exp
ort
s (U
SD
bill
ion)
Sha
re (p
erce
ntag
e)
Wo
rld
To w
orl
d
HS
less
less
Ran
kco
de
Des
crip
tio
nA
PE
CW
orl
din
tra-
To w
orl
d in
tra-
Diff
eren
ceE
uro
pea
nE
uro
pea
nU
nio
nU
nio
ntr
ade
rad
e
231
7108
Gol
d (i
ncl.
gold
pla
ted
with
/pla
tinum
)22
584
31 7
3230
223
71.1
774
.73
3.56
unw
roug
ht/s
emi-
man
ufac
ture
d o
r p
owd
ered
232
2930
90O
rgan
o-su
lphu
r co
mp
ound
s, n
es2
797
5 02
33
754
55.6
874
.50
18.8
2
233
8508
80To
ols,
nes
, han
d-h
eld
, with
sel
fcon
tain
ed2
324
4 51
83
123
51.4
574
.42
22.9
7el
ectr
ic m
otor
234
8544
49E
lect
ric c
ond
ucto
rs, f
or a
vol
tage
not
2 13
84
025
2 87
653
.13
74.3
521
.22
exce
edin
g 80
V, n
es
235
8418
10C
omb
ined
ref
riger
ator
-fre
ezer
s, fi
tted
with
3 34
76
005
4 51
655
.74
74.1
118
.37
sep
arat
e ex
tern
al d
oors
236
4407
10Lu
mb
er, c
onife
rous
(sof
twoo
d) 6
mm
12 0
2922
614
16 2
4453
.19
74.0
620
.87
and
thi
cker
237
3924
10Ta
ble
war
e an
d k
itche
nwar
e of
pla
stic
s2
188
4 23
12
956
51.7
274
.02
22.3
0
238
7209
17C
old
rol
led
iron
/ste
el,
4 31
67
747
5 84
155
.71
73.9
018
.19
coils
>60
0 m
m x
0.5
-1 m
m
239
4011
20P
neum
atic
tire
s ne
w o
f rub
ber
for
bus
es7
178
13 7
449
723
52.2
273
.82
21.6
0or
lorr
ies
240
8531
90P
arts
of e
lect
ric s
ound
or
visu
al s
igna
lling
1 57
32
787
2 14
356
.45
73.4
216
.97
app
arat
us
241
4418
90B
uild
er’s
join
ery
and
car
pen
tery
of w
ood
nes
2 04
74
210
2 79
148
.63
73.3
624
.73
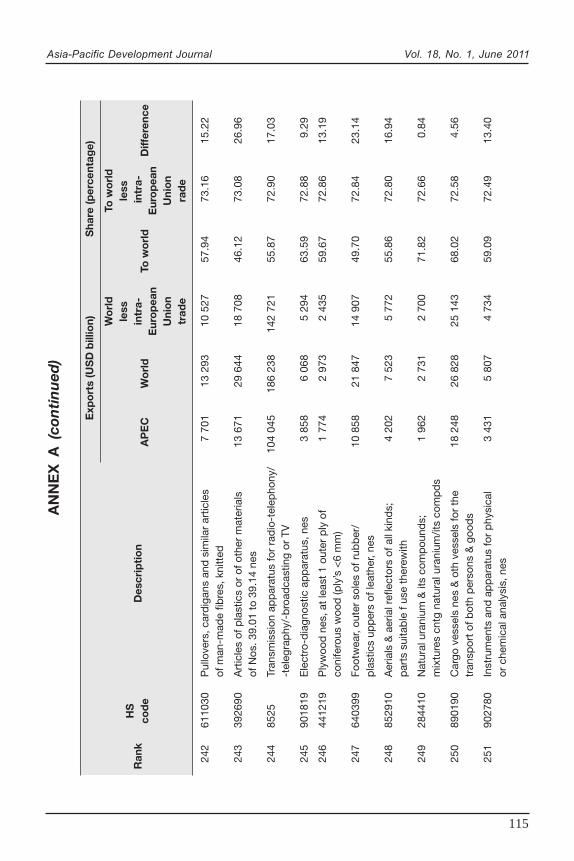
Asia-Pacific Development Journal Vol. 18, No. 1, June 2011
115
AN
NE
X A
(co
nti
nu
ed)
Exp
ort
s (U
SD
bill
ion)
Sha
re (p
erce
ntag
e)
Wo
rld
To w
orl
d
HS
less
less
Ran
kco
de
Des
crip
tio
nA
PE
CW
orl
din
tra-
To w
orl
d in
tra-
Diff
eren
ceE
uro
pea
nE
uro
pea
nU
nio
nU
nio
ntr
ade
rad
e
242
6110
30P
ullo
vers
, car
dig
ans
and
sim
ilar
artic
les
7 70
113
293
10 5
2757
.94
73.1
615
.22
of m
an-m
ade
fibre
s, k
nitt
ed
243
3926
90A
rtic
les
of p
last
ics
or o
f oth
er m
ater
ials
13 6
7129
644
18 7
0846
.12
73.0
826
.96
of N
os. 3
9.01
to
39.1
4 ne
s
244
8525
Tran
smis
sion
ap
par
atus
for
rad
io-t
elep
hony
/10
4 04
518
6 23
814
2 72
155
.87
72.9
017
.03
-tel
egra
phy
/-b
road
cast
ing
or T
V
245
9018
19E
lect
ro-d
iagn
ostic
ap
par
atus
, nes
3 85
86
068
5 29
463
.59
72.8
89.
29
246
4412
19P
lyw
ood
nes
, at
leas
t 1
oute
r p
ly o
f1
774
2 97
32
435
59.6
772
.86
13.1
9co
nife
rous
woo
d (p
ly’s
<6
mm
)
247
6403
99Fo
otw
ear,
oute
r so
les
of r
ubb
er/
10 8
5821
847
14 9
0749
.70
72.8
423
.14
pla
stic
s up
per
s of
leat
her,
nes
248
8529
10A
eria
ls &
aer
ial r
efle
ctor
s of
all
kind
s;4
202
7 52
35
772
55.8
672
.80
16.9
4p
arts
sui
tab
le f
use
ther
ewith
249
2844
10N
atur
al u
rani
um &
its
com
pou
nds;
1 96
22
731
2 70
071
.82
72.6
60.
84m
ixtu
res
cntg
nat
ural
ura
nium
/its
com
pd
s
250
8901
90C
argo
ves
sels
nes
& o
th v
esse
ls fo
r th
e18
248
26 8
2825
143
68.0
272
.58
4.56
tran
spor
t of
bot
h p
erso
ns &
goo
ds
251
9027
80In
stru
men
ts a
nd a
pp
arat
us fo
r p
hysi
cal
3 43
15
807
4 73
459
.09
72.4
913
.40
or c
hem
ical
ana
lysi
s, n
es

Asia-Pacific Development Journal Vol. 18, No. 1, June 2011
116
AN
NE
X A
(co
nti
nu
ed)
Exp
ort
s (U
SD
bill
ion)
Sha
re (p
erce
ntag
e)
Wo
rld
To w
orl
d
HS
less
less
Ran
kco
de
Des
crip
tio
nA
PE
CW
orl
din
tra-
To w
orl
d in
tra-
Diff
eren
ceE
uro
pea
nE
uro
pea
nU
nio
nU
nio
ntr
ade
rad
e
252
3811
21Lu
bric
atg
oil a
dd
itive
s cn
tg p
et o
ils/
2 00
53
927
2 76
851
.06
72.4
421
.38
oils
ob
tain
d fr
om b
itu m
iner
als
253
7210
70Fl
at r
olle
d p
rod
, i/n
as, p
aint
ed, v
arni
shed
1 84
34
594
2 54
740
.13
72.3
732
.24
or p
last
coa
ted
, >/=
600
mm
wid
e
254
4407
99Lu
mb
er, n
on-c
onife
rous
nes
2 36
33
699
3 26
663
.87
72.3
58.
48
255
7408
11W
ire o
f ref
ind
cop
per
of w
hich
the
max
4 29
88
977
5 94
347
.87
72.3
224
.45
cros
s se
ctio
nal d
imen
sion
>6
mm
256
1005
90M
aize
(cor
n) n
es6
035
10 1
248
359
59.6
272
.20
12.5
8
257
8479
89M
achi
nes
and
mec
hani
cal a
pp
lianc
es n
es20
841
33 9
3928
879
61.4
172
.17
10.7
6ha
ving
ind
ivid
ual f
unct
ions
258
8704
Mot
or v
ehic
les
for
the
tran
spor
t of
goo
ds
40 4
7982
000
56 1
0549
.37
72.1
522
.78
259
8703
24A
utom
obile
s w
ith r
ecip
roca
ting
pis
ton
78 3
3911
8 24
510
8 61
066
.25
72.1
35.
88en
gine
dis
pla
cing
>3
000
cc
260
7219
13Fl
at r
olld
pro
d, s
tain
less
ste
el, h
r in
coi
l,2
374
4 03
53
299
58.8
571
.98
13.1
3w
>/=
600
mm
, 3<
>
261
8536
50E
lect
rical
sw
itche
s fo
r a
volta
ge n
ot5
859
12 4
338
141
47.1
271
.97
24.8
5ex
ceed
ing
1 00
0 vo
lts, n
es
262
8517
90P
arts
of e
lect
rical
ap
par
atus
for
line
15 8
3926
351
22 0
1560
.11
71.9
411
.83
tele
pho
ne o
r lin
e te
legr
aphy
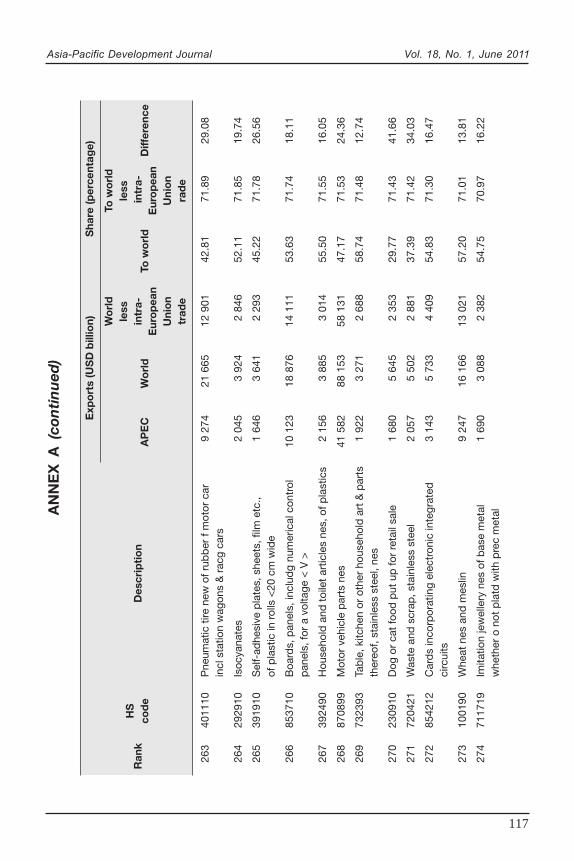
Asia-Pacific Development Journal Vol. 18, No. 1, June 2011
117
AN
NE
X A
(co
nti
nu
ed)
Exp
ort
s (U
SD
bill
ion)
Sha
re (p
erce
ntag
e)
Wo
rld
To w
orl
d
HS
less
less
Ran
kco
de
Des
crip
tio
nA
PE
CW
orl
din
tra-
To w
orl
d in
tra-
Diff
eren
ceE
uro
pea
nE
uro
pea
nU
nio
nU
nio
ntr
ade
rad
e
263
4011
10P
neum
atic
tire
new
of r
ubb
er f
mot
or c
ar9
274
21 6
6512
901
42.8
171
.89
29.0
8in
cl s
tatio
n w
agon
s &
rac
g ca
rs
264
2929
10Is
ocya
nate
s2
045
3 92
42
846
52.1
171
.85
19.7
4
265
3919
10S
elf-
adhe
sive
pla
tes,
she
ets,
film
etc
.,1
646
3 64
12
293
45.2
271
.78
26.5
6of
pla
stic
in r
olls
<20
cm
wid
e
266
8537
10B
oard
s, p
anel
s, in
clud
g nu
mer
ical
con
trol
10 1
2318
876
14 1
1153
.63
71.7
418
.11
pan
els,
for
a vo
ltage
< V
>
267
3924
90H
ouse
hold
and
toi
let
artic
les
nes,
of p
last
ics
2 15
63
885
3 01
455
.50
71.5
516
.05
268
8708
99M
otor
veh
icle
par
ts n
es41
582
88 1
5358
131
47.1
771
.53
24.3
6
269
7323
93Ta
ble
, kitc
hen
or o
ther
hou
seho
ld a
rt &
par
ts1
922
3 27
12
688
58.7
471
.48
12.7
4th
ereo
f, st
ainl
ess
stee
l, ne
s
270
2309
10D
og o
r ca
t fo
od p
ut u
p fo
r re
tail
sale
1 68
05
645
2 35
329
.77
71.4
341
.66
271
7204
21W
aste
and
scr
ap, s
tain
less
ste
el2
057
5 50
22
881
37.3
971
.42
34.0
3
272
8542
12C
ard
s in
corp
orat
ing
elec
tron
ic in
tegr
ated
3 14
35
733
4 40
954
.83
71.3
016
.47
circ
uits
273
1001
90W
heat
nes
and
mes
lin9
247
16 1
6613
021
57.2
071
.01
13.8
1
274
7117
19Im
itatio
n je
wel
lery
nes
of b
ase
met
al1
690
3 08
82
382
54.7
570
.97
16.2
2w
heth
er o
not
pla
td w
ith p
rec
met
al
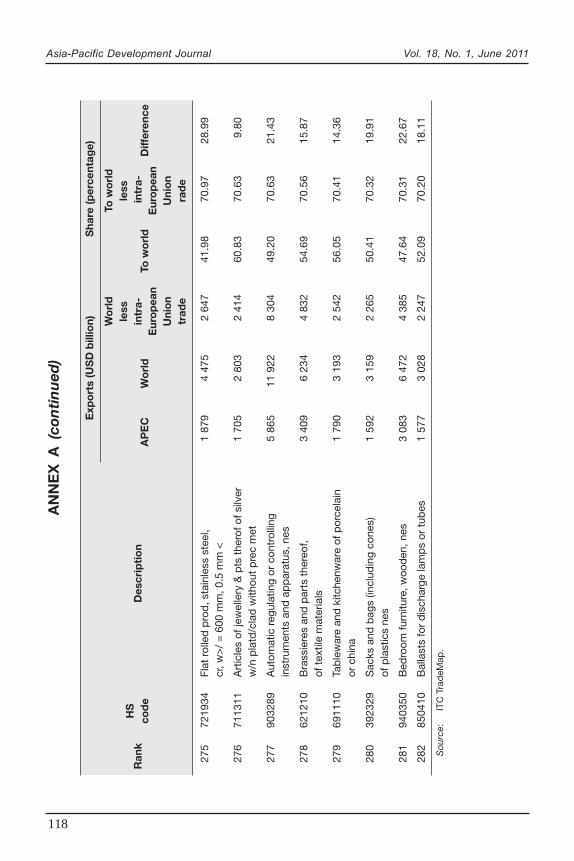
Asia-Pacific Development Journal Vol. 18, No. 1, June 2011
118
AN
NE
X A
(co
nti
nu
ed)
Exp
ort
s (U
SD
bill
ion)
Sha
re (p
erce
ntag
e)
Wo
rld
To w
orl
d
HS
less
less
Ran
kco
de
Des
crip
tio
nA
PE
CW
orl
din
tra-
To w
orl
d in
tra-
Diff
eren
ceE
uro
pea
nE
uro
pea
nU
nio
nU
nio
ntr
ade
rad
e
275
7219
34Fl
at r
olle
d p
rod
, sta
inle
ss s
teel
,1
879
4 47
52
647
41.9
870
.97
28.9
9cr
, w>
/ =
600
mm
, 0.5
mm
<
276
7113
11A
rtic
les
of je
wel
lery
& p
ts t
hero
f of s
ilver
1 70
52
803
2 41
460
.83
70.6
39.
80w
/n p
latd
/cla
d w
ithou
t p
rec
met
277
9032
89A
utom
atic
reg
ulat
ing
or c
ontr
ollin
g5
865
11 9
228
304
49.2
070
.63
21.4
3in
stru
men
ts a
nd a
pp
arat
us, n
es
278
6212
10B
rass
iere
s an
d p
arts
the
reof
,3
409
6 23
44
832
54.6
970
.56
15.8
7of
tex
tile
mat
eria
ls
279
6911
10Ta
ble
war
e an
d k
itche
nwar
e of
por
cela
in1
790
3 19
32
542
56.0
570
.41
14.3
6or
chi
na
280
3923
29S
acks
and
bag
s (in
clud
ing
cone
s)1
592
3 15
92
265
50.4
170
.32
19.9
1of
pla
stic
s ne
s
281
9403
50B
edro
om fu
rnitu
re, w
ood
en, n
es3
083
6 47
24
385
47.6
470
.31
22.6
7
282
8504
10B
alla
sts
for
dis
char
ge la
mp
s or
tub
es1
577
3 02
82
247
52.0
970
.20
18.1
1
Sou
rce:
ITC
Tra
deM
ap.
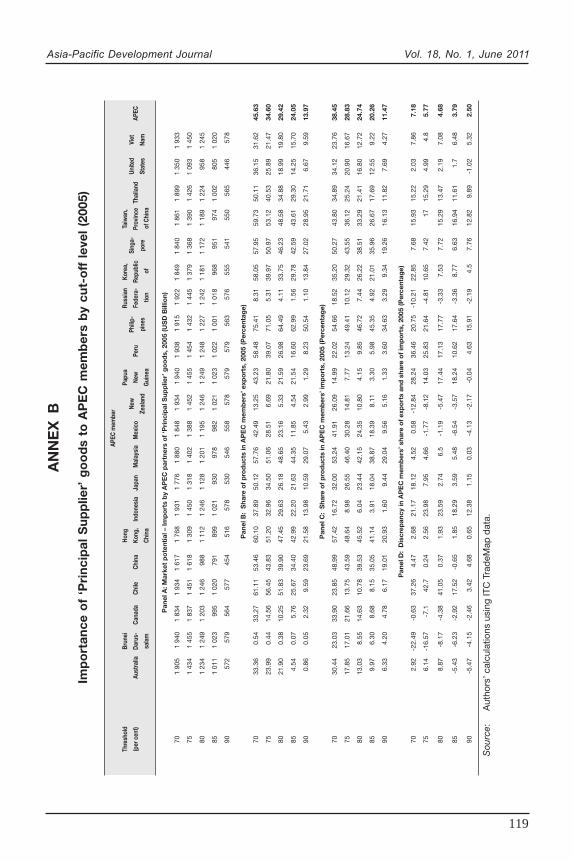
Asia-Pacific Development Journal Vol. 18, No. 1, June 2011
119
AN
NE
X B
Imp
ort
ance
of
‘Pri
nci
pal
Su
pp
lier’
go
od
s to
AP
EC
mem
ber
s b
y cu
t-o
f f l
evel
(20
05)
APEC
mem
ber
Thre
shol
dBr
unei
Hong
New
Papu
aPh
ilip-
Russ
ian
Kore
a,Si
nga-
Taiw
an,
Unite
dVi
et(p
er c
ent)
Aust
ralia
Daru
s-Ca
nada
Chile
Chin
aKo
ng,
Indo
nesi
aJa
pan
Mal
aysi
aM
exic
oZe
alan
dNe
wPe
rupi
nes
Fede
ra-
Repu
blic
pore
Prov
ince
Thai
land
Stat
esNa
mAP
EC
sala
mCh
ina
Gui
nea
tion
of
of C
hina
Pan
el A
: Mar
ket
po
tent
ial –
Imp
ort
s b
y A
PE
C p
artn
ers
of
‘Pri
ncip
al S
upp
lier’
go
od
s, 2
005
(US
D B
illio
n)
701
905
1 94
01
834
1 93
41
617
1 76
81
931
1 77
61
880
1 84
81
934
1 94
01
938
1 91
51
922
1 84
91
840
1 86
11
899
1 35
01
933
751
434
1 45
51
837
1 45
11
618
1 30
91
450
1 31
81
402
1 38
81
452
1 45
51
454
1 43
21
445
1 37
91
368
1 39
01
426
1 09
31
450
801
234
1 24
91
203
1 24
698
81
112
1 24
61
128
1 20
11
195
1 24
61
249
1 24
81
227
1 24
21
181
1 17
21
189
1 22
495
81
245
851
011
1 02
399
51
020
791
899
1 02
193
097
898
21
021
1 02
31
022
1 00
11
018
968
951
974
1 00
280
51
020
9057
257
956
457
745
451
657
853
054
655
857
857
957
956
357
655
554
155
056
544
657
8
Pan
el B
: S
hare
of
pro
duc
ts in
AP
EC
mem
ber
s’ e
xpo
rts,
200
5 (P
erce
ntag
e)
7033
.36
0.54
33.2
761
.11
53.4
660
.10
37.8
950
.12
57.7
642
.49
13.2
543
.23
58.4
875
.41
8.31
58.0
557
.95
59.7
350
.11
36.1
531
.62
45.6
3
7523
.99
0.44
14.5
656
.45
43.8
351
.20
32.9
634
.50
51.0
628
.51
6.69
21.8
039
.07
71.0
55.
3139
.97
50.9
753
.12
40.5
325
.89
21.4
734
.60
8021
.90
0.38
10.2
551
.83
39.9
047
.45
29.6
326
.18
48.6
523
.16
5.33
21.5
926
.98
64.4
94.
1133
.75
46.2
348
.58
34.8
818
.99
19.8
029
.42
854.
540.
075.
7625
.67
34.4
042
.99
22.2
021
.63
44.3
511
.85
4.54
21.5
416
.60
62.9
91.
5629
.78
42.5
943
.61
29.3
014
.25
15.7
024
.05
900.
860.
052.
329.
5923
.69
21.5
813
.98
10.5
929
.07
5.43
2.99
1.29
8.23
50.5
41.
1013
.84
27.0
228
.95
21.7
16.
679.
5913
.97
Pan
el C
: S
hare
of
pro
duc
ts in
AP
EC
mem
ber
s’ im
po
rts,
200
5 (P
erce
ntag
e)
7030
.44
23.0
333
.90
23.8
548
.99
57.4
216
.72
32.0
053
.24
41.9
126
.09
14.9
922
.02
54.6
618
.52
35.2
050
.27
43.8
034
.89
34.1
223
.76
38.4
5
7517
.85
17.0
121
.66
13.7
543
.59
48.6
48.
9826
.55
46.4
030
.28
14.8
17.
7713
.24
49.4
110
.12
29.3
243
.55
36.1
225
.24
20.9
016
.67
28.8
3
8013
.03
8.55
14.6
310
.78
39.5
345
.52
6.04
23.4
442
.15
24.3
510
.80
4.15
9.85
46.7
27.
4426
.22
38.5
133
.29
21.4
116
.80
12.7
224
.74
859.
976.
308.
688.
1535
.05
41.1
43.
9118
.04
38.8
718
.39
8.11
3.30
5.98
45.3
54.
9221
.01
35.9
626
.67
17.6
912
.55
9.22
20.2
6
906.
334.
204.
786.
1719
.01
20.9
31.
609.
4429
.04
9.56
5.16
1.33
3.60
34.6
33.
299.
3419
.26
16.1
311
.82
7.69
4.27
11.4
7
Pan
el D
: D
iscr
epan
cy in
AP
EC
mem
ber
s’ s
har e
of
exp
ort
s an
d s
hare
of
imp
ort
s, 2
005
(Per
cent
age)
702.
92-2
2.49
-0.6
337
.26
4.47
2.68
21.1
718
.12
4.52
0.58
-12.
8428
.24
36.4
620
.75
-10.
2122
.85
7.68
15.9
315
.22
2.03
7.86
7.18
756.
14-1
6.57
-7.1
42.7
0.24
2.56
23.9
87.
954.
66-1
.77
-8.1
214
.03
25.8
321
.64
-4.8
110
.65
7.42
1715
.29
4.99
4.8
5.77
808.
87-8
.17
-4.3
841
.05
0.37
1.93
23.5
92.
746.
5-1
.19
-5.4
717
.44
17.1
317
.77
-3.3
37.
537.
7215
.29
13.4
72.
197.
084.
68
85-5
.43
-6.2
3-2
.92
17.5
2-0
.65
1.85
18.2
93.
595.
48-6
.54
-3.5
718
.24
10.6
217
.64
-3.3
68.
776.
6316
.94
11.6
11.
76.
483.
79
90-5
.47
-4.1
5-2
.46
3.42
4.68
0.65
12.3
81.
150.
03-4
.13
-2.1
7-0
.04
4.63
15.9
1-2
.19
4.5
7.76
12.8
29.
89-1
.02
5.32
2.50
Sou
rce:
Aut
hors
’ cal
cula
tions
usi
ng IT
C T
rad
eMap
dat
a.
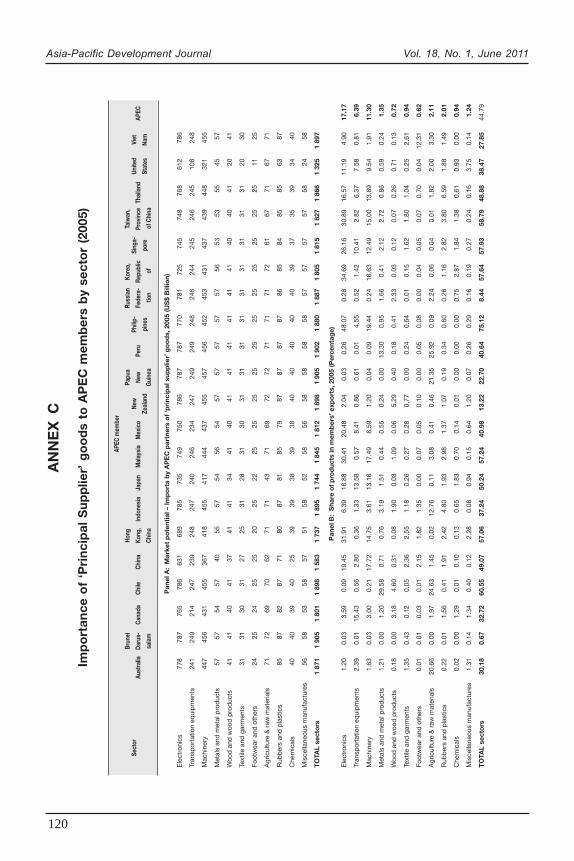
Asia-Pacific Development Journal Vol. 18, No. 1, June 2011
120
AN
NE
X C
Imp
ort
ance
of
‘Pri
nci
pal
Su
pp
lier’
go
od
s to
AP
EC
mem
ber
s b
y se
cto
r (2
005)
APEC
mem
ber
Sect
orBr
unei
Hong
New
Papu
aPh
ilip-
Russ
ian
Kore
a,Si
nga-
Taiw
an,
Unite
dVi
etAu
stra
liaDa
rus-
Cana
daCh
ileCh
ina
Kong
,In
done
sia
Japa
nM
alay
sia
Mex
ico
Zeal
and
New
Peru
pine
sFe
dera
-Re
publ
icpo
rePr
ovin
ceTh
aila
ndSt
ates
Nam
APEC
sala
mCh
ina
Gui
nea
tion
of
of C
hina
Pan
el A
: M
arke
t p
ote
ntia
l – Im
po
rts
by
AP
EC
par
tner
s o
f ‘p
rinc
ipal
sup
plie
r’ g
oo
ds,
200
5 (U
S$
Bill
ion)
Ele
ctro
nics
778
787
765
786
631
689
785
735
749
750
786
787
787
770
781
725
745
748
768
612
786
Tran
spor
tatio
n eq
uip
men
ts24
124
921
424
723
924
824
724
024
623
424
724
924
924
824
624
424
524
624
510
824
8
Mac
hine
ry44
745
643
145
536
741
845
541
744
443
745
545
745
645
245
343
143
743
944
832
145
5
Met
als
and
met
al p
rod
ucts
5757
5457
4055
5754
5654
5757
5757
5756
5353
5545
57
Woo
d a
nd w
ood
pro
duc
ts41
4140
4137
4141
3441
4041
4141
4141
4140
4041
2041
Text
ile a
nd g
arm
ents
3131
3031
2725
3128
3130
3131
3131
3131
3131
3120
30
Foot
wea
r an
d o
ther
s24
2524
2525
2025
2225
2525
2525
2525
2525
2525
1125
Agr
icul
ture
& r
aw m
ater
ials
7172
6970
6271
7143
7169
7272
7171
7172
6167
7167
71
Rub
ber
s an
d p
last
ics
8587
8287
7180
8781
8579
8787
8787
8685
8485
8563
87
Che
mic
als
4040
3940
2539
3938
3938
4040
4040
4039
3735
3934
40
Mis
cella
neou
s m
anuf
actu
res
5658
5358
5751
5852
5856
5858
5858
5757
5757
5824
58
TO
TAL
sect
ors
1 87
11
905
1 80
11
898
1 58
31
737
1 89
51
744
1 84
51
812
1 89
81
905
1 90
21
880
1 88
71
805
1 81
51
827
1 86
61
325
1 89
7
Pan
el B
: S
hare
of
pro
duc
ts in
mem
ber
s’ e
xpo
rts,
200
5 (P
erce
ntag
e)
Ele
ctro
nics
1.20
0.03
3.59
0.09
19.4
531
.91
6.39
16.8
830
.41
20.4
82.
040.
030.
2648
.07
0.28
34.6
926
.16
30.8
916
.57
11.1
94.
9017
.17
Tran
spor
tatio
n eq
uip
men
ts2.
390.
0115
.43
0.56
2.80
0.36
1.33
13.5
80.
578.
410.
860.
610.
014.
550.
521.
4210
.41
2.82
6.37
7.58
0.81
6.39
Mac
hine
ry1.
630.
033.
000.
2117
.72
14.7
53.
6113
.16
17.4
98.
591.
200.
040.
0919
.44
0.24
16.6
312
.49
15.0
013
.89
9.54
1.91
11.3
0
Met
als
and
met
al p
rod
ucts
1.21
0.00
1.20
29.5
80.
710.
763.
191.
510.
440.
550.
240.
0013
.30
0.95
1.66
0.41
2.12
2.72
0.86
0.59
0.24
1.35
Woo
d a
nd w
ood
pro
duc
ts0.
180.
003.
184.
600.
310.
081.
900.
031.
090.
065.
290.
400.
180.
412.
330.
030.
120.
070.
260.
710.
130.
72
Text
ile a
nd g
arm
ents
1.35
0.43
0.12
0.05
2.36
2.55
1.18
0.26
0.27
0.28
0.77
0.00
0.24
0.64
0.01
0.15
1.62
1.80
1.04
0.25
2.61
0.94
Foot
wea
r an
d o
ther
s0.
010.
010.
030.
012.
151.
821.
350.
000.
070.
050.
100.
000.
050.
080.
000.
040.
050.
070.
700.
0412
.31
0.62
Agr
icul
ture
& r
aw m
ater
ials
20.6
60.
001.
9724
.63
1.45
0.02
12.7
60.
113.
080.
410.
4621
.35
25.9
20.
092.
240.
060.
040.
011.
822.
003.
302.
11
Rub
ber
s an
d p
last
ics
0.22
0.01
1.56
0.41
1.91
2.42
4.80
1.93
2.98
1.37
1.07
0.19
0.34
0.60
0.26
1.16
2.82
3.80
6.59
1.88
1.49
2.01
Che
mic
als
0.02
0.00
1.29
0.01
0.10
0.13
0.65
1.83
0.70
0.14
0.01
0.00
0.00
0.00
0.75
2.87
1.84
1.38
0.61
0.93
0.00
0.94
Mis
cella
neou
s m
anuf
actu
res
1.31
0.14
1.34
0.40
0.12
2.28
0.08
0.94
0.15
0.64
1.20
0.07
0.26
0.29
0.16
0.19
0.27
0.24
0.16
3.75
0.14
1.24
TO
TAL
sect
ors
30.1
80.
6732
.72
60.5
549
.07
57.0
637
.24
50.2
457
.24
40.9
813
.22
22.7
040
.64
75.1
28.
4457
.64
57.9
358
.79
48.8
838
.47
27.8
544
.79
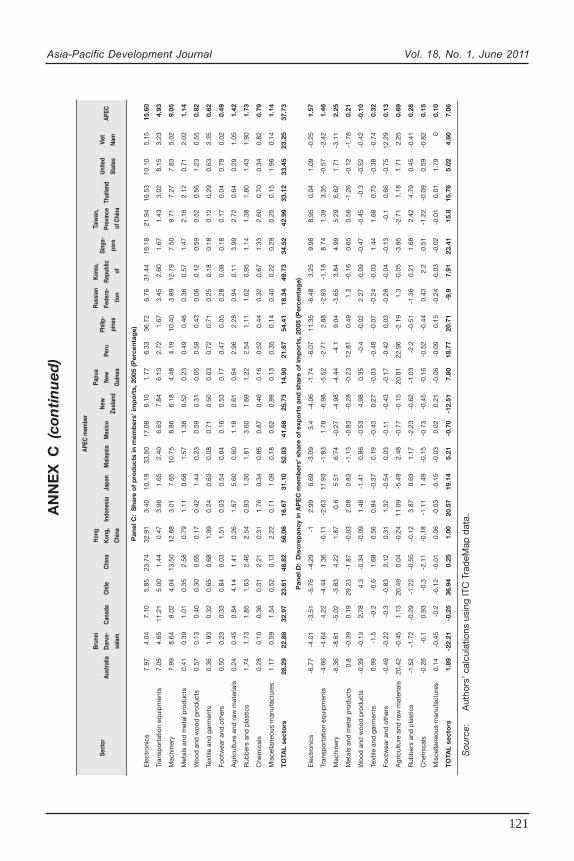
Asia-Pacific Development Journal Vol. 18, No. 1, June 2011
121
Pan
el C
: S
hare
of
pro
duc
ts in
mem
ber
s’ im
po
rts,
200
5 (P
erce
ntag
e)
Ele
ctro
nics
7.97
4.04
7.10
5.85
23.7
432
.91
3.40
10.1
933
.50
17.0
86.
101.
776.
3336
.72
6.76
31.4
416
.18
21.9
416
.53
10.1
05.
1515
.60
Tran
spor
tatio
n eq
uip
men
ts7.
054.
6511
.21
5.00
1.44
0.47
3.96
1.65
2.40
6.63
7.84
6.13
2.72
1.67
3.45
2.60
1.67
1.43
3.02
8.15
3.23
4.93
Mac
hine
ry7.
998.
648.
024.
0413
.50
12.8
83.
017.
6510
.75
8.86
6.18
4.48
4.19
10.4
03.
8912
.79
7.50
9.71
7.27
7.83
5.02
9.05
Met
als
and
met
al p
rod
ucts
0.41
0.39
1.01
0.35
2.58
0.79
1.11
0.68
1.57
1.38
0.52
0.23
0.49
0.46
0.36
0.57
1.47
2.16
2.12
0.71
2.02
1.14
Woo
d a
nd w
ood
pro
duc
ts0.
570.
130.
400.
300.
650.
170.
421.
440.
230.
590.
310.
050.
580.
430.
060.
120.
590.
520.
561.
230.
550.
82
Text
ile a
nd g
arm
ents
0.36
1.93
0.32
0.65
0.68
1.99
0.24
0.63
0.08
0.71
0.50
0.03
0.72
0.71
0.25
0.18
0.18
0.12
0.29
0.63
3.35
0.62
Foot
wea
r an
d o
ther
s0.
500.
230.
330.
840.
031.
510.
030.
540.
040.
160.
530.
170.
470.
050.
280.
080.
180.
170.
040.
790.
020.
49
Agr
icul
ture
and
raw
mat
eria
ls0.
240.
450.
844.
141.
410.
261.
675.
600.
601.
180.
610.
542.
962.
280.
940.
113.
992.
720.
640.
291.
051.
42
Rub
ber
s an
d p
last
ics
1.74
1.73
1.85
1.63
2.46
2.54
0.93
1.30
1.81
3.60
1.69
1.22
2.54
1.11
1.62
0.95
1.14
1.38
1.80
1.43
1.90
1.73
Che
mic
als
0.28
0.10
0.36
0.31
2.21
0.31
1.76
0.34
0.85
0.87
0.46
0.16
0.52
0.44
0.32
0.67
1.33
2.60
0.70
0.34
0.82
0.79
Mis
cella
neou
s m
anuf
actu
res
1.17
0.59
1.54
0.52
0.13
2.22
0.11
1.09
0.18
0.62
0.99
0.13
0.35
0.14
0.40
0.22
0.29
0.25
0.15
1.96
0.14
1.14
TO
TAL
sect
ors
28.2
922
.88
32.9
723
.61
48.8
256
.06
16.6
731
.10
52.0
341
.68
25.7
314
.90
21.8
754
.41
18.3
449
.73
34.5
242
.99
33.1
233
.45
23.2
537
.73
Pan
el D
: D
iscr
epan
cy in
AP
EC
mem
ber
s’ s
har e
of
exp
ort
s an
d s
hare
of
imp
ort
s, 2
005
(Per
cent
age)
Ele
ctro
nics
-6.7
7-4
.01
-3.5
1-5
.76
-4.2
9-1
2.99
6.69
-3.0
93.
4-4
.06
-1.7
4-6
.07
11.3
5-6
.48
3.25
9.98
8.95
0.04
1.09
-0.2
51.
57
Tran
spor
tatio
n eq
uip
men
ts-4
.66
-4.6
44.
22-4
.44
1.36
-0.1
1-2
.63
11.9
3-1
.83
1.78
-6.9
8-5
.52
-2.7
12.
88-2
.93
-1.1
88.
741.
393.
35-0
.57
-2.4
21.
46
Mac
hine
ry-6
.36
-8.6
1-5
.02
-3.8
34.
221.
870.
65.
516.
74-0
.27
-4.9
8-4
.44
-4.1
9.04
-3.6
53.
844.
995.
296.
621.
71-3
.11
2.25
Met
als
and
met
al p
rod
ucts
0.8
-0.3
90.
1929
.23
-1.8
7-0
.03
2.08
0.83
-1.1
3-0
.83
-0.2
8-0
.23
12.8
10.
491.
3-0
.16
0.65
0.56
-1.2
6-0
.12
-1.7
80.
21
Woo
d a
nd w
ood
pro
duc
ts-0
.39
-0.1
32.
784.
3-0
.34
-0.0
91.
48-1
.41
0.86
-0.5
34.
980.
35-0
.4-0
.02
2.27
-0.0
9-0
.47
-0.4
5-0
.3-0
.52
-0.4
2-0
.10
Text
ile a
nd g
arm
ents
0.99
-1.5
-0.2
-0.6
1.68
0.56
0.94
-0.3
70.
19-0
.43
0.27
-0.0
3-0
.48
-0.0
7-0
.24
-0.0
31.
441.
680.
75-0
.38
-0.7
40.
32
Foot
wea
r an
d o
ther
s-0
.49
-0.2
2-0
.3-0
.83
2.12
0.31
1.32
-0.5
40.
03-0
.11
-0.4
3-0
.17
-0.4
20.
03-0
.28
-0.0
4-0
.13
-0.1
0.66
-0.7
512
.29
0.13
Agr
icul
ture
and
raw
mat
eria
ls20
.42
-0.4
51.
1320
.49
0.04
-0.2
411
.09
-5.4
92.
48-0
.77
-0.1
520
.81
22.9
6-2
.19
1.3
-0.0
5-3
.95
-2.7
11.
181.
712.
250.
69
Rub
ber
s an
d p
last
ics
-1.5
2-1
.72
-0.2
9-1
.22
-0.5
5-0
.12
3.87
0.63
1.17
-2.2
3-0
.62
-1.0
3-2
.2-0
.51
-1.3
60.
211.
682.
424.
790.
45-0
.41
0.28
Che
mic
als
-0.2
6-0
.10.
93-0
.3-2
.11
-0.1
8-1
.11
1.49
-0.1
5-0
.73
-0.4
5-0
.16
-0.5
2-0
.44
0.43
2.2
0.51
-1.2
2-0
.09
0.59
-0.8
20.
15
Mis
cella
neou
s m
anuf
actu
res
0.14
-0.4
5-0
.2-0
.12
-0.0
10.
06-0
.03
-0.1
5-0
.03
0.02
0.21
-0.0
6-0
.09
0.15
-0.2
4-0
.03
-0.0
2-0
.01
0.01
1.79
00.
10
TO
TAL
sect
ors
1.89
-22.
21-0
.25
36.9
40.
251.
0020
.57
19.1
45.
21-0
.70
-12.
517.
8018
.77
20.7
1-9
.97.
9123
.41
15.8
15.7
65.
024.
607.
06
Sou
rce:
Aut
hors
’ cal
cula
tions
usi
ng IT
C T
rad
eMap
dat
a.
AN
NE
X C
(co
nti
nu
ed)
APEC
mem
ber
Sect
orBr
unei
Hong
New
Papu
aPh
ilip-
Russ
ian
Kore
a,Si
nga-
Taiw
an,
Unite
dVi
etAu
stra
liaDa
rus-
Cana
daCh
ileCh
ina
Kong
,In
done
sia
Japa
nM
alay
sia
Mex
ico
Zeal
and
New
Peru
pine
sFe
dera
-Re
publ
icpo
rePr
ovin
ceTh
aila
ndSt
ates
Nam
APEC
sala
mCh
ina
Gui
nea
tion
of
of C
hina
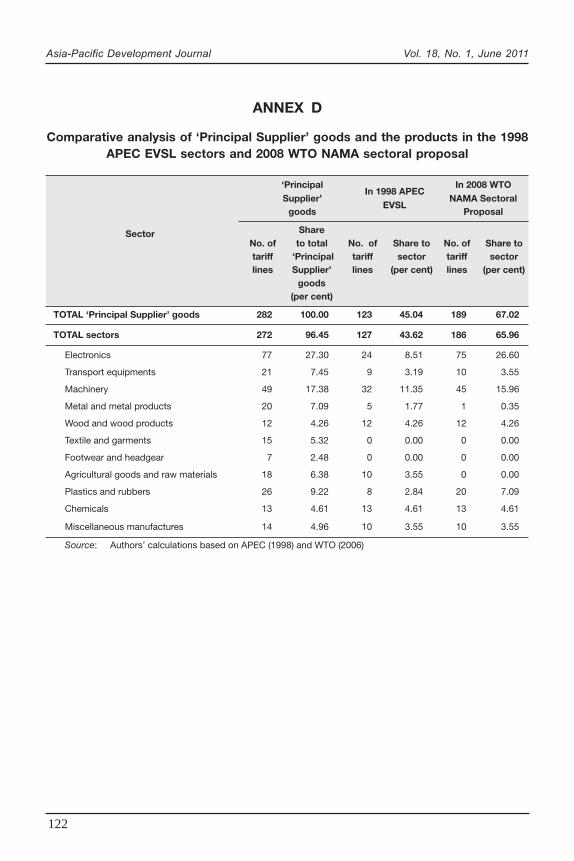
Asia-Pacific Development Journal Vol. 18, No. 1, June 2011
122
ANNEX D
Comparative analysis of ‘Principal Supplier’ goods and the products in the 1998APEC EVSL sectors and 2008 WTO NAMA sectoral proposal
‘PrincipalIn 1998 APEC
In 2008 WTOSupplier’
EVSLNAMA Sectoral
goods Proposal
Sector ShareNo. of to total No. of Share to No. of Share totariff ‘Principal tariff sector tariff sectorlines Supplier’ lines (per cent) lines (per cent)
goods(per cent)
TOTAL ‘Principal Supplier’ goods 282 100.00 123 45.04 189 67.02
TOTAL sectors 272 96.45 127 43.62 186 65.96
Electronics 77 27.30 24 8.51 75 26.60
Transport equipments 21 7.45 9 3.19 10 3.55
Machinery 49 17.38 32 11.35 45 15.96
Metal and metal products 20 7.09 5 1.77 1 0.35
Wood and wood products 12 4.26 12 4.26 12 4.26
Textile and garments 15 5.32 0 0.00 0 0.00
Footwear and headgear 7 2.48 0 0.00 0 0.00
Agricultural goods and raw materials 18 6.38 10 3.55 0 0.00
Plastics and rubbers 26 9.22 8 2.84 20 7.09
Chemicals 13 4.61 13 4.61 13 4.61
Miscellaneous manufactures 14 4.96 10 3.55 10 3.55
Source: Authors’ calculations based on APEC (1998) and WTO (2006)
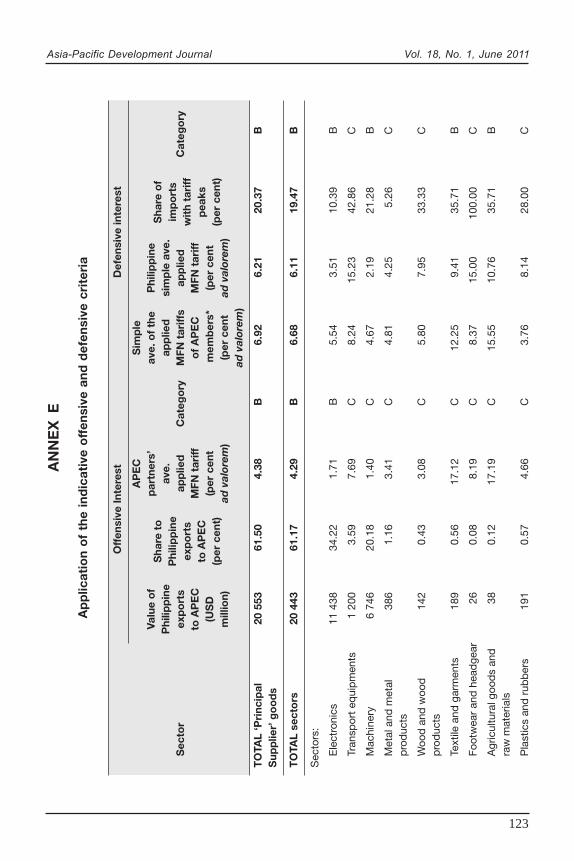
Asia-Pacific Development Journal Vol. 18, No. 1, June 2011
123
AN
NE
X E
Ap
plic
atio
n o
f th
e in
dic
ativ
e o
f fen
sive
an
d d
efen
sive
cri
teri
a
Off
ensi
ve In
tere
stD
efen
sive
inte
rest
AP
EC
Sim
ple
Valu
e o
fS
hare
to
par
tner
s’av
e. o
f th
eP
hilip
pin
eS
hare
of
Phi
lipp
ine
Phi
lipp
ine
ave.
app
lied
sim
ple
ave
.im
po
rts
Sec
tor
exp
ort
sex
po
rts
app
lied
Cat
ego
ryM
FN t
ariff
sap
plie
dw
ith
tari
ffC
ateg
ory
to A
PE
Cto
AP
EC
MFN
tar
iffo
f A
PE
CM
FN t
ariff
pea
ks(U
SD
(per
cen
t)(p
er c
ent
mem
ber
s*(p
er c
ent
(per
cen
t)m
illio
n)ad
val
orem
)(p
er c
ent
ad v
alor
em)
ad v
alor
em)
TO
TAL
‘Pri
ncip
al20
553
61.5
04.
38B
6.92
6.21
20.3
7B
Sup
plie
r’ g
oo
ds
TO
TAL
sect
ors
20 4
4361
.17
4.29
B6.
686.
1119
.47
B
Sec
tors
:
Ele
ctro
nics
11 4
3834
.22
1.71
B5.
543.
5110
.39
B
Tran
spor
t eq
uip
men
ts1
200
3.59
7.69
C8.
2415
.23
42.8
6C
Mac
hine
ry6
746
20.1
81.
40C
4.67
2.19
21.2
8B
Met
al a
nd m
etal
386
1.16
3.41
C4.
814.
255.
26C
pro
duc
ts
Woo
d a
nd w
ood
142
0.43
3.08
C5.
807.
9533
.33
Cp
rod
ucts
Text
ile a
nd g
arm
ents
189
0.56
17.1
2C
12.2
59.
4135
.71
B
Foot
wea
r an
d h
ead
gear
260.
088.
19C
8.37
15.0
010
0.00
C
Agr
icul
tura
l goo
ds
and
380.
1217
.19
C15
.55
10.7
635
.71
Bra
w m
ater
ials
Pla
stic
s an
d r
ubb
ers
191
0.57
4.66
C3.
768.
1428
.00
C
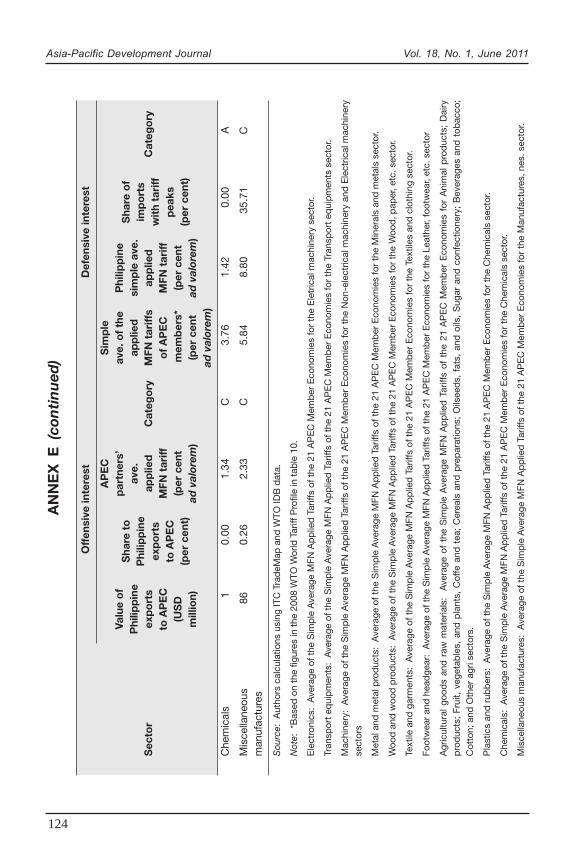
Asia-Pacific Development Journal Vol. 18, No. 1, June 2011
124
AN
NE
X E
(co
nti
nu
ed)
Off
ensi
ve in
tere
stD
efen
sive
inte
rest
AP
EC
Sim
ple
Valu
e o
fS
hare
to
par
tner
s’av
e. o
f th
eP
hilip
pin
eS
hare
of
Phi
lipp
ine
Phi
lipp
ine
ave.
app
lied
sim
ple
ave
.im
po
rts
Sec
tor
exp
ort
sex
po
rts
app
lied
Cat
ego
ryM
FN t
ariff
sap
plie
dw
ith
tari
ffC
ateg
ory
to A
PE
Cto
AP
EC
MFN
tar
iffo
f A
PE
CM
FN t
ariff
pea
ks(U
SD
(per
cen
t)(p
er c
ent
mem
ber
s*(p
er c
ent
(per
cen
t)m
illio
n)ad
val
orem
)(p
er c
ent
ad v
alor
em)
ad v
alor
em)
Che
mic
als
10.
001.
34C
3.76
1.42
0.00
A
Mis
cella
neou
s86
0.26
2.33
C5.
848.
8035
.71
Cm
anuf
actu
res
Sou
rce:
Aut
hors
cal
cula
tions
usi
ng IT
C T
rad
eMap
and
WTO
IDB
dat
a.
Not
e: *
Bas
ed o
n th
e fig
ures
in t
he 2
008
WTO
Wor
ld T
ariff
Pro
file
in t
able
10.
Ele
ctro
nics
: A
vera
ge o
f the
Sim
ple
Ave
rage
MFN
Ap
plie
d T
ariff
s of
the
21
AP
EC
Mem
ber
Eco
nom
ies
for
the
Ele
tric
al m
achi
nery
sec
tor.
Tran
spor
t eq
uip
men
ts:
Ave
rage
of t
he S
imp
le A
vera
ge M
FN A
pp
lied
Tar
iffs
of t
he 2
1 A
PE
C M
emb
er E
cono
mie
s fo
r th
e Tr
ansp
ort
equi
pm
ents
sec
tor.
Mac
hine
ry:
Ave
rage
of t
he S
imp
le A
vera
ge M
FN A
pp
lied
Tar
iffs
of t
he 2
1 A
PE
C M
emb
er E
cono
mie
s fo
r th
e N
on-e
lect
rical
mac
hine
ry a
nd E
lect
rical
mac
hine
ryse
ctor
s
Met
al a
nd m
etal
pro
duc
ts:
Ave
rage
of t
he S
imp
le A
vera
ge M
FN A
pp
lied
Tar
iffs
of t
he 2
1 A
PE
C M
emb
er E
cono
mie
s fo
r th
e M
iner
als
and
met
als
sect
or.
Woo
d a
nd w
ood
pro
duc
ts:
Ave
rage
of t
he S
imp
le A
vera
ge M
FN A
pp
lied
Tar
iffs
of t
he 2
1 A
PE
C M
emb
er E
cono
mie
s fo
r th
e W
ood
, pap
er, e
tc. s
ecto
r.
Text
ile a
nd g
arm
ents
: A
vera
ge o
f the
Sim
ple
Ave
rage
MFN
Ap
plie
d T
ariff
s of
the
21
AP
EC
Mem
ber
Eco
nom
ies
for
the
Text
iles
and
clo
thin
g se
ctor
.
Foot
wea
r an
d h
ead
gear
: A
vera
ge o
f the
Sim
ple
Ave
rage
MFN
Ap
plie
d T
ariff
s of
the
21
AP
EC
Mem
ber
Eco
nom
ies
for
the
Leat
her,
foot
wea
r, et
c. s
ecto
r
Agr
icul
tura
l go
ods
and
raw
mat
eria
ls:
Ave
rage
of
the
Sim
ple
Ave
rage
MFN
Ap
plie
d T
ariff
s of
the
21
AP
EC
Mem
ber
Eco
nom
ies
for
Ani
mal
pro
duc
ts;
Dai
ryp
rod
ucts
; Fr
uit,
veg
etab
les,
and
pla
nts,
Cof
fe a
nd t
ea;
Cer
eals
and
pre
par
atio
ns;
Oils
eed
s, f
ats,
and
oils
, S
ugar
and
con
fect
ione
ry;
Bev
erag
es a
nd t
obac
co;
Cot
ton;
and
Oth
er a
gri s
ecto
rs.
Pla
stic
s an
d r
ubb
ers:
Ave
rage
of t
he S
imp
le A
vera
ge M
FN A
pp
lied
Tar
iffs
of t
he 2
1 A
PE
C M
emb
er E
cono
mie
s fo
r th
e C
hem
ical
s se
ctor
.
Che
mic
als:
Ave
rage
of t
he S
imp
le A
vera
ge M
FN A
pp
lied
Tar
iffs
of t
he 2
1 A
PE
C M
emb
er E
cono
mie
s fo
r th
e C
hem
ical
s se
ctor
.
Mis
cella
neou
s m
anuf
actu
res:
Ave
rage
of t
he S
imp
le A
vera
ge M
FN A
pp
lied
Tar
iffs
of t
he 2
1 A
PE
C M
emb
er E
cono
mie
s fo
r th
e M
anuf
actu
res,
nes
. sec
tor.