Embed Size (px)
Citation preview

Revisionary Test Paper_Final_Syllabus 2012_Dec2008
Board of Studies, The Institute of Cost Accountants of India (Statutory Body under an Act of Parliament) Page 1
Paper 15 - Management Accounting –Enterprise Performance Management
Question 1.
(a) State whether the following statement are “True” or “False”
(i) To convert the assignment problem into a maximization problem, all elements of the
matrix are deducted from the highest element in the matrix.
(ii) EVA encourages short-term performance.
(iii) A „cost of quality report‟ indicates the total cost to the organization of producing
products or services conforming with quality of requirements.
(iv) Balance Score Card is a performance measurement tool for controlling individual
productivity.
(v) The Key factors of „Theory of Constraints‟ are Contribution and Profit.
(b) Choose the most appropriate one from the stated options and write it down.
(i) Back flush costing is most likely to be used when
A. Management desires sequential tracking of costs
B. A Just-in-Time inventory philosophy has been adopted
C. The company carries significant amount of inventory
D. Actual production costs are debited to work-in-progress
(ii) In calculating the life cycle costs of a product, which of the following items would be
included?
(i) Planning and concept design costs
(ii) Preliminary and detailed design costs
(iii) Testing costs
(iv) Production costs
(v) Distribution Costs
A. All of the Above
B. (Iv)And (v)
C. (ii), (iv) and (v)
D. (iv)
(iii) Quality Circle is
A. People-building philosophy
B. Based on the value of worker
C. Is a problem-solving technique
D. All of the above
(iv) In calculating the life cycle costs of a product, which of the following items would be
included?
A. Planning and concept design costs
B. Preliminary and detailed design costs
C. Testing costs
D. Production costs
Revisionary Test Paper_Final_Syllabus 2012_Dec2008
Board of Studies, The Institute of Cost Accountants of India (Statutory Body under an Act of Parliament) Page 2
(v) Control in management parlance consists of five actions
1. Planning
2. Comparison of achievement of plan
3. Assessment of deviations
4. Corrective action for mismatch of performance with the plan
5. Execution.
The Correct sequence of these activities is
A. 1-2-3-4-5
B. 1-5-3-4-2
C. 1-4-5-3-2
D. 1-5-2-3-4
(c) Write out what the following abbreviations stands for in the context of Enterprise Performance
Management.
(i) MPS
(ii) WAITRO
(iii) JUSE (iv) FAST (v) QFD
(d) Define the following terms in not more than two or three lines.
(i) Zero defects
(ii) The Shewhart Cycle
(iii) Cost Driver
(iv) Talent Drain
(v) V in VAT Analysis
Answer to Question 1(a):
(i) True
(ii) False
(iii) False
(iv) False
(v) False
Answer to Question 1(b):
(i) B. A Just-in-Time inventory philosophy has been adopted
(ii) A. All of the Above
(iii) D. All of the above
(iv) A. Planning and concept design costs
(v) 1-5-2-3-4
Answer to Question 1(c):
(i) Master Production Schedule
(ii) World Association of Industrial and Technological Research Organisation
(iii) Japanese Union of Scientists and Engineers
(iv) Function Analysis System Technique
(v) Quality Function Deployment

Revisionary Test Paper_Final_Syllabus 2012_Dec2008
Board of Studies, The Institute of Cost Accountants of India (Statutory Body under an Act of Parliament) Page 3
Answer to Question 1(d):
(i) Zero Defects does not mean mistakes never happen, rather that there is not allowable
number of errors built into a product or process and that you get it right first time.
(ii) The Shewhart Cycle:
PLAN- Establish the objectives and processes necessary to delivery results in accordance
with the specifications.
DO- Implement the process
CHECK- Monitor and evaluate the processes and results against objectives and
specifications and report the outcome.
ACT- Apply actions to the outcome for necessary improvement.
(iii) Cost Driver, is the one that is selected and used as a basis with a view to assigning costs
attached/attributed to an activity cost centre to cost objects-a term commonly used in
ABC costing.
(iv) The talent Drain is the second potential problem in succession planning. Because upper
management must identify a small group of managers to receive training and
development promotion, those managers who are not assigned o development
activities may feel overlooked leave the organizations. This turnover may reduce the
number of talented managers of the lower and middle lower levels of the organization.
They may work for a competing firm or start their own business, thus creating increased
competition for their former company.
(v) V in VAT Analysis a logical structure (many-to-one-flow) starts with one or few raw
materials and the product expands into a number of different products as it flows
through its routings.
Question 2.
(a) Seasonal Ltd. is manufacturing Woolen Garments. It faces high demand during winter and
slack demand during summer. Advise The Production Manager of Seasonal Ltd. how to
adjust the production capacity to meet the current demand
Answer:
Options which can be used to increase or decrease capacity to match current demand
include: (i) Hire/lay off - By hiring additional workers as needed or by laying off workers not currently
required to meet demand, firms can maintain a balance between capacity and
demand. (ii) Overtime - By asking or requiring workers to work extra hours a day or an extra day per
week, firms can create a temporary increase in capacity without the added expense of
hiring additional worker. (iii) Part-time or casual labor - By utilizing temporary workers or casual labor (workers who are
considered permanent but only work when needed, on an on-call basis, and typically
without the benefits given to full-time workers). (iv) Inventory - Finished-goods inventory can be built up in periods of slack demand and
then used to fill demand during periods of high demand. In this way no new workers
have to be hired, no temporary or casual labor is needed, and no overtime is incurred. (v) Subcontracting - Frequently firms choose to allow another manufacturer or service
provider to provide the product or service to the subcontracting firm‟s customer. By
Revisionary Test Paper_Final_Syllabus 2012_Dec2008
Board of Studies, The Institute of Cost Accountants of India (Statutory Body under an Act of Parliament) Page 4
subcontracting work to an alternative source, additional capacity is temporarily
obtained. (vi) Contract manufacturing: Sub letting spare or idle manufacturing facilities to other firms
needing extra facilities. This is the reverse of sub-contracting. (vii)Cross-training. Cross-trained employees may be able to perform tasks in several
operations, creating some flexibility when scheduling capacity. (viii) Other methods. While varying workforce size and utilization, inventory buildup/
backlogging, and subcontracting are well-known alternatives, there are other, more
novel ways that find use in industry. Among these options are sharing employees with
countercyclical companies and attempting to find interesting and meaningful projects
for employees to do during slack times.
(b) Enumerate the options available to a firm which wants to stimulate demand in order to utilize
its idle capacity.
Answer:
Demand can be stimulated by the following ways:
(i) Pricing - Varying (lower) pricing to increase demand in periods when demand is less than
peak. For example, matinee prices for movie theaters, off-season rates for hotels, night
time rates for mobile telephone service, and off-season pricing for items that experience
seasonal demand. (ii) Promotion - Advertising, direct marketing, bulk purchase discounts, bonus/free offers and
other forms of promotion are used to shift demand. (iii) Back ordering - By postponing delivery on current orders demand is shifted to period
when capacity is not fully utilized. This is really just a form of smoothing demand. Service
industries are able to smooth demand by taking reservations or by making appointments
in an attempt to avoid walk-in customer. Some refer to this as “partitioning” demand. (iv) New demand creation - A new, but complementary demand is created for a product or
service. When restaurant customers have to wait, they are frequently diverted into a
complementary (but not complimentary) service, the bar. Other examples include the
addition of video arcades within movie theaters, and the expansion of services at
convenience stores.
(c) What is Linear Decision Rule?
Answer:
Linear decision rule is an optimizing technique. It seeks to minimize total production costs (labor,
overtime, hiring/lay off, inventory carrying cost) using a set of cost-approximating functions
(three of which are quadratic) to obtain a single quadratic equation. Then, by using calculus,
two linear equations can be derived from the quadratic equation, one to be used to plan the
output for each period and the other for planning the workforce for each period.
Question 3.
(a) What is the structure of the quality circle?
Answer:
A Quality Circle has an appropriate organizational structure for its effective and efficient
performance. It varies from industry to industry, organization to organization. But it is useful to
have a basic framework as a model. The structure of a Quality Circle consists of the following
elements. (i) A steering committee: This is at the top of the structure. It is headed by a senior executive
and includes representatives from the top management personnel and human resources
Revisionary Test Paper_Final_Syllabus 2012_Dec2008
Board of Studies, The Institute of Cost Accountants of India (Statutory Body under an Act of Parliament) Page 5
development people. It establishes policy, plans and directs the program and meets
usually once in a month. (ii) Co-ordinator: He may be a Personnel or Administrative officer who co-ordinates and
supervises the work of the facilitators and administers the programme. (iii) Facilitator: He may be a senior supervisory officer. He co-ordinates the works of several
quality circles through the Circle leaders. (iv) Circle leader: Leaders may be from lowest level workers or Supervisors. A Circle leader
organizes and conducts Circle activities. (v) Circle members: They may be staff workers. Without circle members the porgramme
cannot exist. They are the lifeblood of quality circles. They should attend all meetings as
far as possible, offer suggestions and ideas, participate actively in group process, takes
training seriously with a receptive attitude. The roles of Steering Committee, Co-0rdinator,
Facilitator, Circle leader and Circle members are well defined.
(b) What is EFQM?
Answer:
EFQM a non-profit t membership foundation is the primary source for organizations in Europe
looking to excel in their market and in their business. Founded in 1989 by the CEOs of prominent
European businesses, EFQM is now the hub of excellent, globally minded organizations of all sizes
and sectors, and both private and public. Specifically designed to help organizations achieve
excellence in their business initiatives, the EFQM organization works to capture the best practices
of globally-minded organizations and to turn this knowledge into practical resources for the
business community. EFQM is a vibrant network of organizations that share the same ambitions to drive excellence through the organization and aspire to reach excellence. The EFQM
Excellence Model is a framework for organizational management systems, promoted by the
European Foundation for Quality Management (EFQM) and designed for helping organizations in
their drive towards being more competitive.
Regardless of sector, size, structure or maturity, to be successful, organizations need to establish
an appropriate management system. The EFQM Excellence Model is a practical tool to help
organizations do this by measuring where they are on the path to excellence; helping them
understand the gaps; and then stimulating solutions.
(c) What are the benefits of Kaizen Procedure?
Answer: Due to proper implementation of Kaizen Procedure, the following Tangible and
Intangible benefits can be made available to the organizations : Tangible Benefits – Sum total of small improvements contributed by all levels of employees can
results in a big pile of improvements viz. Reduced Time/ Rejection/ Energy consumption etc. along with improved quality.
Intangible Benefits – There are many intangible benefits that go a long way in developing
participative culture. These are :
(i) As the stress is on number (of small step improvements) it can be a single motivating
factor for individual employees. They take pride in increasing this number.
(ii) As these are small step improvements calling for very negligible investment, it is virtually
risk free.
(iii) It results in better team work due to certain principles of spiral thinking involved in basic
philosophy.
(iv) With increased emphasis on waste elimination it gives the employees a sense of
belonging towards organization while building a culture of loyalty.
(v) With emphasis on energy savings it helps the society as a whole in conserving
improvement resources like electricity, fuel etc.
(vi) It results in change in attitude of work force from hostile to loyal, from destructive to
constructive.

Revisionary Test Paper_Final_Syllabus 2012_Dec2008
Board of Studies, The Institute of Cost Accountants of India (Statutory Body under an Act of Parliament) Page 6
Question 4.
(a) What is Benchmarking? Discuss different types of Benchmarking.
Answer:
Benchmarking is the continuous, systematic process of measuring one‟s output and/or work
processes against the toughest competitors or those recognized best in the industry.
Benchmarking should not be treated as just comparison. It is necessary to have a point of
reference to know how well one is doing. Comparing the results with a competitor helps the
management to get a goal that is both desirable and achievable but provides no clue on how
the goals are to be achieved. Benchmarking is a systematic and continuous measurement
process. It is a process of measuring and comparing an organization‟s business processes
against business process leaders anywhere in the world, to gain information which will help the
organization to improve its performance. It is basically a quality practice. Companies choose to
benchmark excellent companies whose business processes are analogous to their own. Types of Benchmarking
Different types of benchmarking are outlined below, though some of them seem to overlap. (i) Product Benchmarking (Reverse Engineering) this is an age old practice of product
oriented reverse engineering. Every organization buys its rival‟s products and tears them
down to find out how the features and performances etc. compare with its products. This
could be the starting point for improvement. When Ford Motor Company redesigned the
Tauras in 1992, it benchmarked 209 features on the car against 7 competitors. The
company then worked to match / excel the higher standard set by any of its rival, in
each of these features with its own product. Japanese seemed to have excelled at this
practice but to their credit it must be said that they just do not imitate, but ingeniously
innovate. (ii) Competitive Benchmarking “A Measure of organizational performance compared
against competing organization; studies the target specific product designs, process
capabilities or administrative methods used by a company‟s direct competitors”.
Competitive Benchmarking moved beyond product oriented comparisons to include
comparisons of process with those of competitors. In this benchmarking, the process
studied may include marketing, finance, human resource, R & D etc. A typical example
would be the classical study the Rank Xerox performed with those of Canon and other
photo copier manufacturers when it faced heightened competition from US and
Japanese companies. (iii) Process Benchmarking “The activity of measuring discrete performance and functionality
against organizations through performance in excellent analogous business processes”.
To gain leadership position it is essential to look at a paradigm-shifting jump to a new way
of managing a process; for this you may have to go beyond your industry and look at the
“best-in-breed” to bring about a fundamental change and not just an incremental
improvement. Cadbury India benchmarks its distribution and logistics function not with
Nestle but with Hindustan Lever Ltd. For supply chain management the best practice
would be that of Mumbai Dubbawallas, which has now won universal acclaim. (iv) Internal Benchmarking “An application of process benchmarking performed, within an
organization by comparing the performance of similar business units or business
processes”. Hewlett Packard through an extensive internal benchmarking exercise on the
Best Scheduling Practice amongst its several product groups was able to cut its “time-to-
market” by half. For a company like HP introduction of new products in time was a
crucial performance metric. (v) Strategic Benchmarking “The application of process benchmarking of the level of
business strategy; a systematic process for evolving alternatives, implementing strategies,
and improving performance by understanding and adapting successful strategy from

Revisionary Test Paper_Final_Syllabus 2012_Dec2008
Board of Studies, The Institute of Cost Accountants of India (Statutory Body under an Act of Parliament) Page 7
external partners who participated in an on-going business alliance”. It will be seen that
strategic benchmarking differs from operational benchmarking in its scope; it helps to
develop a vision of the changed organizations; it will develop core competencies that
will help sustained competitive advantage; targeting a specific shift in strategy such as
entering new markets or develop new products, developing a new line of business or
making an acquisition and creating an organization that is more capable of learning
how to respond in an uncertain future because it has increased its acceptance of
change. (vi) Global Benchmarking: This is defined as “the extension of strategic benchmarking to
include benchmarking partners on a global scale”. A classic example of global
benchmarking is given by Michael Hammer in his book “Re-engineering the
corporation”. He cites the example of Ford Company of US, which benchmarked its
accounts payable function with that of Mazda in Japan and found to its astonishment
that the entire function was managed by 5 persons as against 500 in Ford.
(b) What is Intranet? What are its advantages?
Answer: An intranet is a private computer network that uses Internet protocols and network
connectivity to securely share part of an organization‟s information or operations with its
employees. Sometimes the term refers only to the most visible service, the internal website. Briefly, an intranet can be understood as “a private version of an Internet,” or as a version of the
Internet confined to an organization. Through such devices and systems off-site employees can
access company information, computing resources and internal communications.
(i) Workforce productivity – Intranets can help users to locate and view information faster
and use applications relevant to their roles and responsibilities. Users can access data
held in any database the organization wants to make available, anytime and - subject
to security provisions - from anywhere within the company workstations. (ii) Time – With intranets, organizations can make more information available to employees
on a “pull” basis (i.e.: employees can link to relevant information at a time which suits
them) rather than being deluged indiscriminately by emails. (iii) Communication – Intranets can serve as powerful tools for communication within an
organization, vertically and horizontally. From a communications standpoint, intranets are
useful to communicate strategic initiatives that have a global reach throughout the
organization. The type of information that can easily be conveyed is the purpose of the
initiative and what the initiative is aiming to achieve, who is driving the initiative, results
achieved to date, and who to speak to for more information. By providing this
information on the intranet, staffs have the opportunity to keep up-to-date with the
strategic focus of the organization. (iv) Knowledge Management – Web publishing allows „cumbersome‟ corporate knowledge
to be maintained and easily accessed throughout the company using hypermedia and
Web technologies. Examples include: employee manuals, benefits documents,
company policies, business standards, news feeds, and even training, can be accessed
using common Internet standards (Acrobat files, Flash files, CGI applications). Because
each business unit can update the online copy of a document, the most recent version is
always available to employees using the intranet. (v) Business operations and management – Intranets are also being used as a platform for
developing and deploying applications to support business operations and decisions
across the internetworked enterprise (vi) Cost-effective – Users can view information and data via web-browser rather than
maintaining physical documents such as procedure manuals, internal phone list and
requisition forms. (vii)Promote common corporate culture – Every user is viewing the same information within
the Intranet.

Revisionary Test Paper_Final_Syllabus 2012_Dec2008
Board of Studies, The Institute of Cost Accountants of India (Statutory Body under an Act of Parliament) Page 8
(viii) Enhance Collaboration – With information easily accessible by all authorised users,
teamwork is enabled.
Question 5.
ABC Ltd. operates a simple chemical process to convert a single material into three separate
items, referred to here as X, Y and Z. All three end products are separated simultaneously at a
single split-off point. Product X and Y are ready for sale immediately upon split off without further processing or any
other additional costs. Product Z, however, is processed further before being sold. There is no
available market price for Z at the split-off point.
The selling prices quoted here are expected to remain the same in the coming year. During
2012-13, the selling prices of the items and the total amounts sold were: X – 186 tons sold for ` 1,500 per ton
Y – 527 tons sold for ` 1,125 per ton
Z – 736 tons sold for ` 750 per ton
The total joint manufacturing costs for the year were ` 6,25,000. An additional ` 3,10,000 was
spent to finish product Z.
There were no opening inventories of X, Y or Z at the end of the year; the following inventories of
complete units were on hand:
X 180 tons
Y 60 Tons
Z 25 tons
There was no opening or closing work-in-progress.
Required:
(i) Compute the cost of inventories of X, Y and Z for Balance Sheet purposes and cost of
goods sold for income statement purpose as of March 31, 2013, using:
(a) Net realizable value (NRV) method of joint cost allocation
(b) Constant gross-margin percentage NRV method of joint-cost allocation.
(ii) Compare the gross-margin percentages for X, Y and Z using two methods given in
requirement.
Answer:
(a) Statement of Joint Cost allocation of inventories of X, Y and Z for Balance Sheet purposes
(By using net realisable value method)
Product
X (`) Y (`) Z (`) Total (`)
Final Sales Value of total production 5,49,000 6,60,375 5,70,750 17,80,125
(Refer to Working Note 1) (366 tons x ` 1,500)
(587 tons x `1,125)
(761 tons x
Rs. 750)
Less: Additional cost --------- --------- 3,10,000 3,10,000
Net realisable value 5,49,000 6,60,375 2,60,750 14,70,125
(at split-off point)
Joint cost allocated
(Refer to working note 2)
2,33,398 2,80,748 1,10,854 6,25,000
Cost of goods sold for income statement as of march 2013
(By using a realizable value method)
Products
X (`) Y (`) Z (`) Total (`)
Allocated joint cost 2,33,378 2,80,748 1,10,854 6,25,000
Additional costs ------- -------- 3,10,000 3,10,000
Cost of goods available for sale (CGAS) 2,33,398 2,80,748 4,20,854 9,35,000
Less: Cost of ending inventory 1,14,785 28,692 13,846 (1,57,323)

Revisionary Test Paper_Final_Syllabus 2012_Dec2008
Board of Studies, The Institute of Cost Accountants of India (Statutory Body under an Act of Parliament) Page 9
X: 49.18%
Y: 10.22% x (CGAS)
Z: 3.29%
(Refer to working note)
Cost of goods sold 1,18,613 2,52,056 4,07,008 7,77,677
Income Statement
(Showing gross margin and gross margin percentage)
(By using net realizable value method)
Product
X Y Z Total
Sales revenue (`) 2,79,000
(186 tons x`1,500)
5,92,875
(527 tons x`1,125)
5,52,000 (736 tons x`750)
14,23,875
Less: Cost of goods sold (`) 1,18,613 2,52,056 4,07,008 7,77,677
Gross margi8n (`) 1,60,387 3,40,819 1,44,992 6,46,198
Gross margin (%) 57,49% 57,49% 26,26%
(b) Statement of joint cost allocation of inventories of X, Y and Z for Balance Sheet Purposes
(By using constant gross margin percentage net-realisable value method)
Product
X (`) Y (`) Z (`) Total (`)
Final sales value of total production 5,49,000 6,60,375 5,70,750 17,80,125
Less: Gross margin
(Refer to working note 3)
2,60,641 3,13,517 2,70,967 8,45,125
2,88,359 3,46,858 2,99,783 9,35,000
Less: Additional cost ------- -------- 3,10,000 3,10,000
Joint cost allocated 2,88,359 3,46,858 (10,217) 6,25,000
Note: The negative joint cost allocation to product Z illustrates one „unusual‟ feature of the
constant gross margin NRV method.
Cost of goods sold for income statement purpose
(By using constant gross margin percentage net-realisable value method) Product
X Y z Total
Allocated joint cost 2,88,359 3,46,858 (10,217) 6,25,000
Joint cost 3,10,000 3,10,000
Cost of goods available for sale (CGAS) 2,88,359 3,46,858 2,99,783 9,36,000
Less: Cost of ending inventory
X: [49.18%]
Y: [10.22%] x CCGS
Z: [3.29%]
1,41,815 35,449 9,863 1,87,1274
Cost of goods sold 1,46,544 3,11,409 2,89,920 7,47,873
Income Statement
(Showing gross margin and gross percentage by using constant gross margin constant gross
margin percentage NRV method)
Product
X Y Z Total
Sales revenue (`) 2,79,000 5,92,875 5,52,000 14,23,875 Less: Cost of goods sold (`) 1,46,544 3,11,409 2,89,920 7,47,873

Revisionary Test Paper_Final_Syllabus 2012_Dec2008
Board of Studies, The Institute of Cost Accountants of India (Statutory Body under an Act of Parliament) Page 10
Gross margin (`) 1,32,456 2,81,466 2,62,080 6,76,002
Gross margin (%) 47.475% 47.475% 47.478% 47.478%
(ii) Comparative statement of gross percentage for X, Y and Z
(Using net realizable value and constant gross margin percentage NRV methods)
Method Product gross margin percentage
X Y Z
Net realisable 57.49 57.49 26.26
Constant gross margin %NRV 47.48 47.48 47.48
Working notes
1. Total production of three products for the year 2012-2013
Items/Products
(1)
Quantity sold
in tons (2)
Quantity of ending
inventory in tons (3)
Total production
(4) =(2)+(3)
Ending inventory
% (5)=(3)/(4)
X 186 180 366 49.18
Y 527 60 587 10.22
Z 736 25 761 3.29
2. Joint cost apportioned to each product:
producteachofvaluerealisableNetxvaluerealisablenetTotal
costjointTotal
000,49,5x125,70,14
000,25,6XproductofcostTotal `
`
`
Similarly, the joint cost of inventories of products Y and Z comes to Rs. 2,80,748 and Rs
1,10,854 respectively. 1. Gross margin percentage
Final sales value production 17,80,125
Less: Joint cost and additional costs (`6,25,000+`3,10,000)
9,35,000
Gross margin 8,45,125
Gross margin % (`8,45,125/`17,80,125) x 100 47.4756%
Question 6.
A Modern Packing Corporation specialises in the manufacture of one-liter plastic bottles. The
firm‟s customers include dairy processors, fruit juice manufactures and manufactures of edible
oils. The bottles are produced by a process called blow moulding. A machine heats plastic to
the melting point. A bubble of molten plastic is formed inside a mould, and a jet of hot air is
forced into the bubble. This blows the plastic into the shape of the mould. The machine releases
the moulded bottle, an employee trims off any flashing (excess plastic around the edge), and
the bottle is complete.
The Firm has four moulding machines, each capable of producing 100 bottles per hour. The firm
estimates that the variable cost of producing a plastic bottle is 20 paise. The bottles are sold for
50 paise each.
Management has been approached by a local toy company that would like the firm to produce a moulded plastic toy for them. The toy company is willing to pay `3.00 per unit for the toy. The
variable cost of manufacture the toy will be `2.40. In addition, Modern Packing Corporation
would have to incur a cost of `20,000 to construct the needed mould exclusively for this order.
Because the toy uses more plastic and is of a more intricate shape than a bottle, a moulding
machine can produce only 40 units per hour. The customer wants 1,00,000 units. Assume that
Modern Packing Corporation has the total capacity of 10,000 machine hours available during

Revisionary Test Paper_Final_Syllabus 2012_Dec2008
Board of Studies, The Institute of Cost Accountants of India (Statutory Body under an Act of Parliament) Page 11
the period in which the toy company wants the delivery of toys. The firm‟s fixed costs, excluding the costs to construct the toy mould, during the same period will be `2,00,000.
Required:
(a) If the management predicts that the demand for its bottles will require the use of 7,500
machine hours or less during the period, should the special order be accepted? Give the
reasons.
(b) If the management predicted that the demand for its bottles would be higher than its
ability to produce bottles, should the order be accepted? Why?
(c) The management has located a firm that has just entered the moulded plastic business.
The firm has considerable excess capacity and more efficient moulding machines and is willing to subcontract the toy job or any portion of it for `2.80 per unit. It will construct its
own toy mould. Determine Modern Packing Corporation‟s minimum expected excess
machine hour capacity needed to justify producing any portion of the order itself rather
than subcontracting it entirely.
(d) The management predicated that it would have 1,600 hours of excess machine hour
capacity available during the period. Consequently, it accepted the toy order and
subcontracted 36,000 units to the other plastic company. In fact demand for bottles
turned out to be 9,00,000 units for the period. The firm was able to produce only 8,40,000
units because it had to produce the toys. What was the cost of the prediction error failure
to predict demand correctly?
Answer:
Contribution From M bottle per hour [100(0.5-.2)] `30
Contribution from toy per hour [40(3-2.4)] `24
a) When the demand for the bottles is 7500or less hours, it is better to accept, toy order because it gives additional profit of `40000
b) When the capacity for bottles is more than 7500 hours, the toy order should not be accepted because the contribution of bottle `30, is more than the contribution per hour
of toy `24
c) The level at which it is necessary tom sub contract the toy order is
[20000/(2.8-2.4)] = 50000 units
d) Computation of cost of prediction error
(i) Statement showing computation of profit if 36000 toys are given for sub contract
Bottles Toy manufacture Toy Sub Contract Total
i. No. of units 8,40,000.00 64,000 36,000
ii. Contribution per unit 0.30 0.60 0.20
iii. Total Contribution 2,52,000.00 38,400.00 7,200.00 2,97,600.00
iv. Fixed Cost 2,00,000.00 20,000.00 ------------- 2,20,000.00
v. Profit 52,000.00 18,400.00 7,200.00 77,600.00
(ii) Computation of profit at actual position
Bottles Toys Total
i. No. of units 9,00,000.00 1,00,000.00
ii. Contribution per
unit
0.30 0.20
iii. Total Contribution 2,70,000.00 20,000.00 2,90,000.00
iv. Fixed Cost 2,00,000.00 2,00,000.00
v. Profit 70,000.00 20,000.00 90,000.00
Therefore cost of prediction error (90,000-77,600) `12,400
Revisionary Test Paper_Final_Syllabus 2012_Dec2008
Board of Studies, The Institute of Cost Accountants of India (Statutory Body under an Act of Parliament) Page 12
Question 7.
(a) What is life cycle costing? Explain the stages in product life-cycle?
Answer: Life cycle costing is a technique which takes account of the total cost of owning a
physical asset, or making a product, during its economic life. It includes the costs associated with
acquiring, using, caring for and disposing of physical assets, including the feasibility studies,
research, design, development, production, maintenance, replacement and disposal, as well as
support, training and operating costs generated by the acquisition, use, maintenance and
replacement of permanent physical assets.
Stages in Product Life Cycle :
There are five distinct stages in the life cycle of a product as follows:
Introduction stage – Research and engineering skill leads to product development. The product
is put on the market and its awareness and acceptance are minimal. Promotional costs will be
high, sales revenue low and profits probably negative. The skill that is exhibited in testing and
launching the product will rank high in this phase as critical factor in securing success and initial
market acceptance. Sales of new products usually rise slowly at first. Growth Stage – In the growth stage product penetration into the market and sales will increase
because of the cumulative effects of introductory promotion, distribution. Since costs will be
lower than in the earlier stage, the product will start to make a profit contribution. Following the
consumer acceptance in the launch stage it now becomes vital or secure wholesaler / retailer
support. But to sustain growth, consumer satisfaction must be ensured at this stage. If the
product is successful, growth usually accelerates at some point, often catching the innovator by
surprise. Maturity Stage – This stage begins after sales cease to rise exponentially. The causes of the
declining percentage growth rate the market saturation – eventually most potential customers
have tried the product and sales settle at a rate governed by population growth and the
replacement rate of satisfied buyers. In addition there were no new distribution channels to fill.
This is usually the longest stage in the cycle, and most existing products are in this stage. The
period over which sales are maintained depends upon the firm‟s ability to stretch the cycle by
means of market segmentation and finding new uses for it. Saturation stage – As the market becomes saturated, pressure is exerted for a new product and
sales along with profit begin to fall. Intensified marketing effort may prolong the period of
maturity, but only by increasing costs disproportionately. Declining Stage – Eventually most products and brands enter a period of declining sales. This
may be caused by the following factors:
Technical advances leading to product substitution
Fashion and changing tastes
Exogenous cost factors will reduce profitability until it reaches zero at which point the
product‟s life is commercially complete.
(b) Indo Gulf Fertilizers Ltd. supports the concept of the terotechnology or life cycle costing for
new investment decisions covering its engineering activities.
The company is to replace a number of its machines and the Production Manager is to run
between the “X” machine, a more expensive machine with a life of 12 years, and the “W”
machine with an estimated life of 6 years. If the “W” machine chosen it is likely that it would be
replaced at the end of 6 years by another “W” machine. The pattern of maintenance and
running costs differs between the two types of machine and relevant data are shown below :
Revisionary Test Paper_Final_Syllabus 2012_Dec2008
Board of Studies, The Institute of Cost Accountants of India (Statutory Body under an Act of Parliament) Page 13
(`)
Particulars X W
Purchase price 19,000 13,000
Trade-in-value 3,000 3,000
Annual repair costs 2,000 2,600
Overhead costs (p.a.) 4,000 2,000
Estimated financing costs averaged over machine life
(p.a.)
10% 10%
You are required to recommend, with supporting figures, which machine to purchase, stating
any assumptions made.
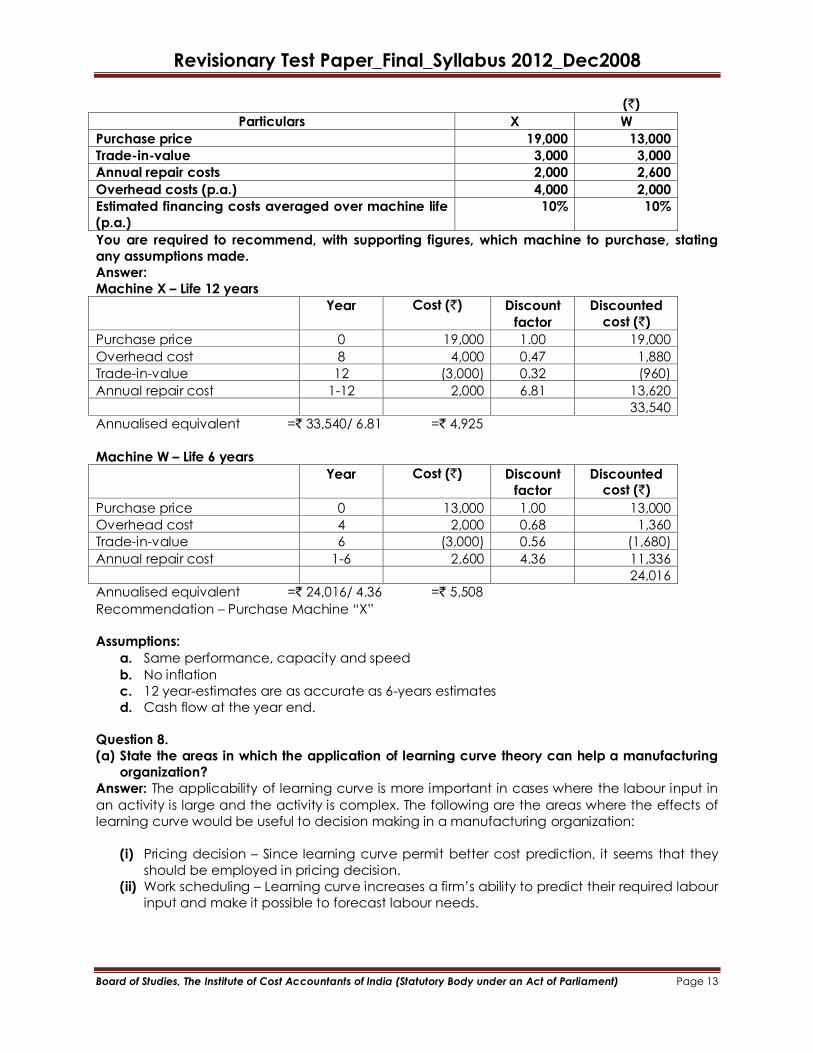
Answer:
Machine X – Life 12 years
Year Cost (`) Discount
factor
Discounted
cost (`)
Purchase price 0 19,000 1.00 19,000
Overhead cost 8 4,000 0.47 1,880
Trade-in-value 12 (3,000) 0.32 (960)
Annual repair cost 1-12 2,000 6.81 13,620
33,540
Annualised equivalent =` 33,540/ 6.81 =` 4,925
Machine W – Life 6 years
Year Cost (`) Discount
factor
Discounted cost (`)
Purchase price 0 13,000 1.00 13,000
Overhead cost 4 2,000 0.68 1,360
Trade-in-value 6 (3,000) 0.56 (1,680)
Annual repair cost 1-6 2,600 4.36 11,336
24,016
Annualised equivalent =` 24,016/ 4.36 =` 5,508
Recommendation – Purchase Machine “X”
Assumptions:
a. Same performance, capacity and speed
b. No inflation
c. 12 year-estimates are as accurate as 6-years estimates
d. Cash flow at the year end.
Question 8.
(a) State the areas in which the application of learning curve theory can help a manufacturing
organization?
Answer: The applicability of learning curve is more important in cases where the labour input in
an activity is large and the activity is complex. The following are the areas where the effects of
learning curve would be useful to decision making in a manufacturing organization:
(i) Pricing decision – Since learning curve permit better cost prediction, it seems that they
should be employed in pricing decision.
(ii) Work scheduling – Learning curve increases a firm‟s ability to predict their required labour
input and make it possible to forecast labour needs.

Revisionary Test Paper_Final_Syllabus 2012_Dec2008
Board of Studies, The Institute of Cost Accountants of India (Statutory Body under an Act of Parliament) Page 14
(iii) Capital budgeting – One of the most important aspects in capital budgeting problems is
the amount of cash flows. The learning curve suggests that unit costs are likely to begin
high and reducing afterwards.
(iv) Overtime decisions – Hiring more workers is not likely to be an easily reversible decision.
Hence, if an organization is near the beginning its learning curve, it prefers to work
overtime rather than hire additional workers who will not be needed later.
(v) Fixation of pay scales – In fixing pay scales and production bonus, the time needed to
learn production process should be allowed for in calculating the wages and bonus for a
period. The wage incentive schemes must recognize the learning curve i.e., the
employees will need to be compensated during the early stages of learning for the lower
than normal level of performance. This is due to lack of familiarity in the early stages of
production rather than any lack of motivation of ability.
(vi) Cash budgets – Since learning effect reduces unit variable costs as more units are
produced, it should be allowed for in cash flow projections.
(vii)Direct costs – The learning curve applies to an industry where there is a high labour
turnover or when products and process are subject to frequent changes. As the labour
hours or cost is reduced for repeat orders, a knowledge of learning curve helps in direct
labour budget.
(viii) Setting of standard costs – If the learning phase is not recognized an incorrect
standard may be established. When cumulative output is low the standard cost is high,
resulting in favourable variances. The converse of this applies when cumulative output is
high.
(b) A company has accepted an order for making 15 items of a specialized machine at a price
of `4 lacs each. The delivery is to be completed within 4 months. The company works 23
days a month and the normal direct wages per day amount to `10,000. However, in case of
need, the company can work over time upto 8 days during the said period at double the normal rate of wages. Overheads amount to `12,000 per normal working day but no
overheads are charged on overtime working days. The material cost is `2,40,000 per
machine. The company has estimated that it will take 10 working days to manufacture the
first machine. The company is expected to experience a learning effect of 90% (b=0.152). The contract stipulates a penalty of `40,000 per machine delivered beyond the schedule of 4
months.
You are required to calculate the costs and advise the company whether it is preferable to work
only during normal working days and pay penalty for any delayed delivery of the machines or
to work overtime to avoid paying penalty.
Answer:
Working days 23 p.m. x 4 = 92 days
Time per machine = 10 days
Learning curve = 90%
Average time for
15 machines 15 x 10 x 15 -0.152 = 99.4 days
14 machines 14 x 10 x 14 -0.152 = 93.7 days
13 machines 13 x 10 x 13 -0.152 = 88.0 days
So 13 machines can be supplied in time
The company can work overtime or supply late with penalty
Alternative I – Profitability statement if worked overtime for balance 2 machines
(`)
Direct materials (15 x 2,40,000) 36,00,000

Revisionary Test Paper_Final_Syllabus 2012_Dec2008
Board of Studies, The Institute of Cost Accountants of India (Statutory Body under an Act of Parliament) Page 15
Direct labour Normal (92 days x 10,000) 9,20,000
Overtime (7.4 days x 20,000) 1,48,000
Overheads (92 days x 12,000) 11,04,000
Total cost 57,72,000
Profit 2,28,000
Sales 60,00,000
Alternative II – Profitability statement if supplied late with penalty
Direct materials (15 x 2,40,000) 36,00,000
Direct labour (99.4 days x 10,000) 9,94,000
Overheads (92 days x 12,000) 11,04,000
Penalty (2 x 40,000) 80,000
Total cost 57,78,000
Profit 2,22,000
Sales 60,00,000
Analysis: It is suggested to work overtime to maximize profit.
Question 9.
(a) A company is organized into two large Divisions. Division „A‟ produces a component which is
used by Division ‟B‟ in making a final product. The final product is sold for `400 each. Division
„A‟ has a capacity to produce 2,000 units and the entire quantity can be purchased by
Division B.
Division „A‟ informed that due to installation of new machines, its depreciation cost had gone
up and hence wanted to increase the price of the component to be supplied to Division B to `220. Division „B‟ however can buy the component from the outside market at `200 each. The
variable cost of Division „B‟ in manufacturing the final product by using the component is `150 (excluding the component cost).
Present statement indicating the position of each Division and the company as a whole taking
each of the following situations separately.
(i) If there are no alternative use for the production facilities of A, will the company benefit if
Division B buys from outside suppliers at Rs. 200 per component?
(ii) If internal facilities of A are not otherwise idle and the alternative use of the facilities will
give an annual cash operating saving of Rs. 30,000 to Division A, should Division B
purchase the component from outside suppliers?
(iii) If there are no alternative used for the production facilities of Division A and the selling
price for the component in the outside market drops by Rs. 15, should Division B purchase
from outside suppliers?
(iv) What transfer price would you fix for the component in each of the above
circumstances?
Answer:
(i) Statement of contribution
(a) When component is purchased by Division B from outside (`)
Division A Nil
Division B sales (2,000 x 400) 8,00,000
Less: Cost of purchase (2,000 x 200) 4,00,000
Variable Cost (2,000 x 150) 3,00,000 7,00,000 1,00,000
Company‟s total contribution 1,00,000

Revisionary Test Paper_Final_Syllabus 2012_Dec2008
Board of Studies, The Institute of Cost Accountants of India (Statutory Body under an Act of Parliament) Page 16
(b) When component is purchased from Division A by Division B
Division A
Sales (2,000 x 220) 4,40,000
Less: Variable cost (2,000 x 190) 3,80,000 60,000
Division B
Sales (2,000 x 400) 8,00,000
Less: Variable cost
Purchase cost from Division A (2,000 x 220) 4,40,000
Variable cost in Division B (2,000 x 150) 3,00,000 7,40,000 60,000
Company‟s total contribution 1,20,000
Thus, it will be beneficial for the company as a whole to ask Division B to buy the component
from Division A.
(ii) Statement of total contribution if Division A could be put to alternative use :
Division A
Contribution from alternative use of facilities 30,000
Division B
Sales (2,000 x 400) 8,00,000
Less: Variable cost
Cost of purchase (2,000 x 400) 4,00,000
Division B (2,000 x 150) 3,00,000 7,00,000 1,00,000
Company‟s total contribution 1,30,000
The company‟s contributions when component is purchased from outside, shows an increase of
Rs. 30,000 as compared to when there is inter departmental transfer. Hence, it will be beneficial
to purchase the component from outside. (iii) Statement of total contribution when component is available from outside at Rs. 185
Division A Nil
Division B
Sales (2,000 x 400) 8,00,000
Less : variable cost
Cost of purchase (2,000 x 185) 3,70,000
Division B 3,00,000 6,70,000 1,30,000
Company‟s total contribution 1,30,000
If the component is purchased by Division B from Division A, the contribution is only Rs. 1,20,000
as calculated under (i) above. Hence it will be beneficial to buy the component from outside.
(iv) Fixation of transfer price
(a) When there are no alternative uses of production facilities of Division A In such a case the variable cost i.e. `190 per component will be charged
(b) If facilities of Division A can be put to alternative uses :
Variable Cost `190
Opportunity cost `15
Revisionary Test Paper_Final_Syllabus 2012_Dec2008
Board of Studies, The Institute of Cost Accountants of India (Statutory Body under an Act of Parliament) Page 17
Transfer Price `205
(c) If market price gets reduced to `185 and there is no alternative use of facilities of Division
A. The variable cost of `190 per component should be charged.
Question 10.
Short Notes:
(a) Backflush accounting
(b) Kaizen Costing
(c) Value Chain Management
(d) Margin of Safety
Answer:
(a) Backflush accounting
Backflush accounting is defined as „a cost accounting system which focuses on the output of
the organization and then work backwards to allocate costs between cost of goods sold and
inventory‟. In essence, backflush accounting is a simpler bookkeeping system designed to reflect
key aspects of JIT system i.e. little or no work-in-progress and demand pull.
There are several variants of backflush accounting (BFA), a popular one being the replacement
of separate raw material and WIP accounts with a single account; Raw and In Process (RIP)
account. When items are sold the standard cost for the materials in the finished goods would be
credited (or back flushed) to the RIP account. All conversion costs (labour and materials) would
be applied to the cost of finished goods production, none would be applied to WIP.
(b) Kaizen Costing
Kaizen costing is a modification of standard costing which is essential to realize the planned cost
reductions in continuous time. Kaizen costing is a Japanese contribution to cost accounting.
Kaizen costing is continuous improvement applied to cost reduction in the manufacturing stage
of a product‟s life. Like that of standard costing programme, the aim of Kaizen costing is to
remove inefficiencies from production processes.
Kaizen costing tracks the cost reduction plans on a monthly basis. The Kaizen costing targets are
expressed in the physical resources terms. If the head of a group fails to achieve the Kaizen
costing target by 1 percent, review by senior will start. Resource consumption is so tightly
controlled in many Japanese firms. Thus the planned cost reductions are planned and
monitored through Kaizen cost targets in terms of physical resources.
While implementing the concept of Kaizen, following few rules are to be remembered :
(i) List down your own problems.
(ii) Grade your problems as to minor, difficult and major.
(iii) Select the smallest minor problem and start with it. After tackling this, move on to next
graded problem and so on.
(iv) Know and always remember, improvement is a part of daily routine.
(v) Never accept status quo.
(vi) Never reject any idea before trying it.
(vii)Share the experiments with colleagues.
(viii) Eliminate already tried but failed experiments, while sharing the problems with
your colleagues.
(ix) Never hide problems, always highlight them.

Revisionary Test Paper_Final_Syllabus 2012_Dec2008
Board of Studies, The Institute of Cost Accountants of India (Statutory Body under an Act of Parliament) Page 18
(c) Value Chain Management
Value chain management (VCM) is a solution for smoothening the interaction between all
partners of an enterprise, suppliers, dealers, bankers etc. VCM goes beyond supply chain
management to bring synergy between business partner by way of providing business and
knowledge information in the effective manner to help achieve business targets. There are three
kinds of partners among whom a company try to build synergy.
(i) One if the normal supply chain management partners – suppliers, suppliers to suppliers,
dealers, customers etc.
(ii) The second important partner category is the transporter who transports raw material
and finished goods. The transporters play an important role in value chain.
(iii) The third important category of partners are service providers and banks.
(d) Margin of Safety
The margin of safety refers to sales in excess of the break-even volume. It represents the
difference between sales at a given activity level and sales at break-even point. It is important
that three should be a reasonable margin of safety to run the operations of the company in
profitable position. A low margin of safety usually indicates high fixed overheads so that profits
are not made until there is a high level of activity to absorb the fixed costs. A margin of safety
provides strengths and stability to a concern.
The margin of safety is an important measure, especially in times of receding sales, to know the
real position to operate without incurring losses and to take steps to increase the margin of
safety to improve the profitability.
Margin of safety is calculated by using the following formulae :
Margin of safety = Actual sales – Break-even sales
= Profit
P/V Ratio
= Profit x Selling Price p.u.
Selling Price p.u. – Variable cost p.u.
The higher the margin of safety, the better profitability of the product/ product line. The margin
of safety can be improved by adopting any of the following steps :
(i) Keeping the break-even point at lowest level and try to maintain actual sales at highest
level.
(ii) Increase in sales volume.
(iii) Increase in selling price.
(iv) Change in product mix increasing contribution.
(v) Lowering fixed cost.
(vi) Lowering variable cost.
(vii)Discontinuance of unprofitable products in sales mix.

Revisionary Test Paper_Final_Syllabus 2012_Dec2008
Board of Studies, The Institute of Cost Accountants of India (Statutory Body under an Act of Parliament) Page 19
Question 11.
(a) A factory engaged in manufacturing plastic buckets is working at 40% capacity and
produces 10,000 buckets per month. The present cost break-up for one bucket is as under :
Materials `20
Labour `6
Overheads `10 (60% fixed)
The selling price is Rs. 40 per bucket. If it is decided to work the factory at 50% capacity, the
selling price falls by 3%. At 90% capacity, the selling price falls by 5% accompanied by a
similar fall in the price of materials.
You are required to prepare a statement showing the profits at 50% and 90% capacities and
also determine the break-even points at each of these production levels.
Answer:
Flexible budget
Capacity level 40%
Present
50% 90%
Production and sales (units) 10,000 12,500 22,500 Selling price (`) 40.00 38.80 38.00
Sales (a) 4,00,000 4,85,000 8,55,000
Variable cost
Materials @ `20 2,00,000 2,50,000 4,27,500
Labour @ `6 60,000 75,000 1,35,000
Variable overheads (`10 x 40/100) 40,000 50,000 90,000
Total (b) 3,00,000 3,75,000 6,52,500
Contribution (a) – (b) 1,00,000 1,10,000 2,02,500
Less: Fixed overheads (Rs. 10 x 60/100 x
10,000 units
60,000 60,000 60,000
Profit 40,000 50,000 1,42,500
Contribution per unit 10.00 8.80 9.00
Breakeven point (units) = Fixed Overhead
Contribution per unit
6,000 6,818 6,677
(b) What is target costing and what are the stages to the methodology?
Answer: Target costing is defined „as a cost management tool for reducing the overall cost of a
product over its entire life cycle with the help of the production, engineering, R&D.‟
The target cost is the estimated cost of a product that enables a company to remain and
compete in the market in the long run. The idea of target costing, originally promoted in Japan,
is about going upstream to achieve cost reduction. Target costing is not really a method of
costing, but it is a technique used in cost management. The intent of target costing is to reduce
cost, where reduction is aimed at the entire life cycle of any product. Target costing can also
help in achieving certain broader objectives, such as, identifying and delivering various
customer requirements in a product through effective management of different processes.
A firm‟s business plan and product market strategies provide the framework and basic guidelines
for applying the target costing methodology. Specific steps involved in target costing may be
summarized as follows:

Revisionary Test Paper_Final_Syllabus 2012_Dec2008
Board of Studies, The Institute of Cost Accountants of India (Statutory Body under an Act of Parliament) Page 20
(i) Determine customer wants precisely.
(ii) Translate them into desired product performance feature.
(iii) Estimate the proportion of value added by each feature and component.
(iv) Choose a product design assures a targeted profit, and cost targets for each
component in total.
(v) Choose manufacturing design that assures targeted costs.
(vi) Choose suppliers that assure buying at targeted costs.
(vii)After each cost review, conduct value engineering to reduce target costs.
(viii) Monitor initial production to be sure that all product performance, cost, profit,
targets are met.
Question 12.
The directors of ABC Ltd. manufactures three products A,B and C, have as ked for advice on the
product mix of the company. The following information is given:
Products
Particulars A B C
Standard cost per unit :
Direct material 20 60 40
Variable overhead 6 4 10
Direct labour :
Department Rate/ Hr.
1 Re. 1
2 Rs. 2
3 Re. 1
Hrs.
28
5
16
Hrs.
16
6
8
Hrs.
30
10
30
Current production p.a. 10,000 5,000 6,000
Selling price per unit ` 100 136 180
Forecast of sales for next year 12,000 7,000 9,000
Fixed overheads p.a. `4,00,000.
Further, the type of labour required by Dept. 2 is in short supply and it is not possible to increase
the manpower of this department beyond its present level.
(a) You are required to prepare a statement showing the most profitable mix of the products to
be made and sold. The statement which should be presented in two parts should show :
(i) the profit expected on current budgeted production; and
(ii) The profit which could be expected if the most profitable mix was produced.
(b) You are also required to bring out any problems which are likely to arise if the product mix in
(a) (ii) above were to be adopted.
Answer:
(a) (i) Statement showing profit on current budgeted production
Products
Units
A
10,000
B
5,000
C
6,000
Total
Sales (`) (i) 10,00,000 6,80,000 10,80,000 27,60,000
Direct material 2,00,000 3,00,000 2,40,000 7,40,000
Direct wages :
Dept 1 2,80,000 80,000 1,80,000 5,40,000
2 1,00,000 60,000 1,20,000 2,80,000
3 1,60,000 40,000 1,80,000 3,80,000

Revisionary Test Paper_Final_Syllabus 2012_Dec2008
Board of Studies, The Institute of Cost Accountants of India (Statutory Body under an Act of Parliament) Page 21
Variable overhead 60,000 20,000 60,000 1,40,000
Marginal cost (ii) 8,00,000 5,00,000 7,80,000 20,80,000
Contribution (i) – (ii) 2,00,000 1,80,000 3,00,000 6,80,000
Fixed overhead 4,00,000
Net profit 2,80,000
Particulars A B C
Marginal cost (per unit) 80 100 130
Contribution (per unit) 20 36 50
Contribution (per hour of Dept 2) 4 6 5
Ranking III I II
Since the key factor is labour hours, production hours should be applied for the products in the
order B, C and A, as ranked above.
Total hours available in Dept. 2 on the basis of current production
A (10,000 x 5) 50,000
B (5,000 x 6) 30,000
C (6,000 x 10) 60,000
Total hours 1,40,000
Reallocation on Hrs. available in Dept. 2
Product Units Hrs. per unit Total hours
B 7,000 6 42,000
A 9,000 10 90,000
C 1,600 5 8,000*
1,40,000
*balancing figure
ii. Statement of profit as per revised programme
Units
A
1,600
B
7,000
C
9,000
Total
Sales 1,60,000 9,52,000 16,20,000 27,32,000
Marginal costs 1,28,000 7,00,000 11,70,000 19,98,000
Contribution 32,000 2,52,000 4,50,000 7,34,000
Fixed cost 4,00,000
Net profit 3,34,000
iii. The following possible problems should be guarded against before taking the above
decision :
(i) The demand for product A may be complementary to demand for the other products.
If it is so, sales of B and C may fall with fall in demand of product A.
(ii) Lower production of product A may adversely affect customers‟ preferences for other
products.

Revisionary Test Paper_Final_Syllabus 2012_Dec2008
Board of Studies, The Institute of Cost Accountants of India (Statutory Body under an Act of Parliament) Page 22
Question 13.
Short Notes:
(a) BPR
(b) JIT
(c) Demand Stimulation
(d) Level Strategy
Answer:
(a) BPR
Davenport and Short have defined BPR as „the analysis and design of workflows and processes
within and between organizations‟.
According to Teng, BPR is „the critical analysis and radical re-design of existing business
processes to achieve improvements in performance measures‟.
A comparison between Total Quality Management and BPR shows that BPR requires the change
to be fundamental and thus more beneficial to the customers.
BPR is a continuous process of rethinking, re-assessment, re-design, evaluation of each element
of business process and consequent improvement in structure and work place. It takes care of
all facets of operation in an organization. It gives stress on management system, social system
and behavioural system. It analyses them and comes out with proposed change in process of
operation. Re-engineering efforts is towards brining changes.
While the concept is generally understood in relation to direct areas of operations of a business
such as production, marketing or distribution, it is equally applicable to indirect areas such as
finance, accounting, personnel etc. BPR means starting all over, starting from scratch
(i) It starts with the top management and with a corporate vision.
(ii) Targeting customers and trying to improve systems and procedures to achieve this.
(iii) Increasing the clock speed of the organization.
(iv) Drilled down the thinking process for each vital element of the organization like
personnel, structure design, drawings, raw materials, accounting practices, MIS, finance
and find out the constraints/ bottlenecks in the process.
(v) Avoids unnecessary work, demolish obsolete methods and systems if required.
(b) JIT
Just in time (JIT) philosophy was first developed in Japan. Toyota introduced it in 50‟s and
later, other companies in Japan have adopted it.
The overriding feature of JIT is that materials or parts are generated in the exact quantity
required and just at the time they are needed. A classic JIT system consists of a series of
manufacturing units each delivering to one another in successive stages of production. The
amount delivered by each unit to the next unit is exactly what the needs for the next production
period (usually one day). There are no safety margins in the form of buffer stock, live storage or
work-in-progress. JIT is a sophisticated approach in eliminating wastage in the process of
manufacturing in different stages, say, from the production design stage to the stage of delivery
of finished product. JIT is sometimes regarded as an inventory control technique or a purchasing
method. It aims at eliminating all activities which do not add „value‟ to the product.

Revisionary Test Paper_Final_Syllabus 2012_Dec2008
Board of Studies, The Institute of Cost Accountants of India (Statutory Body under an Act of Parliament) Page 23
Schonberger defines JIT as being „to produce and deliver finished goods just in time to be sold,
sub assemblies just in time to be assembled into finished goods, fabricated parts just in time to go
into sub assemblies and purchased materials just in time to be transformed into fabricated
parts‟.
(c) Demand Stimulation
Options for situations in which demand needs to be increased in order to match capacity
include: (i) Pricing - Varying (lower) pricing to increase demand in periods when demand is less than
peak. For example, matinee prices for movie theaters, off-season rates for hotels, night
time rates for mobile telephone service, and off-season pricing for items that experience
seasonal demand. (ii) Promotion - Advertising, direct marketing, bulk purchase discounts, bonus/free offers and
other forms of promotion are used to shift demand. (iii) Back ordering - By postponing delivery on current orders demand is shifted to period
when capacity is not fully utilized. This is really just a form of smoothing demand. Service
industries are able to smooth demand by taking reservations or by making appointments
in an attempt to avoid walk-in customer. Some refer to this as “partitioning” demand. (iv) New demand creation - A new, but complementary demand is created for a product or
service. When restaurant customers have to wait, they are frequently diverted into a
complementary (but not complimentary) service, the bar. Other examples include the
addition of video arcades within movie theaters, and the expansion of services at
convenience stores.
(d) Level Strategy
A level strategy seeks to produce an aggregate plan that maintains a steady production rate
and/or a steady employment level. In order to satisfy changes in customer demand, the firm
must raise or lower inventory levels in anticipation of increased or decreased levels of forecast
demand. The firm maintains a level workforce and a steady rate of output when demand is
somewhat low. This allows the firm to establish higher inventory levels than are currently needed.
As demand increases, the firm is able to continue a steady production rate/steady employment
level, while allowing the inventory surplus to absorb the increased demand.
A second alternative would be to use a backlog or backorder. A backorder is simply a promise
to deliver the product at a later date when it is more readily available, usually when capacity
begins to catch up with diminishing demand. In essence, the backorder is a device for moving
demand from one period to another, preferably one in which demand is lower, thereby
smoothing demand requirements over time. A level strategy allows a firm to maintain a constant
level of output and still meet demand. This is desirable from an employee relations standpoint.
Negative results of the level strategy would include the cost of excess inventory, subcontracting
or overtime costs, and backorder costs, which typically are the cost of expediting orders and the
loss of customer goodwill.
Question 14.
(a) What is Management Control System? What are its purposes?
Answer
Joseph Maciariello & Calvin Kirby have defined M.C.S. as follows MCS is a set of inter-related
communication structures that facilitates the processing of information for the purpose of
Revisionary Test Paper_Final_Syllabus 2012_Dec2008
Board of Studies, The Institute of Cost Accountants of India (Statutory Body under an Act of Parliament) Page 24
assisting managers in coordinating the parts and attaining the purpose of an organization on a
continuous basis.
They view “the entire organization as a control system. „Control‟ is seen as a characteristic of a
control system; it occurs when the organization is attaining its purpose. Purpose and attainment
of purpose are central to the work of control system.”
Purposes of MCS, according to them are
(i) Coordination of parts of organization
(ii) Steering those parts to achieve organizational goals.
(iii) Bring along unity out of the diverse activities of an organization
(b) Explain the impact of budgetary control system on human behavior.
Answer: The budget process affects behavior in three aspects
(i) Formulation of budgets - The budgeting process may be top – down, determined wholly by
top management. This may engender a feeling of budgets being thrust upon employees
who perceive them as pressure devices; as a result their full enthusiasm may not be
forthcoming in implementing it. In case the budget is formulated with a bottom-up
approach, involving employees, commitment for meeting the budget can be assured.
(ii) Fixing targets - Sales production and other targets that are fixed should be challenging but
attainable so as to bring out the best efforts of individuals. If targets are so high, as to be
unattainable, it may de motivate employees: in some cases it may also lead to manipulation
of data to ensure conformity with budget. However such manipulations will have adverse
effects in the long run. A common practice is far sales manager to dump stocks on their
dealers at the year end to meet sales targets, perhaps giving unduly long credit.
(iii) Evaluation of performance - The evaluation of performance should be done in a
constructive manner and not in vindictive style. While variances may be thrown up by the
system, the causative factors may not be known readily. Hence it is necessary to analyze the
reasons for variance and ensure proper accountability.
(c) What is operations strategy? What are the criteria for evaluating an operation strategy?
Answer: According to Slack and Lewis, operations strategy holds the following definition:
Operations strategy is the total pattern of decisions which shape the long-term capabilities of
any type of operations and their contribution to the overall strategy, through the reconciliation
of market requirements with operations resources.
Criteria for Evaluating an Operations Strategy
Consistency (internal and external)
Between the operations strategy and the overall business strategy
Between the operations strategy and the other functional strategies within the business
Among the decision categories that make up the operations strategy
Between the operations strategy and the business environment (resources available,
competitive behaviour, governmental restraints, etc.) Contribution (to competitive advantage)
Making trade-offs explicit, enabling operations to set priorities that enhance the competitive
advantage.
Directing attention to opportunities that complement the business strategy Promoting clarity
regarding the operations strategy throughout the business unit so its potential can be
Revisionary Test Paper_Final_Syllabus 2012_Dec2008
Board of Studies, The Institute of Cost Accountants of India (Statutory Body under an Act of Parliament) Page 25
fully realized.
Providing the operations capabilities that will be required by the business in the future.
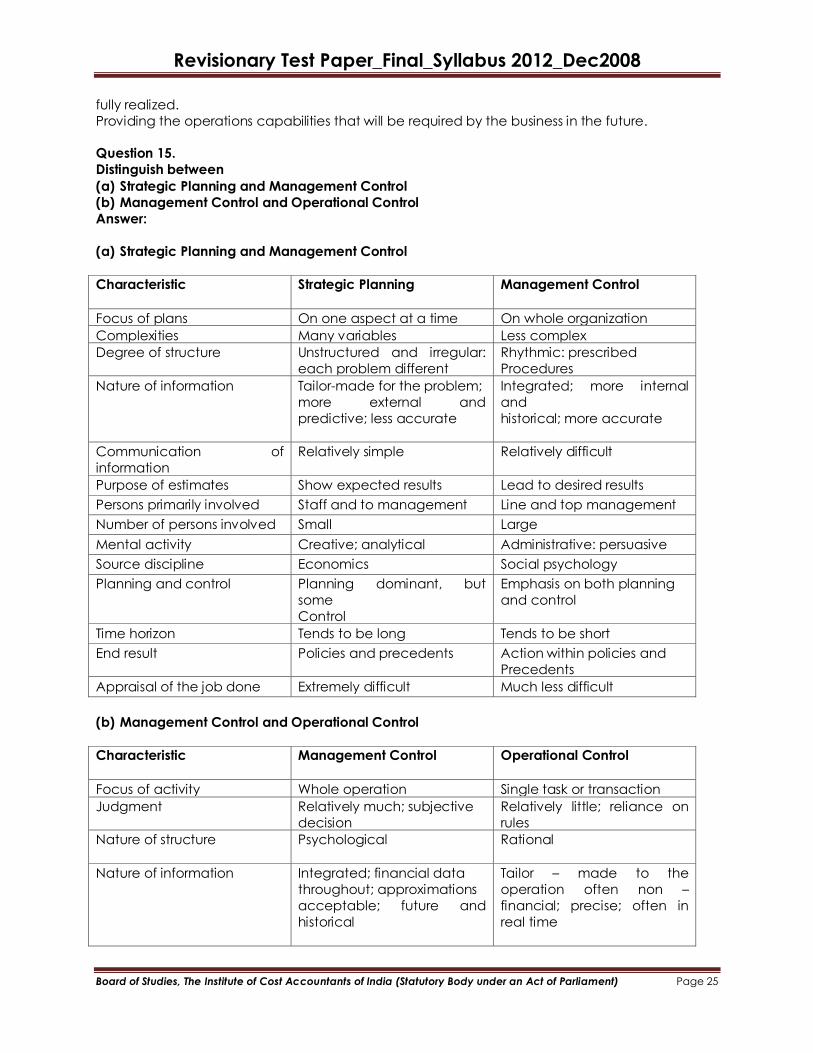
Question 15.
Distinguish between
(a) Strategic Planning and Management Control
(b) Management Control and Operational Control
Answer:
(a) Strategic Planning and Management Control
Characteristic Strategic Planning Management Control
Focus of plans On one aspect at a time On whole organization
Complexities Many variables Less complex
Degree of structure Unstructured and irregular:
each problem different
Rhythmic: prescribed
Procedures
Nature of information Tailor-made for the problem;
more external and
predictive; less accurate
Integrated; more internal
and
historical; more accurate
Communication of
information
Relatively simple Relatively difficult
Purpose of estimates Show expected results Lead to desired results
Persons primarily involved Staff and to management Line and top management
Number of persons involved Small Large
Mental activity Creative; analytical Administrative: persuasive
Source discipline Economics Social psychology
Planning and control Planning dominant, but
some
Control
Emphasis on both planning
and control
Time horizon Tends to be long Tends to be short
End result Policies and precedents Action within policies and
Precedents
Appraisal of the job done Extremely difficult Much less difficult
(b) Management Control and Operational Control
Characteristic Management Control
Operational Control
Focus of activity Whole operation Single task or transaction
Judgment
Relatively much; subjective
decision
Relatively little; reliance on
rules
Nature of structure
Psychological Rational
Nature of information Integrated; financial data
throughout; approximations
acceptable; future and
historical
Tailor – made to the
operation often non –
financial; precise; often in
real time

Revisionary Test Paper_Final_Syllabus 2012_Dec2008
Board of Studies, The Institute of Cost Accountants of India (Statutory Body under an Act of Parliament) Page 26
Persons primarily involved Management Supervisors (or none)
Mental activity Administrative; persuasive Follow directions (or none)
Source discipline Social psychology Economics; physical
sciences
Time horizon Weeks, months years Day to day
Type of costs Discretionary Engineered
Question 16.
After observing heavy congestion of customers over a period of time in a petrol station, Mr.
Khan has decided to set up a petrol pump facility on his own in his nearby site. He has complied
statistics relating to the potential customer arrival pattern and service pattern as given below. He
has also decided to evaluate the operations by using the simulation technique.
Arrivals Services
Inter-arrival time (minutes) Probability Inter-arrival time
(minutes)
Probability
2 0.22 4 0.28
4 0.30 6 0.40
6 0.24 8 0.22
8 0.14 10 0.10
10 0.10
Assume:
(i) The clock starts at 8.00 hours
(ii) Only one pump is set-up
(iii) The following 12 Random Nos. are to be used to depict the customer arrival pattern
78 26 94 08 46 63 18 35 59 12 97 82
(iv) The following 12 Random Nos. are to be used to depict the service pattern
44 21 73 96 63 35 57 31 84 24 05 37
You are required to find out the
(i) Probability of the pump being idle
(ii) Average time spent by a customer waiting in queue.
Answer:
Inter-arrival time Service time
Inter-
arrival
time
(minutes)
Probability Cumulative
probability
Range Inter-arrival
time
(minutes)
Probability Cumulative
probability
Range
2 0.22 0.22 00-21 4 0.28 0.28 00-27
4 0.30 0.52 22-51 6 0.40 0.68 28-67
6 0.24 0.76 52-75 8 0.22 0.90 68-89
8 0.14 0.90 76-89 10 0.10 1.00 90-99
10 0.10 1.00 90-99
Sl.no Random
No. for
inter-
arrival
Inter-
arrival
time
Entry
time in
queue
Service
start
time
Random
no. for
service
Service
time
Service
end
time
Waiting
time of
customer
Idle
time
1 78 8 8.08 8.08 44 6 8.14 - 8
2 26 4 8.12 8.14 21 4 8.18 2 -
3 94 10 8.22 8.22 73 8 8.30 - 4

Revisionary Test Paper_Final_Syllabus 2012_Dec2008
Board of Studies, The Institute of Cost Accountants of India (Statutory Body under an Act of Parliament) Page 27
4 08 2 8.24 8.30 96 10 8.40 6
5 46 4 8.28 8.40 63 6 8.46 12
6 63 6 8.34 8.46 35 6 8.52 12
7 18 2 8.36 8.52 57 6 8.58 16
8 35 4 8.40 8.58 31 6 9.04 18
9 59 6 8.46 9.04 84 8 9.12 18
10 12 2 8.48 9.12 24 4 9.16 24
11 97 10 8.58 9.16 05 4 9.20 18
12 82 8 9.06 9.20 37 6 9.26 14
Total
Validity
Time
140 12
Average waiting time spent by the customer= 140/12= 11.67 minutes.
Probability of idle time of the petrol station= 12/86= 0.1395 or 13.95% idle, say 14%.
Question 17.
(a) “Purpose of Sensitivity analysis is to identify the critical variable in project analysis.”-Discuss.
Answer: Sensitivity analysis applied to a Capital project will show the margin of error in various
parameters of a project which can be allowed before the project ceases to be profitable.
Sensitivity analysis is a good technique for focusing the attention of management on critical
variable and showing where additional analysis may be beneficial before finally accepting a
project. It does not directly measure risk and it is limited by only being able to examine the effect
of change in one variable, while the others remaining constant, an unlike occurrence in
practice.
(b) The sales Manager of the Electronic Toy Company is considering two toys: a doll and a
game. The toys have discrete probability distribution of cash inflows in each of the next three
years.
Event Doll (`) Probability Game
Prosperity 20,000 0.2 42,000
Normal 15,000 0.5 20,000
Recession 9,000 0.3 (5,000)
(i) For each toy item, compute
1. The expected value of the cash inflow in each of the next three years.
2. The standard deviation
(ii) Which toy would you select and why?
Answer:
For the doll: Expected Value= `20,000 x 0.2 + `15,000 x 0.5 + `9,000 x 0.3= `14,200
For the game: Expected Value=`42,000 x 0.2 + `20,000 x 0.5 - `5,000 x 0.3=`16,900
For the doll:
= [0.2(20,000-14,200)2 + 0.5(15,000-14,200)2 +0.3(9,000-14,200)2]1/2 = `3,893.58
For the game: =`16,573.77

Revisionary Test Paper_Final_Syllabus 2012_Dec2008
Board of Studies, The Institute of Cost Accountants of India (Statutory Body under an Act of Parliament) Page 28
Coefficient of variation: doll 10014,200
3893.85=27.4%
Game 10016,900
16,573.77=98.1%
CV is lower in Doll-Therefore Doll should be chosen-Risk is lower
(c) What is Extended Supply Chain?
Answer: The extended supply chain is a clever way of describing everyone who contributes to a
product. So if you make text books, then your extended supply chain would include the
factories where the books are printed and bound, but also the company that sells you the
paper, the mill where that supplier buys their stock, and so on. It is important to keep track of
what is happening in your extended supply chain because with a supplier or a supplier‟s supplier
could end up having an impact on you (as the old saying goes, a chain is only a strong as its
weakest link). For example, a fire in a paper mill might cause the text book manufacturer‟s
paper supplier to run out of inventory. If the text book company knows what is happening in its
extended supply chain it can find another paper vendor.
Question 18.
The Managers of Soundtrack Ltd. were surprised at a recent newspaper article, which suggested
that the company‟s performance in last two years had been poor. The MD commented that the
turnover had increased by nearly 17% and pre-tax profit by 25% between the last two financial
years and that the company compared well with others in the same industry.
The Company seeks your opinion on the issue and provides you with the following details:
`in Crores
Profit and Loss Account extracts for the year
2011-12 2012-13
Turnover 326 380
Pre-tax accounting profit (*) 67 84
Taxation 23 29
Profit after tax 44 55
Dividends 15 18
Retained earnings 29 37
Balance sheet extracts for the year ending
2011-12 2012-13
Fixed Assets 120 156
Net Current Assets 130 160
250 316
Financed by:
Shareholders‟ funds 195 236
Medium and long-term loans 55 80
250 316
(*) After deduction of the economic depreciation of the Company‟s fixed assets. This is also the
depreciation used for tax purposes.
Other information:
(i) Soundtrack had non-capitalized leases Valued at `10 crore in each year 2011-13.
(ii) Balance sheet capital employed at 31.03.2011 was `223 crore.
(iii) The company‟s pre-tax cost of debts was estimated to be 9% in 2011-2012 and 10% in 2012-
13.
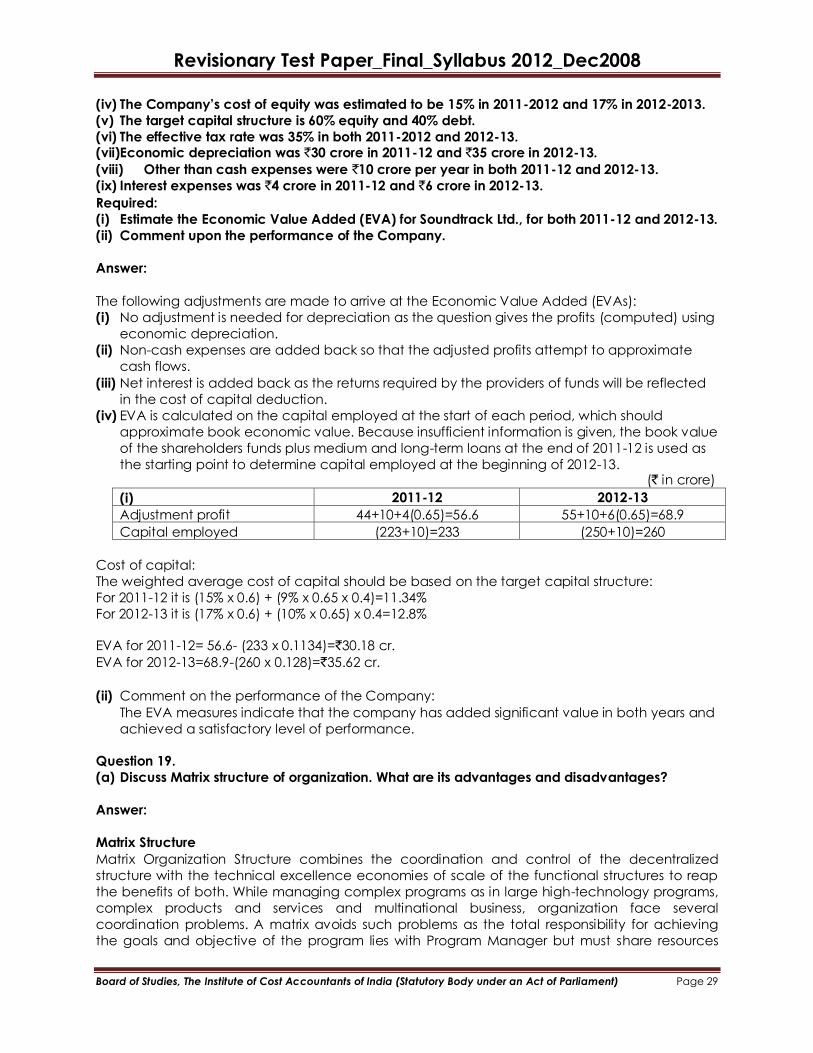
Revisionary Test Paper_Final_Syllabus 2012_Dec2008
Board of Studies, The Institute of Cost Accountants of India (Statutory Body under an Act of Parliament) Page 29
(iv) The Company‟s cost of equity was estimated to be 15% in 2011-2012 and 17% in 2012-2013.
(v) The target capital structure is 60% equity and 40% debt.
(vi) The effective tax rate was 35% in both 2011-2012 and 2012-13. (vii)Economic depreciation was `30 crore in 2011-12 and `35 crore in 2012-13.
(viii) Other than cash expenses were `10 crore per year in both 2011-12 and 2012-13.
(ix) Interest expenses was `4 crore in 2011-12 and `6 crore in 2012-13.
Required:
(i) Estimate the Economic Value Added (EVA) for Soundtrack Ltd., for both 2011-12 and 2012-13.
(ii) Comment upon the performance of the Company.
Answer:
The following adjustments are made to arrive at the Economic Value Added (EVAs):
(i) No adjustment is needed for depreciation as the question gives the profits (computed) using
economic depreciation.
(ii) Non-cash expenses are added back so that the adjusted profits attempt to approximate
cash flows.
(iii) Net interest is added back as the returns required by the providers of funds will be reflected
in the cost of capital deduction.
(iv) EVA is calculated on the capital employed at the start of each period, which should
approximate book economic value. Because insufficient information is given, the book value
of the shareholders funds plus medium and long-term loans at the end of 2011-12 is used as
the starting point to determine capital employed at the beginning of 2012-13. (` in crore)
(i) 2011-12 2012-13
Adjustment profit 44+10+4(0.65)=56.6 55+10+6(0.65)=68.9
Capital employed (223+10)=233 (250+10)=260
Cost of capital:
The weighted average cost of capital should be based on the target capital structure:
For 2011-12 it is (15% x 0.6) + (9% x 0.65 x 0.4)=11.34%
For 2012-13 it is (17% x 0.6) + (10% x 0.65) x 0.4=12.8%
EVA for 2011-12= 56.6- (233 x 0.1134)=`30.18 cr.
EVA for 2012-13=68.9-(260 x 0.128)=`35.62 cr.
(ii) Comment on the performance of the Company:
The EVA measures indicate that the company has added significant value in both years and
achieved a satisfactory level of performance.
Question 19.
(a) Discuss Matrix structure of organization. What are its advantages and disadvantages?
Answer:
Matrix Structure
Matrix Organization Structure combines the coordination and control of the decentralized
structure with the technical excellence economies of scale of the functional structures to reap
the benefits of both. While managing complex programs as in large high-technology programs,
complex products and services and multinational business, organization face several
coordination problems. A matrix avoids such problems as the total responsibility for achieving
the goals and objective of the program lies with Program Manager but must share resources

Revisionary Test Paper_Final_Syllabus 2012_Dec2008
Board of Studies, The Institute of Cost Accountants of India (Statutory Body under an Act of Parliament) Page 30
from the various functional heads. The functional managers assigned to the projects are
administratively reporting to the Project Manager but functionally to the Function Head.
The distinguishing feature of the matrix structure is thus the dual dimensions of management
embodied in it. The outputs produced by the organization may be identified in the rows of the
matrix while functional inputs utilized by each project may be identified in the columns of the
matrix. The total outputs of the functions are found in the last column of the matrix. Though the
Project Manager assumes full responsibility for delivery of a product which meets performance
specifications he does not have direct authority over the functional organization that actually
performs the work. The functional personnel thus operate under the knowledge-based authority
of the function and the resource-based authority of the Project Manager. This may create a
friction in the course of the work but it is up to the Project Manager to use it as a creative friction
to further the goals of the program.
The matrix organization structure is suitable for projects which are not large enough to warrant a
fully decentralized set-up, with all functional managers under each project. Decentralization
may result in loss of scale economics, by way of duplication of functional services for several
projects. The matrix structure is suitable for projects of short duration.
Advantages
(i) Ensures better coordination and control of the decentralized structure along with
achieving technical excellence and economies of scale of the functional organization.
(ii) Fosters creativity and multiple sources of diversity.
(iii) Broader middle-management exposure to strategic issues of the business.
(iv) Acts as a good training ground for future leaders.
Disadvantages
(i) Dual accountability as explained above, which may create confusion.
(ii) Necessitates tremendous horizontal and vertical coordination.
(iii) Difference in orientation between Program and Functional personnel. The functional
person may aim for high technical performance not warranted by project requirement.
(iv) Diffuse responsibility - As responsibility is distributed between program and functional
personnel becomes difficult to administer system of accountability, leading to potential
conflict.
(v) Program personnel may have a sense of insecurity as soon as a project is completed and
this may lower their morale.
(vi) The design of the reward structure for program and functional personnel is a ticklish issue
which should be worked out in a fair and transparent manner to satisfy all.
(b) Discuss Management Style & Culture
Answer:
Management Style may be summarized as a continuum between highly autocratic or external
style or Theory X Style and highly participative or internal style or Theory Y style.
In the external style there is
(a) Centralization of authority and decision making and lower levels of management have to
strictly comply with the formal procedures laid.
(b) The organization structure is pyramidal in nature.
(c) Detailed formal planning and control systems are formulated which are rigid in nature.
(d) There is strict supervision and guided tight control.

Revisionary Test Paper_Final_Syllabus 2012_Dec2008
Board of Studies, The Institute of Cost Accountants of India (Statutory Body under an Act of Parliament) Page 31
(e) There is no freedom given and no empowerment at lower level.
(f) Rewards and incentives are used effectively to motivate employee.
This system does produce results, but it may de motivate employees who like to have more
freedom in the works environment. Further it may thwart the innovative spirit. The intense
competition amongst employee may even create a tense atmosphere in the organization
which may not be conducive to long term growth.
However in case the employee are very subservient and not enterprising, this style may suit such
organization.
The classic illustration of this external style was the one practiced by Harold Geneen of ITT in U.S.
with a highly centralized tight central system. He personally made detailed evaluations of the
performance of business units instead of monitoring the overall performance only, leaving the
details to the unit managers.
Internal Style: The internal style is participative in nature and employees are given the freedom
to offer suggestions, come out with innovations and take part in the decision making process.
There is thus
(a) Decentralization of authority i.e., bottom-up approach
(b) The organization structure is flat.
(c) Rules and procedures are flexible.
(d) There is empowerment of employee which may encourage their creative spirit to blossom.
(e) The organization promotes commitment and self-control rather than thrusting a stifling
control on employees.
In this style of management there may be a tendency on the part of some employees, who are
not self motivated, to be passengers, without making any positive contribution to the
organization. There is also the danger of each employee going his own way resulting in chaos,
and to avoid such eventuality suitable coordinating mechanism must be in places. Moreover,
the individual behavior must be goal-congruent with that of the organization.
John Chambers of CISCO practiced a participatory approach and encouraged his employees
to lead, make good decision and take risks willingly.
Jack Welch the legendary CEO of General Electric was an autocratic leader in his early career,
inviting the nickname of “Newtron Jack”. From 1990s he transformed his style into one of
involving people in decision-making and making use of the brain of every worker. His ambitions
goal was to remove the “boss element” for G.E and to make it a boundary less organization.
Jeff Immelt who succeeded Jack Welch in 2001 is adored by everyone in G.E. for being a
friendly likeable leader, with a proven track record.
In India, Infosys is a typical example of a company practicing a democratic approach in
management.
Toyota is well-known for its philosophy of encouraging employees to come out with suggestions
for improvement and rewarding them.
Mixed Style This is a composite of both the above styles, blending the advantages of each,
without their drawbacks. Human nature being what it is, proper functioning of any organization
requires suitable checks and balances. A control style based exclusively on intrinsic motivation
seems to be naïve. A rigid authoritarian style, cast in a rule-bound framework, may be a noose
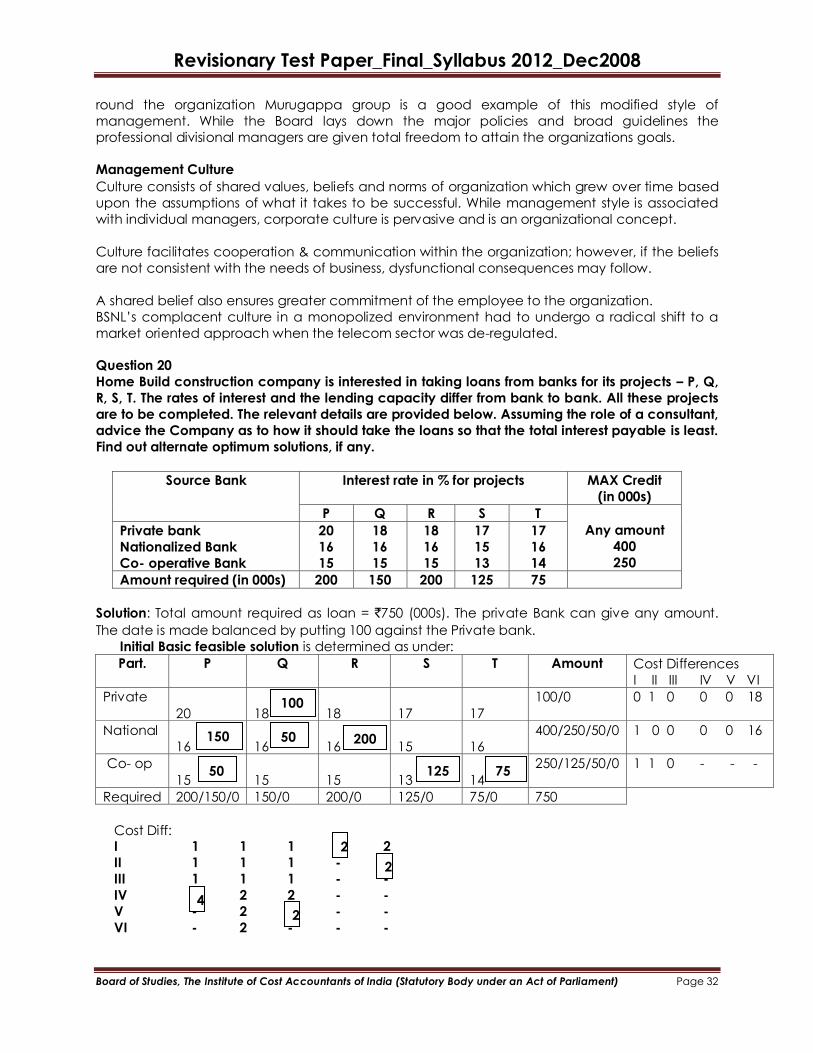
Revisionary Test Paper_Final_Syllabus 2012_Dec2008
Board of Studies, The Institute of Cost Accountants of India (Statutory Body under an Act of Parliament) Page 32
round the organization Murugappa group is a good example of this modified style of
management. While the Board lays down the major policies and broad guidelines the
professional divisional managers are given total freedom to attain the organizations goals.
Management Culture
Culture consists of shared values, beliefs and norms of organization which grew over time based
upon the assumptions of what it takes to be successful. While management style is associated
with individual managers, corporate culture is pervasive and is an organizational concept.
Culture facilitates cooperation & communication within the organization; however, if the beliefs
are not consistent with the needs of business, dysfunctional consequences may follow.
A shared belief also ensures greater commitment of the employee to the organization.
BSNL‟s complacent culture in a monopolized environment had to undergo a radical shift to a
market oriented approach when the telecom sector was de-regulated.
Question 20
Home Build construction company is interested in taking loans from banks for its projects – P, Q,
R, S, T. The rates of interest and the lending capacity differ from bank to bank. All these projects
are to be completed. The relevant details are provided below. Assuming the role of a consultant,
advice the Company as to how it should take the loans so that the total interest payable is least.
Find out alternate optimum solutions, if any.
Source Bank Interest rate in % for projects MAX Credit
(in 000s)
P Q R S T
Any amount
400
250
Private bank
Nationalized Bank
Co- operative Bank
20
16
15
18
16
15
18
16
15
17
15
13
17
16
14
Amount required (in 000s) 200 150 200 125 75
Solution: Total amount required as loan = `750 (000s). The private Bank can give any amount.
The date is made balanced by putting 100 against the Private bank.
Initial Basic feasible solution is determined as under:
Part. P Q R S T Amount Cost Differences
I II III IV V VI
Private
20
18
18
17
17
100/0 0 1 0 0 0 18
National
16
16
16
15
16
400/250/50/0 1 0 0 0 0 16
Co- op
15
15
15
13
14
250/125/50/0 1 1 0 - - -
Required 200/150/0 150/0 200/0 125/0 75/0 750
Cost Diff: I 1 1 1 2
II 1 1 1 -
III 1 1 1 - -
IV 2 2 - -
V - 2 - -
VI - 2 - - -
100
50
150 150 50 200
125 75
4
2
2
2

Revisionary Test Paper_Final_Syllabus 2012_Dec2008
Board of Studies, The Institute of Cost Accountants of India (Statutory Body under an Act of Parliament) Page 33
In the above IBFS.
Number of allocated cell is 7
M + n – 1 (i.e. Rows + Columns – 1)
= 3+5-1 = 7
Hence, there is no degeneracy. This can be tested for optimality.
Optimality Test:
Table 2 = Ui + Vj for allocated cells computed as below:
Ui & Vj 15-0= 15 16-1= 15 16-1 = 15 13-0= 13 14 – 0= 14
18 – 15 = 3
20
18
18
17
17
16 – 15= 1
16
16
16
15
16
(based) 0
15
15
15
13
14
Table 2 = Ui + Vj for unallocated cells computed as below:
3 + 15 = 18 3 + 15 = 18 3 + 13 = 16 3 + 14 = 17
1 + 13 = 14 1 + 14 = 15
0 + 15 = 15 0 + 15 = 15
Table 3 = Net Evaluation Table (NET) = Table 1 – Table 2 for unallocated cells is computed
below:
20 - 18 = 2 18 - 18 = 0 17 - 16 = 1 17 - 17 = 0
15 - 14 = 1 16 - 15 = 1
15 - 15 = 0 15 - 15 = 0
The above solution is optimal since all elements in NET are non- negative. However there are four zeroes and so the solution is not unique. There are four alternate solutions.
Computation of Minimum Cost: (amount in „000s and interest rate in %)
Particulars P Q R S T
Private 100 x 18 = 18
National 150 x 16 = 24.00 50 x 16 = 8 200 x 16 = 32
Co- op 50 x 15 = 7.50 125 x 13 = 16.25 75 x 14 = 10.50 Minimum Cost = Total of above = `1,16,250
Question 21.
(a) What is Cost of lost opportunity?
Answer: The most difficult cost of quality to quantify is the cost of lost opportunities. This is the lost
revenue resulting from the loss of existing customers, the loss of potential customers and the lost
business growth arising from the failure to deliver products and services at the required quality
standards. Examples include cancellations due to inadequate service response times, ordering
of competitors‟ products because the company‟s products are not available, and the wrong
products offered for the specific customer‟s application.
(b) What is cost of quality? How it can be reduced?
Answer: The cost of quality is the sum of cost of conformance, cost of non-conformance and
cost of lost opportunity. The quality costs amount to somewhere between 5-25% of turnover
depending on industry. The quality cost will be much more if we include the potential loss of
business from the affected customers. With cost of quality accounting for such a large
proportion of turnover any reduction in quality cost will improve profitability and provide
competitive edge to the company.
The quality cost reduction can be achieved in the following two stages:
150
100
50
50 200
75 125

Revisionary Test Paper_Final_Syllabus 2012_Dec2008
Board of Studies, The Institute of Cost Accountants of India (Statutory Body under an Act of Parliament) Page 34
(i) First, when prevention costs are increased to pay for the right kind of systems engineering
work in quality control, a reduction will occur in rejection, defect and rework of output.
This defect reduction means a substantial reduction in both types of failure costs. (ii) Secondly, a reduction in defective output will have a positive effect on appraisal costs
because defect reduction means a reduced need for routine inspection and test
activities. It follows that as prevention is increased the need for appraisal decreases. The
end result is a substantial reduction in the cost of quality and an increase in the level of
quality.
(c) What is the definition of quality? Explain.
Answer: Quality is defined as “the totality of features and characteristics of a product or service
that bear on its ability to satisfy stated or implied needs.”
Within the context of manufacturing, the definition of quality would include the following
factors: (i) Form: All dimensions, appearance, configuration of the manufacturing practice must
meet the prescribed requirement. (ii) Fix: Features of the product must be applicable to its use, including proper function,
interchangeability, consistent geometry and so forth. (iii) Function: The products performance should conform to the design and meet the
customer applications. (iv) Reliability: The product item should function according to the expectations over a
reasonable life time.
(v) Consistency: Every product has the same properties, functions and performance. The
customers will expect consistent service from each product.
Question 22.
(a) What is Quality Management Principle? Discuss different types of Quality Management
Principles.
Answer
A Quality Management Principle is a comprehensive and fundamental rule or belief, for leading
and operating an organization aimed at continually improving performance over the long-term
by focusing on customers while addressing the needs of all other stakeholders.
Eight Quality Management Principles have been identified. These are:
PRINCIPLE-1: CUSTOMER FOCUS
Organizations depend on their customers and therefore should understand current and future
Customer needs, should meet customer requirements and strive to exceed customer
expectations. PRINCIPLE-2: LEADERSHIP
Leaders establish unity of purpose and direction of the organization. They should create and
maintain the internal environment in which people can become fully involved in achieving
organization‟s objectives. PRINCIPLE-3: INVOLVEMENT OF PEOPLE
People of all levels are the essence of an organization and their full involvement enables their
abilities to be used for the organizations benefit. PRINCIPLE-4: PROCESS APPROACH
A desired result is achieved more efficiently when activities and related resources are managed
as a process. PRINCIPLE-5: SYSTEM APPROACH TO MANAGEMENT
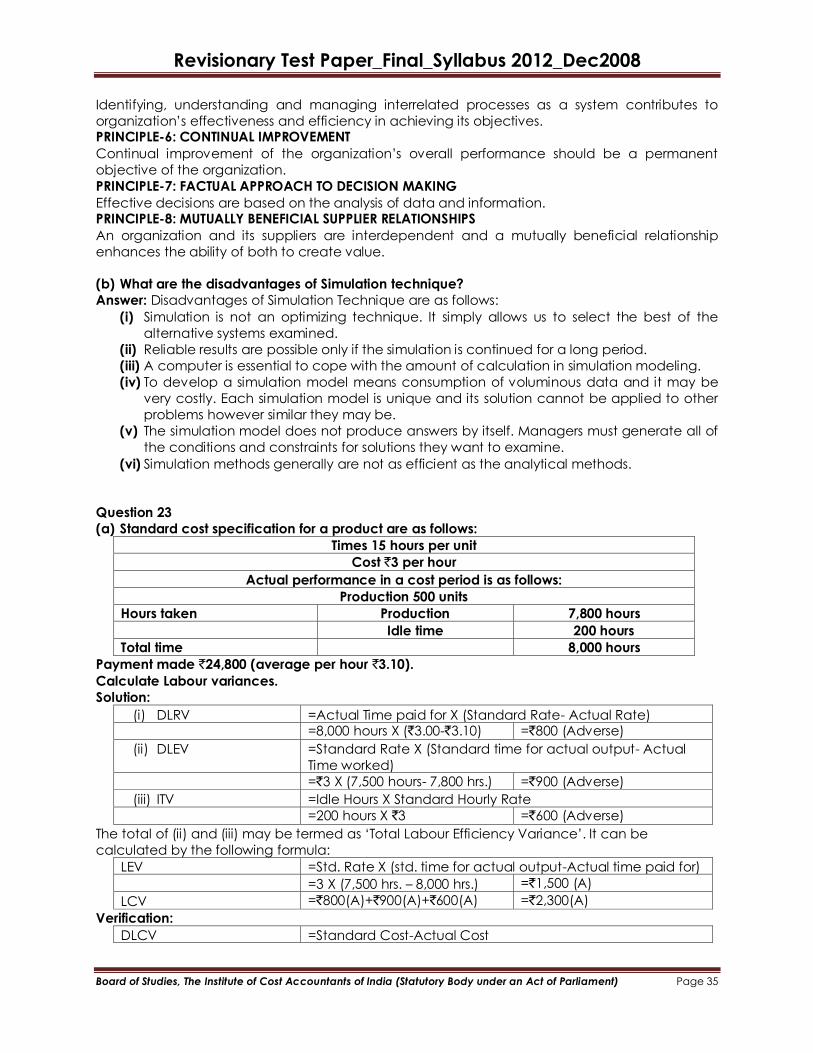
Revisionary Test Paper_Final_Syllabus 2012_Dec2008
Board of Studies, The Institute of Cost Accountants of India (Statutory Body under an Act of Parliament) Page 35
Identifying, understanding and managing interrelated processes as a system contributes to
organization‟s effectiveness and efficiency in achieving its objectives. PRINCIPLE-6: CONTINUAL IMPROVEMENT
Continual improvement of the organization‟s overall performance should be a permanent
objective of the organization.
PRINCIPLE-7: FACTUAL APPROACH TO DECISION MAKING
Effective decisions are based on the analysis of data and information. PRINCIPLE-8: MUTUALLY BENEFICIAL SUPPLIER RELATIONSHIPS
An organization and its suppliers are interdependent and a mutually beneficial relationship
enhances the ability of both to create value.
(b) What are the disadvantages of Simulation technique?
Answer: Disadvantages of Simulation Technique are as follows:
(i) Simulation is not an optimizing technique. It simply allows us to select the best of the
alternative systems examined.
(ii) Reliable results are possible only if the simulation is continued for a long period.
(iii) A computer is essential to cope with the amount of calculation in simulation modeling.
(iv) To develop a simulation model means consumption of voluminous data and it may be
very costly. Each simulation model is unique and its solution cannot be applied to other
problems however similar they may be.
(v) The simulation model does not produce answers by itself. Managers must generate all of
the conditions and constraints for solutions they want to examine.
(vi) Simulation methods generally are not as efficient as the analytical methods.
Question 23
(a) Standard cost specification for a product are as follows:
Times 15 hours per unit
Cost `3 per hour
Actual performance in a cost period is as follows:
Production 500 units
Hours taken Production 7,800 hours
Idle time 200 hours
Total time 8,000 hours
Payment made `24,800 (average per hour `3.10).
Calculate Labour variances.
Solution:
(i) DLRV =Actual Time paid for X (Standard Rate- Actual Rate)
=8,000 hours X (`3.00-`3.10) =`800 (Adverse)
(ii) DLEV =Standard Rate X (Standard time for actual output- Actual
Time worked)
=`3 X (7,500 hours- 7,800 hrs.) =`900 (Adverse)
(iii) ITV =Idle Hours X Standard Hourly Rate
=200 hours X `3 =`600 (Adverse)
The total of (ii) and (iii) may be termed as „Total Labour Efficiency Variance‟. It can be
calculated by the following formula:
LEV =Std. Rate X (std. time for actual output-Actual time paid for)
=3 X (7,500 hrs. – 8,000 hrs.) =`1,500 (A)
LCV =`800(A)+`900(A)+`600(A) =`2,300(A)
Verification:
DLCV =Standard Cost-Actual Cost
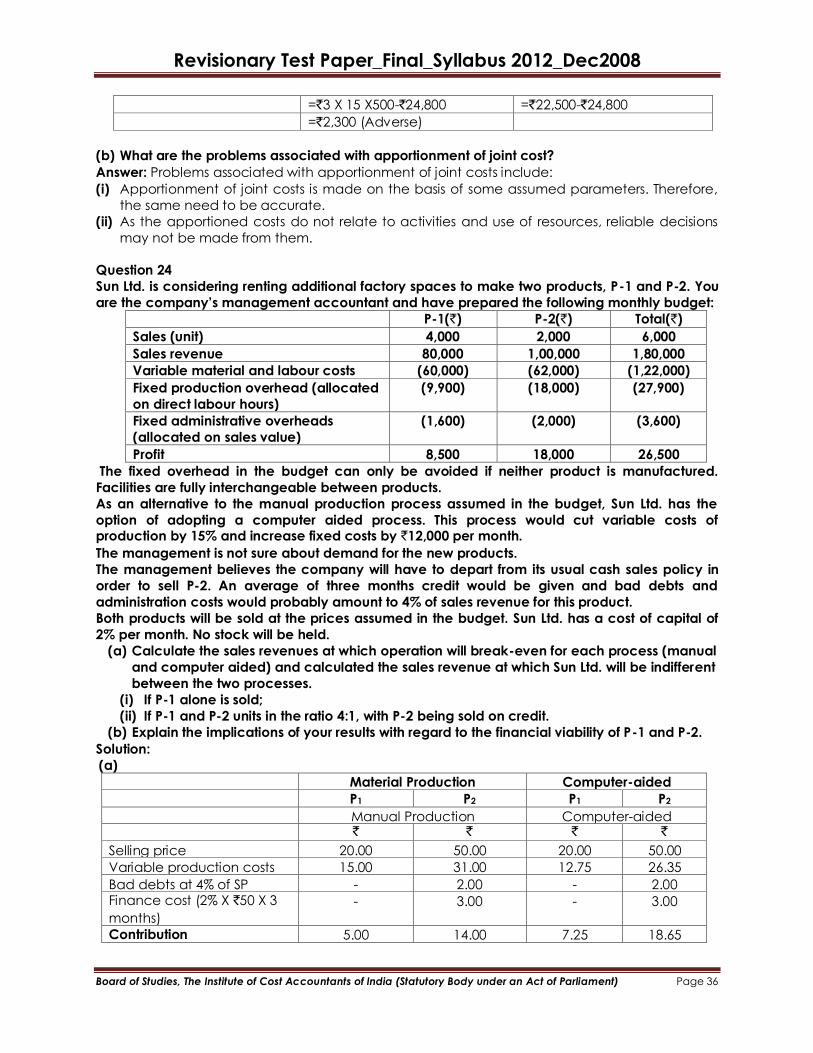
Revisionary Test Paper_Final_Syllabus 2012_Dec2008
Board of Studies, The Institute of Cost Accountants of India (Statutory Body under an Act of Parliament) Page 36
=`3 X 15 X500-`24,800 =`22,500-`24,800
=`2,300 (Adverse)
(b) What are the problems associated with apportionment of joint cost?
Answer: Problems associated with apportionment of joint costs include:
(i) Apportionment of joint costs is made on the basis of some assumed parameters. Therefore,
the same need to be accurate.
(ii) As the apportioned costs do not relate to activities and use of resources, reliable decisions
may not be made from them.
Question 24
Sun Ltd. is considering renting additional factory spaces to make two products, P-1 and P-2. You
are the company‟s management accountant and have prepared the following monthly budget: P-1(`) P-2(`) Total(`)
Sales (unit) 4,000 2,000 6,000
Sales revenue 80,000 1,00,000 1,80,000
Variable material and labour costs (60,000) (62,000) (1,22,000)
Fixed production overhead (allocated
on direct labour hours)
(9,900) (18,000) (27,900)
Fixed administrative overheads
(allocated on sales value)
(1,600) (2,000) (3,600)
Profit 8,500 18,000 26,500
The fixed overhead in the budget can only be avoided if neither product is manufactured.
Facilities are fully interchangeable between products.
As an alternative to the manual production process assumed in the budget, Sun Ltd. has the
option of adopting a computer aided process. This process would cut variable costs of production by 15% and increase fixed costs by `12,000 per month.
The management is not sure about demand for the new products.
The management believes the company will have to depart from its usual cash sales policy in
order to sell P-2. An average of three months credit would be given and bad debts and
administration costs would probably amount to 4% of sales revenue for this product.
Both products will be sold at the prices assumed in the budget. Sun Ltd. has a cost of capital of
2% per month. No stock will be held.
(a) Calculate the sales revenues at which operation will break-even for each process (manual
and computer aided) and calculated the sales revenue at which Sun Ltd. will be indifferent
between the two processes.
(i) If P-1 alone is sold;
(ii) If P-1 and P-2 units in the ratio 4:1, with P-2 being sold on credit.
(b) Explain the implications of your results with regard to the financial viability of P-1 and P-2.
Solution:
(a)
Material Production Computer-aided
P1 P2 P1 P2
Manual Production Computer-aided
` ` ` `
Selling price 20.00 50.00 20.00 50.00
Variable production costs 15.00 31.00 12.75 26.35
Bad debts at 4% of SP - 2.00 - 2.00 Finance cost (2% X `50 X 3
months)
- 3.00 - 3.00
Contribution 5.00 14.00 7.25 18.65

Revisionary Test Paper_Final_Syllabus 2012_Dec2008
Board of Studies, The Institute of Cost Accountants of India (Statutory Body under an Act of Parliament) Page 37
Fixed cost per month `31,500 `43,500
(i) P1 only is sold:
Manual process break-even point =6,300 units [`31,500/`5]
=`1,26,000 sales revenue
Computer aided break-even point =6,000 units [`43,500/`7.25]
=`1,20,000 sales revenue
Point of indifference: Let X =point of indifference
Then under manual process indifference point is where:
5x-31,500 =7.25x-43,500
=5,333.33 units
=`1,06,667 sales revenue
(ii) P1 and P2 are sold in the ratio of 4:1
Manual process: Average contribution per unit =(4X `5+1X `14)/5 =`6.80 Break-even point
=4,632.35 units [`31,500/`6.80]
=`1,20,441 sales revenue
Computer-aided process: Average contribution per unit =(4X `7.25+1X `18.65)/5 =`9.53 Break-even point
=4,564.53 units [`43,500/`9.53]
=`1,18,678 sales revenue
Indifference point: Let X =point of indifference
Then under computer aided process indifference point is
Where 6.80x-`31,500 =9.53x-43,500
=4,395.60 units
=`1,14,286 sales revenue
(b) Budgeted sales of P1<BE sales. As such, production P1 alone cannot be considered. Also, it is
not worth selling on its own even if P1 and P2 are substitutes. That the products are perfect substitutes and `1,80,000 sales can be generated is likely to be over-optimistic. In short, the
single-product policy is very risky.
With the alternative proposal of selling P1 and P2 in 4:1 proportion, the BE point is 4,565 units-P1
and P2 in 4:1 proportion, the BE point is 4,565 units - P1 3,652 units and P2 913 units. This will mean
a margin of safety of 348 units for P1 and 1,087 units for P2 as compared with the budgeted
quantities. Launching both products is clearly the most profitable alternative.
We note that the budgeted sales mix is in the ratio of 2:1 to yield an average contribution per unit of `8 (manual process) and `11.05 (computer aided process); the break-even point based
on this is 3,937 units for both the processes, consisting of 2,625 units of P1 and 1,312 unit of P2. This
represents a margin of safety of 1,375 units of P1 (34%) and 688 units of P2 (34%). It is obviously
better to sell P2 in preference to P1. It is recommended that both products be sold and the
computer-aided process be adopted.
Question 25
(c) A company has developed a special purpose Electronic Security Device and once
introduced in the market, the same expected to have a life cycle of 3 years from the time of
its introduction in the market before the device becomes obsolete due to technological
advancement of other competitive products.
You have been asked by the company to prepare a product life cycle budget.
The following information is available:
Year 1 Year 2 Year 3
No. of units to be manufactured and sold 50,000 2,00,000 1,50,000
Price per device (`) 500 400 350
R & D and Design cost (`) 9,00,000 1,00,000 Nil
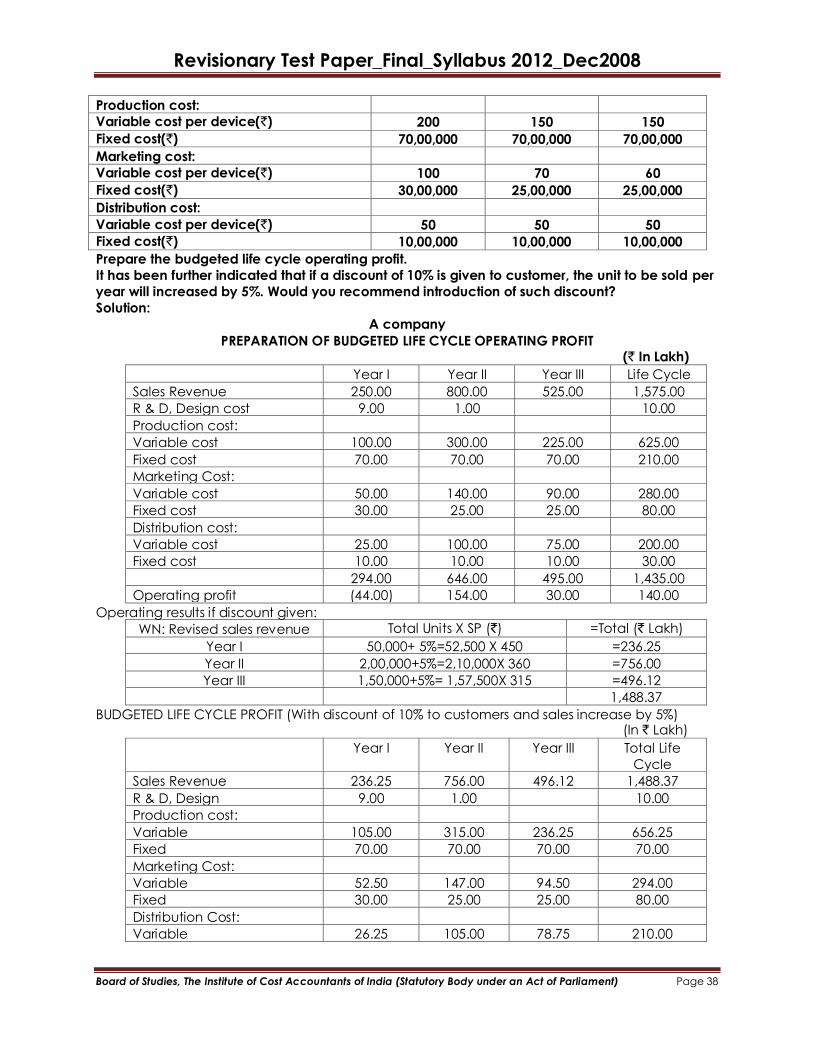
Revisionary Test Paper_Final_Syllabus 2012_Dec2008
Board of Studies, The Institute of Cost Accountants of India (Statutory Body under an Act of Parliament) Page 38
Production cost:
Variable cost per device(`) 200 150 150
Fixed cost(`) 70,00,000 70,00,000 70,00,000
Marketing cost:
Variable cost per device(`) 100 70 60
Fixed cost(`) 30,00,000 25,00,000 25,00,000
Distribution cost:
Variable cost per device(`) 50 50 50
Fixed cost(`) 10,00,000 10,00,000 10,00,000
Prepare the budgeted life cycle operating profit.
It has been further indicated that if a discount of 10% is given to customer, the unit to be sold per
year will increased by 5%. Would you recommend introduction of such discount?
Solution:
A company
PREPARATION OF BUDGETED LIFE CYCLE OPERATING PROFIT (` In Lakh)
Year I Year II Year III Life Cycle
Sales Revenue 250.00 800.00 525.00 1,575.00
R & D, Design cost 9.00 1.00 10.00
Production cost:
Variable cost 100.00 300.00 225.00 625.00
Fixed cost 70.00 70.00 70.00 210.00
Marketing Cost:
Variable cost 50.00 140.00 90.00 280.00
Fixed cost 30.00 25.00 25.00 80.00
Distribution cost:
Variable cost 25.00 100.00 75.00 200.00
Fixed cost 10.00 10.00 10.00 30.00
294.00 646.00 495.00 1,435.00
Operating profit (44.00) 154.00 30.00 140.00
Operating results if discount given:
WN: Revised sales revenue Total Units X SP (`) =Total (` Lakh)
Year I 50,000+ 5%=52,500 X 450 =236.25
Year II 2,00,000+5%=2,10,000X 360 =756.00
Year III 1,50,000+5%= 1,57,500X 315 =496.12
1,488.37
BUDGETED LIFE CYCLE PROFIT (With discount of 10% to customers and sales increase by 5%) (In ` Lakh)
Year I Year II Year III Total Life
Cycle
Sales Revenue 236.25 756.00 496.12 1,488.37
R & D, Design 9.00 1.00 10.00
Production cost:
Variable 105.00 315.00 236.25 656.25
Fixed 70.00 70.00 70.00 70.00
Marketing Cost:
Variable 52.50 147.00 94.50 294.00
Fixed 30.00 25.00 25.00 80.00
Distribution Cost:
Variable 26.25 105.00 78.75 210.00

Revisionary Test Paper_Final_Syllabus 2012_Dec2008
Board of Studies, The Institute of Cost Accountants of India (Statutory Body under an Act of Parliament) Page 39
Fixed 10.00 10.00 10.00 30.00
302.75 673.00 514.50 1,490.25
Operating profit (66.50) 83.00 (18.38) (1.88)
The second alternative is not acceptable, as that would result in overall loss during the life cycle.
(d) Enumerate the steps involved in target costing?
Answer: The following are the steps involved in target costing.
(i) Ascertain from market studies the demand and the price at which the product can be
sold.
(ii) Deduct the required profit percentage from the selling price.
(iii) The balance represents the target cost.
(iv) Compare the actual/estimated cost with the target cost.
(v) If the actual/estimated target cost is greater than the target cost, introduced cost
reduction measures to bring down the cost to the level of target cost. If the required
reduction in cost is not possible, reject the proposal to produce the product.
Question 26.
(a) Five Swimmers are eligible to compete in a relay team that should have four swimmers
swimming different styles- backstroke, breaststroke, free style and butterfly. The time taken
for the five swimmers - Anand, Balu, Chandru, Deepak and Eswar – to cover a distance of
100 metres in various swimming styles are given below in minutes: seconds. Anand swims
backstroke in 1:09, breaststroke in 1:15 and has never competed in free style or butterfly.
Balu is a free style specialist averaging 1:01 for 100 metres but can also swim breaststroke in
1:16 and butterfly in 1:20. Chandru swims all styles, backstroke 1:10, breaststroke 1:12, free
style 1:05 and butterfly 1:20. Deepak swims only butterfly at 1:11 while Eswar swims
backstroke 1:20, breaststroke 1:16, free style 1:06 and butterfly 1:10. Which swimmers should
be assigned to which swimming style? Who will not be in the team?
Solution:
I. The Time taken matrix is first derived (in seconds)
Swimmers Backstroke Breaststroke Freestyle Butterfly
Anand 69 75 - -
Balu - 76 61 80
Chandru 70 72 65 80
Deepak - - - 71
Eswar 80 76 66 70
The objective is minimization of time taken. The combinations not available for assignment are
indicate by M where M = infinity. A dummy column is introduced in the above matrix.
II. Inserting Dummy Column III. Row and Column Operations
69 75 M M 0 0 3 M M 0
M 76 61 80 0 M 4 0 10 0
70 72 65 80 0 1 0 4 10 0
M M M 71 0 M M M 1 0
80 76 66 70 0 11 4 5 0 0

Revisionary Test Paper_Final_Syllabus 2012_Dec2008
Board of Studies, The Institute of Cost Accountants of India (Statutory Body under an Act of Parliament) Page 40
IV. Inserting Dummy Column
3 M M 0
M 4 10 0
1 4 10 0
M M M 1
11 4 5 0
Answer: Total Time taken will be 272 seconds or 4 min and 32 seconds.
Swimmer Anand Balu Chandru Deepak Eswar
Style Backstroke Freestyle Breaststroke
Dummy - will not
be in the race.
Butterfly
Time Taken 69 61 72 70
(b) What is PDCA?
Answer: PDCA (“Plan-Do-Check-Act”) is an iterative four-step problem-solving process typically
used in quality control. PDCA was made popular by Dr. W. Edwards Deming, who is considered
by many to be the father of modern quality control; however it was always referred to by him as
the “Shewhart cycle.” Later in Deming‟s career, he modified PDCA to “Plan, Do, Study, Act”
(PDSA) so as to better describe his recommendations.
The concept of PDCA comes out of the Scientific Method. The scientific method can be written
as “hypothesis” - “experiment” - “evaluation” or Plan, Do, and Check. Shewhart described
manufacture under “control” - under statistical control - as a three step process of specification,
production, and inspection. The also specifically related this to the Scientific Method of
hypothesis, experiment and evaluation. Shewhart, says that the statistician “must help to change
the demand [for goods] by showing... how to close up the tolerance range and to improve the
quality of goods.” Clearly, Shewhart intended the analyst to take action based on the
conclusions of the evaluation. PDCA has an inherent circular paradigm, it assumes that
everything starts with Planning. Plan has a limited range of meaning. Shewart intended that
experiments and quality control should be planned to deliver results in accordance with the
specifications, which is good advice. However, Planning was not intended to cover aspects
such as creativity, innovation, invention. In these aspects particularly when based upon
imagination, it is often impossible or counterproductive to plan. Hence, PDCA is inapplicable in
these situations.
Question 27.
(a) A review, made by the top management of XYZ ltd., (which makes only one product), of the
result of the first quarter of the year revealed the following:
Sales (in units)
Loss Fixed cost (for the year ` 1,20,000)
Variable cost/unit
10,000 ` 10,000
`30,000
`8.00
0
0
0
0
0

Revisionary Test Paper_Final_Syllabus 2012_Dec2008
Board of Studies, The Institute of Cost Accountants of India (Statutory Body under an Act of Parliament) Page 41
The finance Manager, who feels perturbed, suggests that the company should at least break
even in the second quarter with a drive for increased sales. Towards this, the company should
introduce better packing, which will increase the cost by re. 0.50 per unit.
The Sales Manager has an alternative proposal. For the second quarter, additional sales
promotion expenses can be increased to the extent of ` 5,000 and a profit of `5,000 can be
aimed at during the period with increased sales.
The production Manager feels otherwise. To improve the demand, the selling price/ unit has to be reduced by 3%. As a result, the sales volume can be increased to attain a profit level of `
4,000 for the quarter.
The Manager Directors asks you, as a Cost and Management Accountant, to evaluate the three
proposals and to calculate the additional sales volume that would be required in each case, in
order to help him to take a decision.
Answer:
Calculation of selling Price:
Variable Cost (8x10,000) 80,000
Add: Fixed Cost 30,000
Total Cost 1,10,000
Profit (10,000)
Sales 1,00,000
Selling Price (1,00,000/10,000) `10
Statement showing evaluation of alternatives and the number of units require attain the targets
of respective managers:
Particulars Finance Manager Sales Manager Production Manager
Selling price (`) 10.00 10.00 9.70 Variable Cost (`) 8.50 8.00 8.00
Contribution/unit (`) 1.50 2.0 1.70
Fixed Cost (`) 30,000 35,000 30,000
Target (Units) B.E.P Profit of `5,000 Profit of `4,000
30,000/1.5 35,000/2 34,000/1.7
20,000 20,000 20,000
Additional units required 10,000 10,000 10,000
Conclusion: The additional sales volume that would be required in each case will be exactly the
same, namely-10,000 units.
(b) What is MRP II and what are the essential elements of it?
Answer: Manufacturing Resource Planning (MRP II) is a computer based system designed to
manage all the resources of a manufacturing organization. It acts as a planning and scheduling
system, linking manufacturing with the sales and finance departments and providing tools for
joint decision making among all three departments.
The essential elements of MRP II system are as follows:
(i) Demand forecast: Which takes into account firm orders and sales forecasts.
(ii) Production planning: Which converts the demand forecast into a broad statement of
output requirements and the necessary production programme? (iii) Resource planning: Which determines the manufacturing resources (materials and
bought-in-components etc.) required to meet the production programme.
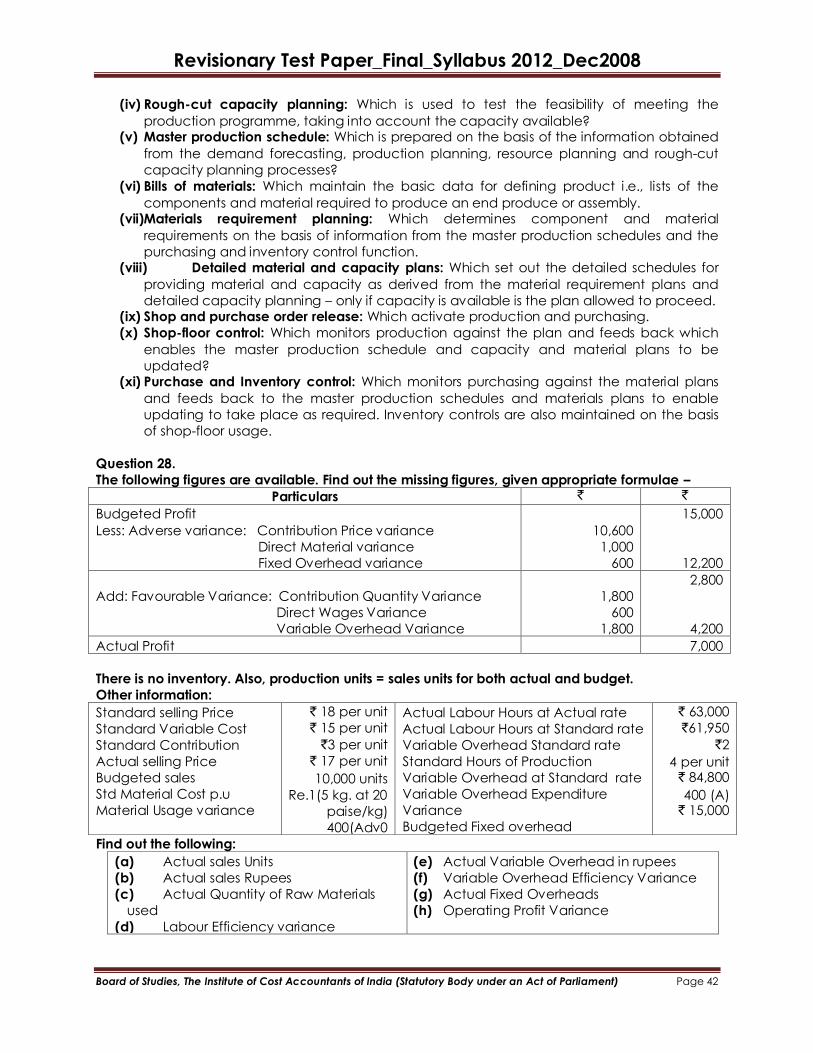
Revisionary Test Paper_Final_Syllabus 2012_Dec2008
Board of Studies, The Institute of Cost Accountants of India (Statutory Body under an Act of Parliament) Page 42
(iv) Rough-cut capacity planning: Which is used to test the feasibility of meeting the
production programme, taking into account the capacity available? (v) Master production schedule: Which is prepared on the basis of the information obtained
from the demand forecasting, production planning, resource planning and rough-cut
capacity planning processes?
(vi) Bills of materials: Which maintain the basic data for defining product i.e., lists of the
components and material required to produce an end produce or assembly. (vii)Materials requirement planning: Which determines component and material
requirements on the basis of information from the master production schedules and the
purchasing and inventory control function. (viii) Detailed material and capacity plans: Which set out the detailed schedules for
providing material and capacity as derived from the material requirement plans and
detailed capacity planning – only if capacity is available is the plan allowed to proceed. (ix) Shop and purchase order release: Which activate production and purchasing.
(x) Shop-floor control: Which monitors production against the plan and feeds back which
enables the master production schedule and capacity and material plans to be
updated? (xi) Purchase and Inventory control: Which monitors purchasing against the material plans
and feeds back to the master production schedules and materials plans to enable
updating to take place as required. Inventory controls are also maintained on the basis
of shop-floor usage.
Question 28.
The following figures are available. Find out the missing figures, given appropriate formulae –
Particulars ` `
Budgeted Profit
Less: Adverse variance: Contribution Price variance
Direct Material variance
Fixed Overhead variance
10,600
1,000
600
15,000
12,200
Add: Favourable Variance: Contribution Quantity Variance
Direct Wages Variance
Variable Overhead Variance
1,800
600
1,800
2,800
4,200
Actual Profit 7,000
There is no inventory. Also, production units = sales units for both actual and budget.
Other information:
Standard selling Price
Standard Variable Cost
Standard Contribution
Actual selling Price
Budgeted sales
Std Material Cost p.u
Material Usage variance
` 18 per unit
` 15 per unit
`3 per unit
` 17 per unit
10,000 units
Re.1(5 kg. at 20
paise/kg)
400(Adv0
Actual Labour Hours at Actual rate
Actual Labour Hours at Standard rate
Variable Overhead Standard rate
Standard Hours of Production
Variable Overhead at Standard rate
Variable Overhead Expenditure
Variance
Budgeted Fixed overhead
` 63,000
`61,950
`2
4 per unit ` 84,800
400 (A) ` 15,000
Find out the following:
(a) Actual sales Units
(b) Actual sales Rupees
(c) Actual Quantity of Raw Materials
used
(d) Labour Efficiency variance
(e) Actual Variable Overhead in rupees
(f) Variable Overhead Efficiency Variance
(g) Actual Fixed Overheads
(h) Operating Profit Variance

Revisionary Test Paper_Final_Syllabus 2012_Dec2008
Board of Studies, The Institute of Cost Accountants of India (Statutory Body under an Act of Parliament) Page 43
Solution:
1. Sales Variances
BQ x BP
(1)
AQ x AP
(2)
AQ x BP
(3)
Sales Variances
Total (1)-(2)=200F
10,000x18=1,80,000 10,600x17=1,80,200 Qtty from WN (a)
10,600x18
=1,90,800
Price(3)-(2)
=10,600A (given)
Volume(1)-(3)
=10,800F
2. Material Variances
SQ x SP
(1)
AQ x AP
(2)
AQ x SP
(3)
Material Variances
Cost (1)-(2)=1,000A (given)
(10,600x5)x0.20
=10,600
55,000x0.21
=11,600 [WN (d)]
55,000X0.20
=11,000 [WN (C)]
Price (3)-(2)
=600A (Bal.
figure)
Usage(1)-(3)
=400A (given)
3. Labour Variances
SH x SR
(1)
AH x AR
(2)
AH x SR Labour Variances
Cost(1)-(2)=600F (given)
(10,600x4)x1.50
=63,600 [WN (e)]
41,300 x1.53
=63,000 (given)
41,300X 1.50
=61,950 (given)
Rate(3)-(2)
=1,050A
Efficiency(1)-(3)
=1,650F
4. VOH Variances
SH x SR AVOH AH x SR VOH Variances
Cost(1)-(2)= 1,800F (given)
(10,600x4)x2
=84,800 (given)
[WN (f) ]
83,000
41,300x2
=82,600
[Hrs from LCV ]
Exp. (3)-(2)
=400A
Efficiency(1)-(3)
=2,200F
5. FOH Variances
AO x SR
(1)
AFOH
(2)
BFOH
(3)
FOH Variances
Cost (1)-(2) =? (NA under Merg
Costing)
10,600 ×?
=?
[ WN (g) ]
15,600
Given
15,000
Exp. (3)-(2)
=600A
Efficiency(1)-(3)
=NA
Working Notes:
a. Contribution Quantity
Variance =(BQ-AQ)x Std. Contribution per
unit
=1,800F
=(10,000-AQ)x`3 = -1,800. On solving,
AQ=10,600 units
b. Since Contribution Quantity Variance is given in the reconciliation Statement as per the
question, Marginal Costing system has been used in the reconciliation. Accordingly, FOH
Variance as per the Reconciliation statement constitutes only FOH Expenditure Variance.
c. Material usage variance=(1)-(3) =400A
10,600-(3) = -400. Hence,(3)=11,000
On balancing,
AQ of Raw Material (AQ)
= 55,000 kg.
d. Material Cost Variance (1)-(2) =1,000A
10,600-(2) = -1,000. Hence, (2)=11,600, on
balancing
AP of Raw Material (AP)
= 0.21 per kg.
e. Labour Cost Variance=(1)-(2) =600A
(1)-63,000= -600. Hence, (1)= 63,600. On balancing, Std Rate ph of Labour
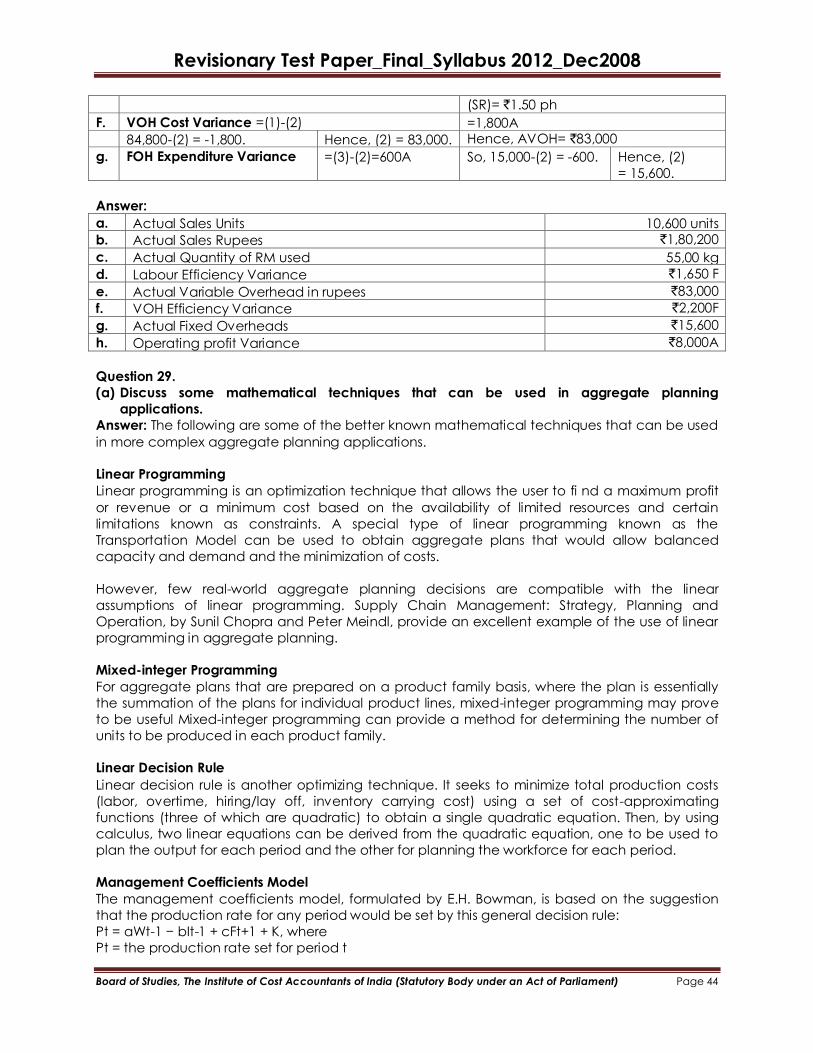
Revisionary Test Paper_Final_Syllabus 2012_Dec2008
Board of Studies, The Institute of Cost Accountants of India (Statutory Body under an Act of Parliament) Page 44
(SR)= `1.50 ph
F. VOH Cost Variance =(1)-(2) =1,800A
84,800-(2) = -1,800. Hence, (2) = 83,000. Hence, AVOH= `83,000
g. FOH Expenditure Variance =(3)-(2)=600A So, 15,000-(2) = -600. Hence, (2)
= 15,600.
Answer:
a. Actual Sales Units 10,600 units
b. Actual Sales Rupees `1,80,200
c. Actual Quantity of RM used 55,00 kg
d. Labour Efficiency Variance `1,650 F
e. Actual Variable Overhead in rupees `83,000
f. VOH Efficiency Variance `2,200F
g. Actual Fixed Overheads `15,600
h. Operating profit Variance `8,000A
Question 29.
(a) Discuss some mathematical techniques that can be used in aggregate planning
applications.
Answer: The following are some of the better known mathematical techniques that can be used
in more complex aggregate planning applications.
Linear Programming
Linear programming is an optimization technique that allows the user to fi nd a maximum profit
or revenue or a minimum cost based on the availability of limited resources and certain
limitations known as constraints. A special type of linear programming known as the
Transportation Model can be used to obtain aggregate plans that would allow balanced
capacity and demand and the minimization of costs.
However, few real-world aggregate planning decisions are compatible with the linear
assumptions of linear programming. Supply Chain Management: Strategy, Planning and
Operation, by Sunil Chopra and Peter Meindl, provide an excellent example of the use of linear
programming in aggregate planning.
Mixed-integer Programming
For aggregate plans that are prepared on a product family basis, where the plan is essentially
the summation of the plans for individual product lines, mixed-integer programming may prove
to be useful Mixed-integer programming can provide a method for determining the number of
units to be produced in each product family.
Linear Decision Rule
Linear decision rule is another optimizing technique. It seeks to minimize total production costs
(labor, overtime, hiring/lay off, inventory carrying cost) using a set of cost-approximating
functions (three of which are quadratic) to obtain a single quadratic equation. Then, by using
calculus, two linear equations can be derived from the quadratic equation, one to be used to
plan the output for each period and the other for planning the workforce for each period.
Management Coefficients Model
The management coefficients model, formulated by E.H. Bowman, is based on the suggestion
that the production rate for any period would be set by this general decision rule:
Pt = aWt-1 − bIt-1 + cFt+1 + K, where
Pt = the production rate set for period t
Revisionary Test Paper_Final_Syllabus 2012_Dec2008
Board of Studies, The Institute of Cost Accountants of India (Statutory Body under an Act of Parliament) Page 45
Wt-1 = the workforce in the previous period
It-1 = the ending inventory for the previous period
Ft+1 = the forecast of demand for the next period
a, b, c, and K are constants
It then uses regression analysis to estimate the values of a, b, c, and K. The end result is a decision
rule based on past managerial behavior without any explicit cost functions, the assumption
being that managers know what is important, even if they cannot readily state explicit costs.
Essentially, this method supplements the application of experienced judgment.
Search Decision Rule
The search decision rule methodology overcomes some of the limitations of the linear cost
assumptions of linear programming. The search decision rule allows the user to state cost data
inputs in very general terms. It requires that a computer program be constructed that will
unambiguously evaluate any production plan‟s cost. It then searches among alternative plans
for the one with the minimum cost. However, unlike
linear programming, there is no assurance of optimality.
Simulation
A number of simulation models can be used for aggregate planning. By developing an
aggregate plan within the environment of a simulation model, it can be tested under a variety
of conditions to find acceptable plans for consideration. These models can also be
incorporated into a decision support system, which can aid in planning and evaluating
alternative control policies. These models can integrate the multiple conflicting objectives
inherent in manufacturing strategy by using different quantitative measures of productivity,
customer service, and flexibility.
Functional Objective Search Approach
The functional objective search (FOS) system is a computerized aggregate planning system that
incorporates a broad range of actual planning conditions. It is capable of realistic, low-cost
operating schedules that provide options for attaining different planning goals. The system works
by comparing the planning load with available capacity. After management has chosen its
desired actions and associated planning objectives for specific load conditions, the system
weights each planning goal to reflect the functional emphasis behind its achievement at a
certain load condition. The computer then uses a computer search to output a plan that
minimizes costs and meets delivery deadlines.
(b) What is Enterprise Risk Management?
Answer: Enterprise risk management deals with risks and opportunities affecting value creation or
preservation, defined as follows:
Enterprise risk management is a process, effected by an entity‟s board of directors,
management and other personnel, applied in strategy setting and across the enterprise,
designed to identify potential events that may affect the entity, and manage risk to be within its
risk appetite, to provide reasonable assurance regarding the achievement of entity objectives.
The underlying premise of enterprise risk management is that every entity exists to provide value
for its stakeholders. All entities face uncertainty and the challenge for management is to
determine how much uncertainty to accept as it strives to grow stakeholder value. Uncertainty
presents both risk and opportunity, with the potential to erode or enhance value. Enterprise risk
management enables management to effectively deal with uncertainty and associated risk
and opportunity, enhancing the capacity to build value.

Revisionary Test Paper_Final_Syllabus 2012_Dec2008
Board of Studies, The Institute of Cost Accountants of India (Statutory Body under an Act of Parliament) Page 46
Value is maximized when management sets strategy and objectives to strike an optimal
balance between growth and return goals and related risks, and efficiently and effectively
deploys resources in pursuit of the entity‟s objectives.
Question 30.
(a) State briefly the shortcoming of Balance Scorecard.
Answer: Balance Scorecard (BSC) is a new approach to strategic Management. It is a
performance management and strategy deployment methodology that helps executives
translate an organization‟s mission statement and overall business strategy into specific
quantifiable goals and monitors the organization‟s performance in terms of these goals. The BSC
also aligns budgets to strategy and helps in developing an enterprise performance
Management System.
Shortcoming of Balanced Score Card: The following are the shortcomings of BSC:
(i) Community and environmental issues are missing in BSC. These are very vital and critical
issues today.
(ii) Competitors have not been included. Companies need to monitor the environment to
track competitor activity and technological developments.
These criticisms mainly stem from the fact that the BSC is not a multiple stakeholder framework.
Any performance measurement framework needs to reflect the needs of all the important
stakeholder. Conclusion: These shortcomings, however, should not detract from the inherent merit of BSC,
which helps to clarify, consolidated and gain consensus around the strategy of the organization.
BSC is a very power full tool for strategy implementation. The shortcoming as pointed out may be
added as its additional perspectives.
(b) DB p.l.c operates a conventional stock control system based on re-order levels and
Economic Ordering Quantities. The various control levels were set originally based on
estimates which did not allow for any uncertainty and this has caused difficulties because, in
practice, lead times, demands and other factors do vary.
As part of a review of the system, a typical stock item, Part No. X206, has been studied in detail
as follows:
Data for part No. X206
Lead time Probability
15 Working days 0.2
20 working days 0.5
25 working days 0.3
Demand per working day Probability
5,000 units 0.5
7,000 units 0.5
Note: It can be assumed that the demands would apply for the whole of the appropriate lead
time.
DB p.l.c works for 240 days per year and it costs Re. 0.15 p.a. to carry a unit of X 206 in stock. The
re-order level for this part is currently 1,50,000 units and the re-order cost is Rs. 1,000.
You are required:
a) to calculate the level of buffer stock implicit in a re-order level of 1,50,000 units.
b) To calculate to probability of a stock-out
c) To calculate the expected annual stock-outs in units;
d) To calculate the stock out cost per unit at which it would be worth while raising the re-
order level to 1,75,000 units;
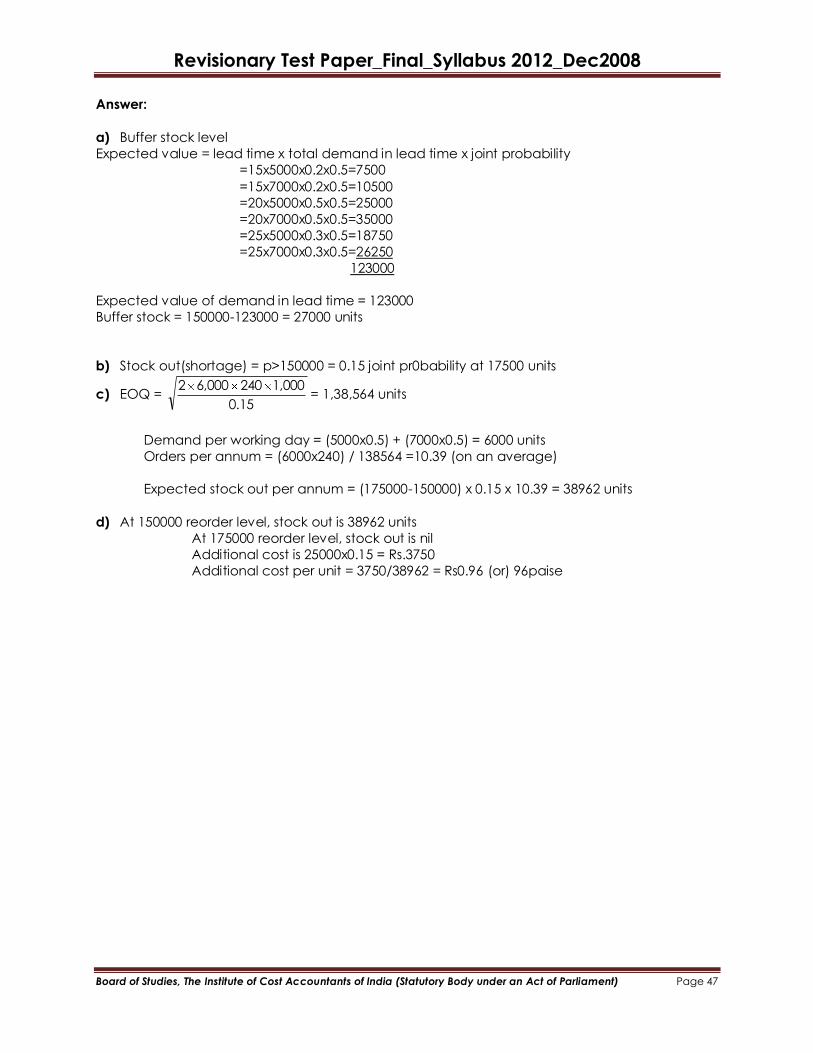
Revisionary Test Paper_Final_Syllabus 2012_Dec2008
Board of Studies, The Institute of Cost Accountants of India (Statutory Body under an Act of Parliament) Page 47
Answer:
a) Buffer stock level
Expected value = lead time x total demand in lead time x joint probability
=15x5000x0.2x0.5=7500
=15x7000x0.2x0.5=10500
=20x5000x0.5x0.5=25000
=20x7000x0.5x0.5=35000
=25x5000x0.3x0.5=18750
=25x7000x0.3x0.5=26250
123000
Expected value of demand in lead time = 123000
Buffer stock = 150000-123000 = 27000 units
b) Stock out(shortage) = p>150000 = 0.15 joint pr0bability at 17500 units
c) EOQ = 0.15
1,0002406,0002= 1,38,564 units
Demand per working day = (5000x0.5) + (7000x0.5) = 6000 units
Orders per annum = (6000x240) / 138564 =10.39 (on an average)
Expected stock out per annum = (175000-150000) x 0.15 x 10.39 = 38962 units
d) At 150000 reorder level, stock out is 38962 units
At 175000 reorder level, stock out is nil
Additional cost is 25000x0.15 = Rs.3750
Additional cost per unit = 3750/38962 = Rs0.96 (or) 96paise