Embed Size (px)
Citation preview
Minerals & Metals
2060RPT0005 Revision Number 0
Norsemont Mining
Constancia Project Technical Report 21 February 2011
\\Bnefp01\Users$\Greg.Lane\My Documents\Current Projects\Current Studies\Constancia\Ni 43-101 Report Feb 2011\Ni 43-101 Report Rev 0 21 Feb.Doc Rev: 0 Date: 21 February 2011 9999FM0038 – 2
Revision Status
Revision Date Description Author Approver
FirstName LastName Position Title FirstName LastName Position Title
A 4 Jan 2011 Issued as template for report to contributors Greg Lane GM Technical
Solutions
B 12 Jan 2011 Intermediate revision Greg Lane GM Technical Solutions
C 3 Feb 2011 Issued for review to contributors Greg Lane GM Technical
Solutions
D 16 Feb 2011 Final draft for client review Greg Lane GM Technical Solutions Andrew See Manager Studies
0 21 Feb 2011 Final Issue Greg Lane GM Technical Solutions Andrew See Manager Studies
\\Bnefp01\Users$\Greg.Lane\My Documents\Current Projects\Current Studies\Constancia\Ni 43-101 Report Feb 2011\Ni 43-101 Report Rev 0 21 Feb.Doc Rev: 0 Date: 21 February 2011 9999FM0038 – 2
3
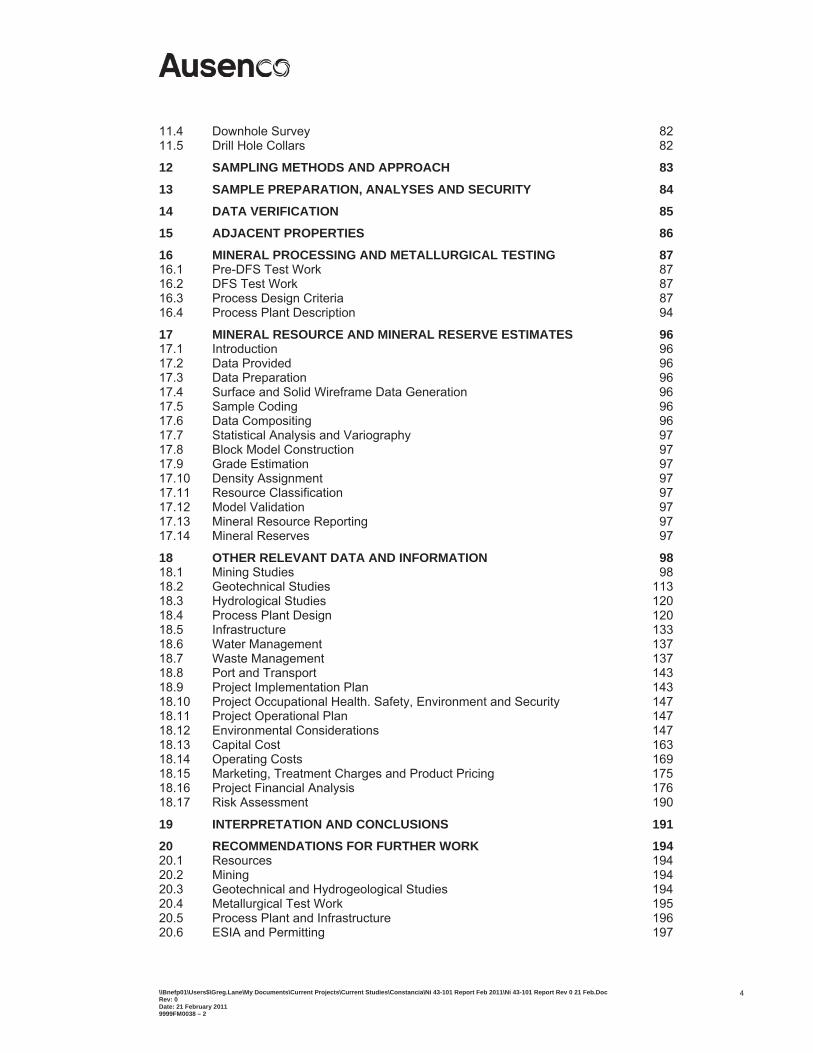
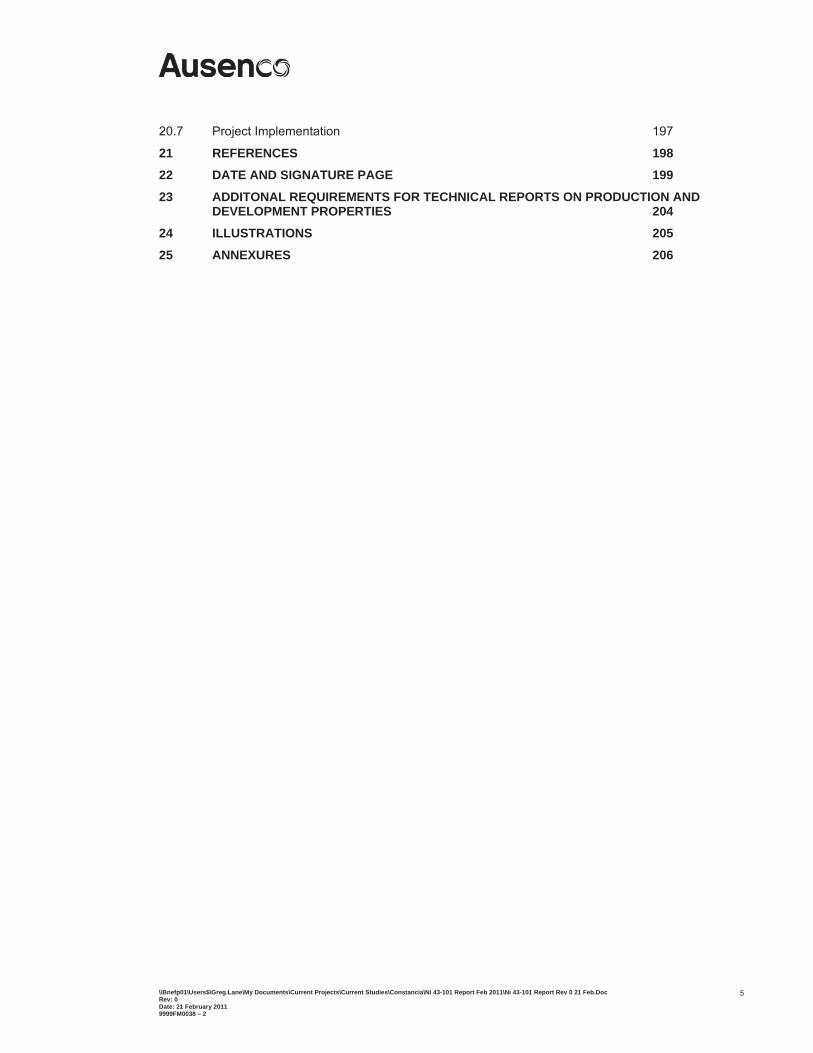
Table of Contents
1 SUMMARY 91.1 Introduction 91.2 Geology and Mineral Resources 111.3 Mining 121.4 Geotechnical Investigations 161.5 Metallurgical Testwork 181.6 Process Description and Plant Design 181.7 Waste Management 241.8 Infrastructure 291.9 Water Management 331.10 Environmental and Social Considerations 331.11 Project Implementation Plan 391.12 Project Operational Plan 401.13 Capital Cost Estimate 401.14 Operating Cost Estimates 421.15 Marketing, Product Pricing and Treatment Charges 431.16 Project Financial Analysis 431.17 Conclusions 511.18 Recommendations 53
2 INTRODUCTION 552.1 Background 552.2 Scope of Work 552.3 Sources of Information 562.4 Site Inspections 562.5 Contributions to This Report 562.6 Disclosure of Interest 56
3 RELIANCE ON OTHER EXPERTS 58
4 PROPERTY DESCRIPTION AND LOCATION 594.1 General Location 594.2 Peruvian Mining Law 594.3 Constancia Mining Concessions 594.4 Mineral Rights Ownership 594.5 Surface Rights 594.6 Environmental Regulations 60
5 ACCESSIBILITY, CLIMATE, LOCAL RESOURCES, INFRASTRUCTURE AND PHYSIOGRAPHY 61
6 HISTORY 62
7 GEOLOGICAL SETTING 63
8 DEPOSIT TYPES 64
9 MINERALISATION AND ALTERATION 65
10 EXPLORATION 6610.1 Surface Mapping and Sampling 6610.2 Geophysics 6610.3 Exploratory Drilling 78
11 DRILLING 8011.1 Overview 8011.2 Collar Location 8211.3 Rig Setup 82
\\Bnefp01\Users$\Greg.Lane\My Documents\Current Projects\Current Studies\Constancia\Ni 43-101 Report Feb 2011\Ni 43-101 Report Rev 0 21 Feb.Doc Rev: 0 Date: 21 February 2011 9999FM0038 – 2
4
11.4 Downhole Survey 8211.5 Drill Hole Collars 82
12 SAMPLING METHODS AND APPROACH 83
13 SAMPLE PREPARATION, ANALYSES AND SECURITY 84
14 DATA VERIFICATION 85
15 ADJACENT PROPERTIES 86
16 MINERAL PROCESSING AND METALLURGICAL TESTING 8716.1 Pre-DFS Test Work 8716.2 DFS Test Work 8716.3 Process Design Criteria 8716.4 Process Plant Description 94
17 MINERAL RESOURCE AND MINERAL RESERVE ESTIMATES 9617.1 Introduction 9617.2 Data Provided 9617.3 Data Preparation 9617.4 Surface and Solid Wireframe Data Generation 9617.5 Sample Coding 9617.6 Data Compositing 9617.7 Statistical Analysis and Variography 9717.8 Block Model Construction 9717.9 Grade Estimation 9717.10 Density Assignment 9717.11 Resource Classification 9717.12 Model Validation 9717.13 Mineral Resource Reporting 9717.14 Mineral Reserves 97
18 OTHER RELEVANT DATA AND INFORMATION 9818.1 Mining Studies 9818.2 Geotechnical Studies 11318.3 Hydrological Studies 12018.4 Process Plant Design 12018.5 Infrastructure 13318.6 Water Management 13718.7 Waste Management 13718.8 Port and Transport 14318.9 Project Implementation Plan 14318.10 Project Occupational Health. Safety, Environment and Security 14718.11 Project Operational Plan 14718.12 Environmental Considerations 14718.13 Capital Cost 16318.14 Operating Costs 16918.15 Marketing, Treatment Charges and Product Pricing 17518.16 Project Financial Analysis 17618.17 Risk Assessment 190
19 INTERPRETATION AND CONCLUSIONS 19120 RECOMMENDATIONS FOR FURTHER WORK 19420.1 Resources 19420.2 Mining 19420.3 Geotechnical and Hydrogeological Studies 19420.4 Metallurgical Test Work 19520.5 Process Plant and Infrastructure 19620.6 ESIA and Permitting 197
\\Bnefp01\Users$\Greg.Lane\My Documents\Current Projects\Current Studies\Constancia\Ni 43-101 Report Feb 2011\Ni 43-101 Report Rev 0 21 Feb.Doc Rev: 0 Date: 21 February 2011 9999FM0038 – 2
5
20.7 Project Implementation 197
21 REFERENCES 19822 DATE AND SIGNATURE PAGE 199
23 ADDITONAL REQUIREMENTS FOR TECHNICAL REPORTS ON PRODUCTION AND DEVELOPMENT PROPERTIES 204
24 ILLUSTRATIONS 205
25 ANNEXURES 206
\\Bnefp01\Users$\Greg.Lane\My Documents\Current Projects\Current Studies\Constancia\Ni 43-101 Report Feb 2011\Ni 43-101 Report Rev 0 21 Feb.Doc Rev: 0 Date: 21 February 2011 9999FM0038 – 2
6
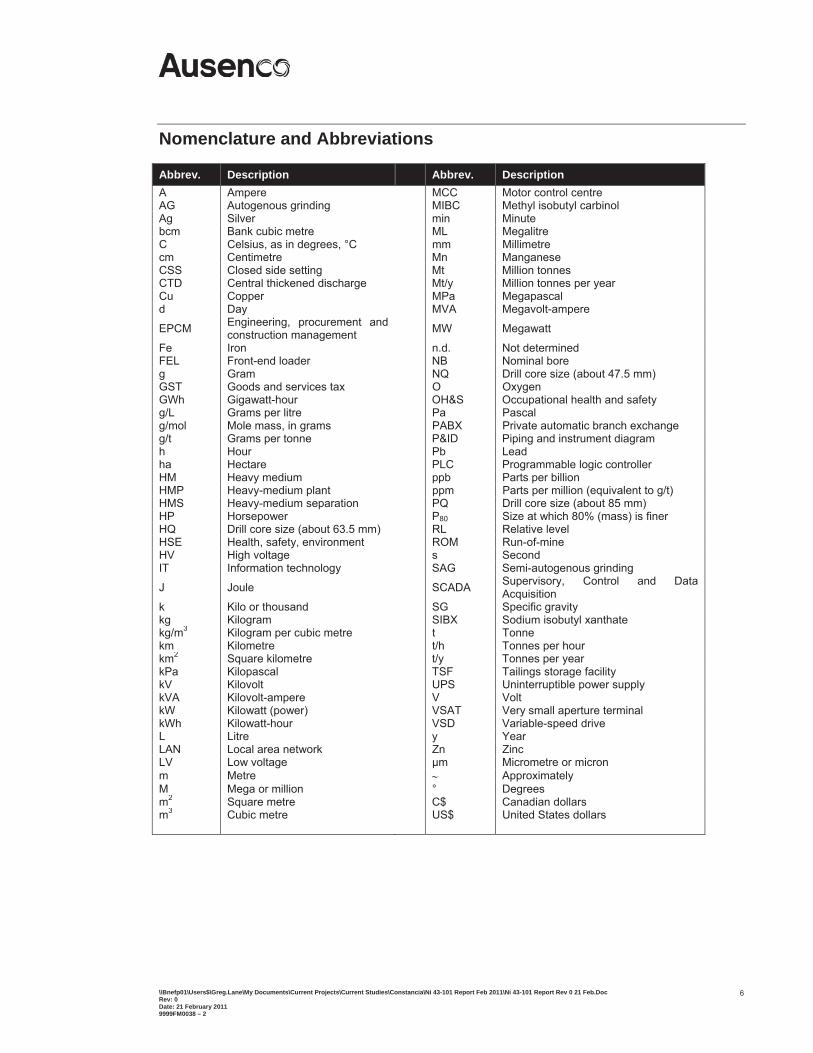
Nomenclature and Abbreviations
Abbrev. Description Abbrev. Description A Ampere MCC Motor control centre AG Autogenous grinding MIBC Methyl isobutyl carbinol Ag Silver min Minute bcm Bank cubic metre ML Megalitre C Celsius, as in degrees, °C mm Millimetre cm Centimetre Mn Manganese CSS Closed side setting Mt Million tonnes CTD Central thickened discharge Mt/y Million tonnes per year Cu Copper MPa Megapascal d Day MVA Megavolt-ampere
EPCM Engineering, procurement and construction management MW Megawatt
Fe Iron n.d. Not determined FEL Front-end loader NB Nominal bore g Gram NQ Drill core size (about 47.5 mm) GST Goods and services tax O Oxygen GWh Gigawatt-hour OH&S Occupational health and safety g/L Grams per litre Pa Pascal g/mol Mole mass, in grams PABX Private automatic branch exchange g/t Grams per tonne P&ID Piping and instrument diagram h Hour Pb Lead ha Hectare PLC Programmable logic controller HM Heavy medium ppb Parts per billion HMP Heavy-medium plant ppm Parts per million (equivalent to g/t) HMS Heavy-medium separation PQ Drill core size (about 85 mm) HP Horsepower P80 Size at which 80% (mass) is finer HQ Drill core size (about 63.5 mm) RL Relative level HSE Health, safety, environment ROM Run-of-mine HV High voltage s Second IT Information technology SAG Semi-autogenous grinding
J Joule SCADA Supervisory, Control and Data Acquisition
k Kilo or thousand SG Specific gravity kg Kilogram SIBX Sodium isobutyl xanthate kg/m3 Kilogram per cubic metre t Tonne km Kilometre t/h Tonnes per hour km2 Square kilometre t/y Tonnes per year kPa Kilopascal TSF Tailings storage facility kV Kilovolt UPS Uninterruptible power supply kVA Kilovolt-ampere V Volt kW Kilowatt (power) VSAT Very small aperture terminal kWh Kilowatt-hour VSD Variable-speed drive L Litre y Year LAN Local area network Zn Zinc LV Low voltage μm Micrometre or micron m Metre Approximately M Mega or million ° Degrees m2 Square metre C$ Canadian dollars m3 Cubic metre US$ United States dollars
\\Bnefp01\Users$\Greg.Lane\My Documents\Current Projects\Current Studies\Constancia\Ni 43-101 Report Feb 2011\Ni 43-101 Report Rev 0 21 Feb.Doc Rev: 0 Date: 21 February 2011 9999FM0038 – 2
7
Important Notice This Constancia Project Technical Report (Technical Report or Report) was prepared for Norsemont Mining Inc. (Norsemont) by Ausenco Solutions Canada Inc (Ausenco) as an update and revision of the Technical Report issued 28 September 2009 authored by GRD Minproc Limited (2009 Technical Report).
The format of this report was based on the 2009 Technical Report to facilitate ease of reading and cross-referencing. Some elements of the 2009 Technical Report were not altered and, as such, some sections of this report are directly referenced to the 2009 Technical Report. Some elements of the report have been revised in full as part of the feasibility study optimisation (FSO) work completed in 2010 by Ausenco and SRK Consulting (Canada) Inc. (SRK). All other elements of this report have been extracted from the 2009 Technical Report and the context updated to reflect the current status of the project. All sections of the report are categorised per this classification for clarity.
The results and opinions expressed in this report are based on the observations and the technical data listed in the report. Whilst Ausenco has reviewed all of the information provided by others, and believes the information to be reliable, Ausenco has not conducted an in-depth independent investigation to verify its accuracy and completeness.
The author has not reviewed any of the following data relevant to the following aspects of the Technical Report that have not changed since the 2009 Technical Report:
mineral resource, geology and other data reported therein;
aspects of the project directly referenced by Section to the 2009 Technical Report;
legal issues regarding the land tenure, company corporate structure, independently verified the legal status or ownership of the Property and has relied upon corporate legal opinion and land tenure opinion supplied by Norsemont;
issues regarding surface rights, road access, permits and the environmental status of the Property and has relied upon opinions supplied by Norsemont;
taxation issues in country and has relied upon Norsemont’s consultant, Picon and Associates for their opinion.
The results and opinions expressed in this report are conditional upon the aforementioned information being current, accurate, and complete as of the date of this report, and the understanding that no information has been withheld that would affect the conclusions made herein. Ausenco reserves the right, but will not be obliged, to revise this report and conclusions if additional information becomes known to Ausenco subsequent to the date of this report. Ausenco does not assume responsibility for Norsemont’s actions in distributing this report.
Norsemont is permitted to file this report as a Technical Report with Canadian Securities Regulatory Authorities pursuant to provincial securities legislation. Except for the purposes legislated under provincial securities laws, any other use of this Report by any third party is at that party’s sole risk.
The Technical Report is to be read as a whole, and sections or parts of it should not be read or relied upon out of context. This notice, which is an integral part of the Report, must accompany every copy of the Report.
\\Bnefp01\Users$\Greg.Lane\My Documents\Current Projects\Current Studies\Constancia\Ni 43-101 Report Feb 2011\Ni 43-101 Report Rev 0 21 Feb.Doc Rev: 0 Date: 21 February 2011 9999FM0038 – 2
8
Title Page
Greg Lane, M. AusIMM (#203005) employed by Ausenco as General Manager Technical Solutions was responsible for the preparation of this report and the revisions to the comminution circuit and associated capital and operating costs completed as part of the Feasibility Study Optimisation study.
Robert Cummings, M.Sc. Geol. Eng., Registered Professional Engineer in Arizona, Geotechnical Consultant and Principal of Saguaro Geoservices, Inc., was responsible for development of pit slope stability analyses and design parameters in Section 18.1.3 and Section 18.2.2.
Thomas F. Kerr, M.Sc., President of Knight Piésold and Co., USA, Registered Professional Engineer (Civil and Geotechnical), P.Eng. in British Columbia (#14906) and Ontario (#90407230) and a P.E. in Colorado (#445050), California (#C49260) and Alaska (#10969), was responsible for information relating to the site geotechnical investigations, and design and costing of the Tailings Storage Facility and water management systems as described in Section 18.2 (excluding Section 18.2.2), Section 18.6, Section 18.7 and Section 18.13.5.
Dino Pilotto, B.A.Sc. (Mining), P.Eng. Saskatchewan, Canada (#14782) and Alberta, Canada (#88762) and Principal Consultant – Mining, SRK Consulting (Canada) Inc., was responsible for open pit mine engineering aspects of the Project as contained in Section 17.14, Section 18.1, Section 18.13.2, and Section 18.14.2.
\\Bnefp01\Users$\Greg.Lane\My Documents\Current Projects\Current Studies\Constancia\Ni 43-101 Report Feb 2011\Ni 43-101 Report Rev 0 21 Feb.Doc Rev: 0 Date: 21 February 2011 9999FM0038 – 2
9
1 SUMMARY
1.1 Introduction
This section has been extracted from the 2009 Technical Report and updated.
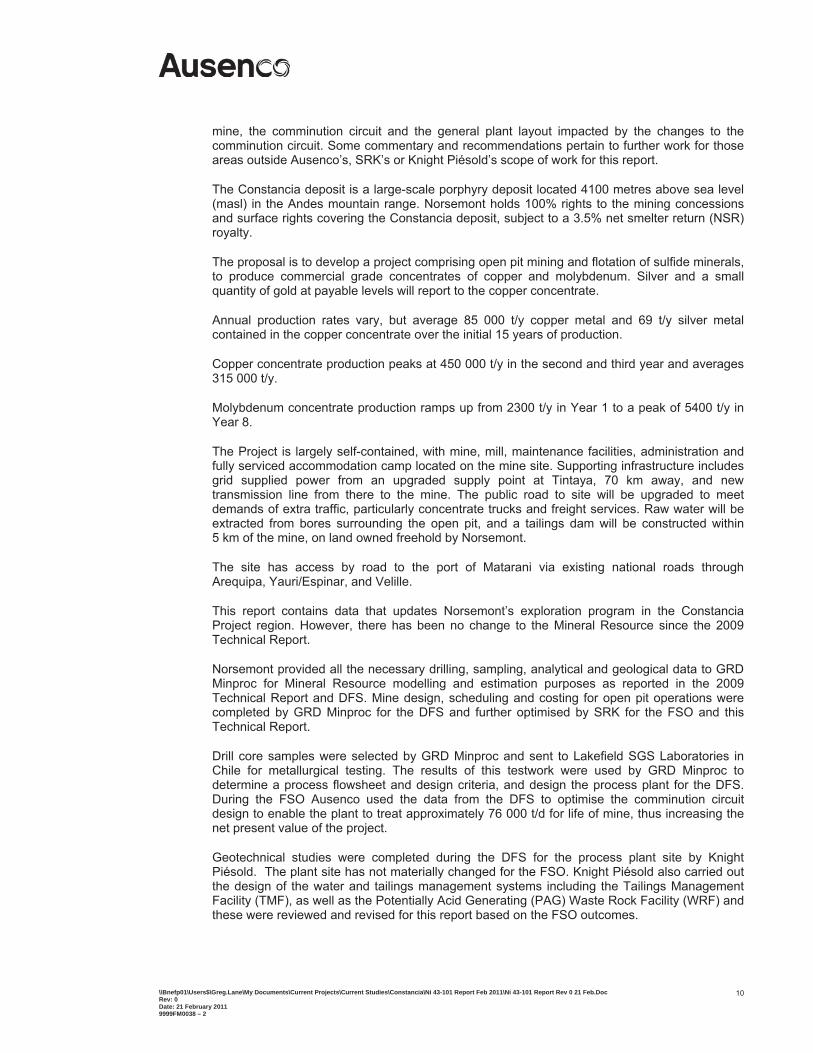
Norsemont Mining Inc (Norsemont) is developing the Constancia Copper, Molybdenum, Silver Project in Southern Peru, approximately 100 km south of the city of Cusco (Figure 1-1).
Figure 1-1 Constancia project location
GRD Minproc Limited (GRD Minproc) completed a January 2010 Definitive Feasibility Study (DFS) and the 2009 Technical Report which included a resource update, metallurgical testwork, mine design, plant and infrastructure design, development of capital and operating costs and financial analysis.
This 2011 Technical Report presents the outcomes of Feasibility Study Optimisation (FSO) work conducted for Norsemont on the Constancia Project by Ausenco Solutions Canada Inc. (Ausenco) and SRK Consulting (Canada) Inc. (SRK) in 2010-2011. The scope of work for the FSO was limited to the mine design, mine planning, comminution circuit design and associated capital and operating costs for these areas of the project.
This 2011 Technical Report contains data from both the FSO work, GRD Minproc’s January 2010 Definitive Feasibility Study (DFS), the 2009 Technical Report and other work completed by Norsemont in 2010 and 2011, including work by Knight Piésold and Co. (Knight Piésold). Ausenco has neither reviewed in full nor revised the scope outside that associated with the
\\Bnefp01\Users$\Greg.Lane\My Documents\Current Projects\Current Studies\Constancia\Ni 43-101 Report Feb 2011\Ni 43-101 Report Rev 0 21 Feb.Doc Rev: 0 Date: 21 February 2011 9999FM0038 – 2
10
mine, the comminution circuit and the general plant layout impacted by the changes to the comminution circuit. Some commentary and recommendations pertain to further work for those areas outside Ausenco’s, SRK’s or Knight Piésold’s scope of work for this report.
The Constancia deposit is a large-scale porphyry deposit located 4100 metres above sea level (masl) in the Andes mountain range. Norsemont holds 100% rights to the mining concessions and surface rights covering the Constancia deposit, subject to a 3.5% net smelter return (NSR) royalty.
The proposal is to develop a project comprising open pit mining and flotation of sulfide minerals, to produce commercial grade concentrates of copper and molybdenum. Silver and a small quantity of gold at payable levels will report to the copper concentrate.
Annual production rates vary, but average 85 000 t/y copper metal and 69 t/y silver metal contained in the copper concentrate over the initial 15 years of production.
Copper concentrate production peaks at 450 000 t/y in the second and third year and averages 315 000 t/y.
Molybdenum concentrate production ramps up from 2300 t/y in Year 1 to a peak of 5400 t/y in Year 8.
The Project is largely self-contained, with mine, mill, maintenance facilities, administration and fully serviced accommodation camp located on the mine site. Supporting infrastructure includes grid supplied power from an upgraded supply point at Tintaya, 70 km away, and new transmission line from there to the mine. The public road to site will be upgraded to meet demands of extra traffic, particularly concentrate trucks and freight services. Raw water will be extracted from bores surrounding the open pit, and a tailings dam will be constructed within 5 km of the mine, on land owned freehold by Norsemont.
The site has access by road to the port of Matarani via existing national roads through Arequipa, Yauri/Espinar, and Velille.
This report contains data that updates Norsemont’s exploration program in the Constancia Project region. However, there has been no change to the Mineral Resource since the 2009 Technical Report.
Norsemont provided all the necessary drilling, sampling, analytical and geological data to GRD Minproc for Mineral Resource modelling and estimation purposes as reported in the 2009 Technical Report and DFS. Mine design, scheduling and costing for open pit operations were completed by GRD Minproc for the DFS and further optimised by SRK for the FSO and this Technical Report.
Drill core samples were selected by GRD Minproc and sent to Lakefield SGS Laboratories in Chile for metallurgical testing. The results of this testwork were used by GRD Minproc to determine a process flowsheet and design criteria, and design the process plant for the DFS. During the FSO Ausenco used the data from the DFS to optimise the comminution circuit design to enable the plant to treat approximately 76 000 t/d for life of mine, thus increasing the net present value of the project.
Geotechnical studies were completed during the DFS for the process plant site by Knight Piésold. The plant site has not materially changed for the FSO. Knight Piésold also carried out the design of the water and tailings management systems including the Tailings Management Facility (TMF), as well as the Potentially Acid Generating (PAG) Waste Rock Facility (WRF) and these were reviewed and revised for this report based on the FSO outcomes.
\\Bnefp01\Users$\Greg.Lane\My Documents\Current Projects\Current Studies\Constancia\Ni 43-101 Report Feb 2011\Ni 43-101 Report Rev 0 21 Feb.Doc Rev: 0 Date: 21 February 2011 9999FM0038 – 2
11
Knight Piésold also provided geotechnical recommendations related to the pit walls while Saguaro Geoservices, Inc. provided technical review and input on the pit walls for the DFS. Knight Piésold reviewed the FSO pit wall geometry (as supplied by SRK) and made recommendations to Norsemont.
MWH Peru S.A. through its subsidiary Ground Water International S.A. undertook hydrogeological studies for the DFS and 2009 Technical Report.
Peruvian consultants CESEL S.A. (CESEL) and SIGT S.A. (SIGT) undertook design and costing for power supply and upgrading the access road to site for the DFS, respectively. Ausenco completed a revision of the electrical load based on the changes made during the FSO and reviewed the impact of the revised load on the power supply.
The accommodation camp for construction and operations personnel was based on estimates provided by experienced Peruvian suppliers for the DFS.
Capital cost estimate data for the plant was obtained from reputable equipment suppliers and Peruvian contractors, relying on technical specifications and material quantity take-offs provided by GRD Minproc for the DFS and updated based on changes made by Ausenco, SRK and Knight Piésold during the FSO and for the preparation of this report.
Operating cost information and selected input parameters for the economic evaluation were obtained from market pricing and from Norsemont. Data from the DFS was used by Ausenco, SRK and Knight Piésold to revise the operating costs for the FSO.
Ausenco undertook cashflow modelling based on data contained within the DFS and FSO, and data supplied by Norsemont pertaining to taxation and specific project related matters.
All dollars referenced in this report are United States dollars unless nominated otherwise.
1.2 Geology and Mineral Resources
1.2.1 Geological setting, mineralisation and alteration
This section is per Section 1.2.1 of the 2009 Technical Report.
1.2.2 Exploration
This section has been updated by Norsemont to reflect the status of exploration as of 8 January 2011. The exploration and drilling data provided by Norsemont is included in this report to capture the current status of the overall Constancia Project. Norsemont has previously disclosed this information in separate releases.
A total of 161,110 m (554 holes) have been drilled in the Constancia Project, including 7484 m drilled by Rio Tinto prior to 2005. The total also includes metallurgical, geotechnical and condemnation drilling programmes. Drilling comprises both diamond drilling and reverse circulation percussion drilling; diamond drilling constitutes 87% of the total.
Exploration has been conducted to conventional industry standards, including surface and downhole surveying of drillholes, geological and geotechnical core logging, cutting and sampling of drill core, sample preparation and assaying. GRD Minproc reviewed the methods used in the drill programs and considered them appropriate for a mineral resource estimate as reported in the 2009 Technical Report.
A total of 1112 density measurements have been made by Norsemont for core from the Constancia San José area. The density measurements were conducted by ALS Chemex S.A.,
\\Bnefp01\Users$\Greg.Lane\My Documents\Current Projects\Current Studies\Constancia\Ni 43-101 Report Feb 2011\Ni 43-101 Report Rev 0 21 Feb.Doc Rev: 0 Date: 21 February 2011 9999FM0038 – 2
12
and are representative of the different rock and mineralisation domains. Additionally, 56 samples from the Pampacancha prospect were sent to SGS del Peru S.A.C. for density measurements during year 2010.
QAQC control for the assay data is based on inclusion of blank, standard and duplicate (1/4 core, coarse duplicate and pulp duplicate) samples with routine samples. A referee laboratory has been used to provide supporting analyses. Samples are securely stored before being loaded onto covered and secured trucks for transport to the laboratory in Lima. Chain of custody documents is maintained, with signatures of delivering and receiving parties and the names of persons accompanying the samples at all times.
GRD Minproc reported their opinion in the 2009 Technical Report that the Norsemont QAQC sampling protocol was rigorously set up and was continuously monitored to identify potential sampling and assaying problems.
1.2.3 Mineral resource estimation
This section is per Section 1.2.3 of the 2009 Technical Report.
1.2.4 Mineral resources
This section is per Section 1.2.4 of the 2009 Technical Report.
1.3 Mining
1.3.1 Introduction
The Constancia copper porphyry massive deposit is located in high altitude between 4000 and 4500 m above sea level and is amenable to open pit bulk mining techniques using electric shovels mining on 15 m benches.
The revised mine design and pit optimisation was developed by SRK based upon the known mineral resource estimate along with geotechnical, hydrogeological and economic parameters supplied by Norsemont and target mining rates provided by Ausenco.
The mining schedule was developed by SRK around rates for all mining costs from the 2009 Technical Report.
The pit optimization and mine schedule work included: data review, preparation and NSR model update; resource checks; and open pit mine design.
Mine fleet and mineability review was then conducted to ensure the fleet was suitable for the revised production schedule, with required changes made to both the opex and capex estimate.
A life-of-mine (LOM) production schedule was then developed showing annual estimates of: pre-stripping; ore tonnes and grade by ore type; and waste tonnes by type. The mining schedule was developed using rates for all mining costs from the 2009 Technical report provided by Norsemont.
1.3.2 Pit optimisation and pit design
The 3D resource block model from the 2009 Technical Report, as received from Norsemont, formed the basis of all the pit optimization and mine planning work. This sub-cell resource model had been regularized into a 25 x 25 x 15 m mining model to simulate dilution and mining losses. The only modifications made to the NSR block values were based on revised metal prices of $2.25/lb Cu; $14.50/lb Mo ; $14.00/oz Ag and; $1000/oz Au.
\\Bnefp01\Users$\Greg.Lane\My Documents\Current Projects\Current Studies\Constancia\Ni 43-101 Report Feb 2011\Ni 43-101 Report Rev 0 21 Feb.Doc Rev: 0 Date: 21 February 2011 9999FM0038 – 2
13
Whittle pit optimization input parameters were as per the 2009 Technical Report except for modifications made to the processing costs and throughput rates (detailed elsewhere in this report). Ultimate and stage pit designs were developed by SRK based on the pit optimisation analysis conducted. Five pit stages were identified within the ultimate limits of the Constancia open pit.
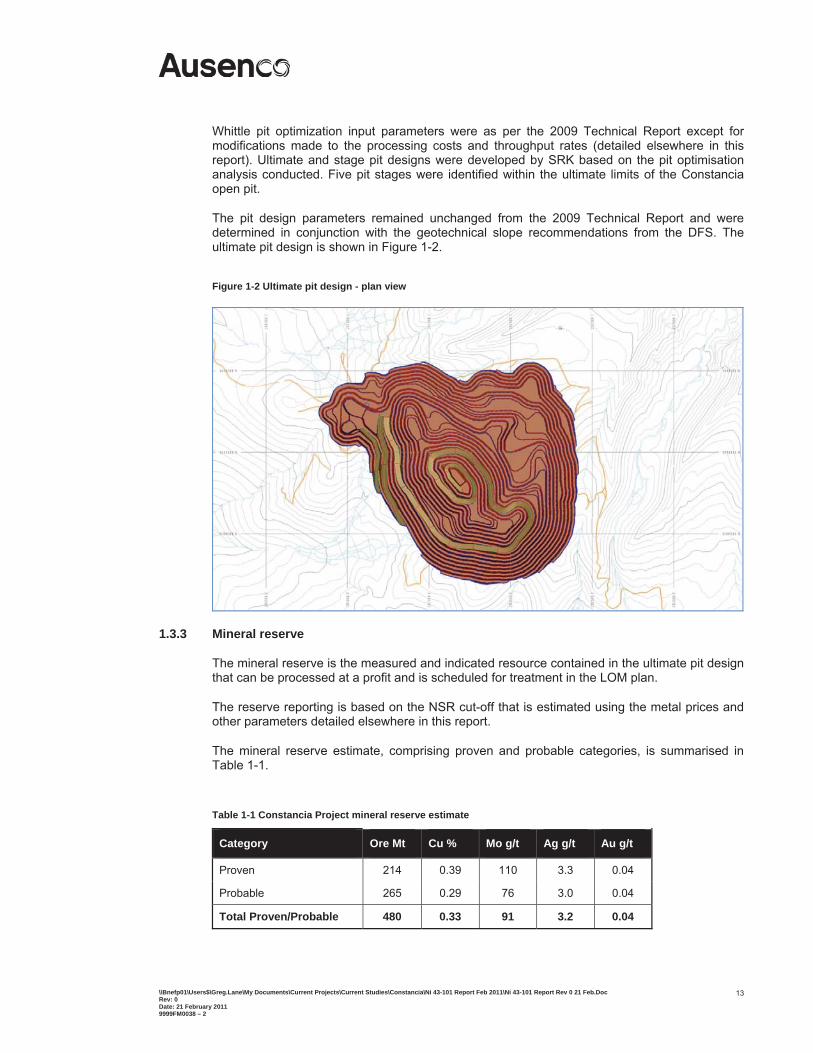
The pit design parameters remained unchanged from the 2009 Technical Report and were determined in conjunction with the geotechnical slope recommendations from the DFS. The ultimate pit design is shown in Figure 1-2.
Figure 1-2 Ultimate pit design - plan view
1.3.3 Mineral reserve
The mineral reserve is the measured and indicated resource contained in the ultimate pit design that can be processed at a profit and is scheduled for treatment in the LOM plan.
The reserve reporting is based on the NSR cut-off that is estimated using the metal prices and other parameters detailed elsewhere in this report.
The mineral reserve estimate, comprising proven and probable categories, is summarised in Table 1-1.
Table 1-1 Constancia Project mineral reserve estimate
Category Ore Mt Cu % Mo g/t Ag g/t Au g/t
Proven 214 0.39 110 3.3 0.04
Probable 265 0.29 76 3.0 0.04
Total Proven/Probable 480 0.33 91 3.2 0.04
\\Bnefp01\Users$\Greg.Lane\My Documents\Current Projects\Current Studies\Constancia\Ni 43-101 Report Feb 2011\Ni 43-101 Report Rev 0 21 Feb.Doc Rev: 0 Date: 21 February 2011 9999FM0038 – 2
14
1.3.4 Mine and process schedules
As per the 2009 Technical Report, mine and process scheduling was carried out on a monthly basis for the pre-strip (Year-1) and first year of production, quarterly for years 2 through 5 and annually thereafter.
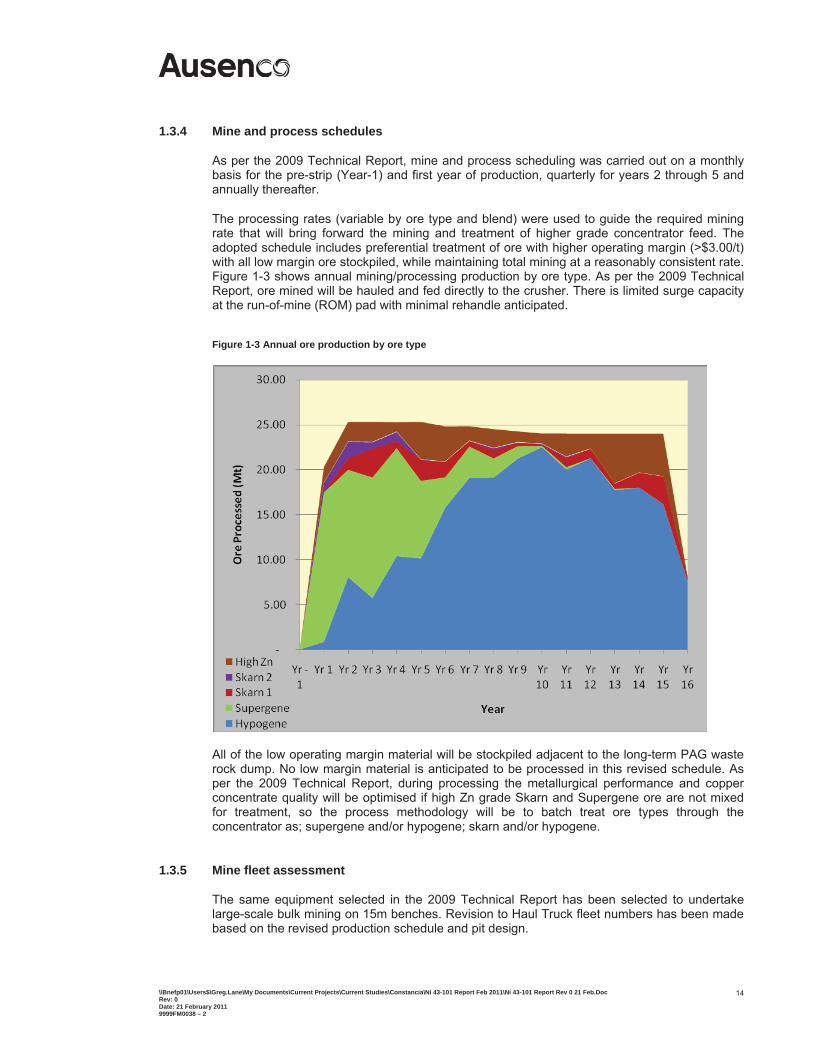
The processing rates (variable by ore type and blend) were used to guide the required mining rate that will bring forward the mining and treatment of higher grade concentrator feed. The adopted schedule includes preferential treatment of ore with higher operating margin (>$3.00/t) with all low margin ore stockpiled, while maintaining total mining at a reasonably consistent rate. Figure 1-3 shows annual mining/processing production by ore type. As per the 2009 Technical Report, ore mined will be hauled and fed directly to the crusher. There is limited surge capacity at the run-of-mine (ROM) pad with minimal rehandle anticipated.
Figure 1-3 Annual ore production by ore type
All of the low operating margin material will be stockpiled adjacent to the long-term PAG waste rock dump. No low margin material is anticipated to be processed in this revised schedule. As per the 2009 Technical Report, during processing the metallurgical performance and copper concentrate quality will be optimised if high Zn grade Skarn and Supergene ore are not mixed for treatment, so the process methodology will be to batch treat ore types through the concentrator as; supergene and/or hypogene; skarn and/or hypogene.
1.3.5 Mine fleet assessment
The same equipment selected in the 2009 Technical Report has been selected to undertake large-scale bulk mining on 15m benches. Revision to Haul Truck fleet numbers has been made based on the revised production schedule and pit design.
\\Bnefp01\Users$\Greg.Lane\My Documents\Current Projects\Current Studies\Constancia\Ni 43-101 Report Feb 2011\Ni 43-101 Report Rev 0 21 Feb.Doc Rev: 0 Date: 21 February 2011 9999FM0038 – 2
15
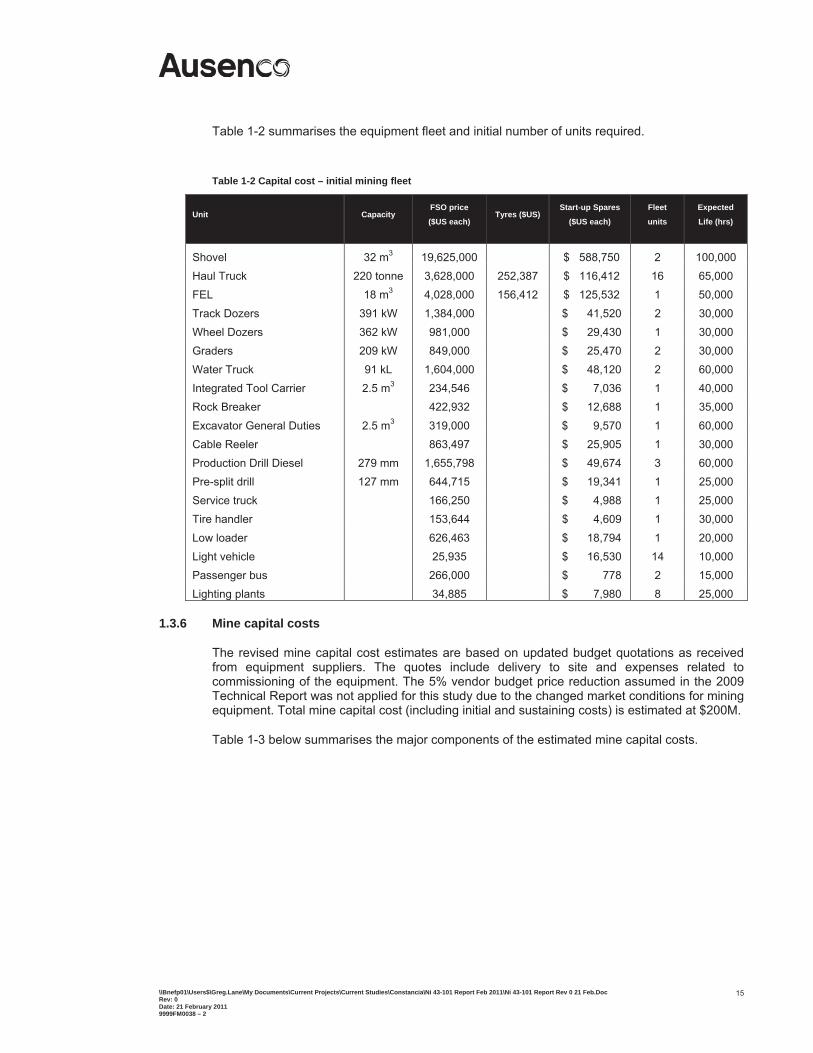
Table 1-2 summarises the equipment fleet and initial number of units required.
Table 1-2 Capital cost – initial mining fleet
Unit Capacity FSO price
($US each) Tyres ($US)
Start-up Spares
($US each)
Fleet
units
Expected
Life (hrs)
Shovel 32 m3 19,625,000 $ 588,750 2 100,000 Haul Truck 220 tonne 3,628,000 252,387 $ 116,412 16 65,000 FEL 18 m3 4,028,000 156,412 $ 125,532 1 50,000
Track Dozers 391 kW 1,384,000 $ 41,520 2 30,000 Wheel Dozers 362 kW 981,000 $ 29,430 1 30,000 Graders 209 kW 849,000 $ 25,470 2 30,000 Water Truck 91 kL 1,604,000 $ 48,120 2 60,000 Integrated Tool Carrier 2.5 m3 234,546 $ 7,036 1 40,000 Rock Breaker 422,932 $ 12,688 1 35,000
Excavator General Duties 2.5 m3 319,000 $ 9,570 1 60,000 Cable Reeler 863,497 $ 25,905 1 30,000 Production Drill Diesel 279 mm 1,655,798 $ 49,674 3 60,000 Pre-split drill 127 mm 644,715 $ 19,341 1 25,000 Service truck 166,250 $ 4,988 1 25,000 Tire handler 153,644 $ 4,609 1 30,000
Low loader 626,463 $ 18,794 1 20,000 Light vehicle 25,935 $ 16,530 14 10,000 Passenger bus 266,000 $ 778 2 15,000 Lighting plants 34,885 $ 7,980 8 25,000
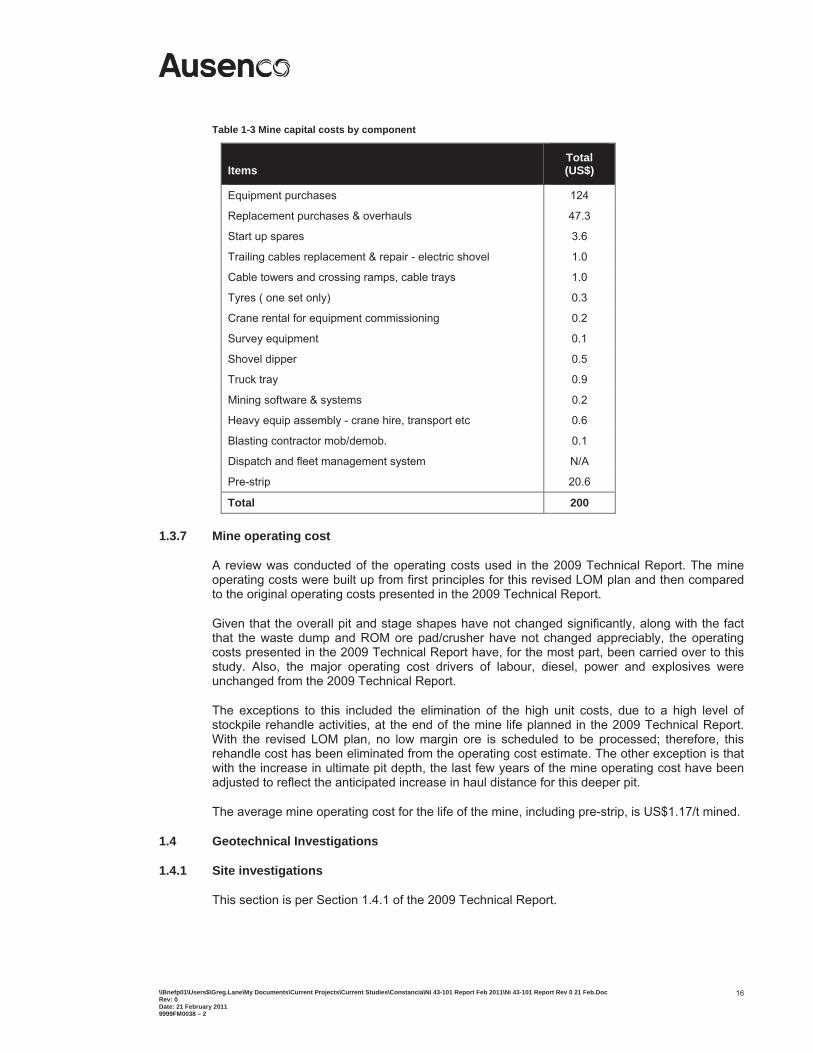
1.3.6 Mine capital costs
The revised mine capital cost estimates are based on updated budget quotations as received from equipment suppliers. The quotes include delivery to site and expenses related to commissioning of the equipment. The 5% vendor budget price reduction assumed in the 2009 Technical Report was not applied for this study due to the changed market conditions for mining equipment. Total mine capital cost (including initial and sustaining costs) is estimated at $200M.
Table 1-3 below summarises the major components of the estimated mine capital costs.
\\Bnefp01\Users$\Greg.Lane\My Documents\Current Projects\Current Studies\Constancia\Ni 43-101 Report Feb 2011\Ni 43-101 Report Rev 0 21 Feb.Doc Rev: 0 Date: 21 February 2011 9999FM0038 – 2
16
Table 1-3 Mine capital costs by component
ItemsTotal (US$)
Equipment purchases 124
Replacement purchases & overhauls 47.3
Start up spares 3.6
Trailing cables replacement & repair - electric shovel 1.0
Cable towers and crossing ramps, cable trays 1.0
Tyres ( one set only) 0.3
Crane rental for equipment commissioning 0.2
Survey equipment 0.1
Shovel dipper 0.5
Truck tray 0.9
Mining software & systems 0.2
Heavy equip assembly - crane hire, transport etc 0.6
Blasting contractor mob/demob. 0.1
Dispatch and fleet management system N/A
Pre-strip 20.6
Total 200
1.3.7 Mine operating cost
A review was conducted of the operating costs used in the 2009 Technical Report. The mine operating costs were built up from first principles for this revised LOM plan and then compared to the original operating costs presented in the 2009 Technical Report.
Given that the overall pit and stage shapes have not changed significantly, along with the fact that the waste dump and ROM ore pad/crusher have not changed appreciably, the operating costs presented in the 2009 Technical Report have, for the most part, been carried over to this study. Also, the major operating cost drivers of labour, diesel, power and explosives were unchanged from the 2009 Technical Report.
The exceptions to this included the elimination of the high unit costs, due to a high level of stockpile rehandle activities, at the end of the mine life planned in the 2009 Technical Report. With the revised LOM plan, no low margin ore is scheduled to be processed; therefore, this rehandle cost has been eliminated from the operating cost estimate. The other exception is that with the increase in ultimate pit depth, the last few years of the mine operating cost have been adjusted to reflect the anticipated increase in haul distance for this deeper pit.
The average mine operating cost for the life of the mine, including pre-strip, is US$1.17/t mined.
1.4 Geotechnical Investigations
1.4.1 Site investigations
This section is per Section 1.4.1 of the 2009 Technical Report.
\\Bnefp01\Users$\Greg.Lane\My Documents\Current Projects\Current Studies\Constancia\Ni 43-101 Report Feb 2011\Ni 43-101 Report Rev 0 21 Feb.Doc Rev: 0 Date: 21 February 2011 9999FM0038 – 2
17
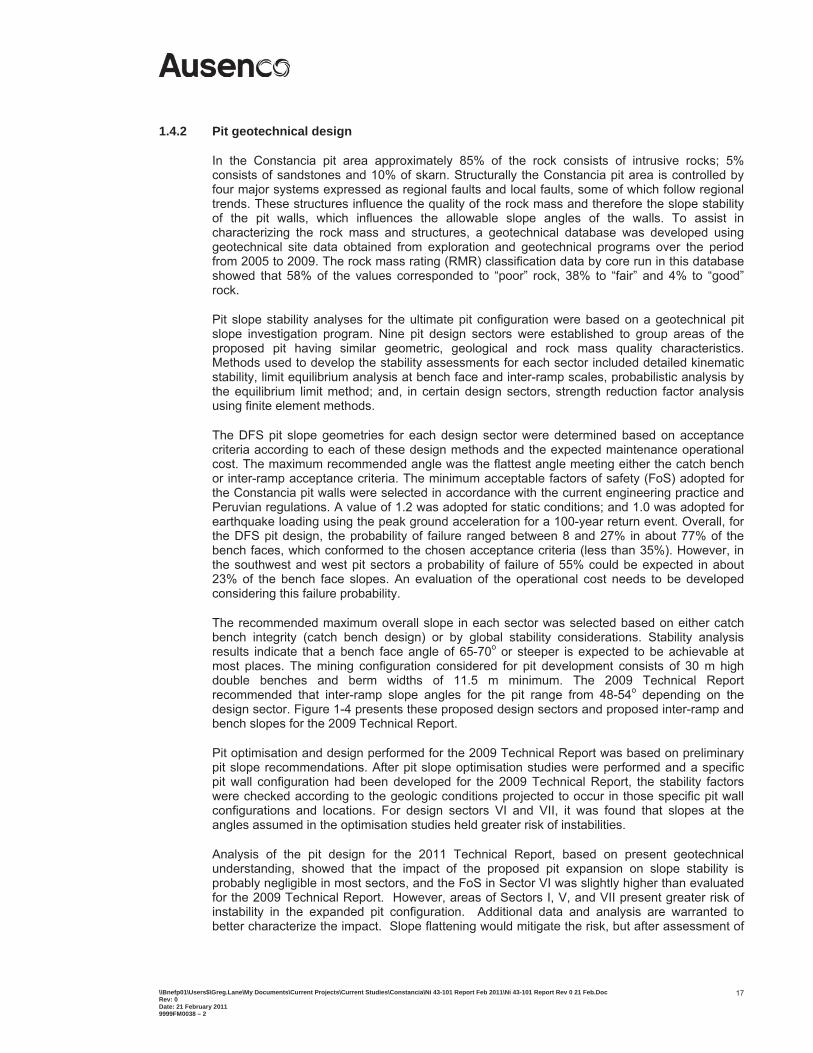
1.4.2 Pit geotechnical design
In the Constancia pit area approximately 85% of the rock consists of intrusive rocks; 5% consists of sandstones and 10% of skarn. Structurally the Constancia pit area is controlled by four major systems expressed as regional faults and local faults, some of which follow regional trends. These structures influence the quality of the rock mass and therefore the slope stability of the pit walls, which influences the allowable slope angles of the walls. To assist in characterizing the rock mass and structures, a geotechnical database was developed using geotechnical site data obtained from exploration and geotechnical programs over the period from 2005 to 2009. The rock mass rating (RMR) classification data by core run in this database showed that 58% of the values corresponded to “poor” rock, 38% to “fair” and 4% to “good” rock.
Pit slope stability analyses for the ultimate pit configuration were based on a geotechnical pit slope investigation program. Nine pit design sectors were established to group areas of the proposed pit having similar geometric, geological and rock mass quality characteristics. Methods used to develop the stability assessments for each sector included detailed kinematic stability, limit equilibrium analysis at bench face and inter-ramp scales, probabilistic analysis by the equilibrium limit method; and, in certain design sectors, strength reduction factor analysis using finite element methods.
The DFS pit slope geometries for each design sector were determined based on acceptance criteria according to each of these design methods and the expected maintenance operational cost. The maximum recommended angle was the flattest angle meeting either the catch bench or inter-ramp acceptance criteria. The minimum acceptable factors of safety (FoS) adopted for the Constancia pit walls were selected in accordance with the current engineering practice and Peruvian regulations. A value of 1.2 was adopted for static conditions; and 1.0 was adopted for earthquake loading using the peak ground acceleration for a 100-year return event. Overall, for the DFS pit design, the probability of failure ranged between 8 and 27% in about 77% of the bench faces, which conformed to the chosen acceptance criteria (less than 35%). However, in the southwest and west pit sectors a probability of failure of 55% could be expected in about 23% of the bench face slopes. An evaluation of the operational cost needs to be developed considering this failure probability.
The recommended maximum overall slope in each sector was selected based on either catch bench integrity (catch bench design) or by global stability considerations. Stability analysis results indicate that a bench face angle of 65-70o or steeper is expected to be achievable at most places. The mining configuration considered for pit development consists of 30 m high double benches and berm widths of 11.5 m minimum. The 2009 Technical Report recommended that inter-ramp slope angles for the pit range from 48-54o depending on the design sector. Figure 1-4 presents these proposed design sectors and proposed inter-ramp and bench slopes for the 2009 Technical Report.
Pit optimisation and design performed for the 2009 Technical Report was based on preliminary pit slope recommendations. After pit slope optimisation studies were performed and a specific pit wall configuration had been developed for the 2009 Technical Report, the stability factors were checked according to the geologic conditions projected to occur in those specific pit wall configurations and locations. For design sectors VI and VII, it was found that slopes at the angles assumed in the optimisation studies held greater risk of instabilities.
Analysis of the pit design for the 2011 Technical Report, based on present geotechnical understanding, showed that the impact of the proposed pit expansion on slope stability is probably negligible in most sectors, and the FoS in Sector VI was slightly higher than evaluated for the 2009 Technical Report. However, areas of Sectors I, V, and VII present greater risk of instability in the expanded pit configuration. Additional data and analysis are warranted to better characterize the impact. Slope flattening would mitigate the risk, but after assessment of
\\Bnefp01\Users$\Greg.Lane\My Documents\Current Projects\Current Studies\Constancia\Ni 43-101 Report Feb 2011\Ni 43-101 Report Rev 0 21 Feb.Doc Rev: 0 Date: 21 February 2011 9999FM0038 – 2
18
the impacts, the steeper preliminary pit slopes were used for the study. Additional slope management measures, as outlined in Section 18.1.3, were incorporated into the planned mining approach and the mining cost estimate, to address the increased slope failure risk from a cost standpoint.
Figure 1-4 Proposed design sectors, inter-ramp and bench slopes for the 2009 pit configuration
1.4.3 Subsurface conditions
This section is per Section 1.4.3 of the 2009 Technical Report.
1.4.4 Construction materials
This section is per Section 1.4.4 of the 2009 Technical Report.
1.4.5 Seismic conditions
This section is per Section 1.4.5 of the 2009 Technical Report.
1.5 Metallurgical Testwork
This section is per Section 1.5 of the 2009 Technical Report.
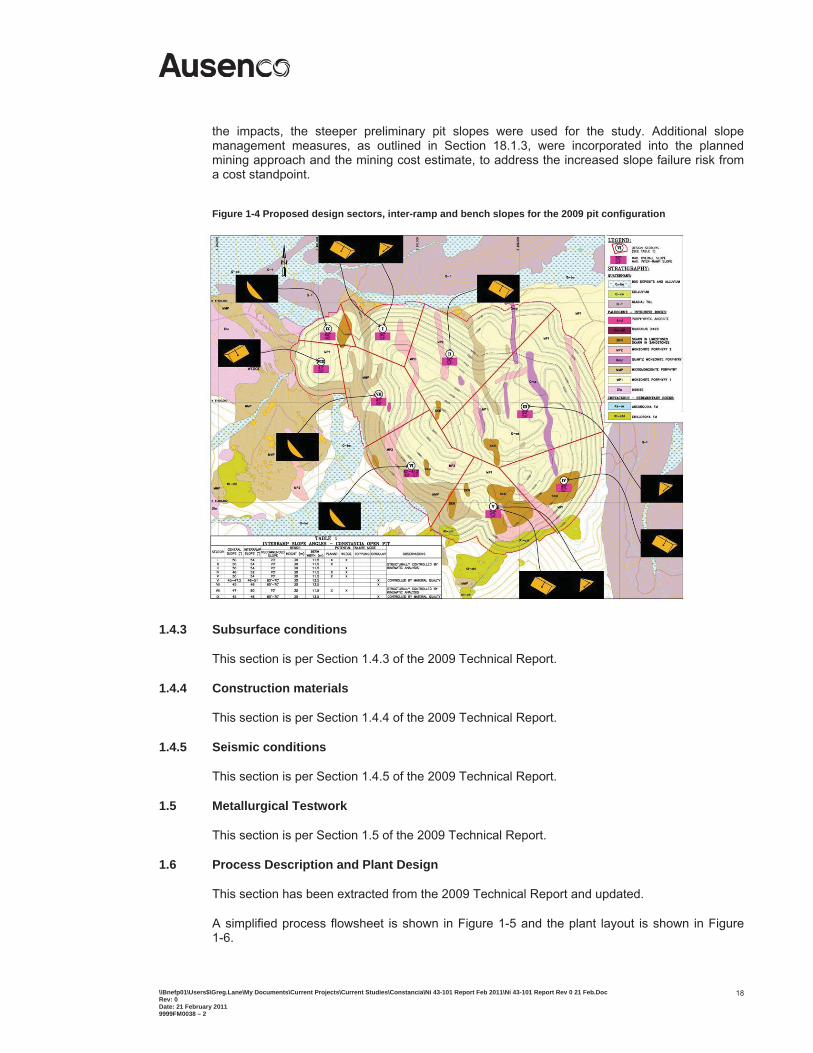
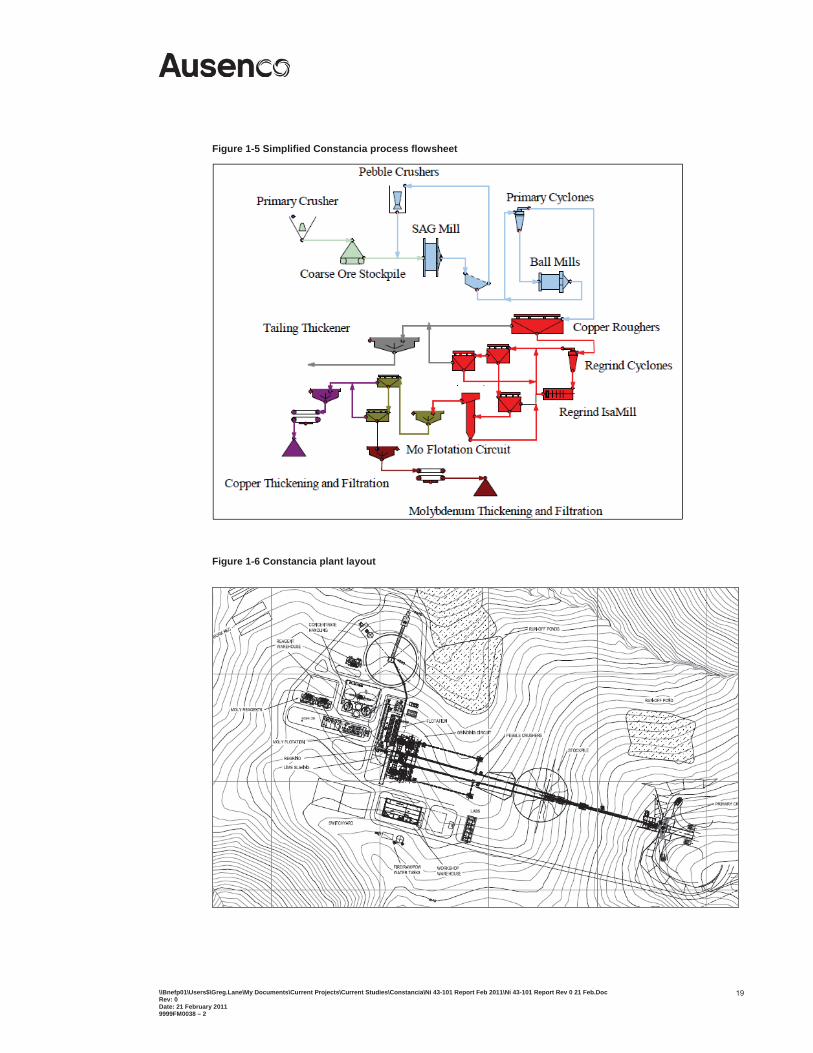
1.6 Process Description and Plant Design
This section has been extracted from the 2009 Technical Report and updated.
A simplified process flowsheet is shown in Figure 1-5 and the plant layout is shown in Figure 1-6.
\\Bnefp01\Users$\Greg.Lane\My Documents\Current Projects\Current Studies\Constancia\Ni 43-101 Report Feb 2011\Ni 43-101 Report Rev 0 21 Feb.Doc Rev: 0 Date: 21 February 2011 9999FM0038 – 2
19
Figure 1-5 Simplified Constancia process flowsheet
Figure 1-6 Constancia plant layout
\\Bnefp01\Users$\Greg.Lane\My Documents\Current Projects\Current Studies\Constancia\Ni 43-101 Report Feb 2011\Ni 43-101 Report Rev 0 21 Feb.Doc Rev: 0 Date: 21 February 2011 9999FM0038 – 2
20
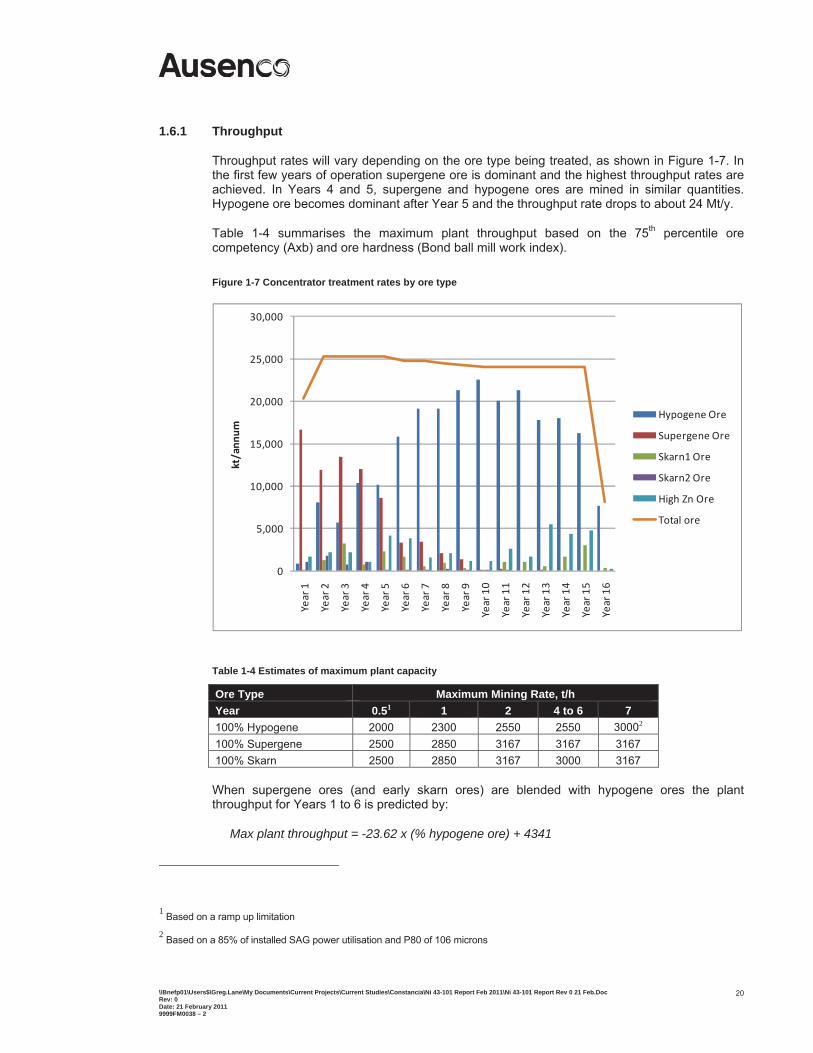
1.6.1 Throughput
Throughput rates will vary depending on the ore type being treated, as shown in Figure 1-7. In the first few years of operation supergene ore is dominant and the highest throughput rates are achieved. In Years 4 and 5, supergene and hypogene ores are mined in similar quantities. Hypogene ore becomes dominant after Year 5 and the throughput rate drops to about 24 Mt/y.
Table 1-4 summarises the maximum plant throughput based on the 75th percentile ore competency (Axb) and ore hardness (Bond ball mill work index).
Figure 1-7 Concentrator treatment rates by ore type
0
5,000
10,000
15,000
20,000
25,000
30,000Year1
Year2
Year3
Year4
Year5
Year6
Year7
Year8
Year9
Year10
Year11
Year12
Year13
Year14
Year15
Year16
kt/ann
um
Hypogene Ore
Supergene Ore
Skarn1 Ore
Skarn2 Ore
High Zn Ore
Total ore
Table 1-4 Estimates of maximum plant capacity
Ore Type Maximum Mining Rate, t/h Year 0.51 1 2 4 to 6 7100% Hypogene 2000 2300 2550 2550 30002 100% Supergene 2500 2850 3167 3167 3167 100% Skarn 2500 2850 3167 3000 3167
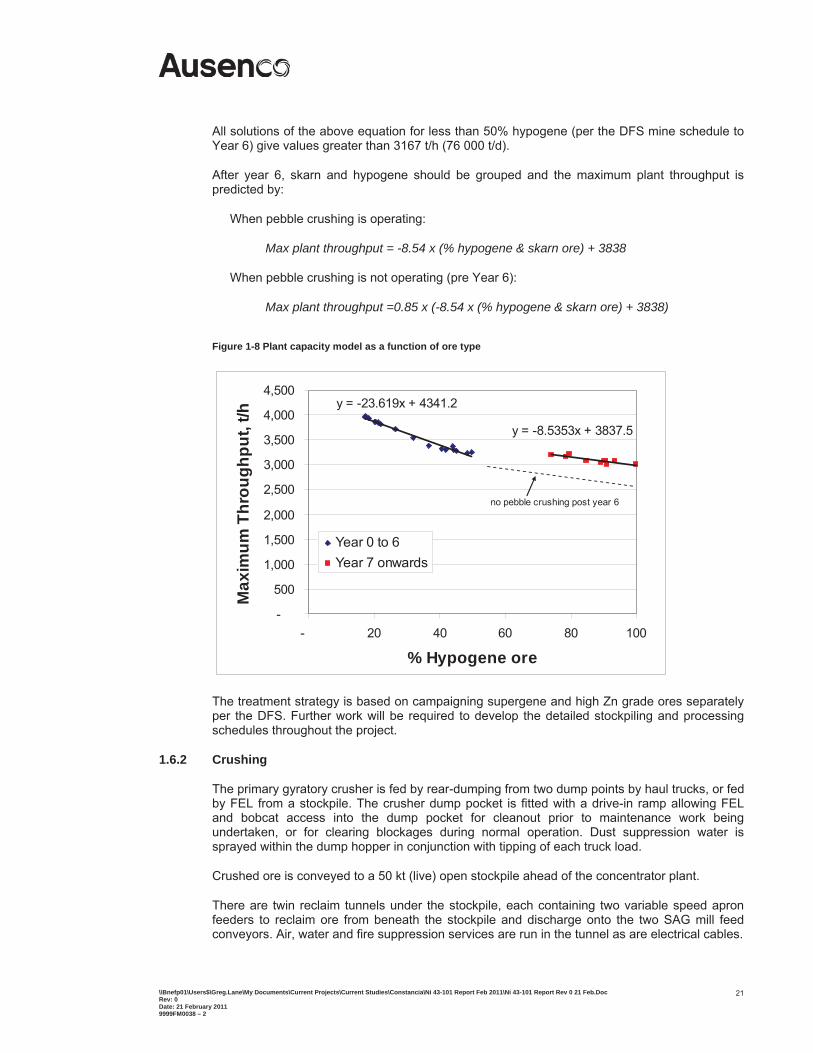
When supergene ores (and early skarn ores) are blended with hypogene ores the plant throughput for Years 1 to 6 is predicted by:
Max plant throughput = -23.62 x (% hypogene ore) + 4341
1 Based on a ramp up limitation
2 Based on a 85% of installed SAG power utilisation and P80 of 106 microns
\\Bnefp01\Users$\Greg.Lane\My Documents\Current Projects\Current Studies\Constancia\Ni 43-101 Report Feb 2011\Ni 43-101 Report Rev 0 21 Feb.Doc Rev: 0 Date: 21 February 2011 9999FM0038 – 2
21
All solutions of the above equation for less than 50% hypogene (per the DFS mine schedule to Year 6) give values greater than 3167 t/h (76 000 t/d).
After year 6, skarn and hypogene should be grouped and the maximum plant throughput is predicted by:
When pebble crushing is operating:
Max plant throughput = -8.54 x (% hypogene & skarn ore) + 3838
When pebble crushing is not operating (pre Year 6):
Max plant throughput =0.85 x (-8.54 x (% hypogene & skarn ore) + 3838)
Figure 1-8 Plant capacity model as a function of ore type
y = -8.5353x + 3837.5
y = -23.619x + 4341.2
-
500
1,000
1,500
2,000
2,500
3,000
3,500
4,000
4,500
- 20 40 60 80 100
% Hypogene ore
Max
imum
Thr
ough
put,
t/h
Year 0 to 6Year 7 onwards
no pebble crushing post year 6
The treatment strategy is based on campaigning supergene and high Zn grade ores separately per the DFS. Further work will be required to develop the detailed stockpiling and processing schedules throughout the project.
1.6.2 Crushing
The primary gyratory crusher is fed by rear-dumping from two dump points by haul trucks, or fed by FEL from a stockpile. The crusher dump pocket is fitted with a drive-in ramp allowing FEL and bobcat access into the dump pocket for cleanout prior to maintenance work being undertaken, or for clearing blockages during normal operation. Dust suppression water is sprayed within the dump hopper in conjunction with tipping of each truck load.
Crushed ore is conveyed to a 50 kt (live) open stockpile ahead of the concentrator plant.
There are twin reclaim tunnels under the stockpile, each containing two variable speed apron feeders to reclaim ore from beneath the stockpile and discharge onto the two SAG mill feed conveyors. Air, water and fire suppression services are run in the tunnel as are electrical cables.
\\Bnefp01\Users$\Greg.Lane\My Documents\Current Projects\Current Studies\Constancia\Ni 43-101 Report Feb 2011\Ni 43-101 Report Rev 0 21 Feb.Doc Rev: 0 Date: 21 February 2011 9999FM0038 – 2
22
1.6.3 Grinding
The grinding circuit consists of a dual line SABC circuit using two variable speed SAG mills in closed circuit with pebble crushing and two fixed speed ball mills. The target grind size is a P80 of 106 m.
Steel balls of nominal 125 mm diameter are added on to the SAG feed conveyors. The ball charge will typically be kept to a level of 12-18%, depending on the ore properties. The slurry in the mill exits through the discharge grates (with 75 mm pebble ports) and passes over the SAG mill trommel screen. Pebbles from the screen oversize are conveyed to the pebble crushers. SAG mill discharge slurry which passes through the screen enters the SAG mill discharge hopper together with the discharge from both ball mills which gravitate through ball mill trommels. Dilution process water is added before slurry is pumped by the cyclone feed pump to the cyclone cluster for classification.
During the early years of operation, the pebble crushers are not required and, hence, their installation is deferred to Year 6. Therefore, from Year 1 to 5, smaller aperture grates are fitted to the SAG mill and trommel oversize simply recycles to the SAG mill feed conveyor via the transfer conveyors without crushing.
1.6.4 Copper flotation
The flowsheet for copper flotation is unchanged from the 2009 Technical Report. However, the plant layout has been altered and a process description from the 2009 Technical Report is provided below for clarity.
Copper flotation feed is conditioned with slaked lime to ensure the circuit pH is maintained at its set value. A3302 collector, AF65 frother and ZnSO4 depressant are added to the conditioning tank, as required. On-stream analysis of copper and zinc in the flotation feed will be used to determine reagent requirements. The conditioned feed reports to two parallel rougher flotation banks. Rougher flotation concentrate is reground prior to cleaning. The copper cleaner circuit consists of three stages of cleaning and one bank of cleaner scavenger flotation cells. On-stream analysis monitors the zinc and copper grades of the major concentrate and tailing streams to allow performance to be optimised.
1.6.5 Molybdenum flotation
The flowsheet for molybdenum flotation is unchanged from the 2009 Technical Report. However, the layout has been altered and a process description from the 2009 Technical Report is provided below for clarity.
The bulk copper/molybdenum concentrate reports to a thickener for partial removal of reagents that are present from copper flotation. The thickener underflow is pumped to a molybdenum rougher conditioning tank where NaHS is added to inhibit the flotation of copper minerals and sphalerite, with a light fuel oil promoter added to enhance the flotation of molybdenum. The molybdenum flotation circuit utilises covered, induced air flotation cells, with internal air recirculation. It consists of one roughing stage and seven cleaning stages.
1.6.6 Copper concentrate thickening and filtration
The flowsheet for copper concentrate thickening and filtration is unchanged from the 2009 Technical Report. However, the layout has been altered and a process description from the 2009 Technical Report is provided below for clarity.
The tailing from the molybdenum flotation roughers and molybdenum cleaner scavengers reports to a copper concentrate thickener, via a static screen to remove any tramp material.
\\Bnefp01\Users$\Greg.Lane\My Documents\Current Projects\Current Studies\Constancia\Ni 43-101 Report Feb 2011\Ni 43-101 Report Rev 0 21 Feb.Doc Rev: 0 Date: 21 February 2011 9999FM0038 – 2
23
Flocculant is added to enhance settling. The clarified thickener overflow reports to a molybdenum circuit process water tank and is used as filter cloth wash, flush water, copper concentrate thickener spray water and for general use in the molybdenum flotation area. The thickener underflow is removed at 60% solids via a peristaltic pump.
The thickened slurry is stored in two agitated tanks. These provide a 24 hour surge capacity, allowing filter maintenance to be conducted without affecting mill throughput. The filter feed is pumped to pressure filtration and filter cake is dropped onto a conveyor and is conveyed to the copper concentrate stockpile.
1.6.7 Molybdenum concentrate thickening and filtration
The flowsheet for molybdenum concentrate thickening and filtration is unchanged from the 2009 Technical Report. However, the layout has been altered and a process description from the 2009 Technical Report is provided below for clarity.
The molybdenum concentrate gravitates to a thickener where it is thickened to 60% solids. The thickener overflow reports to the molybdenum process water tank from where it is used as process water in the molybdenum flotation circuit. The thickened concentrate is pumped to a ferric chloride leach tank where copper, zinc and lead present in the concentrate is dissolved to reduce their content to less than 0.5%. The slurry is then pumped to a pressure filter to produce a filter cake of 25% moisture. The filtrate from the filter reports to the tailing thickener. Filter cake is transferred by bobcat to the bagging plant where it is bagged in 1 m3 bulk bags.
1.6.8 Tailings thickening
The flowsheet for tailings thickening is unchanged from the 2009 Technical Report. However, the layout has been altered and a process description from the 2009 Technical Report is provided below for clarity.
The copper rougher tailing stream flows by gravity from the two rougher lines to a thickener, where it is combined with copper cleaner scavenger tailing and thickened to 52% solids. The thickened underflow is then pumped to the TMF. The thickener overflow gravitates to the main process water tank from where it is used in the grinding and copper roughing circuits.
1.6.9 Tailing water reclaim
The flowsheet for the tailings water reclaim area is unchanged from the 2009 Technical Report. However, the layout has been altered and a process description from the 2009 Technical Report is provided below for clarity.
Water is reclaimed from the TMF and pumped to a process water pond. From the process water pond it is pumped to the process water tank as required.
1.6.10 Concentrate storage and loadout
The copper concentrate is conveyed within the storage shed via a two way shuttle conveyor to concentrate stockpiles under the concentrate filter station. A total of seven days production capacity is provided within the shed, and, in addition, a low grade concentrate stockpile with seven days production capacity is allowed on hardstand outside the shed.
The concentrate is transferred from the stockpiles via FEL onto trucks for transport from the mine site to the terminal warehouse facility at the port facilities in Matarani.
\\Bnefp01\Users$\Greg.Lane\My Documents\Current Projects\Current Studies\Constancia\Ni 43-101 Report Feb 2011\Ni 43-101 Report Rev 0 21 Feb.Doc Rev: 0 Date: 21 February 2011 9999FM0038 – 2
24
1.6.11 Water services
The flowsheet for the water services area is unchanged from the 2009 Technical Report. However, the layout has been altered and a process description from the 2009 Technical Report is provided below for clarity.
Raw water is pumped from bores to the fire/raw water tank. The raw water tank provides water to the potable water treatment plant. The treated water is pumped to a potable water tank which discharges into the potable water reticulation system and the safety shower water network. Raw water is also piped to the molybdenum flotation area and provides cooling water to lubrication areas and the gland water system.
1.6.12 Reagents
The flowsheet for the reagents area is unchanged from the 2009 Technical Report. However, the layout has been altered and a process description from the 2009 Technical Report is provided below for clarity.
Slaked lime slurry as alkaline pH conditioner is prepared and pumped from a storage tank to the SAG mill, the copper rougher conditioning tank, the copper cleaner conditioning tank and the acidic water neutralisation area. Zinc sulfate is mixed and pumped to the copper rougher and cleaner conditioning tanks, as required, as zinc depressant. A3302 is used as primary collector for copper and molybdenum in the copper flotation circuit with addition to the primary cyclone feed sump, the copper rougher conditioning tank and the copper cleaner conditioning tank. SIBX is a secondary collector in the copper rougher circuit. AF65 frother is used to provide a stable froth in the flotation cells
Solid NaHS is mixed and the solution is pumped to the molybdenum flotation circuit as copper depressant. Light fuel oil is used to assist flotation of molybdenum minerals in the molybdenum flotation circuit. Hydrochloric acid is used in conjunction with ferric chloride in the leach section of the molybdenum thickening/filtration area.
Flocculant is mixed in a dedicated plant and pumped to the copper/molybdenum feed thickener, the copper rougher tailings thickener, the copper concentrate thickener and the molybdenum concentrate thickener.
1.6.13 On stream analysis and laboratory
Two on-stream analysis (OSA) systems have been included to allow continuous analysis of performance. The copper flotation circuit OSA system will analyse Cu, Fe, Zn and Pb in the rougher feed, rougher concentrate, rougher tailing, cleaner scavenger concentrate and bulk copper/molybdenum concentrate. The molybdenum plant OSA system will analyse Mo, Cu, Fe, Zn and Pb in the flotation feed, rougher concentrate, rougher tailing, cleaner scavenger concentrate and molybdenum concentrate before and after the ferric leach.
The laboratory facility is located within the plant site. The laboratory is capable of processing samples for mine grade control, exploration, process plant metallurgical accounting, metallurgical optimisation and environmental control. In addition, the laboratory has the facility to undertake testwork to optimise grinding, flotation, leaching, etc.
1.7 Waste Management
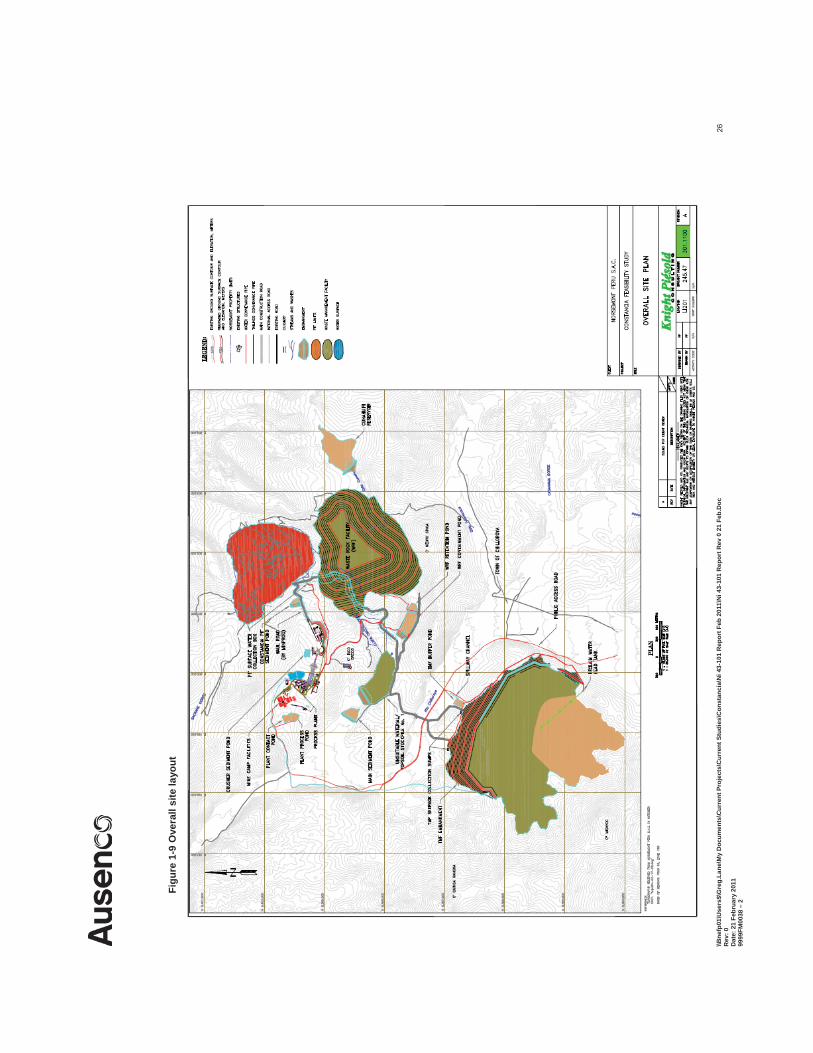
Major waste management facilities within the project area include the potential acid generating waste rock facility (PAG WRF) and the tailings management facility (TMF). Site preparation spoil unsuitable for construction material (“unsuitable material”) and topsoil generated during construction site preparation activities will be disposed in dedicated structures or in the major

\\Bnefp01\Users$\Greg.Lane\My Documents\Current Projects\Current Studies\Constancia\Ni 43-101 Report Feb 2011\Ni 43-101 Report Rev 0 21 Feb.Doc Rev: 0 Date: 21 February 2011 9999FM0038 – 2
25
waste management facility. Figure 1-9 presents the Constancia mine overall site plan and the location of these facilities. The major waste management facilities are described in the following sub-sections.
\\Bne
fp01
\Use
rs$\
Gre
g.La
ne\M
y D
ocum
ents
\Cur
rent
Pro
ject
s\C
urre
nt S
tudi
es\C
onst
anci
a\N
i 43-
101
Rep
ort F
eb 2
011\
Ni 4
3-10
1 R
epor
t Rev
0 2
1 Fe
b.D
oc
Rev
: 0
Dat
e: 2
1 Fe
brua
ry 2
011
9999
FM00
38 –
2
26
Figu
re 1
-9 O
vera
ll si
te la
yout
\\Bnefp01\Users$\Greg.Lane\My Documents\Current Projects\Current Studies\Constancia\Ni 43-101 Report Feb 2011\Ni 43-101 Report Rev 0 21 Feb.Doc Rev: 0 Date: 21 February 2011 9999FM0038 – 2
27
1.7.1 Waste rock facility (WRF)
A PAG WRF will be developed to store waste rock mined from the San José and Constancia Pits.
Approximately 392 Mt of waste have been characterised as having the potential to generate acid and will be placed in the PAG WRF. Approximately 58 Mt of waste have been characterised as non-acid generating and will be used as construction material for the TMF embankment, haul roads, construction roads and access roads. The PAG WRF will be located immediately south of the Constancia pit.
The 392 Mt capacity of the PAG WRF results from a combination of the original 300 Mt configuration developed for the DFS and an additional 92 Mt capacity developed in the recent conceptual design update. The expanded WRF will have a maximum elevation of approximately 4350 masl and a maximum vertical height of 230 m. Development of the PAG WRF is planned in six stages with the objective of reducing haul distances during the initial years of mining. Loading will start in the Cunahuiri valley, at the northern end of the facility, and will progress southwest and downslope towards the ultimate toe also within the Cunahuiri valley. During the final stage of the project the PAG WRF will be expanded westward into the adjacent Llapa Orcco valley to provide the added 92 Mt of storage.
Hydrogeologic studies and modelling show that the natural groundwater levels and gradients beneath the PAG WRF within the Cunahuiri valley will provide hydraulic containment for any seepage, and this will be directed to a collection and reporting point below the southwest toe of the facility. This hydraulic containment replaces the need for a liner in this portion of the facility. The design does, however, include for a robust underdrain system to assist in intercepting and directing the seepage from the base of the waste rock to the reporting point. The final stage of the facility in the Llapa Orcco valley may require a liner to isolate the seepage as natural hydraulic containment has not been confirmed in this area. Seepage collected within this lined portion of the WRF will either report by gravity to the WRF containment pond or be pumped to the plant area from a secondary containment pond.
The WRF containment pond will be constructed below the downstream end of the PAG WRF and retention pond. This pond will also contain surface runoff from the PAG WRF. A 28 m high earthfill embankment will provide approximately 600 000 m3 of water storage. The design consists of a cross-valley zoned embankment with a grouted curtain that spans nearly the entire length of the embankment and extends to depths of approximately 40 m into rock. Water stored in the pond will be used as process water for the mill after treatment. During infrequent, extreme wet periods, excess water reporting to the pond may be pumped onto the upper surface of the PAG WRF for recirculation through the dump for added temporary storage. Water from the PAG WRF is not intended to be released to the environment. However, a valve controlled outlet pipe has been incorporated into the design to be used only in the very unlikely event of an emergency in which water levels within the pond need to be rapidly lowered.
A retention pond between the toe of the PAG WRF and containment pond will be constructed to contain any rocks falling down over the slope of the WRF and to provide for energy dissipation of the drainage flows. A 5 m high, flow-through, rockfill embankment will be constructed at the downstream end of the retention pond, which will provide an approximate capacity of 24 000 m3.
1.7.2 Tailings management facility (TMF)
The TMF will be developed behind an embankment dam crossing two broad, gently sloped, south to north valleys above the south side of the Chilloroya River at a site 5.2 km southwest of the mine and 3.7 km south of the process plant. The TMF has been designed with an overall storage capacity of 372 Mt (dry) of tailings assuming an average in storage dry density of
\\Bnefp01\Users$\Greg.Lane\My Documents\Current Projects\Current Studies\Constancia\Ni 43-101 Report Feb 2011\Ni 43-101 Report Rev 0 21 Feb.Doc Rev: 0 Date: 21 February 2011 9999FM0038 – 2
28
1.5 t/m3. The TMF configuration is based on the DFS design that had a capacity of 277 Mt but with a vertical expansion providing another 95 Mt of capacity.
The embankment will have an ultimate height of approximately 150 m at its highest point and will consist of a zoned earthfill structure that will be constructed in stages out of local borrow materials and selected non-PAG mine waste. During the first two years of operations the embankment will be constructed following a downstream configuration, but from Year 3 onward a modified centreline approach will be adopted over a drained and consolidated beach.
Tailings will be deposited from designated off-take points on a distribution pipeline along the upstream crest of the embankment. The points of active deposition will be rotated frequently to form a thin layered, drained and well consolidated beach that will slope away from the embankment towards the south side of the TMF basin. Initially, prior to beach development, the surface water pond will be in contact with the embankment in the east valley but it will be progressively displaced upward and to the south as the beach becomes established such that after the first two years of operations the beach is expected to have displaced the pond well away from the embankment. The surface water pond will vary in size throughout the life of mine depending on the season, precipitation, and operational requirements. Tailings deposited in the facility will consist of rougher tailings (RT) and cleaner scavenger tailings (CST) from the process. These streams will be combined at the plant at an approximate ratio of 4 to 1 RT to CST, prior to transportation and deposition into the TMF. The DFS concluded that although the CST will contain significant sulfide minerals that make it potentially acid generating, the combined stream will have excess alkalinity from the mill such that its pH will initially be in the order of 8 to 9 when deposited. Geochemical analyses indicate that an exposure period of six months to a year would be necessary for this alkalinity to be consumed, and the tailings deposition plan calls for a fresh layer of tailings to be placed over each previously deposited layer well within this period to reduce the potential for acidic conditions developing. The TMF includes a geomembrane liner over the base of the eastern valley and most of the western valley to provide geomembrane containment in areas where the surface water pond will be in contact with the base at any time over the life of mine. A 50 m wide tailings underdrain will be placed on top of the geomembrane against the upstream toe of the embankment to assist in depressing pore pressures in the tailings against the embankment and to minimise the head on this part of the geomembrane liner. The geomembrane liner has not been extended into the upper, southern reaches of the western valley since the surface water pond will never be located there. However, to assist in intercepting and collecting any small amounts of seepage that may pass beneath the western side of the embankment in the absence of the liner, an intercept trench and drain will be constructed under the embankment across this valley.
Groundwater drains will be installed under the geomembrane to intercept groundwater seeps and keep them away from the geomembrane. A separate foundation drain system will be installed under the embankment to collect water seeping through the embankment, which may include direct precipitation on the embankment and/or small amounts of seepage passing through it, as well as localised groundwater seeps in the embankment foundation.
Water collected by the drain systems will be conveyed to sumps located immediately downstream of the embankment in each of the east and west valleys. Monitoring and control systems at the sumps will allow for automated water quality and flow rate determinations to be made. From the sumps, the water will either be released to the Chilloroya River or pumped back to the TMF based on the water quality.
1.7.3 Topsoil and unsuitable material stockpiles
This section is unchanged from the 2009 Technical Report but summarised below for clarity.
Two main stockpiles, for storage of unsuitable materials and topsoil, are planned for the project. These structures include a combined stockpile (Unsuitable Material/Topsoil Stockpile No. 1),
\\Bnefp01\Users$\Greg.Lane\My Documents\Current Projects\Current Studies\Constancia\Ni 43-101 Report Feb 2011\Ni 43-101 Report Rev 0 21 Feb.Doc Rev: 0 Date: 21 February 2011 9999FM0038 – 2
29
located downstream of the PAG WRF containment pond, which will provide storage capacity for bog, topsoil, and unsuitable materials. A second stockpile (Topsoil Stockpile No. 2) strictly for topsoil will be located directly north of the PAG WRF. This stockpile may be relocated to allow for additional capacity to the WRF. If relocated, the location of this facility will be determined during the next design stage.
The combined stockpile will be developed behind a cross-valley constructed embankment and will provide approximately 2.65 Mm3 of total storage capacity. The topsoil stockpile north of the PAG WRF will predominantly be used for storage of topsoil removed from the pits and WRF. Its capacity will be 0.4 Mm3.
1.8 Infrastructure
1.8.1 Access roads
This section is per Section 1.8.1 of the 2009 Technical Report.
1.8.2 Water supply
This section is per Section 1.8.2 of the 2009 Technical Report.
1.8.3 Power supply
1.8.3.1 Power line
This section has been extracted from the 2009 Technical Report and revised to reflect the modified process plant.
The design maximum power demand for the Project is approximately 105 MW after Year 6 and the average continuous demand is estimated to be about 90 MW in early operation, increasing to 100 MW after Year 6.
CESEL completed a power supply study, taking into account current and forecast power demand in the region.
The study identified the preferred option is to initially secure supply at 138 kV from the existing Tintaya Substation, with transmission by means of a single circuit supported by lattice steel towers over a route length of 70 km to the Constancia mine site, designed for future operation at 220 kV. It was assumed that 220 kV supply will be available from Tintaya substation in 2012.
The transmission line from Tintaya Substation to the Constancia mine site has been designed in accordance with relevant North American and European codes and standards, and in recognition of all environmental, geological, social and cultural considerations related to the land and airspace easement along the proposed route of the line.
Topographical and geological surveys and environmental and socio-economic baseline studies were completed along the proposed route and at the Tintaya and Constancia substation sites. Earth resistivity measurements were conducted to obtain the necessary data for the design of the line grounding systems.
The transmission line is designed per the DFS for ultimate operation at 220 kV and will have a design capacity of 150 MW. The route length is approximately 70 km.
The transmission line will also include an OPGW or optical fibre composite overhead ground wire serving the multiple functions of earth bonding for the towers, lightning protection shielding for the power conductors and communications via the enclosed 24 optical fibres.
\\Bnefp01\Users$\Greg.Lane\My Documents\Current Projects\Current Studies\Constancia\Ni 43-101 Report Feb 2011\Ni 43-101 Report Rev 0 21 Feb.Doc Rev: 0 Date: 21 February 2011 9999FM0038 – 2
30
The fibre optic communications will provide protection, relaying and control functions for the transmission line and data links from Constancia to the Peruvian communications network.
1.8.3.2 Constancia substation 138/220 kV
The Constancia substation switchyard has been designed with overhead busbar systems, switchgear, metering and protection equipment to control the ultimate installation of two primary transformers to provide the plant with 100% redundancy.
Allowance has been made in the design for a bay to accommodate extension of the line or an alternative connection to the Peruvian grid.
The DFS cost estimate included one 100 MVA primary transformer with all associated switchgear, metering and protection equipment. This revised concept requires a larger (120 MVA) single unit. An additional capital cost of $0.5M has been allowed for the larger unit.
Insulation levels and surge protection equipment reflect the elevation of Constancia Substation in excess of 4000 masl and the level of iso-keraunic activity in the region.
1.8.3.3 Tintaya substation 138 kV expansion
For the initial supply to Constancia at 138 kV, an additional switchyard bay at Tintaya substation has been allowed to accommodate the extension of the existing 138 kV double busbar, 45 MVAR of capacitive compensation equipment and all associated switchgear, transformer, metering and protection equipment for the transmission line.
The additional bay proposed for Tintaya substation to serve the transmission line to Constancia will be designed for a capacity in excess of 200 MVA.
1.8.3.4 Power supply transfer from 138 kV to 220 kV
The transmission line and Constancia Substation have been designed for ultimate operation at 220 kV in Year 1. The main power transformer and associated metering and protection transformers have been specified with winding tappings to enable operation at either 138 kV or 220 kV.
Norsemont advised that the Tintaya substation upgrade for 220 kV has been approved and will be funded by others and no costs were allowed in the DFS or the cost estimate in this report for the Tintaya substation upgrade.
1.8.3.5 Control and communications
Tintaya Substation is operated by Red de Energía del Perú S.A. (REP) from its regional control centre in Arequipa. The new transmission line from Tintaya to Constancia will be integrated into the REP SCADA system for purposes of monitoring, control, energy metering and load management.
A local area network will form the platform for monitoring and control of the transmission line and Constancia substation and an operator workstation in the Constancia substation will provide access to monitoring and control functions, system protection, energy measurement and alarms.
\\Bnefp01\Users$\Greg.Lane\My Documents\Current Projects\Current Studies\Constancia\Ni 43-101 Report Feb 2011\Ni 43-101 Report Rev 0 21 Feb.Doc Rev: 0 Date: 21 February 2011 9999FM0038 – 2
31
1.8.3.6 Power supply capital cost estimate
The capital cost for power supply was estimated at $24.5 M for the DFS, including the design and construction of the power line and the two substations. Ausenco has allowed an additional $0.5 for a larger 120 MVA primary transformer.
1.8.3.7 Operation and maintenance
The power transmission system to the point of supply at the 22.9 kV terminals of the main transformer at Constancia Substation, will be constructed, owned, operated and maintained by REP.
Based on information from Organismo Supervisor de la Inversión en Energía y Minería (OSINERGMIN), the Peruvian Government’s energy and mining investment supervisory organization, the DFS included an annual cost of operation and maintenance (O&M) of 2% of the capital cost. Norsemont included $0.5M/y in the general and administration (G&A) costs.
1.8.3.8 Energy consumption and cost
On the basis of an overall average continuous demand of 85 MW at 138 kV (Years 1 to 4); a peak/off-peak ratio of 8/16; tariff information provided by OSINERGMIN, and an exchange rate of $1=3.2 Soles (per the DFS), this equates to an average cost of 4.89¢/kWh.
1.8.4 Internal roads
Internal roads are as per the DFS, modified only to suit the revised layout, and will be constructed within the Constancia project site. Access between the plant, pit, PAG WRF, and TMF will be on the mine haul roads. Additional access roads will be constructed for connection between these primary production facilities and secondary support facilities.
1.8.5 Buildings
Buildings are as per the DFS and include:
Heavy and light vehicle workshop and washbay: the mine office is included in this facility
Heavy vehicle fuel distribution bowser
Mine dispatch centre
Core shed
Main security and gatehouse building
Emergency services building
Substation building
Emergency diesel power station
Control rooms for primary crusher and the grinding building
Laboratory and laboratory store
Workshop to support plant operations
Warehouse – including an external fenced compound
Administration building and change-rooms
Kitchen and mess to provide for up to 432 personnel on day shift
Copper flotation blower enclosure
\\Bnefp01\Users$\Greg.Lane\My Documents\Current Projects\Current Studies\Constancia\Ni 43-101 Report Feb 2011\Ni 43-101 Report Rev 0 21 Feb.Doc Rev: 0 Date: 21 February 2011 9999FM0038 – 2
32
Air compressor enclosure
Reagents and molybdenum concentrate packaging store
The process plant is not within a covered building except for the concentrate filter and storage facility, and the molybdenum concentrate filtration buildings.
The majority of the buildings are of steel frame construction and fully clad. Overhead, tower or davit style cranes are provided where appropriate for maintenance purposes in the plant and service buildings. Substations are custom design blockwork buildings, while several other buildings are modular pre-fabricated structure, e.g. laboratory, control rooms, fire station and first aid post, gatehouse etc.
1.8.6 Construction and accommodation camp
The construction and accommodation camp concept is unchanged from the DFS. However, the layout has been modified to optimise earthworks. The description from the DFS is included below for clarity.
Construction and operational workforces are housed in a purpose-built accommodation camp located adjacent to the process plant. The camp is supplied and installed by a single construction contractor with another contractor operating the facility for Norsemont once the construction phase is complete. The camp is to be self-sufficient, with full sleeping, bathing, dining, laundering and recreational facilities.
The camp will be constructed from modular units to minimise cost and expedite delivery. The camp comprises single, double and 4-person accommodation units, camp administration offices, internal access roads, potable water treatment, storage and distribution, medical facility, a recreation hall, waste management, sewage treatment, laundry, landscaping, IT and communications infrastructure, and site security.
The DFS capital cost estimate is $30 M for the 1800 bed camp, based on budget quotes from specialist Peruvian contractors, and has an accuracy of ±15%.
The DFS operating cost estimate is approximately $15 per person per day, again based on budget quotes from Peruvian contractors.
1.8.7 Concentrate transport and shipping
This section is per Section 1.8.7 of the 2009 Technical Report. The description from the 2009 Technical Report is provided for clarity.
Concentrate will be transported by truck from site to the nearest port, Matarani, located 475 km by road from Constancia. Transportation will be undertaken by a specialist haulage contractor. The long term haulage contract will be competitively bid. Hopper-type trucks with a closed cover system will be used, each with a capacity of 35 t. Travel time per truck is estimated at two days, equating to a running fleet requirement of approximately 70 trucks in peak production years.
The concentrate will be stored in Matarani in a warehouse owned and operated by the International South Terminal S.A. (TISUR), a private organisation that has held the port operations contract since 1999. The storage facility will be sized to equal the monthly production for the Constancia project (average 21 000 tonnes of concentrate). TISUR will also be responsible for shiploading services.
Correspondence between TISUR and Norsemont indicates that port handling charges of $7.50/t (wet) will apply.
\\Bnefp01\Users$\Greg.Lane\My Documents\Current Projects\Current Studies\Constancia\Ni 43-101 Report Feb 2011\Ni 43-101 Report Rev 0 21 Feb.Doc Rev: 0 Date: 21 February 2011 9999FM0038 – 2
33
1.9 Water Management
1.9.1 Process water
This section is per Section 1.9.1 of the 2009 Technical Report since the peak throughput is unchanged.
1.9.2 Water balance
The water balance model is unchanged from the 2009 Technical Report. However, it will be revised in the next design stage with the new mine plan to refine actual water demands, design flows, and sizing of the various water and waste management facilities.
1.9.3 Non-process water
This section is per Section 1.9.3 of the 2009 Technical Report. However, it will be revised at the next design stage with the new mine plan to refine the estimates of the actual water diversion and temporary storage requirements.
1.9.4 Cunahuiri Reservoir
The Cunahuiri Reservoir will provide storage capacity for the fresh water supply to the plant, and will also serve as a reservoir from which controlled releases will be made to compensate for potential flow reductions to the Rio Chilloroya and reductions in flows from local springs around the pit area. The Cunahuiri Reservoir will collect water from the upstream Quebrada Cunahuiri catchment area and the catchment area to the northeast of the PAG WRF that will be diverted in the WRF Non-Contact Diversion Channel No. 1. Collected waters will include seepage flows, surface runoff, and direct precipitation to the reservoir. The site-wide water balance analysis completed for the DFS and 2009 Technical report, estimated that the required Cunahuiri Reservoir storage volume was 2,000,000 m3.
1.10 Environmental and Social Considerations
1.10.1 ESIA
The Ministry of Energy and Mines (MINEM) is the principal regulatory agency responsible for permitting mining projects and, specifically, the relevant authority for the approval of ESIAs for the mining and energy sector in Peru.
The project has been designed to consider all relevant legislation applicable to the development of mining projects in Peru including mines, roads, ports and transmission lines. Additional legislation that has been considered includes legislation and regulations regarding archaeological areas of significance, endangered and protected species as well as community relations and public disclosure programs.
On 24 November 2010 the ESIA for the Constancia Project was approved by the Peruvian Ministry of Energy and Mines. Results from the baseline studies indicated:
Air quality within the project site and the surrounding communities is generally good.
Existing levels of noise and vibrations from static sources are within national standards.
The site is classified as an area with medium seismicity.
Soils are colluvial–alluvial and residual materials. In general the erosion potential of the soil in the area surrounding the project is low to medium.
Water quality: in general, results indicate that the water quality within the project area has neutral to alkaline pH and in some locations exceeds the national standards for iron, manganese, copper, lead, zinc and arsenic.
\\Bnefp01\Users$\Greg.Lane\My Documents\Current Projects\Current Studies\Constancia\Ni 43-101 Report Feb 2011\Ni 43-101 Report Rev 0 21 Feb.Doc Rev: 0 Date: 21 February 2011 9999FM0038 – 2
34
Flora: a total of 494 different species of plants and 10 vegetative formations were identified within the project area. While 18 species of flora are classified as endangered these are not located within the direct area of influence.
Terrestrial fauna: a total of 96 different species of birds, 19 species of mammals, four species of reptiles, and four species of amphibians were identified within the project area. Of these, five species of birds, three species of mammals and one amphibian are listed as protected species.
Aquatic life: three species of trout and two species of catfish (bagre and challhua) were found within these aquatic environments. Challhua was found only in wetland areas. One species of fish belongs to the IUCN Red List of Threatened Species.
Human interest environment:
o Landscape: some parts of the district are considered to contain medium values of visual quality, due to the presence of lakes and the dominant mountain landscapes in these sectors.
o Archaeological Heritage: a total of 46 archaeological sites were identified in the area of the future mine site. The process to obtain a certificate of non-existence of archaeological remains of significance from the INC (National Cultural Institute) has been initiated.
o Environmental liabilities from Previous and Current Mining Activities: five zones were identified where mining-related environmental liabilities exist on Norsemont mining concessions.
o Traffic: current levels of traffic will be assessed in a survey by SIGT that will identify vehicle types, the daily volume of traffic and the kinds of loads being transported along the existing road networks.
1.10.2 Stakeholder mapping Stakeholder mapping has been undertaken, identifying the two principal stakeholder groups in the direct area of influence as the communities of Uchucarco and Chilloroya. There are three well-defined groups in each of the communities, namely:
Community assembly: people from the community.
Artisanal miners: from the community and possess land in the community (do not own title of the land).
Youth Groups: (in the case of Chilloroya, represented through the Youth Association), they have higher education than the rest of the local residents and the experience of having lived in other cities; however, they own no land and possess no economic capital.
The youth groups and artisanal miners do not have a solid organisational structure, but do have marked interests and represent a significant proportion of the population. The association of artisanal miners in Chilloroya is one year old. Benefits from the artisanal mining activities in Chilloroya are not distributed evenly across the population, but are primarily experienced by those members of the population who possess the land where the illegal mining activities are occurring.
\\Bnefp01\Users$\Greg.Lane\My Documents\Current Projects\Current Studies\Constancia\Ni 43-101 Report Feb 2011\Ni 43-101 Report Rev 0 21 Feb.Doc Rev: 0 Date: 21 February 2011 9999FM0038 – 2
35
Uchucarco has a greater number and variety of organisations inside its community structure; some of which have duties that are independent from the Governing Board, these include: JAAS3, the Committee of Water Users (“Comité de Regantes”), among others. In addition, Uchucarco is the most active community in the District of Chamaca4, and has more relationships with district and private institutions.
In Chilloroya, unlike Uchucarco, the political strength of the Governing Board is weak and the different associations in the community are not well organised. Although there is a varied array of organisations, many are focused on specific tasks and have little political presence, as in the case of women’s and parents’ organisations.
1.10.3 Status of land ownership in the communities of Uchucarco and Chilloroya
The land administration system in Uchucarco and Chilloroya is consistent with the community system of land possession, under which communities have the right to decide upon their territories. These decisions must be made and undertaken by consensus, through a General Assembly of the community.
Typically land is divided into plots among the dwellers (as in the case of Chilloroya and Uchucarco), and boundaries marked in the presence of members of the governing board. These plots of land are registered with the community. The dwellers do not have official title to the lands but can enjoy the benefits from the land (growing crops, grazing of livestock, construction of a house or dwellings) etc.
The dweller is not permitted to make any transaction or exchange of the land.
The project has purchased 4097 ha of private lands to date and has plans to purchase additional lands belonging to the two communities. As a result of the project development, approximately 35 families from the community of Chilloroya will need to be relocated. Norsemont is currently implementing their Resettlement Action Plan (RAP) in accordance with International Finance Corporation (IFC) performance standards on involuntary resettlement and Peruvian National legislation.
1.10.4 Impact identification and evaluation
Positive and negative impacts related to the project development phases were identified and evaluated. Mitigation measures were proposed and evaluated for their relative level of impact and significance. The process for the evaluation of impacts was guided by national and international standards, using impact assessment matrices and predictive models. The evaluation of impacts considered direct, indirect and cumulative impacts. Modelling of noise and vibration, air dispersion, water quality and visual impacts were undertaken to evaluate the impacts on the local population.
1.10.5 Environmental management plan As part of the ESIA, an Environmental Management Plan (EMP) was developed to:
Identify mitigation and management strategies
Set objectives and targets
Define performance indicators
Document time frames to achieve targets
3 Water and Sanitation Administration Board (“Junta de Administración de Agua y Saneamiento”)
4 Uchuccarcco is one of the most densely populated districts of Chamaca, in addition to having a privileged economic conditions
\\Bnefp01\Users$\Greg.Lane\My Documents\Current Projects\Current Studies\Constancia\Ni 43-101 Report Feb 2011\Ni 43-101 Report Rev 0 21 Feb.Doc Rev: 0 Date: 21 February 2011 9999FM0038 – 2
36
Allocate responsibilities and identify the necessary resources for the implementation of the plan
Establish mechanisms to monitor, evaluate and report on progress.
EMPs are important tools for ensuring that the management actions arising from the ESIA are clearly defined and implemented throughout all phases of the Project life cycle.
1.10.6 Resettlement Action Plan (RAP)
A Resettlement Action Plan (RAP) was developed as part of the ESIA. The RAP complies with international best practice for involuntary resettlement as promulgated by the Equator Principles and IFC Performance Standards. The RAP specifically addresses compensation procedures and measures for people undergoing physical and/or economic displacement as a result of project implementation, and includes:
Census of project-affected people
Cut-off date
Compensation matrix
Framework for development of detailed resettlement actions
1.10.7 Community relations plan
The Community Relations Plan was prepared taking into account the following requirements:
Final determination of the Direct and Indirect Areas of Influence of the project, based on the outcomes of the Social Impact Analysis.
The needs in the construction and operation phases, as determined in the Social Impact Analysis.
The State’s requirements, as expressed in the Community Relations Guidelines of the MINEM and the Prior Commitment Act (DS-042-2003-EM).
The requirements of international financial institutions, taking into account as main references the Equator Principles, IFC Performance Standards, United Nations Environment Programme’s APELL (Awareness and Preparedness for Emergencies at Local Level) for Mining, and, supplementary social management standards.
Specific social programs were designed for the mitigation and prevention of identified impacts.Generally, these programs addressed the following key topics:
Communication and consultation
Participatory monitoring
Claims and dispute resolution
Local employment
Social investment
Land acquisition and resettlement
Code of conduct for workers.
1.10.8 Health, safety and environment (HSE) management and monitoring plan
Norsemont will develop a comprehensive HSE management plan for the Constancia Project to:
Ensure HSE compliance
Demonstrate that all hazards are appropriately managed
\\Bnefp01\Users$\Greg.Lane\My Documents\Current Projects\Current Studies\Constancia\Ni 43-101 Report Feb 2011\Ni 43-101 Report Rev 0 21 Feb.Doc Rev: 0 Date: 21 February 2011 9999FM0038 – 2
37
Achieve continuous improvement in HSE performance.
Periodic and regular monitoring constitute a principal component of the HSE plan for the construction, operation, closure and post-closure phases of the project. The plan includes direct monitoring of air and water resources, and indirect monitoring of flora and fauna.
The monitoring program will provide information for evaluating actual project impacts and the effectiveness of the mitigation measures in place. This will allow for dynamic adjustments to the mitigation plan as the project progresses.
Six air quality monitoring stations are proposed: four adjacent to the open pit, and one each in Uchucarco and Chilloroya. Strict measures to maintain air quality will be implemented. This will involve, for example, spraying water on access roads for dust control to ensure compliance with legislation regarding airborne particulates.
Twelve surface water quality monitoring stations are proposed in the area.
The TMF, PAG WRF, topsoil and unsuitable material stockpiles and all associated ponds will be instrumented for performance monitoring. This will include pore pressures in the tailings and mine waste, as well as in the drain zones and embankment structural zone and foundations. Water flow rates and totalised volumes will be measured as will the water and tailings levels. Monitoring of slope movements and materials settlement will be made.
Industrial and hazardous waste will be separated from common domestic waste. Domestic waste will be recycled whenever feasible. Norsemont will construct a sanitary landfill for the disposal of domestic wastes.
Hazardous waste will be stored temporarily in secondary confinement areas prior to removal to designated facilities for resale, recycling or indefinite storage, in accordance with Peruvian regulations.
In all cases, storage facilities for fuel and chemical substances will be designed with secondary impermeable containment. These lined and bermed containment areas will be designed to hold 110% of the capacity of the largest tank to avoid spillage of contaminants. No underground storage facilities for fuel are planned.
Sewage treatment facilities will be constructed servicing all project components. Operating procedures, including monitoring discharges, will comply with the corresponding Peruvian standards.
Health and safety procedures will be developed in accordance with Peruvian legislation and will be strictly enforced.
A restoration program will be developed to re-establish a landscape that is environmentally and aesthetically compatible with the surrounding countryside.
All personnel and contractors will be required to comply with the standards and procedures contained in the ESIA for all Project stages. Internal and external audits will be performed periodically to verify compliance.
1.10.9 Closure plan
In accordance with Peruvian National Regulations for the mining sector, a conceptual closure plan was developed for inclusion in the ESIA. The conceptual plan includes recognition of the principal impacts from project closure to the communities in the area of influence, and identifies measures to mitigate these impacts.
Reclamation and closure of the project will be conducted in accordance with international best practices, the objective being to return mined lands to conditions capable of supporting prior land use or uses that are equal to or better than prior land use to the extent practical and feasible. In addition, long term stability and safety issues will be addressed as a priority.
\\Bnefp01\Users$\Greg.Lane\My Documents\Current Projects\Current Studies\Constancia\Ni 43-101 Report Feb 2011\Ni 43-101 Report Rev 0 21 Feb.Doc Rev: 0 Date: 21 February 2011 9999FM0038 – 2
38
The area to be disturbed and reclaimed encompasses approximately 796 ha. Reclamation and closure activities are to be conducted concurrently with mining operations, to the extent practical, to reduce the final reclamation and closure costs and minimise long term environmental liabilities. The key goals of reclamation and closure are to ensure the physical and chemical stability of the TMF and the WRF.
The closure plan includes:
Salvaging, stockpiling and ultimate replacement of topsoil and subsoils from the PAG WRF and process plant areas.
Reclamation of the open pit, including re-contouring, re-grading and re-vegetating of an approximately 30 m wide area surrounding the open pit. After closure the pit lake water will need to be treated in perpetuity by lime addition prior to discharge into the Chilloroya during the wet season.
WRF: closure of the PAG WRF will include covering the facility with an approximately 1.8 m cap comprising a low permeability layer, a drain layer and 0.3 m of topsoil/growth media. The soil cover will be scarified and seeded.
The upstream diversion channel of the PAG WRF will remain in place at closure. The current closure concept is to pump the seepage and run-off from the WRF to the pit for in-pit treatment, as discussed above.
TMF: the current closure plan is based around de-sulfurising (by pyrite flotation) plant tailings during the last one and half to two years of operations, to form inert tailings. [There is no allowance for these costs in the financial analysis as Norsemont will assess the needs during the later stages of operation]. These inert tailings will then be deposited over the existing tailings surface to form an impermeable cover. The pyrite float material will be stored in a lined area of the TSF. A spillway will be constructed in the southeast side of the TMF that has been designed to pass the overflow resulting from the probable maximum precipitation (PMP). A soil cover will be placed on top of the tailings beach and the facility and the dam face will be revegetated.
Roads will be reclaimed by pushing safety berms down and over roads, removing culverts, backfilling ditches, and re-grading areas to re-establish the natural drainage system. After regrading is completed, road areas will be scarified and seeded.
Infrastructure will be removed from the project area when no longer needed. Concrete foundations will be buried in place, and scrap metal removed. The mill area will be decontaminated. Associated yard areas will be ripped to eliminate compacted soils and regraded, after which previously disturbed areas will be scarified and seeded.
Production water wells will be abandoned in accordance with local regulations or transferred to support an approved post-mining land use. Monitoring wells will be abandoned once regulatory officials decide they are no longer necessary. Water lines, utility poles, power lines, fuel tanks, generators, transformers and other items remaining in the project area after mine operations cease will be removed from the site and disposed of properly unless they can be used by the communities, or sent to salvage. The non-hazardous sanitary land fill will be closed by placing an inert cap over the facility and removing any infrastructure (fences, platforms, etc.).
Annual reports will be prepared to document the closure and reclamation activities. Revegetation efforts will be monitored biannually by a range specialist to record vegetation success, monitor erosion, and modify reclamation plans if necessary. Groundwater wells and surface water sites will be sampled quarterly to record post-mining water quality.
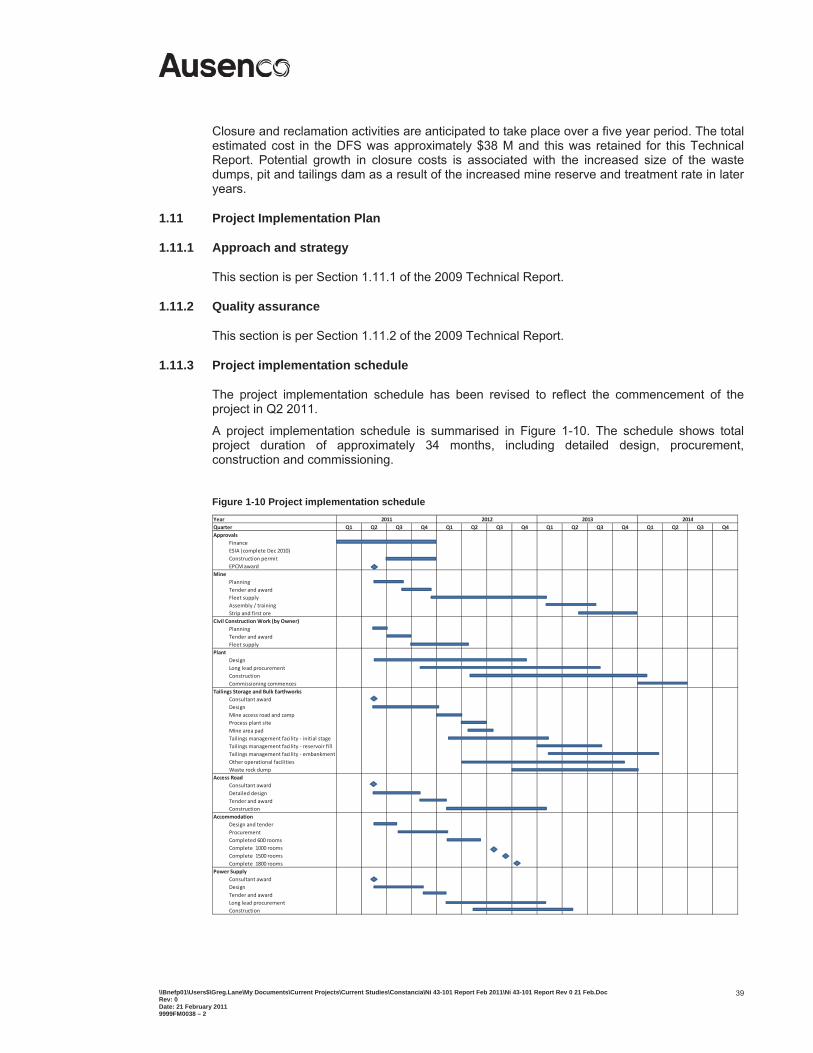
\\Bnefp01\Users$\Greg.Lane\My Documents\Current Projects\Current Studies\Constancia\Ni 43-101 Report Feb 2011\Ni 43-101 Report Rev 0 21 Feb.Doc Rev: 0 Date: 21 February 2011 9999FM0038 – 2
39
Closure and reclamation activities are anticipated to take place over a five year period. The total estimated cost in the DFS was approximately $38 M and this was retained for this Technical Report. Potential growth in closure costs is associated with the increased size of the waste dumps, pit and tailings dam as a result of the increased mine reserve and treatment rate in later years.
1.11 Project Implementation Plan
1.11.1 Approach and strategy
This section is per Section 1.11.1 of the 2009 Technical Report.
1.11.2 Quality assurance
This section is per Section 1.11.2 of the 2009 Technical Report.
1.11.3 Project implementation schedule
The project implementation schedule has been revised to reflect the commencement of the project in Q2 2011.
A project implementation schedule is summarised in Figure 1-10. The schedule shows total project duration of approximately 34 months, including detailed design, procurement, construction and commissioning.
Figure 1-10 Project implementation schedule
Q1 Q2 Q3 Q4 Q1 Q2 Q3 Q4 Q1 Q2 Q3 Q4 Q1 Q2 Q3 Q4Approvals
FinanceESIA (complete Dec 2010)Construction permitEPCMaward
MinePlanningTender and awardFleet supplyAssembly / trainingStrip and first ore
Civil ConstructionWork (by Owner)PlanningTender and awardFleet supply
PlantDesignLong lead procurementConstructionCommissioning commences
Tailings Storage and Bulk EarthworksConsultant awardDesignMine access road and campProcess plant siteMine area padTailings management facility initial stageTailings management facility reservoir fillTailings management facility embankmentOther operational facilitiesWaste rock dump
Access RoadConsultant awardDetailed designTender and awardConstruction
AccommodationDesign and tenderProcurementCompleted 600 roomsComplete 1000 roomsComplete 1500 roomsComplete 1800 rooms
Power SupplyConsultant awardDesignTender and awardLong lead procurementConstruction
2011 2012 2013YearQuarter
2014
\\Bnefp01\Users$\Greg.Lane\My Documents\Current Projects\Current Studies\Constancia\Ni 43-101 Report Feb 2011\Ni 43-101 Report Rev 0 21 Feb.Doc Rev: 0 Date: 21 February 2011 9999FM0038 – 2
40
Key dates for the project are as follows:
Project execution commencement – Q2 2011
Environmental approval – complete
Construction permit and commencement of construction – Q1 2012
Commencement of process plant commissioning – Q1 2014.
Critical activities that need to commence upon Norsement Board approval are:
Negotiations to secure a power supply agreement or option
Detailed design for the access road upgrade and investigation of accelerating its implementation
Engineering design which includes process design, flowsheet verification and optimisation, plant layout, and long lead item procurement
Detailed design and planning for bulk earthworks and purchase of Owner’s civil construction fleet
Recruitment of key Owner’s team members
Development of the accommodation camp contract and investigation of availability of second hand camps
Investigation of the criticality and availability of long lead equipment
Development of project systems. This includes OHS&E requirements and standards, equipment numbering, asset numbering, document numbering, cost control and reporting systems, document control, permit plan development and implementation, and procurement documentation and systems.
1.11.4 Civil construction fleet
This section is per Section 1.11.4 of the 2009 Technical Report.
1.12 Project Operational Plan
This section is per Section 1.12 of the 2009 Technical Report.
1.13 Capital Cost Estimate
1.13.1 Initial project capital
The Constancia Project capital estimate by facility is summarised in Table 1-5. The total capital cost, including sustaining capital amounts to $1.16 B of which $920 M is initial capital.
The capital cost estimate for the Constancia Project DFS and 2009 Technical Report had a level of accuracy of ±15% and had a base date of Q1 2009. Elements of the estimate were modified by Ausenco, Knight Piésold or SRK as part of the FSO and the base date for the estimate is a combination of Q1 2009 and Q4 2010 as summarised below:
The mining costs were by SRK with a base date of Q4 2010
The process plant comminution circuit capital costs were by Ausenco based on the 2009 Technical Report data with equipment priced in Q4 2010 and other disciplines per the 2009 Technical Report priced in Q1 2009
All other capital cost elements were per the 2009 Technical Report with a base date of Q1 2009:
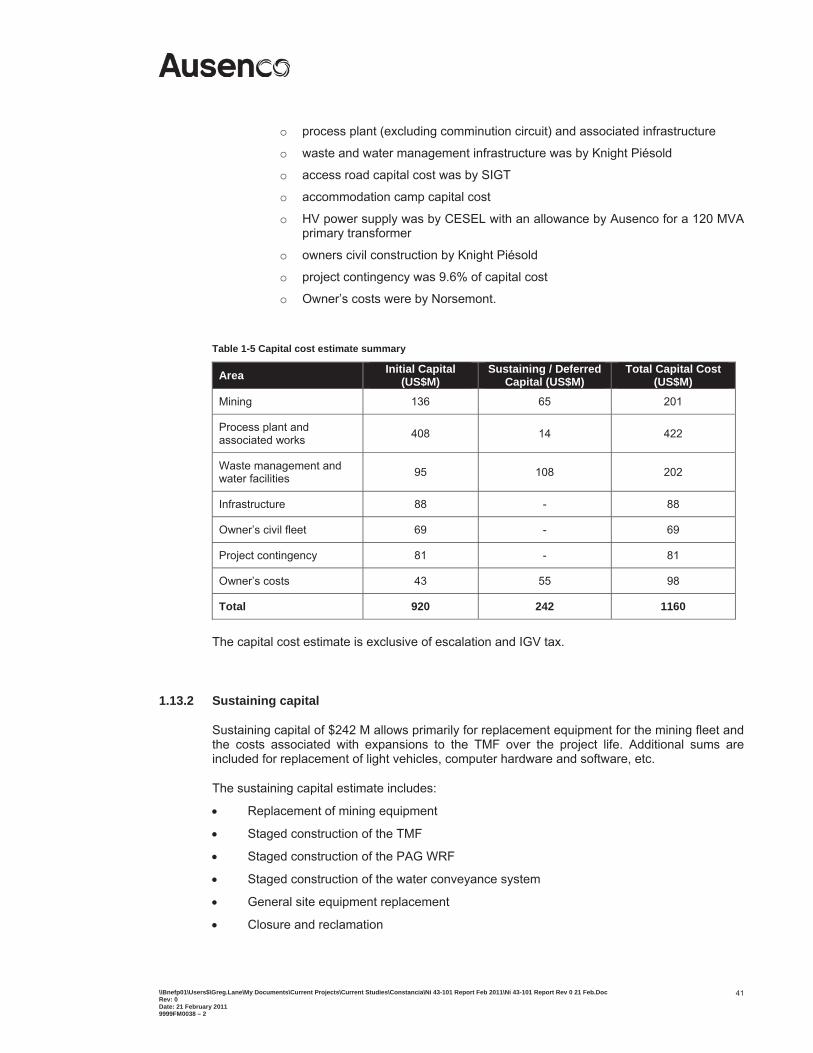
\\Bnefp01\Users$\Greg.Lane\My Documents\Current Projects\Current Studies\Constancia\Ni 43-101 Report Feb 2011\Ni 43-101 Report Rev 0 21 Feb.Doc Rev: 0 Date: 21 February 2011 9999FM0038 – 2
41
o process plant (excluding comminution circuit) and associated infrastructure
o waste and water management infrastructure was by Knight Piésold
o access road capital cost was by SIGT
o accommodation camp capital cost
o HV power supply was by CESEL with an allowance by Ausenco for a 120 MVA primary transformer
o owners civil construction by Knight Piésold
o project contingency was 9.6% of capital cost
o Owner’s costs were by Norsemont.
Table 1-5 Capital cost estimate summary
Area Initial Capital (US$M)
Sustaining / DeferredCapital (US$M)
Total Capital Cost (US$M)
Mining 136 65 201
Process plant and associated works 408 14 422
Waste management and water facilities 95 108 202
Infrastructure 88 - 88
Owner’s civil fleet 69 - 69
Project contingency 81 - 81
Owner’s costs 43 55 98
Total 920 242 1160
The capital cost estimate is exclusive of escalation and IGV tax.
1.13.2 Sustaining capital
Sustaining capital of $242 M allows primarily for replacement equipment for the mining fleet and the costs associated with expansions to the TMF over the project life. Additional sums are included for replacement of light vehicles, computer hardware and software, etc.
The sustaining capital estimate includes:
Replacement of mining equipment
Staged construction of the TMF
Staged construction of the PAG WRF
Staged construction of the water conveyance system
General site equipment replacement
Closure and reclamation
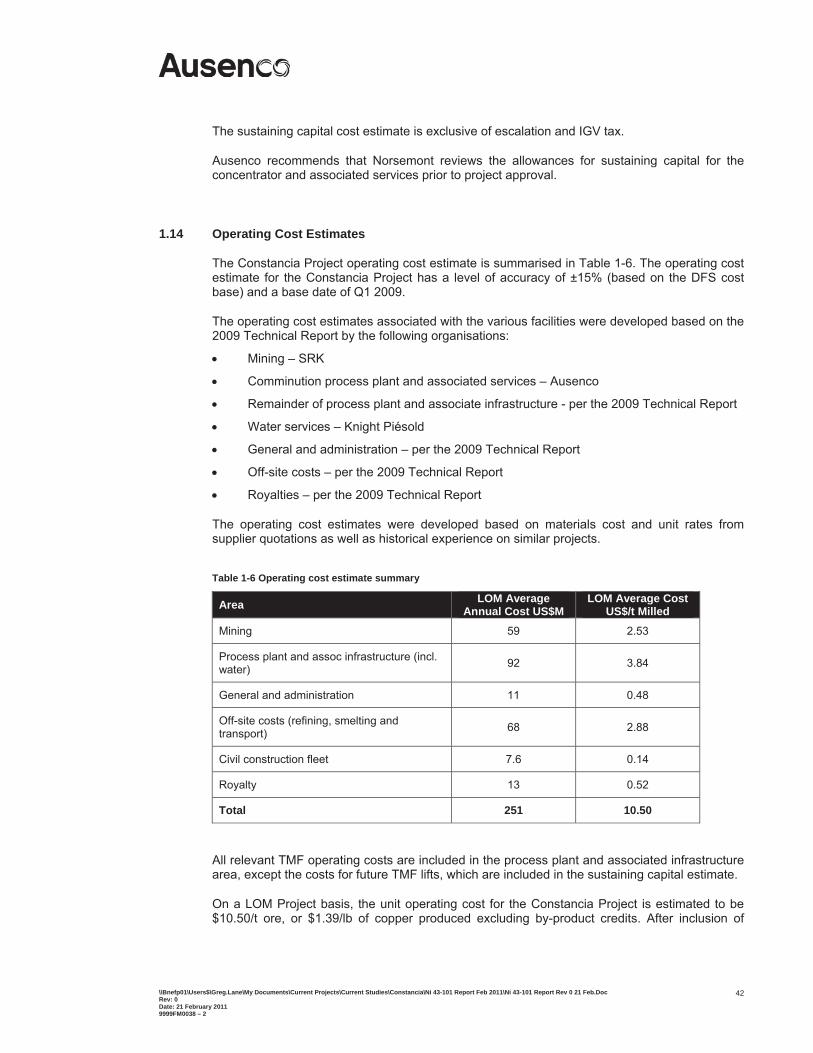
\\Bnefp01\Users$\Greg.Lane\My Documents\Current Projects\Current Studies\Constancia\Ni 43-101 Report Feb 2011\Ni 43-101 Report Rev 0 21 Feb.Doc Rev: 0 Date: 21 February 2011 9999FM0038 – 2
42
The sustaining capital cost estimate is exclusive of escalation and IGV tax.
Ausenco recommends that Norsemont reviews the allowances for sustaining capital for the concentrator and associated services prior to project approval.
1.14 Operating Cost Estimates
The Constancia Project operating cost estimate is summarised in Table 1-6. The operating cost estimate for the Constancia Project has a level of accuracy of ±15% (based on the DFS cost base) and a base date of Q1 2009.
The operating cost estimates associated with the various facilities were developed based on the 2009 Technical Report by the following organisations:
Mining – SRK
Comminution process plant and associated services – Ausenco
Remainder of process plant and associate infrastructure - per the 2009 Technical Report
Water services – Knight Piésold
General and administration – per the 2009 Technical Report
Off-site costs – per the 2009 Technical Report
Royalties – per the 2009 Technical Report
The operating cost estimates were developed based on materials cost and unit rates from supplier quotations as well as historical experience on similar projects.
Table 1-6 Operating cost estimate summary
Area LOM Average Annual Cost US$M
LOM Average Cost US$/t Milled
Mining 59 2.53
Process plant and assoc infrastructure (incl. water) 92 3.84
General and administration 11 0.48
Off-site costs (refining, smelting and transport) 68 2.88
Civil construction fleet 7.6 0.14
Royalty 13 0.52
Total 251 10.50
All relevant TMF operating costs are included in the process plant and associated infrastructure area, except the costs for future TMF lifts, which are included in the sustaining capital estimate.
On a LOM Project basis, the unit operating cost for the Constancia Project is estimated to be $10.50/t ore, or $1.39/lb of copper produced excluding by-product credits. After inclusion of
\\Bnefp01\Users$\Greg.Lane\My Documents\Current Projects\Current Studies\Constancia\Ni 43-101 Report Feb 2011\Ni 43-101 Report Rev 0 21 Feb.Doc Rev: 0 Date: 21 February 2011 9999FM0038 – 2
43
credits for sale of molybdenum, silver and gold the unit cost reduces to $0.93/lb of payable copper.
1.15 Marketing, Product Pricing and Treatment Charges
Norsemont has reviewed market reports on copper pricing, treatment and refining charges, and penalties for pricing information. It has been assumed that concentrates will be shipped to smelters in Asia for treatment.
Norsemont has adopted a single average price of $2.50/lb Cu, $14.00/oz Ag, $1000/oz Au and $14.50/lb Mo over the life of the Project for Base Case economic assessment. These prices are less than current spot prices.
In common with metal prices, smelting and refining charges have varied widely over the past year, and prediction of future costs is difficult. Norsemont has adopted figures of $65/t and $0.07/lb. Standard metal refining deductions have been applied.
1.16 Project Financial Analysis
1.16.1 Background
Capital costs, operating costs and production plan inputs were assembled as described in this report and the pre-tax cashflow prepared. Norsemont provided inputs regarding taxation, metal prices, royalties and off-site charges, and the basis for the post-tax cashflow and financial analysis.
In estimating ramp-up, it was assumed that design metal recovery would be achieved eight months after production started, per the 2009 Technical Report. Norsemont advised the basis for working capital was two month debtors.
Operating cost inputs to the financial model are summarised in Table 1-7, metal price assumptions in Table 1-8 and the production schedule in Table 1-9.
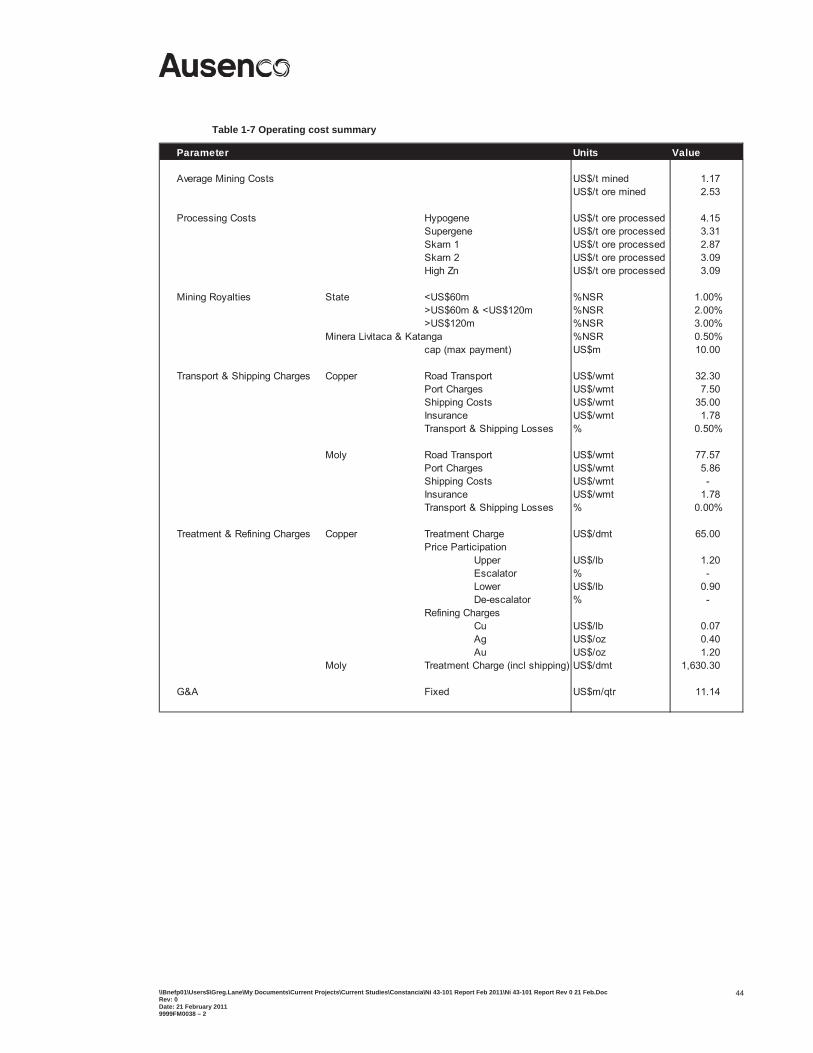
\\Bnefp01\Users$\Greg.Lane\My Documents\Current Projects\Current Studies\Constancia\Ni 43-101 Report Feb 2011\Ni 43-101 Report Rev 0 21 Feb.Doc Rev: 0 Date: 21 February 2011 9999FM0038 – 2
44
Table 1-7 Operating cost summary
Parameter
Average Mining Costs US$/t mined 1.17 US$/t ore mined 2.53
Processing Costs Hypogene US$/t ore processed 4.15 Supergene US$/t ore processed 3.31 Skarn 1 US$/t ore processed 2.87 Skarn 2 US$/t ore processed 3.09 High Zn US$/t ore processed 3.09
Mining Royalties State <US$60m %NSR 1.00%>US$60m & <US$120m %NSR 2.00%>US$120m %NSR 3.00%
Minera Livitaca & Katanga %NSR 0.50%cap (max payment) US$m 10.00
Transport & Shipping Charges Copper Road Transport US$/wmt 32.30 Port Charges US$/wmt 7.50 Shipping Costs US$/wmt 35.00 Insurance US$/wmt 1.78 Transport & Shipping Losses % 0.50%
Moly Road Transport US$/wmt 77.57 Port Charges US$/wmt 5.86 Shipping Costs US$/wmt - Insurance US$/wmt 1.78 Transport & Shipping Losses % 0.00%
Treatment & Refining Charges Copper Treatment Charge US$/dmt 65.00 Price Participation
Upper US$/lb 1.20 Escalator % - Lower US$/lb 0.90 De-escalator % -
Refining ChargesCu US$/lb 0.07 Ag US$/oz 0.40 Au US$/oz 1.20
Moly Treatment Charge (incl shipping) US$/dmt 1,630.30
G&A Fixed US$m/qtr 11.14
Units Value
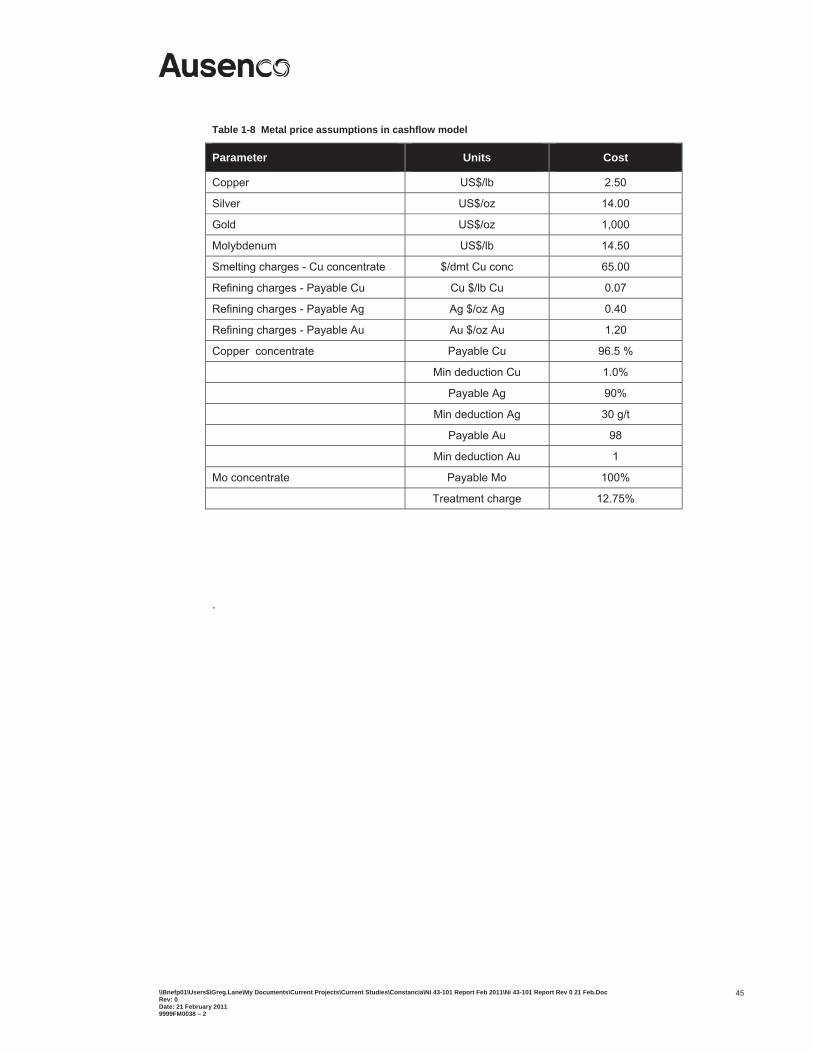
\\Bnefp01\Users$\Greg.Lane\My Documents\Current Projects\Current Studies\Constancia\Ni 43-101 Report Feb 2011\Ni 43-101 Report Rev 0 21 Feb.Doc Rev: 0 Date: 21 February 2011 9999FM0038 – 2
45
Table 1-8 Metal price assumptions in cashflow model
Parameter Units Cost
Copper US$/lb 2.50
Silver US$/oz 14.00
Gold US$/oz 1,000
Molybdenum US$/lb 14.50
Smelting charges - Cu concentrate $/dmt Cu conc 65.00
Refining charges - Payable Cu Cu $/lb Cu 0.07
Refining charges - Payable Ag Ag $/oz Ag 0.40
Refining charges - Payable Au Au $/oz Au 1.20
Copper concentrate Payable Cu 96.5 %
Min deduction Cu 1.0%
Payable Ag 90%
Min deduction Ag 30 g/t
Payable Au 98
Min deduction Au 1
Mo concentrate Payable Mo 100%
Treatment charge 12.75%
.
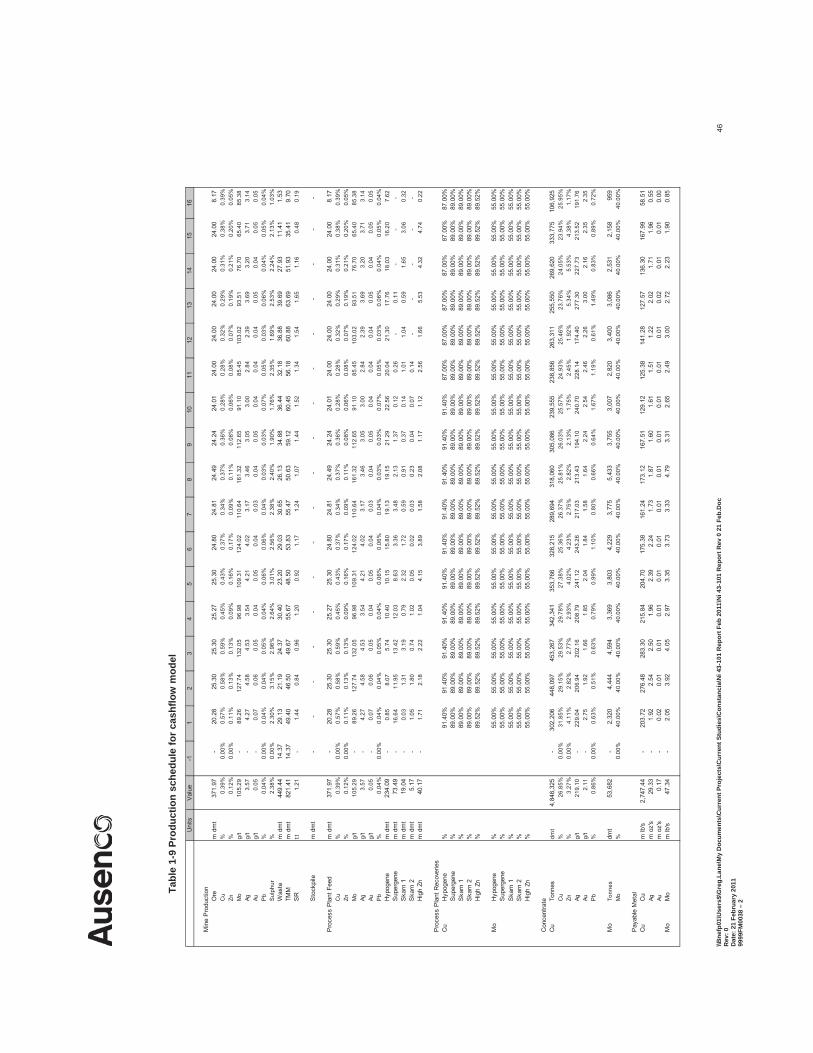
\\Bne
fp01
\Use
rs$\
Gre
g.La
ne\M
y D
ocum
ents
\Cur
rent
Pro
ject
s\C
urre
nt S
tudi
es\C
onst
anci
a\N
i 43-
101
Rep
ort F
eb 2
011\
Ni 4
3-10
1 R
epor
t Rev
0 2
1 Fe
b.D
oc
Rev
: 0
Dat
e: 2
1 Fe
brua
ry 2
011
9999
FM00
38 –
2
46
Tabl
e 1-
9 Pr
oduc
tion
sche
dule
for c
ashf
low
mod
el
Uni
tsV
alue
-11
23
45
67
89
1011
1213
1415
16
Min
e P
rodu
ctio
nO
rem
dm
t37
1.97
-
20
.28
25
.30
25
.30
25
.27
25
.30
24
.80
24
.81
24
.49
24
.24
24
.01
24
.00
24
.00
24
.00
24
.00
24
.00
8.
17
Cu
%0.
39%
0.00
%0.
57%
0.58
%0.
59%
0.45
%0.
43%
0.37
%0.
34%
0.37
%0.
36%
0.28
%0.
28%
0.32
%0.
29%
0.31
%0.
38%
0.39
%Zn
%0.
12%
0.00
%0.
11%
0.13
%0.
13%
0.09
%0.
16%
0.17
%0.
09%
0.11
%0.
08%
0.06
%0.
08%
0.07
%0.
19%
0.21
%0.
20%
0.05
%M
og/
t10
5.29
-
89
.26
127.
74
132.
05
96.9
8
10
9.31
12
4.02
11
0.64
16
1.32
11
2.65
91
.10
85.4
5
10
3.02
93
.51
76.7
0
65
.40
85.3
8
Agg/
t3.
57
-
4.
27
4.58
4.53
3.54
4.21
4.02
3.17
3.46
3.05
3.00
2.84
2.39
3.69
3.20
3.71
3.14
Aug/
t0.
05
-
0.
07
0.06
0.05
0.04
0.05
0.04
0.03
0.04
0.05
0.04
0.04
0.04
0.05
0.04
0.05
0.05
Pb
%0.
04%
0.00
%0.
04%
0.04
%0.
05%
0.04
%0.
06%
0.06
%0.
04%
0.03
%0.
03%
0.07
%0.
05%
0.03
%0.
06%
0.04
%0.
05%
0.04
%S
ulph
ur%
2.38
%0.
00%
2.30
%3.
15%
2.96
%2.
64%
3.01
%2.
56%
2.38
%2.
40%
1.90
%1.
76%
2.35
%1.
69%
2.53
%2.
24%
2.13
%1.
03%
Was
tem
dm
t44
9.44
14.3
7
29.1
3
21.1
9
24.3
7
30.4
0
23.2
0
29.0
3
30.6
5
26.1
3
34.8
8
36.4
4
32.1
8
36.8
8
39.6
9
27.9
3
11.4
1
1.53
TM
Mm
dm
t82
1.41
14.3
7
49.4
0
46.5
0
49.6
7
55.6
7
48.5
0
53.8
3
55.4
7
50.6
3
59.1
2
60.4
5
56.1
8
60.8
8
63.6
9
51.9
3
35.4
1
9.70
S
Rt:t
1.21
-
1.44
0.
84
0.
96
1.
20
0.
92
1.
17
1.
24
1.
07
1.
44
1.
52
1.
34
1.
54
1.
65
1.
16
0.
48
0.
19
Sto
ckpi
lem
dm
t-
-
-
-
-
-
-
-
-
-
-
-
-
-
-
-
-
Pro
cess
Pla
nt F
eed
m d
mt
371.
97
-
20.2
8
25.3
0
25.3
0
25.2
7
25.3
0
24.8
0
24.8
1
24.4
9
24.2
4
24.0
1
24.0
0
24.0
0
24.0
0
24.0
0
24.0
0
8.17
C
u%
0.39
%0.
00%
0.57
%0.
58%
0.59
%0.
45%
0.43
%0.
37%
0.34
%0.
37%
0.36
%0.
28%
0.28
%0.
32%
0.29
%0.
31%
0.38
%0.
39%
Zn%
0.12
%0.
00%
0.11
%0.
13%
0.13
%0.
09%
0.16
%0.
17%
0.09
%0.
11%
0.08
%0.
06%
0.08
%0.
07%
0.19
%0.
21%
0.20
%0.
05%
Mo
g/t
105.
29
-
89.2
6
12
7.74
13
2.05
96
.98
109.
31
124.
02
110.
64
161.
32
112.
65
91.1
0
85
.45
103.
02
93.5
1
76
.70
65.4
0
85
.38
Ag
g/t
3.57
-
4.27
4.
58
4.
53
3.
54
4.
21
4.
02
3.
17
3.
46
3.
05
3.
00
2.
84
2.
39
3.
69
3.
20
3.
71
3.
14
Au
g/t
0.05
-
0.07
0.
06
0.
05
0.
04
0.
05
0.
04
0.
03
0.
04
0.
05
0.
04
0.
04
0.
04
0.
05
0.
04
0.
05
0.
05
P
b%
0.04
%0.
00%
0.04
%0.
04%
0.05
%0.
04%
0.06
%0.
06%
0.04
%0.
03%
0.03
%0.
07%
0.05
%0.
03%
0.06
%0.
04%
0.05
%0.
04%
Hyp
ogen
em
dm
t23
4.09
-
0.85
8.
07
5.
74
10
.40
10.1
5
15
.80
19.1
3
19
.15
21.2
9
22
.56
20.0
4
21
.30
17.7
6
18
.03
16.2
0
7.
62
S
uper
gene
m d
mt
73.4
9
-
16.6
4
11
.95
13.4
2
12
.03
8.63
3.36
3.48
2.13
1.37
0.12
0.26
-
0.11
-
-
-
S
karn
1m
dm
t19
.04
-
0.
03
1.31
3.19
0.79
2.32
1.72
0.59
0.91
0.37
0.14
1.01
1.04
0.59
1.65
3.06
0.32
Ska
rn 2
m d
mt
5.17
-
1.
05
1.80
0.74
1.02
0.05
0.02
0.03
0.23
0.04
0.07
0.14
-
-
-
-
-
H
igh
Znm
dm
t40
.17
-
1.
71
2.18
2.22
1.04
4.15
3.89
1.58
2.08
1.17
1.12
2.56
1.66
5.53
4.32
4.74
0.22
Pro
cess
Pla
nt R
ecov
erie
sC
uH
ypog
ene
%91
.40%
91.4
0%91
.40%
91.4
0%91
.40%
91.4
0%91
.40%
91.4
0%91
.40%
91.4
0%87
.00%
87.0
0%87
.00%
87.0
0%87
.00%
87.0
0%S
uper
gene
%89
.00%
89.0
0%89
.00%
89.0
0%89
.00%
89.0
0%89
.00%
89.0
0%89
.00%
89.0
0%89
.00%
89.0
0%89
.00%
89.0
0%89
.00%
89.0
0%S
karn
1%
89.0
0%89
.00%
89.0
0%89
.00%
89.0
0%89
.00%
89.0
0%89
.00%
89.0
0%89
.00%
89.0
0%89
.00%
89.0
0%89
.00%
89.0
0%89
.00%
Ska
rn 2
%89
.00%
89.0
0%89
.00%
89.0
0%89
.00%
89.0
0%89
.00%
89.0
0%89
.00%
89.0
0%89
.00%
89.0
0%89
.00%
89.0
0%89
.00%
89.0
0%H
igh
Zn%
89.5
2%89
.52%
89.5
2%89
.52%
89.5
2%89
.52%
89.5
2%89
.52%
89.5
2%89
.52%
89.5
2%89
.52%
89.5
2%89
.52%
89.5
2%89
.52%
Mo
Hyp
ogen
e%
55.0
0%55
.00%
55.0
0%55
.00%
55.0
0%55
.00%
55.0
0%55
.00%
55.0
0%55
.00%
55.0
0%55
.00%
55.0
0%55
.00%
55.0
0%55
.00%
Sup
erge
ne%
55.0
0%55
.00%
55.0
0%55
.00%
55.0
0%55
.00%
55.0
0%55
.00%
55.0
0%55
.00%
55.0
0%55
.00%
55.0
0%55
.00%
55.0
0%55
.00%
Ska
rn 1
%55
.00%
55.0
0%55
.00%
55.0
0%55
.00%
55.0
0%55
.00%
55.0
0%55
.00%
55.0
0%55
.00%
55.0
0%55
.00%
55.0
0%55
.00%
55.0
0%S
karn
2%
55.0
0%55
.00%
55.0
0%55
.00%
55.0
0%55
.00%
55.0
0%55
.00%
55.0
0%55
.00%
55.0
0%55
.00%
55.0
0%55
.00%
55.0
0%55
.00%
Hig
h Zn
%55
.00%
55.0
0%55
.00%
55.0
0%55
.00%
55.0
0%55
.00%
55.0
0%55
.00%
55.0
0%55
.00%
55.0
0%55
.00%
55.0
0%55
.00%
55.0
0%
Con
cent
rate
Cu
Tonn
esdm
t4,
848,
325
-
302,
206
448,
097
453,
267
342,
341
353,
766
328,
215
289,
694
318,
060
305,
086
239,
555
238,
856
263,
311
255,
550
269,
620
333,
775
106,
925
C
u%
26.8
5%0.
00%
31.8
5%29
.15%
29.5
3%29
.78%
27.3
8%25
.36%
26.3
7%25
.81%
26.0
3%25
.57%
24.9
3%25
.46%
23.7
6%24
.05%
23.9
4%25
.95%
Zn%
3.27
%0.
00%
4.11
%2.
82%
2.77
%2.
93%
4.02
%4.
23%
2.75
%2.
82%
2.13
%1.
75%
2.45
%1.
92%
5.34
%5.
53%
4.38
%1.
17%
Agg/
t21
9.10
-
22
9.04
20
6.94
20
2.16
20
8.79
24
1.12
24
3.26
21
7.03
21
3.43
19
4.10
24
0.70
22
8.14
17
4.40
27
7.30
22
7.73
21
3.52
19
1.76
Aug/
t2.
11
-
2.
75
1.92
1.66
1.85
2.04
1.84
1.58
1.64
2.24
2.54
2.46
2.26
3.00
2.16
2.35
2.35
Pb
%0.
86%
0.00
%0.
63%
0.51
%0.
63%
0.79
%0.
99%
1.10
%0.
80%
0.66
%0.
64%
1.67
%1.
19%
0.61
%1.
49%
0.83
%0.
89%
0.72
%
Mo
Tonn
esdm
t53
,682
-
2,
320
4,
444
4,
594
3,
369
3,
803
4,
229
3,
775
5,
433
3,
755
3,
007
2,
820
3,
400
3,
086
2,
531
2,
158
95
9
Mo
%0.
00%
40.0
0%40
.00%
40.0
0%40
.00%
40.0
0%40
.00%
40.0
0%40
.00%
40.0
0%40
.00%
40.0
0%40
.00%
40.0
0%40
.00%
40.0
0%40
.00%
Pay
able
Met
alC
uC
um
lb's
2,74
7.44
-
203.
72
27
6.48
283.
30
21
5.84
204.
70
17
5.38
161.
24
17
3.12
167.
51
12
9.12
125.
38
14
1.28
127.
57
13
6.30
167.
99
58
.51
Agm
oz'
s29
.33
-
1.92
2.
54
2.50
1.
96
2.39
2.
24
1.73
1.
87
1.60
1.
61
1.51
1.
22
2.02
1.
71
1.96
0.
55
Aum
oz'
s0.
17
-
0.
02
0.01
0.
01
0.01
0.
01
0.01
0.
01
0.01
0.
01
0.01
0.
01
0.01
0.
02
0.01
0.
01
0.00
M
oM
om
lb's
47.3
4
-
2.
05
3.92
4.
05
2.97
3.
35
3.73
3.
33
4.79
3.
31
2.65
2.
49
3.00
2.
72
2.23
1.
90
0.85
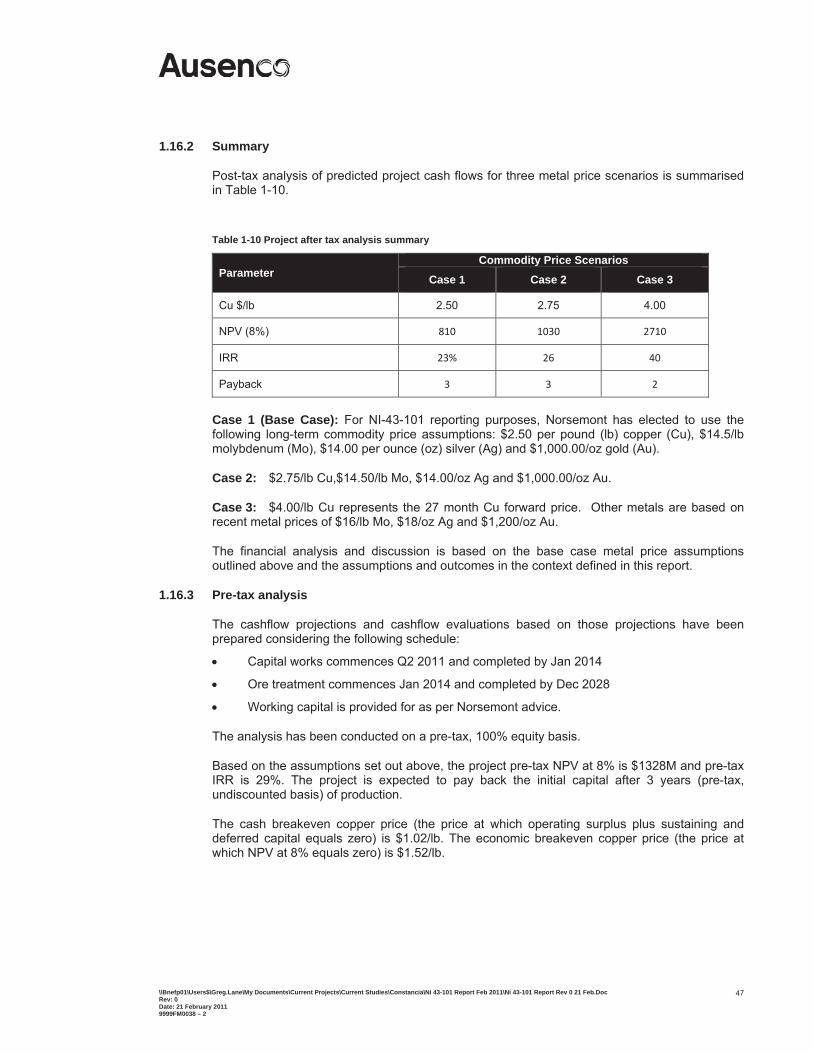
\\Bnefp01\Users$\Greg.Lane\My Documents\Current Projects\Current Studies\Constancia\Ni 43-101 Report Feb 2011\Ni 43-101 Report Rev 0 21 Feb.Doc Rev: 0 Date: 21 February 2011 9999FM0038 – 2
47
1.16.2 Summary
Post-tax analysis of predicted project cash flows for three metal price scenarios is summarised in Table 1-10.
Table 1-10 Project after tax analysis summary
Parameter Commodity Price Scenarios
Case 1 Case 2 Case 3
Cu $/lb 2.50 2.75 4.00
NPV (8%) 810 1030 2710
IRR 23% 26 40
Payback 3 3 2
Case 1 (Base Case): For NI-43-101 reporting purposes, Norsemont has elected to use the following long-term commodity price assumptions: $2.50 per pound (lb) copper (Cu), $14.5/lb molybdenum (Mo), $14.00 per ounce (oz) silver (Ag) and $1,000.00/oz gold (Au).
Case 2: $2.75/lb Cu,$14.50/lb Mo, $14.00/oz Ag and $1,000.00/oz Au.
Case 3: $4.00/lb Cu represents the 27 month Cu forward price. Other metals are based on recent metal prices of $16/lb Mo, $18/oz Ag and $1,200/oz Au.
The financial analysis and discussion is based on the base case metal price assumptions outlined above and the assumptions and outcomes in the context defined in this report.
1.16.3 Pre-tax analysis
The cashflow projections and cashflow evaluations based on those projections have been prepared considering the following schedule:
Capital works commences Q2 2011 and completed by Jan 2014
Ore treatment commences Jan 2014 and completed by Dec 2028
Working capital is provided for as per Norsemont advice.
The analysis has been conducted on a pre-tax, 100% equity basis.
Based on the assumptions set out above, the project pre-tax NPV at 8% is $1328M and pre-tax IRR is 29%. The project is expected to pay back the initial capital after 3 years (pre-tax, undiscounted basis) of production.
The cash breakeven copper price (the price at which operating surplus plus sustaining and deferred capital equals zero) is $1.02/lb. The economic breakeven copper price (the price at which NPV at 8% equals zero) is $1.52/lb.
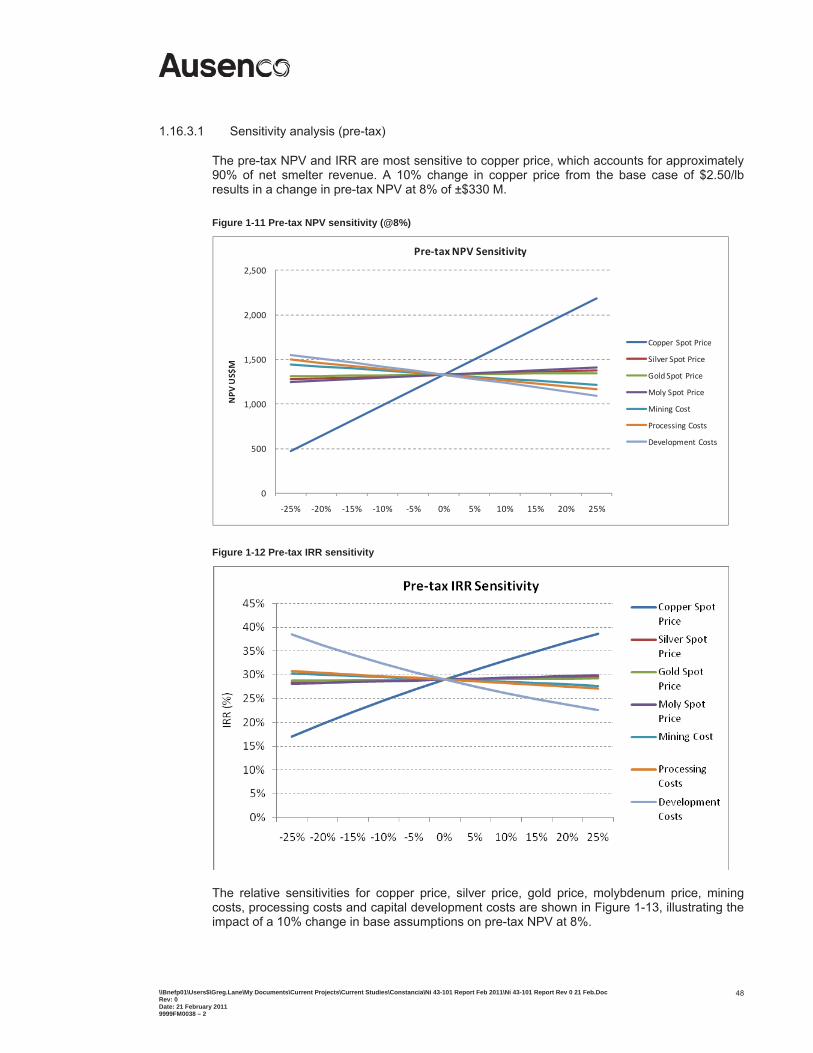
\\Bnefp01\Users$\Greg.Lane\My Documents\Current Projects\Current Studies\Constancia\Ni 43-101 Report Feb 2011\Ni 43-101 Report Rev 0 21 Feb.Doc Rev: 0 Date: 21 February 2011 9999FM0038 – 2
48
1.16.3.1 Sensitivity analysis (pre-tax)
The pre-tax NPV and IRR are most sensitive to copper price, which accounts for approximately 90% of net smelter revenue. A 10% change in copper price from the base case of $2.50/lb results in a change in pre-tax NPV at 8% of ±$330 M.
Figure 1-11 Pre-tax NPV sensitivity (@8%)
0
500
1,000
1,500
2,000
2,500
25% 20% 15% 10% 5% 0% 5% 10% 15% 20% 25%
NPV
US$M
Pre taxNPV Sensitivity
Copper Spot Price
Silver Spot Price
Gold Spot Price
Moly Spot Price
Mining Cost
Processing Costs
Development Costs
Figure 1-12 Pre-tax IRR sensitivity
The relative sensitivities for copper price, silver price, gold price, molybdenum price, mining costs, processing costs and capital development costs are shown in Figure 1-13, illustrating the impact of a 10% change in base assumptions on pre-tax NPV at 8%.
\\Bnefp01\Users$\Greg.Lane\My Documents\Current Projects\Current Studies\Constancia\Ni 43-101 Report Feb 2011\Ni 43-101 Report Rev 0 21 Feb.Doc Rev: 0 Date: 21 February 2011 9999FM0038 – 2
49
Figure 1-13 Pre-tax NPV sensitivity (@8%)
(400.0) (300.0) (200.0) (100.0) 100.0 200.0 300.0 400.0
Copper Spot Price
Silver Spot Price
Gold Spot Price
Moly Spot Price
Mining Cost
ProcessingCosts
DevelopmentCosts
Change in NPV (US$m)
Pre tax NPV Sensitivity (+/ 10%)
1.16.4 Post-tax analysis
1.16.4.1 Key cashflow assumptions (post-tax)
Norsemont commissioned a Peruvian tax specialist to assist in determining the impact of tax on the project post-tax cashflows and financial evaluations.
Tax and depreciation rates provided are summarised in Table 1-11.
Table 1-11 Tax and depreciation assumptions
Parameter
Corporate Tax Rate % 30.00%
Profit Distribution to Employees (pre-tax profits) % 8.00%
Tax Depreciation Rates Owned Fixed Plant %pa 20%Buildings %pa 5%
Leased Movable Plant %pa 50%Buildings %pa 20%
Pre-operating Costs 100% deductible in one year
ValueUnits
\\Bnefp01\Users$\Greg.Lane\My Documents\Current Projects\Current Studies\Constancia\Ni 43-101 Report Feb 2011\Ni 43-101 Report Rev 0 21 Feb.Doc Rev: 0 Date: 21 February 2011 9999FM0038 – 2
50
1.16.4.2 Summary of results (post-tax)
Based on the assumptions set out above, the project post-tax NPV at 8% is $811M and post-tax IRR is 23%. The project is expected to pay back the initial capital after 3 years (post-tax, undiscounted basis) of production.
1.16.4.3 Sensitivity analysis (post-tax)
As with the pre-tax analysis, the post-tax NPV and IRR are most sensitive to copper price. A 10% change in copper price from the base case of $2.50/lb results in a change in post-tax NPV at 8% of ±$220 M.
Figure 1-14 Post-tax NPV sensitivity (@8%)
Figure 1-15 Post-tax IRR Sensitivity
0%
5%
10%
15%
20%
25%
30%
35%
IRR(%)
Post tax IRR Sensitivity
Copper Spot Price
Silver Spot Price
Gold Spot Price
Moly Spot Price
Mining Cost
Processing Costs
Development Costs
\\Bnefp01\Users$\Greg.Lane\My Documents\Current Projects\Current Studies\Constancia\Ni 43-101 Report Feb 2011\Ni 43-101 Report Rev 0 21 Feb.Doc Rev: 0 Date: 21 February 2011 9999FM0038 – 2
51
The relative sensitivities for copper price, silver price, gold price, molybdenum price, mining costs, processing costs and capital development costs are shown in Figure 1-16, illustrating the impact of a 10% change in base assumptions on post-tax NPV at 8%.
Figure 1-16 Post-tax NPV Sensitivity (@8%)
(250.0) (200.0) (150.0) (100.0) (50.0) 50.0 100.0 150.0 200.0 250.0
Copper Spot Price
Silver Spot Price
Gold Spot Price
Moly Spot Price
Mining Cost
Processing Costs
DevelopmentCosts
Change in NPV (US$m)
Post tax NPV Sensitivity (+/ 10%)
1.17 Conclusions
1.17.1 Project overview
A FSO has been completed for the Constancia Project that focused on the mine and process plant schedules and updated the metal prices used to assess the project. The FSO was based on a DFS prepared by GRDMinproc that covered all disciplines, i.e. resource modelling, mining, metallurgical testwork, process design, plant and infrastructure design, project implementation, environmental and socioeconomic studies, and capital and operating cost estimates to ±15%.
A post-tax cashflow model indicates a Base Case NPV of $811 M and an IRR of 23%. However, these values do not take into account the financing costs required to develop the Project.
Project economics are most sensitive to the long-term copper price: a constant price of $2.50/lb has been assumed for the Base Case cashflow model. Other important economic variables are the total capital cost, treatment charges, the cost of diesel and the cost of electricity.
1.17.2 Risks and opportunities
The project risks identified in the 2009 Technical Report remain pertinent and are listed below:
Power supply - there is potential that all available capacity at the current supply point of Tintaya substation is secured by other parties. Should this occur, Norsemont would have to fund the additional capital cost of obtaining a supply from the more distant Cotaruse Substation.
\\Bnefp01\Users$\Greg.Lane\My Documents\Current Projects\Current Studies\Constancia\Ni 43-101 Report Feb 2011\Ni 43-101 Report Rev 0 21 Feb.Doc Rev: 0 Date: 21 February 2011 9999FM0038 – 2
52
Power Price - the price of electricity paid by Norsemont during operations will be subject to market conditions. Hence, competition for power may result in the cost of power being higher than the current assumption. Negotiations with the various organisations that generate and transmit power may allow more confidence on power pricing and availability. However, it is understood that firm commitments by government organisations can only be provided closer to the time of supply. In addition, the exchange rate from US dollars to New Soles has changed 12% from the DFS. These additional potential costs have not been included in the FSO operating costs.
Escalation - the estimate is based on pricing lower than that experienced in late 2008 at the peak of the market. Should commodity prices increase and market competition intensify then it is likely that the project will be exposed to price escalation.
Political - elections may coincide with the execution of the project, this has potential to affect both the project delivery and the project outcome through social conflict and civil unrest.
Pit geotechnical - geotechnical parameters are key criteria in the mine design, in particular the assessment for overall pit slope stability. Additional operating costs would be incurred if the pit slope stability estimates prove to be too optimistic.
Norsemont as Developer/Operator - the implementation strategy is based on Norsemont undertaking the overall project management role for the execution phase of the project, and constructing the bulk earthworks using its own construction fleet, in addition to the owner-operator role for the operations phase of the project. Significant project and construction management capabilities will be required by the Owner for this and particularly to ensure the timely completion of the bulk earthworks. This approach risks causing delay to the project schedule and prolongation claims from other contractors with liability falling on Norsemont. Cost increases arising from the need to employ additional staff to provide project management are a further risk.
To avoid delays to the construction schedule the relocation action plan must be implemented in Q2 2011. If these activities are delayed then there is a high likelihood that the construction schedule will not be met.
In addition, the FSO work updated only some aspects of the project and not all capital and operating costs were revised to Q4 2010 basis. Changes in the exchange rates and market conditions have therefore not been addressed in the cost basis for this report.
Opportunities exist to improve the Project in the following areas:
The comminution circuit is able to treat more than the 76 kt/d allowed in the current processing schedule for the first few years. As a result it will be possible to treat low margin ore and increase cash flow during this period.
The optimum grind size selection should consider the impact of hydrocyclone classification on copper and other heavy mineral/metal species. This is likely to result in a coarser optimum flotation feed size distribution, higher throughput and lower grinding circuit operating costs.
Detailed planning for the bulk earthworks and purchase of the Owners civil construction fleet would provide greater certainty on the capital and operating costs of the fleet.
Investigation of the availability of second hand accommodation camps has the potential to save cost.
Commencement of the project in Q2 2011 may allow the equipment lead times to be improved over those used in this report.
Early execution of Front End Engineering Design of the process plant will provide greater degree of scope definition and more definitive costing.
\\Bnefp01\Users$\Greg.Lane\My Documents\Current Projects\Current Studies\Constancia\Ni 43-101 Report Feb 2011\Ni 43-101 Report Rev 0 21 Feb.Doc Rev: 0 Date: 21 February 2011 9999FM0038 – 2
53
Detailed design of the improvement works for the access road upgrade will increase the level of confidence around the scope of works. In addition, accelerated completion of the access road upgrade will reduce transportation and travel risks and reduce travel time and delays.
1.18 Recommendations
1.18.1 Mineral resources Per the 2009 Technical Report, no further work required until a decision has been made to proceed to development.
1.18.2 Mining and mineral reserves The FSO pit designs include a quadrant where the probability of bench scale failure is 44%. The incremental costs associated with flattening the pit slope in this area should be assessed relative to the corresponding reduced probability of bench scale failures.
The fuel (diesel) and explosive unit prices used in the study should be confirmed by following up on the budget pricing submissions already requested from local suppliers.
The mining and civil construction fleets should be evaluated to determine any synergies that might improve project value.
Electric shovels and diesel drills have been assumed as the basis for the study. Further work should be performed to confirm the best approach considering capital and operating costs, mine operability and productivity to confirm the most suitable mine equipment solution.
1.18.3 Geotechnical and hydrogeological studies Selected geotechnical and hydrogeological investigations were recommended in the 2009 Technical Report to provide support for detailed engineering.
These included:
Additional field geotechnical investigations within the southern portion of the PAG WRF (limited investigations have been possible to date, due to access restrictions).
Investigations to evaluate the need for removing the extremely weathered diorite to significant depths beneath the TMF embankment.
Additional geotechnical characterisation of the tailings and waste rock materials.
Additional investigations in potential borrow areas to further characterise potential construction materials and refine the quantity estimates.
Within the mine pit, three additional geotechnical drill holes in the areas of Sectors VI and Sector VII are necessary to investigate the potential that locally observed geological faults may extend through this area.
Risk analysis to investigate the probability and consequences of a rock mass slide occurring over the access ramp, thereby removing access to the pit in the area of Sectors VI and VII.
Further hydrogeological investigations within the TMF and PAG WRF to confirm the criteria used in the design of these facilities. Within the PAG WRF, the objective will be to confirm the containment capacity of the existing design.
An investigation was underway to assess the potential influence of pit dewatering on the lakes and karstic area situated north of the pit. The investigation would include drilling, hydraulic testing and piezometer installations along the Yanak fault and within the lakes catchment area to assess the existing ground water system and the degree of hydraulic continuity and connection between the Yanak fault and lake basins.
\\Bnefp01\Users$\Greg.Lane\My Documents\Current Projects\Current Studies\Constancia\Ni 43-101 Report Feb 2011\Ni 43-101 Report Rev 0 21 Feb.Doc Rev: 0 Date: 21 February 2011 9999FM0038 – 2
54
A groundwater exploration program to assess the availability and quality of groundwater during drought conditions. Targets include: the Yanak fault south of the pit area and structures paralleling the Chilloroya valley below the glacial valley infill material.
The installation of additional groundwater monitoring and sampling wells for the following locations: (1) within Quebrada Telaracaca to monitor potential seepages from the PAG WRF via fault zones; (2) upgradient and downgradient of the PAG WRF within Quebrada Huayllachane; and (3) downgradient of the proposed plant site.
Field geotechnical investigations within the Llapa Orcco valley where the expansion of the PAG WRF will be constructed.
1.18.4 Process testwork and plant design Additional testwork was recommended in the 2009 Technical Report to investigate:
The potential to recover zinc concentrate as a saleable by-product
Improved silver recovery to copper concentrates
The potential to reduce the talc/amphibole content of the molybdenum concentrate
Norsemont has instigated further test work programs and these are still in progress.
1.18.5 Environmental and permitting
Norsemont submitted its ESIA on March 26th, 2010. The ESIA was approved following a public audience held in June 2010 which was attended by 1500 people within the area of direct and indirect influence on November 24, 2010. Approval for construction is expected at the end of Q4 2011.
\\Bnefp01\Users$\Greg.Lane\My Documents\Current Projects\Current Studies\Constancia\Ni 43-101 Report Feb 2011\Ni 43-101 Report Rev 0 21 Feb.Doc Rev: 0 Date: 21 February 2011 9999FM0038 – 2
55
2 INTRODUCTION
2.1 Background Norsemont is developing the Constancia (Cu-Mo-Ag) Project in Southern Peru, 100 km south of Cusco.
NI 43-101 compliant Technical Reports have previously been prepared for Norsemont in May 2008 and September 2009. GRDMinproc issued a final Definitive Feasibility Study (DFS) report on the project in January 2010.
Ausenco was appointed by Norsemont to undertake and manage Feasibility Study Optimisation (FSO) work which has included a further mine design (by SRK), comminution plant redesign and development of capital and operating costs for that scope of work. Knight Piesold updated its DFS input based on the FSO outcomes. The 2009 Technical Report, the DFS and the FSO form the basis of this Technical Report.
The Constancia deposit is a large-scale porphyry copper orebody located 4100 m above sea level (masl) in the Andes Mountains. The proposal is to develop a Project comprising open pit mining and flotation of sulfide minerals, to produce commercial grade concentrates of copper and molybdenum. Silver and a small quantity of gold at payable levels would report to the copper concentrate.
The Project is largely self-contained, with mine, mill, maintenance facilities, administration and fully serviced accommodation camp located on the mine site. Supporting infrastructure includes a power line to bring power from an upgraded supply point on the national grid at Tintaya, 70 km away. The public road to site will be upgraded to meet demands of extra traffic, particularly concentrate trucks and freight services. Raw water will be extracted from bores surrounding the open pit, and a tailings dam will be constructed within 5 km of the mine, on land owned freehold by Norsemont.
This report has been prepared in accordance with Form 43-101F (the “Technical Report”) of the Canadian Securities Administrators National Instrument 43-101 (NI 43-101).
2.2 Scope of Work
Ausenco’s scope for the FSO was to manage the following activities:
Review and optimise the cost and design of the comminution circuit to allow the processing of 76 kt/d of ore for life of mine (LOM)
Develop a new mine design, mine plan and mine schedule to suit revised processing and cost models (all done by SRK)
Review the remainder to the plant and associated infrastructure for the project and advise Norsemont of any necessary changes
Review and revise the mining capital and operating costs (by SRK)
Review and revise the plant operating and capital costs for the comminution circuit
Revise the overall project capital and operating costs to incorporate the FSO and DFS costs, as appropriate
Prepare a financial analysis, including post-production (i.e. off-site) costs, and provide a pre-tax economic evaluation of the Project
Manage the preparation of a FSO report
\\Bnefp01\Users$\Greg.Lane\My Documents\Current Projects\Current Studies\Constancia\Ni 43-101 Report Feb 2011\Ni 43-101 Report Rev 0 21 Feb.Doc Rev: 0 Date: 21 February 2011 9999FM0038 – 2
56
Manage the preparation of a revised NI 43-101 report that reflects the changes made to the project with major contributions from Norsemont, SRK and Knight Piésold.
Norsemont engaged the following consultants in addition to Ausenco and SRK:
Knight Piésold was responsible for site geotechnical investigations, and design and costing of the waste rock and tailings storage facilities, and water management systems.
SIGT S.A., a Peruvian consulting company which provides services in design and supervision of roads and highways, supervised the design and costing for the access road to the project for the DFS and 2009 Technical Report.
CESEL S.A. undertook design and costing for the Constancia project HV power line and sub-stations for the DFS and 2009 Technical Report.
Jorge Picon, financial consultant to Norsemont, was responsible for the preparation of the post-tax financial model input for the DFS, 2009 Technical Report and confirmed the post-tax financial model for this report.
MWH Peru S.A. through its subsidiary Ground Water International S.A. undertook hydrogeological studies for the DFS and 2009 Technical Report.
2.3 Sources of Information
The geology, resource estimate and metallurgical testwork program are discussed in detail in the 2009 Technical Report.
Rates and bulk materials prices from the cost estimates used for the DFS were reviewed by Ausenco, SRK and Knight Piésold and used for the capital cost estimate in this report.
Operating cost information from the DFS was reviewed by Ausenco, SRK and Knight Piésold and revised based on the FSO outcomes using DFS base costs.
2.4 Site Inspections
Mr Dino Pilotto of SRK visited the project site on 25 and 26 January, 2011.
See Section 2.4 of the 2009 Technical Report for other relevant site inspection details.
2.5 Contributions to This Report The major contributors to this report are listed below:
Overall management and editorial responsibility was by Mr Greg Lane and Mr Andrew See of Ausenco. Ausenco updated the design and costs for the comminution circuit and revised the overall plant layout to suit the revised design.
Mine design, mine planning, mine scheduling, mine operating and capital costs were by Mr Dino Pilotto of SRK.
Geotechnical input for pit stability was by Mr Robert Cummings of Saguaro Geoservices, Inc.
Geotechnical and design input for site earthworks structures were by Mr Tom Kerr and Mr Gilberto Dominguez of Knight Piésold.
Taxation opinions were supplied by Picon & Associates, 12 January, 2011.
Norsemont supplied historical data related to the past work by GRD Minproc for the DFS and past Technical Reports, and all data relating to exploration, drilling and environmental and social matters.
2.6 Disclosure of Interest
Ausenco is not an associate or affiliate of Norsemont, or of any associated company.

\\Bnefp01\Users$\Greg.Lane\My Documents\Current Projects\Current Studies\Constancia\Ni 43-101 Report Feb 2011\Ni 43-101 Report Rev 0 21 Feb.Doc Rev: 0 Date: 21 February 2011 9999FM0038 – 2
57
Ausenco’s fee for this Technical Report is not dependent in whole or part on any prior or future engagement or understanding resulting from the conclusions of this report. The fee is in accordance with standard industry fees for work of this nature.
\\Bnefp01\Users$\Greg.Lane\My Documents\Current Projects\Current Studies\Constancia\Ni 43-101 Report Feb 2011\Ni 43-101 Report Rev 0 21 Feb.Doc Rev: 0 Date: 21 February 2011 9999FM0038 – 2
58
3 RELIANCE ON OTHER EXPERTS In preparing this report, Ausenco has relied on input from Norsemont, a number of well qualified independent consulting groups as recorded in Section 2.5 of this report, and the 2009 Technical Report.
Data and reports on the status of mining concessions, metallurgical testwork, process design, infrastructure design, hydrological, hydrogeological and geotechnical investigations and recommendations, off-site infrastructure engineering, environmental and legal matters, permits and licences and taxation for the financial analysis were reported in the 2009 Technical Report and have been relied on as the basis of this report.
Specific information provided by Norsemont and its consultants includes:
Exploration and drilling status reporting
Environmental approvals and permit status
Metal prices
Treatment charges
Transport costs (road, port and shipping)
Access road upgrade costs, through Norsemont’s sub-contractor SIGT
Power cost, including power transmission, through Norsemont’s sub-contractor CESEL
Diesel cost, delivered, including storage and dispensing
Exchange rates
Information concerning operations management such as organisational structure, labour conditions (sourcing, salaries and on-costs, transport), camp services and maintenance.
Gaston Loyola, Vice President Exploration for Norsemont was responsible for Norsemont’s exploration, drilling, sampling and data quality activities as described in Sections 5 to 13, 15 and for Norsemont’s geological modelling in Section 17.
Carol Fries, Vice President Health, Safety, Environment and Community Relations for Norsemont was responsible for the preparation of the Environmental Social Impact Assessment and the preparation of information provided in Sections 5 and 18.
A project cashflow model was prepared by Ausenco based on data reported herein, a draft template provided by Norsemont and a taxation opinion by Picon & Associates.
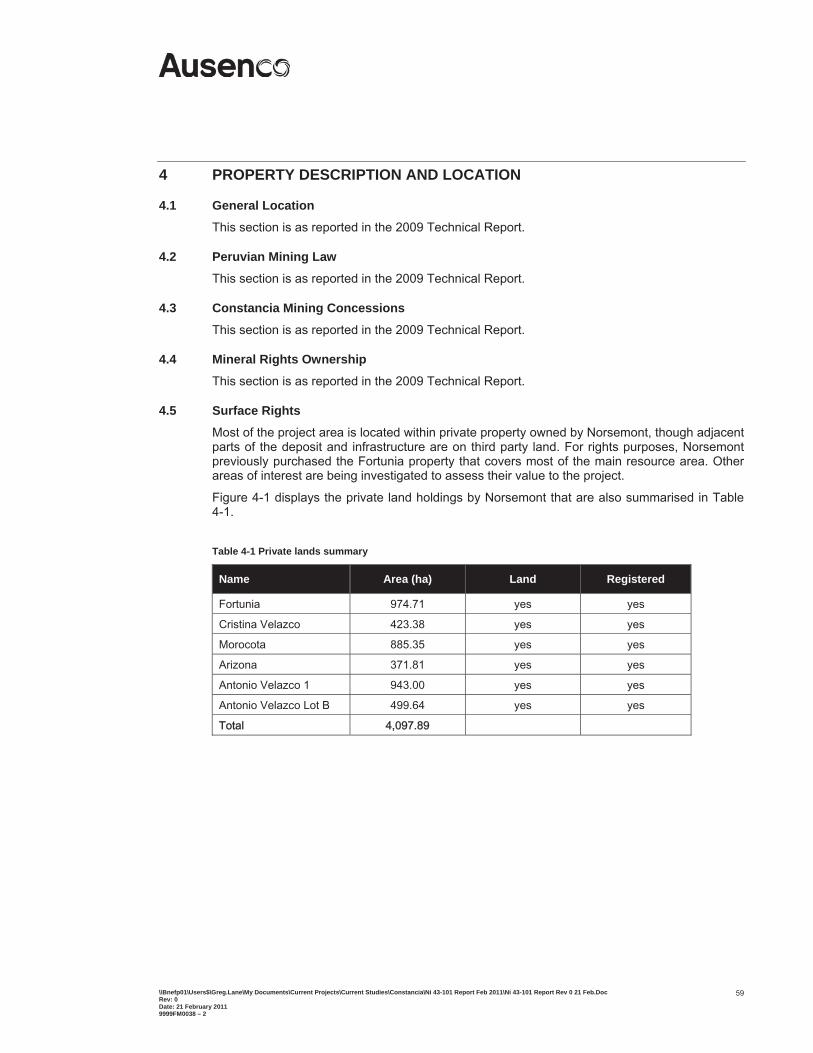
\\Bnefp01\Users$\Greg.Lane\My Documents\Current Projects\Current Studies\Constancia\Ni 43-101 Report Feb 2011\Ni 43-101 Report Rev 0 21 Feb.Doc Rev: 0 Date: 21 February 2011 9999FM0038 – 2
59
4 PROPERTY DESCRIPTION AND LOCATION
4.1 General Location This section is as reported in the 2009 Technical Report.
4.2 Peruvian Mining Law This section is as reported in the 2009 Technical Report.
4.3 Constancia Mining Concessions
This section is as reported in the 2009 Technical Report.
4.4 Mineral Rights Ownership
This section is as reported in the 2009 Technical Report.
4.5 Surface Rights Most of the project area is located within private property owned by Norsemont, though adjacent parts of the deposit and infrastructure are on third party land. For rights purposes, Norsemont previously purchased the Fortunia property that covers most of the main resource area. Other areas of interest are being investigated to assess their value to the project.
Figure 4-1 displays the private land holdings by Norsemont that are also summarised in Table 4-1.
Table 4-1 Private lands summary
Name Area (ha) Land Registered
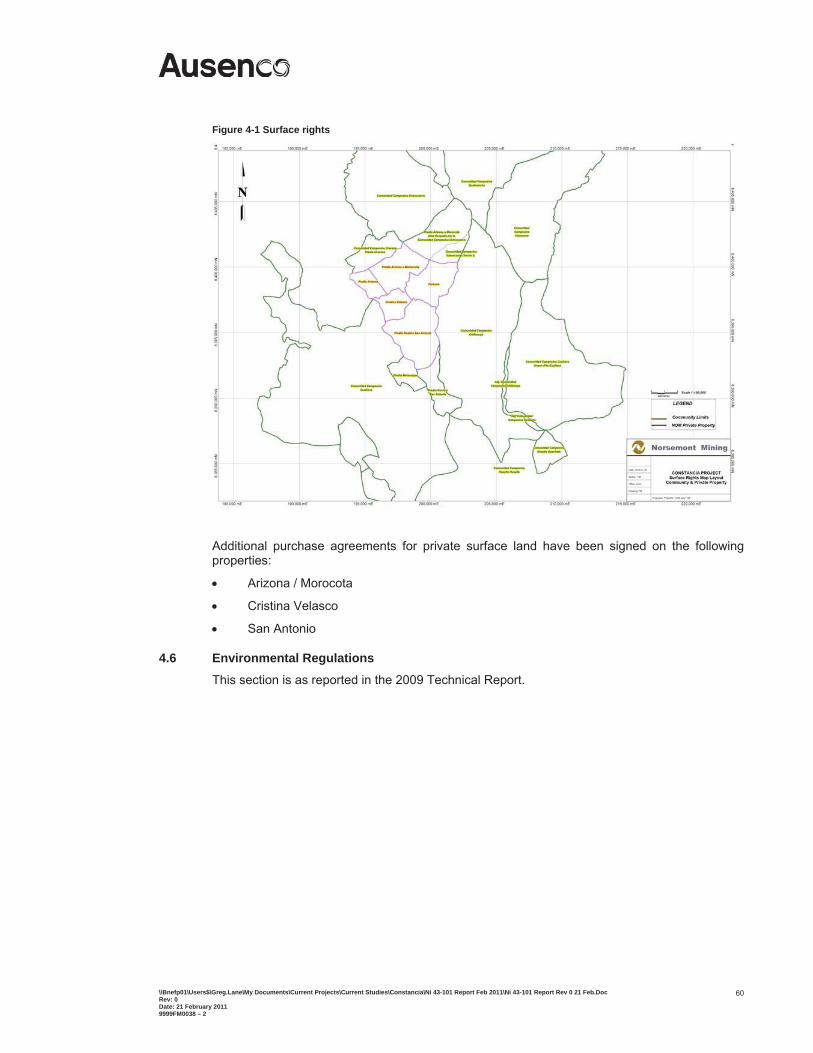
\\Bnefp01\Users$\Greg.Lane\My Documents\Current Projects\Current Studies\Constancia\Ni 43-101 Report Feb 2011\Ni 43-101 Report Rev 0 21 Feb.Doc Rev: 0 Date: 21 February 2011 9999FM0038 – 2
60
Figure 4-1 Surface rights
Additional purchase agreements for private surface land have been signed on the following properties:
Arizona / Morocota
Cristina Velasco
San Antonio
4.6 Environmental Regulations
This section is as reported in the 2009 Technical Report.

\\Bnefp01\Users$\Greg.Lane\My Documents\Current Projects\Current Studies\Constancia\Ni 43-101 Report Feb 2011\Ni 43-101 Report Rev 0 21 Feb.Doc Rev: 0 Date: 21 February 2011 9999FM0038 – 2
61
5 ACCESSIBILITY, CLIMATE, LOCAL RESOURCES, INFRASTRUCTURE AND PHYSIOGRAPHYThis section is as reported in the 2009 Technical Report.

\\Bnefp01\Users$\Greg.Lane\My Documents\Current Projects\Current Studies\Constancia\Ni 43-101 Report Feb 2011\Ni 43-101 Report Rev 0 21 Feb.Doc Rev: 0 Date: 21 February 2011 9999FM0038 – 2
62
6 HISTORY This section is as reported in the 2009 Technical Report.

\\Bnefp01\Users$\Greg.Lane\My Documents\Current Projects\Current Studies\Constancia\Ni 43-101 Report Feb 2011\Ni 43-101 Report Rev 0 21 Feb.Doc Rev: 0 Date: 21 February 2011 9999FM0038 – 2
63
7 GEOLOGICAL SETTING This section is as reported in the 2009 Technical Report.

\\Bnefp01\Users$\Greg.Lane\My Documents\Current Projects\Current Studies\Constancia\Ni 43-101 Report Feb 2011\Ni 43-101 Report Rev 0 21 Feb.Doc Rev: 0 Date: 21 February 2011 9999FM0038 – 2
64
8 DEPOSIT TYPES This section is as reported in the 2009 Technical Report.

\\Bnefp01\Users$\Greg.Lane\My Documents\Current Projects\Current Studies\Constancia\Ni 43-101 Report Feb 2011\Ni 43-101 Report Rev 0 21 Feb.Doc Rev: 0 Date: 21 February 2011 9999FM0038 – 2
65
9 MINERALISATION AND ALTERATION This section is as reported in the 2009 Technical Report.
\\Bnefp01\Users$\Greg.Lane\My Documents\Current Projects\Current Studies\Constancia\Ni 43-101 Report Feb 2011\Ni 43-101 Report Rev 0 21 Feb.Doc Rev: 0 Date: 21 February 2011 9999FM0038 – 2
66
10 EXPLORATION
This section has been updated by Norsemont to reflect the status of exploration as of 8 January 2011. Exploration is continuing in the project area, and is focused on areas and targets described in the following sub-sections. The exploration and drilling data provided by Norsemont is included in this report to capture the current status of the overall Constancia Project. Norsemont has previously disclosed this information in separate releases.
10.1 Surface Mapping and Sampling During the first quarter of 2007, geological mapping at 1:1000 scale was conducted at the Constancia deposit, covering an area of approximately 450 hectares. Owing to the scarcity of outcrops, most of this mapping was carried out along roadcuts, and combined with information from some trenches. First rock intercepts from drill holes were also used to help define the different rock types at surface. Locations were based on GPS measurements.
From April to October 2008, surface mapping was focused on the areas where geophysical anomalies were identified at depth as well as surface reconnaissance of the areas for future waste dump and plant facilities. By October 2008, an additional 2200 hectares were mapped at 1:2000 and 1:5000 scale including the collection of >900 rock samples and 41 stream sediment samples, the latter in the eastern sector of the Constancia deposit where scattered gold occurrences were observed in an area of 4.5 km by 0.8 km, now known as the Pampacancha prospect. Surface mapping resumed in mid-February 2009 to the south of the Pampacancha prospect (SE of the Constancia deposit), and the Arizona and San Antonio areas, the site of the future tailings management facility (TMF).. By the end of March 2009, an additional 1500 hectares had been mapped and about 350 rock samples collected. From April to June 2009 mapping was carried out in the Chilloroya South area, where evidence of porphyry-related copper-gold-molybdenum was found. From February to June 2010, mapping was focused on the Norsemont properties located to the west of the project site, in the vicinity of the Uchucarco village, and the Norsemont owned Arizona-Morocota and Fortunia areas.
In summary, throughout 2007 to 2010, 11 444 hectares were mapped in the Constancia project at several scales, including 1:1000, 1:2000 and 1:5000. Of this, 8 905 hectares were mapped on Norsemont mining concessions, which represents 39% of the total Norsemont mining rights in the area. Additionally, 2595 rock samples and 41 stream sediments samples were collected during this period.
10.2 Geophysics
An in-house interpretation of the geophysical data along with interpretation of available surface mapping and rock and stream sediment geochemistry helped identify several targets within the project area. Currently, the most important are the anomalies associated with the Pampacancha prospect, the chargeability-magnetic anomalies observed in the Chilloroya South prospect and the chargeability anomalies located in Uchucarco, 3.8 km NE of the Constancia porphyry.
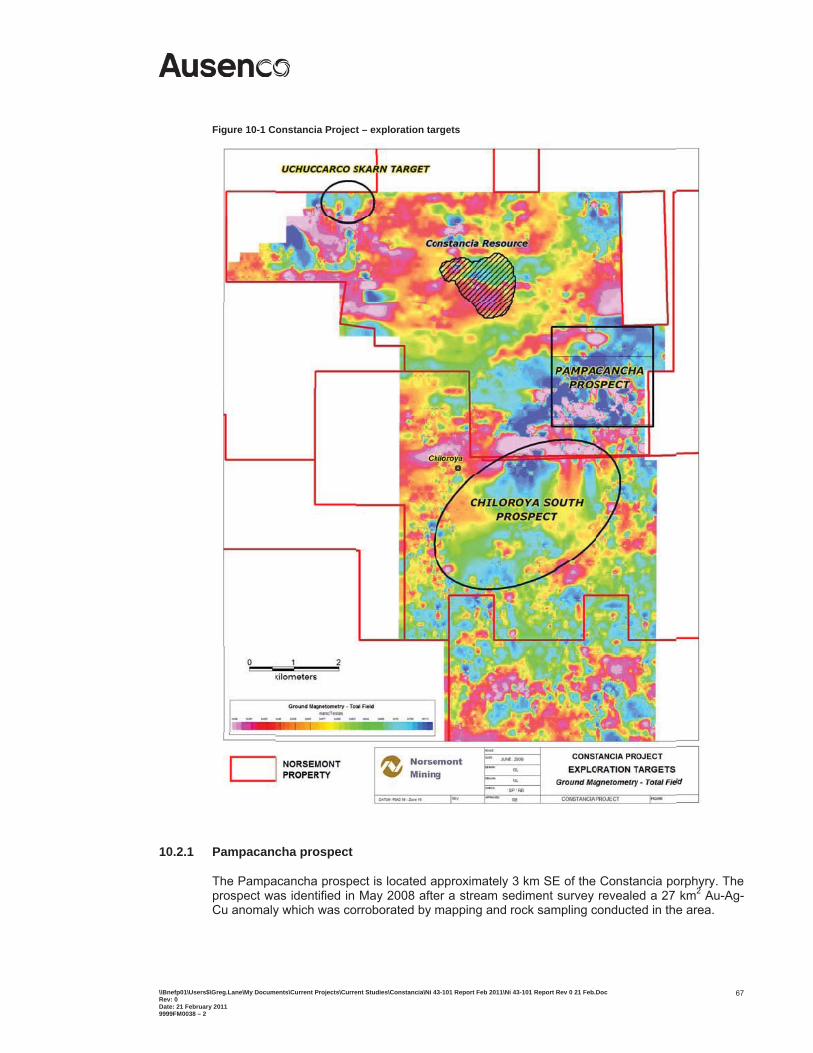
\\Bnefp01\Users$\Greg.Lane\My Documents\Current Projects\Current Studies\Constancia\Ni 43-101 Report Feb 2011\Ni 43-101 Report Rev 0 21 Feb.Doc Rev: 0 Date: 21 February 2011 9999FM0038 – 2
67
Figure 10-1 Constancia Project – exploration targets
10.2.1 Pampacancha prospect
The Pampacancha prospect is located approximately 3 km SE of the Constancia porphyry. The prospect was identified in May 2008 after a stream sediment survey revealed a 27 km2 Au-Ag-Cu anomaly which was corroborated by mapping and rock sampling conducted in the area.
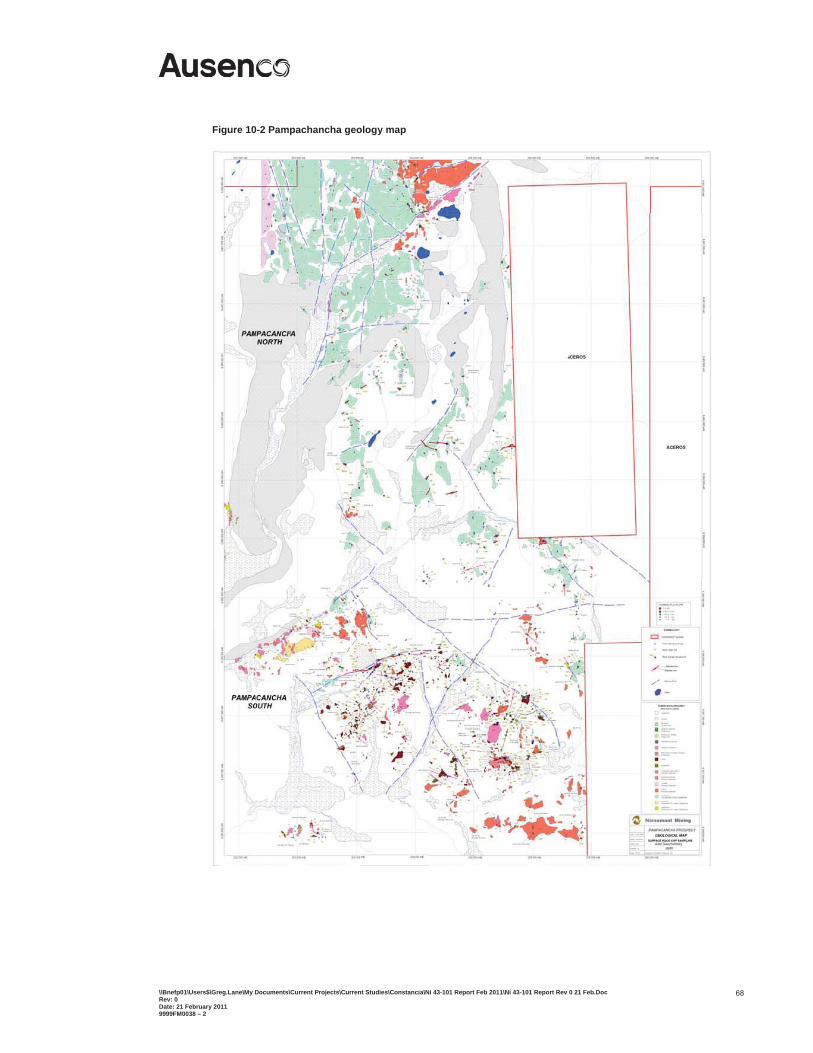
\\Bnefp01\Users$\Greg.Lane\My Documents\Current Projects\Current Studies\Constancia\Ni 43-101 Report Feb 2011\Ni 43-101 Report Rev 0 21 Feb.Doc Rev: 0 Date: 21 February 2011 9999FM0038 – 2
68
Figure 10-2 Pampachancha geology map
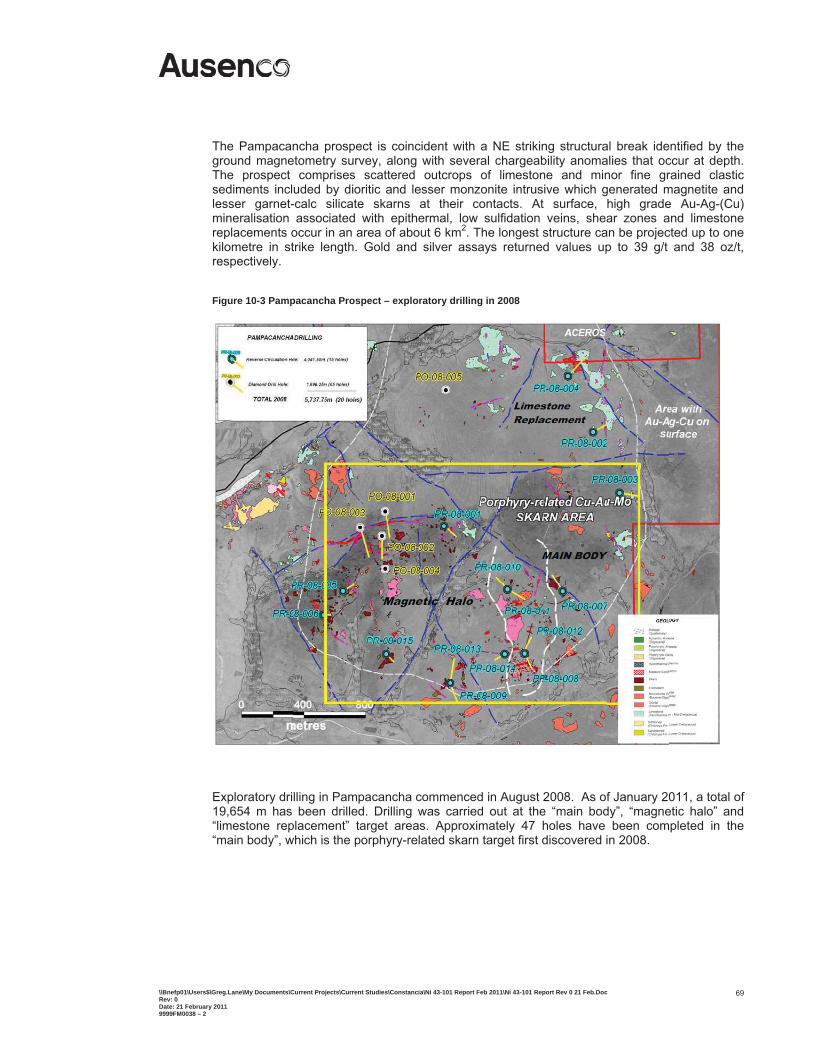
\\Bnefp01\Users$\Greg.Lane\My Documents\Current Projects\Current Studies\Constancia\Ni 43-101 Report Feb 2011\Ni 43-101 Report Rev 0 21 Feb.Doc Rev: 0 Date: 21 February 2011 9999FM0038 – 2
69
The Pampacancha prospect is coincident with a NE striking structural break identified by the ground magnetometry survey, along with several chargeability anomalies that occur at depth. The prospect comprises scattered outcrops of limestone and minor fine grained clastic sediments included by dioritic and lesser monzonite intrusive which generated magnetite and lesser garnet-calc silicate skarns at their contacts. At surface, high grade Au-Ag-(Cu) mineralisation associated with epithermal, low sulfidation veins, shear zones and limestone replacements occur in an area of about 6 km2. The longest structure can be projected up to one kilometre in strike length. Gold and silver assays returned values up to 39 g/t and 38 oz/t, respectively.
Figure 10-3 Pampacancha Prospect – exploratory drilling in 2008
Exploratory drilling in Pampacancha commenced in August 2008. As of January 2011, a total of 19,654 m has been drilled. Drilling was carried out at the “main body”, “magnetic halo” and “limestone replacement” target areas. Approximately 47 holes have been completed in the “main body”, which is the porphyry-related skarn target first discovered in 2008.
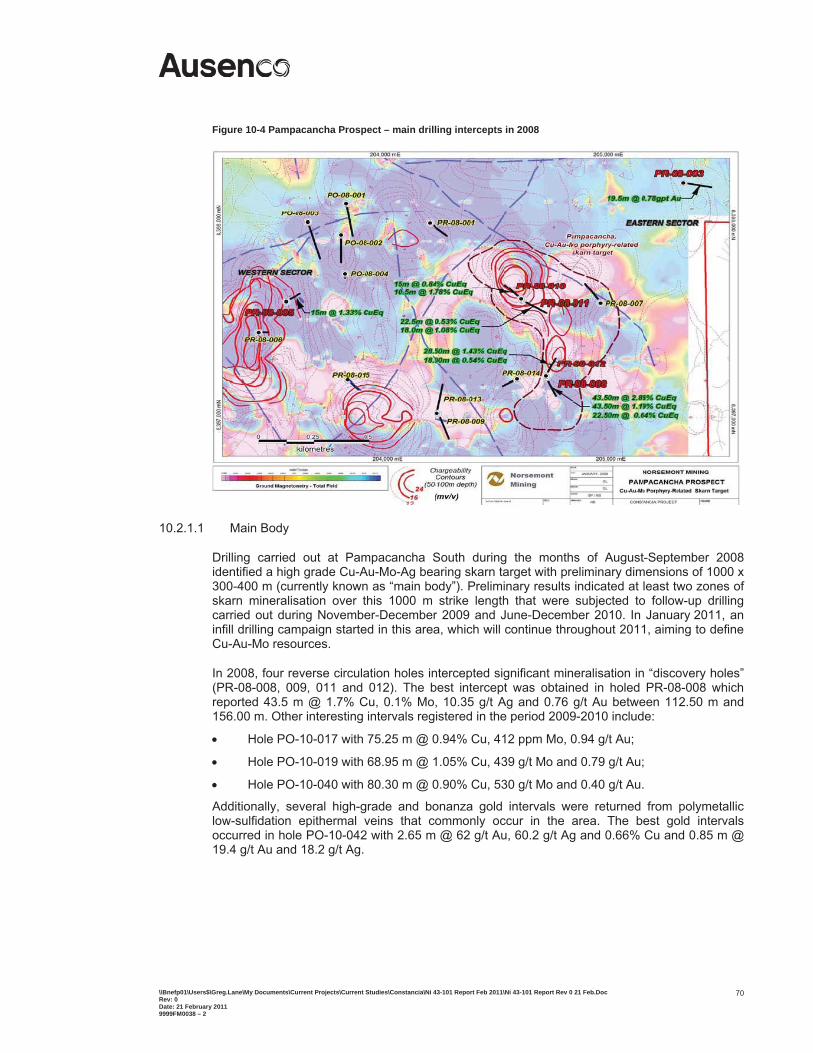
\\Bnefp01\Users$\Greg.Lane\My Documents\Current Projects\Current Studies\Constancia\Ni 43-101 Report Feb 2011\Ni 43-101 Report Rev 0 21 Feb.Doc Rev: 0 Date: 21 February 2011 9999FM0038 – 2
70
Figure 10-4 Pampacancha Prospect – main drilling intercepts in 2008
10.2.1.1 Main Body
Drilling carried out at Pampacancha South during the months of August-September 2008 identified a high grade Cu-Au-Mo-Ag bearing skarn target with preliminary dimensions of 1000 x 300-400 m (currently known as “main body”). Preliminary results indicated at least two zones of skarn mineralisation over this 1000 m strike length that were subjected to follow-up drilling carried out during November-December 2009 and June-December 2010. In January 2011, an infill drilling campaign started in this area, which will continue throughout 2011, aiming to define Cu-Au-Mo resources.
In 2008, four reverse circulation holes intercepted significant mineralisation in “discovery holes” (PR-08-008, 009, 011 and 012). The best intercept was obtained in holed PR-08-008 which reported 43.5 m @ 1.7% Cu, 0.1% Mo, 10.35 g/t Ag and 0.76 g/t Au between 112.50 m and 156.00 m. Other interesting intervals registered in the period 2009-2010 include:
Hole PO-10-017 with 75.25 m @ 0.94% Cu, 412 ppm Mo, 0.94 g/t Au;
Hole PO-10-019 with 68.95 m @ 1.05% Cu, 439 g/t Mo and 0.79 g/t Au;
Hole PO-10-040 with 80.30 m @ 0.90% Cu, 530 g/t Mo and 0.40 g/t Au.
Additionally, several high-grade and bonanza gold intervals were returned from polymetallic low-sulfidation epithermal veins that commonly occur in the area. The best gold intervals occurred in hole PO-10-042 with 2.65 m @ 62 g/t Au, 60.2 g/t Ag and 0.66% Cu and 0.85 m @ 19.4 g/t Au and 18.2 g/t Ag.
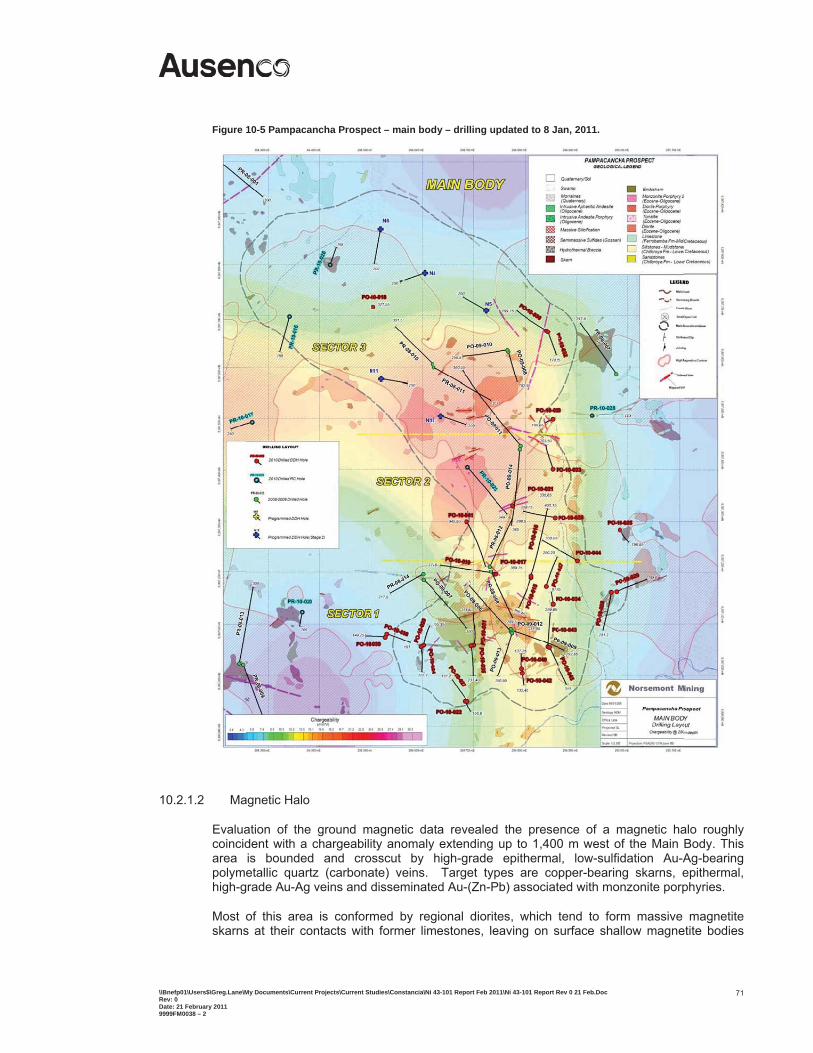
\\Bnefp01\Users$\Greg.Lane\My Documents\Current Projects\Current Studies\Constancia\Ni 43-101 Report Feb 2011\Ni 43-101 Report Rev 0 21 Feb.Doc Rev: 0 Date: 21 February 2011 9999FM0038 – 2
71
Figure 10-5 Pampacancha Prospect – main body – drilling updated to 8 Jan, 2011.
10.2.1.2 Magnetic Halo
Evaluation of the ground magnetic data revealed the presence of a magnetic halo roughly coincident with a chargeability anomaly extending up to 1,400 m west of the Main Body. This area is bounded and crosscut by high-grade epithermal, low-sulfidation Au-Ag-bearing polymetallic quartz (carbonate) veins. Target types are copper-bearing skarns, epithermal, high-grade Au-Ag veins and disseminated Au-(Zn-Pb) associated with monzonite porphyries.
Most of this area is conformed by regional diorites, which tend to form massive magnetite skarns at their contacts with former limestones, leaving on surface shallow magnetite bodies
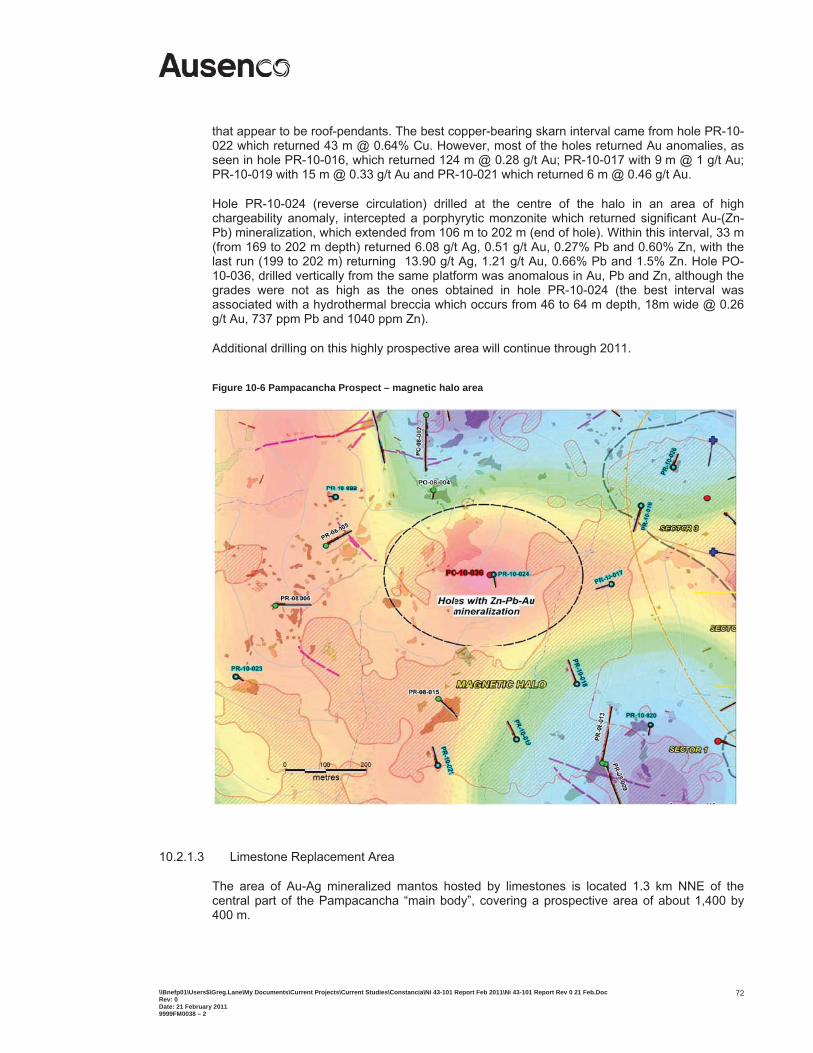
\\Bnefp01\Users$\Greg.Lane\My Documents\Current Projects\Current Studies\Constancia\Ni 43-101 Report Feb 2011\Ni 43-101 Report Rev 0 21 Feb.Doc Rev: 0 Date: 21 February 2011 9999FM0038 – 2
72
that appear to be roof-pendants. The best copper-bearing skarn interval came from hole PR-10-022 which returned 43 m @ 0.64% Cu. However, most of the holes returned Au anomalies, as seen in hole PR-10-016, which returned 124 m @ 0.28 g/t Au; PR-10-017 with 9 m @ 1 g/t Au; PR-10-019 with 15 m @ 0.33 g/t Au and PR-10-021 which returned 6 m @ 0.46 g/t Au.
Hole PR-10-024 (reverse circulation) drilled at the centre of the halo in an area of high chargeability anomaly, intercepted a porphyrytic monzonite which returned significant Au-(Zn-Pb) mineralization, which extended from 106 m to 202 m (end of hole). Within this interval, 33 m (from 169 to 202 m depth) returned 6.08 g/t Ag, 0.51 g/t Au, 0.27% Pb and 0.60% Zn, with the last run (199 to 202 m) returning 13.90 g/t Ag, 1.21 g/t Au, 0.66% Pb and 1.5% Zn. Hole PO-10-036, drilled vertically from the same platform was anomalous in Au, Pb and Zn, although the grades were not as high as the ones obtained in hole PR-10-024 (the best interval was associated with a hydrothermal breccia which occurs from 46 to 64 m depth, 18m wide @ 0.26 g/t Au, 737 ppm Pb and 1040 ppm Zn).
Additional drilling on this highly prospective area will continue through 2011.
Figure 10-6 Pampacancha Prospect – magnetic halo area
10.2.1.3 Limestone Replacement Area
The area of Au-Ag mineralized mantos hosted by limestones is located 1.3 km NNE of the central part of the Pampacancha “main body”, covering a prospective area of about 1,400 by 400 m.
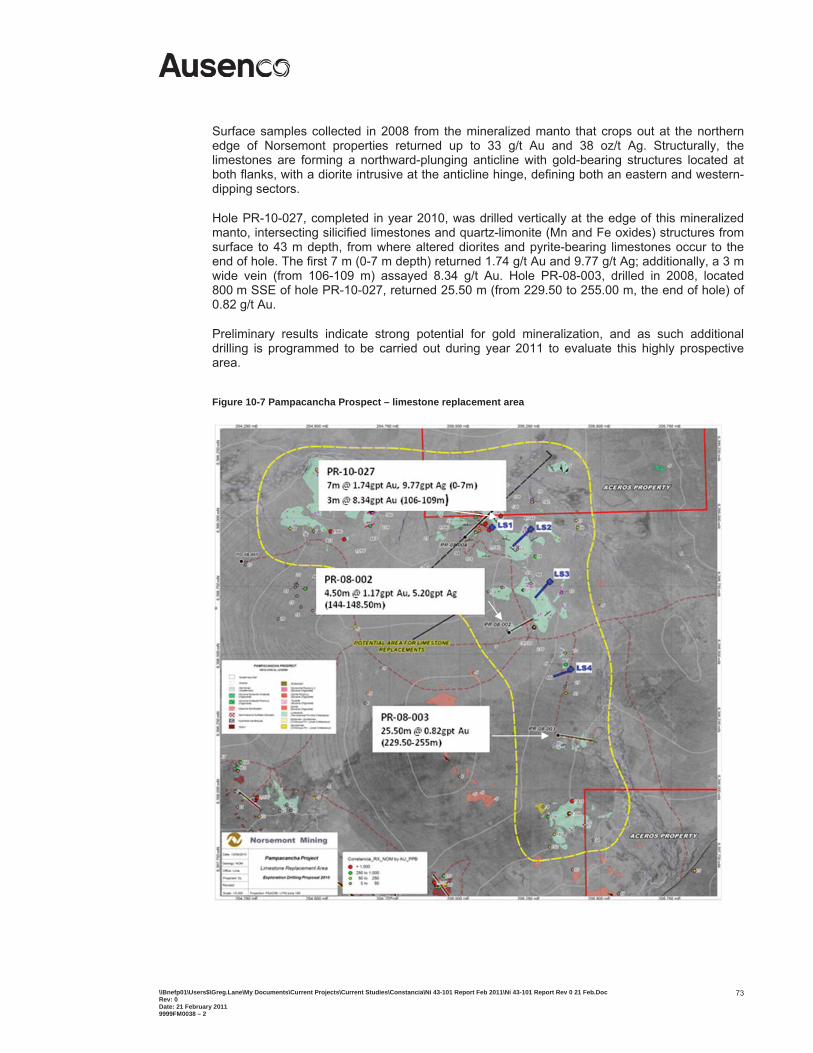
\\Bnefp01\Users$\Greg.Lane\My Documents\Current Projects\Current Studies\Constancia\Ni 43-101 Report Feb 2011\Ni 43-101 Report Rev 0 21 Feb.Doc Rev: 0 Date: 21 February 2011 9999FM0038 – 2
73
Surface samples collected in 2008 from the mineralized manto that crops out at the northern edge of Norsemont properties returned up to 33 g/t Au and 38 oz/t Ag. Structurally, the limestones are forming a northward-plunging anticline with gold-bearing structures located at both flanks, with a diorite intrusive at the anticline hinge, defining both an eastern and western-dipping sectors.
Hole PR-10-027, completed in year 2010, was drilled vertically at the edge of this mineralized manto, intersecting silicified limestones and quartz-limonite (Mn and Fe oxides) structures from surface to 43 m depth, from where altered diorites and pyrite-bearing limestones occur to the end of hole. The first 7 m (0-7 m depth) returned 1.74 g/t Au and 9.77 g/t Ag; additionally, a 3 m wide vein (from 106-109 m) assayed 8.34 g/t Au. Hole PR-08-003, drilled in 2008, located 800 m SSE of hole PR-10-027, returned 25.50 m (from 229.50 to 255.00 m, the end of hole) of 0.82 g/t Au.
Preliminary results indicate strong potential for gold mineralization, and as such additional drilling is programmed to be carried out during year 2011 to evaluate this highly prospective area.
Figure 10-7 Pampacancha Prospect – limestone replacement area
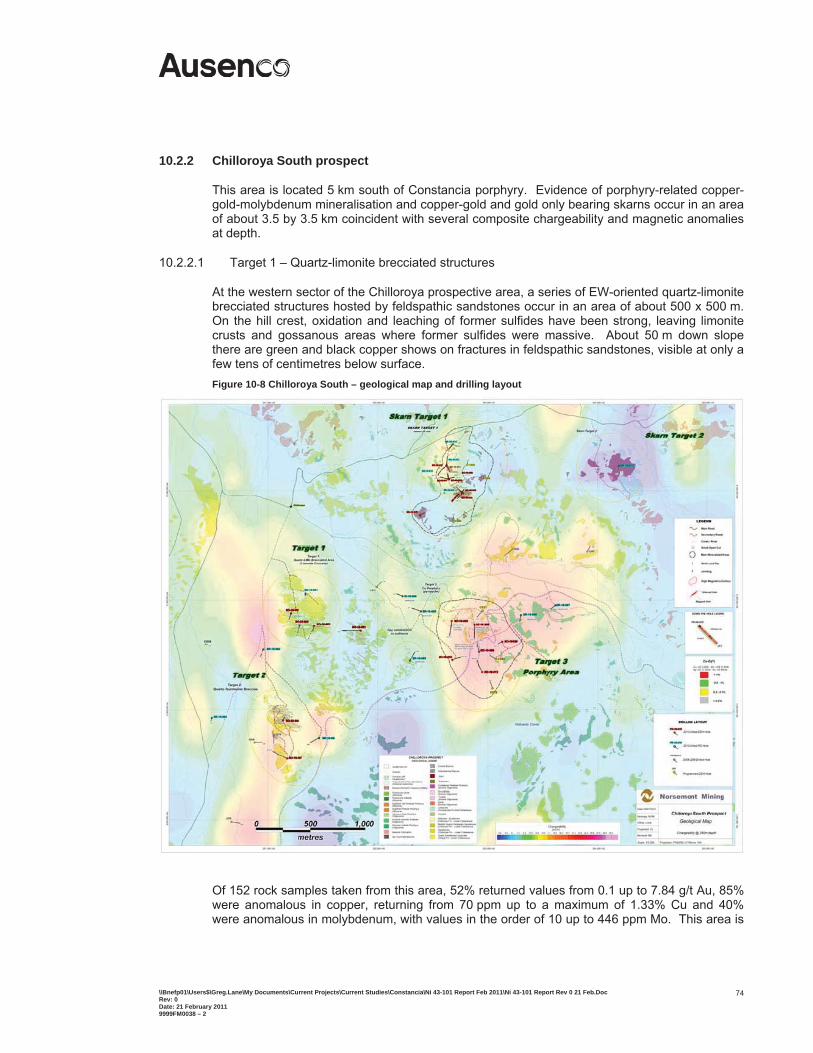
\\Bnefp01\Users$\Greg.Lane\My Documents\Current Projects\Current Studies\Constancia\Ni 43-101 Report Feb 2011\Ni 43-101 Report Rev 0 21 Feb.Doc Rev: 0 Date: 21 February 2011 9999FM0038 – 2
74
10.2.2 Chilloroya South prospect
This area is located 5 km south of Constancia porphyry. Evidence of porphyry-related copper-gold-molybdenum mineralisation and copper-gold and gold only bearing skarns occur in an area of about 3.5 by 3.5 km coincident with several composite chargeability and magnetic anomalies at depth.
10.2.2.1 Target 1 – Quartz-limonite brecciated structures
At the western sector of the Chilloroya prospective area, a series of EW-oriented quartz-limonite brecciated structures hosted by feldspathic sandstones occur in an area of about 500 x 500 m. On the hill crest, oxidation and leaching of former sulfides have been strong, leaving limonite crusts and gossanous areas where former sulfides were massive. About 50 m down slope there are green and black copper shows on fractures in feldspathic sandstones, visible at only a few tens of centimetres below surface. Figure 10-8 Chilloroya South – geological map and drilling layout
Of 152 rock samples taken from this area, 52% returned values from 0.1 up to 7.84 g/t Au, 85% were anomalous in copper, returning from 70 ppm up to a maximum of 1.33% Cu and 40% were anomalous in molybdenum, with values in the order of 10 up to 446 ppm Mo. This area is
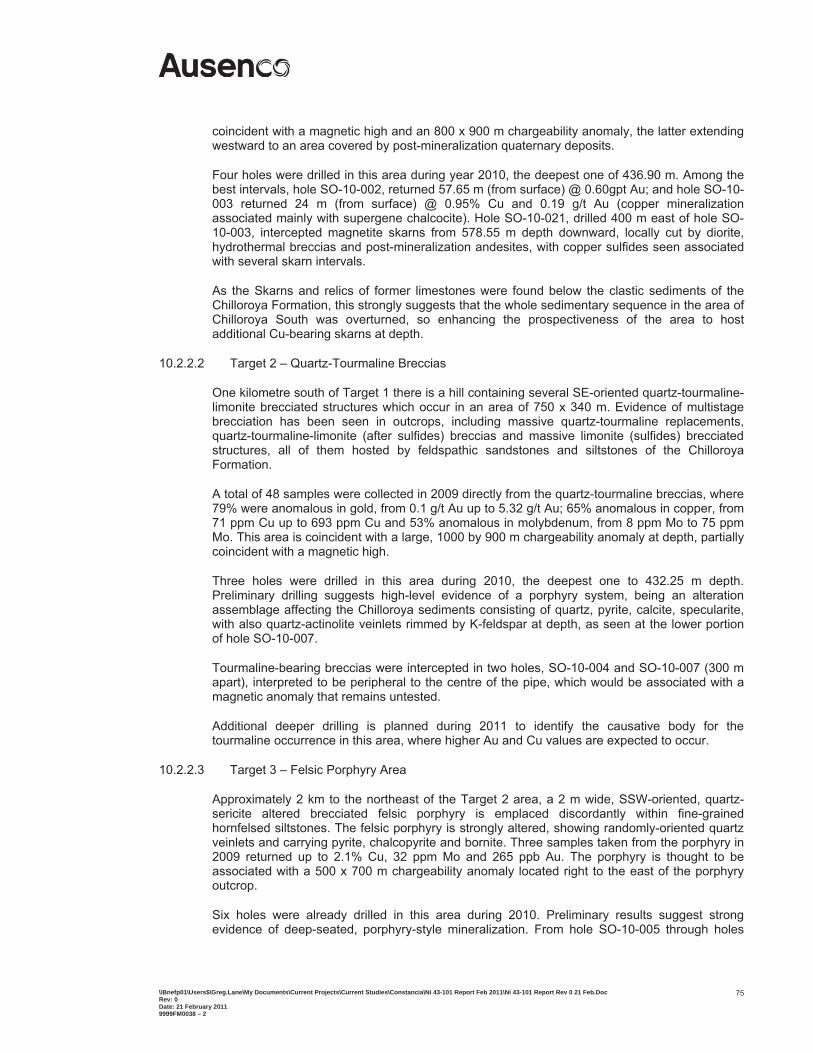
\\Bnefp01\Users$\Greg.Lane\My Documents\Current Projects\Current Studies\Constancia\Ni 43-101 Report Feb 2011\Ni 43-101 Report Rev 0 21 Feb.Doc Rev: 0 Date: 21 February 2011 9999FM0038 – 2
75
coincident with a magnetic high and an 800 x 900 m chargeability anomaly, the latter extending westward to an area covered by post-mineralization quaternary deposits.
Four holes were drilled in this area during year 2010, the deepest one of 436.90 m. Among the best intervals, hole SO-10-002, returned 57.65 m (from surface) @ 0.60gpt Au; and hole SO-10-003 returned 24 m (from surface) @ 0.95% Cu and 0.19 g/t Au (copper mineralization associated mainly with supergene chalcocite). Hole SO-10-021, drilled 400 m east of hole SO-10-003, intercepted magnetite skarns from 578.55 m depth downward, locally cut by diorite, hydrothermal breccias and post-mineralization andesites, with copper sulfides seen associated with several skarn intervals.
As the Skarns and relics of former limestones were found below the clastic sediments of the Chilloroya Formation, this strongly suggests that the whole sedimentary sequence in the area of Chilloroya South was overturned, so enhancing the prospectiveness of the area to host additional Cu-bearing skarns at depth.
10.2.2.2 Target 2 – Quartz-Tourmaline Breccias
One kilometre south of Target 1 there is a hill containing several SE-oriented quartz-tourmaline-limonite brecciated structures which occur in an area of 750 x 340 m. Evidence of multistage brecciation has been seen in outcrops, including massive quartz-tourmaline replacements, quartz-tourmaline-limonite (after sulfides) breccias and massive limonite (sulfides) brecciated structures, all of them hosted by feldspathic sandstones and siltstones of the Chilloroya Formation.
A total of 48 samples were collected in 2009 directly from the quartz-tourmaline breccias, where 79% were anomalous in gold, from 0.1 g/t Au up to 5.32 g/t Au; 65% anomalous in copper, from 71 ppm Cu up to 693 ppm Cu and 53% anomalous in molybdenum, from 8 ppm Mo to 75 ppm Mo. This area is coincident with a large, 1000 by 900 m chargeability anomaly at depth, partially coincident with a magnetic high.
Three holes were drilled in this area during 2010, the deepest one to 432.25 m depth. Preliminary drilling suggests high-level evidence of a porphyry system, being an alteration assemblage affecting the Chilloroya sediments consisting of quartz, pyrite, calcite, specularite, with also quartz-actinolite veinlets rimmed by K-feldspar at depth, as seen at the lower portion of hole SO-10-007.
Tourmaline-bearing breccias were intercepted in two holes, SO-10-004 and SO-10-007 (300 m apart), interpreted to be peripheral to the centre of the pipe, which would be associated with a magnetic anomaly that remains untested.
Additional deeper drilling is planned during 2011 to identify the causative body for the tourmaline occurrence in this area, where higher Au and Cu values are expected to occur.
10.2.2.3 Target 3 – Felsic Porphyry Area
Approximately 2 km to the northeast of the Target 2 area, a 2 m wide, SSW-oriented, quartz-sericite altered brecciated felsic porphyry is emplaced discordantly within fine-grained hornfelsed siltstones. The felsic porphyry is strongly altered, showing randomly-oriented quartz veinlets and carrying pyrite, chalcopyrite and bornite. Three samples taken from the porphyry in 2009 returned up to 2.1% Cu, 32 ppm Mo and 265 ppb Au. The porphyry is thought to be associated with a 500 x 700 m chargeability anomaly located right to the east of the porphyry outcrop.
Six holes were already drilled in this area during 2010. Preliminary results suggest strong evidence of deep-seated, porphyry-style mineralization. From hole SO-10-005 through holes
\\Bnefp01\Users$\Greg.Lane\My Documents\Current Projects\Current Studies\Constancia\Ni 43-101 Report Feb 2011\Ni 43-101 Report Rev 0 21 Feb.Doc Rev: 0 Date: 21 February 2011 9999FM0038 – 2
76
SO- 10-006 (drilled 220m east of hole SO-10-005) and SO-10-008 (drilled 370 m SE of SO-10-005), alteration and mineralization evolved laterally from propylitic to weak potassic, clearly exposed at hole SO-10-008, where micro-veinlets of chalcopyrite, molybdenite, magnetite and K-feldspar, coupled with fairly anomalous copper values were seen from 400 m depth down to the end of hole.
Hydrothermal brecciation activity was also verified in this area, such as the 12 m wide breccia observed at hole SO-10-006 (from 302 to 314 m depth), which returned 0.74% Cu.
Additionally, Cu-bearing skarn was intercepted at holes SO-10-008 and SO-10-012, the latter drilled 185 m SSE of hole 008. At hole SO-10-008, a 31.60 m interval (from 251.75 to 283.35 m depth) averaged 0.72% Cu, 6.0 g/t Ag and 0.29 g/t Au, and hole SO-10-012 intercepted 24.70 m (from 266.40 to 291.10 m) of 0.29% Cu, 7.56 g/t Ag and 0.17 g/t Au. This skarn layer is still open at several directions.
Additional drilling is programmed for 2011 to identify the source of mineralisation and alteration seen in the area, as well as to determine the extent and copper potential of the copper bearing skarn intercepted in holes SO-10-008 and SO-10-012.
Figure 10-9 Chilloroya South – target 3
Apart from the mineralisation in the prospect area, several copper and gold occurrences hosted by the Chilloroya sediments associated with shear zones and vein-like structures occur on surface and at depth in several parts of the prospect. For instance, on surface, at 500 m south-west of the felsic porphyry outcrop there is an open cut exposing green copper oxides with randomly-oriented chalcopyrite veinlets; mineralisation is not well exposed on surface, but starts to be clearly defined just 0.50 m below. Five samples taken from this area returned up to 1.49% Cu, 2.88 g/t Au and 521 ppm Mo. Three reverse circulation holes drilled between 500 and 800 m west of Target 3 intercepted significant Au and Ag values expected to be hosted by low-sulfidation epithermal veins. The best intervals were found in hole SR-10-006, which intercepted 3 m (from 277 to 280 m depth) @ 13.7 g/t Au; hole SR-10-005, with 3 m (from 307 to 310 m) @
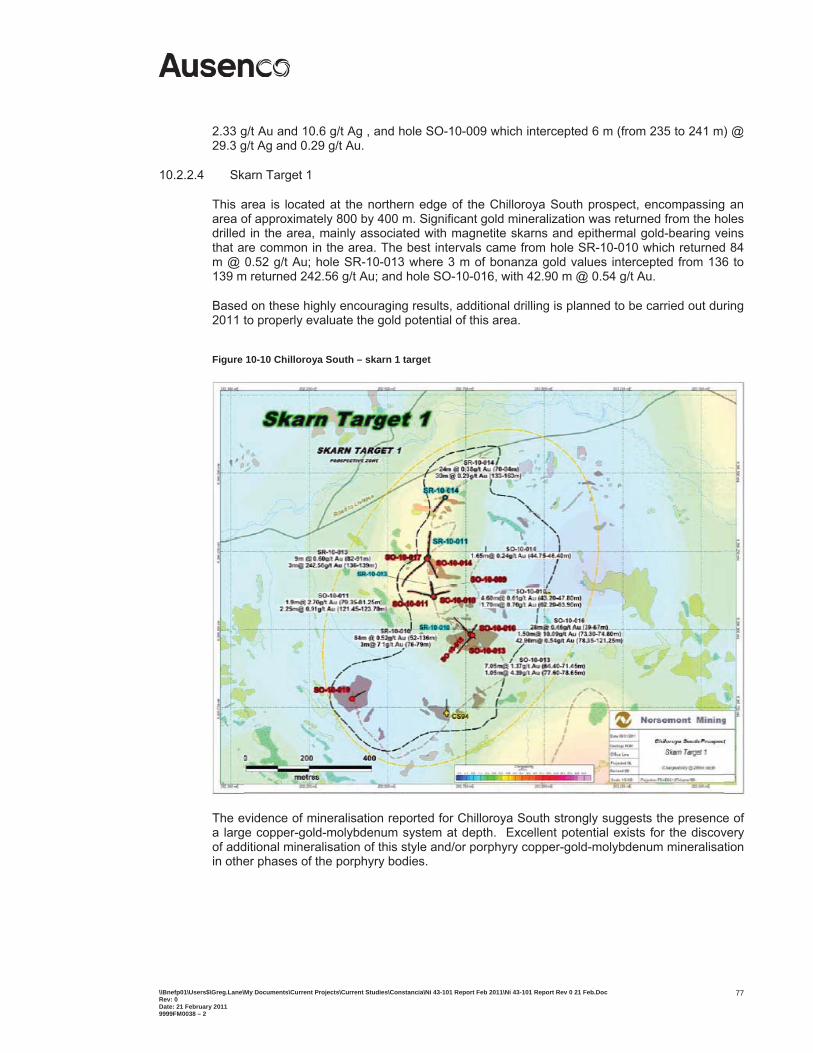
\\Bnefp01\Users$\Greg.Lane\My Documents\Current Projects\Current Studies\Constancia\Ni 43-101 Report Feb 2011\Ni 43-101 Report Rev 0 21 Feb.Doc Rev: 0 Date: 21 February 2011 9999FM0038 – 2
77
2.33 g/t Au and 10.6 g/t Ag , and hole SO-10-009 which intercepted 6 m (from 235 to 241 m) @ 29.3 g/t Ag and 0.29 g/t Au.
10.2.2.4 Skarn Target 1
This area is located at the northern edge of the Chilloroya South prospect, encompassing an area of approximately 800 by 400 m. Significant gold mineralization was returned from the holes drilled in the area, mainly associated with magnetite skarns and epithermal gold-bearing veins that are common in the area. The best intervals came from hole SR-10-010 which returned 84 m @ 0.52 g/t Au; hole SR-10-013 where 3 m of bonanza gold values intercepted from 136 to 139 m returned 242.56 g/t Au; and hole SO-10-016, with 42.90 m @ 0.54 g/t Au.
Based on these highly encouraging results, additional drilling is planned to be carried out during 2011 to properly evaluate the gold potential of this area.
Figure 10-10 Chilloroya South – skarn 1 target
The evidence of mineralisation reported for Chilloroya South strongly suggests the presence of a large copper-gold-molybdenum system at depth. Excellent potential exists for the discovery of additional mineralisation of this style and/or porphyry copper-gold-molybdenum mineralisation in other phases of the porphyry bodies.
\\Bnefp01\Users$\Greg.Lane\My Documents\Current Projects\Current Studies\Constancia\Ni 43-101 Report Feb 2011\Ni 43-101 Report Rev 0 21 Feb.Doc Rev: 0 Date: 21 February 2011 9999FM0038 – 2
78
10.2.3 Uchucarco Chargeability anomaly
This target, located 3.2 km northwest of the Constancia porphyry, consists of a magnetic anomaly of about 1 km wide and 0.8 km long roughly coincident with a chargeability anomaly of 0.7 x 0.4 km.
Three holes drilled in January 2010 did not reveal significant mineralization associated to the anomaly, whereas no more work was conducted there since.
10.3 Exploratory Drilling
During the years 2008 to 2010, exploratory drilling was devoted to evaluate several targets of both the Pampacancha and Chilloroya South prospects, as well as some isolated geophysical anomalies in the proximity of the Constancia porphyry (i.e. Uchucarco and Yanaccaca). As of the 8 January, 2011, exploratory drilling in all of these areas totals 33,195.25 m distributed in 116 holes. Of this, 19,653.50 m were drilled in Pampacancha (75 holes); 11,964.95 m in Chilloroya South (35 holes), and the remainder in Uchucarco and Yanaccaca areas. Based on the highly encouraging results obtained so far, additional drilling is programmed to be carried out in Pampacancha and Chilloroya South areas during 2011.
At Pampacancha, a total of 19,653.50 m (75 holes) were drilled from August 2008 to 8 January 2011. Of this, 11,951.90 m (47 holes) were drilled in the “main body” only (the remainder were allocated to the “magnetic halo” and “limestone replacement area” respectively). During 2011, an intense infill drilling campaign is planned to be executed in the “main body” area aiming to define resources. Drilling carried out in Pampacancha “main body” defined a high grade Cu-Au-Mo-Ag-bearing skarn and porphyry target with preliminary dimensions of about 1,000 by 300-400 m. Drilling results indicate at least two zones of skarn mineralisation that were subjected to follow-up drilling during 2009 and 2010.
At Chilloroya South, five primary targets were drill-tested from June 2010 to date. As of the 8 January 2011, drilling accumulated 11,964.95 m in 35 holes. Preliminary results suggest the presence of a large, deep porphyry system(s), which would be the cause of the alteration and mineralization seen in the area.
During 2011, a second round of deeper exploratory holes are programmed in the whole area, prioritizing Targets 1, 2, 3 and Skarn Target 1 areas, the latter where significant gold mineralization was intercepted associated with magnetite skarns and epithermal veins in an area of about 800 by 400 m.
Preliminary exploration at Yanaccaca (about 900 m north of the San Jose area) started in early 2007.
Yanaccaca is a large, approximately 1000 by 400 m, magnetic anomaly with a north-south to NE orientation, coincident with the border of a similarly oriented low IP resistivity anomaly. Hole CO-07-109 intercepted 38.7 m of a magnetite skarn averaging 1.6 % Cu. Two additional holes were drilled after November 2008 (CO-08-291 and CO-08-293), both failing to intercept significant copper mineralisation. During January-February 2010, three additional holes were drilled. Hole CO-10-294 (230 m E of hole CO-07-109, in between holes CO-08-291 and CO-08-293) intercepted 10 m of skarn (from 84.00 to 94.00 m depth) averaging 0.42% Cu and 2.9 g/t Ag. Two more holes were also drilled in between the Yanaccaca skarns and the northern edge of the San Jose area (about 500 m apart), to test the northward skarn extension from San Jose to Yanaccaca area. Hole CO-10-296, drilled 127 m north of the northern edge of San Jose did not intercepted any skarn body, but weakly mineralized and altered monzonite porphyry (MP1) instead, returning 24 m (from 210.00 to 234.00 m depth) assaying 0.31 % Cu, 0.03 % Mo, and 5.2 g/t Ag. Hole CO-10-295, drilled 360 m north of the edge of San Jose area was aborted at 146.05 m due to bad weather conditions. Similar to hole CO-10-296, lithology was dominated by
\\Bnefp01\Users$\Greg.Lane\My Documents\Current Projects\Current Studies\Constancia\Ni 43-101 Report Feb 2011\Ni 43-101 Report Rev 0 21 Feb.Doc Rev: 0 Date: 21 February 2011 9999FM0038 – 2
79
low grade monzonite porphyry (MP1), with very few limestones and low-grade skarn-endoskarn intercepts. Two mineralized intervals hosted by MP1 porphyry returned: (a) 12.35 m (from 0.00 to 12.35 m) @ 0.22% Cu, 21.4 g/t Ag and 0.23 g/t Au and (b) 12.35 m (from 104.00 to 116.34 m) @ 0.35% Cu and 3.46 g/t Ag.
Based on current evidence the possibility for the copper-bearing skarns to extend northward of the northern edge of the San Jose area were diminished. Apparently the monzonite porphyry invaded all this area leaving only isolated skarn roof-pendants, rather than generating layer-controlled skarn bodies. However, the amount of drilling executed so far in Yanaccaca is not enough to properly evaluate this area.
At Ucchucarcco, three holes totalling 783.45 m were drilled in this area to test the strong chargeability anomaly interpreted from the 2008 geophysical survey. Despite the size and strength of the anomaly, drilling failed in intercepting economic mineralization. The chargeability anomaly was then mainly associated to both pyrite-bearing diorites and limestones, the latter exhibiting some carbonaceous layers which may have helped in strengthen the chargeability response. No additional drilling was planned conducted in this area.
A number of exploration holes were drilled in the zone between Constancia and San José to assess the continuity of the mineralisation between both areas. This drilling indicates that mineralisation continues between these two zones at depth.
Drilling on the southwestern side of the Constancia resource carried out in 2008 indicates a continuation of the skarn mineralisation. Hole CO-08-229 returned two high-grade skarn intercepts, 58.50 m @ 1.53% Cu and 54.50 m @ 0.95% Cu.
.
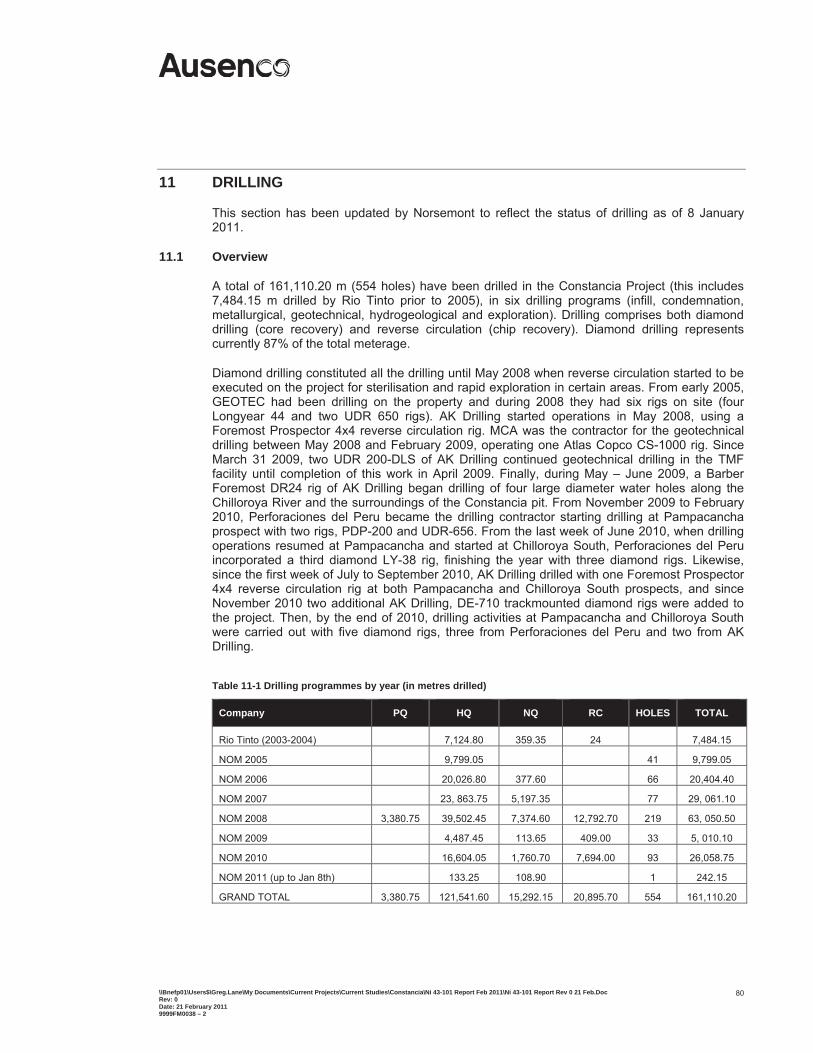
\\Bnefp01\Users$\Greg.Lane\My Documents\Current Projects\Current Studies\Constancia\Ni 43-101 Report Feb 2011\Ni 43-101 Report Rev 0 21 Feb.Doc Rev: 0 Date: 21 February 2011 9999FM0038 – 2
80
11 DRILLING
This section has been updated by Norsemont to reflect the status of drilling as of 8 January 2011.
11.1 Overview
A total of 161,110.20 m (554 holes) have been drilled in the Constancia Project (this includes 7,484.15 m drilled by Rio Tinto prior to 2005), in six drilling programs (infill, condemnation, metallurgical, geotechnical, hydrogeological and exploration). Drilling comprises both diamond drilling (core recovery) and reverse circulation (chip recovery). Diamond drilling represents currently 87% of the total meterage.
Diamond drilling constituted all the drilling until May 2008 when reverse circulation started to be executed on the project for sterilisation and rapid exploration in certain areas. From early 2005, GEOTEC had been drilling on the property and during 2008 they had six rigs on site (four Longyear 44 and two UDR 650 rigs). AK Drilling started operations in May 2008, using a Foremost Prospector 4x4 reverse circulation rig. MCA was the contractor for the geotechnical drilling between May 2008 and February 2009, operating one Atlas Copco CS-1000 rig. Since March 31 2009, two UDR 200-DLS of AK Drilling continued geotechnical drilling in the TMF facility until completion of this work in April 2009. Finally, during May – June 2009, a Barber Foremost DR24 rig of AK Drilling began drilling of four large diameter water holes along the Chilloroya River and the surroundings of the Constancia pit. From November 2009 to February 2010, Perforaciones del Peru became the drilling contractor starting drilling at Pampacancha prospect with two rigs, PDP-200 and UDR-656. From the last week of June 2010, when drilling operations resumed at Pampacancha and started at Chilloroya South, Perforaciones del Peru incorporated a third diamond LY-38 rig, finishing the year with three diamond rigs. Likewise, since the first week of July to September 2010, AK Drilling drilled with one Foremost Prospector 4x4 reverse circulation rig at both Pampacancha and Chilloroya South prospects, and since November 2010 two additional AK Drilling, DE-710 trackmounted diamond rigs were added to the project. Then, by the end of 2010, drilling activities at Pampacancha and Chilloroya South were carried out with five diamond rigs, three from Perforaciones del Peru and two from AK Drilling.
Table 11-1 Drilling programmes by year (in metres drilled)
Company PQ HQ NQ RC HOLES TOTAL
Rio Tinto (2003-2004) 7,124.80 359.35 24 7,484.15
NOM 2005 9,799.05 41 9,799.05
NOM 2006 20,026.80 377.60 66 20,404.40
NOM 2007 23, 863.75 5,197.35 77 29, 061.10
NOM 2008 3,380.75 39,502.45 7,374.60 12,792.70 219 63, 050.50
NOM 2009 4,487.45 113.65 409.00 33 5, 010.10
NOM 2010 16,604.05 1,760.70 7,694.00 93 26,058.75
NOM 2011 (up to Jan 8th) 133.25 108.90 1 242.15
GRAND TOTAL 3,380.75 121,541.60 15,292.15 20,895.70 554 161,110.20
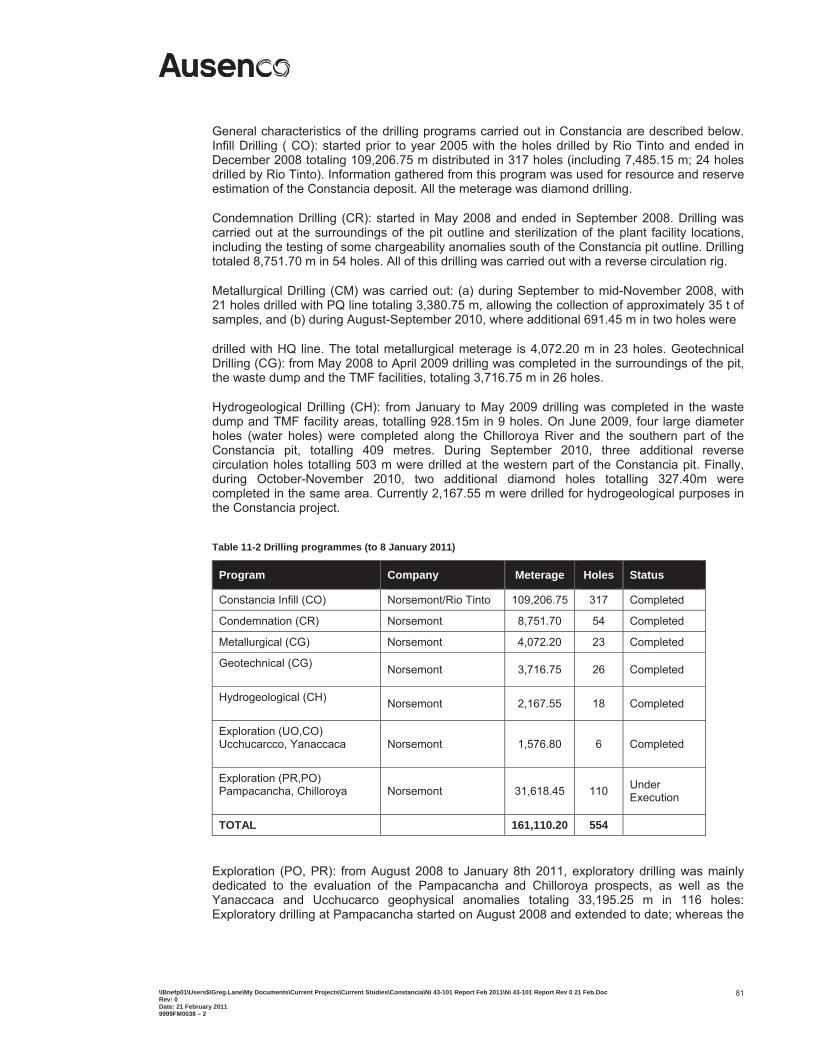
\\Bnefp01\Users$\Greg.Lane\My Documents\Current Projects\Current Studies\Constancia\Ni 43-101 Report Feb 2011\Ni 43-101 Report Rev 0 21 Feb.Doc Rev: 0 Date: 21 February 2011 9999FM0038 – 2
81
General characteristics of the drilling programs carried out in Constancia are described below. Infill Drilling ( CO): started prior to year 2005 with the holes drilled by Rio Tinto and ended in December 2008 totaling 109,206.75 m distributed in 317 holes (including 7,485.15 m; 24 holes drilled by Rio Tinto). Information gathered from this program was used for resource and reserve estimation of the Constancia deposit. All the meterage was diamond drilling.
Condemnation Drilling (CR): started in May 2008 and ended in September 2008. Drilling was carried out at the surroundings of the pit outline and sterilization of the plant facility locations, including the testing of some chargeability anomalies south of the Constancia pit outline. Drilling totaled 8,751.70 m in 54 holes. All of this drilling was carried out with a reverse circulation rig.
Metallurgical Drilling (CM) was carried out: (a) during September to mid-November 2008, with 21 holes drilled with PQ line totaling 3,380.75 m, allowing the collection of approximately 35 t of samples, and (b) during August-September 2010, where additional 691.45 m in two holes were
drilled with HQ line. The total metallurgical meterage is 4,072.20 m in 23 holes. Geotechnical Drilling (CG): from May 2008 to April 2009 drilling was completed in the surroundings of the pit, the waste dump and the TMF facilities, totaling 3,716.75 m in 26 holes.
Hydrogeological Drilling (CH): from January to May 2009 drilling was completed in the waste dump and TMF facility areas, totalling 928.15m in 9 holes. On June 2009, four large diameter holes (water holes) were completed along the Chilloroya River and the southern part of the Constancia pit, totalling 409 metres. During September 2010, three additional reverse circulation holes totalling 503 m were drilled at the western part of the Constancia pit. Finally, during October-November 2010, two additional diamond holes totalling 327.40m were completed in the same area. Currently 2,167.55 m were drilled for hydrogeological purposes in the Constancia project.
Table 11-2 Drilling programmes (to 8 January 2011)
Program Company Meterage Holes Status
Constancia Infill (CO) Norsemont/Rio Tinto 109,206.75 317 Completed
Condemnation (CR) Norsemont 8,751.70 54 Completed
Metallurgical (CG) Norsemont 4,072.20 23 Completed
Geotechnical (CG) Norsemont 3,716.75 26 Completed
Hydrogeological (CH) Norsemont 2,167.55 18 Completed
Exploration (UO,CO) Ucchucarcco, Yanaccaca
Norsemont 1,576.80 6 Completed
Exploration (PR,PO) Pampacancha, Chilloroya
Norsemont 31,618.45 110 Under Execution
TOTAL 161,110.20 554
Exploration (PO, PR): from August 2008 to January 8th 2011, exploratory drilling was mainly dedicated to the evaluation of the Pampacancha and Chilloroya prospects, as well as the Yanaccaca and Ucchucarco geophysical anomalies totaling 33,195.25 m in 116 holes: Exploratory drilling at Pampacancha started on August 2008 and extended to date; whereas the
\\Bnefp01\Users$\Greg.Lane\My Documents\Current Projects\Current Studies\Constancia\Ni 43-101 Report Feb 2011\Ni 43-101 Report Rev 0 21 Feb.Doc Rev: 0 Date: 21 February 2011 9999FM0038 – 2
82
evaluation of the Chilloroya South prospect commenced past June 2010. The Ucchucarco and Yanaccaca anomalies were drill-tested during January-February 2010.
11.2 Collar Location
Drillhole locations are initially defined using hand-held GPS. The drill hole collars and elevations are then surveyed by a surveyor every three months or as necessary. The instruments used accord with the date of the survey, with Total Station, and with differential GPS being used mostly. All measurements are tied to the National Grid. UTM coordinates based on the Provisional South America 1956 (PSAD56) datum are used throughout the project.
11.3 Rig Setup
The borehole azimuth is set up by marking front and back sights with a Brunton compass. After the rig is set up, the azimuth is checked by the geologist. Inclination is measured with the inclinometer incorporated into the rig. Comparisons between the planned and downhole survey measurements (done between 5 to 20 m below the surface to allow for the casing) have shown variations under 0.5o, with only one case being greater than 1o.
Since November 2007, the initial inclination has been measured with a more precise digital inclinometer, and the front and back sights are left in the field to be measured by the surveyors at a later date.
Once the rig is positioned, the senior geologist on site approves the location and set-up. During the drilling, a Norsemont-appointed drilling supervisor checks the compliance with the drilling procedures. The same supervisor is responsible for the correct measurements of downhole surveys at the end of the drilling.
11.4 Downhole Survey
Downhole deviation surveying (showing both dip and azimuth) has been completed at reasonable intervals down the hole for most of the drillholes. Instruments that have been used for this task are the Eastman Single Shot, Flexit and Maxibor. In the case of the photographic records (Eastman), these are read by the senior geologist, and entered into the database. Measurements not within range are flagged as invalid in the database. The Maxibor and Flexit data is delivered both electronically and as in a printout. Flexit data contains measurements of the magnetic field intensity which is used to validate the data. All data is input into the database, and anomalous values are flagged as invalid.
Flexit data has been collected at 30 m intervals since January 2007. Prior to this date, the measurements were made at 50 m intervals, proceeding upwards from the base of the hole. A final measurement is made just below the surface casing (5-20 m below surface). If, for any reason, the rods have to be removed prior to completion of the hole, then the hole is surveyed at that time as a safety measure. Measurements performed using Maxibor were made at 3 m intervals.
11.5 Drill Hole Collars
Appendix 1 contains a table showing the collar locations for all drill holes in the Constancia Project, updated to 8 January 2011.

\\Bnefp01\Users$\Greg.Lane\My Documents\Current Projects\Current Studies\Constancia\Ni 43-101 Report Feb 2011\Ni 43-101 Report Rev 0 21 Feb.Doc Rev: 0 Date: 21 February 2011 9999FM0038 – 2
83
12 SAMPLING METHODS AND APPROACH This section is as reported in the 2009 Technical Report.
\\Bnefp01\Users$\Greg.Lane\My Documents\Current Projects\Current Studies\Constancia\Ni 43-101 Report Feb 2011\Ni 43-101 Report Rev 0 21 Feb.Doc Rev: 0 Date: 21 February 2011 9999FM0038 – 2
84
13 SAMPLE PREPARATION, ANALYSES AND SECURITY This section is as reported in the 2009 Technical Report.

\\Bnefp01\Users$\Greg.Lane\My Documents\Current Projects\Current Studies\Constancia\Ni 43-101 Report Feb 2011\Ni 43-101 Report Rev 0 21 Feb.Doc Rev: 0 Date: 21 February 2011 9999FM0038 – 2
85
14 DATA VERIFICATION This section is as reported in the 2009 Technical Report.

\\Bnefp01\Users$\Greg.Lane\My Documents\Current Projects\Current Studies\Constancia\Ni 43-101 Report Feb 2011\Ni 43-101 Report Rev 0 21 Feb.Doc Rev: 0 Date: 21 February 2011 9999FM0038 – 2
86
15 ADJACENT PROPERTIES This section is as reported in the 2009 Technical Report.
\\Bnefp01\Users$\Greg.Lane\My Documents\Current Projects\Current Studies\Constancia\Ni 43-101 Report Feb 2011\Ni 43-101 Report Rev 0 21 Feb.Doc Rev: 0 Date: 21 February 2011 9999FM0038 – 2
87
16 MINERAL PROCESSING AND METALLURGICAL TESTING
16.1 Pre-DFS Test Work This section is as reported in the 2009 Technical Report.
16.2 DFS Test Work This section is as reported in the 2009 Technical Report.
16.3 Process Design Criteria
A design rate of 4125 t/h is nominated for primary crushing to achieve the design processing plant capacity of 76 000 t/d, at an availability of 70%.
16.3.1 Grinding
The capacity of the grinding circuit is nominally 25.3 Mt/y. This production rate was used along with the ore characteristics to define the required SAG and ball mill specific energy and the installed mill power requirements. A flotation feed 80% passing size (P80) of 106 m was selected for grinding circuit design, based on analysis of the available flotation testwork and discussion with Norsemont.
The 2009 Technical Report was based on a design with a maximum throughput of 25.3 Mt/y on higher grade soft supergene ore. Hence, the volumetric capacity of the comminution plant and subsequent unit operations was unaffected by the changes made to the comminution circuit. The changes made to the comminution circuit improved the utilisation of the capital invested in the project across life of mine by maintaining a relatively constant target plant feed rate.
Ausenco selected the criteria for SAG and ball mill specific energy calculation based on ore type and subsequent flotation feed P80 requirements. The ore characteristics by ore type were reviewed as described in Section 4. GRDMinproc specified a P80 of 106 microns as the optimum for the supergene (GRDMinproc report 60021-000-23-002-005 Rev 0, 5 January 2010, p 60) skarn and hypogene ores (GRDMinproc report 60021-000-23-002-005 Rev 0, 5 January 2010, p 82). These were adopted for the calculations herein without detailed review of the source data.
The assumptions in Table 16-1 were used in all calculations for plant throughput.
Table 16-1 Assumed production schedule inputs
Parameter Value
Availability 91.3% Assumed h/month 666 Hours per day 24 Hours per year 8000
The ore characteristics provided in Norsemont Data Samples Comminution 2009-05-13.xls and reported in GRDMinproc, 2009, Comminution Circuit Design, Rev 0, Document No. 60021-0020-21-002-001 were used to determine the 75th percentile data points (Table 16-2). The Axb parameters, which determine SAG mill throughput, were then compared with the data base range for each ore type (Figures 16-1 to 16-4). The Bond ball mill work index (BWI) is used to determine the ball mill power requirement.
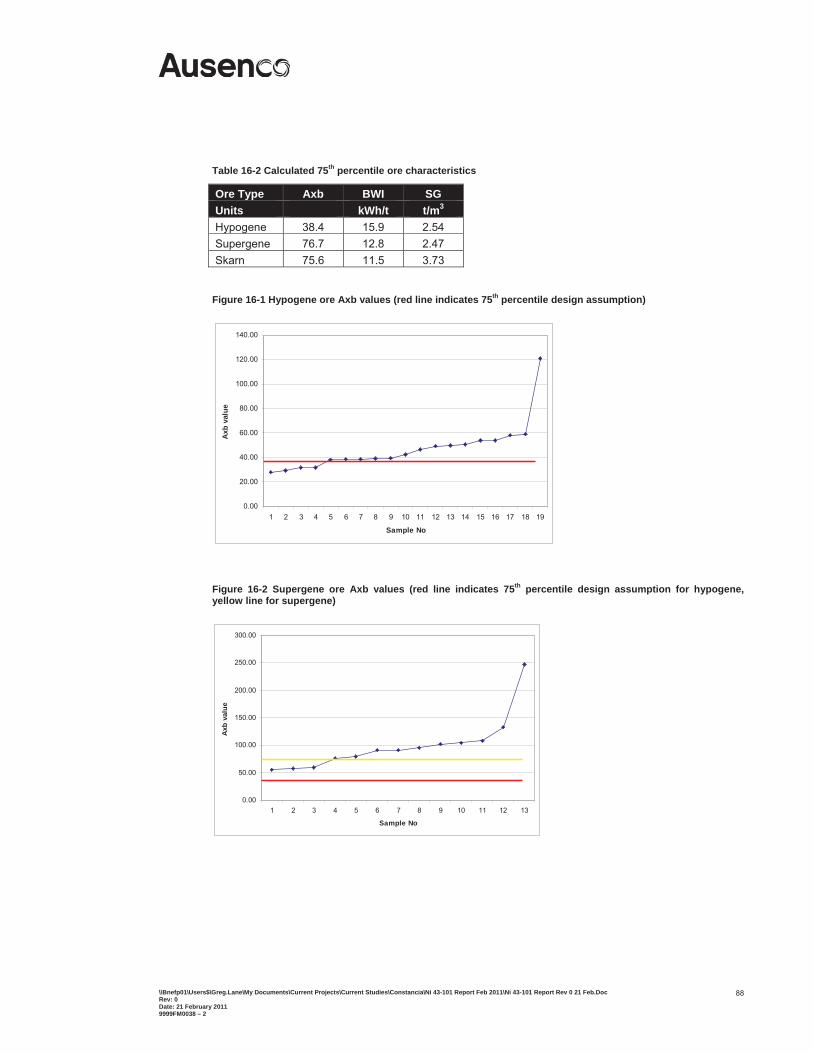
\\Bnefp01\Users$\Greg.Lane\My Documents\Current Projects\Current Studies\Constancia\Ni 43-101 Report Feb 2011\Ni 43-101 Report Rev 0 21 Feb.Doc Rev: 0 Date: 21 February 2011 9999FM0038 – 2
88
Table 16-2 Calculated 75th percentile ore characteristics
Ore Type Axb BWI SGUnits kWh/t t/m3
Hypogene 38.4 15.9 2.54 Supergene 76.7 12.8 2.47 Skarn 75.6 11.5 3.73
Figure 16-1 Hypogene ore Axb values (red line indicates 75th percentile design assumption)
0.00
20.00
40.00
60.00
80.00
100.00
120.00
140.00
1 2 3 4 5 6 7 8 9 10 11 12 13 14 15 16 17 18 19
Sample No
Axb
valu
e
Figure 16-2 Supergene ore Axb values (red line indicates 75th percentile design assumption for hypogene, yellow line for supergene)
0.00
50.00
100.00
150.00
200.00
250.00
300.00
1 2 3 4 5 6 7 8 9 10 11 12 13
Sample No
Axb
valu
e
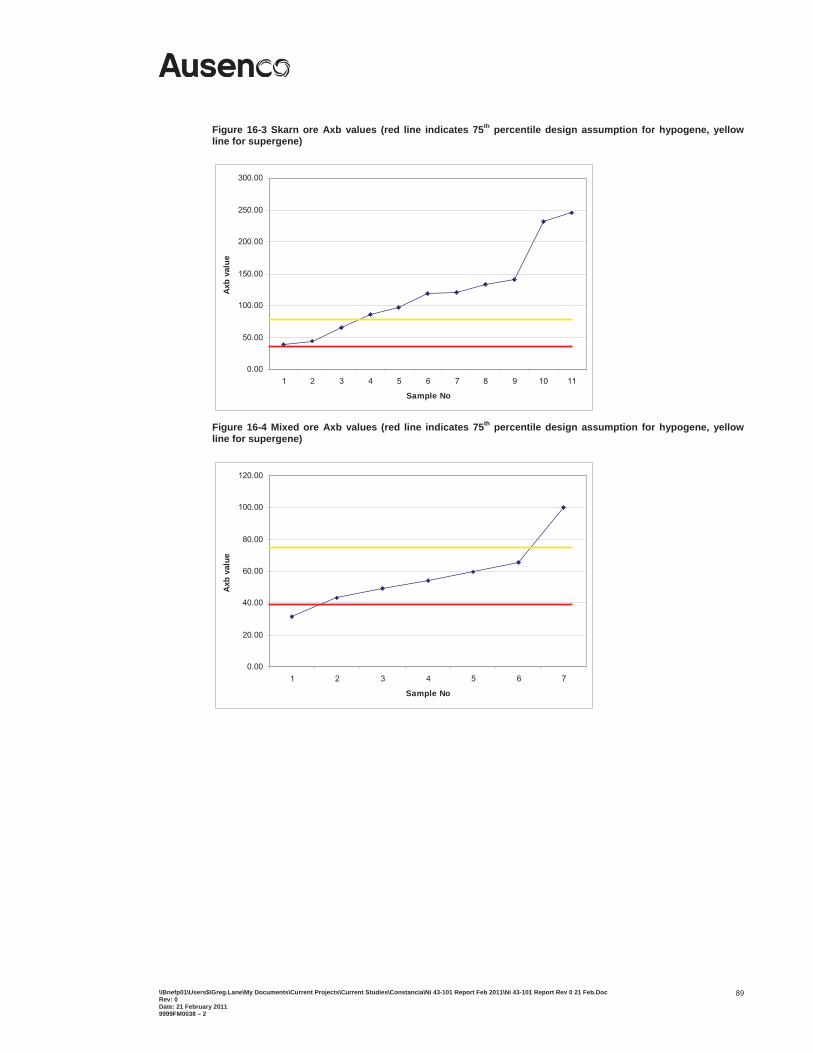
\\Bnefp01\Users$\Greg.Lane\My Documents\Current Projects\Current Studies\Constancia\Ni 43-101 Report Feb 2011\Ni 43-101 Report Rev 0 21 Feb.Doc Rev: 0 Date: 21 February 2011 9999FM0038 – 2
89
Figure 16-3 Skarn ore Axb values (red line indicates 75th percentile design assumption for hypogene, yellow line for supergene)
0.00
50.00
100.00
150.00
200.00
250.00
300.00
1 2 3 4 5 6 7 8 9 10 11
Sample No
Axb
valu
e
Figure 16-4 Mixed ore Axb values (red line indicates 75th percentile design assumption for hypogene, yellow line for supergene)
0.00
20.00
40.00
60.00
80.00
100.00
120.00
1 2 3 4 5 6 7
Sample No
Axb
valu
e
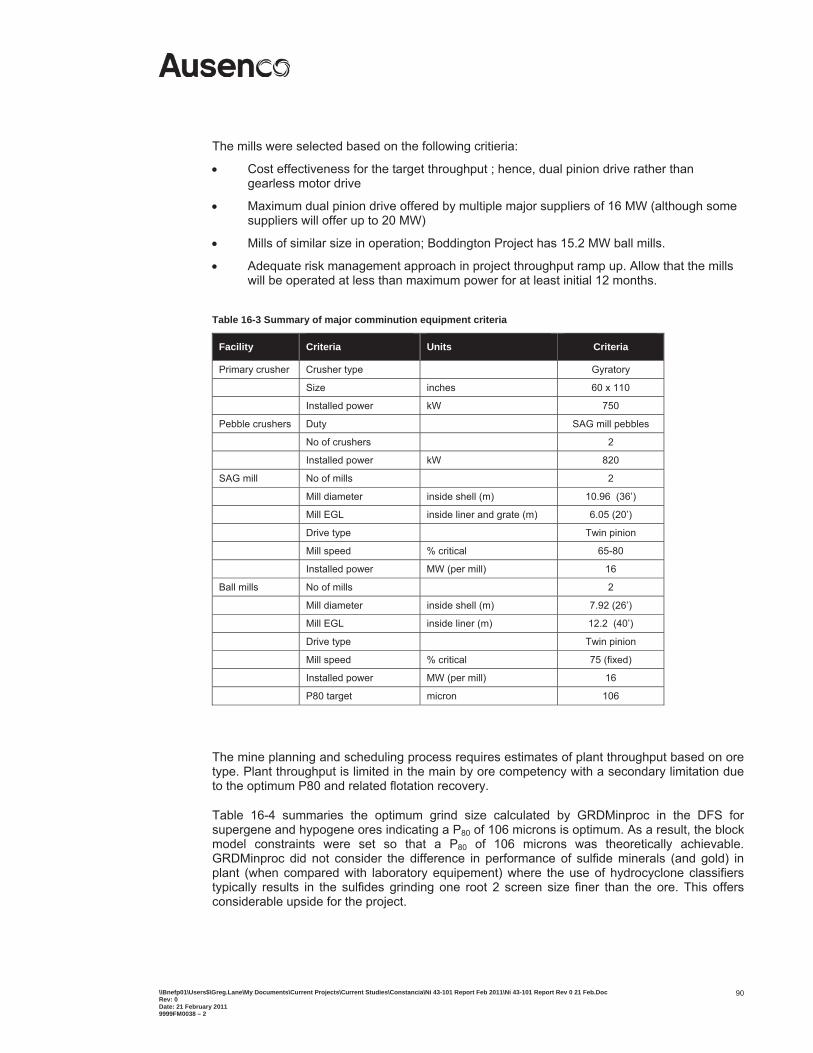
\\Bnefp01\Users$\Greg.Lane\My Documents\Current Projects\Current Studies\Constancia\Ni 43-101 Report Feb 2011\Ni 43-101 Report Rev 0 21 Feb.Doc Rev: 0 Date: 21 February 2011 9999FM0038 – 2
90
The mills were selected based on the following critieria:
Cost effectiveness for the target throughput ; hence, dual pinion drive rather than gearless motor drive
Maximum dual pinion drive offered by multiple major suppliers of 16 MW (although some suppliers will offer up to 20 MW)
Mills of similar size in operation; Boddington Project has 15.2 MW ball mills.
Adequate risk management approach in project throughput ramp up. Allow that the mills will be operated at less than maximum power for at least initial 12 months.
Table 16-3 Summary of major comminution equipment criteria
Facility Criteria Units Criteria
Primary crusher Crusher type Gyratory
Size inches 60 x 110
Installed power kW 750
Pebble crushers Duty SAG mill pebbles
No of crushers 2
Installed power kW 820
SAG mill No of mills 2
Mill diameter inside shell (m) 10.96 (36’)
Mill EGL inside liner and grate (m) 6.05 (20’)
Drive type Twin pinion
Mill speed % critical 65-80
Installed power MW (per mill) 16
Ball mills No of mills 2
Mill diameter inside shell (m) 7.92 (26’)
Mill EGL inside liner (m) 12.2 (40’)
Drive type Twin pinion
Mill speed % critical 75 (fixed)
Installed power MW (per mill) 16
P80 target micron 106
The mine planning and scheduling process requires estimates of plant throughput based on ore type. Plant throughput is limited in the main by ore competency with a secondary limitation due to the optimum P80 and related flotation recovery.
Table 16-4 summaries the optimum grind size calculated by GRDMinproc in the DFS for supergene and hypogene ores indicating a P80 of 106 microns is optimum. As a result, the block model constraints were set so that a P80 of 106 microns was theoretically achievable. GRDMinproc did not consider the difference in performance of sulfide minerals (and gold) in plant (when compared with laboratory equipement) where the use of hydrocyclone classifiers typically results in the sulfides grinding one root 2 screen size finer than the ore. This offers considerable upside for the project.
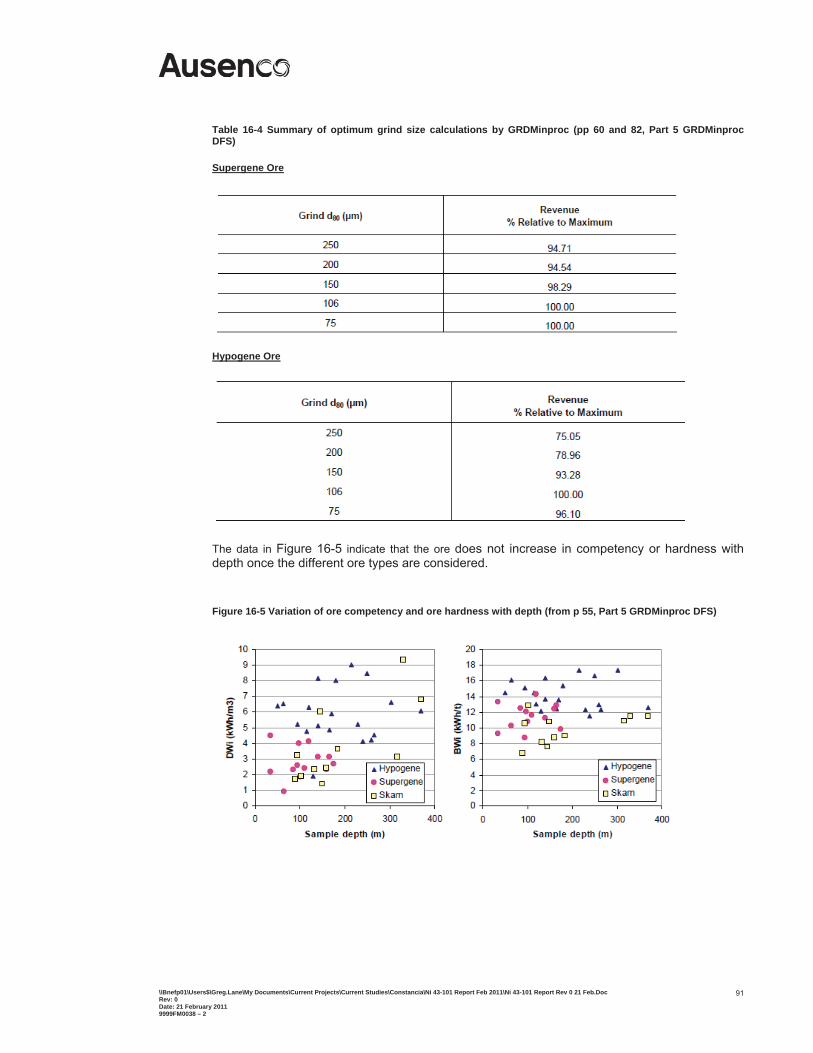
\\Bnefp01\Users$\Greg.Lane\My Documents\Current Projects\Current Studies\Constancia\Ni 43-101 Report Feb 2011\Ni 43-101 Report Rev 0 21 Feb.Doc Rev: 0 Date: 21 February 2011 9999FM0038 – 2
91
Table 16-4 Summary of optimum grind size calculations by GRDMinproc (pp 60 and 82, Part 5 GRDMinproc DFS)
Supergene Ore
Hypogene Ore
The data in Figure 16-5 indicate that the ore does not increase in competency or hardness with depth once the different ore types are considered.
Figure 16-5 Variation of ore competency and ore hardness with depth (from p 55, Part 5 GRDMinproc DFS)
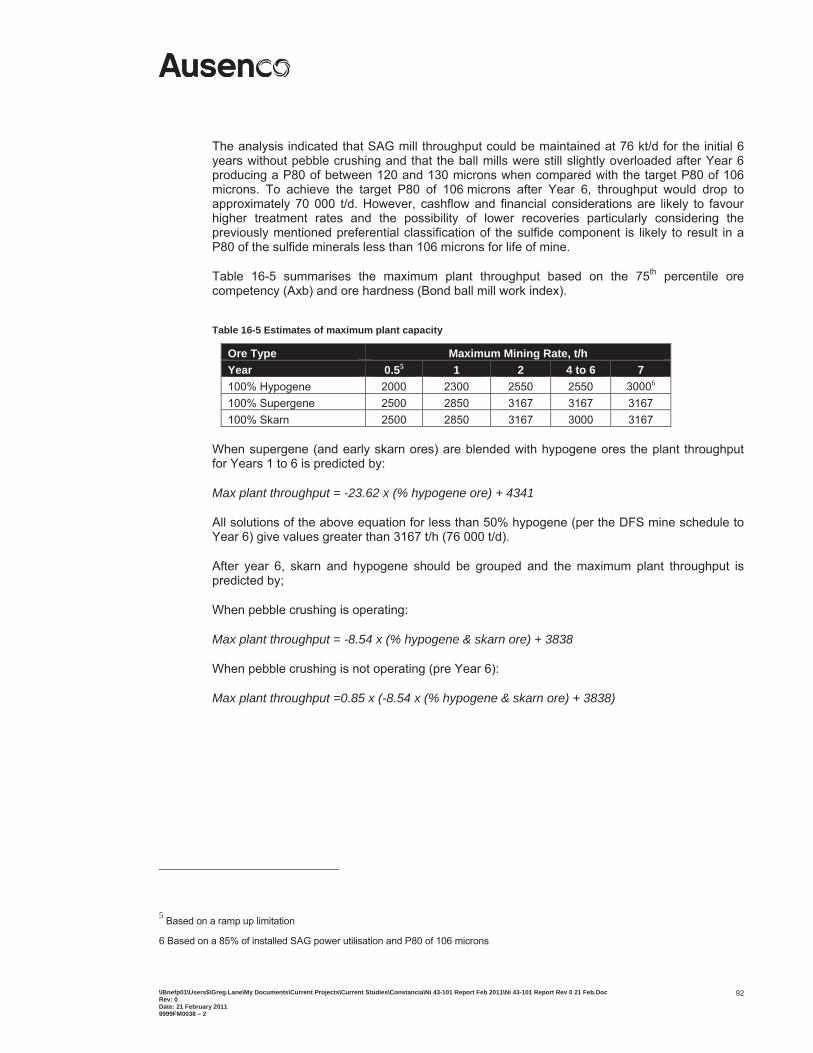
\\Bnefp01\Users$\Greg.Lane\My Documents\Current Projects\Current Studies\Constancia\Ni 43-101 Report Feb 2011\Ni 43-101 Report Rev 0 21 Feb.Doc Rev: 0 Date: 21 February 2011 9999FM0038 – 2
92
The analysis indicated that SAG mill throughput could be maintained at 76 kt/d for the initial 6 years without pebble crushing and that the ball mills were still slightly overloaded after Year 6 producing a P80 of between 120 and 130 microns when compared with the target P80 of 106 microns. To achieve the target P80 of 106 microns after Year 6, throughput would drop to approximately 70 000 t/d. However, cashflow and financial considerations are likely to favour higher treatment rates and the possibility of lower recoveries particularly considering the previously mentioned preferential classification of the sulfide component is likely to result in a P80 of the sulfide minerals less than 106 microns for life of mine.
Table 16-5 summarises the maximum plant throughput based on the 75th percentile ore competency (Axb) and ore hardness (Bond ball mill work index).
Table 16-5 Estimates of maximum plant capacity
Ore Type Maximum Mining Rate, t/h Year 0.55 1 2 4 to 6 7100% Hypogene 2000 2300 2550 2550 30006 100% Supergene 2500 2850 3167 3167 3167 100% Skarn 2500 2850 3167 3000 3167
When supergene (and early skarn ores) are blended with hypogene ores the plant throughput for Years 1 to 6 is predicted by:
Max plant throughput = -23.62 x (% hypogene ore) + 4341
All solutions of the above equation for less than 50% hypogene (per the DFS mine schedule to Year 6) give values greater than 3167 t/h (76 000 t/d).
After year 6, skarn and hypogene should be grouped and the maximum plant throughput is predicted by;
When pebble crushing is operating:
Max plant throughput = -8.54 x (% hypogene & skarn ore) + 3838
When pebble crushing is not operating (pre Year 6):
Max plant throughput =0.85 x (-8.54 x (% hypogene & skarn ore) + 3838)
5 Based on a ramp up limitation
6 Based on a 85% of installed SAG power utilisation and P80 of 106 microns
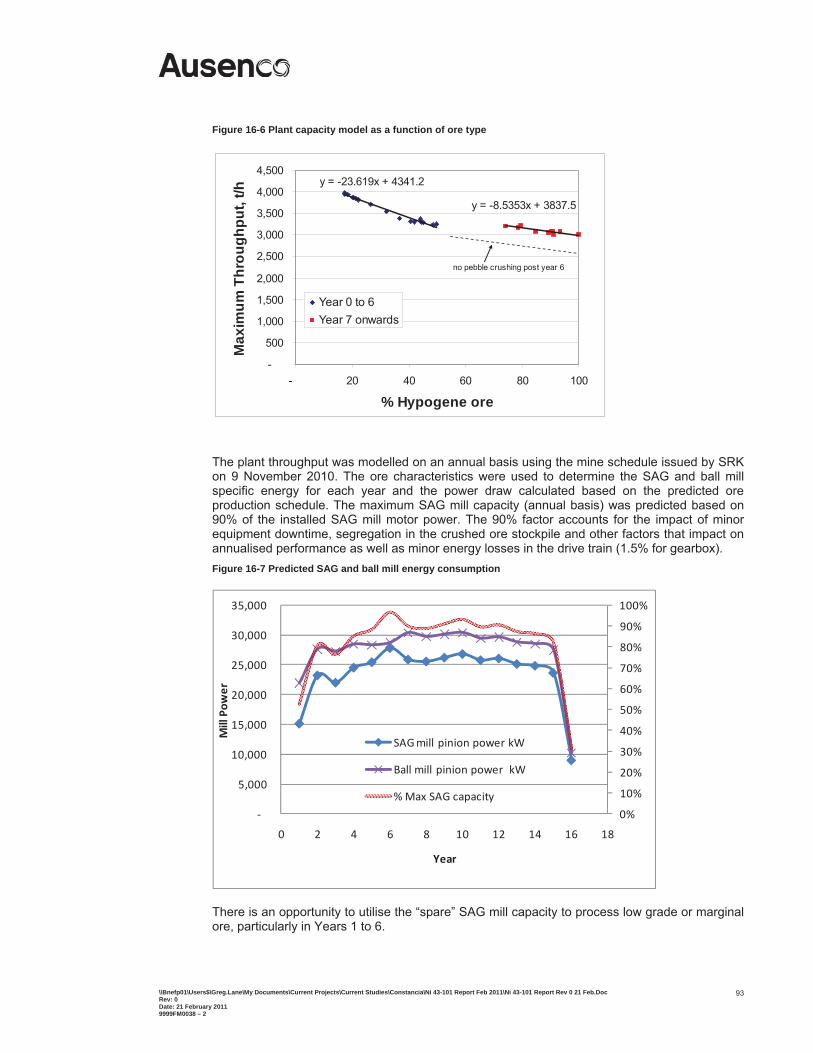
\\Bnefp01\Users$\Greg.Lane\My Documents\Current Projects\Current Studies\Constancia\Ni 43-101 Report Feb 2011\Ni 43-101 Report Rev 0 21 Feb.Doc Rev: 0 Date: 21 February 2011 9999FM0038 – 2
93
Figure 16-6 Plant capacity model as a function of ore type
y = -8.5353x + 3837.5
y = -23.619x + 4341.2
-
500
1,000
1,500
2,000
2,500
3,000
3,500
4,000
4,500
- 20 40 60 80 100
% Hypogene ore
Max
imum
Thr
ough
put,
t/h
Year 0 to 6Year 7 onwards
no pebble crushing post year 6
The plant throughput was modelled on an annual basis using the mine schedule issued by SRK on 9 November 2010. The ore characteristics were used to determine the SAG and ball mill specific energy for each year and the power draw calculated based on the predicted ore production schedule. The maximum SAG mill capacity (annual basis) was predicted based on 90% of the installed SAG mill motor power. The 90% factor accounts for the impact of minor equipment downtime, segregation in the crushed ore stockpile and other factors that impact on annualised performance as well as minor energy losses in the drive train (1.5% for gearbox). Figure 16-7 Predicted SAG and ball mill energy consumption
0%
10%
20%
30%
40%
50%
60%
70%
80%
90%
100%
5,000
10,000
15,000
20,000
25,000
30,000
35,000
0 2 4 6 8 10 12 14 16 18
MillPo
wer
Year
SAGmill pinion power kW
Ball mill pinion power kW
%Max SAG capacity
There is an opportunity to utilise the “spare” SAG mill capacity to process low grade or marginal ore, particularly in Years 1 to 6.
\\Bnefp01\Users$\Greg.Lane\My Documents\Current Projects\Current Studies\Constancia\Ni 43-101 Report Feb 2011\Ni 43-101 Report Rev 0 21 Feb.Doc Rev: 0 Date: 21 February 2011 9999FM0038 – 2
94
16.3.2 Copper flotation
This section is as reported in the 2009 Technical Report.
16.3.3 Molybdenum flotation
This section is as reported in the 2009 Technical Report.
16.3.4 Copper thickening and filtration This section is as reported in the 2009 Technical Report.
Ausenco considers that there is significant potential to reduce the number of concentrate filters from the three units in the DFS given the peak annual concentrate production rate based on 8000 h/y is approximately 57 t/h. This will be considered further in the basic engineering phase of the project.
16.3.5 Molybdenum thickening and filtration This section is as reported in the 2009 Technical Report.
16.3.6 Tailings thickening
This section is as reported in the 2009 Technical Report.
Ausenco considers that there is significant potential to reduce the diameter of the tailings thickener nominated in the DFS. The nominate solids loading rate is relatively low compared with benchmark plants. This will be considered further in the basic engineering phase of the project.
16.3.7 Concentrate storage
This section is as reported in the 2009 Technical Report.
16.3.8 Water services
This section is as reported in the 2009 Technical Report.
16.3.9 Reagents
This section is as reported in the 2009 Technical Report.
16.4 Process Plant Description
16.4.1 Overview
The processing circuit consists of a primary gyratory crusher discharging to a coarse ore stockpile of approximately 50 000 t live capacity. Grinding consists of dual line SAB circuits to year 5 and SABC circuits thereafter with the introduction of pebble crushing for the competent hypogene ores. Flotation consists of a standard copper flotation circuit, combined with a molybdenum flotation circuit. Depressant will be required depending on the zinc content of mined ore, and a ferric chloride leach will be used to maximise the molybdenum concentrate grade. Concentrates are thickened via high rate thickeners prior to filtration in pressure filters. The tailings streams are combined and thickened prior to discharge to the tailings management facility (TMF).
Based on the proposed mine plan and test work, a production forecast was prepared for the selected circuit. The predicted average annual SAG mill throughput varies depending on ore
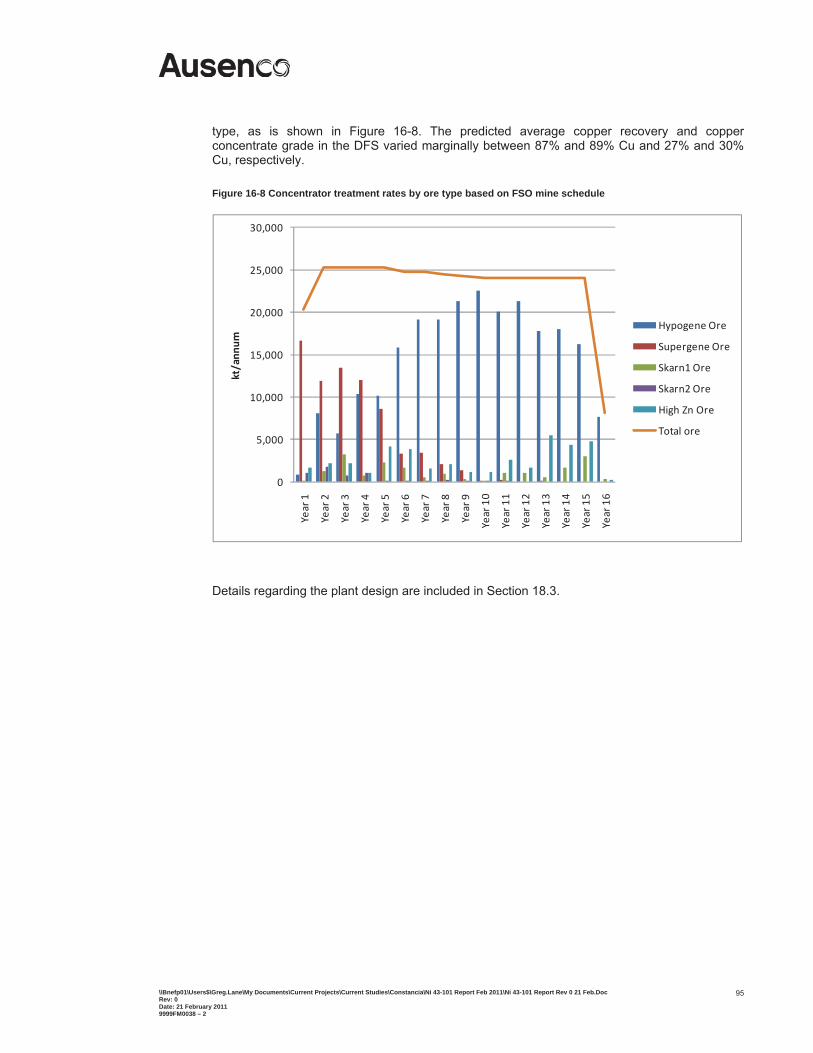
\\Bnefp01\Users$\Greg.Lane\My Documents\Current Projects\Current Studies\Constancia\Ni 43-101 Report Feb 2011\Ni 43-101 Report Rev 0 21 Feb.Doc Rev: 0 Date: 21 February 2011 9999FM0038 – 2
95
type, as is shown in Figure 16-8. The predicted average copper recovery and copper concentrate grade in the DFS varied marginally between 87% and 89% Cu and 27% and 30% Cu, respectively.
Figure 16-8 Concentrator treatment rates by ore type based on FSO mine schedule
0
5,000
10,000
15,000
20,000
25,000
30,000
Year1
Year2
Year3
Year4
Year5
Year6
Year7
Year8
Year9
Year10
Year11
Year12
Year13
Year14
Year15
Year16
kt/ann
um
Hypogene Ore
Supergene Ore
Skarn1 Ore
Skarn2 Ore
High Zn Ore
Total ore
Details regarding the plant design are included in Section 18.3.
\\Bnefp01\Users$\Greg.Lane\My Documents\Current Projects\Current Studies\Constancia\Ni 43-101 Report Feb 2011\Ni 43-101 Report Rev 0 21 Feb.Doc Rev: 0 Date: 21 February 2011 9999FM0038 – 2
96
17 MINERAL RESOURCE AND MINERAL RESERVE ESTIMATES
17.1 Introduction
SRK revised the mineral reserve estimates based on the mineral resource reported in the 2009 Technical Report.
The remainder of this section was extracted from the 2009 Technical Report.
Resource estimation for the Constancia deposit is based on integrated geological and assay interpretations of information recorded from diamond core logging and assaying.
Interpretation wireframe data was supplied by Norsemont, including recently updated information prepared by Atticus Associates, Lima using the Leapfrog (Version 2.1) software package.
Most preliminary data preparation has been carried out using the Micromine software package. Statistical analysis and variography has been carried out in the GeoAccess Professional package, with verification in Micromine and Datamine. Wireframe validation was done in both Micromine and Datamine, and correction of wireframes and flagging of data was carried out in Micromine.
Rock and volume model creation was carried out in Micromine, with export to Datamine for verification.
All resource estimation work was carried out using the Estima process in Datamine Studio 3, operating in double precision. Extensive use was made of the Datamine macro facilities for almost all of the data processing and analysis, cell modelling, estimation and reporting functions.
A single resource block model has been constructed to cover the Constancia and San José parts of the deposit. Coordinates used for all data and models are the National Grid UTM coordinates based on the Provisional South America 1956 (PSAD56) datum.
17.2 Data Provided This section is as reported in the 2009 Technical Report.
17.3 Data Preparation
This section is as reported in the 2009 Technical Report.
17.4 Surface and Solid Wireframe Data Generation This section is as reported in the 2009 Technical Report.
17.5 Sample Coding
This section is as reported in the 2009 Technical Report.
17.6 Data Compositing
This section is as reported in the 2009 Technical Report.
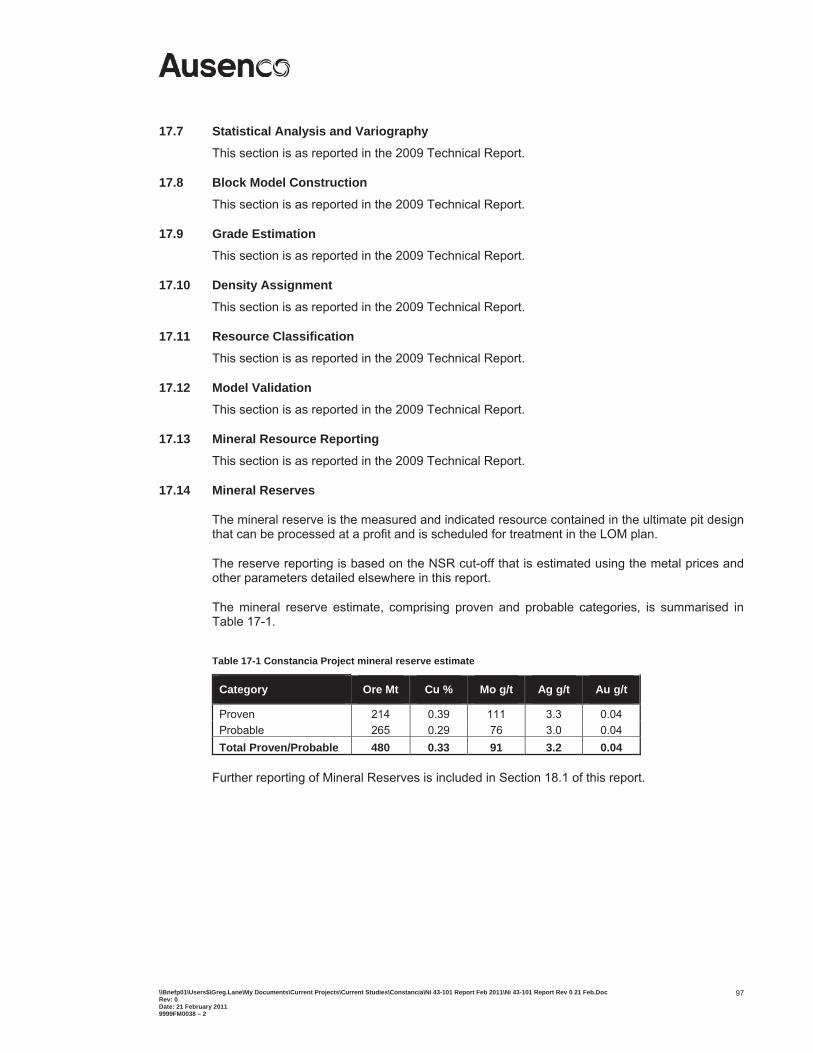
\\Bnefp01\Users$\Greg.Lane\My Documents\Current Projects\Current Studies\Constancia\Ni 43-101 Report Feb 2011\Ni 43-101 Report Rev 0 21 Feb.Doc Rev: 0 Date: 21 February 2011 9999FM0038 – 2
97
17.7 Statistical Analysis and Variography
This section is as reported in the 2009 Technical Report.
17.8 Block Model Construction
This section is as reported in the 2009 Technical Report.
17.9 Grade Estimation This section is as reported in the 2009 Technical Report.
17.10 Density Assignment
This section is as reported in the 2009 Technical Report.
17.11 Resource Classification
This section is as reported in the 2009 Technical Report.
17.12 Model Validation This section is as reported in the 2009 Technical Report.
17.13 Mineral Resource Reporting
This section is as reported in the 2009 Technical Report.
17.14 Mineral Reserves
The mineral reserve is the measured and indicated resource contained in the ultimate pit design that can be processed at a profit and is scheduled for treatment in the LOM plan.
The reserve reporting is based on the NSR cut-off that is estimated using the metal prices and other parameters detailed elsewhere in this report.
The mineral reserve estimate, comprising proven and probable categories, is summarised in Table 17-1.
Table 17-1 Constancia Project mineral reserve estimate
Category Ore Mt Cu % Mo g/t Ag g/t Au g/t
Proven 214 0.39 111 3.3 0.04 Probable 265 0.29 76 3.0 0.04 Total Proven/Probable 480 0.33 91 3.2 0.04
Further reporting of Mineral Reserves is included in Section 18.1 of this report.
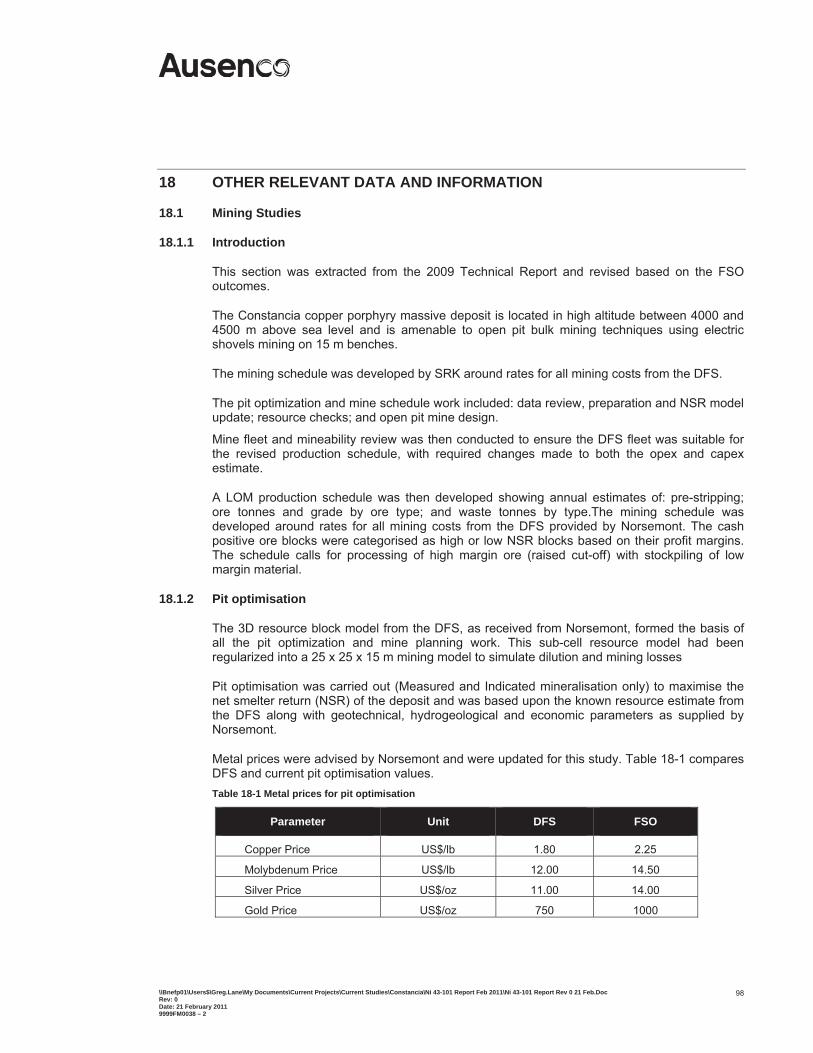
\\Bnefp01\Users$\Greg.Lane\My Documents\Current Projects\Current Studies\Constancia\Ni 43-101 Report Feb 2011\Ni 43-101 Report Rev 0 21 Feb.Doc Rev: 0 Date: 21 February 2011 9999FM0038 – 2
98
18 OTHER RELEVANT DATA AND INFORMATION
18.1 Mining Studies
18.1.1 Introduction
This section was extracted from the 2009 Technical Report and revised based on the FSO outcomes.
The Constancia copper porphyry massive deposit is located in high altitude between 4000 and 4500 m above sea level and is amenable to open pit bulk mining techniques using electric shovels mining on 15 m benches.
The mining schedule was developed by SRK around rates for all mining costs from the DFS.
The pit optimization and mine schedule work included: data review, preparation and NSR model update; resource checks; and open pit mine design.
Mine fleet and mineability review was then conducted to ensure the DFS fleet was suitable for the revised production schedule, with required changes made to both the opex and capex estimate.
A LOM production schedule was then developed showing annual estimates of: pre-stripping; ore tonnes and grade by ore type; and waste tonnes by type.The mining schedule was developed around rates for all mining costs from the DFS provided by Norsemont. The cash positive ore blocks were categorised as high or low NSR blocks based on their profit margins. The schedule calls for processing of high margin ore (raised cut-off) with stockpiling of low margin material.
18.1.2 Pit optimisation
The 3D resource block model from the DFS, as received from Norsemont, formed the basis of all the pit optimization and mine planning work. This sub-cell resource model had been regularized into a 25 x 25 x 15 m mining model to simulate dilution and mining losses
Pit optimisation was carried out (Measured and Indicated mineralisation only) to maximise the net smelter return (NSR) of the deposit and was based upon the known resource estimate from the DFS along with geotechnical, hydrogeological and economic parameters as supplied by Norsemont.
Metal prices were advised by Norsemont and were updated for this study. Table 18-1 compares DFS and current pit optimisation values. Table 18-1 Metal prices for pit optimisation
Parameter Unit DFS FSO
Copper Price US$/lb 1.80 2.25
Molybdenum Price US$/lb 12.00 14.50
Silver Price US$/oz 11.00 14.00
Gold Price US$/oz 750 1000
\\Bnefp01\Users$\Greg.Lane\My Documents\Current Projects\Current Studies\Constancia\Ni 43-101 Report Feb 2011\Ni 43-101 Report Rev 0 21 Feb.Doc Rev: 0 Date: 21 February 2011 9999FM0038 – 2
99
The processing costs were revised and are detailed elsewhere in this report. In this study the total processing cost consists of the operating cost plus the general and administration (“G&A”) costs. Operating costs vary by ore type.
Table 18-2 compares DFS and current values for processing and G&A costs as well as throughput rates. The remaining optimisation parameters are as per Section 18.1.2 of the 2009 Technical Report.
Table 18-2 Processing unit costs by ore type
Parameter Unit DFS FSO Operating Costs
Processing
Hypogene US$/t 4.42 4.00
Supergene US$/t 3.29 3.24
Skarn 1 US$/t 2.59 2.71
Skarn 2 US$/t 2.87 2.96 General & Administration
Annual G & A Cost US$M/year 9.50 9.50 G & A Unit Costs
Hypogene US$/t concentrator feed 0.60 0.40
Supergene US$/t concentrator feed 0.43 0.38
Skarn 1 US$/t concentrator feed 0.42 0.38
Skarn 2 US$/t concentrator feed 0.42 0.38 Scheduling Parameters Grinding Throughput Rate by Ore Type
Hypogene Mt/y 16 24.0
Supergene Mt/y 22 25.3
Skarn 1 Mt/y 23 25.3
Skarn 2 Mt/y 23 25.3
Whittle™ software was used to generate optimal pits for the Constancia deposit based on analysis of the resource model. A series of nested optimal shells are generated for varying product price for both best case and worst case mining scenarios. An analysis of these nested shells was then undertaken, taking into account overall NPV as well as incremental strip ratios and returns, and an optimal shell chosen.
18.1.3 Pit design
Ultimate and staged pit designs were created by SRK from the selected optimisation shells and incorporated access ramps, catch berms and internal haul roads. Potential pit design stages were identified by analysing the incremental changes between the series of nested shells leading to the selected ultimate limits. This analysis is done both graphically and numerically.
Five pit stages were identified within the ultimate limits of the Constancia open pit. Although the San Jose deposit was designed as a stand-alone pit, due to its small size it is incorporated into the overall stage design of Constancia. Pit stages were selected that provided a minimum mining width of 60 m from the previous stage. There are instances when pit shells merge to form common walls and access within the pit has been considered in the design.
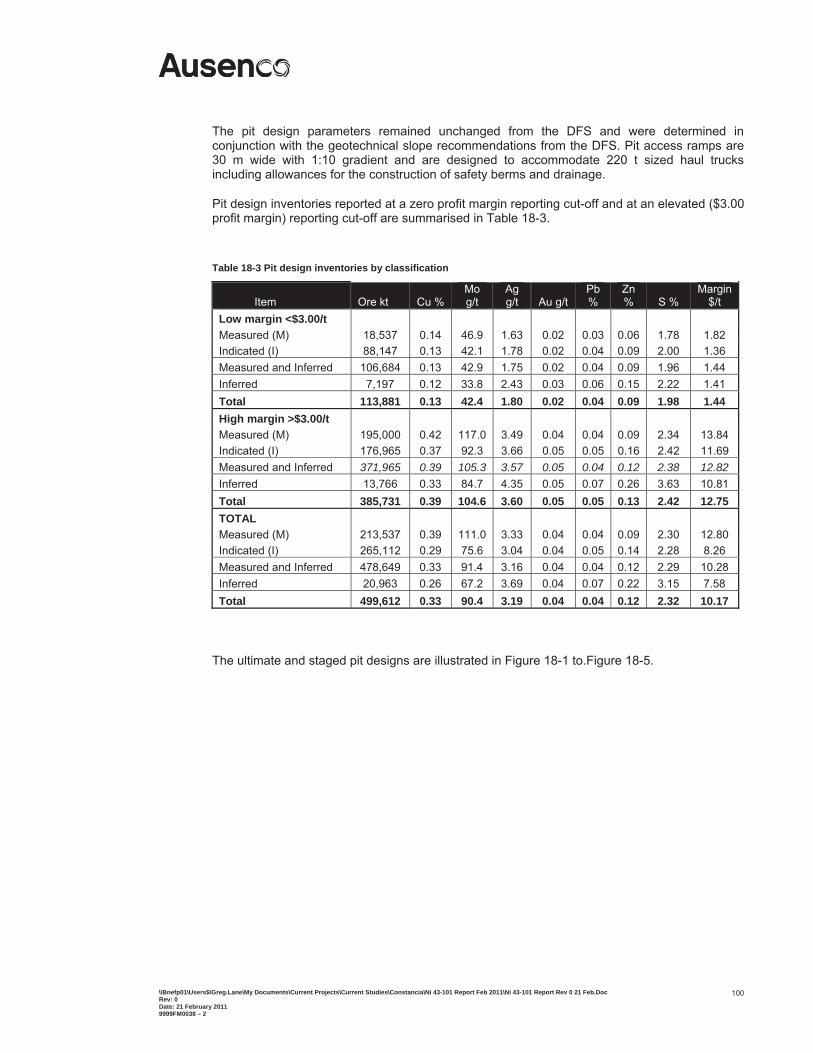
\\Bnefp01\Users$\Greg.Lane\My Documents\Current Projects\Current Studies\Constancia\Ni 43-101 Report Feb 2011\Ni 43-101 Report Rev 0 21 Feb.Doc Rev: 0 Date: 21 February 2011 9999FM0038 – 2
100
The pit design parameters remained unchanged from the DFS and were determined in conjunction with the geotechnical slope recommendations from the DFS. Pit access ramps are 30 m wide with 1:10 gradient and are designed to accommodate 220 t sized haul trucks including allowances for the construction of safety berms and drainage.
Pit design inventories reported at a zero profit margin reporting cut-off and at an elevated ($3.00 profit margin) reporting cut-off are summarised in Table 18-3.
Table 18-3 Pit design inventories by classification
Item Ore kt Cu % Mo g/t
Ag g/t Au g/t
Pb %
Zn % S %
Margin $/t
Low margin <$3.00/t Measured (M) 18,537 0.14 46.9 1.63 0.02 0.03 0.06 1.78 1.82 Indicated (I) 88,147 0.13 42.1 1.78 0.02 0.04 0.09 2.00 1.36 Measured and Inferred 106,684 0.13 42.9 1.75 0.02 0.04 0.09 1.96 1.44 Inferred 7,197 0.12 33.8 2.43 0.03 0.06 0.15 2.22 1.41 Total 113,881 0.13 42.4 1.80 0.02 0.04 0.09 1.98 1.44 High margin >$3.00/t Measured (M) 195,000 0.42 117.0 3.49 0.04 0.04 0.09 2.34 13.84 Indicated (I) 176,965 0.37 92.3 3.66 0.05 0.05 0.16 2.42 11.69 Measured and Inferred 371,965 0.39 105.3 3.57 0.05 0.04 0.12 2.38 12.82 Inferred 13,766 0.33 84.7 4.35 0.05 0.07 0.26 3.63 10.81 Total 385,731 0.39 104.6 3.60 0.05 0.05 0.13 2.42 12.75 TOTAL Measured (M) 213,537 0.39 111.0 3.33 0.04 0.04 0.09 2.30 12.80 Indicated (I) 265,112 0.29 75.6 3.04 0.04 0.05 0.14 2.28 8.26 Measured and Inferred 478,649 0.33 91.4 3.16 0.04 0.04 0.12 2.29 10.28 Inferred 20,963 0.26 67.2 3.69 0.04 0.07 0.22 3.15 7.58 Total 499,612 0.33 90.4 3.19 0.04 0.04 0.12 2.32 10.17
The ultimate and staged pit designs are illustrated in Figure 18-1 to.Figure 18-5.
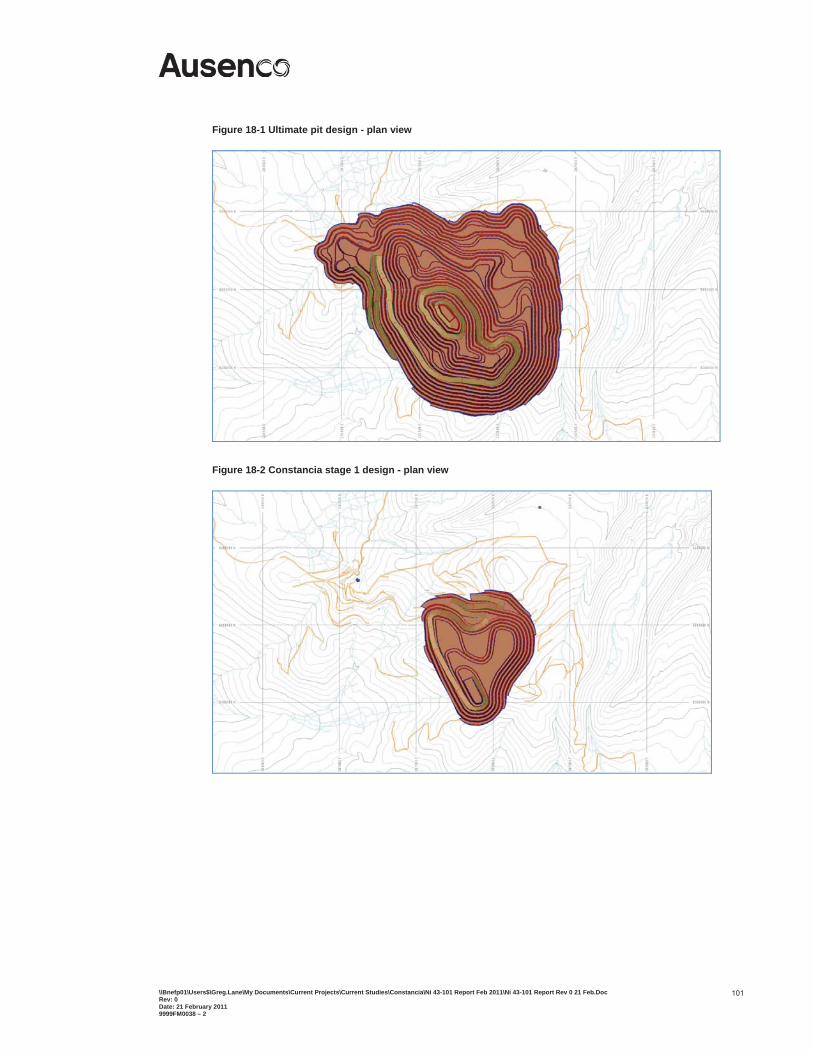
\\Bnefp01\Users$\Greg.Lane\My Documents\Current Projects\Current Studies\Constancia\Ni 43-101 Report Feb 2011\Ni 43-101 Report Rev 0 21 Feb.Doc Rev: 0 Date: 21 February 2011 9999FM0038 – 2
101
Figure 18-1 Ultimate pit design - plan view
Figure 18-2 Constancia stage 1 design - plan view
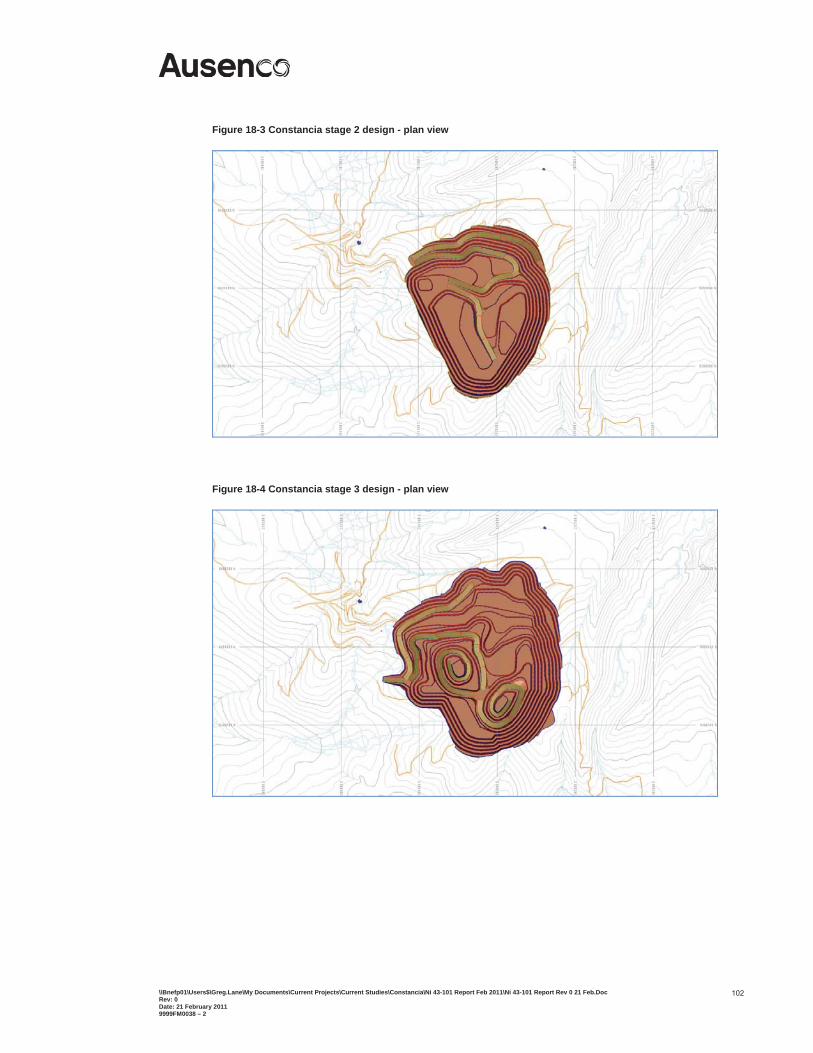
\\Bnefp01\Users$\Greg.Lane\My Documents\Current Projects\Current Studies\Constancia\Ni 43-101 Report Feb 2011\Ni 43-101 Report Rev 0 21 Feb.Doc Rev: 0 Date: 21 February 2011 9999FM0038 – 2
102
Figure 18-3 Constancia stage 2 design - plan view
Figure 18-4 Constancia stage 3 design - plan view
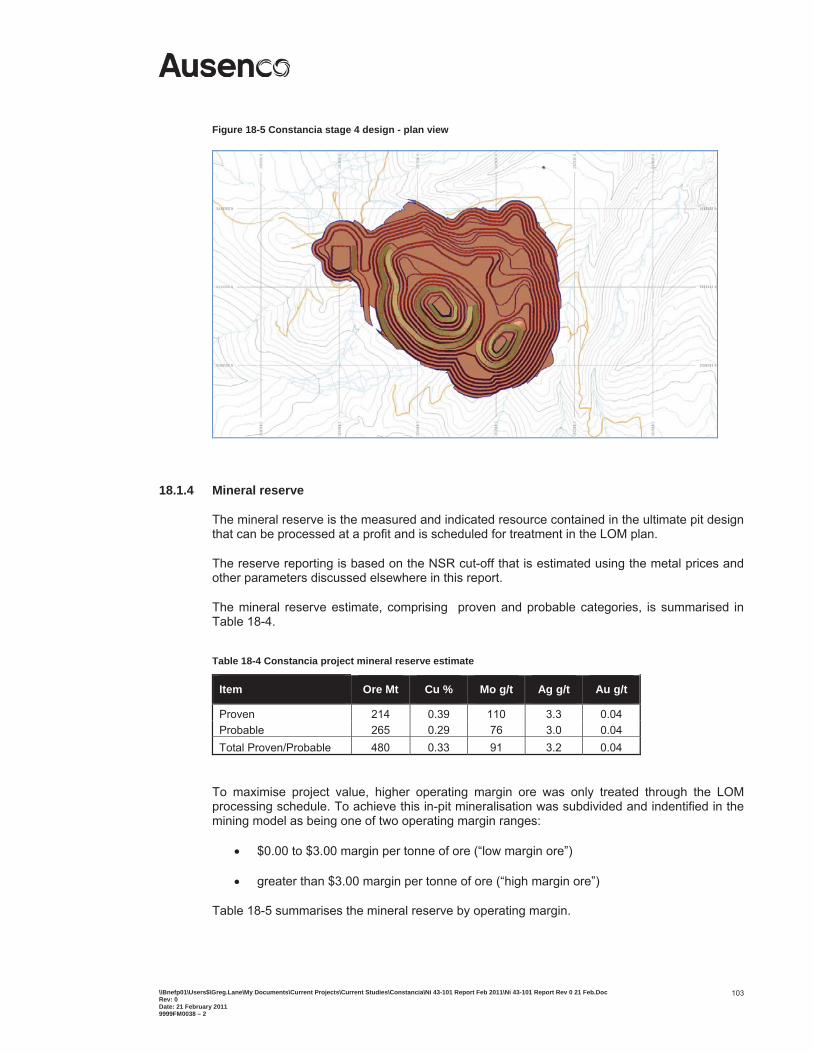
\\Bnefp01\Users$\Greg.Lane\My Documents\Current Projects\Current Studies\Constancia\Ni 43-101 Report Feb 2011\Ni 43-101 Report Rev 0 21 Feb.Doc Rev: 0 Date: 21 February 2011 9999FM0038 – 2
103
Figure 18-5 Constancia stage 4 design - plan view
18.1.4 Mineral reserve
The mineral reserve is the measured and indicated resource contained in the ultimate pit design that can be processed at a profit and is scheduled for treatment in the LOM plan.
The reserve reporting is based on the NSR cut-off that is estimated using the metal prices and other parameters discussed elsewhere in this report.
The mineral reserve estimate, comprising proven and probable categories, is summarised in Table 18-4.
Table 18-4 Constancia project mineral reserve estimate
Item Ore Mt Cu % Mo g/t Ag g/t Au g/t
Proven 214 0.39 110 3.3 0.04 Probable 265 0.29 76 3.0 0.04 Total Proven/Probable 480 0.33 91 3.2 0.04
To maximise project value, higher operating margin ore was only treated through the LOM processing schedule. To achieve this in-pit mineralisation was subdivided and indentified in the mining model as being one of two operating margin ranges:
$0.00 to $3.00 margin per tonne of ore (“low margin ore”)
greater than $3.00 margin per tonne of ore (“high margin ore”)
Table 18-5 summarises the mineral reserve by operating margin.
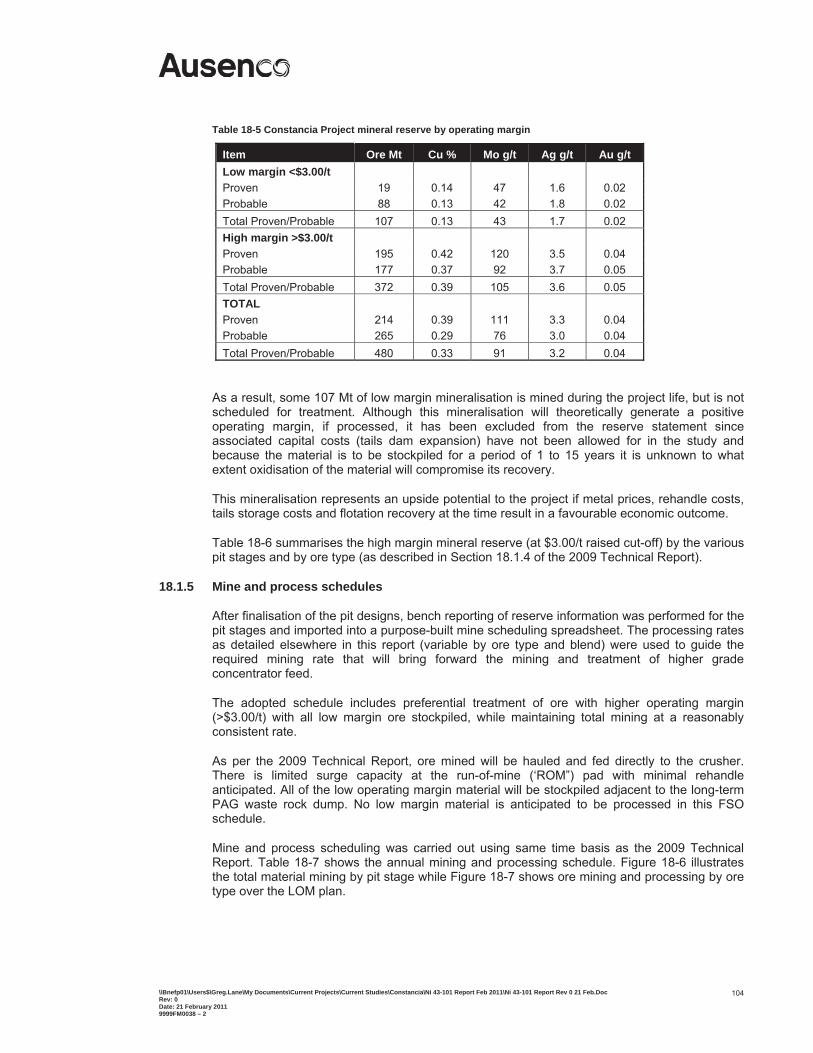
\\Bnefp01\Users$\Greg.Lane\My Documents\Current Projects\Current Studies\Constancia\Ni 43-101 Report Feb 2011\Ni 43-101 Report Rev 0 21 Feb.Doc Rev: 0 Date: 21 February 2011 9999FM0038 – 2
104
Table 18-5 Constancia Project mineral reserve by operating margin
Item Ore Mt Cu % Mo g/t Ag g/t Au g/t Low margin <$3.00/t Proven 19 0.14 47 1.6 0.02 Probable 88 0.13 42 1.8 0.02 Total Proven/Probable 107 0.13 43 1.7 0.02 High margin >$3.00/t Proven 195 0.42 120 3.5 0.04 Probable 177 0.37 92 3.7 0.05 Total Proven/Probable 372 0.39 105 3.6 0.05 TOTAL Proven 214 0.39 111 3.3 0.04 Probable 265 0.29 76 3.0 0.04 Total Proven/Probable 480 0.33 91 3.2 0.04
As a result, some 107 Mt of low margin mineralisation is mined during the project life, but is not scheduled for treatment. Although this mineralisation will theoretically generate a positive operating margin, if processed, it has been excluded from the reserve statement since associated capital costs (tails dam expansion) have not been allowed for in the study and because the material is to be stockpiled for a period of 1 to 15 years it is unknown to what extent oxidisation of the material will compromise its recovery.
This mineralisation represents an upside potential to the project if metal prices, rehandle costs, tails storage costs and flotation recovery at the time result in a favourable economic outcome.
Table 18-6 summarises the high margin mineral reserve (at $3.00/t raised cut-off) by the various pit stages and by ore type (as described in Section 18.1.4 of the 2009 Technical Report).
18.1.5 Mine and process schedules
After finalisation of the pit designs, bench reporting of reserve information was performed for the pit stages and imported into a purpose-built mine scheduling spreadsheet. The processing rates as detailed elsewhere in this report (variable by ore type and blend) were used to guide the required mining rate that will bring forward the mining and treatment of higher grade concentrator feed.
The adopted schedule includes preferential treatment of ore with higher operating margin (>$3.00/t) with all low margin ore stockpiled, while maintaining total mining at a reasonably consistent rate.
As per the 2009 Technical Report, ore mined will be hauled and fed directly to the crusher. There is limited surge capacity at the run-of-mine (‘ROM”) pad with minimal rehandle anticipated. All of the low operating margin material will be stockpiled adjacent to the long-term PAG waste rock dump. No low margin material is anticipated to be processed in this FSO schedule.
Mine and process scheduling was carried out using same time basis as the 2009 Technical Report. Table 18-7 shows the annual mining and processing schedule. Figure 18-6 illustrates the total material mining by pit stage while Figure 18-7 shows ore mining and processing by ore type over the LOM plan.
\\Bnefp01\Users$\Greg.Lane\My Documents\Current Projects\Current Studies\Constancia\Ni 43-101 Report Feb 2011\Ni 43-101 Report Rev 0 21 Feb.Doc Rev: 0 Date: 21 February 2011 9999FM0038 – 2
105
Table 18-6 Mineral reserve by pit stage and ore type @ $3.00/t raised cut-off
ItemStage
1 2 3 4 5 Total Hypogene Ore (kt) 14,625 30,032 53,598 83,182 66,724 248,159 Hypogene Cu (%) 0.47 0.34 0.32 0.30 0.30 0.32 Hypogene Mo (g/t) 140.4 122.3 136.7 92.8 83.6 106.2 Hypogene Ag (g/t) 3.83 3.23 3.14 2.65 2.68 2.90 Hypogene Au (g/t) 0.05 0.04 0.03 0.04 0.05 0.04 Supergene Ore (kt) 33,537 26,746 11,747 2,733 169 74,932 Supergene Cu (%) 0.63 0.52 0.45 0.54 0.25 0.56 Supergene Mo (g/t) 110.6 100.6 94.8 76.8 66.7 103.2 Supergene Ag (g/t) 4.62 3.67 5.08 5.35 2.17 4.37 Supergene Au (g/t) 0.06 0.04 0.03 0.11 0.02 0.05 Skarn1 Ore (kt) 6,936 8,347 4,028 3,407 18,578 41,295 Skarn1 Cu (%) 0.76 0.55 0.54 0.36 0.42 0.51 Skarn1 Mo (g/t) 213.5 124.3 110.2 69.7 69.8 108.9 Skarn1 Ag (g/t) 6.61 5.41 6.54 4.04 6.32 6.02 Skarn1 Au (g/t) 0.08 0.08 0.06 0.05 0.06 0.07 Skarn2 Ore (kt) 4,403 1,926 133 427 692 7,581 Skarn2 Cu (%) 0.59 0.45 0.44 0.30 0.26 0.51 Skarn2 Mo (g/t) 98.7 50.5 13.7 42.7 47.9 77.1 Skarn2 Ag (g/t) 4.39 3.58 5.45 2.89 4.60 4.14 Skarn2 Au (g/t) 0.09 0.09 0.06 0.09 0.07 0.09 Total Ore (kt) 59,501 67,050 69,505 89,749 86,163 371,967 Total Cu (%) 0.60 0.44 0.35 0.31 0.33 0.39 Total Mo (g/t) 129.0 111.8 127.9 91.2 80.3 105.3 Total Ag (g/t) 4.64 3.69 3.67 2.78 3.48 3.57 Total Au (g/t) 0.06 0.05 0.03 0.04 0.05 0.05
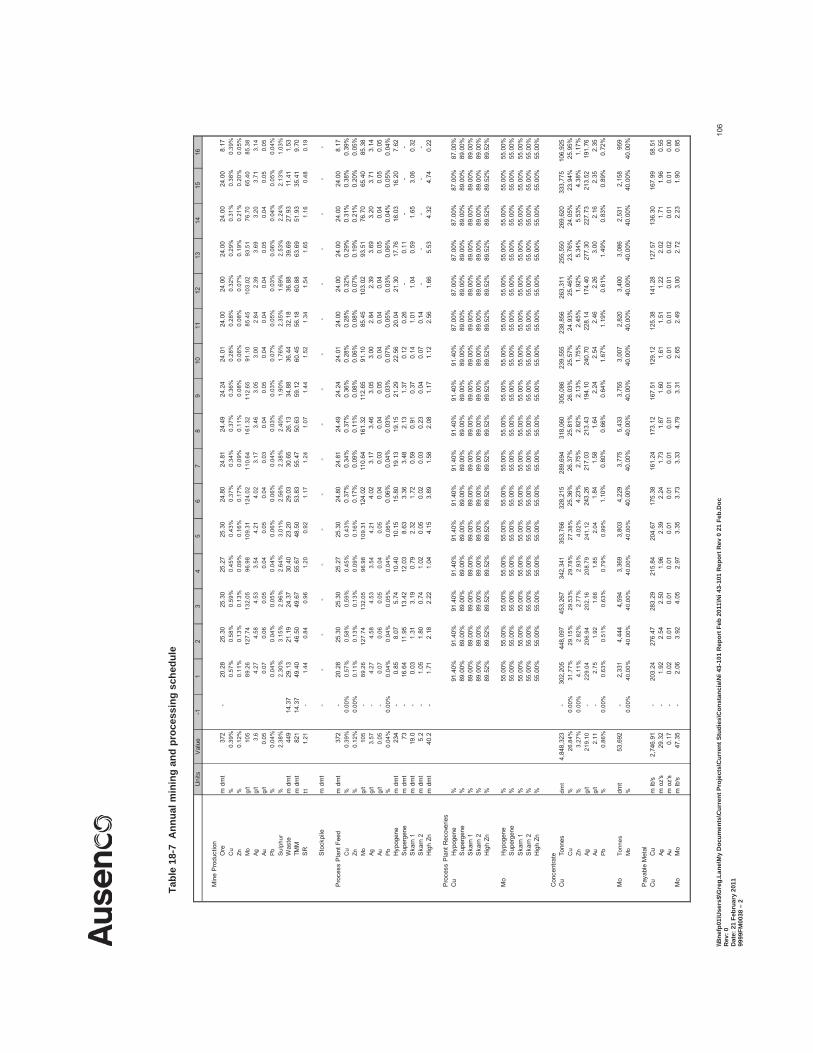
\\Bne
fp01
\Use
rs$\
Gre
g.La
ne\M
y D
ocum
ents
\Cur
rent
Pro
ject
s\C
urre
nt S
tudi
es\C
onst
anci
a\N
i 43-
101
Rep
ort F
eb 2
011\
Ni 4
3-10
1 R
epor
t Rev
0 2
1 Fe
b.D
oc
Rev
: 0
Dat
e: 2
1 Fe
brua
ry 2
011
9999
FM00
38 –
2
106
Tabl
e 18
-7 A
nnua
l min
ing
and
proc
essi
ng s
ched
ule
Uni
tsV
alue
-11
23
45
67
89
1011
1213
1415
16
Min
e P
rodu
ctio
nO
rem
dm
t37
2
-
20.2
8
25.3
0
25.3
0
25.2
7
25.3
0
24.8
0
24.8
1
24.4
9
24.2
4
24.0
1
24.0
0
24.0
0
24.0
0
24.0
0
24.0
0
8.17
C
u%
0.39
%0.
57%
0.58
%0.
59%
0.45
%0.
43%
0.37
%0.
34%
0.37
%0.
36%
0.28
%0.
28%
0.32
%0.
29%
0.31
%0.
38%
0.39
%Zn
%0.
12%
0.11
%0.
13%
0.13
%0.
09%
0.16
%0.
17%
0.09
%0.
11%
0.08
%0.
06%
0.08
%0.
07%
0.19
%0.
21%
0.20
%0.
05%
Mo
g/t
105
89
.26
127.
74
132.
05
96.9
8
10
9.31
12
4.02
11
0.64
16
1.32
11
2.65
91
.10
85.4
5
10
3.02
93
.51
76.7
0
65
.40
85.3
8
Agg/
t3.
6
4.27
4.
58
4.
53
3.
54
4.
21
4.
02
3.
17
3.
46
3.
05
3.
00
2.
84
2.
39
3.
69
3.
20
3.
71
3.
14
Au
g/t
0.05
0.07
0.
06
0.
05
0.
04
0.
05
0.
04
0.
03
0.
04
0.
05
0.
04
0.
04
0.
04
0.
05
0.
04
0.
05
0.
05
P
b%
0.04
%0.
04%
0.04
%0.
05%
0.04
%0.
06%
0.06
%0.
04%
0.03
%0.
03%
0.07
%0.
05%
0.03
%0.
06%
0.04
%0.
05%
0.04
%S
ulph
ur%
2.38
%2.
30%
3.15
%2.
96%
2.64
%3.
01%
2.56
%2.
38%
2.40
%1.
90%
1.76
%2.
35%
1.69
%2.
53%
2.24
%2.
13%
1.03
%W
aste
m d
mt
449
14.3
7
29.1
3
21.1
9
24.3
7
30.4
0
23.2
0
29.0
3
30.6
5
26.1
3
34.8
8
36.4
4
32.1
8
36.8
8
39.6
9
27.9
3
11.4
1
1.53
TM
Mm
dm
t82
1
14
.37
49
.40
46
.50
49
.67
55
.67
48
.50
53
.83
55
.47
50
.63
59
.12
60
.45
56
.18
60
.88
63
.69
51
.93
35
.41
9.
70
SR
t:t1.
21
-
1.
44
0.84
0.96
1.20
0.92
1.17
1.24
1.07
1.44
1.52
1.34
1.54
1.65
1.16
0.48
0.19
Sto
ckpi
lem
dm
t-
-
-
-
-
-
-
-
-
-
-
-
-
-
-
-
-
Pro
cess
Pla
nt F
eed
m d
mt
372
-
20
.28
25
.30
25
.30
25
.27
25
.30
24
.80
24
.81
24
.49
24
.24
24
.01
24
.00
24
.00
24
.00
24
.00
24
.00
8.
17
Cu
%0.
39%
0.00
%0.
57%
0.58
%0.
59%
0.45
%0.
43%
0.37
%0.
34%
0.37
%0.
36%
0.28
%0.
28%
0.32
%0.
29%
0.31
%0.
38%
0.39
%Zn
%0.
12%
0.00
%0.
11%
0.13
%0.
13%
0.09
%0.
16%
0.17
%0.
09%
0.11
%0.
08%
0.06
%0.
08%
0.07
%0.
19%
0.21
%0.
20%
0.05
%M
og/
t10
5
-
89.2
6
12
7.74
13
2.05
96
.98
109.
31
124.
02
11
0.64
161.
32
11
2.65
91.1
0
85.4
5
103.
02
93
.51
76
.70
65
.40
85
.38
Agg/
t3.
57
-
4.
27
4.58
4.53
3.54
4.21
4.02
3.
17
3.46
3.
05
3.00
2.
84
2.39
3.
69
3.20
3.
71
3.14
Au
g/t
0.05
-
0.07
0.
06
0.
05
0.
04
0.
05
0.
04
0.03
0.
04
0.05
0.
04
0.04
0.
04
0.05
0.
04
0.05
0.
05
Pb
%0.
04%
0.00
%0.
04%
0.04
%0.
05%
0.04
%0.
06%
0.06
%0.
04%
0.03
%0.
03%
0.07
%0.
05%
0.03
%0.
06%
0.04
%0.
05%
0.04
%H
ypog
ene
m d
mt
234
-
0.
85
8.07
5.
74
10.4
0
10.1
5
15.8
0
19.1
3
19.1
5
21.2
9
22.5
6
20.0
4
21.3
0
17.7
6
18.0
3
16.2
0
7.62
S
uper
gene
m d
mt
73
-
16.6
4
11.9
5
13.4
2
12.0
3
8.63
3.
36
3.48
2.
13
1.37
0.
12
0.26
-
0.11
-
-
-
S
karn
1m
dm
t19
.0
-
0.
03
1.31
3.
19
0.79
2.
32
1.72
0.
59
0.91
0.
37
0.14
1.
01
1.04
0.
59
1.65
3.
06
0.32
S
karn
2m
dm
t5.
2
-
1.05
1.
80
0.74
1.
02
0.05
0.
02
0.03
0.
23
0.04
0.
07
0.14
-
-
-
-
-
H
igh
Znm
dm
t40
.2
-
1.
71
2.18
2.
22
1.04
4.
15
3.89
1.
58
2.08
1.
17
1.12
2.
56
1.66
5.
53
4.32
4.
74
0.22
Pro
cess
Pla
nt R
ecov
erie
sC
uH
ypog
ene
%91
.40%
91.4
0%91
.40%
91.4
0%91
.40%
91.4
0%91
.40%
91.4
0%91
.40%
91.4
0%87
.00%
87.0
0%87
.00%
87.0
0%87
.00%
87.0
0%S
uper
gene
%89
.00%
89.0
0%89
.00%
89.0
0%89
.00%
89.0
0%89
.00%
89.0
0%89
.00%
89.0
0%89
.00%
89.0
0%89
.00%
89.0
0%89
.00%
89.0
0%S
karn
1%
89.0
0%89
.00%
89.0
0%89
.00%
89.0
0%89
.00%
89.0
0%89
.00%
89.0
0%89
.00%
89.0
0%89
.00%
89.0
0%89
.00%
89.0
0%89
.00%
Ska
rn 2
%89
.00%
89.0
0%89
.00%
89.0
0%89
.00%
89.0
0%89
.00%
89.0
0%89
.00%
89.0
0%89
.00%
89.0
0%89
.00%
89.0
0%89
.00%
89.0
0%H
igh
Zn%
89.5
2%89
.52%
89.5
2%89
.52%
89.5
2%89
.52%
89.5
2%89
.52%
89.5
2%89
.52%
89.5
2%89
.52%
89.5
2%89
.52%
89.5
2%89
.52%
Mo
Hyp
ogen
e%
55.0
0%55
.00%
55.0
0%55
.00%
55.0
0%55
.00%
55.0
0%55
.00%
55.0
0%55
.00%
55.0
0%55
.00%
55.0
0%55
.00%
55.0
0%55
.00%
Sup
erge
ne%
55.0
0%55
.00%
55.0
0%55
.00%
55.0
0%55
.00%
55.0
0%55
.00%
55.0
0%55
.00%
55.0
0%55
.00%
55.0
0%55
.00%
55.0
0%55
.00%
Ska
rn 1
%55
.00%
55.0
0%55
.00%
55.0
0%55
.00%
55.0
0%55
.00%
55.0
0%55
.00%
55.0
0%55
.00%
55.0
0%55
.00%
55.0
0%55
.00%
55.0
0%S
karn
2%
55.0
0%55
.00%
55.0
0%55
.00%
55.0
0%55
.00%
55.0
0%55
.00%
55.0
0%55
.00%
55.0
0%55
.00%
55.0
0%55
.00%
55.0
0%55
.00%
Hig
h Zn
%55
.00%
55.0
0%55
.00%
55.0
0%55
.00%
55.0
0%55
.00%
55.0
0%55
.00%
55.0
0%55
.00%
55.0
0%55
.00%
55.0
0%55
.00%
55.0
0%
Con
cent
rate
Cu
Tonn
esdm
t4,
848,
323
-
302,
205
448,
097
453,
267
342,
341
353,
766
328,
215
289,
694
318,
060
305,
086
239,
555
238,
856
263,
311
255,
550
269,
620
333,
775
106,
925
C
u%
26.8
4%0.
00%
31.7
7%29
.15%
29.5
3%29
.78%
27.3
8%25
.36%
26.3
7%25
.81%
26.0
3%25
.57%
24.9
3%25
.46%
23.7
6%24
.05%
23.9
4%25
.95%
Zn%
3.27
%0.
00%
4.11
%2.
82%
2.77
%2.
93%
4.02
%4.
23%
2.75
%2.
82%
2.13
%1.
75%
2.45
%1.
92%
5.34
%5.
53%
4.38
%1.
17%
Agg/
t21
9.10
-
22
9.04
20
6.94
20
2.16
20
8.79
24
1.12
24
3.26
217.
03
21
3.43
194.
10
24
0.70
228.
14
17
4.40
277.
30
22
7.73
213.
52
19
1.76
Aug/
t2.
11
-
2.
75
1.92
1.66
1.85
2.04
1.84
1.
58
1.64
2.
24
2.54
2.
46
2.26
3.
00
2.16
2.
35
2.35
P
b%
0.86
%0.
00%
0.63
%0.
51%
0.63
%0.
79%
0.99
%1.
10%
0.80
%0.
66%
0.64
%1.
67%
1.19
%0.
61%
1.49
%0.
83%
0.89
%0.
72%
Mo
Tonn
esdm
t53
,692
-
2,
331
4,
444
4,
594
3,
369
3,
803
4,
229
3,
775
5,
433
3,
755
3,
007
2,
820
3,
400
3,
086
2,
531
2,
158
95
9
Mo
%0.
00%
40.0
0%40
.00%
40.0
0%40
.00%
40.0
0%40
.00%
40.0
0%40
.00%
40.0
0%40
.00%
40.0
0%40
.00%
40.0
0%40
.00%
40.0
0%40
.00%
Pay
able
Met
alC
uC
um
lb's
2,74
6.91
-
203.
24
27
6.47
283.
29
21
5.84
204.
67
17
5.38
161.
24
17
3.12
167.
51
12
9.12
125.
38
14
1.28
127.
57
13
6.30
167.
99
58
.51
Agm
oz'
s29
.32
-
1.92
2.
54
2.50
1.
96
2.39
2.
24
1.73
1.
87
1.60
1.
61
1.51
1.
22
2.02
1.
71
1.96
0.
55
Aum
oz'
s0.
17
-
0.
02
0.01
0.
01
0.01
0.
01
0.01
0.
01
0.01
0.
01
0.01
0.
01
0.01
0.
02
0.01
0.
01
0.00
M
oM
om
lb's
47.3
5
-
2.
06
3.92
4.
05
2.97
3.
35
3.73
3.
33
4.79
3.
31
2.65
2.
49
3.00
2.
72
2.23
1.
90
0.85
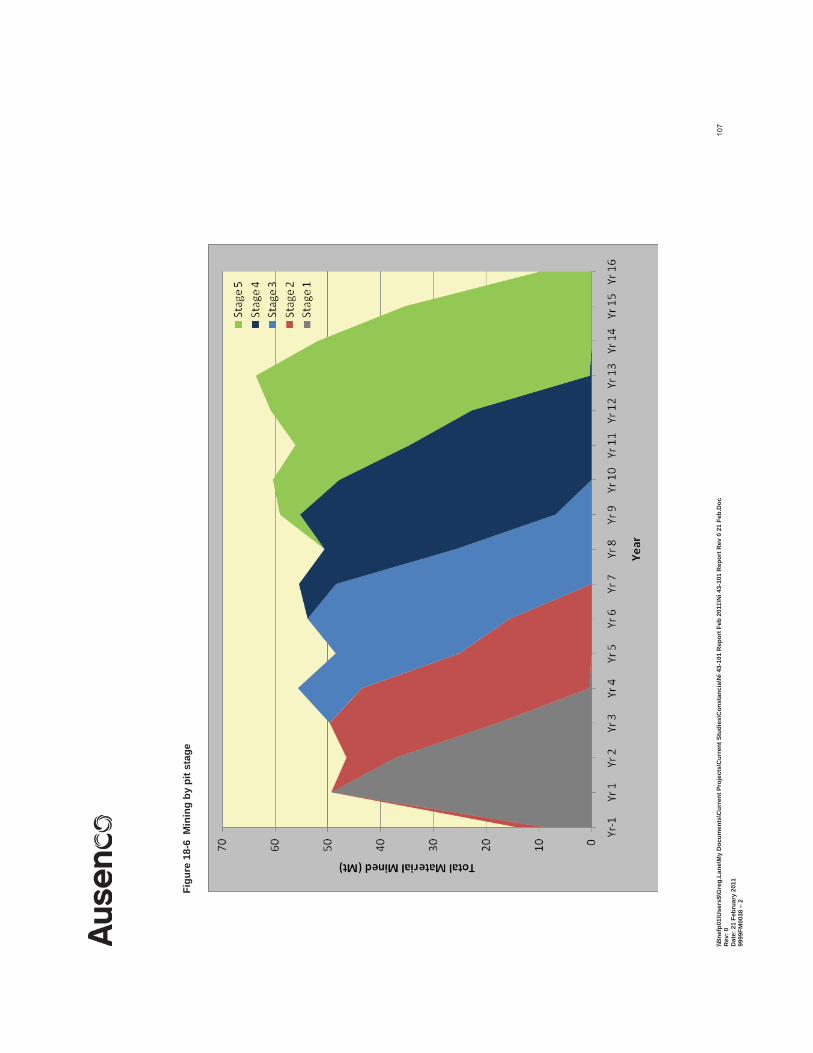
\\Bne
fp01
\Use
rs$\
Gre
g.La
ne\M
y D
ocum
ents
\Cur
rent
Pro
ject
s\C
urre
nt S
tudi
es\C
onst
anci
a\N
i 43-
101
Rep
ort F
eb 2
011\
Ni 4
3-10
1 R
epor
t Rev
0 2
1 Fe
b.D
oc
Rev
: 0
Dat
e: 2
1 Fe
brua
ry 2
011
9999
FM00
38 –
2
107
Fi
gure
18-
6 M
inin
g by
pit
stag
e
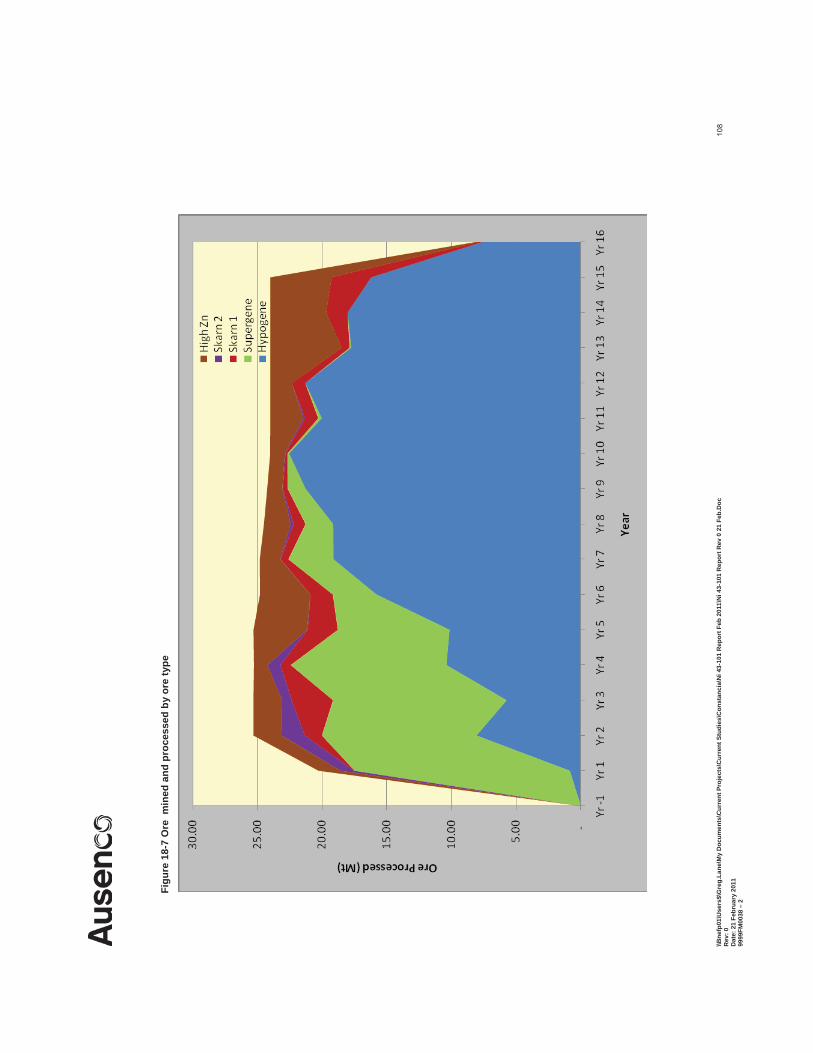
\\Bne
fp01
\Use
rs$\
Gre
g.La
ne\M
y D
ocum
ents
\Cur
rent
Pro
ject
s\C
urre
nt S
tudi
es\C
onst
anci
a\N
i 43-
101
Rep
ort F
eb 2
011\
Ni 4
3-10
1 R
epor
t Rev
0 2
1 Fe
b.D
oc
Rev
: 0
Dat
e: 2
1 Fe
brua
ry 2
011
9999
FM00
38 –
2
108
Figu
re 1
8-7
Ore
min
ed a
nd p
roce
ssed
by
ore
type
\\Bnefp01\Users$\Greg.Lane\My Documents\Current Projects\Current Studies\Constancia\Ni 43-101 Report Feb 2011\Ni 43-101 Report Rev 0 21 Feb.Doc Rev: 0 Date: 21 February 2011 9999FM0038 – 2
109
18.1.6 Ore types and batching
This section was extracted from the 2009 Technical Report and revised.
The three major ore types identified in the 2009 Technical Report Constancia resource model were Skarn, Supergene and Hypogene.
Mineralisation that is high in zinc and proximal to the Supergene ore may be problematic in terms of producing elevated Zn levels in the copper concentrate, potentially affecting its marketability. To better understand potential impacts, GRD Minproc developed a spatial/analytical routine to sub-divide Skarn in the resource model into Skarn1 and Skarn2, where Skarn2 mineralisation is high in zinc and proximal to Supergene mineralisation. The resource and regularised mining model were modified to include the resultant skarn sub-division.
Constancia ore and waste loading operations are scheduled to be performed using large electric shovels capable of mining on benches with a 15 m face height. This approach minimises mining costs, but results in poor ore type selectivity relative to other mining approaches. To simulate realistic mining selectivity, the resource block model was regularised, meaning that the grade attributes of the constituent ore types within a parent cell were averaged. Ore types in the mining model were then assigned on a majority basis i.e. if a parent block contained more than 50% Supergene it is designated as Supergene. As a result of ore regularisation, those blocks around ore type margins are a mixture of ore types, but are identified only by the majority constituent.
Subsequent to creating the mining model, a further “High Zinc” ore type was created. As in the 2009 Technical Report, any ore blocks with a Zn/Cu ratio of greater than 0.66 were designated as high zinc (for blocks with zinc grades higher than 0.16%). High zinc ore is principally a subset of the Skarn1 and Skarn2 mineralisation.
During processing, the metallurgical performance and copper concentrate quality will be optimised if high zinc and Supergene ores are not mixed for treatment. However, mixing of other ore types is not a treatment issue, so the process methodology will be to “batch treat” ore types through the concentrator with the feed consisting of:
1. Supergene and/or Hypogene
2. Skarn and/or Hypogene.
Batch durations can be as short as one week, although a longer period would be desirable. With the short duration, plant batching should normally be controllable by managing the respective ore types in the pit, with a minimal requirement for short term stockpiling and re-handling of ore. The mining estimate allows for routine re-handling of approximately 20% of ROM feed as a result of crusher stoppages or congestion during normal operations. Due to the bulk mining approach and the complex mineralisation shapes it is inevitable that there will be some mixing of high zinc and Supergene ore types in the plant feed. This mixing will be controlled by ore control practices comprising:
Routine face mapping to identify and predict Skarn/Supergene contacts
Routine logging and sampling of blasthole cuttings to identify ore types
Batch designation as part of short term planning and grade control practices.
Where Skarn/Supergene mixing occurs, it should normally be possible to identify problematic ore prior to mining and apply appropriate management strategies. This will be a learning process that will evolve as the short term plant and concentrate response is better understood during daily operations.
\\Bnefp01\Users$\Greg.Lane\My Documents\Current Projects\Current Studies\Constancia\Ni 43-101 Report Feb 2011\Ni 43-101 Report Rev 0 21 Feb.Doc Rev: 0 Date: 21 February 2011 9999FM0038 – 2
110
18.1.7 Mine fleet assessment
This section is as reported in the 2009 Technical Report, except for revisions below.
Given the relatively small shovel/truck fleet, a computerised dispatch system was deemed not to be required and was excluded in this FSO capex estimate.
Given the revised LOM plan and increased ultimate pit limits, truck haulage requirements were re-estimated. Truck haulage cycle times were estimated for the LOM plan and truck requirements for each year of the mine plan. The average truck requirement has increased from 13 units in the DFS to 16 units for the revised FSO LOM plan.
18.1.8 Mine operating cost
This section was extracted from the 2009 Technical Report and revised based on the FSO outcomes.
A review was conducted of the operating costs summarised in the 2009 Technical Report.
The mine operating costs were built up from first principles for this revised LOM plan presented in the FSO, and then compared to the original operating costs presented in the DFS.
Given that the overall pit and stage shapes have not changed significantly, along with the fact that the waste dump and ROM ore pad/crusher have not changed appreciably, the operating costs presented in the DFS have, for the most part, been carried over to this FSO. Also, the major operating cost drivers of labour, diesel, power and explosives were unchanged from the DFS.
The exceptions to this included the elimination of the high unit costs at the end of the mine life which were a result of a high level of stockpile rehandle activities in the DFS. With the revised LOM plan, no marginal ore is scheduled to be processed; as such, this rehandle cost has been eliminated from the operating cost estimate. The other exception is that with the increase in ultimate pit depth, the last few years of the mine operating cost have been adjusted to reflect the anticipated increase in haul distance for this deeper pit.
The average mine operating cost for the life of the mine, including pre-strip, is US$1.17/t mined.
18.1.9 Mine capital cost
This section was extracted from the 2009 Technical Report and revised based on the FSO outcomes.
The total mining capital cost (including capitalised mining operating costs in the pre-production period, equipment replacement and sustaining capital) is estimated at $200 M, as detailed in Table 18-8.
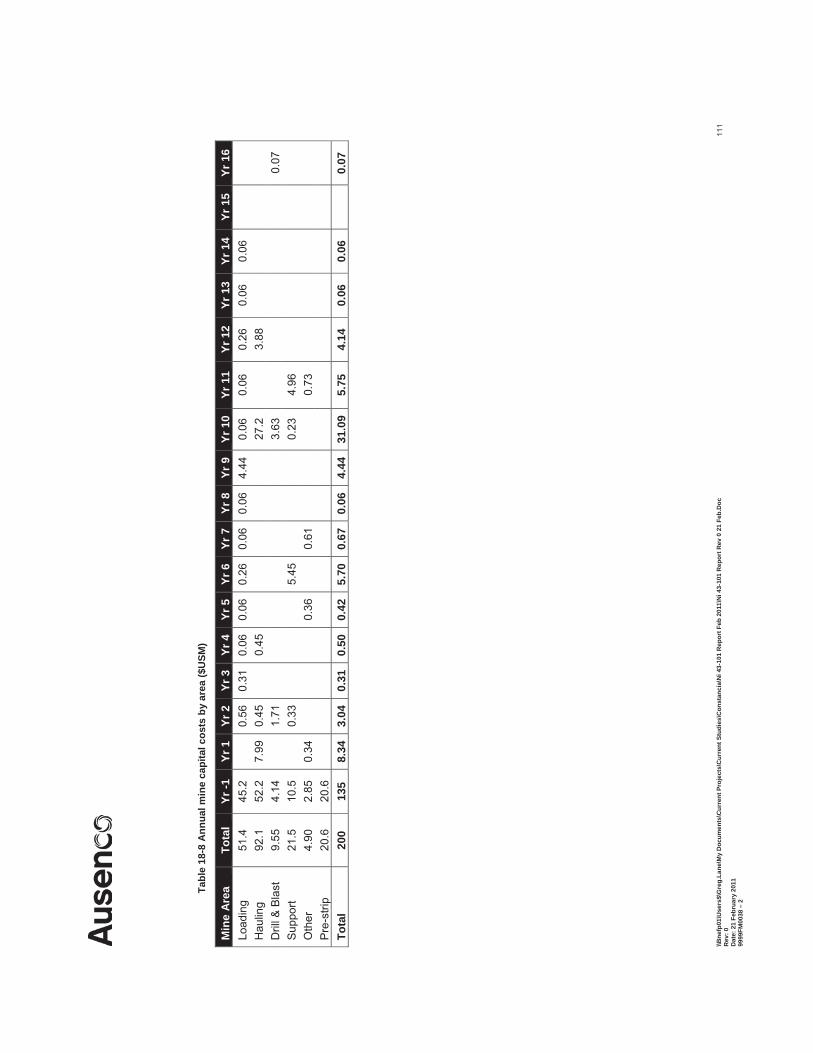
\\Bne
fp01
\Use
rs$\
Gre
g.La
ne\M
y D
ocum
ents
\Cur
rent
Pro
ject
s\C
urre
nt S
tudi
es\C
onst
anci
a\N
i 43-
101
Rep
ort F
eb 2
011\
Ni 4
3-10
1 R
epor
t Rev
0 2
1 Fe
b.D
oc
Rev
: 0
Dat
e: 2
1 Fe
brua
ry 2
011
9999
FM00
38 –
2
111
Tabl
e 18
-8 A
nnua
l min
e ca
pita
l cos
ts b
y ar
ea ($
USM
)
Min
e A
rea
Tota
l Yr
-1
Yr 1
Yr
2
Yr 3
Yr
4
Yr 5
Yr
6
Yr 7
Yr
8
Yr 9
Yr
10
Yr 1
1 Yr
12
Yr 1
3 Yr
14
Yr 1
5 Yr
16
Load
ing
51.4
45
.2
0.
56
0.31
0.
06
0.06
0.
26
0.06
0.
06
4.44
0.
06
0.06
0.
26
0.06
0.
06
Hau
ling
92.1
52
.2
7.99
0.
45
0.
45
27
.2
3.
88
Dril
l & B
last
9.
55
4.14
1.71
3.63
0.07
S
uppo
rt 21
.5
10.5
0.33
5.45
0.23
4.
96
O
ther
4.
90
2.85
0.
34
0.
36
0.
61
0.
73
P
re-s
trip
20.6
20
.6
Tota
l 20
0 13
5 8.
34
3.04
0.
31
0.50
0.
42
5.70
0.
67
0.06
4.
44
31.0
9 5.
75
4.14
0.
06
0.06
0.07
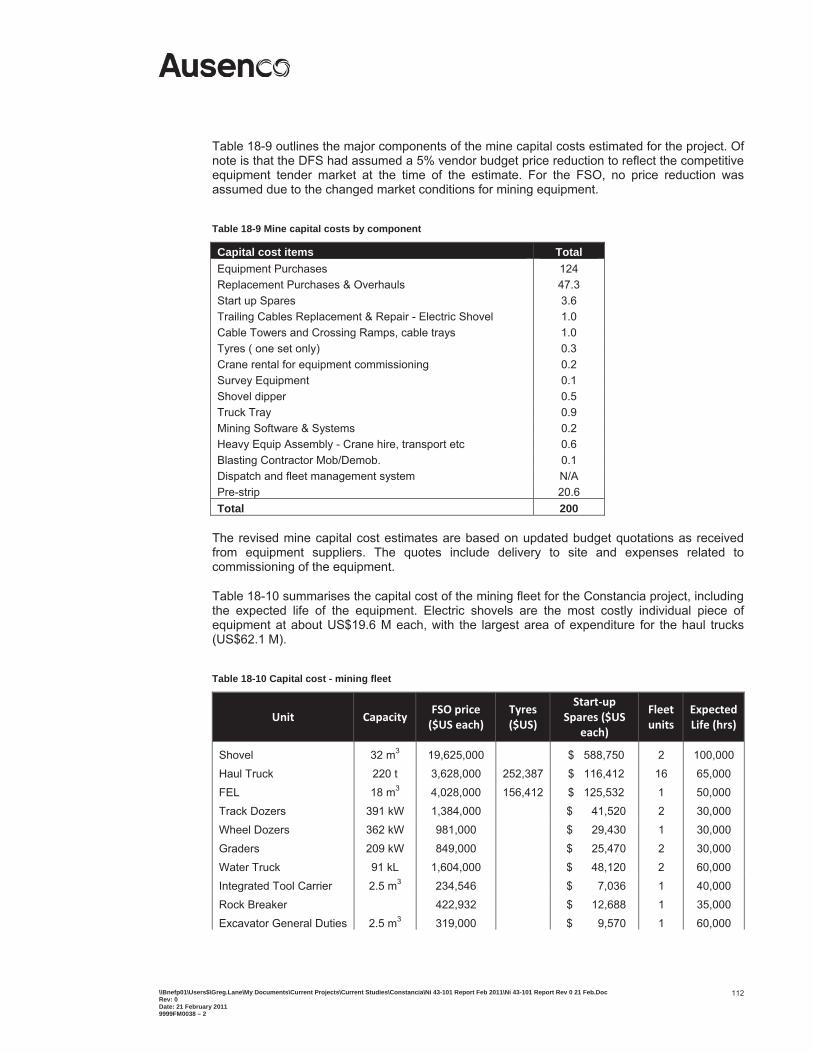
\\Bnefp01\Users$\Greg.Lane\My Documents\Current Projects\Current Studies\Constancia\Ni 43-101 Report Feb 2011\Ni 43-101 Report Rev 0 21 Feb.Doc Rev: 0 Date: 21 February 2011 9999FM0038 – 2
112
Table 18-9 outlines the major components of the mine capital costs estimated for the project. Of note is that the DFS had assumed a 5% vendor budget price reduction to reflect the competitive equipment tender market at the time of the estimate. For the FSO, no price reduction was assumed due to the changed market conditions for mining equipment.
Table 18-9 Mine capital costs by component
Capital cost items Total Equipment Purchases 124 Replacement Purchases & Overhauls 47.3 Start up Spares 3.6 Trailing Cables Replacement & Repair - Electric Shovel 1.0 Cable Towers and Crossing Ramps, cable trays 1.0 Tyres ( one set only) 0.3 Crane rental for equipment commissioning 0.2 Survey Equipment 0.1 Shovel dipper 0.5 Truck Tray 0.9 Mining Software & Systems 0.2 Heavy Equip Assembly - Crane hire, transport etc 0.6 Blasting Contractor Mob/Demob. 0.1 Dispatch and fleet management system N/A Pre-strip 20.6 Total 200
The revised mine capital cost estimates are based on updated budget quotations as received from equipment suppliers. The quotes include delivery to site and expenses related to commissioning of the equipment.
Table 18-10 summarises the capital cost of the mining fleet for the Constancia project, including the expected life of the equipment. Electric shovels are the most costly individual piece of equipment at about US$19.6 M each, with the largest area of expenditure for the haul trucks (US$62.1 M).
Table 18-10 Capital cost - mining fleet
Unit CapacityFSO price($US each)
Tyres($US)
Start upSpares ($US
each)
Fleetunits
ExpectedLife (hrs)
Shovel 32 m3 19,625,000 $ 588,750 2 100,000 Haul Truck 220 t 3,628,000 252,387 $ 116,412 16 65,000 FEL 18 m3 4,028,000 156,412 $ 125,532 1 50,000 Track Dozers 391 kW 1,384,000 $ 41,520 2 30,000 Wheel Dozers 362 kW 981,000 $ 29,430 1 30,000
Graders 209 kW 849,000 $ 25,470 2 30,000 Water Truck 91 kL 1,604,000 $ 48,120 2 60,000 Integrated Tool Carrier 2.5 m3 234,546 $ 7,036 1 40,000 Rock Breaker 422,932 $ 12,688 1 35,000 Excavator General Duties 2.5 m3 319,000 $ 9,570 1 60,000
\\Bnefp01\Users$\Greg.Lane\My Documents\Current Projects\Current Studies\Constancia\Ni 43-101 Report Feb 2011\Ni 43-101 Report Rev 0 21 Feb.Doc Rev: 0 Date: 21 February 2011 9999FM0038 – 2
113
Unit CapacityFSO price($US each)
Tyres($US)
Start upSpares ($US
each)
Fleetunits
ExpectedLife (hrs)
Cable Reeler 863,497 $ 25,905 1 30,000 Production Drill Diesel 279 mm 1,655,798 $ 49,674 3 60,000 Pre-split drill 127 mm 644,715 $ 19,341 1 25,000
Service truck 166,250 $ 4,988 1 25,000 Tire handler 153,644 $ 4,609 1 30,000 Low loader 626,463 $ 18,794 1 20,000 Light vehicle 25,935 $ 16,530 14 10,000 Passenger bus 266,000 $ 778 2 15,000 Lighting plants 34,885 $ 7,980 8 25,000
18.2 Geotechnical Studies
18.2.1 Introduction
This section is as reported in the 2009 Technical Report.
18.2.2 Open pit geotechnical investigations, design parameters and slope angles
This section was extracted from the 2009 Technical Report and revised for the new pit design.
The final Constancia pit area will measure 1.6 km by 1.3 km with a maximum depth (difference between the highest point of the pit rim and the lowest point within the pit) of 650 m. About 85% of the rock consists of intrusive rocks (chiefly porphyritic monzonites with minor components of diorite and andesite); 5% consists of sandstones and 10% of skarn and marbleised limestones. The structural map prepared for the pit is presented in Figure 18-8.
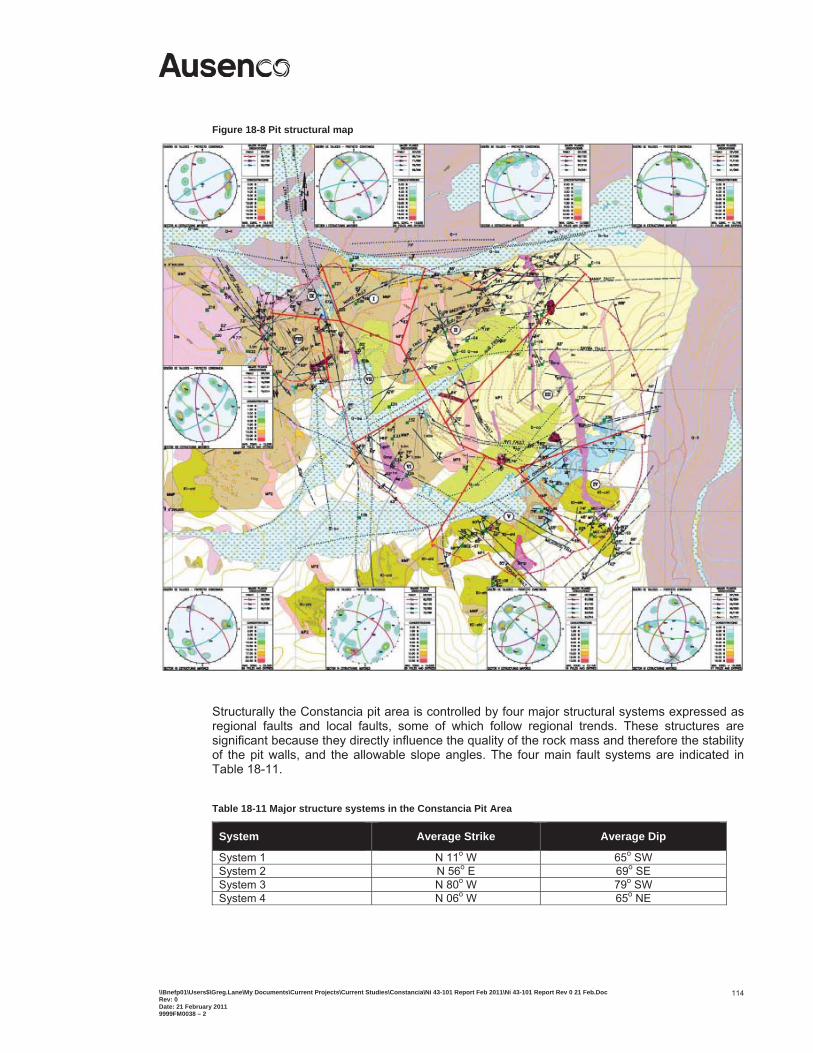
\\Bnefp01\Users$\Greg.Lane\My Documents\Current Projects\Current Studies\Constancia\Ni 43-101 Report Feb 2011\Ni 43-101 Report Rev 0 21 Feb.Doc Rev: 0 Date: 21 February 2011 9999FM0038 – 2
114
Figure 18-8 Pit structural map
Structurally the Constancia pit area is controlled by four major structural systems expressed as regional faults and local faults, some of which follow regional trends. These structures are significant because they directly influence the quality of the rock mass and therefore the stability of the pit walls, and the allowable slope angles. The four main fault systems are indicated in Table 18-11.
Table 18-11 Major structure systems in the Constancia Pit Area
System Average Strike Average Dip
System 1 N 11o W 65o SW System 2 N 56o E 69o SE System 3 N 80o W 79o SW System 4 N 06o W 65o NE
\\Bnefp01\Users$\Greg.Lane\My Documents\Current Projects\Current Studies\Constancia\Ni 43-101 Report Feb 2011\Ni 43-101 Report Rev 0 21 Feb.Doc Rev: 0 Date: 21 February 2011 9999FM0038 – 2
115
As noted earlier, rock fracture measurements were obtained from geologic surfaces and cell/window mapping in road cuts and outcrops, and from oriented core holes drilled specifically for geotechnical purposes. Geotechnical data relating to fracture intensity and other parameters were collected from the ore reserve characterisation holes but these holes conveyed no fracture orientation data. Data were identified as major structures (faults significant enough to be shown on surface geologic mapping), minor structures, and individual discontinuities (joints, bedding planes, and shears) and were identified separately in the database. The fracture orientation data were adjusted for orientation bias (Terzaghi, 1965) resulting from the alignment of the source of the observations (for example, drill hole orientation or cut slope azimuth).
A geotechnical database was established based on the mineral exploration drilling conducted by Norsemont, dating back to 2005, up to and including the 2008/9 geotechnical site investigation results. The geotechnical database includes details of alteration, oxidation, lithology, rock strength, and rock fracturing characteristics including spacing, roughness, infilling, Rock Quality Designation (RQD) and continuity (or persistence) estimated according to the fracture type and infilling, in accordance with ISRM recommended procedures (1981).
All of the pit wall slope stability analyses assumed that the water table would be lowered behind the pit walls by perimeter dewatering wells and in-pit dewatering holes. This is consistent with the pit dewatering plan and allows the pore water pressures to be neglected. Unit weight data and classification parameters assumed damp/wet conditions.
The rock mass parameters were compiled into estimates of rock mass quality through the Rock Mass Rating (RMR) system of Bieniawski (1989), and further into the Geomechanical Strength Index (GSI); (Hoek, Marinos, and Benissi, 1998; and Hoek, Wood and Shah, 1992). The RMR classification data by core run show that 58% of the values obtained correspond to “poor” rock, 38% to “fair” and 4% to “good” rock. In the Constancia pit area, the rock mass ratings are controlled by weathering, alteration, fracture intensity, and the filling material in fault zones, but are not greatly influenced by the lithology.
From the rock mass quality ratings, the geotechnical conditions were discretised into six major geotechnical units, or domains, as follows:
Geotechnical Unit I – overburden consisting of Quaternary deposits formed mainly by glacial till and areas of bog material or wetlands. The maximum thickness of this unit is approximately 40 m in the pit area, but is typically much less.
Geotechnical Unit II – residual soil to extremely weathered rock with intense oxidation, extremely weak to very weak and fragmented: characteristically similar to fault zones bearing gouge or intensely fractured/crushed rock fillings.
Geotechnical Unit III – highly weathered to fair rock with moderate oxidation, weak and highly fractured. GSI values are typically in the 30-40 range.
Geotechnical Unit IV – moderately weathered rock, medium strong to strong but moderately to highly fractured. GSI values typically range between 40 and 50.
Geotechnical Unit V – slightly weathered rock, strong to very strong, slightly to moderately fractured. GSI values are typically in excess of 50.
Geotechnical Unit VI – slightly weathered to fresh rock, strong to very strong, slightly fractured. These rock masses approximate the strength of the intact rock. GSI values are typically in excess of 60.
\\Bnefp01\Users$\Greg.Lane\My Documents\Current Projects\Current Studies\Constancia\Ni 43-101 Report Feb 2011\Ni 43-101 Report Rev 0 21 Feb.Doc Rev: 0 Date: 21 February 2011 9999FM0038 – 2
116
The investigations showed that for about three-quarters of the ultimate pit slope perimeter, slope stability is influenced chiefly by discrete major structures and block faults that intercept broad zones of more competent rock. These areas were analyzed by considering the discrete structures kinematically, and by performing continuum, limit-equilibrium stability analyses on sections representing the discrete structures and the intervening rock mass zones. The remainder (1/4) of the ultimate pit slope areas are influenced chiefly by a more homogeneous condition of poor rock quality. These areas were analysed by limit equilibrium and continuum modeling methods. In both cases, the applicable fault zone and rock mass strength conditions were characterised from rock quality values developed from core inspection and surface mapping, coupled with laboratory geotechnical testing on recovered fault gouges and rock discontinuities.
The pit slope recommendations are associated with nine pit design sectors (Figure 18.19), which were established to group areas of the proposed pit having similar geometric, geological and rock mass quality characteristics. Each pit sector was characterised by one or more Geotechnical Units described above, each unit representing a region of generally consistent rock mass character. Major fault structures were considered as individual units. Minor fault structures, as well as alteration, oxidation, and lithology were included in the overall rock mass characterisation within a particular unit.
Rock structure orientation data were applied for each design sector. For each design sector, the data included rock structural observations and fracture statistics from surface observations and oriented core holes pertinent to that particular sector. Therefore, the kinematic analyses reflect both surface and subsurface data for each sector.
The recommended slope angle may be determined by the catch bench requirements (catch bench design) or by global stability (which considers the rock mass at the global (inter-ramp or overall pit wall) scale. Catch bench integrity may be driven by kinematics, which identifies the distribution of localised discontinuities along which catch bench degradation may take place in toppling, plane shear, or wedge failure modes. Catch bench integrity may also be affected by rock mass failures responding to overall weak rock mass conditions. Methods used to determine the appropriate pit slope angles based on catch bench design or global stability included detailed kinematic stability at bench and inter-ramp scales; limit equilibrium analysis; probabilistic analysis by the limit equilibrium method; and stress analysis using finite element methods in certain design sectors. If the slope design is governed by global stability the resulting catch benches may be wider than the required 11.5 m minimum, assuming that the same bench face angle occurs.
For purposes of checking the catch bench design, kinematic and limit equilibrium stability analyses indicate that a bench face angle of 65-70o is expected to be achievable, in most places, for the Constancia pit walls. A 30 m high double bench configuration, requiring catch benches at least 11.5 m wide (Ryan and Pryor, 2000) has been considered for pit development (the calculated minimum catch bench width includes an additional 1 m allowance for block loss at the crest).
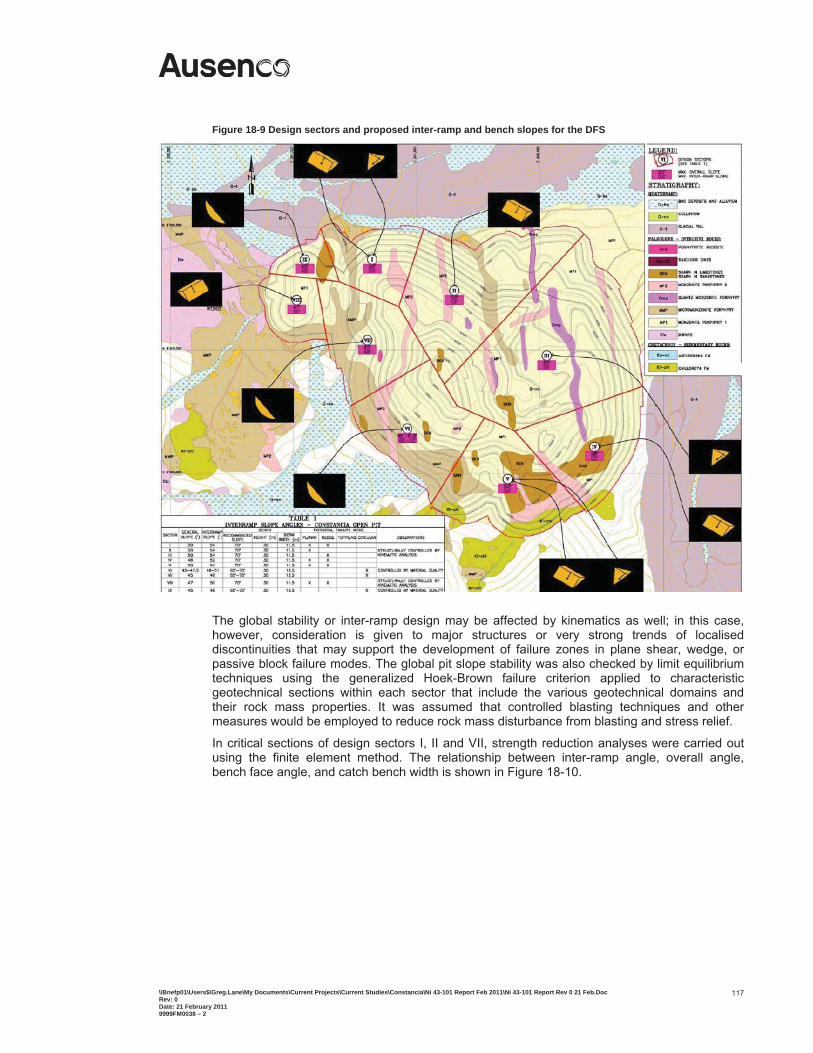
\\Bnefp01\Users$\Greg.Lane\My Documents\Current Projects\Current Studies\Constancia\Ni 43-101 Report Feb 2011\Ni 43-101 Report Rev 0 21 Feb.Doc Rev: 0 Date: 21 February 2011 9999FM0038 – 2
117
Figure 18-9 Design sectors and proposed inter-ramp and bench slopes for the DFS
The global stability or inter-ramp design may be affected by kinematics as well; in this case, however, consideration is given to major structures or very strong trends of localised discontinuities that may support the development of failure zones in plane shear, wedge, or passive block failure modes. The global pit slope stability was also checked by limit equilibrium techniques using the generalized Hoek-Brown failure criterion applied to characteristic geotechnical sections within each sector that include the various geotechnical domains and their rock mass properties. It was assumed that controlled blasting techniques and other measures would be employed to reduce rock mass disturbance from blasting and stress relief.
In critical sections of design sectors I, II and VII, strength reduction analyses were carried out using the finite element method. The relationship between inter-ramp angle, overall angle, bench face angle, and catch bench width is shown in Figure 18-10.
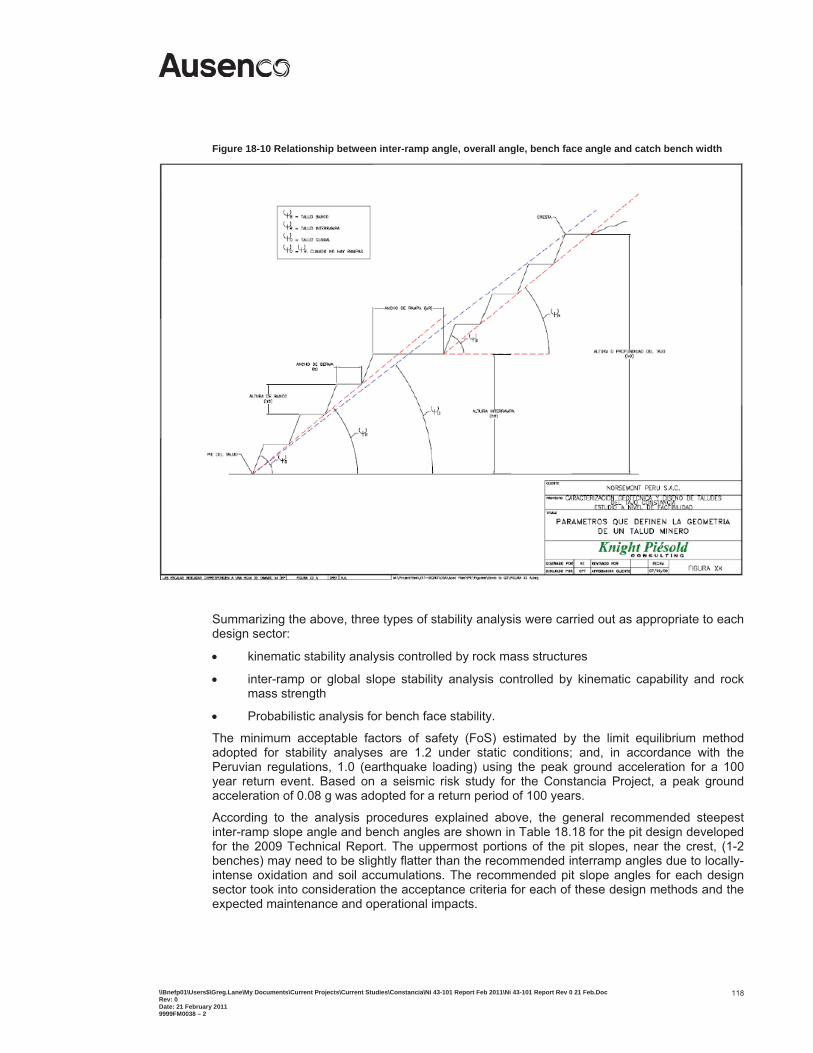
\\Bnefp01\Users$\Greg.Lane\My Documents\Current Projects\Current Studies\Constancia\Ni 43-101 Report Feb 2011\Ni 43-101 Report Rev 0 21 Feb.Doc Rev: 0 Date: 21 February 2011 9999FM0038 – 2
118
Figure 18-10 Relationship between inter-ramp angle, overall angle, bench face angle and catch bench width
Summarizing the above, three types of stability analysis were carried out as appropriate to each design sector:
kinematic stability analysis controlled by rock mass structures
inter-ramp or global slope stability analysis controlled by kinematic capability and rock mass strength
Probabilistic analysis for bench face stability.
The minimum acceptable factors of safety (FoS) estimated by the limit equilibrium method adopted for stability analyses are 1.2 under static conditions; and, in accordance with the Peruvian regulations, 1.0 (earthquake loading) using the peak ground acceleration for a 100 year return event. Based on a seismic risk study for the Constancia Project, a peak ground acceleration of 0.08 g was adopted for a return period of 100 years.
According to the analysis procedures explained above, the general recommended steepest inter-ramp slope angle and bench angles are shown in Table 18.18 for the pit design developed for the 2009 Technical Report. The uppermost portions of the pit slopes, near the crest, (1-2 benches) may need to be slightly flatter than the recommended interramp angles due to locally-intense oxidation and soil accumulations. The recommended pit slope angles for each design sector took into consideration the acceptance criteria for each of these design methods and the expected maintenance and operational impacts.
\\Bnefp01\Users$\Greg.Lane\My Documents\Current Projects\Current Studies\Constancia\Ni 43-101 Report Feb 2011\Ni 43-101 Report Rev 0 21 Feb.Doc Rev: 0 Date: 21 February 2011 9999FM0038 – 2
119
From the 2009 geotechnical studies, the tabulated bench face angles were expected to occur with a calculated overall frequency of at least 65%. Since there is potential for catch bench failures and localised slope movement at the inter-ramp scale, clean-up, maintenance, and special attention to rock fall protection will be necessary. In general, a higher probability of failure may be tolerable where the slopes are low, where the mining configuration permits rock fall catchment, where the service time of the slope is short, or when important facilities such as pump stations or ramps are not vulnerable to the slope in question.
Table 18-12 Inter-ramp slope angles – Constancia open pit
Inter-ramp slope angles recommended for the pit configuration developed for the 2009 Technical Report range from 48-54o depending on the design sector. Overall slope angles are the flatter of the angles resulting from kinematic or limit equilibrium analyses for the global stability and catch bench cases. Analyses of the expanded pit configuration suggest that the FoS criteria discussed above may not be fully met in portions of Sectors I, V, and VII.
Considering the open pit configuration developed for the 2009 Technical Report, the calculated probability of bench failure ranges between 8% and 27%, in about 77% of the bench face slopes. Based on the current geotechnical understanding of the Constancia pit geology, it has been calculated that a probability of failure of 55% pertains to the remaining 23% of the bench face slopes, chiefly in portions of the pit slopes that will expose substantial areas of GU-II and GU-III materials. This is most prevalent in Sectors V, VI, and VII. In such areas additional geotechnical investigation needs to be carried out in the next stage of engineering design.
The expanded pit slopes, which were chosen on the basis of the recommendations of the previous configuration, were assessed for stability. The slopes of the expanded pit were compared to the slopes presented within the 2009 Technical Report along the same lines of section; the differences are not geotechnically significant, based on current data, for Sectors III, IV, VIII, and IX. Although the expanded pit is wider and deeper than the design presented in the 2009 Technical report, it has been determined that the previously-studied geotechnical domains, including the rock fabric and kinematic analyses performed for the catch bench characterization, are pertinent to the expanded pit configuration at the preliminary feasibility level.
\\Bnefp01\Users$\Greg.Lane\My Documents\Current Projects\Current Studies\Constancia\Ni 43-101 Report Feb 2011\Ni 43-101 Report Rev 0 21 Feb.Doc Rev: 0 Date: 21 February 2011 9999FM0038 – 2
120
The expanded pit was examined with relation to the expression of previously-identified major structures and Geotechnical Units as they appeared on the stability analyses presented in the 2009 Technical Report. From a geotechnical stability standpoint, some parts of the expanded pit present potentially significant contrasts relative to the previous design in terms of additional width mined, increased height of pit slope, or exposure of interpreted geologic structures. Sectors I, II-A, V, VI, and VII were considered to warrant new analyses. The same limit equilibrium methods and rock mass characterization were used as were employed in the analyses described in the 2009 Technical Report, by applying the expanded pit geometry along the previous geotechnical analyses sections. The results indicated that, at the interramp scale, the expanded pit slope configuration in Sectors I and VII may be slightly below the minimum FoS criteria described above. Smaller sections of other slopes, especially where dominated by GU-II material, are also slightly below the FoS criteria. Additional geotechnical exploration and evaluation are necessary in such areas to optimize the pit slope design.
18.2.3 Geotechnical investigations at the TMF, PAG WRF and plant site This section is as reported in the 2009 Technical Report.
18.2.4 Borrow materials
This section is as reported in the 2009 Technical Report.
18.2.5 Natural hazards and slope stability
This section is as reported in the 2009 Technical Report.
18.2.6 Seismic risk analysis This section is as reported in the 2009 Technical Report.
18.3 Hydrological Studies This section is as reported in the 2009 Technical Report.
18.4 Process Plant Design
18.4.1 General layout and description
The following section was extracted from the 2009 Technical Report and revised based on the FSO outcomes.
The site layout, including the mine, processing plant, waste dumps, and tailings facilities, is shown in Figure 18-11.
The process plant is located to the west of the open pit mine, with the TMF located approximately 3 km south of the plant. The PAG WRF is located adjacent to the pit. Road access to the process plant and pit is from a connection to the existing north-south road 2 km to the western side of the plant. The construction and operations accommodation camp is located in walking distance of the process plant.
The mine is sited in hilly terrain. The plant site has been selected as being the closest site available to the mine that is both economical and practical to develop, but significant earthworks are required to establish a multi-tiered pad. Major plant areas are all located on in-situ material, i.e. constructed on cut.
Some general buildings are constructed on engineered embankment. A suitably sized construction laydown area is provided for the establishment of management offices and construction requirements.
Power supply is provided to the mine from the existing network via a 138/220 kV transmission line from the Tintaya substation.

\\Bnefp01\Users$\Greg.Lane\My Documents\Current Projects\Current Studies\Constancia\Ni 43-101 Report Feb 2011\Ni 43-101 Report Rev 0 21 Feb.Doc Rev: 0 Date: 21 February 2011 9999FM0038 – 2
121
The crushing facility is benched into the hillside to minimise expensive ROM pad construction. The layout allows the crushing facility to be free-draining ensuring practical and economical maintenance.
The mine office and workshops are located immediately to the East of the process plant, and is located outside the 500 m designated blast zone from the pit boundary. Significant costs would have been required to expand the existing process plant site to accommodate these buildings nearer to the plant.
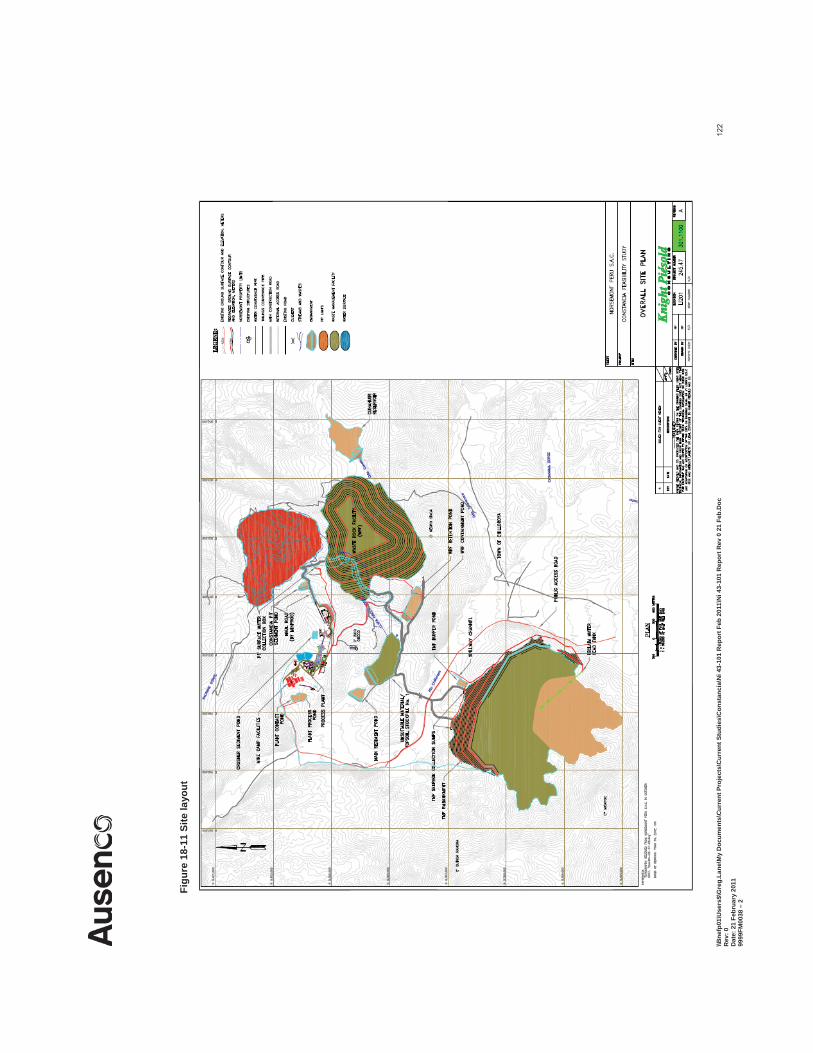
\\Bne
fp01
\Use
rs$\
Gre
g.La
ne\M
y D
ocum
ents
\Cur
rent
Pro
ject
s\C
urre
nt S
tudi
es\C
onst
anci
a\N
i 43-
101
Rep
ort F
eb 2
011\
Ni 4
3-10
1 R
epor
t Rev
0 2
1 Fe
b.D
oc
Rev
: 0
Dat
e: 2
1 Fe
brua
ry 2
011
9999
FM00
38 –
2
122
Figu
re 1
8-11
Site
layo
ut
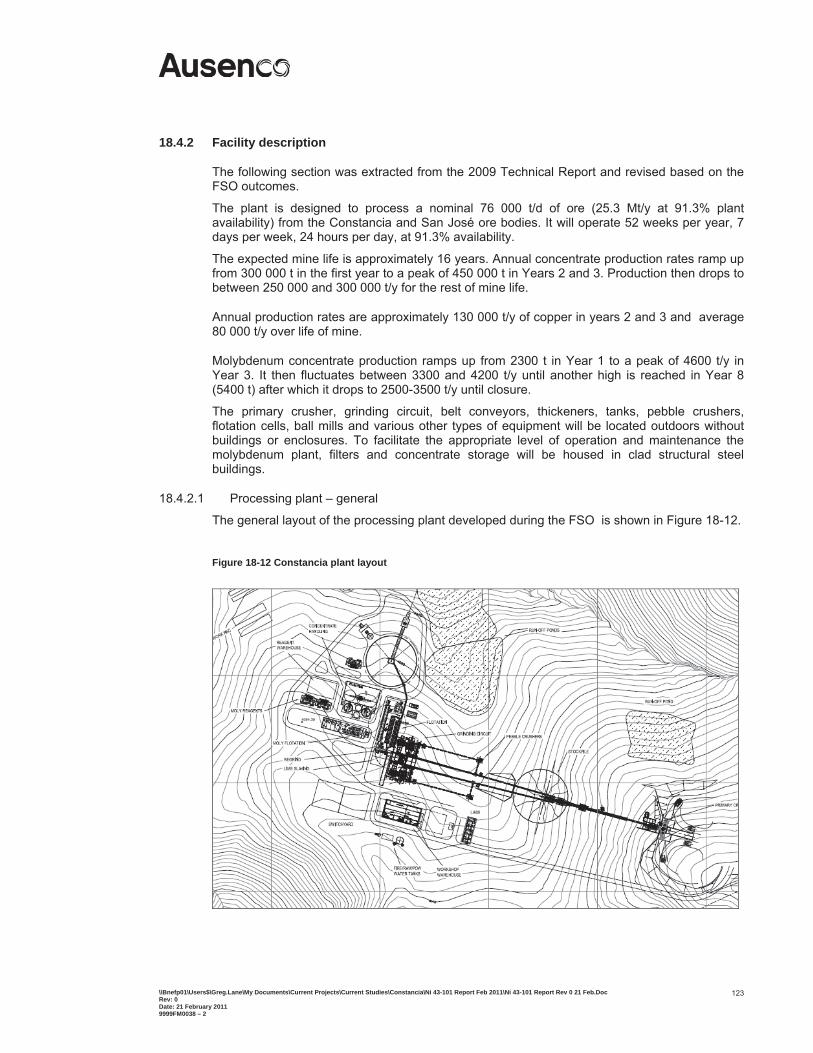
\\Bnefp01\Users$\Greg.Lane\My Documents\Current Projects\Current Studies\Constancia\Ni 43-101 Report Feb 2011\Ni 43-101 Report Rev 0 21 Feb.Doc Rev: 0 Date: 21 February 2011 9999FM0038 – 2
123
18.4.2 Facility description
The following section was extracted from the 2009 Technical Report and revised based on the FSO outcomes.
The plant is designed to process a nominal 76 000 t/d of ore (25.3 Mt/y at 91.3% plant availability) from the Constancia and San José ore bodies. It will operate 52 weeks per year, 7 days per week, 24 hours per day, at 91.3% availability.
The expected mine life is approximately 16 years. Annual concentrate production rates ramp up from 300 000 t in the first year to a peak of 450 000 t in Years 2 and 3. Production then drops to between 250 000 and 300 000 t/y for the rest of mine life.
Annual production rates are approximately 130 000 t/y of copper in years 2 and 3 and average 80 000 t/y over life of mine.
Molybdenum concentrate production ramps up from 2300 t in Year 1 to a peak of 4600 t/y in Year 3. It then fluctuates between 3300 and 4200 t/y until another high is reached in Year 8 (5400 t) after which it drops to 2500-3500 t/y until closure.
The primary crusher, grinding circuit, belt conveyors, thickeners, tanks, pebble crushers, flotation cells, ball mills and various other types of equipment will be located outdoors without buildings or enclosures. To facilitate the appropriate level of operation and maintenance the molybdenum plant, filters and concentrate storage will be housed in clad structural steel buildings.
18.4.2.1 Processing plant – general
The general layout of the processing plant developed during the FSO is shown in Figure 18-12.
Figure 18-12 Constancia plant layout
\\Bnefp01\Users$\Greg.Lane\My Documents\Current Projects\Current Studies\Constancia\Ni 43-101 Report Feb 2011\Ni 43-101 Report Rev 0 21 Feb.Doc Rev: 0 Date: 21 February 2011 9999FM0038 – 2
124
The processing plant has been laid out in accordance with established good engineering practice for traditional grinding and flotation plants. The major objective is to make the best possible use of the natural ground contours to minimise pumping requirements by using gravity flows and also to reduce the height of steel structures.
To optimise the cost of the major footings for the SAG mill, the height of the SAG mill above grade has been minimised by locating the cyclone feed sump as low as possible. The mill cyclones have been located so that the cyclone overflow can gravitate into the rougher conditioning tank.
At the other end of the flotation bank, the copper tailings thickener has also been located to facilitate gravity flow and eliminate the requirement for another large set of pumps.
Due consideration has been given to the layout of the molybdenum plant to facilitate good housekeeping and occupational health and safety requirements.
The copper and molybdenum plants are independent of each other and separated by a reasonable distance. Further, the molybdenum concentrator is sited downwind of major high occupancy plant areas (prevailing wind on site is from the north).
Similarly, the reagents areas can release hazardous gases and so is located downwind of high occupancy plant areas, but close enough to the flotation area to avoid long runs of piping.
Rainwater runoff and general spillages from the processing plant are fully contained and directed to the dirty water sediment pond. Again, the natural fall of the site is used to direct flow to this pond, located at the western end of the site at the lowest point, to avoid the need for pumps.
Wherever possible, major substations and motor control centre (MCCs) have been located as close as possible to the drives to minimise cable run lengths.
18.4.2.2 Primary Crushing and Conveying
The ore is delivered to the ROM pad by haul trucks (nominally 220 to 270 t capacity) and is dumped directly into the primary crusher dump pocket. ROM ore top size is approximately 1 m. The ROM pad is approximately 175 m long and 125 m wide. It provides haul truck access to the primary crusher dump pocket from two sides.
Provision will be made on the ROM pad for two emergency ROM stockpiles, each with areas of 2000 m2, which would provide a total emergency capacity for approximately 24 000 t of ore, sufficient for 5-6 hours of primary crusher operation. The emergency stockpiles can be loaded into the crusher dump pocket by FEL. The potential exists for additional storage areas for “off-spec” ore to be located away from the ROM pad.
A design feed rate of 4500 t/h is nominated for the crushing plant with a maximum rate of 6000 t/h.
The crushed coarse ore stockpile will allow the plant to continue to run during crusher outages. A 60” x 113” primary gyratory crusher is fed by rear-dumping from two dump points by trucks, or by FEL from a stockpile. The third face at the crusher dump pocket is fitted with a drive-up ramp allowing bobcat and excavator access into the dump pocket for clean-out prior to maintenance work being undertaken or for clearing blockages during normal operations.
A static rock breaker is situated at the feed bin to break oversise rocks and to clear blockages. Dust suppression water is sprayed within the dump hopper during the tipping of each truck load.
\\Bnefp01\Users$\Greg.Lane\My Documents\Current Projects\Current Studies\Constancia\Ni 43-101 Report Feb 2011\Ni 43-101 Report Rev 0 21 Feb.Doc Rev: 0 Date: 21 February 2011 9999FM0038 – 2
125
The ore is crushed using a closed side setting of 125 mm. Expected maximum lump size is around 250 mm, with a P80 of 115 mm. The primary crusher is equipped with a 750 kW drive motor.
The crusher discharges into a pocket located directly above a 2.4 m wide belt feeder which transfers crushed ore onto the 1.8 m wide stockpile feed conveyor at up to 6000 t/h.
A metal detector is fitted above the crusher discharge belt feeder and a self-cleaning magnet is suspended at the transfer point from the conveyor to the stockpile feed conveyor. Tramp metal is discharged to a collection bin. The stockpile feed conveyor is equipped with a weightometer. A dust suppression system is provided for the primary crushing area.
The primary crusher area is supervised from a local control room. The crusher MCC is located on ground level to house the electrical and instrumentation ancillaries. It is supplied from the primary crusher substation.
Crusher lubricant and hydraulic fluid are water-cooled. Closed circuit cooling water will be sourced from a cooling tower in the stockpile and pebble crusher area. An air blower provides sealing air to prevent dust entering the crusher eccentric in the bottom shell, via the dust seal chamber. A 250 t crawler jib crane is retained on site for use in crusher maintenance. An air compressor supplies crusher air services. Water is removed from the area by a sump pump.
The stockpile feed conveyor has a maximum capacity of 6000 t/h, and discharges crushed coarse ore onto the open stockpile. The stockpile has a live capacity of 50 000 t, or approximately 16 hours of plant running time. Two reclaim tunnels contain two apron reclaim feeders each, with design capacities of 1500 t/h each.
Reclaimed reclaim ore from beneath the stockpile discharges onto two 1200 mm wide SAG mill feed belt conveyors.
The reclaim tunnels house the reclaim feeders, maintenance hoists, the loading end of the SAG mill feed conveyor, ventilation fans and necessary air, water, and fire suppression services.
A dust suppression system is provided for discharge and loading points. Water is removed from the reclaim area by a sump pump.
The SAG mill feed conveyors are equipped with reclaim weightometers, pebble crusher discharge loading points, and SAG mill feed weightometers. The SAG mill feed conveyor design capacity for combined crushed ore feed and crushed mill pebbles is 2000 t/h (of crushed ore and recycled pebbles).
SAG mill grinding media balls (125 mm nominal) are added to a 400 t SAG mill ball storage bins by FEL. Variable speed SAG mill grinding media feeders feed balls onto the coarse ore on the SAG mill feed conveyor, at a controlled rate.
18.4.2.3 Grinding
Grinding reduces the particle size of the crushed ore to a target grind size of 106 m, suitable for flotation. The SAG/ball (SAB), and later with pebble crushing (SABC), grinding circuit contains two variable speed dual-pinion SAG mills with trommel screens, two pebble crushers (retrofitted in Year 5 for Year 6 operation), two cyclone feed pumps, two cyclone clusters, and two fixed speed, dual-pinion ball mills.
The SAG mills grind a nominal 3158 t/h of fresh crushed ore from the stockpile (and a nominal 790 t/h of recycled ore pebbles after Year 5). The 10.98 m x 6.05 m (EGL) SAG mills are equipped with a variable speed twin 8 MW motors. Each of the two 7.92 m dia, 12.4 m (EGL)
\\Bnefp01\Users$\Greg.Lane\My Documents\Current Projects\Current Studies\Constancia\Ni 43-101 Report Feb 2011\Ni 43-101 Report Rev 0 21 Feb.Doc Rev: 0 Date: 21 February 2011 9999FM0038 – 2
126
fixed-speed twin-pinion ball mills is driven by two 8 MW motors. The mill drives are started with liquid resistance starters and are fitted with reduction gearing and inching drives.
The mill lubrication systems are water-cooled. Metallic liners are used in both the SAG mill and the two ball mills. Mill liner handling tools, mill liner bolt tools, monorails, and mill feed chute trolleys are provided for mill liner maintenance.
The pebbles will be crushed and recycled through the SAG mill. Each of the two pebble crushers is equipped with a 600 kW drive. Each of the two cyclone feed pumps is equipped with a 1.5 MW drive.
Ore entering the SAG mill feed chute is combined with process water, forming the feed to the SAG mill. Size reduction is realised by grinding within the mill with the charge and steel balls.
The SAG mill slurry exits through the 25 mm aperture discharge grate (later with 75 mm grates with the introduction of pebble crushing) and passes over a trommel with 15 mm apertures.
After Year 5, the 15 to 75 mm ore pebbles from the oversize of the SAG mill discharge screen are recycled to the pebble crushing bins, via 600 mm wide pebble conveyors, fitted with weightometers, metal detectors and tramp metal magnets. SAG mill ball scats and tramp metal are separated from the ore pebbles and sent to either of the two tramp bins. Excess pebbles can overflow from the pebble crushing bin to a pebble crusher overflow bunker. Pebbles may be bypassed around the pebble crushers to the SAG mill feed conveyor. The pebble crushers are cone type crushers producing a product nominally with P80 of 13 mm. Pebble crusher discharge is returned to the SAG mill feed conveyors. Crusher lubricant and hydraulic fluid are cooled by oil-to-water coolers. An overhead crane is provided for pebble crusher maintenance. Water is removed from the pebble crushing area by a sump pump.
SAG mill discharge slurry passes as underflow through the trommel screen and enters the SAG mill discharge hopper, together with the undersize discharge from the ball mill trommel screens. Dilution process water is added, before the combined slurry (SG 1.64) is pumped at 4700 m3/h (maximum) by the parallel circuit, cyclone feed pumps, to two hydro-cyclone clusters for classification. Each of the cyclone feed pumps has a 1.5 MW drive motor. A spare bare shaft cyclone feed pump is to be stored at site to allow immediate change-out of a defective pump. The scats from the two ball mill trommel screens discharge to two scats bunkers.
A maximum 3016 t/h of oversized slurry particles reports to each of the two cyclone cluster underflows and is directed back to the two ball mill feed chutes. Approximately 1580 t/h from each of the two primary grinding cyclone overflows, having a particle size P80 of 106 m, is transferred to cyclone overflow boil boxes, and from there via gravity to the copper rougher flotation feed conditioning tank.
Ball mill grinding media (steel balls – 65 mm nominal size) are fed by a FEL to the ball mill storage bins. Balls are discharged to a kibble attached to the jib or tower crane and transferred to ball mill ball feeders and storage bins. Balls are added to either of the two ball mills by diverting balls from the feeder to one or other of the two ball mill feed chutes.
Lubricating oils are cooled by oil-to-water heat exchangers. Closed circuit cooling water for the entire grinding area is circulated through a cooler located adjacent to the plant. Water is removed from the grinding area by two sump pumps.
A large mobile crane retained at the site would be available for maintenance in the mill and cyclone areas. In addition, a tower crane is located at the end of the grinding floor for use with moderate lifts.
\\Bnefp01\Users$\Greg.Lane\My Documents\Current Projects\Current Studies\Constancia\Ni 43-101 Report Feb 2011\Ni 43-101 Report Rev 0 21 Feb.Doc Rev: 0 Date: 21 February 2011 9999FM0038 – 2
127
18.4.2.4 Copper flotation
This section is as reported in the 2009 Technical Report.
18.4.2.5 Molybdenum flotation
This section is as reported in the 2009 Technical Report.
18.4.2.6 Copper concentrate thickening and filtration
This section is as reported in the 2009 Technical Report. However, the 2009 Technical Report nominated three PF 144 filters and cycle times of 12.5 minutes. With this cycle time these filters have a capacity of up to 400 00 t/y each and there appears to be capacity to optimise the current arrangement.
18.4.2.7 Concentrate storage and loadout
After filtering, the copper concentrate is transferred to a shuttle conveyor and discharged onto the copper concentrate product storage stockpiles inside the copper concentrate and load-out building.
The building contains a live stockpile with capacity for seven days production (12 000 t). An emergency stockpile with a further seven days production capacity is allowed externally on hardstand, if problems arise with shipment to the port.
18.4.2.8 Molybdenum concentrate thickening and filtration
This section is as reported in the 2009 Technical Report.
18.4.2.9 Tailings disposal
This section is as reported in the 2009 Technical Report. Given the grind P80 of 106 microns, the thickener is potentially conservatively sized and there is an opportunity to review the selection during the basic design phase.
18.4.2.10 Reagents
This section is as reported in the 2009 Technical Report.
18.4.2.11 Water services
Water services cover raw water, fire water, process water, gland seal water, potable water, safety shower water, and cooling water.
The raw water supply is provided from bores to the process plant via a 2500 m3 fire/raw water tank, and is best located above the plant. The average requirement for raw water is 365 m3/h. The bottom 50% of the tank’s volume is reserved for fire protection, with the remainder being available for other use. Water is distributed around the site from this tank.
Raw water is also piped to the flotation area for use as molybdenum make-up water and for gland seal water.
The fire water system consists of independent fire water pump sets and a dedicated fire water main. The fire water main is generally buried and is fitted with above-ground fire hydrants and hose reels. A jockey pump is used to maintain pressure in the fire water main. The electric fire pump is the duty pump, with the diesel fire pump as standby. The fire-water reserve provides four hours of fire fighting capability at a fire water pumping rate of 344 m3/h.
\\Bnefp01\Users$\Greg.Lane\My Documents\Current Projects\Current Studies\Constancia\Ni 43-101 Report Feb 2011\Ni 43-101 Report Rev 0 21 Feb.Doc Rev: 0 Date: 21 February 2011 9999FM0038 – 2
128
The raw water supply also provides water to the potable water treatment plant located between the process plant and the accommodation camp, and is capable of producing 10 m3/h of potable water.
Potable water, stored in a 528 m3 potable water tank at the process plant, is pumped to the potable water reticulation system and the emergency shower water network by duty/standby potable water pumps.
Raw water provides make-up water to the cooling systems. Cooling water is in a closed circuit cooling water system, cooled by a heat exchanger coil in the open circuit cooling tower or closed system heat exchanger. The closed circuit cooling water is used for cooling bearing lubrication oil, hydraulic oil and gearbox oil. Closed circuit cooling water is stored in a tank and circulated by pumps.
Gland seal water for process plant pumps and other seals is provided by pumps.
18.4.2.12 Air services and other miscellaneous services
This section is as reported in the 2009 Technical Report.
18.4.2.13 Laboratory
This section is as reported in the 2009 Technical Report.
18.4.2.14 Diesel storage
This section is as reported in the 2009 Technical Report.
18.4.3 Electrical
This section was extracted from the 2009 Technical Report and modified as necessary.
18.4.3.1 Voltage levels
Project voltages will be aligned with existing Peruvian voltages, which follow the North American system. Voltages used include 22.9 kV, 13.8 kV, 4.16 kV and 460 V.
18.4.3.2 Altitude derating
The site has a nominal design altitude of 4300 masl (though the process plant is at around 4100 m). Standard equipment ratings for electrical equipment typically only apply up to 1000 m.
Medium Voltage (MV) design involves two correction factors to compensate for the lower pressure and density of air at high altitude:
A voltage correction factor – 0.67 at 4300 m
A current correction factor – nominally 0.933 at 4300 m.
In practical terms, equipment is often fully substituted with higher rated equipment. For example, a 22.9 kV application may use a 36 kV rated air-insulated switchboard, and similarly a 13.8 kV application may use a 22.9 kV rated air-insulated switchboard.
A gas-insulated switchboard (GIS) is usually fully-rated independent of altitude, and utilises special fully-insulated plug-socket cable terminations.
\\Bnefp01\Users$\Greg.Lane\My Documents\Current Projects\Current Studies\Constancia\Ni 43-101 Report Feb 2011\Ni 43-101 Report Rev 0 21 Feb.Doc Rev: 0 Date: 21 February 2011 9999FM0038 – 2
129
Low Voltage (LV) equipment typically only has current derating, with the standard phase clearances proving adequate for the lower voltages.
Vendor confirmation on equipment suitability for given altitude and duty have not been verified and vendor statements have been accepted for the purposes of this study.
18.4.3.3 MV power distribution
The following 13.8 kV switchboard is proposed:
Grinding.
The following 4.16 kV switchboards are proposed:
Primary crusher
Pebble crushing
Water services
Tailings
Tailings dam.
The following 22.9 kV overhead lines are proposed:
Primary crusher / heavy workshop / pit
Camp / tailings dam / bores
Camp waste water treatment plant.
The pit transportable substation produces 7.2 kV to suit the mining equipment.
Neutral earthing resistors (NERs) have been included on all transformers supplying MV switchboards and LV motor control centres.
18.4.3.4 Transformers
All transformers are oil-filled, outdoors, ONAN type, except for the smaller, indoors types used for small power distribution, which will be constant-voltage, dry-type.
Transformer protection will be included as per the design criteria. Where practicable, the protection will trip the upstream supply circuit-breaker upon fault detection.
Allowance has not been made for redundancy on transformers within the process plant area. It is recommended to purchase an additional transformer for each size as a spare.
Other than in the grinding area, no allowance has been made for redundancy on transformers within the process plant area. It is recommended to purchase an additional transformer for each size as a spare.
All outdoors transformers include the capability for future conversion to ONAF cooling to accommodate future expansion capacity if required.
18.4.3.5 MV switchgear
All MV switchgear within the processing plant will be fully type-tested.
\\Bnefp01\Users$\Greg.Lane\My Documents\Current Projects\Current Studies\Constancia\Ni 43-101 Report Feb 2011\Ni 43-101 Report Rev 0 21 Feb.Doc Rev: 0 Date: 21 February 2011 9999FM0038 – 2
130
A preliminary fault study showed that a 16 kA fault rating could be applied for certain MV switchboards, however, a 25 kA fault rating has been proposed for all MV switchboards within the processing plant to simplify procurement, spares and maintenance.
All MV switchboards will have remote operator panels, so that operators are not required to be in front of the switchboard when an open or close operation is to be performed.
18.4.3.6 Pit MV distribution
The pit area has a 22.9 kV overhead power line run to the proximity of the pit outer boundary. From there the power line extends partially around the pit periphery in both directions. A number of stab lines head towards the centre of the pit. Additional stab lines and completion of the peripheral run fully around the pit have been allowed for in the design, but those future works are not costed.
The pit machinery includes 7.2 kV drills and shovels. Two transportable substations have been included, each capable of powering one shovel and two drills. Substations are mounted onto heavy duty steel-framed skids. The 22.9/7.2 kV transformer is specially designed and manufactured to ensure longevity despite rough movement.
LV power for pit dewatering pumps has also been incorporated into the substation.
18.4.3.7 LV motor control centres
LV MCCs are all 460 VAC, double-sided, indoors type.
Distribution transformers have been sized to minimise spares inventory, with the preliminary selection for the largest size of 2500 kVA being chosen above the smaller 2000 kVA unit to minimise the quantity of MCCs required for the project. For a distribution transformer size of 2500 kVA, an MCC minimum fault rating of above 70 kA would be required. It is typical within the industry for costs to increase disproportionately when fault ratings exceed the industry threshold of 63 kA. Further assessment and discussion with potential vendors would be recommended to confirm whether it is more beneficial to reduce the large distribution transformer capacity (to say 2250 kVA) or to select the higher MCC fault rating.
MCC starter field control circuit voltage is 24 VDC. Contactor control voltage is centre-tapped 110 VAC for improved safety.
All LV switchgear within the process plant would be fully type-tested.
Soft starters are used on the larger non-VSD 460 V drives to reduce peak instantaneous current on the MCC, and hence contribute to reducing the applicable arc flash category.
18.4.3.8 Switchrooms
Switchrooms within the process plant will be blockwork buildings.
A transportable building is allowed for at the tailings dam. The transportable switchroom will be metalclad and manufactured from non-combustible materials, mounted a nominal 2 m above the ground.
The following features have been included for the switchrooms:
Air-conditioning, suitable for generated heat load of switchboards, MCC and VVVFs at (n+1) redundancy
Complete fit-out
\\Bnefp01\Users$\Greg.Lane\My Documents\Current Projects\Current Studies\Constancia\Ni 43-101 Report Feb 2011\Ni 43-101 Report Rev 0 21 Feb.Doc Rev: 0 Date: 21 February 2011 9999FM0038 – 2
131
Stairs and landings (as applicable)
Lighting and small power distribution boards and associated transformers
Pressurisation system to exclude dust
UPS system including distribution board and bypass switch.
A fire detection and suppression system has been included within each switchroom.
18.4.3.9 Fire detection and alarm system
Substation fire indicator panels (FIPs) would report to a site main fire indicator panel (MFIP). A connection to the MFIP has been included within the new control room.
The substation FIPs are connected to the MFIP via a fibre-optic connection.
A basic fire detection and alarm system has been included for the process plant areas.
18.4.3.10 Variable Speed Drives (VSDs)
The variable speed drives (VSDs) are based on:
ABB ACS1000 series for MV motors
ABB ACS800 series for LV motors.
All VSDs are mounted external to MCCs.
The ABB MV VSDs cannot operate at 4.16 kV output at this altitude, and can drive a maximum 3.3 kV motor.
LV VSDs have significant (x 0.67)
18.4.3.11 Diesel generated emergency supply
A 6 MW diesel generated emergency supply is to be provided by a turnkey power station vendor. Preliminary assessment, based upon recommendations from a potential vendor, is that four 4.16 kV diesel generating sets would be connected to a 4.16 kV power station switchboard, which feeds through a 4.16/22.9 kV transformer onto the 22.9 kV main switchboard.
Generator power output de-rating is 0.66 at 4100 masl, meaning larger units are required compared to sea level.
18.4.3.12 Other power
Main power and lighting distribution has been included around the EPCM and construction contractors’ yard.
18.4.3.13 Harmonic mitigation
Harmonic filters are not required and this has a significant positive impact on plant footprint requirements.
\\Bnefp01\Users$\Greg.Lane\My Documents\Current Projects\Current Studies\Constancia\Ni 43-101 Report Feb 2011\Ni 43-101 Report Rev 0 21 Feb.Doc Rev: 0 Date: 21 February 2011 9999FM0038 – 2
132
18.4.3.14 Lighting and small power
MCCs supply 3 phase power to dedicated 460/400-230 V, L and SP transformers which then feed adjacent L and SP distribution boards. Three phase small power is 380 V (as opposed to 460 V for motors), with single phase at 220 V.
Bulkhead lighting type is predominantly 70 W high pressure sodium, and fittings are mounted either using 2.4 m lighting poles, or attached directly to buildings and other infrastructure where possible.
Emergency light fittings will have individual batteries. An assessment of a centralised UPS system may be considered in the design phase.
18.4.3.15 Earthing and lightning protection
Earthing and lightning protection includes the following hardware implementations:
Buried equipotential bonding conductor run throughout process plant area and attached to all major structures and equipment
Earth mats at all transformer yards
Earth tails from all structure columns and concrete reinforcing onto the buried conductor system
Overhead earth wire on all overhead power lines, taken to earth at regular pole intervals
Surge arrestors at all overhead-to-surface power line transitions
Surge diverters on all LV MCC incomers.
18.4.4 Instrumentation and control
This section is as reported in the 2009 Technical Report.
18.4.5 Buildings
18.4.5.1 Heavy and light vehicle workshop and mine office
This section is as reported in the 2009 Technical Report.
18.4.5.2 Heavy vehicle washbay
This section is as reported in the 2009 Technical Report.
18.4.5.3 Vehicle fuel distribution bowser
This section is as reported in the 2009 Technical Report.
18.4.5.4 Mine dispatch centre
This section is as reported in the 2009 Technical Report.
18.4.5.5 Core shed
This section is as reported in the 2009 Technical Report.
\\Bnefp01\Users$\Greg.Lane\My Documents\Current Projects\Current Studies\Constancia\Ni 43-101 Report Feb 2011\Ni 43-101 Report Rev 0 21 Feb.Doc Rev: 0 Date: 21 February 2011 9999FM0038 – 2
133
Pebble Crusher Building
There is no pebble crusher building in the revised layout.
Copper Filtration and Concentrate Storage Building
This facility accommodates all the equipment associated with the copper filtration plant and concentrate storage. The filter(s) is in an elevated position above the concentrate storage shed on a concrete suspended slab. Concentrate is discharged to a dual direction shuttle conveyor for distribution to the concentrate stockpile. It is a steel framed structure, fully clad to concrete bunker walls, with 4 m high double roller shutter doors to access each stockpile.
Molybdenum Filtration Building
The molybdenum filtration plant is to be in a building, approximately 15 m x 18 m, comprising a steel portal framed structure, fully clad, with 6000 mm high double-access doors, and an overhead crane.
Copper Flotation Blower Building
This facility is constructed to accommodate nine blowers and ancillary equipment to service the copper flotation plant.
The building consists of a steel portal framed structure, fully clad, with two by 6000 mm high double access doors, and a full-length overhead crane. The approximate size of the building is 18 m x 10 m.
Air Compressor House
This facility accommodates three air compressors and ancillary equipment to service the process plant. It also houses the main instrument air drier. The approximate size of the building is 16 x 6 m (100 m2).
Reagents and Packaging Store
This facility caters for the reagents and packaging requirements. The approximate size of the building 2
18.4.5.6 Process plant architectural buildings
This section is as reported in the 2009 Technical Report.
18.5 Infrastructure
18.5.1 Access road
This section is as reported in the 2009 Technical Report.
18.5.2 Water supply
This section is as reported in the 2009 Technical Report.
\\Bnefp01\Users$\Greg.Lane\My Documents\Current Projects\Current Studies\Constancia\Ni 43-101 Report Feb 2011\Ni 43-101 Report Rev 0 21 Feb.Doc Rev: 0 Date: 21 February 2011 9999FM0038 – 2
134
18.5.3 Accommodation camp
This section is as reported in the 2009 Technical Report.
18.5.4 Power supply
18.5.4.1 Electricity market study
This section is as reported in the 2009 Technical Report.
18.5.4.2 Power supply option
Option studies were undertaken based upon connection into the Peruvian National Interconnected Electric System (SEIN), and terms of reference for the investigation included technical, economic, environmental, land ownership, cultural and heritage considerations.
The plant maximum demand is estimated to be 105 MW with an average load of 85 to 90 MW in the first five years and increasing as more competent ore is treated in later years.
The scope of the study included the required facilities at the origin of supply, the transmission line, switchyard and main switchroom at the Constancia mine site.
The DFS identified the preferred option of initially securing supply at 138 kV from Tintaya substation, with transmission by means of a single circuit supported by lattice steel towers over a route length of 70 km to the Constancia mine site, designed for future operation at 220 kV. It was assumed that 220 kV supply will become available from the Tintaya substation in 2012.
Norsemont advised that the Tintaya substation upgrade has been approved by others and that the 220 kV supply would likely be available for the Constancia project.
18.5.4.3 Power line design
This section is as reported in the 2009 Technical Report.
18.5.4.4 Constancia substation 138/220 kV
The DFS Constancia substation switchyard has been designed with overhead busbar systems, switchgear, metering and protection equipment to control the ultimate installation of two by 100 MVA primary transformers to provide the plant with 100% redundancy at this level in the main power supply.
The main switchyard will be designed for a capacity in excess of 200 MVA, and the layout provides for the incoming bay for the transmission line from Tintaya and space for a future bay to accommodate extension of the line, or an alternative connection to the Peruvian grid.
The DFS allowed only one 100 MVA primary transformer in the estimate with all associated switchgear, metering and protection equipment to supply the estimated plant maximum demand of 95 MW or 100 MVA at the minimum required COES power factor of 0.95.
The FSO requires one 120 MVA transformer and Ausenco has allowed an additional $0.5M in the capital cost estimate. The DFS electrical system was originally designed with a 120 MVA transformer and no other modifications are considered necessary to the DFS design.
Switchyard switchgear current and short-circuit ratings will be standardised at 1250 A and 25 kA respectively.
\\Bnefp01\Users$\Greg.Lane\My Documents\Current Projects\Current Studies\Constancia\Ni 43-101 Report Feb 2011\Ni 43-101 Report Rev 0 21 Feb.Doc Rev: 0 Date: 21 February 2011 9999FM0038 – 2
135
Insulation levels and surge protection equipment will be standardised with IEC values and reflect the 4000 masl elevation of the Constancia Substation and the level of iso-keraunic activity in the region.
The proposed switchyard design and layout is based upon the use of air-insulated switchgear manufactured in accordance with IEC standards.
The primary transformer will be constructed with winding tappings of 220 kV/36.5-22.9. The main 22.9 kV metal clad switchboard is configured with two outdoor main circuit breakers connected by means of dual bus duct to the split main busbar system fitted with a normally open bus tie. The switchboard provides for 29 supply feeders to the plant and the overhead distribution systems.
The main switchboard is housed within a double-storey blockwork switchroom. The ground floor comprises a cabling chamber, battery, station transformer and auxiliaries room, and the upper floor houses the main switchboard, alarm, control and communications panels.
18.5.4.5 Tintaya substation 138 kV expansion
The DFS nominated an initial supply to Constancia at 138 kV, an additional switchyard bay at Tintaya substation has been allowed to accommodate the extension of the existing 138 kV double busbar, 45 MVAR of capacitive compensation equipment and all associated switchgear, transformer, metering and protection equipment for the transmission line. The additional bay proposed for Tintaya substation to serve the transmission line to Constancia will be designed for a capacity in excess of 200 MVA.
Capacitive compensation for the transmission line will operate at 22.9 kV, connecting to the 138 kV bus via a 60 MVA, 138/22.9 kV transformer.
Switchgear current and short-circuit ratings will meet the needs of existing substation equipment and forecast projections to 2017.
Insulation levels and surge protection equipment will be standardised with IEC values and reflect the elevation of Tintaya substation and the level of iso-keraunic activity in the region.
Transmission line reactive power compensation will be provided by a 45 MVAR unit complete with associated transformer, switchgear, control and protection equipment.
18.5.4.6 Tintaya substation 220 kV augmentation
The cost of the proposed 220 kV augmentation of Tintaya substation was not included in the estimate for the DFS or this report as Norsemont advised this work would be completed by others.
18.5.4.7 Power supply transfer from 138 kV to 220 kV
TheDFS transmission line and Constancia substation were designed for ultimate operation at 220 kV.
Initial operation of the 138 kV supply will no longer be necessary, per Norsemont advice.
18.5.4.8 Control and communications
Tintaya substation is operated by Red de Energía del Perú (REP) from its regional control centre in Arequipa, which, in turn, is supervised by the main control centre in Lima. The new
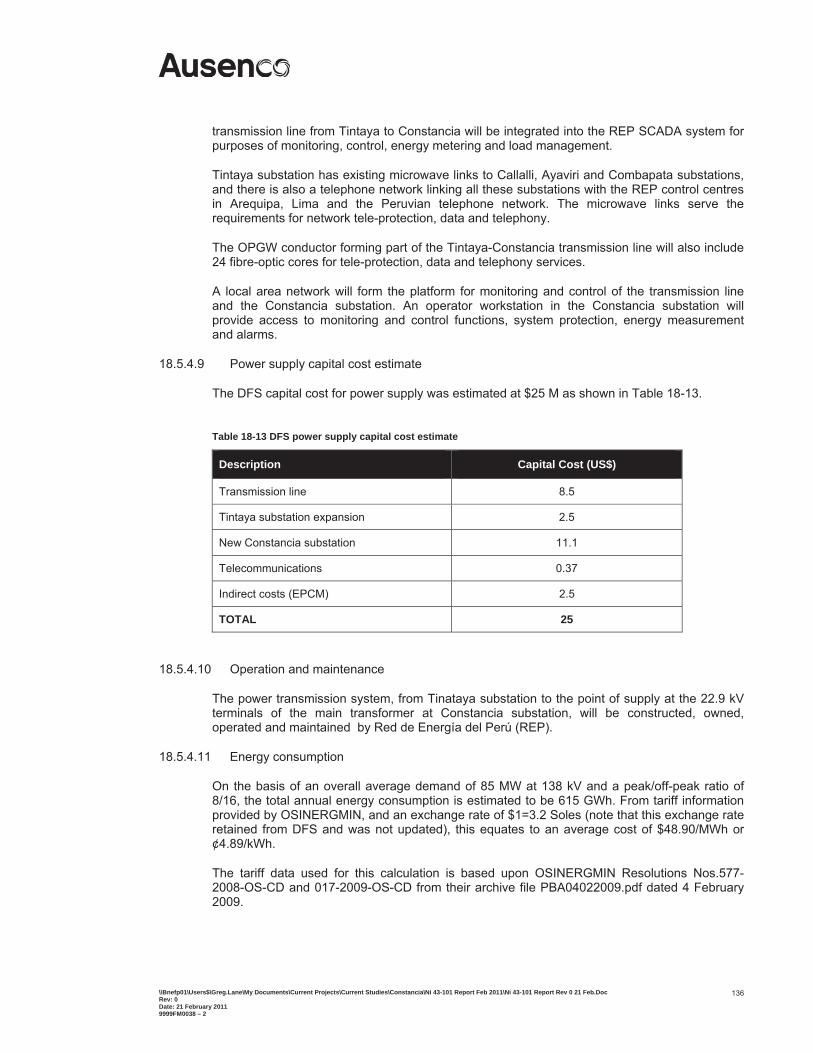
\\Bnefp01\Users$\Greg.Lane\My Documents\Current Projects\Current Studies\Constancia\Ni 43-101 Report Feb 2011\Ni 43-101 Report Rev 0 21 Feb.Doc Rev: 0 Date: 21 February 2011 9999FM0038 – 2
136
transmission line from Tintaya to Constancia will be integrated into the REP SCADA system for purposes of monitoring, control, energy metering and load management.
Tintaya substation has existing microwave links to Callalli, Ayaviri and Combapata substations, and there is also a telephone network linking all these substations with the REP control centres in Arequipa, Lima and the Peruvian telephone network. The microwave links serve the requirements for network tele-protection, data and telephony.
The OPGW conductor forming part of the Tintaya-Constancia transmission line will also include 24 fibre-optic cores for tele-protection, data and telephony services.
A local area network will form the platform for monitoring and control of the transmission line and the Constancia substation. An operator workstation in the Constancia substation will provide access to monitoring and control functions, system protection, energy measurement and alarms.
18.5.4.9 Power supply capital cost estimate
The DFS capital cost for power supply was estimated at $25 M as shown in Table 18-13.
Table 18-13 DFS power supply capital cost estimate
Description Capital Cost (US$)
Transmission line 8.5
Tintaya substation expansion 2.5
New Constancia substation 11.1
Telecommunications 0.37
Indirect costs (EPCM) 2.5
TOTAL 25
18.5.4.10 Operation and maintenance
The power transmission system, from Tinataya substation to the point of supply at the 22.9 kV terminals of the main transformer at Constancia substation, will be constructed, owned, operated and maintained by Red de Energía del Perú (REP).
18.5.4.11 Energy consumption
On the basis of an overall average demand of 85 MW at 138 kV and a peak/off-peak ratio of 8/16, the total annual energy consumption is estimated to be 615 GWh. From tariff information provided by OSINERGMIN, and an exchange rate of $1=3.2 Soles (note that this exchange rate retained from DFS and was not updated), this equates to an average cost of $48.90/MWh or ¢4.89/kWh.
The tariff data used for this calculation is based upon OSINERGMIN Resolutions Nos.577-2008-OS-CD and 017-2009-OS-CD from their archive file PBA04022009.pdf dated 4 February 2009.
\\Bnefp01\Users$\Greg.Lane\My Documents\Current Projects\Current Studies\Constancia\Ni 43-101 Report Feb 2011\Ni 43-101 Report Rev 0 21 Feb.Doc Rev: 0 Date: 21 February 2011 9999FM0038 – 2
137
18.6 Water Management
18.6.1 Introduction
This section is per Section 18.6.1 of the 2009 Technical Report.
18.6.2 Process water
This section is per Section 18.6.2 of the 2009 Technical Report since the peak throughput is unchanged.
18.6.3 Water balance
This Section is per Section 18.6.3 of the 2009 Technical Report. However, it will be revised in the next design stage with the new mine plan to refine the estimates of the actual water demands, design flows, and sizing of the various water and waste management facilities associated with that mine plan.
18.6.4 Non-process water
This section is per Section 18.6.4 of the 2009 Technical Report. However, it will be revised at the next design stage with the new mine plan to refine the estimates of the actual water diversion and temporary storage requirements.
18.6.5 Cunahuiri Reservoir
The Cunahuiri Reservoir will provide storage capacity for the fresh water supply to the plant, and will also serve as a reservoir from which controlled releases will be made to compensate for flow reductions to the Rio Chilloroya and reductions in flows from local springs around the pit area. The Cunahuiri Reservoir will collect water from the upstream Quebrada Cunahuiri catchment area and the catchment area to the northeast of the PAG WRF that will be diverted in the WRF Non-Contact Diversion Channel No. 1. Collected waters will include seepage flows, surface runoff, and direct precipitation to the reservoir. As part of the site-wide water balance analysis completed for the DFS and 2009 Technical report, the required Cunahuiri Reservoir storage volume was estimated to be 2,000,000 m3.
18.7 Waste Management
Major waste management facilities within the project area include a PAG WRF and the TMF.
Unsuitable material and topsoil generated during construction will be disposed in dedicated structures or in the major waste management facilities. The major waste management facilities are described in the following sections.
18.7.1 Waste rock facility
A PAG WRF will be developed to accommodate PAG waste rock mined from the San José and Constancia Pits. Approximately 392 Mt of waste have been characterised as having the potential to generate acid and will be placed in the PAG WRF. Approximately 58 Mt of waste have been characterised as non-acid generating and will be used as material for the construction of the TMF embankment, haul roads, construction roads and access roads. The PAG WRF will be located immediately southeast of the Constancia pit. Figure 18-13 presents the general layout of the facility and its associated structures.
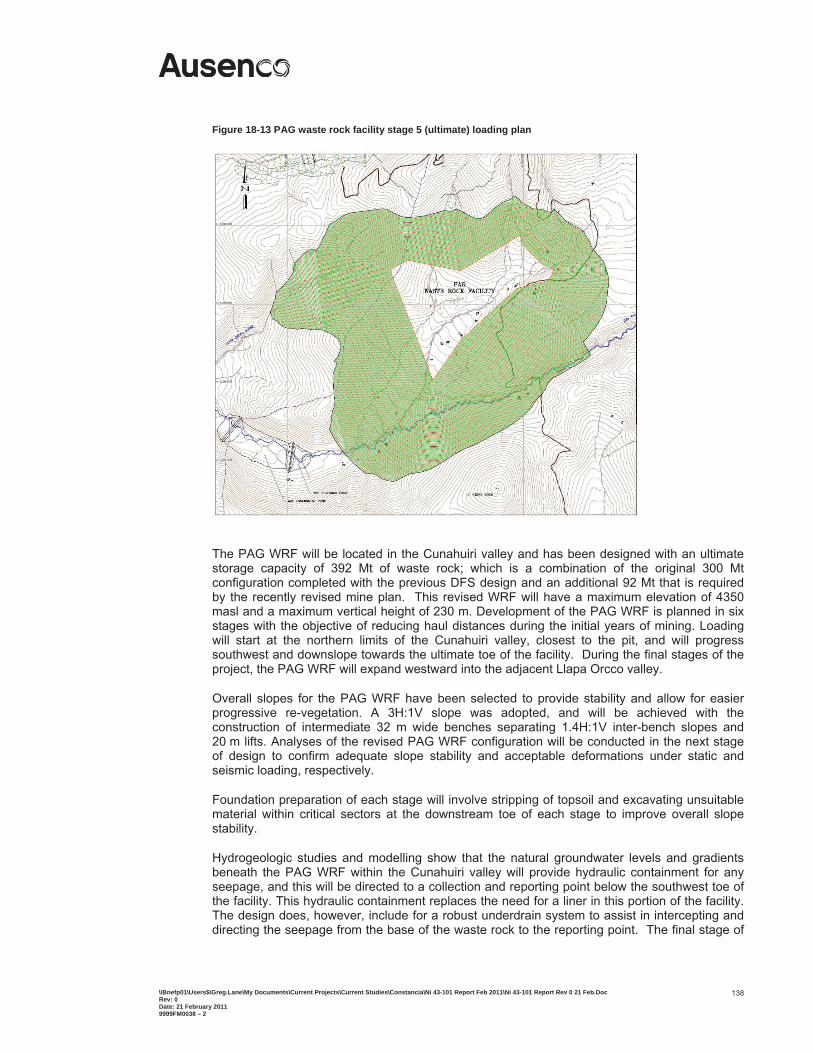
\\Bnefp01\Users$\Greg.Lane\My Documents\Current Projects\Current Studies\Constancia\Ni 43-101 Report Feb 2011\Ni 43-101 Report Rev 0 21 Feb.Doc Rev: 0 Date: 21 February 2011 9999FM0038 – 2
138
Figure 18-13 PAG waste rock facility stage 5 (ultimate) loading plan
The PAG WRF will be located in the Cunahuiri valley and has been designed with an ultimate storage capacity of 392 Mt of waste rock; which is a combination of the original 300 Mt configuration completed with the previous DFS design and an additional 92 Mt that is required by the recently revised mine plan. This revised WRF will have a maximum elevation of 4350 masl and a maximum vertical height of 230 m. Development of the PAG WRF is planned in six stages with the objective of reducing haul distances during the initial years of mining. Loading will start at the northern limits of the Cunahuiri valley, closest to the pit, and will progress southwest and downslope towards the ultimate toe of the facility. During the final stages of the project, the PAG WRF will expand westward into the adjacent Llapa Orcco valley.
Overall slopes for the PAG WRF have been selected to provide stability and allow for easier progressive re-vegetation. A 3H:1V slope was adopted, and will be achieved with the construction of intermediate 32 m wide benches separating 1.4H:1V inter-bench slopes and 20 m lifts. Analyses of the revised PAG WRF configuration will be conducted in the next stage of design to confirm adequate slope stability and acceptable deformations under static and seismic loading, respectively.
Foundation preparation of each stage will involve stripping of topsoil and excavating unsuitable material within critical sectors at the downstream toe of each stage to improve overall slope stability.
Hydrogeologic studies and modelling show that the natural groundwater levels and gradients beneath the PAG WRF within the Cunahuiri valley will provide hydraulic containment for any seepage, and this will be directed to a collection and reporting point below the southwest toe of the facility. This hydraulic containment replaces the need for a liner in this portion of the facility. The design does, however, include for a robust underdrain system to assist in intercepting and directing the seepage from the base of the waste rock to the reporting point. The final stage of
\\Bnefp01\Users$\Greg.Lane\My Documents\Current Projects\Current Studies\Constancia\Ni 43-101 Report Feb 2011\Ni 43-101 Report Rev 0 21 Feb.Doc Rev: 0 Date: 21 February 2011 9999FM0038 – 2
139
the facility in the Llapa Orcco valley will require a liner to isolate the seepage as natural hydraulic containment has not been confirmed in this area. Seepage collected within this lined portion of the WRF will either report by gravity to the WRF containment pond or pumped to the plant area from a secondary containment pond.
Instrumentation will be installed in the PAG WRF for performance monitoring. Such instrumentation will include:
Piezometers in the waste pile and underlying drains
Settlement and deformation monuments on the outer faces of the waste pile
Flow rate and volume meters on the pumped discharge from the PAG WRF containment pond to the process pond.
The WRF containment pond will be constructed below the downstream end of the PAG WRF and retention pond. This pond will also contain surface runoff from the PAG WRF. A 28 m high earthfill embankment will provide approximately 600 000 m3 of water storage. The design consists of a cross-valley zoned embankment with a grouted curtain that spans nearly the entire length of the embankment and extends to depths of approximately 40 m into rock. Water stored in the pond will be used as process water for the mill after treatment. During infrequent, extreme wet periods, excess water reporting to the pond may be pumped onto the upper surface of the PAG WRF for recirculation through the dump for added temporary storage. Water from the PAG WRF is not intended to be released to the environment; however, a valve controlled outlet pipe has been incorporated into the design to be used only in the very unlikely event of an emergency in which water levels within the pond need to be rapidly lowered.
A retention pond between the toe of the PAG WRF and containment pond will be constructed to contain any rocks falling down over the slope of the WRF and to provide for energy dissipation of the drainage flows. A 5 m high, flow-through, rockfill embankment will be constructed at the downstream end of the retention pond, which will provide an approximate capacity of 24 000 m3.
18.7.2 Tailings management facility
The TMF will be developed behind an embankment dam crossing two broad, gently sloped, south to north valleys above the south side of the Chilloroya River, as shown in Figure 18-14. The site is some 5.2 km southwest of the mine pit and 3.7 km south of the process plant and was selected from an extensive alternatives assessment and ranking study that contemplated seven alternatives. The TMF has been designed with an overall storage capacity of 372 million dry tonnes of tailings assuming an average in storage dry density of 1.5 t/m3. The TMF configuration is based on the DFS design that had a capacity of 277 Mt but with a vertical expansion providing another 95 Mt of capacity.
The embankment will have a maximum ultimate height of approximately 150 m.
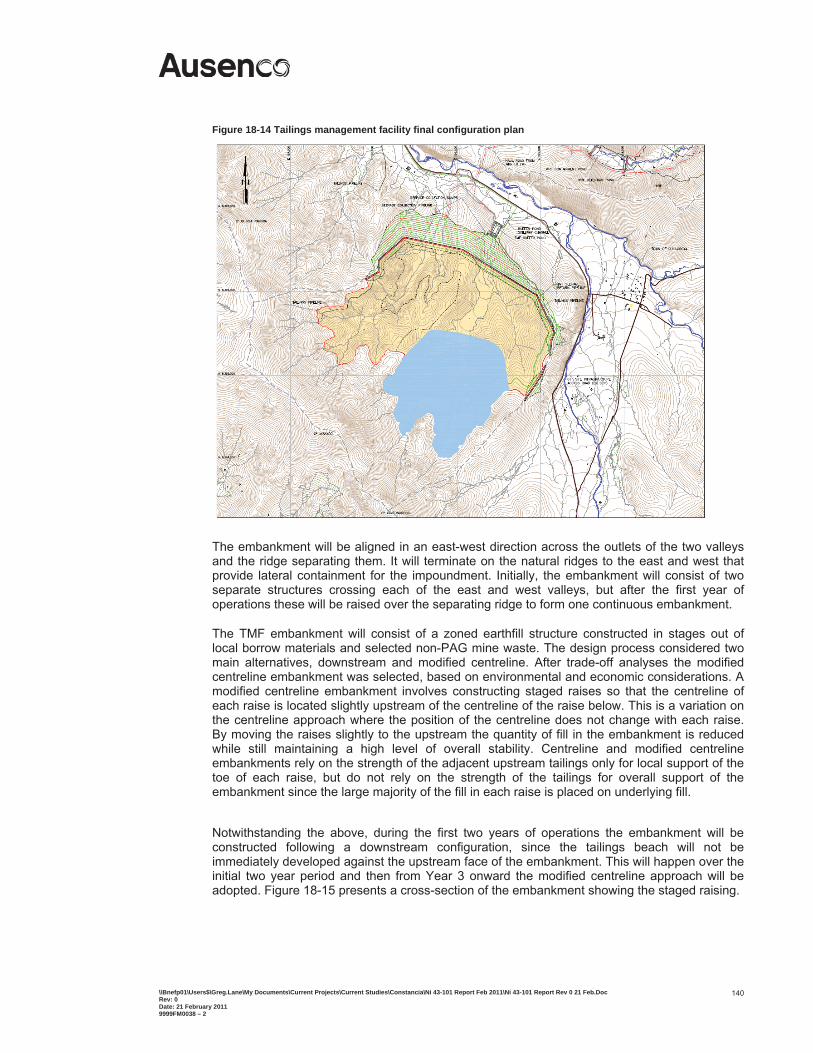
\\Bnefp01\Users$\Greg.Lane\My Documents\Current Projects\Current Studies\Constancia\Ni 43-101 Report Feb 2011\Ni 43-101 Report Rev 0 21 Feb.Doc Rev: 0 Date: 21 February 2011 9999FM0038 – 2
140
Figure 18-14 Tailings management facility final configuration plan
The embankment will be aligned in an east-west direction across the outlets of the two valleys and the ridge separating them. It will terminate on the natural ridges to the east and west that provide lateral containment for the impoundment. Initially, the embankment will consist of two separate structures crossing each of the east and west valleys, but after the first year of operations these will be raised over the separating ridge to form one continuous embankment.
The TMF embankment will consist of a zoned earthfill structure constructed in stages out of local borrow materials and selected non-PAG mine waste. The design process considered two main alternatives, downstream and modified centreline. After trade-off analyses the modified centreline embankment was selected, based on environmental and economic considerations. A modified centreline embankment involves constructing staged raises so that the centreline of each raise is located slightly upstream of the centreline of the raise below. This is a variation on the centreline approach where the position of the centreline does not change with each raise. By moving the raises slightly to the upstream the quantity of fill in the embankment is reduced while still maintaining a high level of overall stability. Centreline and modified centreline embankments rely on the strength of the adjacent upstream tailings only for local support of the toe of each raise, but do not rely on the strength of the tailings for overall support of the embankment since the large majority of the fill in each raise is placed on underlying fill.
Notwithstanding the above, during the first two years of operations the embankment will be constructed following a downstream configuration, since the tailings beach will not be immediately developed against the upstream face of the embankment. This will happen over the initial two year period and then from Year 3 onward the modified centreline approach will be adopted. Figure 18-15 presents a cross-section of the embankment showing the staged raising.
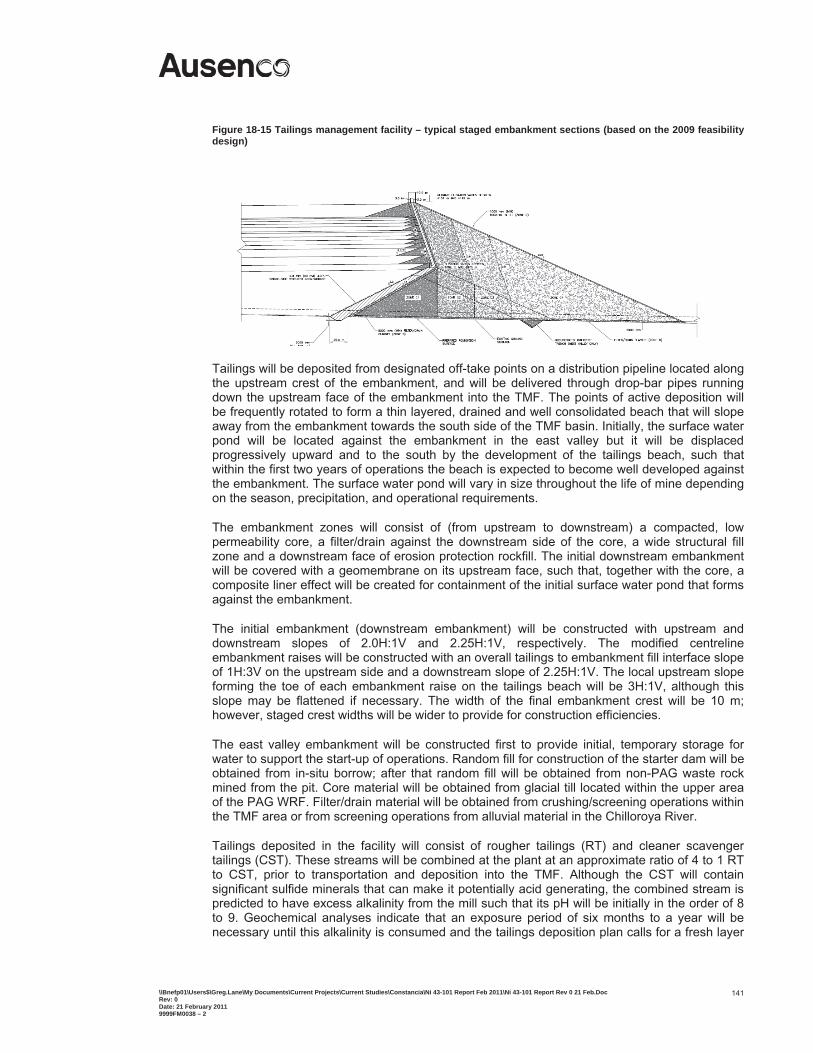
\\Bnefp01\Users$\Greg.Lane\My Documents\Current Projects\Current Studies\Constancia\Ni 43-101 Report Feb 2011\Ni 43-101 Report Rev 0 21 Feb.Doc Rev: 0 Date: 21 February 2011 9999FM0038 – 2
141
Figure 18-15 Tailings management facility – typical staged embankment sections (based on the 2009 feasibility design)
Tailings will be deposited from designated off-take points on a distribution pipeline located along the upstream crest of the embankment, and will be delivered through drop-bar pipes running down the upstream face of the embankment into the TMF. The points of active deposition will be frequently rotated to form a thin layered, drained and well consolidated beach that will slope away from the embankment towards the south side of the TMF basin. Initially, the surface water pond will be located against the embankment in the east valley but it will be displaced progressively upward and to the south by the development of the tailings beach, such that within the first two years of operations the beach is expected to become well developed against the embankment. The surface water pond will vary in size throughout the life of mine depending on the season, precipitation, and operational requirements.
The embankment zones will consist of (from upstream to downstream) a compacted, low permeability core, a filter/drain against the downstream side of the core, a wide structural fill zone and a downstream face of erosion protection rockfill. The initial downstream embankment will be covered with a geomembrane on its upstream face, such that, together with the core, a composite liner effect will be created for containment of the initial surface water pond that forms against the embankment.
The initial embankment (downstream embankment) will be constructed with upstream and downstream slopes of 2.0H:1V and 2.25H:1V, respectively. The modified centreline embankment raises will be constructed with an overall tailings to embankment fill interface slope of 1H:3V on the upstream side and a downstream slope of 2.25H:1V. The local upstream slope forming the toe of each embankment raise on the tailings beach will be 3H:1V, although this slope may be flattened if necessary. The width of the final embankment crest will be 10 m; however, staged crest widths will be wider to provide for construction efficiencies.
The east valley embankment will be constructed first to provide initial, temporary storage for water to support the start-up of operations. Random fill for construction of the starter dam will be obtained from in-situ borrow; after that random fill will be obtained from non-PAG waste rock mined from the pit. Core material will be obtained from glacial till located within the upper area of the PAG WRF. Filter/drain material will be obtained from crushing/screening operations within the TMF area or from screening operations from alluvial material in the Chilloroya River.
Tailings deposited in the facility will consist of rougher tailings (RT) and cleaner scavenger tailings (CST). These streams will be combined at the plant at an approximate ratio of 4 to 1 RT to CST, prior to transportation and deposition into the TMF. Although the CST will contain significant sulfide minerals that can make it potentially acid generating, the combined stream is predicted to have excess alkalinity from the mill such that its pH will be initially in the order of 8 to 9. Geochemical analyses indicate that an exposure period of six months to a year will be necessary until this alkalinity is consumed and the tailings deposition plan calls for a fresh layer
\\Bnefp01\Users$\Greg.Lane\My Documents\Current Projects\Current Studies\Constancia\Ni 43-101 Report Feb 2011\Ni 43-101 Report Rev 0 21 Feb.Doc Rev: 0 Date: 21 February 2011 9999FM0038 – 2
142
of tailings to be placed over each previously deposited layer well within this period to reduce the potential for acidic conditions developing. At least one and half or two years prior to closure, the CST tailings will be routed through a tertiary flotation stage to de-sulfurise the stream so that the combined RT and CST tailings remain non-acid generating. These de-sulfurised tailings will be deposited into the TMF via the previously used distribution and deposition system to form a covering layer of benign tailings that will serve as a foundation for the permanent closure cover. The small volume of concentrated sulfide tailings removed from the CST will be deposited in a dedicated facility built just prior to this. The concentrated sulfide tailings facility may be constructed within the TMF or near the mill and is expected to comprise a small geomembrane lined basin. Once all of the concentrated sulfide tailings have been deposited in the facility, a geomembrane will be installed over this facility and welded to the lower geomembrane to fully encapsulate the concentrated sulfide tailings. The facility will then be covered by soil and erosion protection layers and contoured to shed run-off.
The TMF impoundment includes a geomembrane liner over the base of the entire eastern valley and most of the western valley to provide geomembrane containment in areas where the surface water pond is in contact with the impoundment base at any time over the life of mine. A 50 m wide tailings underdrain is placed on top of the geomembrane against the upstream toe of the embankment to assist in depressing pore pressures in the tailings against the embankment and to minimise the heads on this part of the geomembrane liner. The tailings underdrain comprises a system of perforated pipes installed in drainage layer material and overlain by non-woven geotextile to provide filtration between the tailings and drainage aggregate.
The geomembrane liner has not been extended into the upper, southern reaches of the western valley since the surface water pond will never be located there. However, to assist in intercepting and collecting any small amounts of seepage that may pass beneath the western side of the embankment in the absence of the liner, an intercept trench and drain is constructed under the embankment across this valley.
Groundwater drains will be installed under the geomembrane to intercept groundwater seeps and keep them away from the geomembrane. These drains will consist of perforated pipes installed in trenches, backfilled with drainage aggregate and encapsulated within a non-woven geotextile wrap.
A separate foundation drain system will be installed under the embankment and will consist of perforated pipes installed within the horizontal drainage blankets of the east and west valley bottoms.
This foundation drain system will collect water seeping through the embankment, which may include direct precipitation on the embankment and/or small amounts of seepage passing through it, as well as localised groundwater seeps in the embankment foundation.
Water collected by the drain systems will be conveyed to sumps located immediately downstream of the embankment in each of the east and west valleys. The basin groundwater drain and tailings underdrain outlet pipes in each valley will be installed together in a common reinforced concrete encasement under the embankment. At the sumps, monitoring and control systems will allow for automated water quality and flow rate determinations to be made for release either to the Chilloroya River or for pump back to the TMF based on the water quality. Two sumps will be constructed, one in each of the valleys.
Construction of the TMF will require the removal of wet soils composed of organic materials and peat (bog) in the bottom of each of the two valleys. The estimated quantities of these materials are approximately 1.3 and 0.8 Mm3 (to be revised based on the new embankment expanded configuration) in the east and west valleys, respectively. The removal process is expected to consist of water drainage, sediment control and excavation of the bog materials. Following excavation, the materials will be hauled and placed into a dedicated storage facility located
\\Bnefp01\Users$\Greg.Lane\My Documents\Current Projects\Current Studies\Constancia\Ni 43-101 Report Feb 2011\Ni 43-101 Report Rev 0 21 Feb.Doc Rev: 0 Date: 21 February 2011 9999FM0038 – 2
143
approximately 1.5 km north of the TMF. During the initial stage of construction before the embankment is in place, sediment control measures will be taken to contain the excavation works and limit the potential for organic materials to migrate downstream into the Chilloroya River.
Instrumentation will be installed in the TMF to monitor the structure throughout the life of the facility.
Settlement and deformation monuments will be installed on the embankment with each major stage of construction, at an approximate spacing of 250 m along the embankment crest, to monitor any displacements and confirm that they do not exceed acceptable tolerances. Additionally, vibrating wire piezometers will be installed within the following materials:
Deposited tailings
Tailings underdrain system
Embankment fill
Horizontal drainage blanket
Bedrock foundation underlying the embankment.
Regular monitoring of the piezometers will be performed to gain an understanding of the overall performance of the embankment and underdrain systems over the life of the facility. Pore pressure data will also be used to monitor the tailings behaviour and rate of consolidation as the facility is raised.
Periodic geotechnical investigations using cone penetration techniques will also be conducted in the tailings to confirm the strength, pore pressure and seismic liquefaction potential characteristics of the deposit.
Flow rate and flow volume totaliser measurements will be made of the various seepage or drainage flows, as well as flows from the surface water pond to the mill or TMF buffer pond and Chilloroya River.
Tailings beach and surface water pond level measurements will also be made at regular intervals in the TMF.
18.7.3 Topsoil and unsuitable material stockpiles
This section is as reported in the 2009 Technical Report. Topsoil and unsuitable material storage requirements will be revised during the next design stage.
18.8 Port and Transport
This section is as reported in the 2009 Technical Report with changes to concentrate production as noted elsewhere in this report.
18.9 Project Implementation Plan
18.9.1 Approach and strategy
This section outlines the proposed project execution methodology from the time of Norsemont board approval of the project through to completion of commissioning and is extracted and updated from the 2009 Technical Report.
A preliminary project delivery model is provided in Figure 18-16.
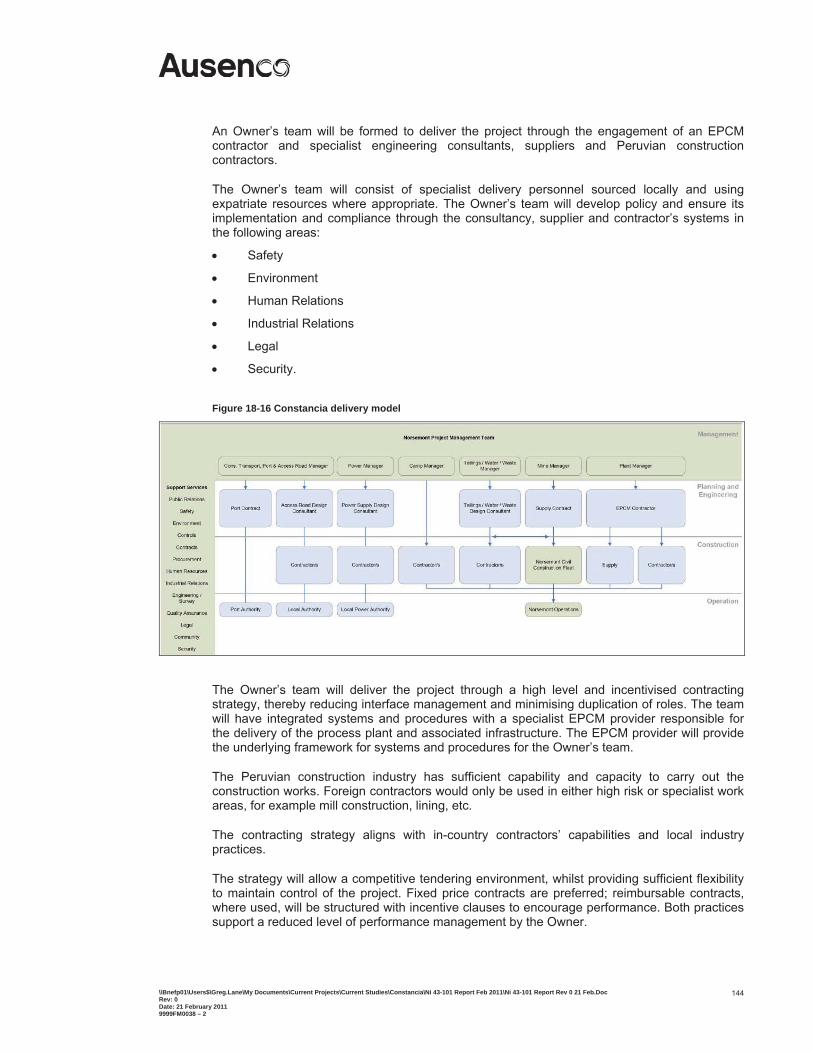
\\Bnefp01\Users$\Greg.Lane\My Documents\Current Projects\Current Studies\Constancia\Ni 43-101 Report Feb 2011\Ni 43-101 Report Rev 0 21 Feb.Doc Rev: 0 Date: 21 February 2011 9999FM0038 – 2
144
An Owner’s team will be formed to deliver the project through the engagement of an EPCM contractor and specialist engineering consultants, suppliers and Peruvian construction contractors.
The Owner’s team will consist of specialist delivery personnel sourced locally and using expatriate resources where appropriate. The Owner’s team will develop policy and ensure its implementation and compliance through the consultancy, supplier and contractor’s systems in the following areas:
Safety
Environment
Human Relations
Industrial Relations
Legal
Security.
Figure 18-16 Constancia delivery model
The Owner’s team will deliver the project through a high level and incentivised contracting strategy, thereby reducing interface management and minimising duplication of roles. The team will have integrated systems and procedures with a specialist EPCM provider responsible for the delivery of the process plant and associated infrastructure. The EPCM provider will provide the underlying framework for systems and procedures for the Owner’s team.
The Peruvian construction industry has sufficient capability and capacity to carry out the construction works. Foreign contractors would only be used in either high risk or specialist work areas, for example mill construction, lining, etc.
The contracting strategy aligns with in-country contractors’ capabilities and local industry practices.
The strategy will allow a competitive tendering environment, whilst providing sufficient flexibility to maintain control of the project. Fixed price contracts are preferred; reimbursable contracts, where used, will be structured with incentive clauses to encourage performance. Both practices support a reduced level of performance management by the Owner.
\\Bnefp01\Users$\Greg.Lane\My Documents\Current Projects\Current Studies\Constancia\Ni 43-101 Report Feb 2011\Ni 43-101 Report Rev 0 21 Feb.Doc Rev: 0 Date: 21 February 2011 9999FM0038 – 2
145
The Owners team will deliver the mining development work, and, ultimately, this team will transfer through to the operations team. The Owners team will cover all aspects of the mining development which will include areas such as mine design, mine fleet selection and procurement, assembly of the mining fleet, and operations, etc.
All the tailings, waste rock, topsoil and water management facilities will be engineered by a single consultant to minimise interface management. Bulk earthworks across the site will be delivered by a civil construction fleet purchased and managed by the Owner. This fleet will commence construction early in the project and be retained through to operations to continue with subsequent construction stages of the tailings management facilities. Construction of the balance of the works will be contracted to local specialist contractors.
The access road will be completed in two phases, the first stage involving detailed design, including government agreement and approvals, and the second stage construction. The detailed design will be provided by a specialist Peruvian engineering consulting firm, and the construction by a specialist civil construction contractor.
Power supply will be delivered in two phases, the first stage including design, government agreement and approvals, land and acquisition; and the second stage being construction and commissioning. The detailed design will be provided by a specialist Peruvian engineering consultancy firm and the construction by a specialist construction contractor.
The accommodation camp will be delivered through a single supply and install contract, with the management under a separate management contract.
18.9.2 Quality assurance
This section is as reported in the 2009 Technical Report.
18.9.3 Project construction fleet
This section is as reported in the 2009 Technical Report. Additional bulk earthworks to that specified in the 2009 Technical Report have been costed as contract works.
18.9.4 Project implementation schedule
The project implementation schedule has been revised to reflect the commencement of the project in Q2 2011.
A project implementation schedule is summarised in Figure 18-17. The schedule shows total project duration of approximately 34 months, including detailed design, procurement, construction and commissioning.
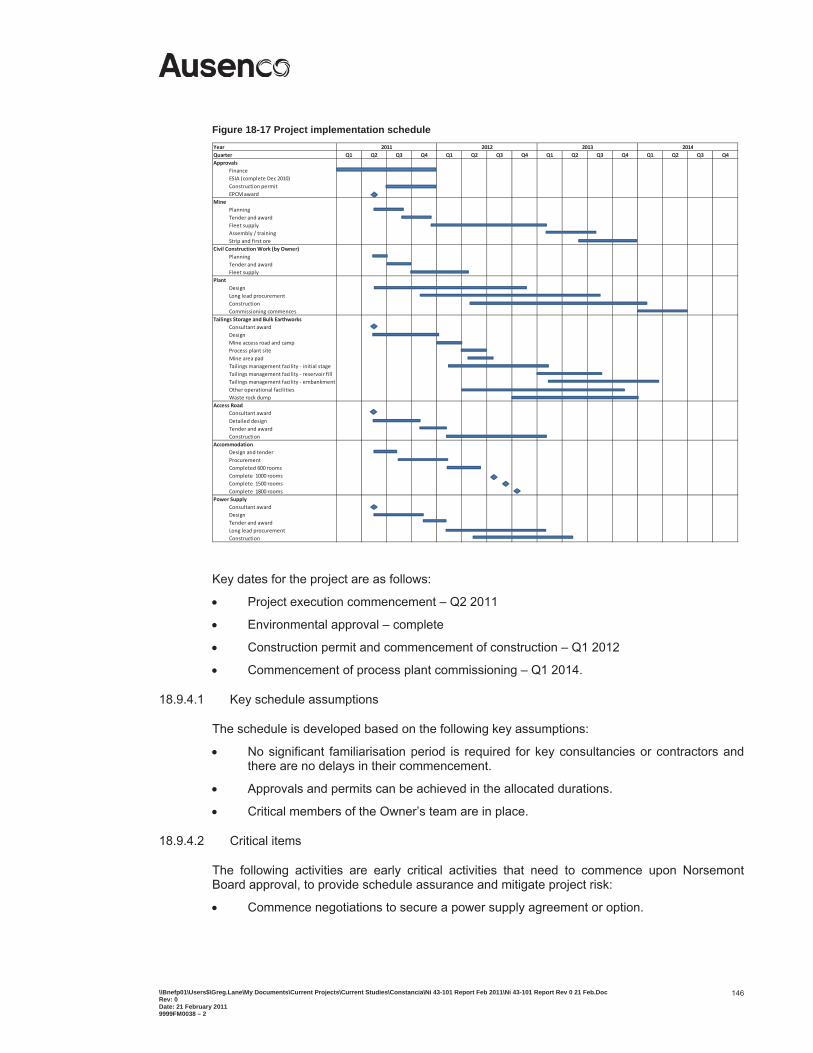
\\Bnefp01\Users$\Greg.Lane\My Documents\Current Projects\Current Studies\Constancia\Ni 43-101 Report Feb 2011\Ni 43-101 Report Rev 0 21 Feb.Doc Rev: 0 Date: 21 February 2011 9999FM0038 – 2
146
Figure 18-17 Project implementation schedule
Q1 Q2 Q3 Q4 Q1 Q2 Q3 Q4 Q1 Q2 Q3 Q4 Q1 Q2 Q3 Q4Approvals
FinanceESIA (complete Dec 2010)Construction permitEPCMaward
MinePlanningTender and awardFleet supplyAssembly / trainingStrip and first ore
Civil ConstructionWork (by Owner)PlanningTender and awardFleet supply
PlantDesignLong lead procurementConstructionCommissioning commences
Tailings Storage and Bulk EarthworksConsultant awardDesignMine access road and campProcess plant siteMine area padTailings management facility initial stageTailings management facility reservoir fillTailings management facility embankmentOther operational facilitiesWaste rock dump
Access RoadConsultant awardDetailed designTender and awardConstruction
AccommodationDesign and tenderProcurementCompleted 600 roomsComplete 1000 roomsComplete 1500 roomsComplete 1800 rooms
Power SupplyConsultant awardDesignTender and awardLong lead procurementConstruction
2011 2012 2013YearQuarter
2014
Key dates for the project are as follows:
Project execution commencement – Q2 2011
Environmental approval – complete
Construction permit and commencement of construction – Q1 2012
Commencement of process plant commissioning – Q1 2014.
18.9.4.1 Key schedule assumptions
The schedule is developed based on the following key assumptions:
No significant familiarisation period is required for key consultancies or contractors and there are no delays in their commencement.
Approvals and permits can be achieved in the allocated durations.
Critical members of the Owner’s team are in place.
18.9.4.2 Critical items
The following activities are early critical activities that need to commence upon Norsemont Board approval, to provide schedule assurance and mitigate project risk:
Commence negotiations to secure a power supply agreement or option.
\\Bnefp01\Users$\Greg.Lane\My Documents\Current Projects\Current Studies\Constancia\Ni 43-101 Report Feb 2011\Ni 43-101 Report Rev 0 21 Feb.Doc Rev: 0 Date: 21 February 2011 9999FM0038 – 2
147
Commence the detailed design of the improvement works for the access road upgrade and investigate the acceleration of its delivery.
Commence the basic engineering and design, process design, flowsheet verification and optimisation, plant layout, and long lead procurement.
Commence the detailed design and planning for the bulk earthworks and purchase of the Owners civil construction fleet.
Commence the recruitment of key Owners team.
Commence the development of the accommodation camp contract, and investigate availability of second hand camps.
Investigate the availability of new long lead equipment, i.e. cancelled orders, etc.
Commence development of project systems. This includes OHS&E requirements and standards, equipment numbering, asset numbering, document numbering, cost control and reporting systems, document control, and procurement documentation and systems.
In addition, the completion of earthworks for water storage prior to or early in the 2012/2013 wet season is critical for adequate water supply for plant startup.
18.9.5 Permits and licences
A draft list of permits applicable to the construction and operation of the Project has been developed by Norsemont and is included in Appendix 1 of the 2009 Technical Report. This list was a draft and was subject to change.
18.10 Project Occupational Health. Safety, Environment and Security
This section is as reported in the 2009 Technical Report.
18.11 Project Operational Plan
This section is as reported in the 2009 Technical Report.
18.12 Environmental Considerations
18.12.1 Legal framework
This section is as reported in the 2009 Technical Report.
18.12.2 Environmental impact assessment
18.12.2.1 Introduction
Knight Piésold was contracted to manage the Environmental Impact Assessment and overall completion of the ESIA for the Constancia Project. Social Capital Group was contracted to complete the Social Impact Assessment, stakeholder mapping and land ownership surveys. The ESIA for the Constancia Project was approved on 24 November 2010 by the Peruvian Ministry of Energy and Mines, the competent authority for approval of mining and energy projects in Peru.
The ESIA consisted of the following chapters:
Executive summary
Background information
\\Bnefp01\Users$\Greg.Lane\My Documents\Current Projects\Current Studies\Constancia\Ni 43-101 Report Feb 2011\Ni 43-101 Report Rev 0 21 Feb.Doc Rev: 0 Date: 21 February 2011 9999FM0038 – 2
148
Legal framework
Environmental description (environmental baseline)
Socioeconomic baseline
Project description
Alternatives analysis
Impact identification and analysis
Environmental Management Plan
Environmental Monitoring Plan
Resettlement Action Plan
Community Relations Plan
Communications and Public Participation Plan
Conceptual Mine Closure Plan
Cost-Benefit Analysis.
18.12.2.2 Environmental description
The area has a mining history that dates back 50 years to when Mitsui operated a copper-zinc mine in Katanga near the community of Uchucarco. Mitsui sold the mine to a Peruvian company which abandoned the mine in the late 70s, leaving a legacy of environmental contamination. Tailings were discharged into the river basin, and the open pits and waste dumps were never reclaimed. People from the community of Uchucarco continue to mine (illegally) the abandoned mine workings at Katanga.
Near the community of Chilloroya, the local population is engaged in the illegal mining of superficial gold. There is documented evidence that the community employs the use of child labour, and levels of mercury found in sediments near a rudimentary gold processing area exceed international standards for the protection of aquatic life. Studies completed as part of the ESIA have documented elevated blood levels of mercury in local children.
Environmental baseline studies were initiated in 2007 by Vector Perú S.A., and updated by Knight Piésold during 2008-2009. All baseline study fieldwork has been completed (wet and dry season data).
The area of study included the mine, transmission line right of way and the concentrate transportation route. Power for the project will be supplied by the construction of an 82 km long high tension line (138 kV) from the Tintaya sub station to Constancia. Concentrate will be transported by road from Constancia to the Matarani Port via Livitaca, Tintaya, Imata and Yura. Upgrades and improvements will be completed to 70 km of the existing road from Constancia to Tintaya.
Physical environment
Location, topography and physiography
Constancia is located in the Central Andes of Peru, 634 km southeast of Lima and 112 km south of the city of Cusco, at an altitude that varies between 4000 and 4500 masl.
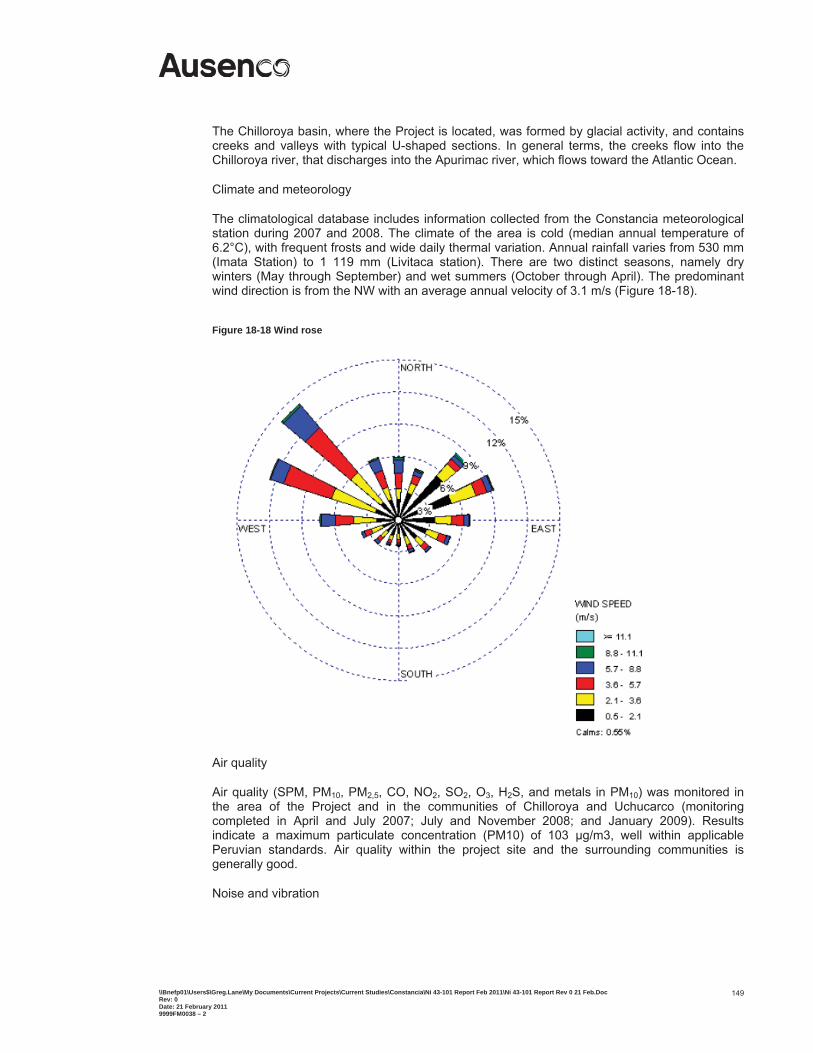
\\Bnefp01\Users$\Greg.Lane\My Documents\Current Projects\Current Studies\Constancia\Ni 43-101 Report Feb 2011\Ni 43-101 Report Rev 0 21 Feb.Doc Rev: 0 Date: 21 February 2011 9999FM0038 – 2
149
The Chilloroya basin, where the Project is located, was formed by glacial activity, and contains creeks and valleys with typical U-shaped sections. In general terms, the creeks flow into the Chilloroya river, that discharges into the Apurimac river, which flows toward the Atlantic Ocean.
Climate and meteorology
The climatological database includes information collected from the Constancia meteorological station during 2007 and 2008. The climate of the area is cold (median annual temperature of 6.2°C), with frequent frosts and wide daily thermal variation. Annual rainfall varies from 530 mm (Imata Station) to 1 119 mm (Livitaca station). There are two distinct seasons, namely dry winters (May through September) and wet summers (October through April). The predominant wind direction is from the NW with an average annual velocity of 3.1 m/s (Figure 18-18).
Figure 18-18 Wind rose
Air quality
Air quality (SPM, PM10, PM2,5, CO, NO2, SO2, O3, H2S, and metals in PM10) was monitored in the area of the Project and in the communities of Chilloroya and Uchucarco (monitoring completed in April and July 2007; July and November 2008; and January 2009). Results indicate a maximum particulate concentration (PM10) of 103 μg/m3, well within applicable Peruvian standards. Air quality within the project site and the surrounding communities is generally good.
Noise and vibration
\\Bnefp01\Users$\Greg.Lane\My Documents\Current Projects\Current Studies\Constancia\Ni 43-101 Report Feb 2011\Ni 43-101 Report Rev 0 21 Feb.Doc Rev: 0 Date: 21 February 2011 9999FM0038 – 2
150
Baseline levels for noise and vibration were measured in the communities of Uchucarco, Chilloroya, Coporaque and Yauri. Results from the baseline study indicate that the levels of noise and vibrations from static sources are within national standards.
Seismicity
The Project site is classified as an area with medium seismicity, according to the Peruvian Seismic Research Center. There have been no local events registered in the Project area during Norsemont’s time.
Soils
The majority of the soils in the study area are of irregular morphology, variable texture and contain considerable cleared gravels. On the hills and slopes, the soils contain colluvial–alluvial and residual materials. In general the erosion potential of the soil in the area surrounding the project is low to medium. The topography of the mine site consists of rolling hills containing native grasses (ichu) that are typically found in the sierra of Peru. During the construction phase, erosion and sediment control techniques will be applied.
Hydrology
The Project is located in the Chilloroya river basin, a tributary of the Velille river which empties into the Apurimac river, and flows to the Atlantic Ocean.
The Chilloroya river basin is approximately 301.84 km2. Major uploads to the river basin occur during the wet season between January and April. The average annual flows in the Chilloroya River are estimated between 6.52 and 5.10 m3/s.
Water quality
The following sub-basins were included in the study area:
Chilloroya river
Pincullune creek
Sacrane creek
Huayllachane creek
Casasuma creek
Arocoyo creek
Canrayoc creek
Chonta – Orcochiri creek
Velille river
Ccatunhuaycco creek.
A total of 53 surface water quality stations were located in the Chilloroya river basin. Surface water quality sampling stations were also established in the Velille and Huancane river basins (Figure 18-19).
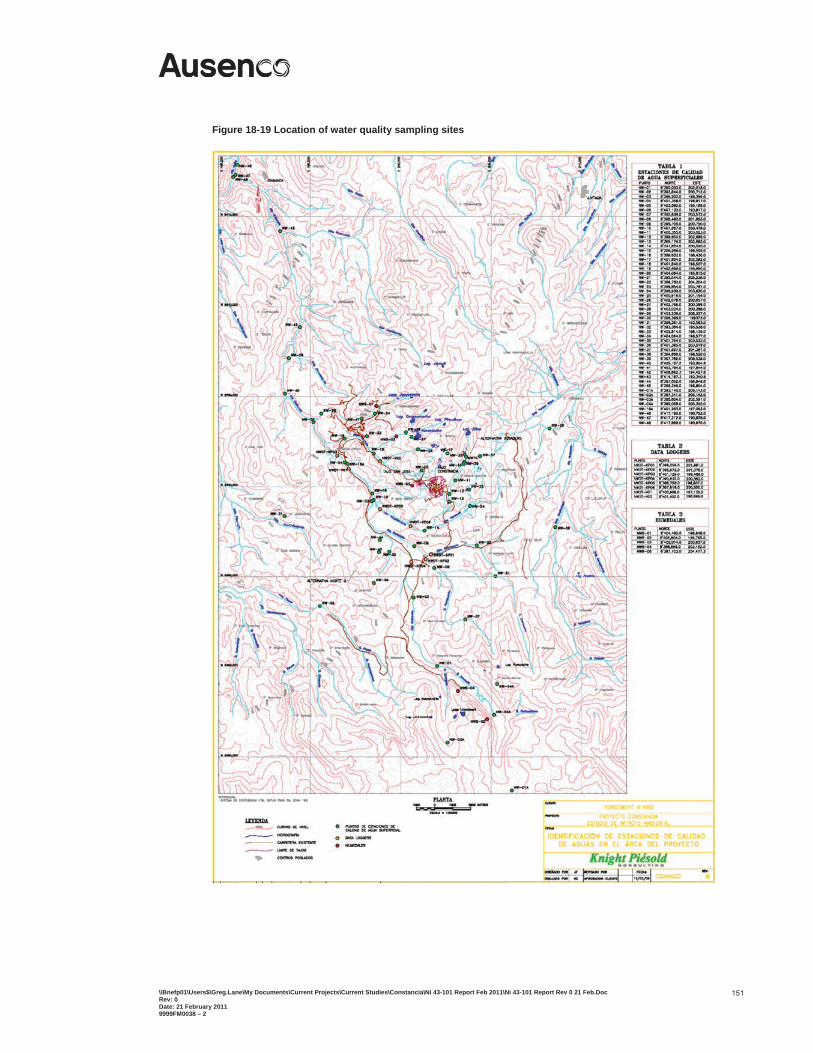
\\Bnefp01\Users$\Greg.Lane\My Documents\Current Projects\Current Studies\Constancia\Ni 43-101 Report Feb 2011\Ni 43-101 Report Rev 0 21 Feb.Doc Rev: 0 Date: 21 February 2011 9999FM0038 – 2
151
Figure 18-19 Location of water quality sampling sites
\\Bnefp01\Users$\Greg.Lane\My Documents\Current Projects\Current Studies\Constancia\Ni 43-101 Report Feb 2011\Ni 43-101 Report Rev 0 21 Feb.Doc Rev: 0 Date: 21 February 2011 9999FM0038 – 2
152
A total of 12 surface water and sediment quality stations were established within the project footprint (pit, waste rock and tailings storage facilities) as well as in five wetlands in the area.
In general, results indicate that the water quality within the project area has neutral to alkaline pH and in some locations exceeds the national standards for iron, manganese, copper, lead and zinc in the Chilloroya river; iron and microbiological parameters in “Hacienda Fortunia”; coliform in Pincullune – Condormarca creek (Jappococha); copper, manganese, zinc, and lead in Sacrane creek; lead and coliform in Huayllachane and Casanuma – Pumacocha creeks; zinc in Arocollo and Canrayoc creeks; and arsenic, iron, and lead in the Velille river and Ccatunhuaycco creek.
Biological environment
The vegetation in the area consists primarily of grasslands, and wetlands. Wildlife is represented by fox, deer, rodents, lizards, frogs and snakes. Domestic animals are primarily represented by milk producing cows, sheep and alpaca. The high diversity of bird life is associated with the presence of wetlands, rivers and lakes in the area.
Flora and vegetation
A total of 494 different species of plants and 10 vegetative formations were identified within the project area. While 18 species of flora are classified as endangered, these are not located within the direct area of influence.
Terrestrial fauna
The diversity of the fauna was characterised through evaluations of habitat and the identification of specific vegetative formations. The evaluations were completed using transects and fixed observation points, and include direct (field observation and traps) and indirect (tracks, remains, excrements) reconnaissance methods. Important habitats for species of interest (national or international protective status) were documented, geo-referenced and photographed.
A total of 96 different species of birds, 19 species of mammals, four species of reptiles, and four species of amphibians were identified within the project area. Of these, five species of birds, three species of mammals and one amphibian are listed as protected species.
Aquatic life
A detailed hydrobiological evaluation of aquatic environments located within the project area, was conducted. Three species of trout and two species of catfish (bagre and challhua) were found within these aquatic environments. Challhua was found only in wetland areas.
One species of fish belongs to the IUCN Red List of Threatened Species.
Human interest environment
Landscape
Landscape is defined as the human perception of nature that is observed in a given moment. It consists of the visible features of an area of land, including physical elements such as landforms, flora and fauna, lighting, weather conditions, human activities (archaeological and cultural) and constructed environments.
The following elements of the landscape were evaluated in the impact analysis: geological, geomorphological and hydrological elements and processes, relevant to the landscape; biological and ecological processes and elements; and anthropological elements.
\\Bnefp01\Users$\Greg.Lane\My Documents\Current Projects\Current Studies\Constancia\Ni 43-101 Report Feb 2011\Ni 43-101 Report Rev 0 21 Feb.Doc Rev: 0 Date: 21 February 2011 9999FM0038 – 2
153
In general, the Sacrane, Misayoc, Telaracaca and Chillorya river basins are considered to contain low values of visual quality as the landscape elements are common to the surrounding areas.
The Japoccocha, Ccuesoccocha-Yanaccocha, Urasana, Cunahuire – Huayllachane, Pumacocha – Casanuma and Huarmicocha – Condorcocha sectors are considered to contain medium values of visual quality, due to the presence of lakes and the dominant mountain landscapes in these sectors.
Archaeological Heritage
An archaeological survey was completed in the areas directly affected by future Project facilities and activities. A total of 46 archaeological sites were identified in the area of the future mine site. The process to obtain a certificate of non existence of archaeological remains of significance from the INC (National Cultural Institute) has been initiated and is expected to be completed by Q4 2011.
Environmental liabilities from Previous and Current Mining Activities
An inventory of mining related environmental liabilities was conducted in all areas where previous mining activities occurred and where current artisanal mining is taking place. The inventory was completed by geo-referencing the locations of these environmental liabilities. Samples were collected and field measurements were taken of mining-related effluents, and material from abandoned waste rock dumps and tailings storage facilities was inspected for evidence of acid generation.
Five zones where mining related environmental liabilities exist on the Norsemont mining concessions were identified and include: Sacsa Orcco, Katanga, San José, Chilloroya, and Yanaccocha lake.
Traffic
Copper concentrate will be transported by truck from the mine to the port at Matarani. As part of the evaluation of impacts a traffic study was completed to evaluate the impacts from the transportation of Constancia concentrate on current traffic levels. Current levels of traffic were assessed from a survey that identified vehicle types, the daily volume of traffic and the kinds of loads being transported along the existing road networks. This study was completed by SIGT.
18.12.2.3 Stakeholder mapping
Taking into account the political and social context, the key stakeholders that have been identified in the two communities are:
The Community Assembly, which represents all of the registered dwellers (143 families in Chilloroya, and approximately 527 families in Uchucarco) in the two communities. This is the most powerful group of the Peasant Community, and where important local decisions are taken.
The Governing Board (“Junta Directiva”), which represents the community in front of external organisations and institutions such as the State, NGO´s, other private and public agencies. Its purpose is to review and approve activities that promote community development, settle boarder and land disputes, and enforce community order. It is composed of a President, Vice-President, Secretary, Prosecutor, Treasurer, and two other members, who are elected democratically by the general assembly for a two-year term.
\\Bnefp01\Users$\Greg.Lane\My Documents\Current Projects\Current Studies\Constancia\Ni 43-101 Report Feb 2011\Ni 43-101 Report Rev 0 21 Feb.Doc Rev: 0 Date: 21 February 2011 9999FM0038 – 2
154
18.12.2.4 Status of land ownership in the communities of Uchucarco and Chilloroya
The land administration system in Uchucarco and Chilloroya is consistent with the community system of land possession. This system, which is recognised by the State and National legislation, acknowledges that the peasant communities possess different social dynamics from the rest of society. Despite the changes in the law on this regard7, communities at the present time have the right to decide upon their territories. These decisions must be made and undertaken by consensus, through a General Assembly of the community.
Community organisations have implemented several means to distribute and use their lands, most commonly through the division of the land into plots among the dwellers (as in the case of Chilloroya and Uchucarco). The plots of land are defined and the boundaries marked in the presence of members of the governing board. The plot of land is then given to the community member. These plots of land are registered with the community and the dwellers become holders or (“posesionarios”)8 of these lands. The dwellers do not have official title to the lands, but can enjoy the benefits from the land (growing crops, grazing of livestock, construction of a house or dwellings), etc. The dweller is not permitted to make any transaction or exchange of the land. Approximately 20% of households in Chilloroya and 50% in Uchucarco hold a certificate issued by the community organisation that demonstrates the allocation of these lands to the specific household.
Eleven percent of households in Chilloroya and 22% in Uchucarco do not possess lands allocated by the community, but do live in the communities.
Existing disputes between land holders regarding the size and extent of their lands have been recorded.
The project has purchased 4097 ha of private lands to date and has plans to purchase additional lands belonging to the two communities as part of the project exclusion zone which is in process.
As a result of the project development, approximately 35 families from the community of Chilloroya will need to be relocated. Norsemont has prepared a Resettlement Action Plan (RAP) in accordance with IFC standards on Involuntary Resettlement and Peruvian National legislation. The RAP has been initiated with the intension to finalize in 2011.
Norsemont completed a land ownership survey of households and lands in both communities that will assist in determining the numbers of people that would be affected by the Project development and the potential impacts from the resettlement. The RAP addresses both physical and economic displacement.
.
7 In 1993 and 1995 two important changes were made in connection with the community land system. The first was introduced with the entry into force of the 1993 Political Constitution, which only recognised the unlimited nature of the community land, but at the same time the autonomy of peasant communities was extended giving them the freedom to dispose of and use their lands as deemed convenient. In 1995, Act Nº 26505 (Act on the Private Investment on the Development of Economic Activities in the Land on the National Territory and in the Lands of Peasant and Native Communities “Ley de la Inversión Privada en el Desarrollo de las Actividades Económicas en las Tierras del Territorio Nacional y de las Comunidades Campesinas y Nativas”) was passed.
8 Legally recognised form of land holder.
\\Bnefp01\Users$\Greg.Lane\My Documents\Current Projects\Current Studies\Constancia\Ni 43-101 Report Feb 2011\Ni 43-101 Report Rev 0 21 Feb.Doc Rev: 0 Date: 21 February 2011 9999FM0038 – 2
155
18.12.2.5 Impact identification and evaluation
Positive and negative impacts related to the project development phases were identified and evaluated. Mitigation measures were evaluated for their relative level of impact and significance and were included in the ESIA.
The environmental impact assessment identified both quantitative and qualitative changes to the environment as a result of the Project, and evaluated the significance of these changes. The proposed impacts were analysed before and after mitigation measures are adopted and the final results were based on the analysis of residual impacts.
The process for the evaluation of impacts will be guided by national and international standards, using impact assessment matrices and predictive models. The evaluation of impacts will consider direct, indirect and cumulative impacts. The following predictive tools will be used in evaluating the impacts:
Noise and Vibration Modelling
Modelling the impacts from noise and vibrations was completed by including information from the baseline study such as topography, meteorology and baseline noise levels. The propagation of noise and vibrations was simulated from the sources to the receptors (populated areas and sensitive faunal habitats). Estimated levels were compared to national environmental quality standards.
Air Dispersion Modelling
This model used numeric and mathematical techniques to simulate physical and chemical processes that affected the dispersion of particulates and reactions with the atmosphere. The model was designed to characterise the transport and dispersion of particulates using meteorological, topographical and emission source (particulate and gaseous emissions) information. Air dispersion models are widely used by environmental protection agencies in the United States, Canada and Australia, to control environmental discharges through the identification of sources that contribute to air pollution and assists in designing strategies for control and mitigation of these sources. Air quality models are used to verify that the generation of new emission sources will not lead to non-compliance with air quality standards.
The Constancia dispersion model quantified the effects from the construction and operation phases on the surrounding air quality, with specific emphasis on sensitive receptors (populated areas).
Modelling of Visual Impacts
Visual impacts were characterised by developing visual basins. The visual basin analysis graphically represented the extent to which the project’s footprint will impact the visual environment. It included an analysis of natural barriers that affect visual accessibility to the project area of influence.
Viewshed 3-D was used to develop the visual basins. Rays or bands were used to cover the project area of influence and each ray l identified points that are visible and those that are not. Specific points of view included:
Points located within the visual basins of the Project site
Points close to the edge of specific infrastructure
Representative observation points that are free of visual barriers
\\Bnefp01\Users$\Greg.Lane\My Documents\Current Projects\Current Studies\Constancia\Ni 43-101 Report Feb 2011\Ni 43-101 Report Rev 0 21 Feb.Doc Rev: 0 Date: 21 February 2011 9999FM0038 – 2
156
Viewpoints of scenic importance close to the project area that are not necessarily within the visual basins .
After identifying the observation points, the visual accessibility was simulated, and a series of criteria evaluated:
Scenic importance of the point
Remoteness of the observation point with respect to project infrastructure
Perception of the infrastructure as a function of remoteness, context, accessibility, etc.
Water Quality Modelling
The potential impacts to surface water and groundwater resources in the project area of influence will be controlled and mitigated by specific strategies to ensure minimal impact to the quantity and quality of these resources.
A mixing zone water quality model was used to simulate the impacts of discharges on these water resources. Peruvian water quality objectives as well as guidelines from the USEPA (United States Environmental Protection Agency), the CCME (Canadian Council of Ministers of the Environment) and the WHO (World Health Organisation) and predicted water quality limits from project waste water streams were incorporated as inputs to the water quality modelling.
Socio-economic Impacts
The probable social effects resulting from the project in the region included:
migration of people (influx of workers and migration of farmer peasants)
increase in the demand for housing and an increase in vehicle traffic
improvement in education and health centres
new job opportunities to construct housing, improved infrastructure and social services
changes in land use
restrictions on livestock movement
limited physical and economic displacement of project-affected people within the area of direct influence.
Impact Evaluation Methodology
The impact evaluation methodology that was used is based on the “Methodological Guide for Environmental Impact Assessment” (Conesa Fernández-Vítora et al., 2003). Knight Piésold made some modifications to this methodology. The various steps included in the methodology are described below.
Verification matrix: The locations of effects were determined by the interaction of project activities and environmental baseline study components.
Significance of Effects: Specific effects of each project activity on each receptor were determined. Specific parameters such as character, magnitude, extension, duration, reversibility, accumulation and periodicity were used to determine the significance of the effects.
Significance of Environmental Receptors: The determination of the significance or importance of the environmental receptor in the area of influence is a function of its uniqueness, functional importance and/or conservation status.
\\Bnefp01\Users$\Greg.Lane\My Documents\Current Projects\Current Studies\Constancia\Ni 43-101 Report Feb 2011\Ni 43-101 Report Rev 0 21 Feb.Doc Rev: 0 Date: 21 February 2011 9999FM0038 – 2
157
Significance of Impacts: In this step the significance of the affect on the environmental receptor was evaluated to obtain the significance of the impact from the Project activity.
Area of influence: The final step in impact evaluation is determining the project’s area of influence. The determination of the area of influence considered effects from Project activities on the environmental receptors located in the study area.
18.12.2.6 Environmental management plan
The Environmental Management Plan (EMP) forms part of the ESIA, and is a management tool used to ensure that impacts from the development stages of the Project are controlled and mitigated. The EMP for the Project was designed to:
Identify mitigation and management strategies
Set objectives and targets
Define performance indicators
Document time frames to achieve targets
Allocate responsibilities and identify the necessary resources for the implementation of the plan
Establish mechanisms to monitor, evaluate and report on progress.
EMPs are important tools for ensuring that the management actions arising from the ESIA are clearly defined and implemented throughout all phases of the Project life cycle.
18.12.2.7 Community relations plan
The Community Relations Plan was prepared taking into account the following requirements:
Final determination of the Direct and Indirect Areas of Influence of the project, based on the outcomes of the Social Impact Analysis.
The needs in the construction and operation phases, as determined in the Social Impact Analysis.
The State’s requirements, as expressed in the Community Relations Guidelines of the MINEM and the Prior Commitment Act (DS 042-2003-EM).
The requirements of international financial institutions, taking into account the Equator Principles, IFC Performance Standards, APELL for Mining, and social management standards, such as SA8000 and AA1000SES.
The Community Relations Plan included the policies, mission and vision of Norsemont. Based on these principles, specific social programs will be designed for the mitigation and prevention of identified impacts. Generally, these programs address the following key topics:
Communication and Consultation
Participative Monitoring
Claims and Dispute Resolution
Local Employment
Social Investment
Land Acquisition and Resettlement
Code of Conduct for Workers
\\Bnefp01\Users$\Greg.Lane\My Documents\Current Projects\Current Studies\Constancia\Ni 43-101 Report Feb 2011\Ni 43-101 Report Rev 0 21 Feb.Doc Rev: 0 Date: 21 February 2011 9999FM0038 – 2
158
18.12.2.8 Cost-Benefit Analysis
Norsemont completed a cost benefit analysis (CBA) for the Project. A CBA is a relatively simple and widely used technique for deciding whether to make a change. It was completed by adding up the value of the benefits of a course of action, and subtracting the costs associated with it.
Costs may be either one-off or ongoing. Benefits are most often received over time. This effect of time is built into the analysis by calculating a payback period. This is the time it takes for the benefits of a change to repay its costs.
18.12.3 HSE management and monitoring plan
Norsemont will develop a comprehensive HSE management plan for the Constancia Project. The HSE management system will be designed to:
ensure HSE compliance
demonstrate that all hazards are appropriately managed
achieve continuous improvement in HSE performance.
Periodic and regular monitoring constitutes a principal component of the HSE plan for the construction, operation, closure and post closure phases of the project. The plan includes direct monitoring of air and water resources, and indirect monitoring of flora and fauna.
The monitoring program will provide information for evaluating actual project impacts and the effectiveness of the mitigation measures in place. This will allow for dynamic adjustments to the mitigation plan.
Six air quality monitoring stations have been proposed four adjacent to the open pit, and one each in Uchucarco and Chilloroya. Strict measures to maintain air quality will be implemented. This will involve, for example, spraying water on access roads for dust control to ensure compliance with legislation regarding airborne particulates.
Twelve surface water quality monitoring stations have been proposed in the area.
The TMF, PAG WRF, topsoil and unsuitable material stockpiles and all associated ponds will be instrumented for performance monitoring. This will include pore pressures in the tailings and mine waste, as well as in the drain zones and embankment structural zone and foundations. Water flow rates and totalised volumes will also be measured as will the water and tailings levels. Monitoring of slope movements and materials settlement will also be made.
Hazardous waste will be separated from common domestic waste. Domestic waste will be recycled whenever feasible. Norsemont will construct a sanitary landfill for the disposal of domestic wastes.
Hazardous waste will be stored temporarily in secondary confinement areas prior to removal to designated facilities for resale, recycling or definitive storage in accordance with Peruvian regulations.
In all cases, storage facilities for fuel and chemical substances will be designed with secondary impermeable containment. These lined and bermed containment areas will be designed to hold 110% of the capacity of the largest tank to avoid spillage of contaminants. No underground storage facilities for fuel are planned.
\\Bnefp01\Users$\Greg.Lane\My Documents\Current Projects\Current Studies\Constancia\Ni 43-101 Report Feb 2011\Ni 43-101 Report Rev 0 21 Feb.Doc Rev: 0 Date: 21 February 2011 9999FM0038 – 2
159
Sewage treatment facilities will be constructed servicing all project components. Operating procedures, including monitoring discharges, will comply with the corresponding Peruvian standards.
Health and safety procedures will be developed in accordance with Peruvian legislation and will be strictly enforced.
A restoration program will be developed to re-establish a landscape that is environmentally and aesthetically compatible with the surrounding countryside.
All personnel and contractors will be required to comply with the standards and procedures contained in the ESIA for all Project stages. Internal and external audits will be performed periodically to verify compliance.
18.12.4 Closure plan
18.12.4.1 Introduction
In accordance with Peruvian National Regulations for the mining sector, a Conceptual Social Closure Plan was developed and was approved by the Peruvian Ministry of Energy and Mines (MINEM). The conceptual plan included the principal impacts from project closure to the communities in the area of influence and identified measures to mitigate these impacts.
Reclamation and closure of the project will be conducted in accordance with international best practices. The objective of the mine reclamation and closure program is to return mined lands to conditions capable of supporting prior land use or uses that are equal to or better than prior land use to the extent practical and feasible. In addition, long-term stability and safety issues must be addressed as a priority.
The area to be disturbed and reclaimed encompasses approximately 796 ha. Reclamation and closure activities are to be conducted concurrently with mining operations, to the extent practical, to reduce the final reclamation and closure costs and minimise long term environmental liabilities. The key goals of reclamation and closure are to ensure the physical and chemical stability of the TMF and the PAG WRF.
18.12.4.2 Surface Reclamation and Revegetation Plan
During construction of the TMF, pit and PAG WRF, topsoil and subsoils that provide suitable growth media will be salvaged from the foundations during development of these facilities. The salvaged soils will be stockpiled for later use and seeded to control invasive weeds and erosion.
18.12.4.3 Reclamation and Closure by Facility
Specific plans for closure and reclamation of each portion of the project area are detailed below.
Table 18-14 summarises the surface area disturbance associated with each facility for the DFS design. These are yet to be updated for the concept outlined in this report.
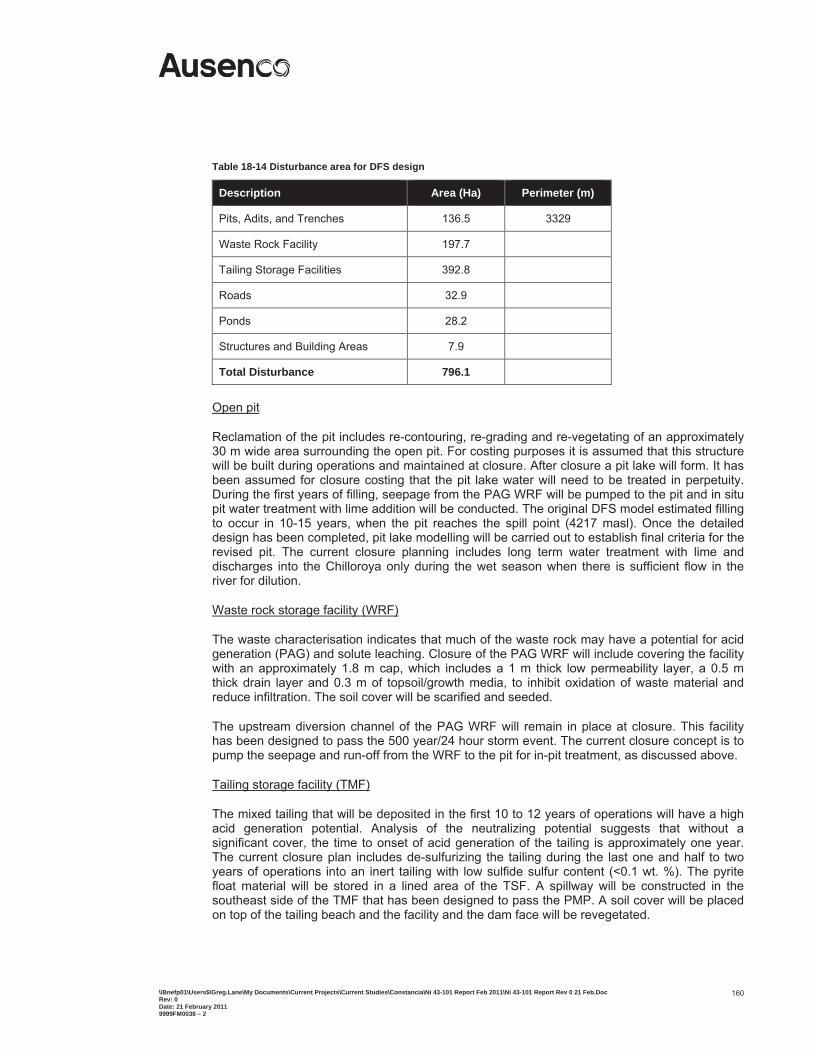
\\Bnefp01\Users$\Greg.Lane\My Documents\Current Projects\Current Studies\Constancia\Ni 43-101 Report Feb 2011\Ni 43-101 Report Rev 0 21 Feb.Doc Rev: 0 Date: 21 February 2011 9999FM0038 – 2
160
Table 18-14 Disturbance area for DFS design
Description Area (Ha) Perimeter (m)
Pits, Adits, and Trenches 136.5 3329
Waste Rock Facility 197.7
Tailing Storage Facilities 392.8
Roads 32.9
Ponds 28.2
Structures and Building Areas 7.9
Total Disturbance 796.1
Open pit
Reclamation of the pit includes re-contouring, re-grading and re-vegetating of an approximately 30 m wide area surrounding the open pit. For costing purposes it is assumed that this structure will be built during operations and maintained at closure. After closure a pit lake will form. It has been assumed for closure costing that the pit lake water will need to be treated in perpetuity. During the first years of filling, seepage from the PAG WRF will be pumped to the pit and in situ pit water treatment with lime addition will be conducted. The original DFS model estimated filling to occur in 10-15 years, when the pit reaches the spill point (4217 masl). Once the detailed design has been completed, pit lake modelling will be carried out to establish final criteria for the revised pit. The current closure planning includes long term water treatment with lime and discharges into the Chilloroya only during the wet season when there is sufficient flow in the river for dilution.
Waste rock storage facility (WRF)
The waste characterisation indicates that much of the waste rock may have a potential for acid generation (PAG) and solute leaching. Closure of the PAG WRF will include covering the facility with an approximately 1.8 m cap, which includes a 1 m thick low permeability layer, a 0.5 m thick drain layer and 0.3 m of topsoil/growth media, to inhibit oxidation of waste material and reduce infiltration. The soil cover will be scarified and seeded.
The upstream diversion channel of the PAG WRF will remain in place at closure. This facility has been designed to pass the 500 year/24 hour storm event. The current closure concept is to pump the seepage and run-off from the WRF to the pit for in-pit treatment, as discussed above.
Tailing storage facility (TMF)
The mixed tailing that will be deposited in the first 10 to 12 years of operations will have a high acid generation potential. Analysis of the neutralizing potential suggests that without a significant cover, the time to onset of acid generation of the tailing is approximately one year. The current closure plan includes de-sulfurizing the tailing during the last one and half to two years of operations into an inert tailing with low sulfide sulfur content (<0.1 wt. %). The pyrite float material will be stored in a lined area of the TSF. A spillway will be constructed in the southeast side of the TMF that has been designed to pass the PMP. A soil cover will be placed on top of the tailing beach and the facility and the dam face will be revegetated.
\\Bnefp01\Users$\Greg.Lane\My Documents\Current Projects\Current Studies\Constancia\Ni 43-101 Report Feb 2011\Ni 43-101 Report Rev 0 21 Feb.Doc Rev: 0 Date: 21 February 2011 9999FM0038 – 2
161
Roads
Roads within the project, including remnants of old access and/or exploration roads, will be reclaimed.
Road reclamation is to include pushing safety berms down and over roads, removing culverts, backfilling ditches, and re-grading areas to re-establish the natural drainage system. Fill will be brought in where necessary. After re-grading is completed, road areas will be scarified and seeded.
Infrastructure
Infrastructure items will be removed from the project area when they are no longer needed to support mining or process activities. The closure cost assumes that the demolition costs would be covered by the salvage costs of the equipment. Concrete foundations will be buried in place. Scrap metal will be removed from the project area. The mill will be decontaminated. Associated yard areas will be ripped to eliminate compacted soils and regraded. After regrading is completed, previously disturbed areas will be scarified and seeded.
Production water wells will be abandoned in accordance with local regulations or transferred to support an approved post-mining land use. Monitoring wells are to be abandoned properly once regulatory officials decide they are no longer necessary for monitoring purposes. Water lines, utility poles, power lines, fuel tanks, generators, transformers and other items remaining in the project area after mine operations cease will be removed from the site and disposed of properly unless they can be used by the communities. The non-hazardous sanitary land fill will be closed by placing an inert cap over the facility and removing any infrastructure (fences, platforms, etc.).
18.12.4.4 Monitoring and Reporting
Each year, annual reports will be prepared to document the closure and reclamation activities. Revegetation efforts will be monitored biannually by a range specialist to record vegetation success, monitor erosion, and modify reclamation plans if necessary. Groundwater wells and surface water sites will be sampled quarterly to record post-mining water quality. At the conclusion of reclamation activities, as-built diagrams of the reclaimed features will be prepared for future reference purposes.
18.12.4.5 Reclamation Schedule and Cost
Closure and reclamation activities are anticipated to take place over a five year period. Table 18-15 presents the reclamation cost estimate, including a 25% contingency. The total estimated cost is approximately $38.2 M. Reclamation costs for earthworks were supplied by GRD Minproc assuming owner operated fleets. Closure costs for water treatment are based on similar projects in South America. Water treatment costs assume in-pit lime treatment and does not account for assurances of meeting in-stream standards. Water will be discharged only during the wet season to use dilution as a means to meet in-stream standards. The closure costs for water treatment presented in Table 18-15 assume one year of water treatment costs based on a net present value using a 7% interest rate. This fund will be maintained in perpetuity in the annual bond accrual for water treatment.
Demolition and removal is assumed to be covered in salvage costs - net cost is therefore zero.
Contingency is included in the overall project contingency.
Reclamation costs and water treatment requirements will be reviewed and adjusted per the final design. The optimised project will has a larger waste dump and tailings dam. However, no changes were made to the DFS reclamation costs for this Technical Report.
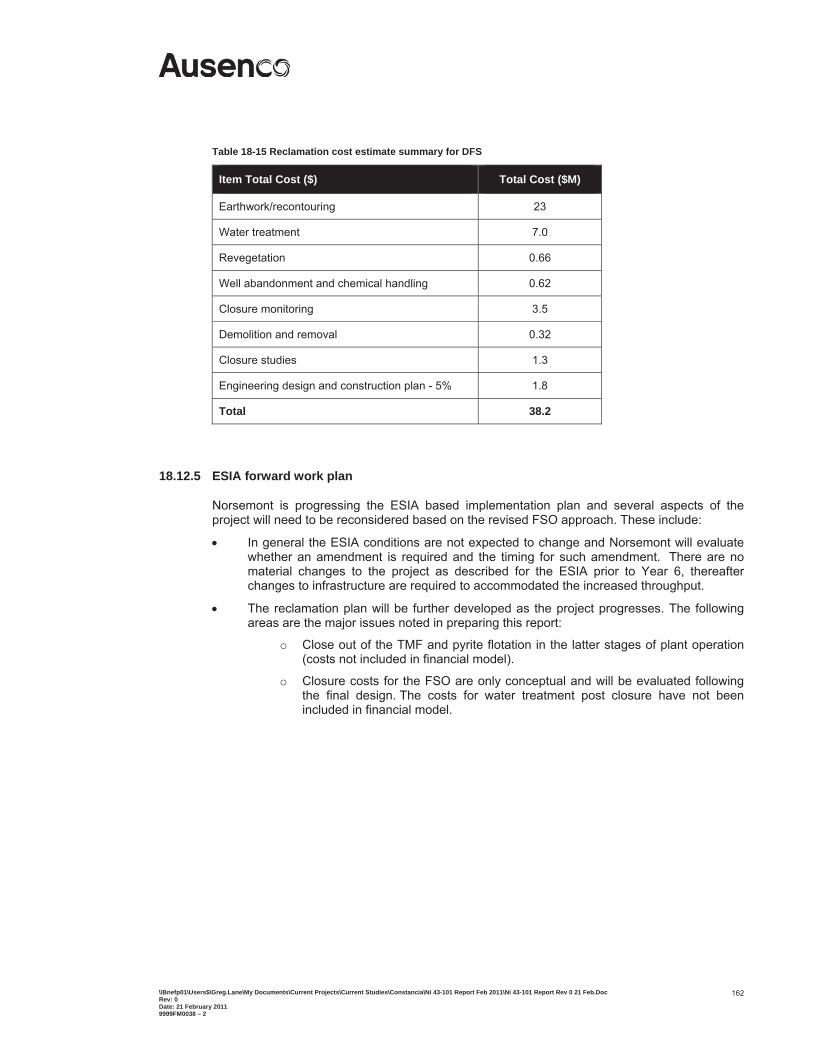
\\Bnefp01\Users$\Greg.Lane\My Documents\Current Projects\Current Studies\Constancia\Ni 43-101 Report Feb 2011\Ni 43-101 Report Rev 0 21 Feb.Doc Rev: 0 Date: 21 February 2011 9999FM0038 – 2
162
Table 18-15 Reclamation cost estimate summary for DFS
Item Total Cost ($) Total Cost ($M)
Earthwork/recontouring 23
Water treatment 7.0
Revegetation 0.66
Well abandonment and chemical handling 0.62
Closure monitoring 3.5
Demolition and removal 0.32
Closure studies 1.3
Engineering design and construction plan - 5% 1.8
Total 38.2
18.12.5 ESIA forward work plan
Norsemont is progressing the ESIA based implementation plan and several aspects of the project will need to be reconsidered based on the revised FSO approach. These include:
In general the ESIA conditions are not expected to change and Norsemont will evaluate whether an amendment is required and the timing for such amendment. There are no material changes to the project as described for the ESIA prior to Year 6, thereafter changes to infrastructure are required to accommodated the increased throughput.
The reclamation plan will be further developed as the project progresses. The following areas are the major issues noted in preparing this report:
o Close out of the TMF and pyrite flotation in the latter stages of plant operation (costs not included in financial model).
o Closure costs for the FSO are only conceptual and will be evaluated following the final design. The costs for water treatment post closure have not been included in financial model.
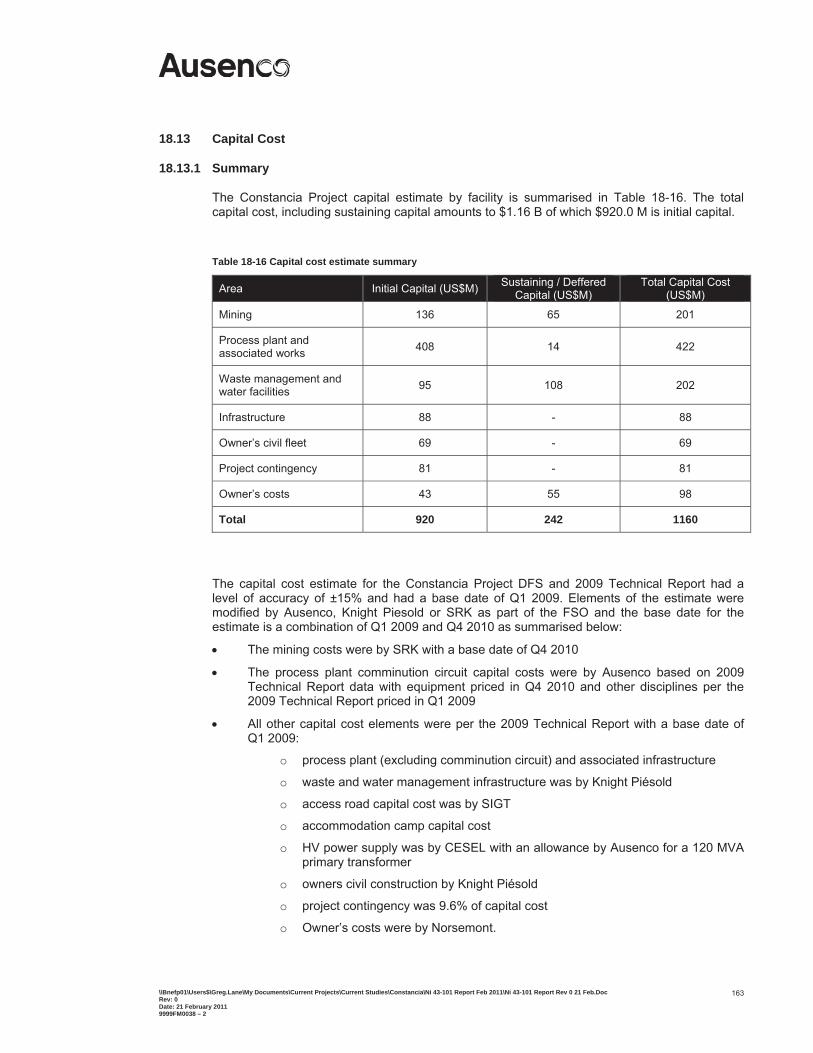
\\Bnefp01\Users$\Greg.Lane\My Documents\Current Projects\Current Studies\Constancia\Ni 43-101 Report Feb 2011\Ni 43-101 Report Rev 0 21 Feb.Doc Rev: 0 Date: 21 February 2011 9999FM0038 – 2
163
18.13 Capital Cost
18.13.1 Summary
The Constancia Project capital estimate by facility is summarised in Table 18-16. The total capital cost, including sustaining capital amounts to $1.16 B of which $920.0 M is initial capital.
Table 18-16 Capital cost estimate summary
Area Initial Capital (US$M) Sustaining / Deffered Capital (US$M)
Total Capital Cost (US$M)
Mining 136 65 201
Process plant and associated works 408 14 422
Waste management and water facilities 95 108 202
Infrastructure 88 - 88
Owner’s civil fleet 69 - 69
Project contingency 81 - 81
Owner’s costs 43 55 98
Total 920 242 1160
The capital cost estimate for the Constancia Project DFS and 2009 Technical Report had a level of accuracy of ±15% and had a base date of Q1 2009. Elements of the estimate were modified by Ausenco, Knight Piesold or SRK as part of the FSO and the base date for the estimate is a combination of Q1 2009 and Q4 2010 as summarised below:
The mining costs were by SRK with a base date of Q4 2010
The process plant comminution circuit capital costs were by Ausenco based on 2009 Technical Report data with equipment priced in Q4 2010 and other disciplines per the 2009 Technical Report priced in Q1 2009
All other capital cost elements were per the 2009 Technical Report with a base date of Q1 2009:
o process plant (excluding comminution circuit) and associated infrastructure
o waste and water management infrastructure was by Knight Piésold
o access road capital cost was by SIGT
o accommodation camp capital cost
o HV power supply was by CESEL with an allowance by Ausenco for a 120 MVA primary transformer
o owners civil construction by Knight Piésold
o project contingency was 9.6% of capital cost
o Owner’s costs were by Norsemont.
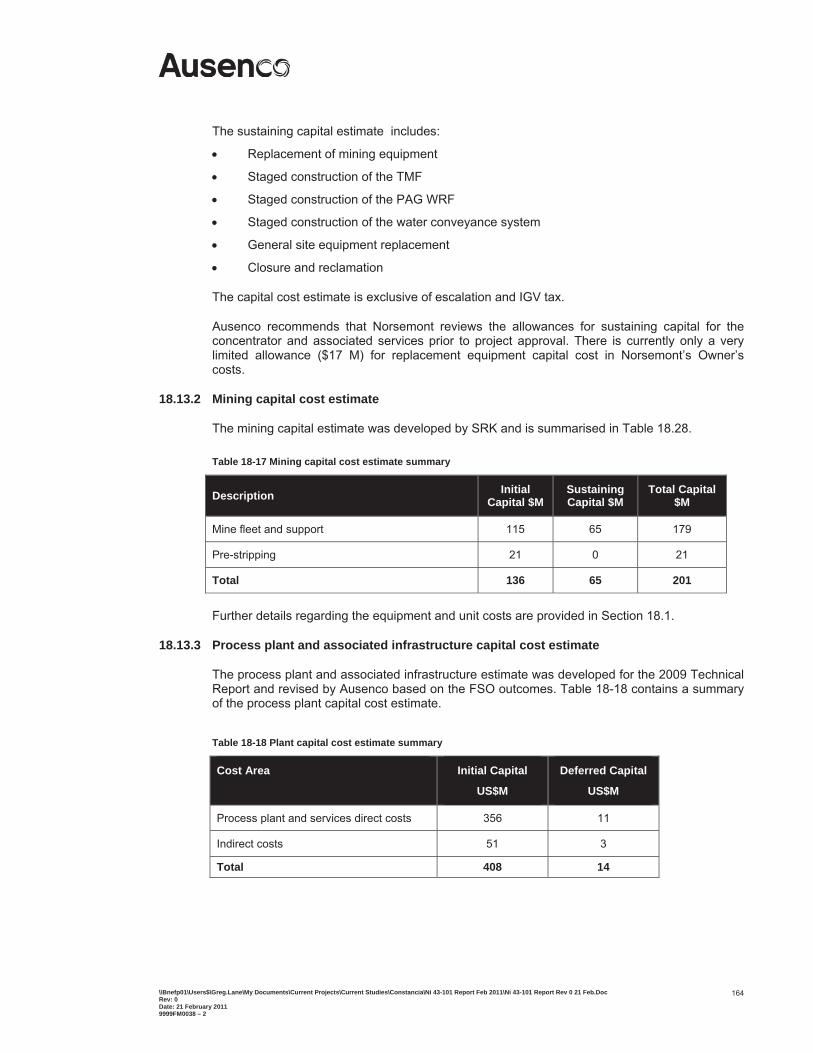
\\Bnefp01\Users$\Greg.Lane\My Documents\Current Projects\Current Studies\Constancia\Ni 43-101 Report Feb 2011\Ni 43-101 Report Rev 0 21 Feb.Doc Rev: 0 Date: 21 February 2011 9999FM0038 – 2
164
The sustaining capital estimate includes:
Replacement of mining equipment
Staged construction of the TMF
Staged construction of the PAG WRF
Staged construction of the water conveyance system
General site equipment replacement
Closure and reclamation
The capital cost estimate is exclusive of escalation and IGV tax.
Ausenco recommends that Norsemont reviews the allowances for sustaining capital for the concentrator and associated services prior to project approval. There is currently only a very limited allowance ($17 M) for replacement equipment capital cost in Norsemont’s Owner’s costs.
18.13.2 Mining capital cost estimate
The mining capital estimate was developed by SRK and is summarised in Table 18.28.
Table 18-17 Mining capital cost estimate summary
Description Initial Capital $M
Sustaining Capital $M
Total Capital $M
Mine fleet and support 115 65 179
Pre-stripping 21 0 21
Total 136 65 201
Further details regarding the equipment and unit costs are provided in Section 18.1.
18.13.3 Process plant and associated infrastructure capital cost estimate
The process plant and associated infrastructure estimate was developed for the 2009 Technical Report and revised by Ausenco based on the FSO outcomes. Table 18-18 contains a summary of the process plant capital cost estimate.
Table 18-18 Plant capital cost estimate summary
Cost Area Initial Capital
US$M
Deferred Capital
US$M
Process plant and services direct costs 356 11
Indirect costs 51 3
Total 408 14
\\Bnefp01\Users$\Greg.Lane\My Documents\Current Projects\Current Studies\Constancia\Ni 43-101 Report Feb 2011\Ni 43-101 Report Rev 0 21 Feb.Doc Rev: 0 Date: 21 February 2011 9999FM0038 – 2
165
The basis of the capital cost estimate was that used for the 2009 Technical Report. Only the areas pertaining to crushing and grinding were modified as a result of the FSO outcomes.
The process plant and associated Infrastructure capital cost estimate covered the engineering, administration, procurement services, construction, pre-commissioning, and commissioning of the process plant and associated on-site facilities. The exception was the electrical, instrumentation and controls component of the estimate which included for the distribution of power and communications from the plant site to other facilities site-wide.
The estimate comprised equipment supply inclusive of import duties, fabrication, installation and construction costs for the permanent and temporary works. Equipments costs were based on budget pricing sourced from international suppliers with the appropriate currency conversions applied.
Fabrication, installation and construction costs were based on budget pricing obtained from Peruvian contractors. The rates provided by the contractors include allowance for inherent risks, including productivity impacts due to the high elevation of the site. Piping was factored as a percentage of the mechanical equipment supply and installation price.
An accuracy provision allowance was provided in the cost estimate for quantity growth. This allowance accounts for the increase in quantities in developing the design from the current level to the final constructed product. The quantum of this allowance was based that used in the 2009 Technical Report.
The deferred capital pertains to the works associated to retrofit one pebble crusher on each train in Year 5/6.
A summary estimate by area and discipline for the process plant and associated infrastructure is included in Table 18-19.
There is no allowance in the capital cost estimate for the following items:
Sustaining capital for minor works associated with the concentrator.
The proposed de-sulfurising (by pyrite flotation) plant tailings required during the last one and half to two years of operations, to form inert tailings. Norsemont will assess the needs during the later stages of operation.
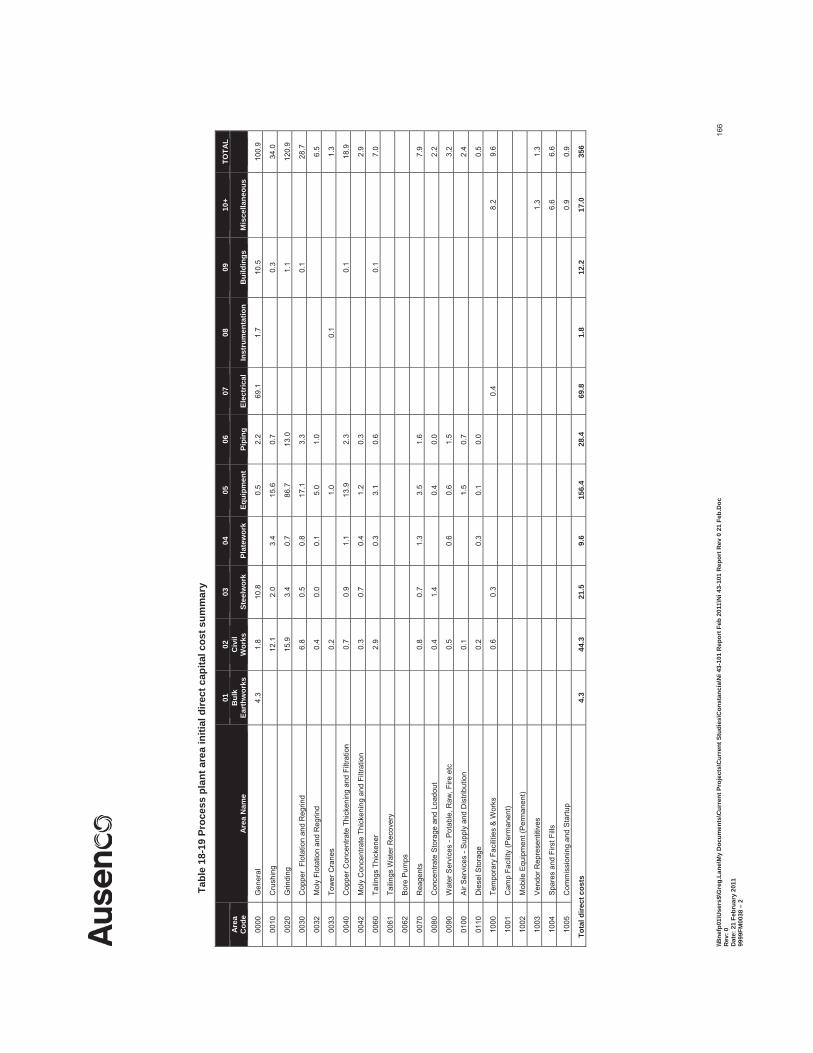
\\Bne
fp01
\Use
rs$\
Gre
g.La
ne\M
y D
ocum
ents
\Cur
rent
Pro
ject
s\C
urre
nt S
tudi
es\C
onst
anci
a\N
i 43-
101
Rep
ort F
eb 2
011\
Ni 4
3-10
1 R
epor
t Rev
0 2
1 Fe
b.D
oc
Rev
: 0
Dat
e: 2
1 Fe
brua
ry 2
011
9999
FM00
38 –
2
166
Tabl
e 18
-19
Proc
ess
plan
t are
a in
itial
dire
ct c
apita
l cos
t sum
mar
y
Are
a N
ame
01
02
03
04
05
06
07
08
09
10+
TOTA
L A
rea
Cod
eB
ulk
Eart
hwor
ks
Civ
il W
orks
St
eelw
ork
Plat
ewor
k Eq
uipm
ent
Pipi
ngEl
ectr
ical
In
stru
men
tatio
nB
uild
ings
M
isce
llane
ous
0000
G
ener
al
4.3
1.8
10.8
0.5
2.2
69.1
1.
7 10
.5
10
0.9
0010
C
rush
ing
12
.1
2.0
3.4
15.6
0.
7
0.
3
34.0
0020
G
rindi
ng
15
.9
3.4
0.7
86.7
13
.0
1.1
12
0.9
0030
C
oppe
r Fl
otat
ion
and
Reg
rind
6.
8 0.
5 0.
8 17
.1
3.3
0.1
28
.7
0032
M
oly
Flot
atio
n an
d R
egrin
d
0.4
0.0
0.1
5.0
1.0
6.5
0033
To
wer
Cra
nes
0.
2
1.
0
0.
1
1.
3
0040
C
oppe
r Con
cent
rate
Thi
cken
ing
and
Filtr
atio
n
0.7
0.9
1.1
13.9
2.
3
0.
1
18.9
0042
M
oly
Con
cent
rate
Thi
cken
ing
and
Filtr
atio
n
0.3
0.7
0.4
1.2
0.3
2.9
0060
Ta
ilings
Thi
cken
er
2.
9
0.3
3.1
0.6
0.1
7.
0
0061
Ta
iling
s W
ater
Rec
over
y
0062
B
ore
Pum
ps
0070
R
eage
nts
0.
8 0.
7 1.
3 3.
5 1.
6
7.
9
0080
C
once
ntra
te S
tora
ge a
nd L
oado
ut
0.
4 1.
4
0.4
0.0
2.2
0090
W
ater
Ser
vice
s - P
otab
le, R
aw, F
ire e
tc
0.
5
0.6
0.6
1.5
3.2
0100
A
ir S
ervi
ces
- Sup
ply
and
Dis
tribu
tion
0.
1
1.
5 0.
7
2.
4
0110
D
iese
l Sto
rage
0.2
0.
3 0.
1 0.
0
0.
5
1000
Te
mpo
rary
Fac
ilitie
s &
Wor
ks
0.
6 0.
3
0.4
8.2
9.6
1001
C
amp
Faci
lity
(Per
man
ent)
1002
M
obile
Equ
ipm
ent (
Per
man
ent)
1003
V
endo
r Rep
rese
ntiti
ves
1.
3 1.
3
1004
S
pare
s an
d Fi
rst F
ills
6.
6 6.
6
1005
C
omm
issi
onin
g an
d St
artu
p
0.9
0.9
Tot
al d
irect
cos
ts
4.3
44.3
21
.5
9.6
156.
4 28
.4
69.8
1.
8 12
.2
17.0
35
6
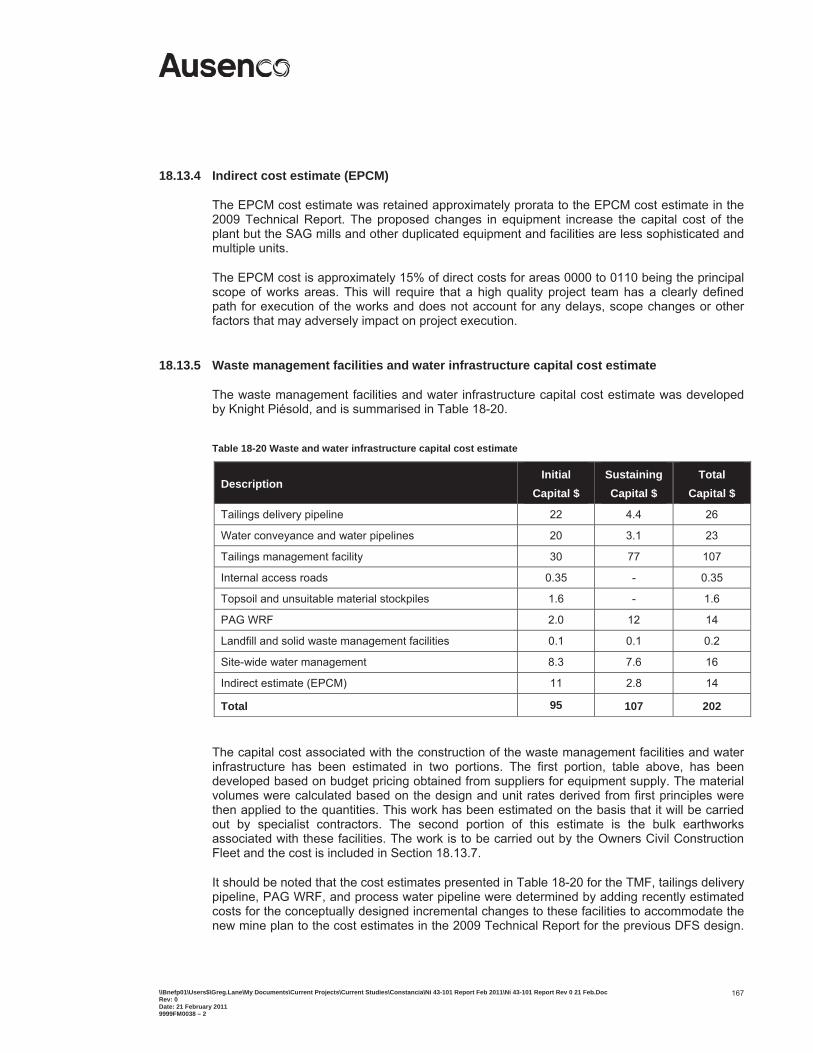
\\Bnefp01\Users$\Greg.Lane\My Documents\Current Projects\Current Studies\Constancia\Ni 43-101 Report Feb 2011\Ni 43-101 Report Rev 0 21 Feb.Doc Rev: 0 Date: 21 February 2011 9999FM0038 – 2
167
18.13.4 Indirect cost estimate (EPCM)
The EPCM cost estimate was retained approximately prorata to the EPCM cost estimate in the 2009 Technical Report. The proposed changes in equipment increase the capital cost of the plant but the SAG mills and other duplicated equipment and facilities are less sophisticated and multiple units.
The EPCM cost is approximately 15% of direct costs for areas 0000 to 0110 being the principal scope of works areas. This will require that a high quality project team has a clearly defined path for execution of the works and does not account for any delays, scope changes or other factors that may adversely impact on project execution.
18.13.5 Waste management facilities and water infrastructure capital cost estimate
The waste management facilities and water infrastructure capital cost estimate was developed by Knight Piésold, and is summarised in Table 18-20.
Table 18-20 Waste and water infrastructure capital cost estimate
Description Initial
Capital $ Sustaining Capital $
Total Capital $
Tailings delivery pipeline 22 4.4 26
Water conveyance and water pipelines 20 3.1 23
Tailings management facility 30 77 107
Internal access roads 0.35 - 0.35
Topsoil and unsuitable material stockpiles 1.6 - 1.6
PAG WRF 2.0 12 14
Landfill and solid waste management facilities 0.1 0.1 0.2
Site-wide water management 8.3 7.6 16
Indirect estimate (EPCM) 11 2.8 14
Total 95 107 202
The capital cost associated with the construction of the waste management facilities and water infrastructure has been estimated in two portions. The first portion, table above, has been developed based on budget pricing obtained from suppliers for equipment supply. The material volumes were calculated based on the design and unit rates derived from first principles were then applied to the quantities. This work has been estimated on the basis that it will be carried out by specialist contractors. The second portion of this estimate is the bulk earthworks associated with these facilities. The work is to be carried out by the Owners Civil Construction Fleet and the cost is included in Section 18.13.7.
It should be noted that the cost estimates presented in Table 18-20 for the TMF, tailings delivery pipeline, PAG WRF, and process water pipeline were determined by adding recently estimated costs for the conceptually designed incremental changes to these facilities to accommodate the new mine plan to the cost estimates in the 2009 Technical Report for the previous DFS design.
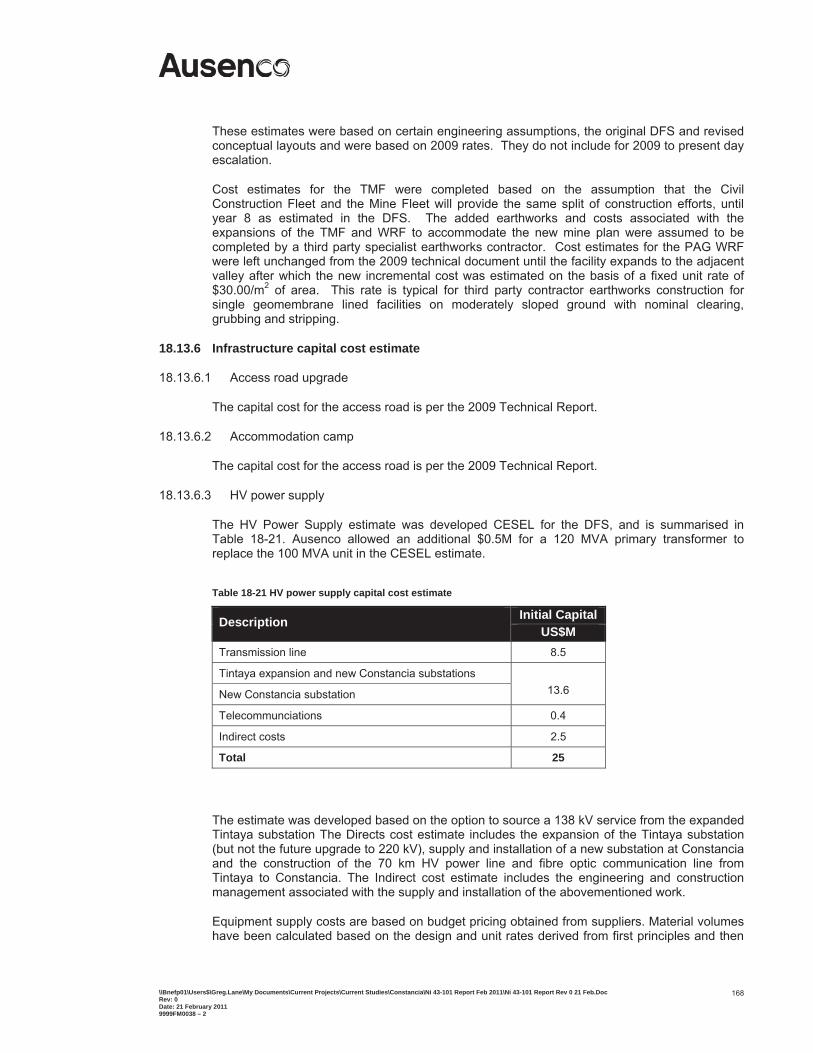
\\Bnefp01\Users$\Greg.Lane\My Documents\Current Projects\Current Studies\Constancia\Ni 43-101 Report Feb 2011\Ni 43-101 Report Rev 0 21 Feb.Doc Rev: 0 Date: 21 February 2011 9999FM0038 – 2
168
These estimates were based on certain engineering assumptions, the original DFS and revised conceptual layouts and were based on 2009 rates. They do not include for 2009 to present day escalation.
Cost estimates for the TMF were completed based on the assumption that the Civil Construction Fleet and the Mine Fleet will provide the same split of construction efforts, until year 8 as estimated in the DFS. The added earthworks and costs associated with the expansions of the TMF and WRF to accommodate the new mine plan were assumed to be completed by a third party specialist earthworks contractor. Cost estimates for the PAG WRF were left unchanged from the 2009 technical document until the facility expands to the adjacent valley after which the new incremental cost was estimated on the basis of a fixed unit rate of $30.00/m2 of area. This rate is typical for third party contractor earthworks construction for single geomembrane lined facilities on moderately sloped ground with nominal clearing, grubbing and stripping.
18.13.6 Infrastructure capital cost estimate
18.13.6.1 Access road upgrade
The capital cost for the access road is per the 2009 Technical Report.
18.13.6.2 Accommodation camp
The capital cost for the access road is per the 2009 Technical Report.
18.13.6.3 HV power supply
The HV Power Supply estimate was developed CESEL for the DFS, and is summarised in Table 18-21. Ausenco allowed an additional $0.5M for a 120 MVA primary transformer to replace the 100 MVA unit in the CESEL estimate.
Table 18-21 HV power supply capital cost estimate
Description Initial Capital US$M
Transmission line 8.5
Tintaya expansion and new Constancia substations 13.6 New Constancia substation
Telecommunciations 0.4
Indirect costs 2.5
Total 25
The estimate was developed based on the option to source a 138 kV service from the expanded Tintaya substation The Directs cost estimate includes the expansion of the Tintaya substation (but not the future upgrade to 220 kV), supply and installation of a new substation at Constancia and the construction of the 70 km HV power line and fibre optic communication line from Tintaya to Constancia. The Indirect cost estimate includes the engineering and construction management associated with the supply and installation of the abovementioned work.
Equipment supply costs are based on budget pricing obtained from suppliers. Material volumes have been calculated based on the design and unit rates derived from first principles and then
\\Bnefp01\Users$\Greg.Lane\My Documents\Current Projects\Current Studies\Constancia\Ni 43-101 Report Feb 2011\Ni 43-101 Report Rev 0 21 Feb.Doc Rev: 0 Date: 21 February 2011 9999FM0038 – 2
169
applied to the quantities to develop item costs. The methodology is consistent with producing an estimate with an accuracy range of ± 15%, as required for the DFS.
It is noted that the power contractor will not utilise the construction camp located on the mine site. The cost of providing a site camp for the construction and supervision is included within the Indirect cost.
18.13.6.4 Owner’s civil construction costs
The capital cost for the Owner’s civil construction works is per the 2009 Technical Report.
18.13.7 Owner’s cost estimate
The Owner’s cost estimate is per the 2009 Technical Report.
18.13.8 Contingency
The 2009 Technical Report contained a Project Contingency estimate that was developed for the mining, process plant and associated infrastructure, accommodation camp, tailings, waste, water management, access road, HV power supply and Owner’s costs. The project contingency was developed using a risk based approach rather than a traditional approach of applying a simple percentage contingency allowance.
Norsemont selected the P80 values to support its Contingency Estimate. The P80 has an 80% probability that the final expenditure will not exceed the estimate, and a 20% probability that the final expenditure will exceed the estimate. Adopting a P80 figure results in a contingency of 9.6% of the capital estimate.
The contingency percentage determined for the DFS was retained for the FSO and this Technical Report.
18.14 Operating Costs
18.14.1 Summary
The Constancia Project operating cost estimate is summarised in Table 18-22. The operating cost estimate for the Constancia Project has a level of accuracy of ±15% (based on the DFS cost base) and a base date of Q1 2009.
The operating cost estimates associated with the various facilities were developed based on the 2009 Technical Report by the following organisations:
Mining – SRK
Comminuiton process plant and associated services – Ausenco
Remainder of process plant and associate infrastructure - per the 2009 Technical Report
Water services – Knight Piésold
General and administration – per the 2009 Technical Report
Off-site costs – per the 2009 Technical Report
Royalties – per the 2009 Technical Report
The operating cost estimates were developed based on materials cost and unit rates from supplier quotations as well as historical experience on similar projects.
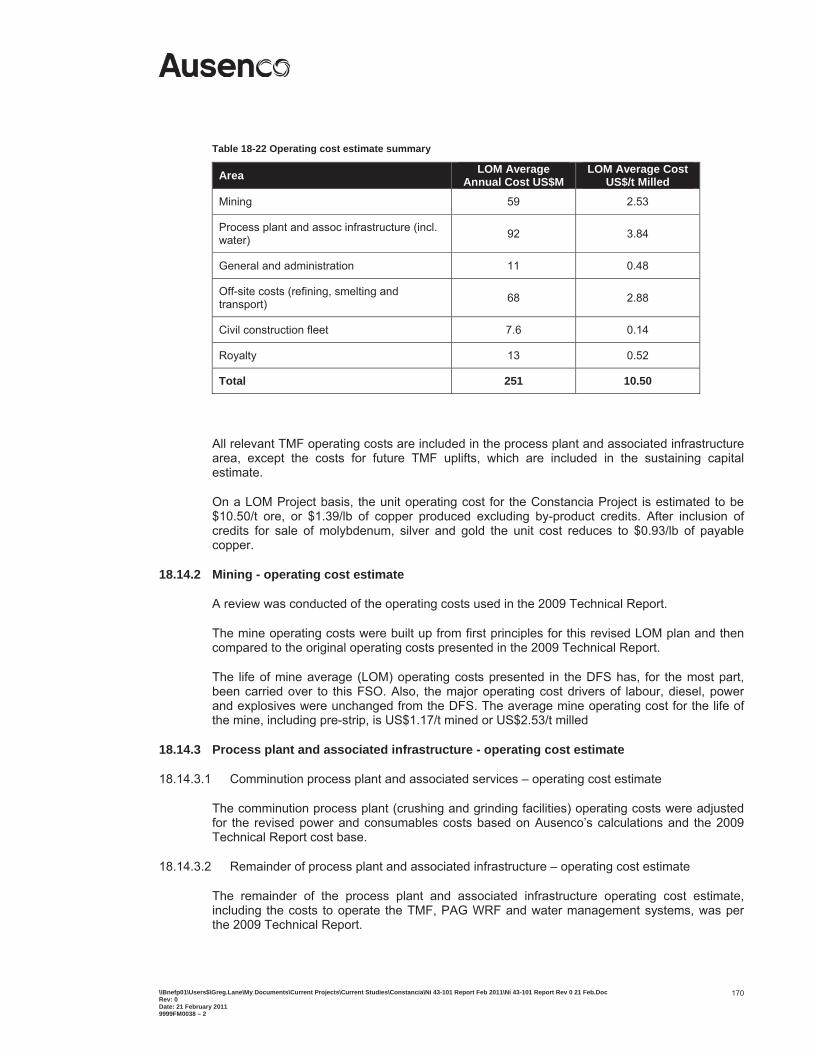
\\Bnefp01\Users$\Greg.Lane\My Documents\Current Projects\Current Studies\Constancia\Ni 43-101 Report Feb 2011\Ni 43-101 Report Rev 0 21 Feb.Doc Rev: 0 Date: 21 February 2011 9999FM0038 – 2
170
Table 18-22 Operating cost estimate summary
Area LOM Average Annual Cost US$M
LOM Average Cost US$/t Milled
Mining 59 2.53
Process plant and assoc infrastructure (incl. water) 92 3.84
General and administration 11 0.48
Off-site costs (refining, smelting and transport) 68 2.88
Civil construction fleet 7.6 0.14
Royalty 13 0.52
Total 251 10.50
All relevant TMF operating costs are included in the process plant and associated infrastructure area, except the costs for future TMF uplifts, which are included in the sustaining capital estimate.
On a LOM Project basis, the unit operating cost for the Constancia Project is estimated to be $10.50/t ore, or $1.39/lb of copper produced excluding by-product credits. After inclusion of credits for sale of molybdenum, silver and gold the unit cost reduces to $0.93/lb of payable copper.
18.14.2 Mining - operating cost estimate
A review was conducted of the operating costs used in the 2009 Technical Report.
The mine operating costs were built up from first principles for this revised LOM plan and then compared to the original operating costs presented in the 2009 Technical Report.
The life of mine average (LOM) operating costs presented in the DFS has, for the most part, been carried over to this FSO. Also, the major operating cost drivers of labour, diesel, power and explosives were unchanged from the DFS. The average mine operating cost for the life of the mine, including pre-strip, is US$1.17/t mined or US$2.53/t milled
18.14.3 Process plant and associated infrastructure - operating cost estimate
18.14.3.1 Comminution process plant and associated services – operating cost estimate
The comminution process plant (crushing and grinding facilities) operating costs were adjusted for the revised power and consumables costs based on Ausenco’s calculations and the 2009 Technical Report cost base.
18.14.3.2 Remainder of process plant and associated infrastructure – operating cost estimate
The remainder of the process plant and associated infrastructure operating cost estimate, including the costs to operate the TMF, PAG WRF and water management systems, was per the 2009 Technical Report.
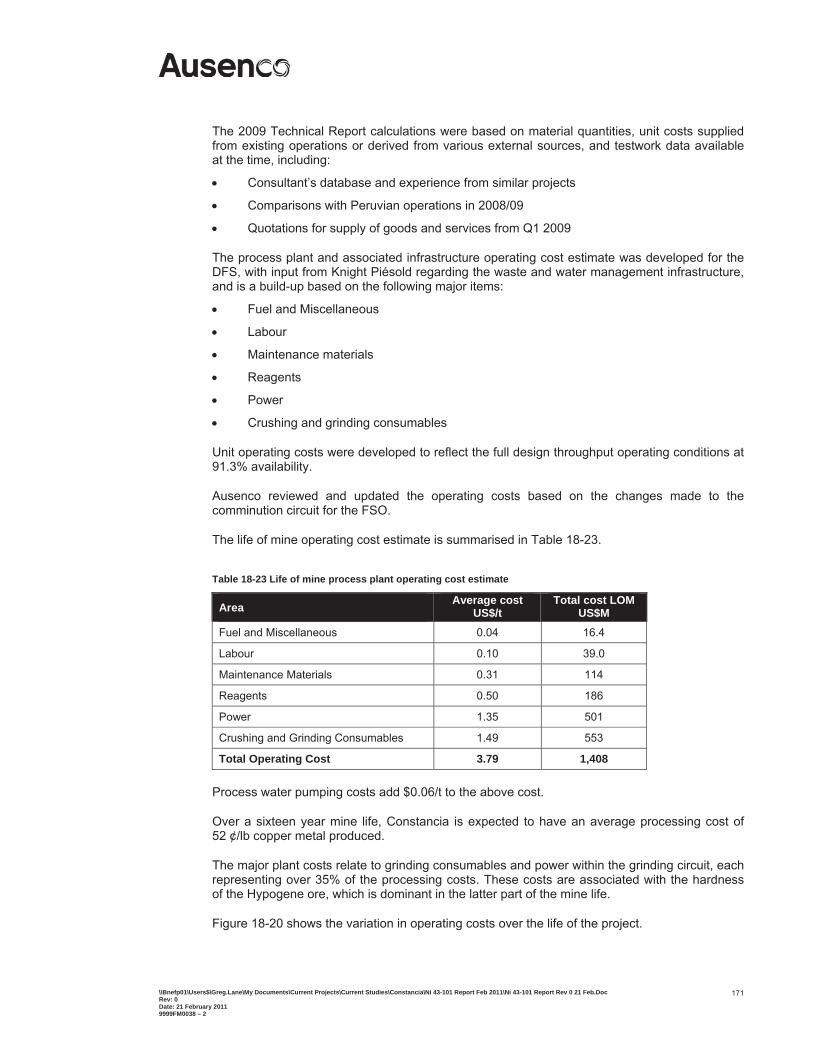
\\Bnefp01\Users$\Greg.Lane\My Documents\Current Projects\Current Studies\Constancia\Ni 43-101 Report Feb 2011\Ni 43-101 Report Rev 0 21 Feb.Doc Rev: 0 Date: 21 February 2011 9999FM0038 – 2
171
The 2009 Technical Report calculations were based on material quantities, unit costs supplied from existing operations or derived from various external sources, and testwork data available at the time, including:
Consultant’s database and experience from similar projects
Comparisons with Peruvian operations in 2008/09
Quotations for supply of goods and services from Q1 2009
The process plant and associated infrastructure operating cost estimate was developed for the DFS, with input from Knight Piésold regarding the waste and water management infrastructure, and is a build-up based on the following major items:
Fuel and Miscellaneous
Labour
Maintenance materials
Reagents
Power
Crushing and grinding consumables
Unit operating costs were developed to reflect the full design throughput operating conditions at 91.3% availability.
Ausenco reviewed and updated the operating costs based on the changes made to the comminution circuit for the FSO.
The life of mine operating cost estimate is summarised in Table 18-23.
Table 18-23 Life of mine process plant operating cost estimate
Area Average cost US$/t
Total cost LOM US$M
Fuel and Miscellaneous 0.04 16.4
Labour 0.10 39.0
Maintenance Materials 0.31 114
Reagents 0.50 186
Power 1.35 501
Crushing and Grinding Consumables 1.49 553
Total Operating Cost 3.79 1,408
Process water pumping costs add $0.06/t to the above cost.
Over a sixteen year mine life, Constancia is expected to have an average processing cost of 52 ¢/lb copper metal produced.
The major plant costs relate to grinding consumables and power within the grinding circuit, each representing over 35% of the processing costs. These costs are associated with the hardness of the Hypogene ore, which is dominant in the latter part of the mine life.
Figure 18-20 shows the variation in operating costs over the life of the project.
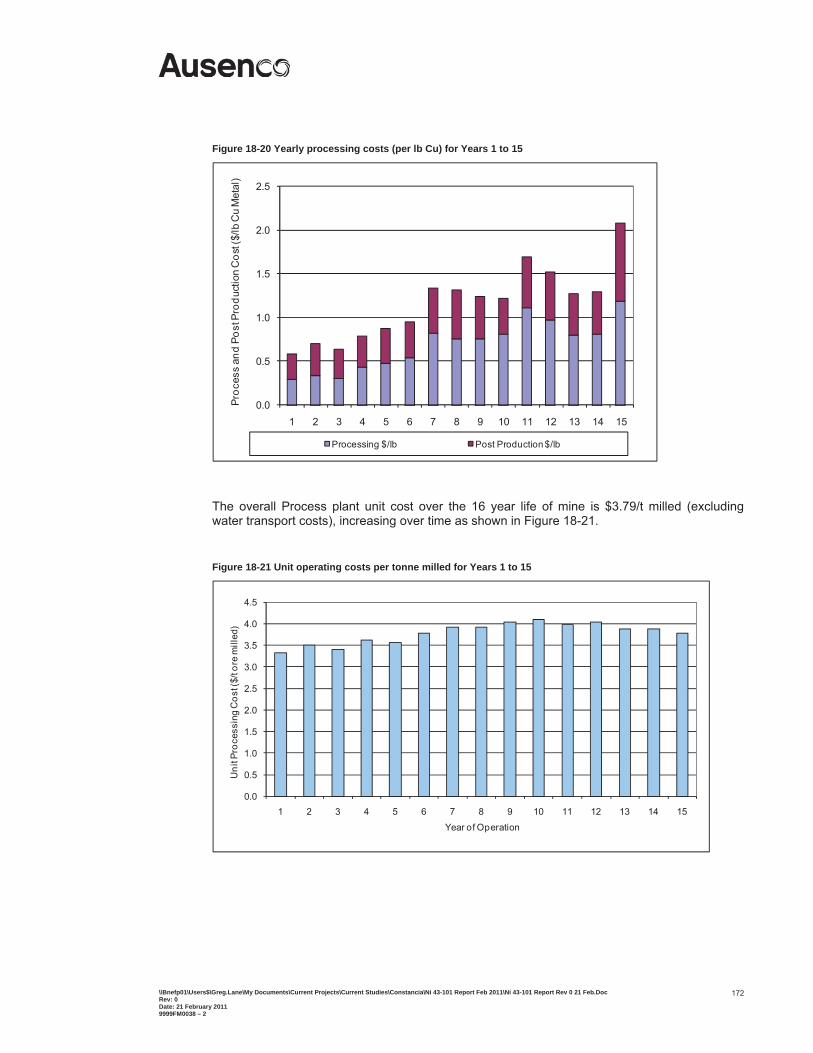
\\Bnefp01\Users$\Greg.Lane\My Documents\Current Projects\Current Studies\Constancia\Ni 43-101 Report Feb 2011\Ni 43-101 Report Rev 0 21 Feb.Doc Rev: 0 Date: 21 February 2011 9999FM0038 – 2
172
Figure 18-20 Yearly processing costs (per lb Cu) for Years 1 to 15
0.0
0.5
1.0
1.5
2.0
2.5
1 2 3 4 5 6 7 8 9 10 11 12 13 14 15
Proc
ess
and
Post
Pro
duct
ion
Cos
t ($/
lb C
u M
etal
)
Year of OperationProcessing $/lb Post Production $/lb
The overall Process plant unit cost over the 16 year life of mine is $3.79/t milled (excluding water transport costs), increasing over time as shown in Figure 18-21.
Figure 18-21 Unit operating costs per tonne milled for Years 1 to 15
0.0
0.5
1.0
1.5
2.0
2.5
3.0
3.5
4.0
4.5
1 2 3 4 5 6 7 8 9 10 11 12 13 14 15
Uni
t Pro
cess
ing
Cos
t ($/
t ore
mill
ed)
Year of Operation
\\Bnefp01\Users$\Greg.Lane\My Documents\Current Projects\Current Studies\Constancia\Ni 43-101 Report Feb 2011\Ni 43-101 Report Rev 0 21 Feb.Doc Rev: 0 Date: 21 February 2011 9999FM0038 – 2
173
18.14.4 General and administration - operating cost estimate
The operating cost for the general and administration area is per the 2009 Technical Report.
The G&A cost estimate covers Labour, Administration and Other Costs required to support site operations.
The Labour cost estimate includes:
Management
Administration
Community relations
Environment and safety
Medical
Security
Accounting
Procurement and logistics
Camp
General and miscellaneous (cleaners, drivers etc).
The Administration cost estimate includes:
Flights (FIFO)
Buses (BIBO)
Camp
Recruitment
Training
Fuel for general administration vehicles and plant.
The “Other Costs” cost estimate includes:
Insurance
Telephone
Couriers/post
Permits, water licences etc.
Legal and other fees
Government charges
Conferences
Director’s fees
Community relations
Road maintenance
HV power line maintenance
Building maintenance (including camp)
\\Bnefp01\Users$\Greg.Lane\My Documents\Current Projects\Current Studies\Constancia\Ni 43-101 Report Feb 2011\Ni 43-101 Report Rev 0 21 Feb.Doc Rev: 0 Date: 21 February 2011 9999FM0038 – 2
174
Vehicle maintenance
Office supplies (corporate and site)
Consultants
Software
Travel expenses (other than FIFO & BIBO).
The overall G&A unit cost for the operation over the life of mine is $0.69/t.
18.14.5 Off-site operating cost estimate
The off-site operating cost basis was per the 2009 Technical Report. Input regarding transport and port charges, smelter costs and penalties (Table 18-24) was supplied by Norsemont.
Table 18-24 Transport and off-site treatment charges
Parameter Unit Cost
Transport - Cu concentrates - truck to port $/wmt conc 32.30
Transport - Mo concentrates - truck to port $/wmt conc 77.57
Port charges concentrate $/wmt conc 7.50
Shipping - Cu concentrates $/wmt conc 35.00
Royalties % of NSR 3.5%
State Royalty % of NSR 1.0% - 3.0%
Minera Livitaca and Katanga % of NSR (capped at $10 M) 0.5%
The off-site operating cost estimate is summarised in Table 18-25 as a build-up from the above costs.
Table 18-25 Off-site operating cost estimate
Cost Area % of Cost $/t Ore c/lb Cu
Smelting Charges 38.5 1.08 13.2
Refining Charges 19.9 0.56 8.8
Penalties 2.0 0.057 0.88
Transport Costs 16.9 0.48 7.5
Shipping (Inl Port Charges) 22.7 0.64 10.0
Total 100 2.82 44
The overall off-site unit cost for the operation over the 16 year life of mine is $2.82/t.
18.14.6 Royalty – cost estimate
The royalty operating cost basis was per the 2009 Technical Report. The royalty is made up of both a State Royalty and the Minera Livitaca and Katanga Royalty. A summary of the royalty operating cost estimate is contained in Table 18-26.
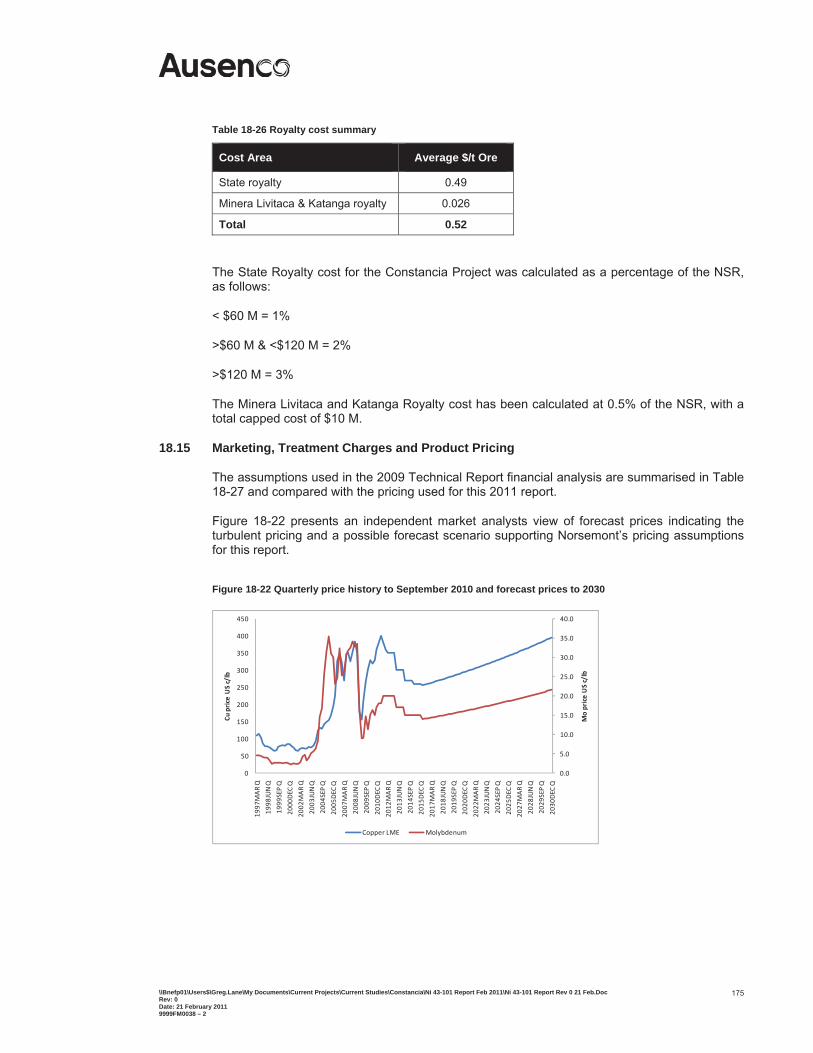
\\Bnefp01\Users$\Greg.Lane\My Documents\Current Projects\Current Studies\Constancia\Ni 43-101 Report Feb 2011\Ni 43-101 Report Rev 0 21 Feb.Doc Rev: 0 Date: 21 February 2011 9999FM0038 – 2
175
Table 18-26 Royalty cost summary
Cost Area Average $/t Ore
State royalty 0.49
Minera Livitaca & Katanga royalty 0.026
Total 0.52
The State Royalty cost for the Constancia Project was calculated as a percentage of the NSR, as follows:
< $60 M = 1%
>$60 M & <$120 M = 2%
>$120 M = 3%
The Minera Livitaca and Katanga Royalty cost has been calculated at 0.5% of the NSR, with a total capped cost of $10 M.
18.15 Marketing, Treatment Charges and Product Pricing
The assumptions used in the 2009 Technical Report financial analysis are summarised in Table 18-27 and compared with the pricing used for this 2011 report.
Figure 18-22 presents an independent market analysts view of forecast prices indicating the turbulent pricing and a possible forecast scenario supporting Norsemont’s pricing assumptions for this report.
Figure 18-22 Quarterly price history to September 2010 and forecast prices to 2030
0.0
5.0
10.0
15.0
20.0
25.0
30.0
35.0
40.0
0
50
100
150
200
250
300
350
400
450
1997
MARQ
1998
JUNQ
1999
SEPQ
2000
DEC
Q
2002
MARQ
2003
JUNQ
2004
SEPQ
2005
DEC
Q
2007
MARQ
2008
JUNQ
2009
SEPQ
2010
DEC
Q
2012
MARQ
2013
JUNQ
2014
SEPQ
2015
DEC
Q
2017
MARQ
2018
JUNQ
2019
SEPQ
2020
DEC
Q
2022
MARQ
2023
JUNQ
2024
SEPQ
2025
DEC
Q
2027
MARQ
2028
JUNQ
2029
SEPQ
2030
DEC
Q
MopriceUSc/lb
CupriceUSc/lb
Copper LME Molybdenum
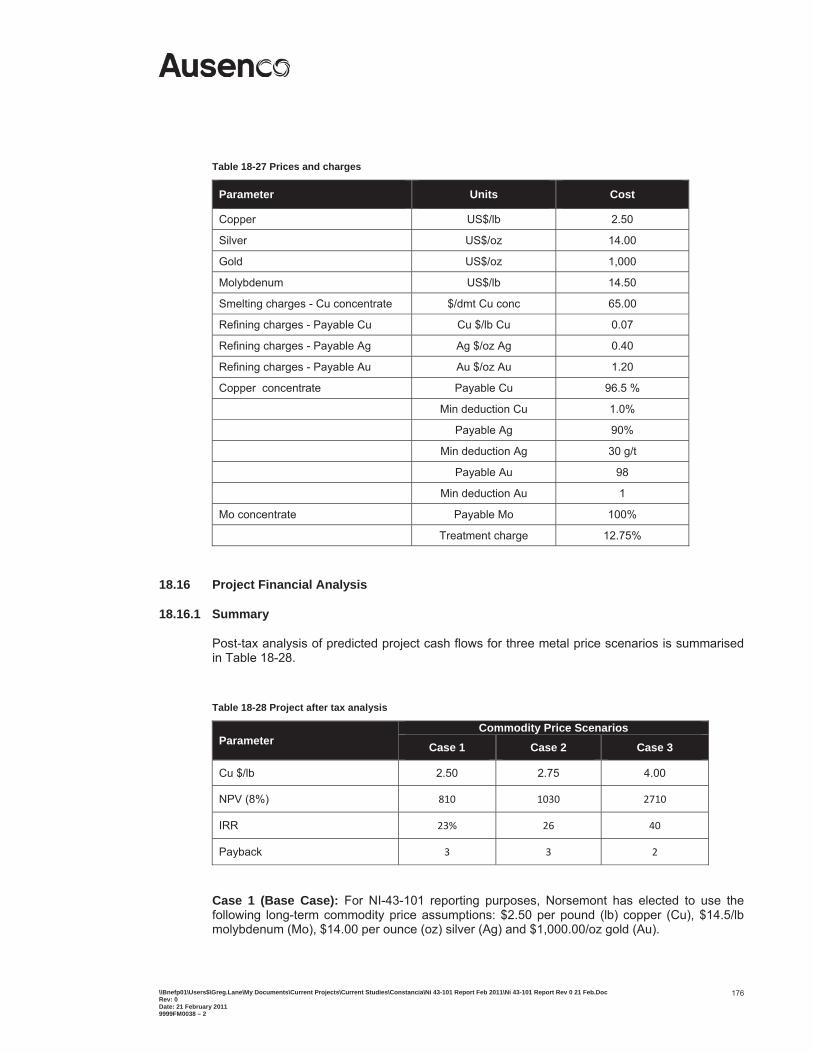
\\Bnefp01\Users$\Greg.Lane\My Documents\Current Projects\Current Studies\Constancia\Ni 43-101 Report Feb 2011\Ni 43-101 Report Rev 0 21 Feb.Doc Rev: 0 Date: 21 February 2011 9999FM0038 – 2
176
Table 18-27 Prices and charges
Parameter Units Cost
Copper US$/lb 2.50
Silver US$/oz 14.00
Gold US$/oz 1,000
Molybdenum US$/lb 14.50
Smelting charges - Cu concentrate $/dmt Cu conc 65.00
Refining charges - Payable Cu Cu $/lb Cu 0.07
Refining charges - Payable Ag Ag $/oz Ag 0.40
Refining charges - Payable Au Au $/oz Au 1.20
Copper concentrate Payable Cu 96.5 %
Min deduction Cu 1.0%
Payable Ag 90%
Min deduction Ag 30 g/t
Payable Au 98
Min deduction Au 1
Mo concentrate Payable Mo 100%
Treatment charge 12.75%
18.16 Project Financial Analysis
18.16.1 Summary
Post-tax analysis of predicted project cash flows for three metal price scenarios is summarised in Table 18-28.
Table 18-28 Project after tax analysis
Parameter Commodity Price Scenarios
Case 1 Case 2 Case 3
Cu $/lb 2.50 2.75 4.00
NPV (8%) 810 1030 2710
IRR 23% 26 40
Payback 3 3 2
Case 1 (Base Case): For NI-43-101 reporting purposes, Norsemont has elected to use the following long-term commodity price assumptions: $2.50 per pound (lb) copper (Cu), $14.5/lb molybdenum (Mo), $14.00 per ounce (oz) silver (Ag) and $1,000.00/oz gold (Au).
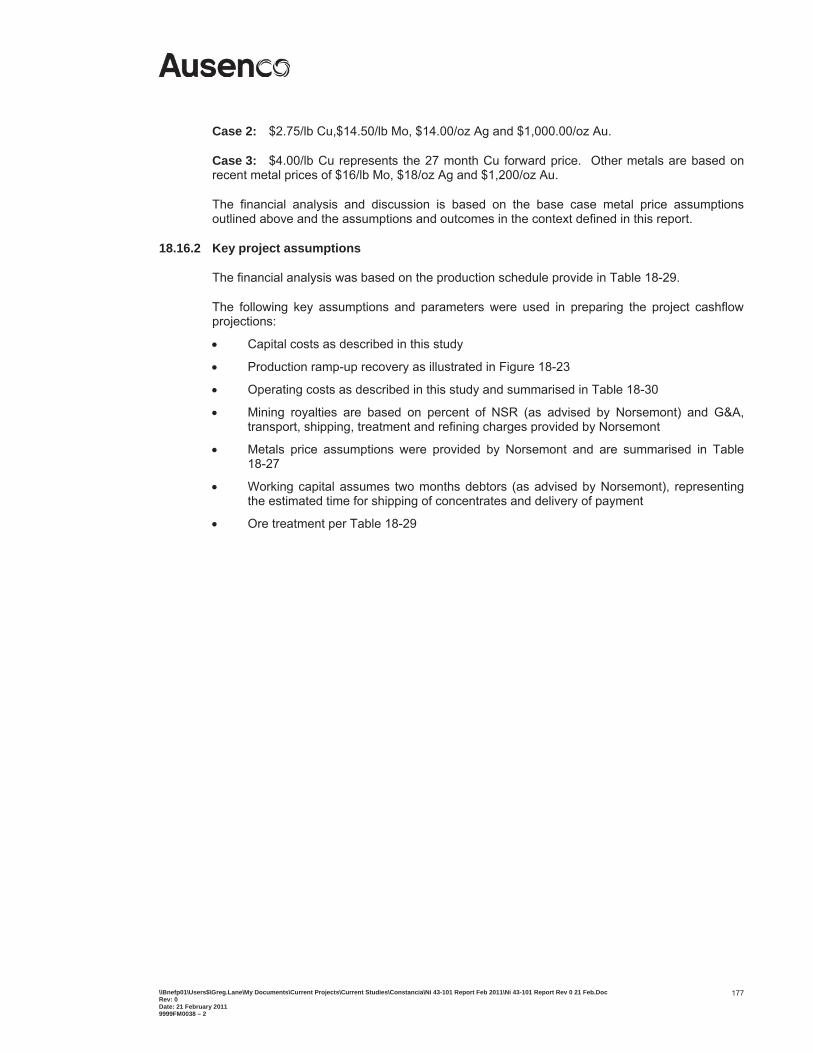
\\Bnefp01\Users$\Greg.Lane\My Documents\Current Projects\Current Studies\Constancia\Ni 43-101 Report Feb 2011\Ni 43-101 Report Rev 0 21 Feb.Doc Rev: 0 Date: 21 February 2011 9999FM0038 – 2
177
Case 2: $2.75/lb Cu,$14.50/lb Mo, $14.00/oz Ag and $1,000.00/oz Au.
Case 3: $4.00/lb Cu represents the 27 month Cu forward price. Other metals are based on recent metal prices of $16/lb Mo, $18/oz Ag and $1,200/oz Au.
The financial analysis and discussion is based on the base case metal price assumptions outlined above and the assumptions and outcomes in the context defined in this report.
18.16.2 Key project assumptions
The financial analysis was based on the production schedule provide in Table 18-29.
The following key assumptions and parameters were used in preparing the project cashflow projections:
Capital costs as described in this study
Production ramp-up recovery as illustrated in Figure 18-23
Operating costs as described in this study and summarised in Table 18-30
Mining royalties are based on percent of NSR (as advised by Norsemont) and G&A, transport, shipping, treatment and refining charges provided by Norsemont
Metals price assumptions were provided by Norsemont and are summarised in Table 18-27
Working capital assumes two months debtors (as advised by Norsemont), representing the estimated time for shipping of concentrates and delivery of payment
Ore treatment per Table 18-29
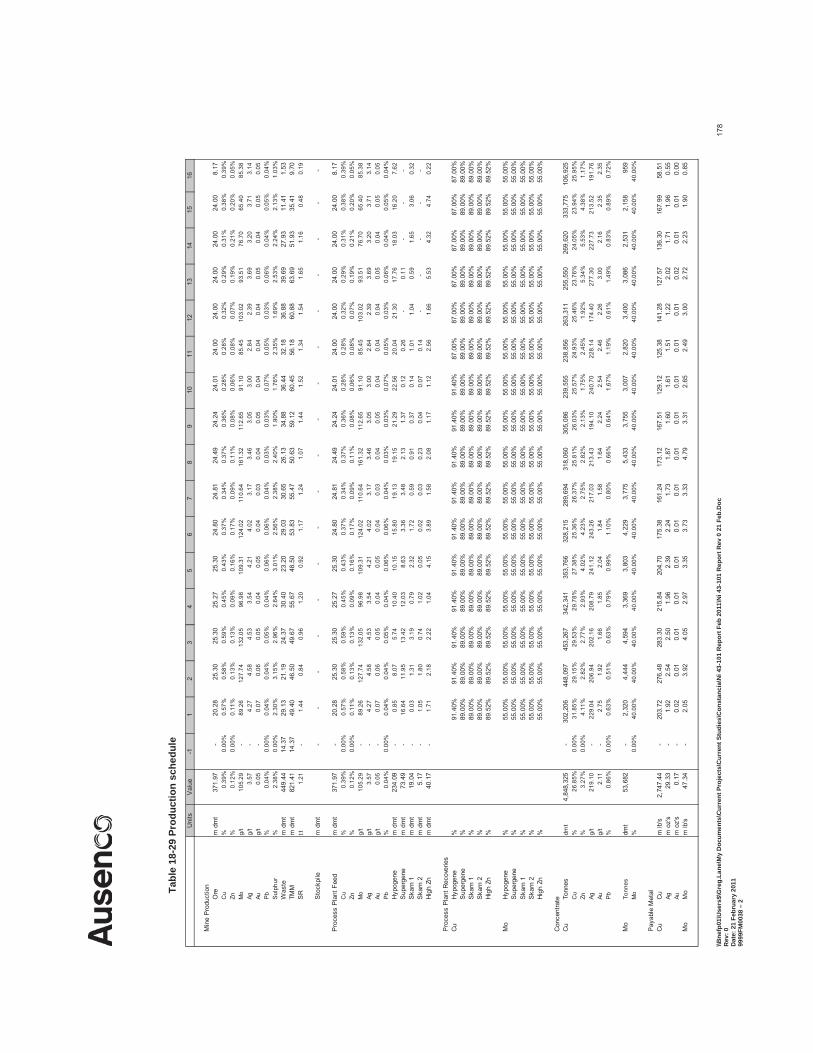
\\Bne
fp01
\Use
rs$\
Gre
g.La
ne\M
y D
ocum
ents
\Cur
rent
Pro
ject
s\C
urre
nt S
tudi
es\C
onst
anci
a\N
i 43-
101
Rep
ort F
eb 2
011\
Ni 4
3-10
1 R
epor
t Rev
0 2
1 Fe
b.D
oc
Rev
: 0
Dat
e: 2
1 Fe
brua
ry 2
011
9999
FM00
38 –
2
178
Tabl
e 18
-29
Prod
uctio
n sc
hedu
le
Uni
tsV
alue
-11
23
45
67
89
1011
1213
1415
16
Min
e P
rodu
ctio
nO
rem
dm
t37
1.97
-
20
.28
25
.30
25
.30
25
.27
25
.30
24
.80
24
.81
24
.49
24
.24
24
.01
24
.00
24
.00
24
.00
24
.00
24
.00
8.
17
Cu
%0.
39%
0.00
%0.
57%
0.58
%0.
59%
0.45
%0.
43%
0.37
%0.
34%
0.37
%0.
36%
0.28
%0.
28%
0.32
%0.
29%
0.31
%0.
38%
0.39
%Zn
%0.
12%
0.00
%0.
11%
0.13
%0.
13%
0.09
%0.
16%
0.17
%0.
09%
0.11
%0.
08%
0.06
%0.
08%
0.07
%0.
19%
0.21
%0.
20%
0.05
%M
og/
t10
5.29
-
89
.26
127.
74
132.
05
96.9
8
10
9.31
12
4.02
11
0.64
16
1.32
11
2.65
91
.10
85.4
5
10
3.02
93
.51
76.7
0
65
.40
85.3
8
Agg/
t3.
57
-
4.
27
4.58
4.53
3.54
4.21
4.02
3.17
3.46
3.05
3.00
2.84
2.39
3.69
3.20
3.71
3.14
Aug/
t0.
05
-
0.
07
0.06
0.05
0.04
0.05
0.04
0.03
0.04
0.05
0.04
0.04
0.04
0.05
0.04
0.05
0.05
Pb
%0.
04%
0.00
%0.
04%
0.04
%0.
05%
0.04
%0.
06%
0.06
%0.
04%
0.03
%0.
03%
0.07
%0.
05%
0.03
%0.
06%
0.04
%0.
05%
0.04
%S
ulph
ur%
2.38
%0.
00%
2.30
%3.
15%
2.96
%2.
64%
3.01
%2.
56%
2.38
%2.
40%
1.90
%1.
76%
2.35
%1.
69%
2.53
%2.
24%
2.13
%1.
03%
Was
tem
dm
t44
9.44
14.3
7
29.1
3
21.1
9
24.3
7
30.4
0
23.2
0
29.0
3
30.6
5
26.1
3
34.8
8
36.4
4
32.1
8
36.8
8
39.6
9
27.9
3
11.4
1
1.53
TM
Mm
dm
t82
1.41
14.3
7
49.4
0
46.5
0
49.6
7
55.6
7
48.5
0
53.8
3
55.4
7
50.6
3
59.1
2
60.4
5
56.1
8
60.8
8
63.6
9
51.9
3
35.4
1
9.70
S
Rt:t
1.21
-
1.44
0.
84
0.
96
1.
20
0.
92
1.
17
1.
24
1.
07
1.
44
1.
52
1.
34
1.
54
1.
65
1.
16
0.
48
0.
19
Sto
ckpi
lem
dm
t-
-
-
-
-
-
-
-
-
-
-
-
-
-
-
-
-
Pro
cess
Pla
nt F
eed
m d
mt
371.
97
-
20.2
8
25.3
0
25.3
0
25.2
7
25.3
0
24.8
0
24.8
1
24.4
9
24.2
4
24.0
1
24.0
0
24.0
0
24.0
0
24.0
0
24.0
0
8.17
C
u%
0.39
%0.
00%
0.57
%0.
58%
0.59
%0.
45%
0.43
%0.
37%
0.34
%0.
37%
0.36
%0.
28%
0.28
%0.
32%
0.29
%0.
31%
0.38
%0.
39%
Zn%
0.12
%0.
00%
0.11
%0.
13%
0.13
%0.
09%
0.16
%0.
17%
0.09
%0.
11%
0.08
%0.
06%
0.08
%0.
07%
0.19
%0.
21%
0.20
%0.
05%
Mo
g/t
105.
29
-
89.2
6
12
7.74
13
2.05
96
.98
109.
31
124.
02
110.
64
161.
32
112.
65
91.1
0
85
.45
103.
02
93.5
1
76
.70
65.4
0
85
.38
Ag
g/t
3.57
-
4.27
4.
58
4.
53
3.
54
4.
21
4.
02
3.
17
3.
46
3.
05
3.
00
2.
84
2.
39
3.
69
3.
20
3.
71
3.
14
Au
g/t
0.05
-
0.07
0.
06
0.
05
0.
04
0.
05
0.
04
0.
03
0.
04
0.
05
0.
04
0.
04
0.
04
0.
05
0.
04
0.
05
0.
05
P
b%
0.04
%0.
00%
0.04
%0.
04%
0.05
%0.
04%
0.06
%0.
06%
0.04
%0.
03%
0.03
%0.
07%
0.05
%0.
03%
0.06
%0.
04%
0.05
%0.
04%
Hyp
ogen
em
dm
t23
4.09
-
0.85
8.
07
5.
74
10
.40
10.1
5
15
.80
19.1
3
19
.15
21.2
9
22
.56
20.0
4
21
.30
17.7
6
18
.03
16.2
0
7.
62
S
uper
gene
m d
mt
73.4
9
-
16.6
4
11
.95
13.4
2
12
.03
8.63
3.36
3.48
2.13
1.37
0.12
0.26
-
0.11
-
-
-
S
karn
1m
dm
t19
.04
-
0.
03
1.31
3.19
0.79
2.32
1.72
0.59
0.91
0.37
0.14
1.01
1.04
0.59
1.65
3.06
0.32
Ska
rn 2
m d
mt
5.17
-
1.
05
1.80
0.74
1.02
0.05
0.02
0.03
0.23
0.04
0.07
0.14
-
-
-
-
-
H
igh
Znm
dm
t40
.17
-
1.
71
2.18
2.22
1.04
4.15
3.89
1.58
2.08
1.17
1.12
2.56
1.66
5.53
4.32
4.74
0.22
Pro
cess
Pla
nt R
ecov
erie
sC
uH
ypog
ene
%91
.40%
91.4
0%91
.40%
91.4
0%91
.40%
91.4
0%91
.40%
91.4
0%91
.40%
91.4
0%87
.00%
87.0
0%87
.00%
87.0
0%87
.00%
87.0
0%S
uper
gene
%89
.00%
89.0
0%89
.00%
89.0
0%89
.00%
89.0
0%89
.00%
89.0
0%89
.00%
89.0
0%89
.00%
89.0
0%89
.00%
89.0
0%89
.00%
89.0
0%S
karn
1%
89.0
0%89
.00%
89.0
0%89
.00%
89.0
0%89
.00%
89.0
0%89
.00%
89.0
0%89
.00%
89.0
0%89
.00%
89.0
0%89
.00%
89.0
0%89
.00%
Ska
rn 2
%89
.00%
89.0
0%89
.00%
89.0
0%89
.00%
89.0
0%89
.00%
89.0
0%89
.00%
89.0
0%89
.00%
89.0
0%89
.00%
89.0
0%89
.00%
89.0
0%H
igh
Zn%
89.5
2%89
.52%
89.5
2%89
.52%
89.5
2%89
.52%
89.5
2%89
.52%
89.5
2%89
.52%
89.5
2%89
.52%
89.5
2%89
.52%
89.5
2%89
.52%
Mo
Hyp
ogen
e%
55.0
0%55
.00%
55.0
0%55
.00%
55.0
0%55
.00%
55.0
0%55
.00%
55.0
0%55
.00%
55.0
0%55
.00%
55.0
0%55
.00%
55.0
0%55
.00%
Sup
erge
ne%
55.0
0%55
.00%
55.0
0%55
.00%
55.0
0%55
.00%
55.0
0%55
.00%
55.0
0%55
.00%
55.0
0%55
.00%
55.0
0%55
.00%
55.0
0%55
.00%
Ska
rn 1
%55
.00%
55.0
0%55
.00%
55.0
0%55
.00%
55.0
0%55
.00%
55.0
0%55
.00%
55.0
0%55
.00%
55.0
0%55
.00%
55.0
0%55
.00%
55.0
0%S
karn
2%
55.0
0%55
.00%
55.0
0%55
.00%
55.0
0%55
.00%
55.0
0%55
.00%
55.0
0%55
.00%
55.0
0%55
.00%
55.0
0%55
.00%
55.0
0%55
.00%
Hig
h Zn
%55
.00%
55.0
0%55
.00%
55.0
0%55
.00%
55.0
0%55
.00%
55.0
0%55
.00%
55.0
0%55
.00%
55.0
0%55
.00%
55.0
0%55
.00%
55.0
0%
Con
cent
rate
Cu
Tonn
esdm
t4,
848,
325
-
302,
206
448,
097
453,
267
342,
341
353,
766
328,
215
289,
694
318,
060
305,
086
239,
555
238,
856
263,
311
255,
550
269,
620
333,
775
106,
925
C
u%
26.8
5%0.
00%
31.8
5%29
.15%
29.5
3%29
.78%
27.3
8%25
.36%
26.3
7%25
.81%
26.0
3%25
.57%
24.9
3%25
.46%
23.7
6%24
.05%
23.9
4%25
.95%
Zn%
3.27
%0.
00%
4.11
%2.
82%
2.77
%2.
93%
4.02
%4.
23%
2.75
%2.
82%
2.13
%1.
75%
2.45
%1.
92%
5.34
%5.
53%
4.38
%1.
17%
Agg/
t21
9.10
-
22
9.04
20
6.94
20
2.16
20
8.79
24
1.12
24
3.26
21
7.03
21
3.43
19
4.10
24
0.70
22
8.14
17
4.40
27
7.30
22
7.73
21
3.52
19
1.76
Aug/
t2.
11
-
2.
75
1.92
1.66
1.85
2.04
1.84
1.58
1.64
2.24
2.54
2.46
2.26
3.00
2.16
2.35
2.35
Pb
%0.
86%
0.00
%0.
63%
0.51
%0.
63%
0.79
%0.
99%
1.10
%0.
80%
0.66
%0.
64%
1.67
%1.
19%
0.61
%1.
49%
0.83
%0.
89%
0.72
%
Mo
Tonn
esdm
t53
,682
-
2,
320
4,
444
4,
594
3,
369
3,
803
4,
229
3,
775
5,
433
3,
755
3,
007
2,
820
3,
400
3,
086
2,
531
2,
158
95
9
Mo
%0.
00%
40.0
0%40
.00%
40.0
0%40
.00%
40.0
0%40
.00%
40.0
0%40
.00%
40.0
0%40
.00%
40.0
0%40
.00%
40.0
0%40
.00%
40.0
0%40
.00%
Pay
able
Met
alC
uC
um
lb's
2,74
7.44
-
203.
72
27
6.48
283.
30
21
5.84
204.
70
17
5.38
161.
24
17
3.12
167.
51
12
9.12
125.
38
14
1.28
127.
57
13
6.30
167.
99
58
.51
Agm
oz'
s29
.33
-
1.92
2.
54
2.50
1.
96
2.39
2.
24
1.73
1.
87
1.60
1.
61
1.51
1.
22
2.02
1.
71
1.96
0.
55
Aum
oz'
s0.
17
-
0.
02
0.01
0.
01
0.01
0.
01
0.01
0.
01
0.01
0.
01
0.01
0.
01
0.01
0.
02
0.01
0.
01
0.00
M
oM
om
lb's
47.3
4
-
2.
05
3.92
4.
05
2.97
3.
35
3.73
3.
33
4.79
3.
31
2.65
2.
49
3.00
2.
72
2.23
1.
90
0.85
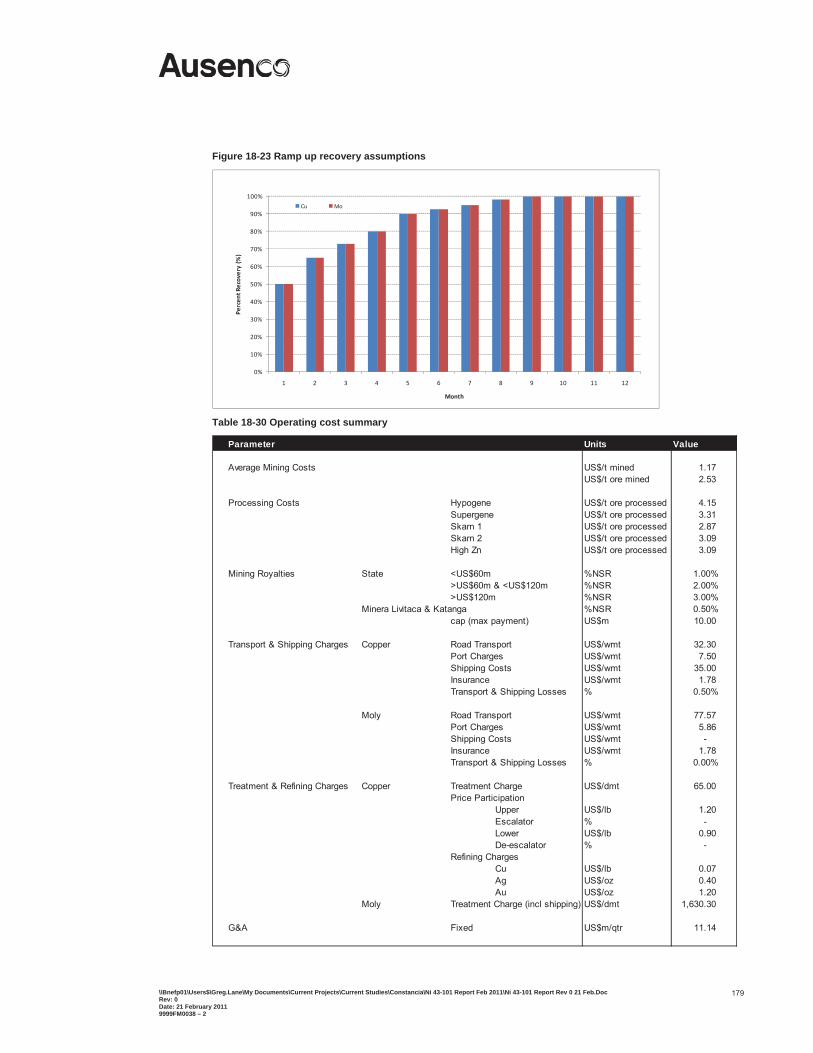
\\Bnefp01\Users$\Greg.Lane\My Documents\Current Projects\Current Studies\Constancia\Ni 43-101 Report Feb 2011\Ni 43-101 Report Rev 0 21 Feb.Doc Rev: 0 Date: 21 February 2011 9999FM0038 – 2
179
Figure 18-23 Ramp up recovery assumptions
0%
10%
20%
30%
40%
50%
60%
70%
80%
90%
100%
1 2 3 4 5 6 7 8 9 10 11 12
Percen
tRecovery(%
)
Month
Cu Mo
Table 18-30 Operating cost summary
Parameter
Average Mining Costs US$/t mined 1.17 US$/t ore mined 2.53
Processing Costs Hypogene US$/t ore processed 4.15 Supergene US$/t ore processed 3.31 Skarn 1 US$/t ore processed 2.87 Skarn 2 US$/t ore processed 3.09 High Zn US$/t ore processed 3.09
Mining Royalties State <US$60m %NSR 1.00%>US$60m & <US$120m %NSR 2.00%>US$120m %NSR 3.00%
Minera Livitaca & Katanga %NSR 0.50%cap (max payment) US$m 10.00
Transport & Shipping Charges Copper Road Transport US$/wmt 32.30 Port Charges US$/wmt 7.50 Shipping Costs US$/wmt 35.00 Insurance US$/wmt 1.78 Transport & Shipping Losses % 0.50%
Moly Road Transport US$/wmt 77.57 Port Charges US$/wmt 5.86 Shipping Costs US$/wmt - Insurance US$/wmt 1.78 Transport & Shipping Losses % 0.00%
Treatment & Refining Charges Copper Treatment Charge US$/dmt 65.00 Price Participation
Upper US$/lb 1.20 Escalator % - Lower US$/lb 0.90 De-escalator % -
Refining ChargesCu US$/lb 0.07 Ag US$/oz 0.40 Au US$/oz 1.20
Moly Treatment Charge (incl shipping) US$/dmt 1,630.30
G&A Fixed US$m/qtr 11.14
Units Value
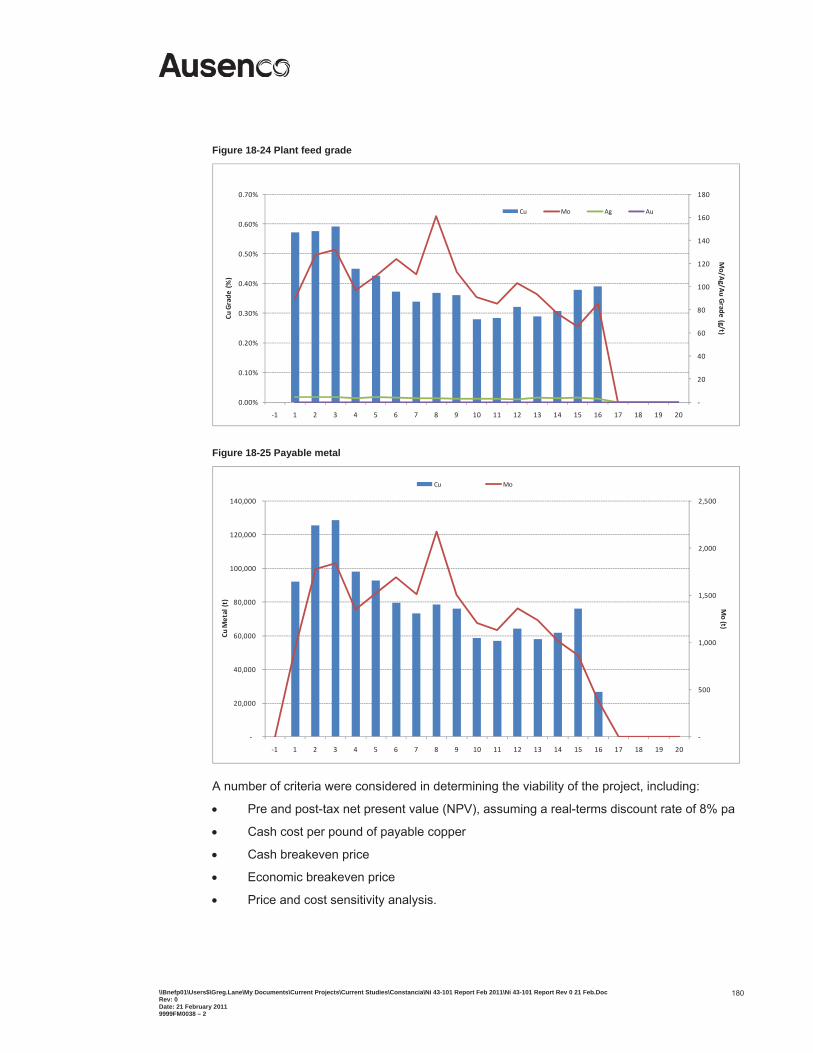
\\Bnefp01\Users$\Greg.Lane\My Documents\Current Projects\Current Studies\Constancia\Ni 43-101 Report Feb 2011\Ni 43-101 Report Rev 0 21 Feb.Doc Rev: 0 Date: 21 February 2011 9999FM0038 – 2
180
Figure 18-24 Plant feed grade
20
40
60
80
100
120
140
160
180
0.00%
0.10%
0.20%
0.30%
0.40%
0.50%
0.60%
0.70%
1 1 2 3 4 5 6 7 8 9 10 11 12 13 14 15 16 17 18 19 20
Mo/A
g/AuGrade
(g/t)
CuGrade
(%)
Cu Mo Ag Au
Figure 18-25 Payable metal
500
1,000
1,500
2,000
2,500
20,000
40,000
60,000
80,000
100,000
120,000
140,000
1 1 2 3 4 5 6 7 8 9 10 11 12 13 14 15 16 17 18 19 20
Mo(t)
CuMetal(t)
Cu Mo
A number of criteria were considered in determining the viability of the project, including:
Pre and post-tax net present value (NPV), assuming a real-terms discount rate of 8% pa
Cash cost per pound of payable copper
Cash breakeven price
Economic breakeven price
Price and cost sensitivity analysis.
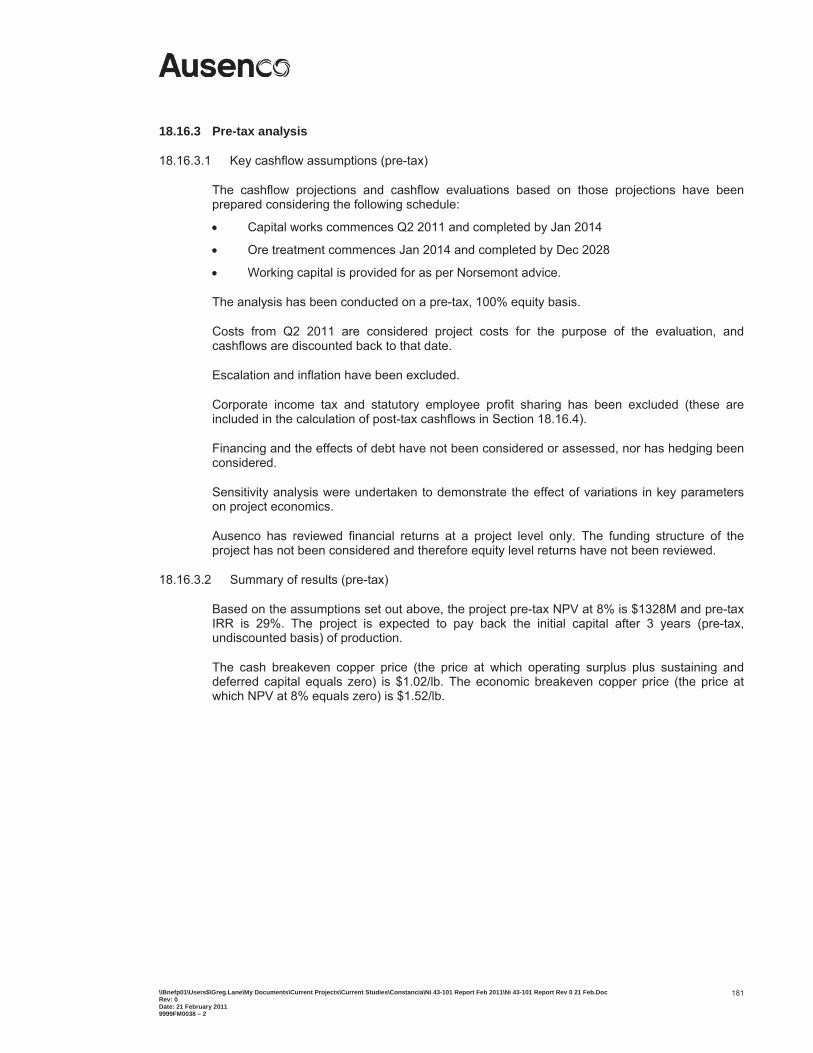
\\Bnefp01\Users$\Greg.Lane\My Documents\Current Projects\Current Studies\Constancia\Ni 43-101 Report Feb 2011\Ni 43-101 Report Rev 0 21 Feb.Doc Rev: 0 Date: 21 February 2011 9999FM0038 – 2
181
18.16.3 Pre-tax analysis
18.16.3.1 Key cashflow assumptions (pre-tax)
The cashflow projections and cashflow evaluations based on those projections have been prepared considering the following schedule:
Capital works commences Q2 2011 and completed by Jan 2014
Ore treatment commences Jan 2014 and completed by Dec 2028
Working capital is provided for as per Norsemont advice.
The analysis has been conducted on a pre-tax, 100% equity basis.
Costs from Q2 2011 are considered project costs for the purpose of the evaluation, and cashflows are discounted back to that date.
Escalation and inflation have been excluded.
Corporate income tax and statutory employee profit sharing has been excluded (these are included in the calculation of post-tax cashflows in Section 18.16.4).
Financing and the effects of debt have not been considered or assessed, nor has hedging been considered.
Sensitivity analysis were undertaken to demonstrate the effect of variations in key parameters on project economics.
Ausenco has reviewed financial returns at a project level only. The funding structure of the project has not been considered and therefore equity level returns have not been reviewed.
18.16.3.2 Summary of results (pre-tax)
Based on the assumptions set out above, the project pre-tax NPV at 8% is $1328M and pre-tax IRR is 29%. The project is expected to pay back the initial capital after 3 years (pre-tax, undiscounted basis) of production.
The cash breakeven copper price (the price at which operating surplus plus sustaining and deferred capital equals zero) is $1.02/lb. The economic breakeven copper price (the price at which NPV at 8% equals zero) is $1.52/lb.
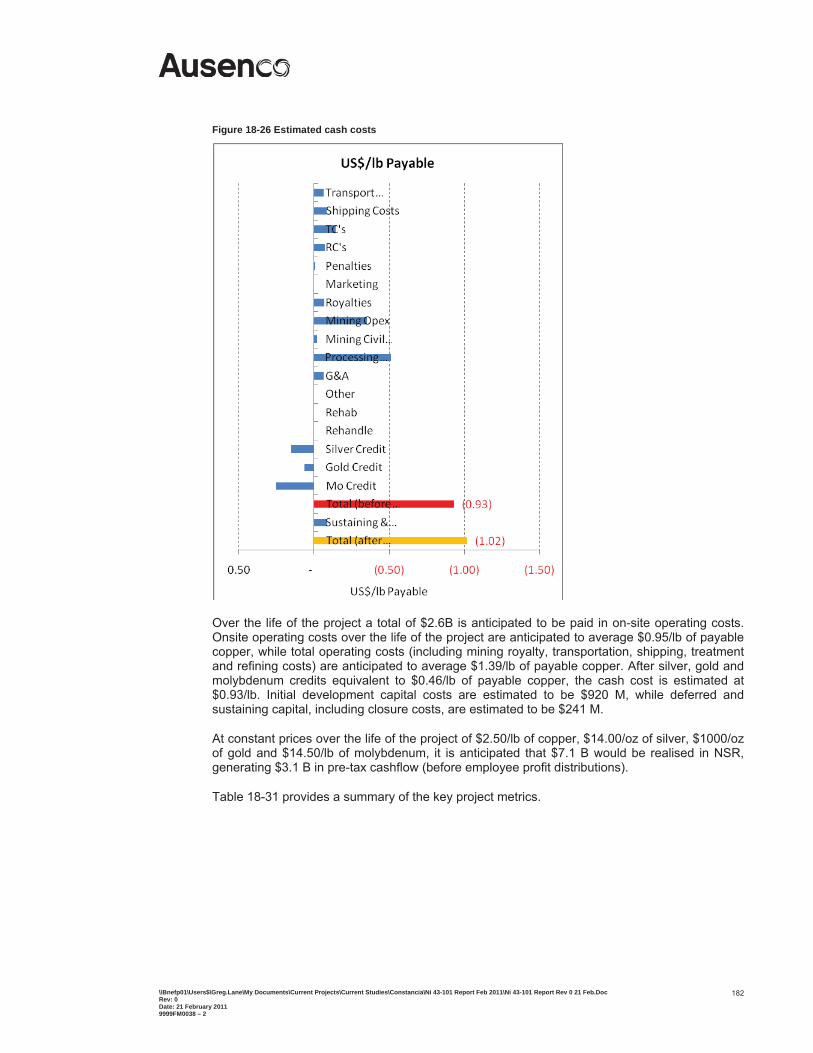
\\Bnefp01\Users$\Greg.Lane\My Documents\Current Projects\Current Studies\Constancia\Ni 43-101 Report Feb 2011\Ni 43-101 Report Rev 0 21 Feb.Doc Rev: 0 Date: 21 February 2011 9999FM0038 – 2
182
Figure 18-26 Estimated cash costs
Over the life of the project a total of $2.6B is anticipated to be paid in on-site operating costs. Onsite operating costs over the life of the project are anticipated to average $0.95/lb of payable copper, while total operating costs (including mining royalty, transportation, shipping, treatment and refining costs) are anticipated to average $1.39/lb of payable copper. After silver, gold and molybdenum credits equivalent to $0.46/lb of payable copper, the cash cost is estimated at $0.93/lb. Initial development capital costs are estimated to be $920 M, while deferred and sustaining capital, including closure costs, are estimated to be $241 M.
At constant prices over the life of the project of $2.50/lb of copper, $14.00/oz of silver, $1000/oz of gold and $14.50/lb of molybdenum, it is anticipated that $7.1 B would be realised in NSR, generating $3.1 B in pre-tax cashflow (before employee profit distributions).
Table 18-31 provides a summary of the key project metrics.
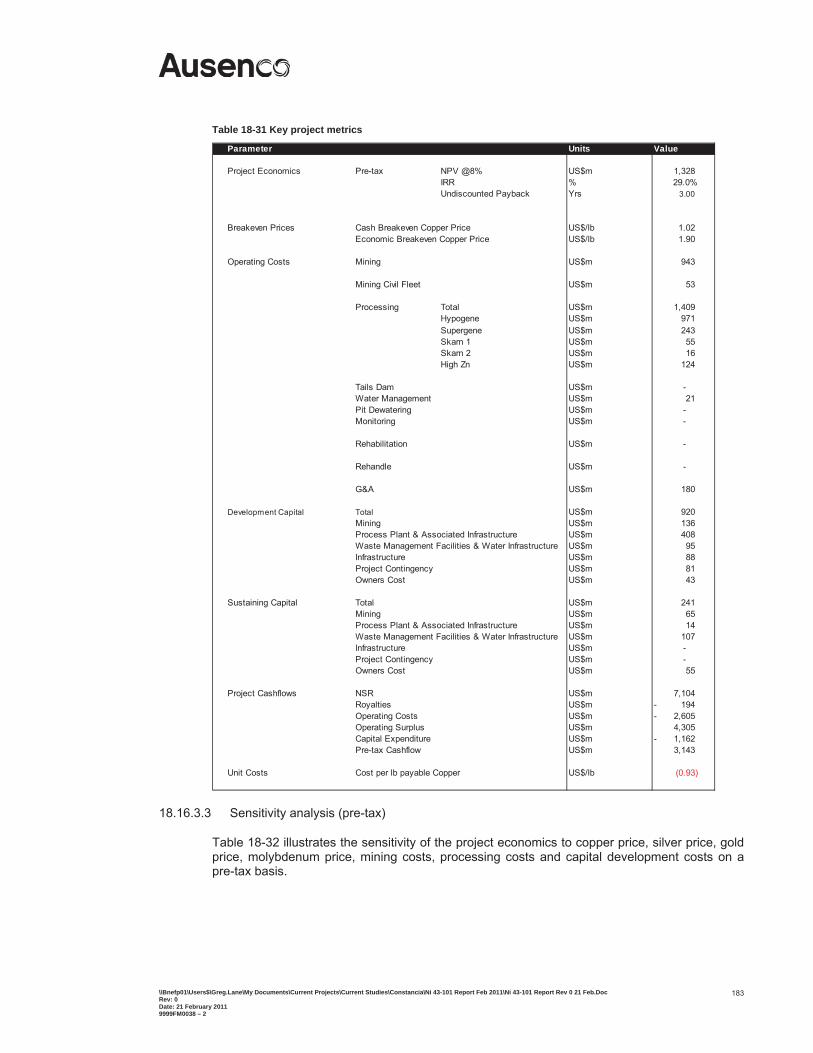
\\Bnefp01\Users$\Greg.Lane\My Documents\Current Projects\Current Studies\Constancia\Ni 43-101 Report Feb 2011\Ni 43-101 Report Rev 0 21 Feb.Doc Rev: 0 Date: 21 February 2011 9999FM0038 – 2
183
Table 18-31 Key project metrics
Parameter
Project Economics Pre-tax NPV @8% US$m 1,328 IRR % 29.0%Undiscounted Payback Yrs 3.00
Breakeven Prices Cash Breakeven Copper Price US$/lb 1.02 Economic Breakeven Copper Price US$/lb 1.90
Operating Costs Mining US$m 943
Mining Civil Fleet US$m 53
Processing Total US$m 1,409 Hypogene US$m 971 Supergene US$m 243 Skarn 1 US$m 55 Skarn 2 US$m 16 High Zn US$m 124
Tails Dam US$m - Water Management US$m 21 Pit Dewatering US$m - Monitoring US$m -
Rehabilitation US$m -
Rehandle US$m -
G&A US$m 180
Development Capital Total US$m 920 Mining US$m 136 Process Plant & Associated Infrastructure US$m 408 Waste Management Facilities & Water Infrastructure US$m 95 Infrastructure US$m 88 Project Contingency US$m 81 Owners Cost US$m 43
Sustaining Capital Total US$m 241 Mining US$m 65 Process Plant & Associated Infrastructure US$m 14 Waste Management Facilities & Water Infrastructure US$m 107 Infrastructure US$m - Project Contingency US$m - Owners Cost US$m 55
Project Cashflows NSR US$m 7,104 Royalties US$m 194- Operating Costs US$m 2,605- Operating Surplus US$m 4,305 Capital Expenditure US$m 1,162- Pre-tax Cashflow US$m 3,143
Unit Costs Cost per lb payable Copper US$/lb (0.93)
Units Value
18.16.3.3 Sensitivity analysis (pre-tax)
Table 18-32 illustrates the sensitivity of the project economics to copper price, silver price, gold price, molybdenum price, mining costs, processing costs and capital development costs on a pre-tax basis.
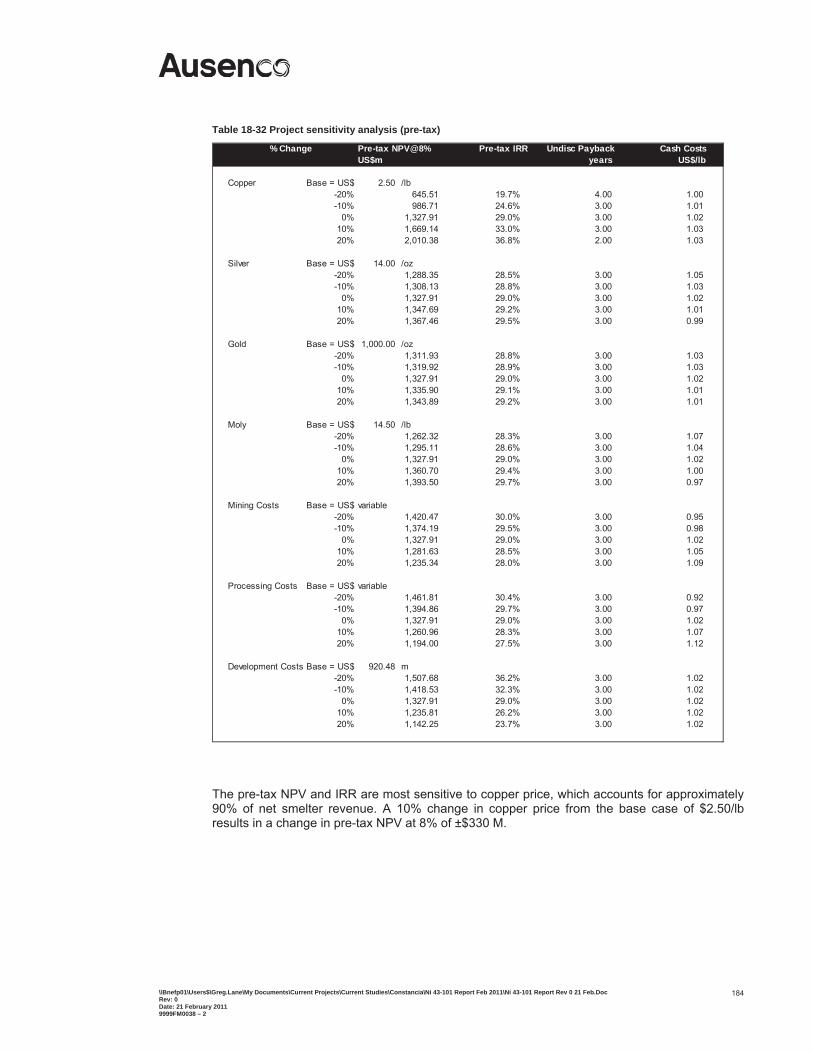
\\Bnefp01\Users$\Greg.Lane\My Documents\Current Projects\Current Studies\Constancia\Ni 43-101 Report Feb 2011\Ni 43-101 Report Rev 0 21 Feb.Doc Rev: 0 Date: 21 February 2011 9999FM0038 – 2
184
Table 18-32 Project sensitivity analysis (pre-tax)
% Change
Copper Base = US$ 2.50 /lb-20% 645.51 19.7% 4.00 1.00 -10% 986.71 24.6% 3.00 1.01
0% 1,327.91 29.0% 3.00 1.02 10% 1,669.14 33.0% 3.00 1.03 20% 2,010.38 36.8% 2.00 1.03
Silver Base = US$ 14.00 /oz-20% 1,288.35 28.5% 3.00 1.05 -10% 1,308.13 28.8% 3.00 1.03
0% 1,327.91 29.0% 3.00 1.02 10% 1,347.69 29.2% 3.00 1.01 20% 1,367.46 29.5% 3.00 0.99
Gold Base = US$ 1,000.00 /oz-20% 1,311.93 28.8% 3.00 1.03 -10% 1,319.92 28.9% 3.00 1.03
0% 1,327.91 29.0% 3.00 1.02 10% 1,335.90 29.1% 3.00 1.01 20% 1,343.89 29.2% 3.00 1.01
Moly Base = US$ 14.50 /lb-20% 1,262.32 28.3% 3.00 1.07 -10% 1,295.11 28.6% 3.00 1.04
0% 1,327.91 29.0% 3.00 1.02 10% 1,360.70 29.4% 3.00 1.00 20% 1,393.50 29.7% 3.00 0.97
Mining Costs Base = US$ variable-20% 1,420.47 30.0% 3.00 0.95 -10% 1,374.19 29.5% 3.00 0.98
0% 1,327.91 29.0% 3.00 1.02 10% 1,281.63 28.5% 3.00 1.05 20% 1,235.34 28.0% 3.00 1.09
Processing Costs Base = US$ variable-20% 1,461.81 30.4% 3.00 0.92 -10% 1,394.86 29.7% 3.00 0.97
0% 1,327.91 29.0% 3.00 1.02 10% 1,260.96 28.3% 3.00 1.07 20% 1,194.00 27.5% 3.00 1.12
Development Costs Base = US$ 920.48 m-20% 1,507.68 36.2% 3.00 1.02 -10% 1,418.53 32.3% 3.00 1.02
0% 1,327.91 29.0% 3.00 1.02 10% 1,235.81 26.2% 3.00 1.02 20% 1,142.25 23.7% 3.00 1.02
Pre-tax NPV@8% Pre-tax IRRUS$m years
Undisc Payback Cash CostsUS$/lb
The pre-tax NPV and IRR are most sensitive to copper price, which accounts for approximately 90% of net smelter revenue. A 10% change in copper price from the base case of $2.50/lb results in a change in pre-tax NPV at 8% of ±$330 M.
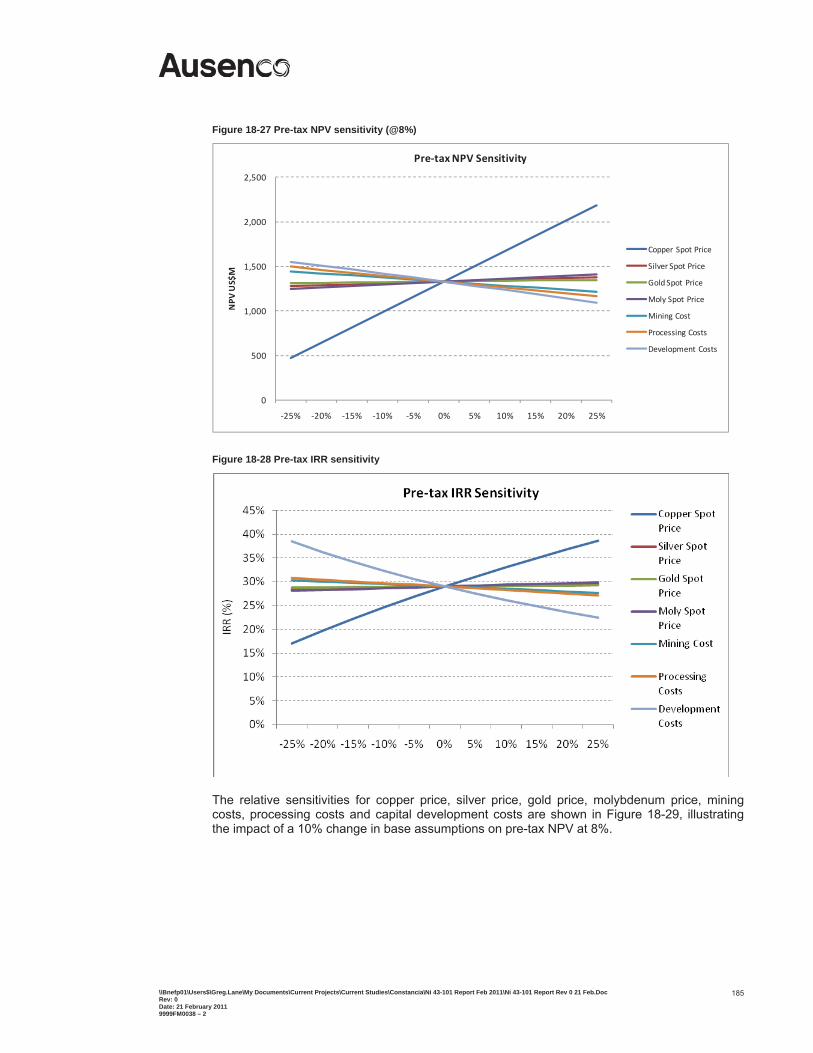
\\Bnefp01\Users$\Greg.Lane\My Documents\Current Projects\Current Studies\Constancia\Ni 43-101 Report Feb 2011\Ni 43-101 Report Rev 0 21 Feb.Doc Rev: 0 Date: 21 February 2011 9999FM0038 – 2
185
Figure 18-27 Pre-tax NPV sensitivity (@8%)
0
500
1,000
1,500
2,000
2,500
25% 20% 15% 10% 5% 0% 5% 10% 15% 20% 25%
NPV
US$M
Pre taxNPV Sensitivity
Copper Spot Price
Silver Spot Price
Gold Spot Price
Moly Spot Price
Mining Cost
Processing Costs
Development Costs
Figure 18-28 Pre-tax IRR sensitivity
The relative sensitivities for copper price, silver price, gold price, molybdenum price, mining costs, processing costs and capital development costs are shown in Figure 18-29, illustrating the impact of a 10% change in base assumptions on pre-tax NPV at 8%.
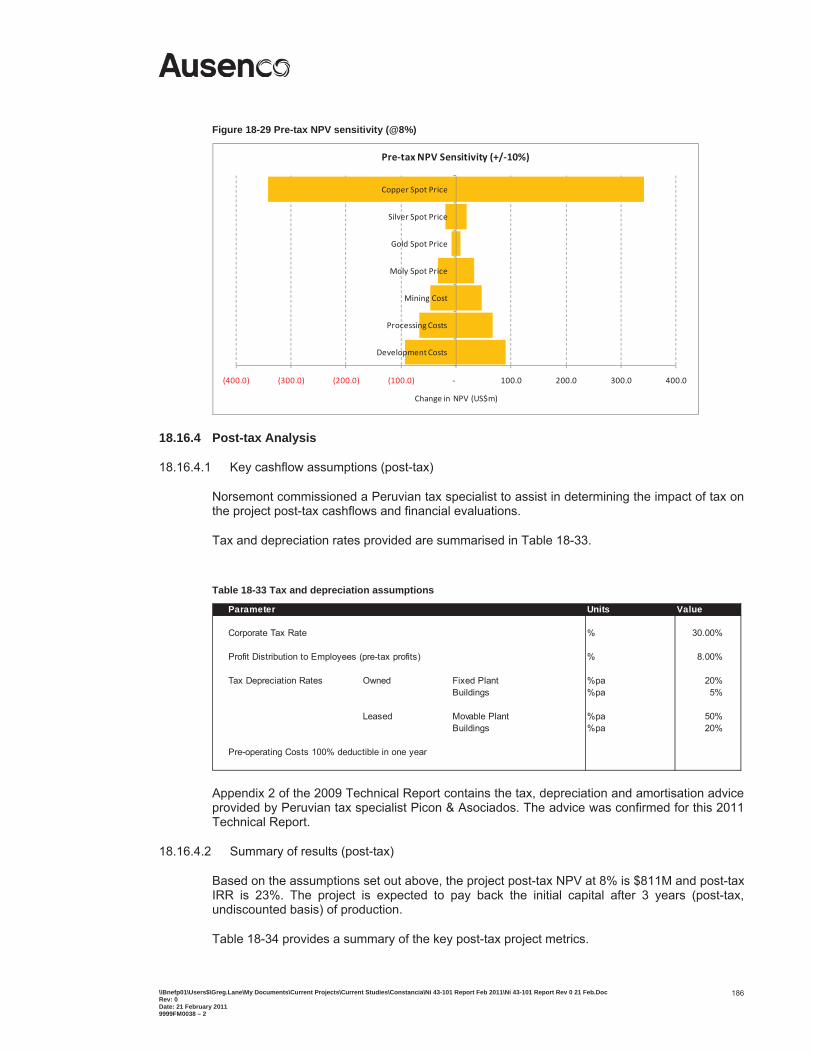
\\Bnefp01\Users$\Greg.Lane\My Documents\Current Projects\Current Studies\Constancia\Ni 43-101 Report Feb 2011\Ni 43-101 Report Rev 0 21 Feb.Doc Rev: 0 Date: 21 February 2011 9999FM0038 – 2
186
Figure 18-29 Pre-tax NPV sensitivity (@8%)
(400.0) (300.0) (200.0) (100.0) 100.0 200.0 300.0 400.0
Copper Spot Price
Silver Spot Price
Gold Spot Price
Moly Spot Price
Mining Cost
ProcessingCosts
DevelopmentCosts
Change in NPV (US$m)
Pre tax NPV Sensitivity (+/ 10%)
18.16.4 Post-tax Analysis
18.16.4.1 Key cashflow assumptions (post-tax)
Norsemont commissioned a Peruvian tax specialist to assist in determining the impact of tax on the project post-tax cashflows and financial evaluations.
Tax and depreciation rates provided are summarised in Table 18-33.
Table 18-33 Tax and depreciation assumptions
Parameter
Corporate Tax Rate % 30.00%
Profit Distribution to Employees (pre-tax profits) % 8.00%
Tax Depreciation Rates Owned Fixed Plant %pa 20%Buildings %pa 5%
Leased Movable Plant %pa 50%Buildings %pa 20%
Pre-operating Costs 100% deductible in one year
ValueUnits
Appendix 2 of the 2009 Technical Report contains the tax, depreciation and amortisation advice provided by Peruvian tax specialist Picon & Asociados. The advice was confirmed for this 2011 Technical Report.
18.16.4.2 Summary of results (post-tax)
Based on the assumptions set out above, the project post-tax NPV at 8% is $811M and post-tax IRR is 23%. The project is expected to pay back the initial capital after 3 years (post-tax, undiscounted basis) of production.
Table 18-34 provides a summary of the key post-tax project metrics.
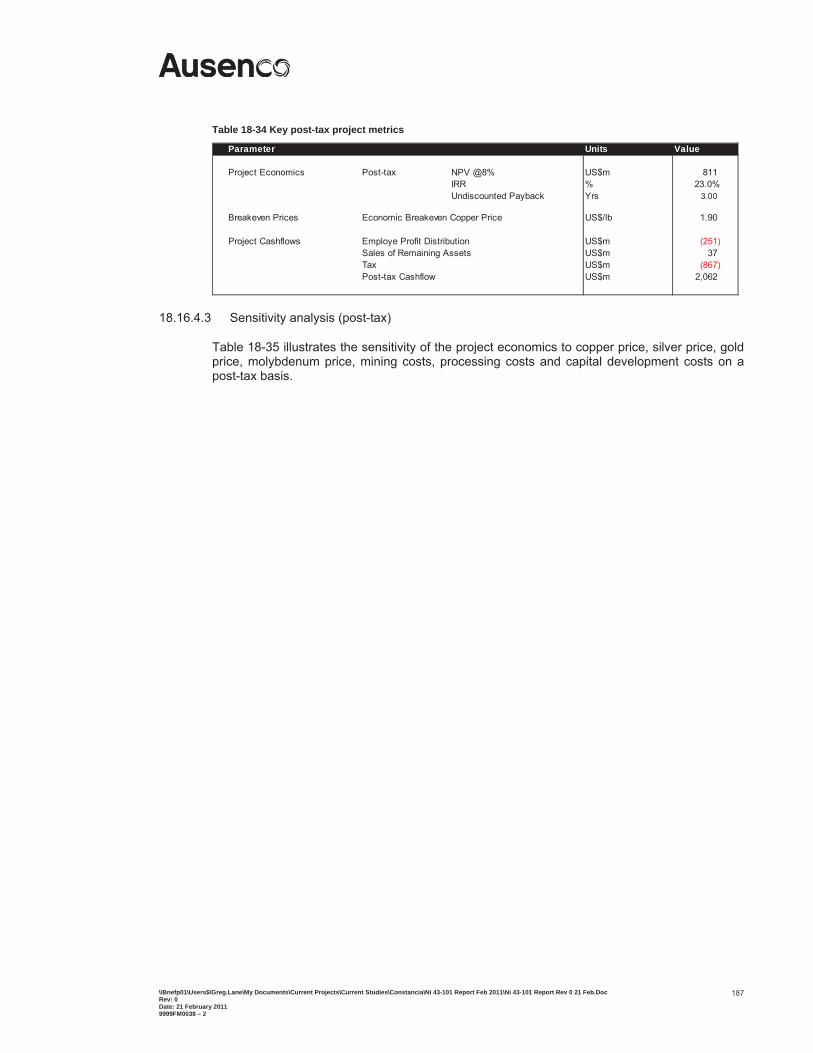
\\Bnefp01\Users$\Greg.Lane\My Documents\Current Projects\Current Studies\Constancia\Ni 43-101 Report Feb 2011\Ni 43-101 Report Rev 0 21 Feb.Doc Rev: 0 Date: 21 February 2011 9999FM0038 – 2
187
Table 18-34 Key post-tax project metrics
Parameter
Project Economics Post-tax NPV @8% US$m 811 IRR % 23.0%Undiscounted Payback Yrs 3.00
Breakeven Prices Economic Breakeven Copper Price US$/lb 1.90
Project Cashflows Employe Profit Distribution US$m (251)Sales of Remaining Assets US$m 37 Tax US$m (867)Post-tax Cashflow US$m 2,062
ValueUnits
18.16.4.3 Sensitivity analysis (post-tax)
Table 18-35 illustrates the sensitivity of the project economics to copper price, silver price, gold price, molybdenum price, mining costs, processing costs and capital development costs on a post-tax basis.
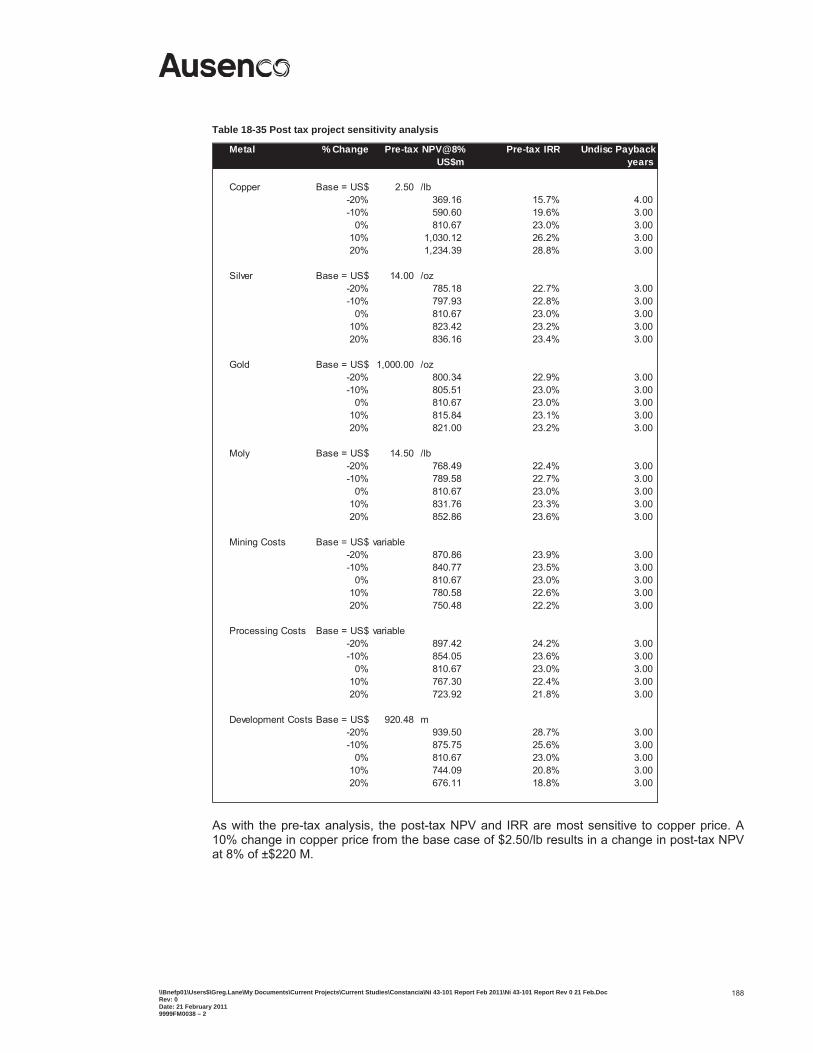
\\Bnefp01\Users$\Greg.Lane\My Documents\Current Projects\Current Studies\Constancia\Ni 43-101 Report Feb 2011\Ni 43-101 Report Rev 0 21 Feb.Doc Rev: 0 Date: 21 February 2011 9999FM0038 – 2
188
Table 18-35 Post tax project sensitivity analysis
Metal % Change
Copper Base = US$ 2.50 /lb-20% 369.16 15.7% 4.00 -10% 590.60 19.6% 3.00
0% 810.67 23.0% 3.00 10% 1,030.12 26.2% 3.00 20% 1,234.39 28.8% 3.00
Silver Base = US$ 14.00 /oz-20% 785.18 22.7% 3.00 -10% 797.93 22.8% 3.00
0% 810.67 23.0% 3.00 10% 823.42 23.2% 3.00 20% 836.16 23.4% 3.00
Gold Base = US$ 1,000.00 /oz-20% 800.34 22.9% 3.00 -10% 805.51 23.0% 3.00
0% 810.67 23.0% 3.00 10% 815.84 23.1% 3.00 20% 821.00 23.2% 3.00
Moly Base = US$ 14.50 /lb-20% 768.49 22.4% 3.00 -10% 789.58 22.7% 3.00
0% 810.67 23.0% 3.00 10% 831.76 23.3% 3.00 20% 852.86 23.6% 3.00
Mining Costs Base = US$ variable-20% 870.86 23.9% 3.00 -10% 840.77 23.5% 3.00
0% 810.67 23.0% 3.00 10% 780.58 22.6% 3.00 20% 750.48 22.2% 3.00
Processing Costs Base = US$ variable-20% 897.42 24.2% 3.00 -10% 854.05 23.6% 3.00
0% 810.67 23.0% 3.00 10% 767.30 22.4% 3.00 20% 723.92 21.8% 3.00
Development Costs Base = US$ 920.48 m-20% 939.50 28.7% 3.00 -10% 875.75 25.6% 3.00
0% 810.67 23.0% 3.00 10% 744.09 20.8% 3.00 20% 676.11 18.8% 3.00
Undisc PaybackUS$m years
Pre-tax IRRPre-tax NPV@8%
As with the pre-tax analysis, the post-tax NPV and IRR are most sensitive to copper price. A 10% change in copper price from the base case of $2.50/lb results in a change in post-tax NPV at 8% of ±$220 M.
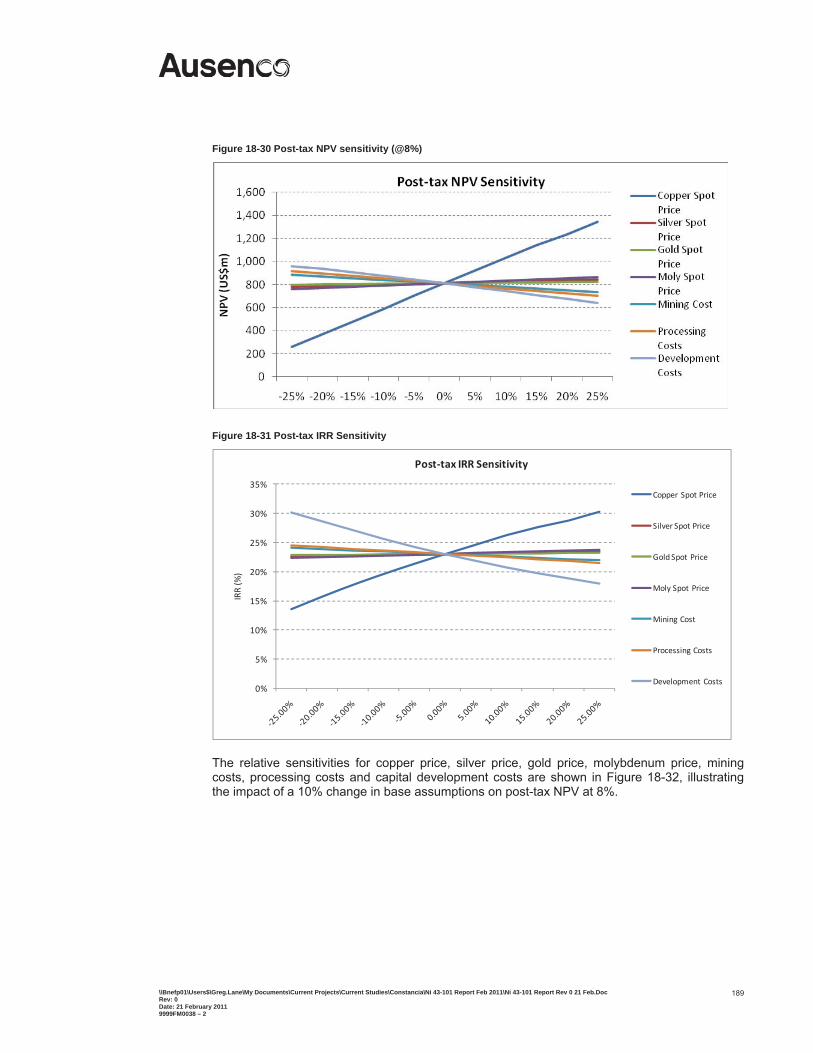
\\Bnefp01\Users$\Greg.Lane\My Documents\Current Projects\Current Studies\Constancia\Ni 43-101 Report Feb 2011\Ni 43-101 Report Rev 0 21 Feb.Doc Rev: 0 Date: 21 February 2011 9999FM0038 – 2
189
Figure 18-30 Post-tax NPV sensitivity (@8%)
Figure 18-31 Post-tax IRR Sensitivity
0%
5%
10%
15%
20%
25%
30%
35%
IRR(%)
Post tax IRR Sensitivity
Copper Spot Price
Silver Spot Price
Gold Spot Price
Moly Spot Price
Mining Cost
Processing Costs
Development Costs
The relative sensitivities for copper price, silver price, gold price, molybdenum price, mining costs, processing costs and capital development costs are shown in Figure 18-32, illustrating the impact of a 10% change in base assumptions on post-tax NPV at 8%.
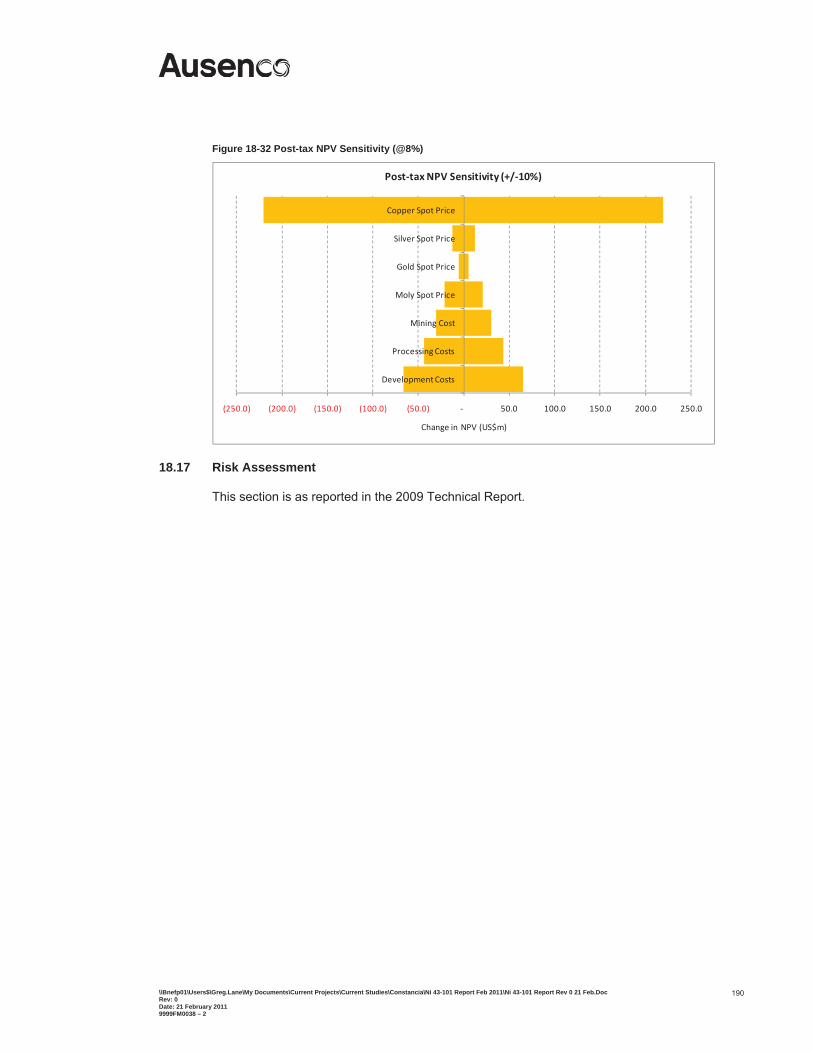
\\Bnefp01\Users$\Greg.Lane\My Documents\Current Projects\Current Studies\Constancia\Ni 43-101 Report Feb 2011\Ni 43-101 Report Rev 0 21 Feb.Doc Rev: 0 Date: 21 February 2011 9999FM0038 – 2
190
Figure 18-32 Post-tax NPV Sensitivity (@8%)
(250.0) (200.0) (150.0) (100.0) (50.0) 50.0 100.0 150.0 200.0 250.0
Copper Spot Price
Silver Spot Price
Gold Spot Price
Moly Spot Price
Mining Cost
Processing Costs
DevelopmentCosts
Change in NPV (US$m)
Post tax NPV Sensitivity (+/ 10%)
18.17 Risk Assessment
This section is as reported in the 2009 Technical Report.
\\Bnefp01\Users$\Greg.Lane\My Documents\Current Projects\Current Studies\Constancia\Ni 43-101 Report Feb 2011\Ni 43-101 Report Rev 0 21 Feb.Doc Rev: 0 Date: 21 February 2011 9999FM0038 – 2
191
19 INTERPRETATION AND CONCLUSIONS
A FSO was completed for the Constancia Project, covering the mine reserve, mine design, mine scheduling and comminution circuit of the processing plant, including revision of the capital and operating costs for those areas. Other areas of the project that have been impacted by the FSO outcomes are reported in this Technical Report.
The accuracies of the capital and operating cost estimates were ±15% for the DFS and 2009 Technical Report. Elements of the FSO were also to a similar level of accuracy. However, the differences in exchange rates used the 2009 Technical Report and this 2011 Technical Report and the combination of capital and operating costs from the two sources results in cost estimates that are likely to be to a lesser level of accuracy.
The 2009 Technical report contained the following conclusions with respect to the scope not modified in this report.
Geotechnical site investigations have been completed to a feasibility level for the Constancia pit, TMF, plant site, and associated structures. Investigations at the site of the PAG WRF, including the containment pond and the potential borrow areas, were limited due to land access restrictions. The information available at this time is considered sufficient to support the feasibility, but additional field work should be performed at these locations to support the next stage of design.
Water for the mill will be supplied from the following sources: groundwater from dewatering wells located behind the pit walls, in pit surface water collected in the pit sumps, drainage from the PAG WRF that will be collected in the containment pond just below the PAG WRF, and reclaimed water from the surface water pond in the TMF. Water from the PAG WRF and in-pit sumps is expected to be acidic and will be neutralised with lime at the process plant before use in the process.
Raw water for sustaining mill operations will be obtained, in part, from pit dewatering wells installed behind the pit perimeter. Based on the current hydrogeologic model, a total of 18 dewatering wells will be installed in and around the pit. Water from these wells will be pumped to a collection box immediately upstream of the plant and then conveyed by gravity to a dedicated tank in the plant. Some additional work is recommended to improve confidence in certain areas, but any changes are not expected to change the outcome of the DFS significantly.
The following conclusions pertain to the FSO scope of work:
The modified approach to the comminution circuit maintains plant throughputs above 24 Mt/y for life of mine and substantially improves the NPV of the project.
There is potential to further increase throughput by treating low margin ores in the initial years of operation (these are not included in the current financial analysis).
\\Bnefp01\Users$\Greg.Lane\My Documents\Current Projects\Current Studies\Constancia\Ni 43-101 Report Feb 2011\Ni 43-101 Report Rev 0 21 Feb.Doc Rev: 0 Date: 21 February 2011 9999FM0038 – 2
192
The stability analysis developed for the inter-ramp slopes in the pit configuration presented in the 2009 Technical Report provided factors of safety above 1.2 under static conditions, and above 1.0 for the case of seismic loads associated with a 100 year return period. These factors of safety are considered acceptable for this level of design and are consistent with Peruvian regulations. The expanded pit design presents two sectors for which the safety factors calculated using the same methods and geologic interpretations are slightly below these FoS criteria at the inter-ramp scale. Additional geotechnical investigations and analysis are recommended to address this issue. In consideration of potential bench scale failures, 77% of the bench face slopes in the pit configuration presented in the 2009 Technical Report were considered to have less than 27% probability of failure. The remaining 25% of the bench face slopes were considered to have a 55% failure probability. Overall, it was calculated that catch benches will meet the minimum width criterion with a reliability of 65% or better. The geotechnical conditions presented in the expanded pit are similar overall, from a catch bench reliability standpoint. More refined statistics for catch bench reliability will be developed for final design. Bench scale failures will be mitigated by scaling and maintenance of catch benches, and the provision of rock fall catchment structures or berms where appropriate.
A post-tax cashflow model indicates a NPV of $811 M and an IRR of 23%. However, these values do not take account of financing costs required to develop the Project, which will be investigated by Norsemont.
Project economics are most sensitive to the long-term copper price: a constant price of $2.50/lb has been assumed for the Base Case cashflow models. Other important economic variables are the total capital cost, treatment charges, the cost of diesel and electricity.
The following risks were identified during the FSO:
The capital cost estimate for the project was only partially updated. The costs for the mine, the plant crushing and grinding circuits and some elements of the infrastructure were addressed using a combination of the DFS cost base and new vendor costs. Variations in exchange rate were not fully addressed.
The operating cost estimate for the project was only partially updated. The costs for the mine, the plant crushing and grinding circuits and some elements of the infrastructure were addressed using a combination of the DFS cost base. Variations in exchange rate were not fully addressed.
The HV substation for the plant will require a 120 MVA transformer due to the increase installed grinding power.
Ausenco has recommended that Norsemont reviews the allowances for sustaining capital for the process plant.
Risk analysis for the 2009 Technical Report identified the following issues that remain unchanged for this report:
Budget over-run – the primary contributors to budget over-run are poor management resulting in scope creep and schedule prolongation. Typical of any project, budget over-run will ultimately affect the overall project viability.
Power supply – there is potential that all available capacity at the current supply point of Tintaya substation is secured by other parties. This situation is common with projects, as such Norsemont should commence negotiations to secure this supply, however, should this supply not be secured then Norsemont’s alternative is to fund the additional capital cost of obtaining a supply from the more distant Cotaruse Substation.
\\Bnefp01\Users$\Greg.Lane\My Documents\Current Projects\Current Studies\Constancia\Ni 43-101 Report Feb 2011\Ni 43-101 Report Rev 0 21 Feb.Doc Rev: 0 Date: 21 February 2011 9999FM0038 – 2
193
Implementation timing - in a regional context the current global financial crisis has resulted in the deferment of project expenditure. Should the activity in the construction market increase then escalation will increase commensurately with market activity. Opportunity exists to capitalise on the current market by the immediate execution of the project, the longer the delay the greater the potential impact of price escalation.
Power Price - the actual electrical charge rate paid by Norsemont during operations will be subject to market conditions, hence competition for power may result in the cost of power being higher that the current assumption within the DFS. This risk is considered as part of the sensitivity modelling.
Pit geotechnical - geotechnical parameters are key criteria in the mine design, in particular the assessment for overall pit slope stability. Additional operational costs would be incurred if the pit slope stability estimates prove to be too optimistic.
Norsemont as Developer/Operator - the implementation strategy relies upon Norsemont undertaking the overall project management role for the execution phase of the project and the owner operator role for the operations phase of the project. This strategy is the most cost effective and provides the effective management of construction risk, however, offsetting this is the risk in being able to recruit a highly capable delivery and operational team.
To avoid delays to the construction schedule the relocation action plan must be implemented in Q2 2011. If these activities are delayed then there is a high likelihood that the construction schedule will not be met.
The following opportunities exist to improve the Project and have been revised from the 2009 Technical Report:
Low margin ore may be processed to further increase project returns.
The comminution circuit has spare capacity in the initial years of operation due to the softer ore.
The P80 of 106 microns for flotation feed may be able to be coarsened to enable increased throughput when treating hypogene ores.
Long lead item supply periods have reduced since the 2009 Technical Report and early commitment to these equipment items may improve project schedule.
The detailed planning for the bulk earthworks and purchase of the Owners civil construction fleet has potential to identify capital and operational costs savings and mitigate time and cost risks in the early construction phase of the project.
The investigation of the availability of new long lead equipment, i.e. cancelled orders etc. may provide schedule opportunities for the project. Currently these long lead item are critical path items, hence a reduction in time of the delivery of key equipment will provide schedule assurance and possibly an overall schedule reduction.
Negotiations with the various organisations that generate and transmit power may allow more confidence on power pricing and availability. However, it is understood that firm commitments by government organisations can only be provided closer to the time of supply.
Detailed design of the improvement works for the access road upgrade and stakeholder consultation will increase the level of confidence around the scope of works. In addition, the acceleration of the delivery of the access road such that it is available for the construction of the mine will reduce transportation and travel risks and reduce travel time and delays.
\\Bnefp01\Users$\Greg.Lane\My Documents\Current Projects\Current Studies\Constancia\Ni 43-101 Report Feb 2011\Ni 43-101 Report Rev 0 21 Feb.Doc Rev: 0 Date: 21 February 2011 9999FM0038 – 2
194
20 RECOMMENDATIONS FOR FURTHER WORK
20.1 Resources
The 2009 Technical Report recommended that no further database or resource modelling work is required until a decision is taken to develop the Project, at which time additional drilling and resource modelling will be required to support more detailed mine planning.
20.2 Mining
Selected mining investigations were recommended in the 2009 Technical Report, and updated for this report where necessary, to provide support follow-up stages of engineering.
The DFS pit designs include sectors where the probability of bench scale failure is in excess of 35%. The incremental costs associated with flattening the pit slope in such areas should be assessed relative to the corresponding benefit of reduced probability of bench scale failures. Additional geotechnical exploration and evaluation are necessary in such areas to optimize the pit slope design.
The fuel (diesel) and explosive unit prices used in the study have been based on budget pricing for a recent Peruvian project, factored to address a potential freight differential. This approach was adopted when enquiries to Peruvian vendors were not answered in a timely way. These assumed rates should be confirmed by following up on the budget pricing submissions already requested from local suppliers.
Heavy equipment budget pricing should be followed up as the starting point for future equipment tendering activities. Additionally, some vendors are prepared to estimate fleet requirements at their own cost but require more detailed mine design information to perform these analyses.
The study has assumed that reticulated mains power will be available to allow electric shovels to operate from five months prior to plant start-up. Definition of an alternative diesel shovel based approach may be desirable in the event the provision of power is delayed.
Analysis of available vendor and other information indicated that the operating cost savings associated with electric drills was not sufficient to justify the incremental capital investment relative to diesel units. This interim conclusion was based on incomplete data and should be supported by a more in depth analysis prior to, or as part of, the mine equipment tendering process The owner civil fleet to address tails dam construction and related mine work has been prepared somewhat independently of the mine production fleet assessment. These two fleets should be evaluated to determine if there are any synergies that might improve project value.
20.3 Geotechnical and Hydrogeological Studies
Selected geotechnical investigations were recommended in the 2009 Technical Report to provide support follow-up stages of engineering. These included:
Additional field geotechnical investigations within the southern portion of the PAG WRF (limited investigations have been possible to date due to access restrictions).
Investigations to evaluate the need for removing the extremely weathered diorite to significant depths beneath the TMF embankment.
Additional geotechnical characterisation of the tailings and waste rock materials.
\\Bnefp01\Users$\Greg.Lane\My Documents\Current Projects\Current Studies\Constancia\Ni 43-101 Report Feb 2011\Ni 43-101 Report Rev 0 21 Feb.Doc Rev: 0 Date: 21 February 2011 9999FM0038 – 2
195
Additional investigations in potential borrow areas to further characterise potential construction materials and refine the quantity estimates.
Within the mine pit, three additional geotechnical drill holes in the area of Sectors VI and VII are necessary to investigate the potential that locally observed geological faults may extend through this area, and to refine the geotechnical stability assessment accordingly.
Risk analyses should be carried out to investigate the probability and consequences of a rock mass slide occurring over the access ramp, and of removing the access to the pit in the area of Sectors VI and VII. Further stability analyses are warranted to optimize the slopes in this area.
Improved characterization of faults and weak rock masses incorporating the most recent exploration data, and the performance of supporting geotechnical analyses as appropriate, are recommended to assess opportunities for pit slope optimization.
With regards to hydrogeological studies, the following actions were recommended prior to project development in the 2009 Technical Report:
Installation of additional ground water monitoring and sampling wells in the following locations: (1) within Quebrada Telaracaca to monitor potential seepages from the PAG WRF via fault zones; (2) upgradient and downgradient of the PAG WRF within Quebrada Huayllachane; and (3) downgradient of the proposed plant site.
Further investigations within the TMF and PAG WRF to confirm the criteria used in the design of these facilities. Within the PAG WRF, the objective will be to confirm the containment capability of the existing regime.
A further, detailed investigation to assess the probability and potential influence of pit dewatering on the lakes and karstic area situated north of the pit is in progress. The investigation includes additional drilling, hydraulic testing and piezometer installations along the Yanak fault and within the lakes catchment area to assess the existing ground water system and the degree of hydraulic continuity and connection between the Yanak fault and lake basins. Results of this work will determine whether any further action is required. Additional site investigations will be carried out in Q2 of 2011.
It was recommended that a groundwater exploration program is undertaken to assess the availability of additional sources of process water as an alternative supply during drought conditions. Targets include: the Yanak fault south of the pit area and structures paralleling the Chilloroya valley below the glacial valley infill material.
20.4 Metallurgical Test Work
The following test work program was recommended in the 2009 Technical Report. Work is in progress but is yet to be finalised and reported.
Testwork was recommended to evaluate the production of zinc concentrate, as a number of periods exist when this may be possible.
Silver recovery calculations were hampered by ICP analysis for the locked cycle tailing streams at times being below the detection limit of 0.5 ppm. Further evaluation of silver recovery and deportments was recommended.
Reduction in the talc/amphibole content of the molybdenum concentrate will produce increased revenue via reduced roasting charges. Further evaluation in an extended test work program was recommended into the extent of naturally floatable minerals in the Constancia deposit, their association with molybdenite and methods for their removal. Potential solutions included:
Replacement or partial replacement of light fuel oil with other collectors such as A3302 in molybdenum flotation
\\Bnefp01\Users$\Greg.Lane\My Documents\Current Projects\Current Studies\Constancia\Ni 43-101 Report Feb 2011\Ni 43-101 Report Rev 0 21 Feb.Doc Rev: 0 Date: 21 February 2011 9999FM0038 – 2
196
Destruction of the fuel oil promoter after the early stages of molybdenum flotation and reverse flotation of naturally floating gangue minerals.
20.5 Process Plant and Infrastructure
The process plant and infrastructure needs to be fully integrated for the FSO concept prior to project approval to fully define the concept for detailed engineering and construciton. This work is planned and has been named Definition Phase Engineering (DPE). The DPE will define the process design, site layout and general arrangement of the project equipment to enable further basic and detailed engineering to progress with a defined process package that is consistent with the FSO outcomes and with revised inputs to the ESIA and permitting process.
The FSO resulted in a number of changes to the mine plan, mine design and process comminution circuit. The DPE will aggregate these changes with the other plant processes and facilities to define a concept that will form the basis of detailed design. In addition, the DPE will provide the backbone of the information for the ESIA and permitting process. This will provide sufficient clarity to minimise “churn” and cost at the commencement of the EPCM phase.
The proposed scope of services is outlined below:
Optimize the mine plan, ore schedule and ore stockpiling and rehandling with respect to high Zn and supergene ore types and develop management plans to manage Zn grades in Cu concentrate on a shipment basis
Finalise the process design package for the project, including:
o process design criteria
o process flow sheets
o process description
o process control philosophy and P&IDs
o process mass and water balance (as inputs to the site-wide water balance).
Conduct the follow project value engineering studies:
o mine fleet and mineability review based on the revised schedule
o crane and maintenance study
o constructability study
o layout optimisation case studies for the primary crusher, SAG mill discharge screen, flotation circuit, filter plant, concentrate storage and plant facilities, as agreed during the review of the FSO design
o site-wide infrastructure and services revision (including power) to reflect the changes from the FSO.
Provide the following deliverables suitable for commencement of EPCM services:
o site layout
o plant layout
o general arrangement drawings
o contracting and procurement plans.
Negotiations with the various organisations that generate and transmit power will allow more confidence on power pricing and availability.
\\Bnefp01\Users$\Greg.Lane\My Documents\Current Projects\Current Studies\Constancia\Ni 43-101 Report Feb 2011\Ni 43-101 Report Rev 0 21 Feb.Doc Rev: 0 Date: 21 February 2011 9999FM0038 – 2
197
Detailed design of the improvement works for the access road upgrade and stakeholder consultation will increase the level of confidence around the scope of works. In addition, the acceleration of the delivery of the access road such that it is available for the construction of the mine will reduce transportation and travel risks and reduce travel time and delays.
20.6 ESIA and Permitting
The ESIA was approved by the Peruvian Ministry of Energy and Mines on November 24, 2010.
The development of the permitting plan will begin in early 2011.
20.7 Project Implementation
The capital and operating costs for the complete project need to be compiled to a preliminary control estimate by updating all costs to a 2011 basis for project approval.
The following recommendations from the 2009 Technical Report remain pertinent.
The detailed planning for the bulk earthworks and purchase of the Owners civil construction fleet has potential to identify capital and operational costs savings and mitigate time and cost risks in the early construction phase of the project.
The capital cost is based on the provision of a new camp.
\\Bnefp01\Users$\Greg.Lane\My Documents\Current Projects\Current Studies\Constancia\Ni 43-101 Report Feb 2011\Ni 43-101 Report Rev 0 21 Feb.Doc Rev: 0 Date: 21 February 2011 9999FM0038 – 2
198
21 REFERENCES
This section is as reported in the 2009 Technical Report.
\\Bnefp01\Users$\Greg.Lane\My Documents\Current Projects\Current Studies\Constancia\Ni 43-101 Report Feb 2011\Ni 43-101 Report Rev 0 21 Feb.Doc Rev: 0 Date: 21 February 2011 9999FM0038 – 2
199
22 DATE AND SIGNATURE PAGE
The undersigned Qualified Persons prepared this Technical Report with an effective date of 21 February 2009.
The format and content of the report are intended to conform to Form 43-101F1 of National Instrument 43-101 (NI 43-101) of the Canadian Securities Administrators.
Title: Constancia Copper Project, NI43-101 Technical Report
Location: Province of Cusco, Peru
Effective Dates:
Effective Date of Technical Report:
Effective Date of Mineral Reserves:
Effective Date of Mineral Resources: 28 September 2009
Qualified Persons:
Greg Lane, M. AusIMM (#203005) employed by Ausenco as General Manager Technical Solutions was responsible for the preparation of this report and the revisions to the comminution circuit and associated capital and operating costs completed as part of the Feasibility Study Optimisation study.
Robert Cummings, M.Sc. Geol. Eng., Registered Professional Engineer in Arizona, Geotechnical Consultant and Principal of Saguaro Geoservices, Inc. was responsible for development of pit slope stability analyses and design parameters in Section 18.1.3 and Section 18.2.2.
Thomas F. Kerr, M.Sc., President of Knight Piésold and Co. USA, Registered Professional Engineer (Civil and Geotechnical), P.Eng., in British Columbia (#14906) and Ontario (#90407230) and a P.E. in Colorado (#445050), California (#C49260) and Alaska (#10969), was responsible for information relating to the site geotechnical investigations, and design and costing of the Tailings Storage Facility and water management systems as described in Section 18.2 (excluding Section 18.2.2), Section 18.6, Section 18.7 and Section 18.13.5.
Dino Pilotto, B.A.Sc. (Mining), P.Eng. Saskatchewan, Canada (#14782) and Alberta, Canada (#88762), Principal Consultant – Mining of SRK Consulting (Canada) Inc. was responsible for open pit mine engineering aspects of the Project as contained in Section 17.14, Section 18.1, Section 18.13.2, and Section 18.14.2.
\\Bnefp01\Users$\Greg.Lane\My Documents\Current Projects\Current Studies\Constancia\Ni 43-101 Report Feb 2011\Ni 43-101 Report Rev 0 21 Feb.Doc Rev: 0 Date: 21 February 2011 9999FM0038 – 2
200
\\Bnefp01\Users$\Greg.Lane\My Documents\Current Projects\Current Studies\Constancia\Ni 43-101 Report Feb 2011\Ni 43-101 Report Rev 0 21 Feb.Doc Rev: 0 Date: 21 February 2011 9999FM0038 – 2
201
\\Bnefp01\Users$\Greg.Lane\My Documents\Current Projects\Current Studies\Constancia\Ni 43-101 Report Feb 2011\Ni 43-101 Report Rev 0 21 Feb.Doc Rev: 0 Date: 21 February 2011 9999FM0038 – 2
202
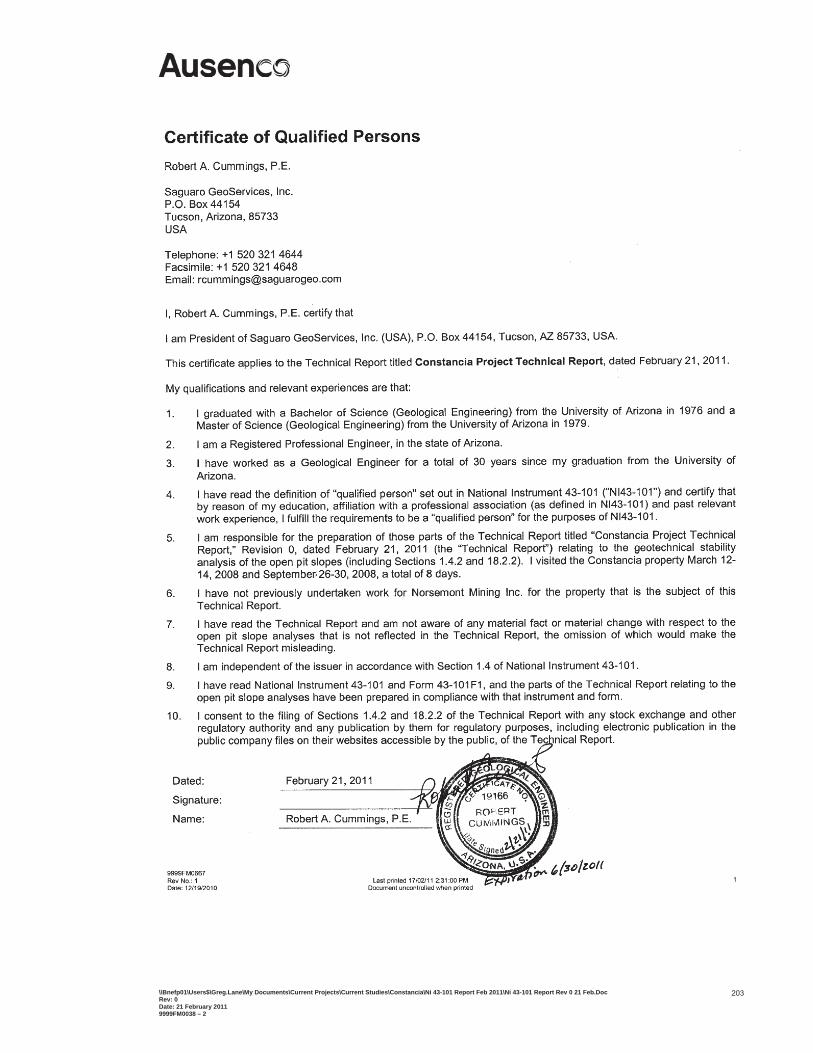
\\Bnefp01\Users$\Greg.Lane\My Documents\Current Projects\Current Studies\Constancia\Ni 43-101 Report Feb 2011\Ni 43-101 Report Rev 0 21 Feb.Doc Rev: 0 Date: 21 February 2011 9999FM0038 – 2
203
\\Bnefp01\Users$\Greg.Lane\My Documents\Current Projects\Current Studies\Constancia\Ni 43-101 Report Feb 2011\Ni 43-101 Report Rev 0 21 Feb.Doc Rev: 0 Date: 21 February 2011 9999FM0038 – 2
204
23 ADDITONAL REQUIREMENTS FOR TECHNICAL REPORTS ON PRODUCTION AND DEVELOPMENT PROPERTIES
As the Constancia Project has not yet reached the development or production stage, there are no additional requirements to report.
\\Bnefp01\Users$\Greg.Lane\My Documents\Current Projects\Current Studies\Constancia\Ni 43-101 Report Feb 2011\Ni 43-101 Report Rev 0 21 Feb.Doc Rev: 0 Date: 21 February 2011 9999FM0038 – 2
205
24 ILLUSTRATIONS
Illustrations are included as appropriate throughout the text, and are listed in the Index (List of Figures).

\\Bnefp01\Users$\Greg.Lane\My Documents\Current Projects\Current Studies\Constancia\Ni 43-101 Report Feb 2011\Ni 43-101 Report Rev 0 21 Feb.Doc Rev: 0 Date: 21 February 2011 9999FM0038 – 2
206
25 ANNEXURES
There is one annexure for this report:
Appendix 1 - Drill collar locations for all drill holes in the Constancia Project, updated to 8 January 2011
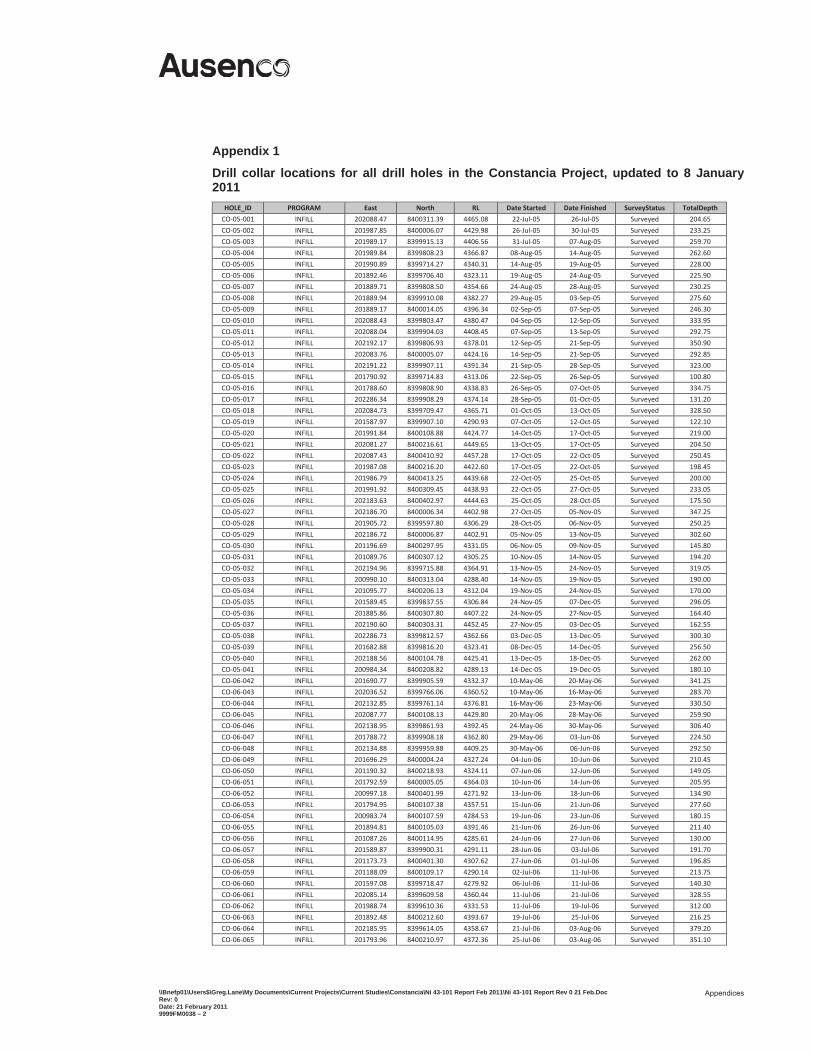
\\Bnefp01\Users$\Greg.Lane\My Documents\Current Projects\Current Studies\Constancia\Ni 43-101 Report Feb 2011\Ni 43-101 Report Rev 0 21 Feb.Doc Rev: 0 Date: 21 February 2011 9999FM0038 – 2
Appendices
Appendix 1
Drill collar locations for all drill holes in the Constancia Project, updated to 8 January 2011
HOLE_ID PROGRAM East North RL Date Started Date Finished SurveyStatus TotalDepth
CO 05 001 INFILL 202088.47 8400311.39 4465.08 22 Jul 05 26 Jul 05 Surveyed 204.65
CO 05 002 INFILL 201987.85 8400006.07 4429.98 26 Jul 05 30 Jul 05 Surveyed 233.25
CO 05 003 INFILL 201989.17 8399915.13 4406.56 31 Jul 05 07 Aug 05 Surveyed 259.70
CO 05 004 INFILL 201989.84 8399808.23 4366.87 08 Aug 05 14 Aug 05 Surveyed 262.60
CO 05 005 INFILL 201990.89 8399714.27 4340.31 14 Aug 05 19 Aug 05 Surveyed 228.00
CO 05 006 INFILL 201892.46 8399706.40 4323.11 19 Aug 05 24 Aug 05 Surveyed 225.90
CO 05 007 INFILL 201889.71 8399808.50 4354.66 24 Aug 05 28 Aug 05 Surveyed 230.25
CO 05 008 INFILL 201889.94 8399910.08 4382.27 29 Aug 05 03 Sep 05 Surveyed 275.60
CO 05 009 INFILL 201889.17 8400014.05 4396.34 02 Sep 05 07 Sep 05 Surveyed 246.30
CO 05 010 INFILL 202088.43 8399803.47 4380.47 04 Sep 05 12 Sep 05 Surveyed 333.95
CO 05 011 INFILL 202088.04 8399904.03 4408.45 07 Sep 05 13 Sep 05 Surveyed 292.75
CO 05 012 INFILL 202192.17 8399806.93 4378.01 12 Sep 05 21 Sep 05 Surveyed 350.90
CO 05 013 INFILL 202083.76 8400005.07 4424.16 14 Sep 05 21 Sep 05 Surveyed 292.85
CO 05 014 INFILL 202191.22 8399907.11 4391.34 21 Sep 05 28 Sep 05 Surveyed 323.00
CO 05 015 INFILL 201790.92 8399714.83 4313.06 22 Sep 05 26 Sep 05 Surveyed 100.80
CO 05 016 INFILL 201788.60 8399808.90 4338.83 26 Sep 05 07 Oct 05 Surveyed 334.75
CO 05 017 INFILL 202286.34 8399908.29 4374.14 28 Sep 05 01 Oct 05 Surveyed 131.20
CO 05 018 INFILL 202084.73 8399709.47 4365.71 01 Oct 05 13 Oct 05 Surveyed 328.50
CO 05 019 INFILL 201587.97 8399907.10 4290.93 07 Oct 05 12 Oct 05 Surveyed 122.10
CO 05 020 INFILL 201991.84 8400108.88 4424.77 14 Oct 05 17 Oct 05 Surveyed 219.00
CO 05 021 INFILL 202081.27 8400216.61 4449.65 13 Oct 05 17 Oct 05 Surveyed 204.50
CO 05 022 INFILL 202087.43 8400410.92 4457.28 17 Oct 05 22 Oct 05 Surveyed 250.45
CO 05 023 INFILL 201987.08 8400216.20 4422.60 17 Oct 05 22 Oct 05 Surveyed 198.45
CO 05 024 INFILL 201986.79 8400413.25 4439.68 22 Oct 05 25 Oct 05 Surveyed 200.00
CO 05 025 INFILL 201991.92 8400309.45 4438.93 22 Oct 05 27 Oct 05 Surveyed 233.05
CO 05 026 INFILL 202183.63 8400402.97 4444.63 25 Oct 05 28 Oct 05 Surveyed 175.50
CO 05 027 INFILL 202186.70 8400006.34 4402.98 27 Oct 05 05 Nov 05 Surveyed 347.25
CO 05 028 INFILL 201905.72 8399597.80 4306.29 28 Oct 05 06 Nov 05 Surveyed 250.25
CO 05 029 INFILL 202186.72 8400006.87 4402.91 05 Nov 05 13 Nov 05 Surveyed 302.60
CO 05 030 INFILL 201196.69 8400297.95 4331.05 06 Nov 05 09 Nov 05 Surveyed 145.80
CO 05 031 INFILL 201089.76 8400307.12 4305.25 10 Nov 05 14 Nov 05 Surveyed 194.20
CO 05 032 INFILL 202194.96 8399715.88 4364.91 13 Nov 05 24 Nov 05 Surveyed 319.05
CO 05 033 INFILL 200990.10 8400313.04 4288.40 14 Nov 05 19 Nov 05 Surveyed 190.00
CO 05 034 INFILL 201095.77 8400206.13 4312.04 19 Nov 05 24 Nov 05 Surveyed 170.00
CO 05 035 INFILL 201589.45 8399837.55 4306.84 24 Nov 05 07 Dec 05 Surveyed 296.05
CO 05 036 INFILL 201885.86 8400307.80 4407.22 24 Nov 05 27 Nov 05 Surveyed 164.40
CO 05 037 INFILL 202190.60 8400303.31 4452.45 27 Nov 05 03 Dec 05 Surveyed 162.55
CO 05 038 INFILL 202286.73 8399812.57 4362.66 03 Dec 05 13 Dec 05 Surveyed 300.30
CO 05 039 INFILL 201682.88 8399816.20 4323.41 08 Dec 05 14 Dec 05 Surveyed 256.50
CO 05 040 INFILL 202188.56 8400104.78 4425.41 13 Dec 05 18 Dec 05 Surveyed 262.00
CO 05 041 INFILL 200984.34 8400208.82 4289.13 14 Dec 05 19 Dec 05 Surveyed 180.10
CO 06 042 INFILL 201690.77 8399905.59 4332.37 10 May 06 20 May 06 Surveyed 341.25
CO 06 043 INFILL 202036.52 8399766.06 4360.52 10 May 06 16 May 06 Surveyed 283.70
CO 06 044 INFILL 202132.85 8399761.14 4376.81 16 May 06 23 May 06 Surveyed 330.50
CO 06 045 INFILL 202087.77 8400108.13 4429.80 20 May 06 28 May 06 Surveyed 259.90
CO 06 046 INFILL 202138.95 8399861.93 4392.45 24 May 06 30 May 06 Surveyed 306.40
CO 06 047 INFILL 201788.72 8399908.18 4362.80 29 May 06 03 Jun 06 Surveyed 224.50
CO 06 048 INFILL 202134.88 8399959.88 4409.25 30 May 06 06 Jun 06 Surveyed 292.50
CO 06 049 INFILL 201696.29 8400004.24 4327.24 04 Jun 06 10 Jun 06 Surveyed 210.45
CO 06 050 INFILL 201190.32 8400218.93 4324.11 07 Jun 06 12 Jun 06 Surveyed 149.05
CO 06 051 INFILL 201792.59 8400005.05 4364.03 10 Jun 06 14 Jun 06 Surveyed 205.95
CO 06 052 INFILL 200997.18 8400401.99 4271.92 13 Jun 06 18 Jun 06 Surveyed 134.90
CO 06 053 INFILL 201794.95 8400107.38 4357.51 15 Jun 06 21 Jun 06 Surveyed 277.60
CO 06 054 INFILL 200983.74 8400107.59 4284.53 19 Jun 06 23 Jun 06 Surveyed 180.15
CO 06 055 INFILL 201894.81 8400105.03 4391.46 21 Jun 06 26 Jun 06 Surveyed 211.40
CO 06 056 INFILL 201087.26 8400114.95 4285.61 24 Jun 06 27 Jun 06 Surveyed 130.00
CO 06 057 INFILL 201589.87 8399900.31 4291.11 28 Jun 06 03 Jul 06 Surveyed 191.70
CO 06 058 INFILL 201173.73 8400401.30 4307.62 27 Jun 06 01 Jul 06 Surveyed 196.85
CO 06 059 INFILL 201188.09 8400109.17 4290.14 02 Jul 06 11 Jul 06 Surveyed 213.75
CO 06 060 INFILL 201597.08 8399718.47 4279.92 06 Jul 06 11 Jul 06 Surveyed 140.30
CO 06 061 INFILL 202085.14 8399609.58 4360.44 11 Jul 06 21 Jul 06 Surveyed 328.55
CO 06 062 INFILL 201988.74 8399610.36 4331.53 11 Jul 06 19 Jul 06 Surveyed 312.00
CO 06 063 INFILL 201892.48 8400212.60 4393.67 19 Jul 06 25 Jul 06 Surveyed 216.25
CO 06 064 INFILL 202185.95 8399614.05 4358.67 21 Jul 06 03 Aug 06 Surveyed 379.20
CO 06 065 INFILL 201793.96 8400210.97 4372.36 25 Jul 06 03 Aug 06 Surveyed 351.10

\\Bnefp01\Users$\Greg.Lane\My Documents\Current Projects\Current Studies\Constancia\Ni 43-101 Report Feb 2011\Ni 43-101 Report Rev 0 21 Feb.Doc Rev: 0 Date: 21 February 2011 9999FM0038 – 2
Appendices
CO 06 066 INFILL 201892.59 8400212.69 4393.82 04 Aug 06 08 Aug 06 Surveyed 172.95
CO 06 067 INFILL 201988.98 8399509.19 4324.52 04 Aug 06 14 Aug 06 Surveyed 348.10
CO 06 068 INFILL 201699.29 8400109.69 4327.75 08 Aug 06 17 Aug 06 Surveyed 258.30
CO 06 069 INFILL 202188.59 8400209.27 4444.74 10 Aug 06 20 Aug 06 Surveyed 339.90
CO 06 070 INFILL 202285.98 8400005.99 4393.44 14 Aug 06 22 Aug 06 Surveyed 337.20
CO 06 071 INFILL 202084.64 8399517.14 4342.20 18 Aug 06 30 Aug 06 Surveyed 359.40
CO 06 072 INFILL 201789.16 8400305.66 4393.99 20 Aug 06 30 Aug 06 Surveyed 378.20
CO 06 073 INFILL 202286.34 8400102.51 4414.31 22 Aug 06 29 Aug 06 Surveyed 316.70
CO 06 074 INFILL 202384.85 8400104.52 4396.54 30 Aug 06 29 Sep 06 Surveyed 374.40
CO 06 075 INFILL 201894.45 8400407.11 4418.72 31 Aug 06 06 Sep 06 Surveyed 229.15
CO 06 076 INFILL 202184.37 8399505.79 4346.45 01 Sep 06 14 Sep 06 Surveyed 355.70
CO 06 077 INFILL 200896.19 8400303.41 4278.86 06 Sep 06 12 Sep 06 Surveyed 187.65
CO 06 078 INFILL 201986.94 8399409.95 4311.98 12 Sep 06 18 Sep 06 Surveyed 171.50
CO 06 079 INFILL 201607.51 8399987.55 4293.56 14 Sep 06 26 Sep 06 Surveyed 336.90
CO 06 080 INFILL 202288.75 8400203.48 4429.90 14 Sep 06 25 Sep 06 Surveyed 326.45
CO 06 081 INFILL 202287.69 8399814.23 4362.61 19 Sep 06 30 Sep 06 Surveyed 374.85
CO 06 082 INFILL 202282.38 8399708.43 4346.99 25 Sep 06 01 Oct 06 Surveyed 213.70
CO 06 083 INFILL 201988.33 8399509.41 4324.38 27 Sep 06 02 Oct 06 Surveyed 526.00
CO 06 084 INFILL 201687.74 8400205.54 4359.77 30 Sep 06 06 Oct 06 Surveyed 229.30
CO 06 085 INFILL 200989.12 8400011.44 4267.16 02 Oct 06 07 Oct 06 Surveyed 195.00
CO 06 086 INFILL 201989.78 8400508.55 4422.54 02 Oct 06 07 Oct 06 Surveyed 200.10
CO 06 087 INFILL 201588.80 8400110.05 4322.31 06 Oct 06 15 Oct 06 Surveyed 307.25
CO 06 088 INFILL 200895.84 8400211.07 4270.74 07 Oct 06 18 Oct 06 Surveyed 262.20
CO 06 089 INFILL 202285.78 8400308.21 4443.57 07 Oct 06 16 Oct 06 Surveyed 343.00
CO 06 090 INFILL 201892.32 8400011.34 4396.51 15 Oct 06 22 Oct 06 Surveyed 325.60
CO 06 091 INFILL 202186.11 8400510.70 4429.53 17 Oct 06 23 Oct 06 Surveyed 368.55
CO 06 092 INFILL 202386.09 8400202.84 4411.84 15 Oct 06 10 Nov 06 Surveyed 586.00
CO 06 093 INFILL 202089.86 8400511.24 4433.25 19 Oct 06 29 Oct 06 Surveyed 348.15
CO 06 094 INFILL 201699.34 8399694.47 4292.99 22 Oct 06 07 Nov 06 Surveyed 351.75
CO 06 095 INFILL 202286.56 8400405.64 4441.29 23 Oct 06 27 Oct 06 Surveyed 327.20
CO 06 096 INFILL 202283.39 8399906.83 4374.49 08 Nov 06 16 Nov 06 Surveyed 500.40
CO 06 097 INFILL 202282.55 8399707.96 4347.66 07 Nov 06 26 Nov 06 Surveyed 529.05
CO 06 098 INFILL 201593.92 8400207.30 4351.80 10 Nov 06 22 Nov 06 Surveyed 562.65
CO 06 099 INFILL 202385.67 8400202.55 4411.97 10 Nov 06 24 Nov 06 Surveyed 518.75
CO 06 100 INFILL 201495.66 8400029.37 4291.24 17 Nov 06 16 Dec 06 Surveyed 633.75
CO 06 101 INFILL 201786.12 8399616.58 4288.99 23 Nov 06 27 Nov 06 Surveyed 98.00
CO 06 102 INFILL 202387.22 8400010.64 4377.32 25 Nov 06 11 Dec 06 Surveyed 514.00
CO 06 103 INFILL 202386.75 8399812.77 4345.87 28 Nov 06 14 Dec 06 Surveyed 507.50
CO 06 104 INFILL 201786.32 8399616.36 4289.11 27 Nov 06 07 Dec 06 Surveyed 402.65
CO 06 105 INFILL 202187.72 8399507.51 4346.74 08 Dec 06 17 Dec 06 Surveyed 531.80
CO 06 106 INFILL 202285.15 8399606.50 4343.91 11 Dec 06 30 Jan 07 Surveyed 568.15
CO 06 107 INFILL 202291.53 8399506.02 4341.05 12 Dec 06 22 Dec 06 Surveyed 545.70
CO 07 108 INFILL 201788.60 8399475.85 4275.15 14 Jan 07 21 Jan 07 Surveyed 177.05
CO 07 109 INFILL 200846.14 8401101.43 4318.96 26 Jan 07 04 Feb 07 Surveyed 443.75
CO 07 110 INFILL 201493.27 8400111.77 4316.62 05 Feb 07 22 Feb 07 Surveyed 619.25
CO 07 111 INFILL 201784.21 8399476.17 4274.89 05 Feb 07 21 Feb 07 Surveyed 506.40
CO 07 112 INFILL 201318.80 8400038.36 4270.22 17 Mar 07 04 Apr 07 Surveyed 564.90
CO 07 113 INFILL 201313.15 8400116.20 4283.69 04 Apr 07 12 Apr 07 Surveyed 331.85
CO 07 114 INFILL 201185.60 8400007.43 4262.78 13 Apr 07 07 May 07 Surveyed 640.95
CO 07 115 INFILL 201542.81 8400056.35 4300.30 06 May 07 20 Jun 07 Surveyed 626.65
CO 07 116 INFILL 201190.28 8399903.92 4234.21 10 May 07 06 Jun 07 Surveyed 460.80
CO 07 117 INFILL 201742.09 8399960.09 4347.96 23 May 07 15 Jun 07 Surveyed 425.45
CO 07 118 INFILL 201736.98 8400055.70 4335.99 25 May 07 30 Jun 07 Surveyed 635.60
CO 07 119 INFILL 201630.33 8399961.24 4304.45 16 Jun 07 21 Jul 07 Surveyed 593.20
CO 07 120 INFILL 201838.18 8399958.37 4378.33 16 Jun 07 03 Jul 07 Surveyed 401.60
CO 07 121 INFILL 201837.38 8400056.16 4373.86 02 Jul 07 27 Jul 07 Surveyed 509.65
CO 07 122 INFILL 201934.59 8399962.35 4408.99 04 Jul 07 22 Jul 07 Surveyed 417.20
CO 07 123 INFILL 201391.22 8400109.74 4298.77 07 Jul 07 26 Jul 07 Surveyed 606.65
CO 07 124 INFILL 202039.95 8399960.44 4426.81 22 Jul 07 03 Aug 07 Surveyed 340.15
CO 07 125 INFILL 202037.02 8399861.77 4392.77 23 Jul 07 05 Aug 07 Surveyed 379.20
CO 07 126 INFILL 200844.40 8401103.88 4319.76 28 Jul 07 07 Aug 07 Surveyed 416.90
CO 07 127 INFILL 201636.58 8399660.67 4273.77 29 Jul 07 09 Sep 07 Surveyed 529.55
CO 07 128 INFILL 202036.71 8400060.74 4434.88 04 Aug 07 21 Aug 07 Surveyed 394.65
CO 07 129 INFILL 201639.29 8399869.29 4317.62 07 Aug 07 25 Aug 07 Surveyed 467.15
CO 07 130 INFILL 201635.05 8400058.07 4304.52 08 Aug 07 21 Aug 07 Surveyed 532.80
CO 07 131 INFILL 202037.35 8400159.09 4434.46 18 Aug 07 27 Aug 07 Surveyed 306.25
CO 07 132 INFILL 201733.68 8399858.73 4342.81 23 Aug 07 26 Aug 07 Surveyed 202.40
CO 07 133 INFILL 201836.66 8399859.93 4359.56 26 Aug 07 18 Sep 07 Surveyed 464.95
CO 07 134 INFILL 201837.30 8399662.27 4304.94 27 Aug 07 31 Aug 07 Surveyed 211.20
CO 07 135 INFILL 202242.68 8400254.27 4442.27 28 Aug 07 04 Sep 07 Surveyed 250.25
CO 07 136 INFILL 202141.26 8399662.56 4366.71 29 Aug 07 13 Sep 07 Surveyed 463.50
CO 07 137 INFILL 201742.61 8399662.49 4293.89 01 Sep 07 12 Sep 07 Surveyed 406.55
CO 07 138 INFILL 202144.48 8400153.61 4435.85 04 Sep 07 11 Sep 07 Surveyed 239.20
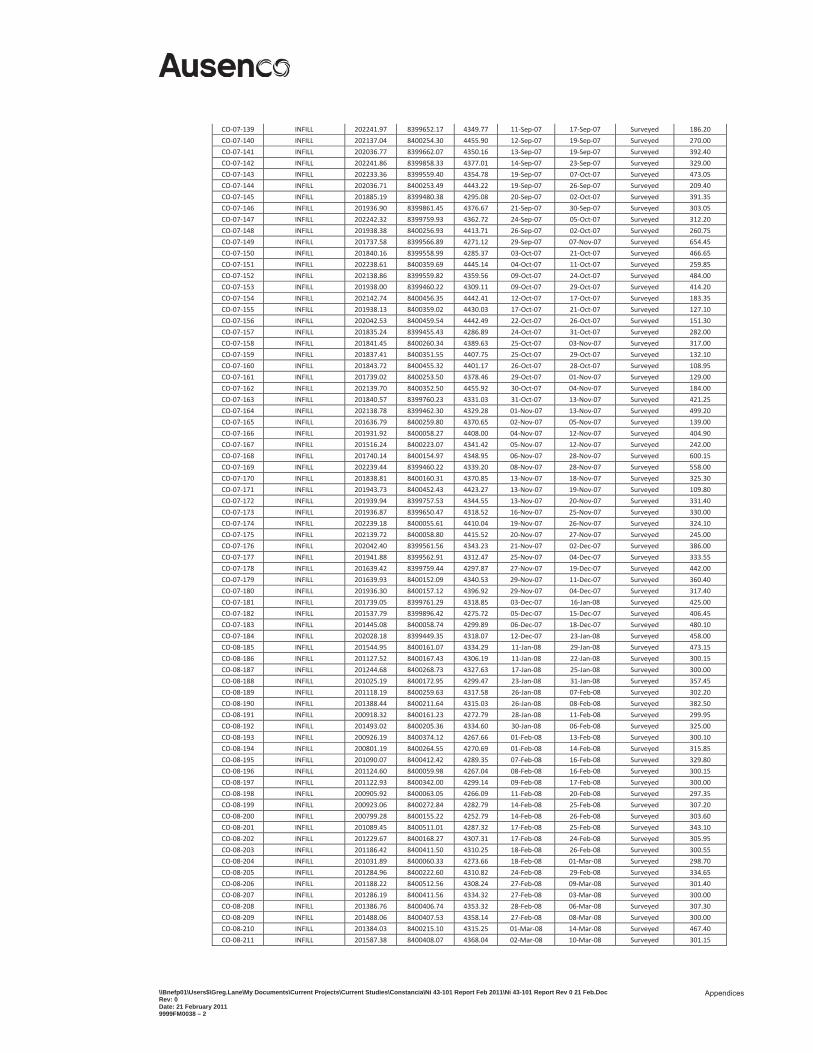
\\Bnefp01\Users$\Greg.Lane\My Documents\Current Projects\Current Studies\Constancia\Ni 43-101 Report Feb 2011\Ni 43-101 Report Rev 0 21 Feb.Doc Rev: 0 Date: 21 February 2011 9999FM0038 – 2
Appendices
CO 07 139 INFILL 202241.97 8399652.17 4349.77 11 Sep 07 17 Sep 07 Surveyed 186.20
CO 07 140 INFILL 202137.04 8400254.30 4455.90 12 Sep 07 19 Sep 07 Surveyed 270.00
CO 07 141 INFILL 202036.77 8399662.07 4350.16 13 Sep 07 19 Sep 07 Surveyed 392.40
CO 07 142 INFILL 202241.86 8399858.33 4377.01 14 Sep 07 23 Sep 07 Surveyed 329.00
CO 07 143 INFILL 202233.36 8399559.40 4354.78 19 Sep 07 07 Oct 07 Surveyed 473.05
CO 07 144 INFILL 202036.71 8400253.49 4443.22 19 Sep 07 26 Sep 07 Surveyed 209.40
CO 07 145 INFILL 201885.19 8399480.38 4295.08 20 Sep 07 02 Oct 07 Surveyed 391.35
CO 07 146 INFILL 201936.90 8399861.45 4376.67 21 Sep 07 30 Sep 07 Surveyed 303.05
CO 07 147 INFILL 202242.32 8399759.93 4362.72 24 Sep 07 05 Oct 07 Surveyed 312.20
CO 07 148 INFILL 201938.38 8400256.93 4413.71 26 Sep 07 02 Oct 07 Surveyed 260.75
CO 07 149 INFILL 201737.58 8399566.89 4271.12 29 Sep 07 07 Nov 07 Surveyed 654.45
CO 07 150 INFILL 201840.16 8399558.99 4285.37 03 Oct 07 21 Oct 07 Surveyed 466.65
CO 07 151 INFILL 202238.61 8400359.69 4445.14 04 Oct 07 11 Oct 07 Surveyed 259.85
CO 07 152 INFILL 202138.86 8399559.82 4359.56 09 Oct 07 24 Oct 07 Surveyed 484.00
CO 07 153 INFILL 201938.00 8399460.22 4309.11 09 Oct 07 29 Oct 07 Surveyed 414.20
CO 07 154 INFILL 202142.74 8400456.35 4442.41 12 Oct 07 17 Oct 07 Surveyed 183.35
CO 07 155 INFILL 201938.13 8400359.02 4430.03 17 Oct 07 21 Oct 07 Surveyed 127.10
CO 07 156 INFILL 202042.53 8400459.54 4442.49 22 Oct 07 26 Oct 07 Surveyed 151.30
CO 07 157 INFILL 201835.24 8399455.43 4286.89 24 Oct 07 31 Oct 07 Surveyed 282.00
CO 07 158 INFILL 201841.45 8400260.34 4389.63 25 Oct 07 03 Nov 07 Surveyed 317.00
CO 07 159 INFILL 201837.41 8400351.55 4407.75 25 Oct 07 29 Oct 07 Surveyed 132.10
CO 07 160 INFILL 201843.72 8400455.32 4401.17 26 Oct 07 28 Oct 07 Surveyed 108.95
CO 07 161 INFILL 201739.02 8400253.50 4378.46 29 Oct 07 01 Nov 07 Surveyed 129.00
CO 07 162 INFILL 202139.70 8400352.50 4455.92 30 Oct 07 04 Nov 07 Surveyed 184.00
CO 07 163 INFILL 201840.57 8399760.23 4331.03 31 Oct 07 13 Nov 07 Surveyed 421.25
CO 07 164 INFILL 202138.78 8399462.30 4329.28 01 Nov 07 13 Nov 07 Surveyed 499.20
CO 07 165 INFILL 201636.79 8400259.80 4370.65 02 Nov 07 05 Nov 07 Surveyed 139.00
CO 07 166 INFILL 201931.92 8400058.27 4408.00 04 Nov 07 12 Nov 07 Surveyed 404.90
CO 07 167 INFILL 201516.24 8400223.07 4341.42 05 Nov 07 12 Nov 07 Surveyed 242.00
CO 07 168 INFILL 201740.14 8400154.97 4348.95 06 Nov 07 28 Nov 07 Surveyed 600.15
CO 07 169 INFILL 202239.44 8399460.22 4339.20 08 Nov 07 28 Nov 07 Surveyed 558.00
CO 07 170 INFILL 201838.81 8400160.31 4370.85 13 Nov 07 18 Nov 07 Surveyed 325.30
CO 07 171 INFILL 201943.73 8400452.43 4423.27 13 Nov 07 19 Nov 07 Surveyed 109.80
CO 07 172 INFILL 201939.94 8399757.53 4344.55 13 Nov 07 20 Nov 07 Surveyed 331.40
CO 07 173 INFILL 201936.87 8399650.47 4318.52 16 Nov 07 25 Nov 07 Surveyed 330.00
CO 07 174 INFILL 202239.18 8400055.61 4410.04 19 Nov 07 26 Nov 07 Surveyed 324.10
CO 07 175 INFILL 202139.72 8400058.80 4415.52 20 Nov 07 27 Nov 07 Surveyed 245.00
CO 07 176 INFILL 202042.40 8399561.56 4343.23 21 Nov 07 02 Dec 07 Surveyed 386.00
CO 07 177 INFILL 201941.88 8399562.91 4312.47 25 Nov 07 04 Dec 07 Surveyed 333.55
CO 07 178 INFILL 201639.42 8399759.44 4297.87 27 Nov 07 19 Dec 07 Surveyed 442.00
CO 07 179 INFILL 201639.93 8400152.09 4340.53 29 Nov 07 11 Dec 07 Surveyed 360.40
CO 07 180 INFILL 201936.30 8400157.12 4396.92 29 Nov 07 04 Dec 07 Surveyed 317.40
CO 07 181 INFILL 201739.05 8399761.29 4318.85 03 Dec 07 16 Jan 08 Surveyed 425.00
CO 07 182 INFILL 201537.79 8399896.42 4275.72 05 Dec 07 15 Dec 07 Surveyed 406.45
CO 07 183 INFILL 201445.08 8400058.74 4299.89 06 Dec 07 18 Dec 07 Surveyed 480.10
CO 07 184 INFILL 202028.18 8399449.35 4318.07 12 Dec 07 23 Jan 08 Surveyed 458.00
CO 08 185 INFILL 201544.95 8400161.07 4334.29 11 Jan 08 29 Jan 08 Surveyed 473.15
CO 08 186 INFILL 201127.52 8400167.43 4306.19 11 Jan 08 22 Jan 08 Surveyed 300.15
CO 08 187 INFILL 201244.68 8400268.73 4327.63 17 Jan 08 25 Jan 08 Surveyed 300.00
CO 08 188 INFILL 201025.19 8400172.95 4299.47 23 Jan 08 31 Jan 08 Surveyed 357.45
CO 08 189 INFILL 201118.19 8400259.63 4317.58 26 Jan 08 07 Feb 08 Surveyed 302.20
CO 08 190 INFILL 201388.44 8400211.64 4315.03 26 Jan 08 08 Feb 08 Surveyed 382.50
CO 08 191 INFILL 200918.32 8400161.23 4272.79 28 Jan 08 11 Feb 08 Surveyed 299.95
CO 08 192 INFILL 201493.02 8400205.36 4334.60 30 Jan 08 06 Feb 08 Surveyed 325.00
CO 08 193 INFILL 200926.19 8400374.12 4267.66 01 Feb 08 13 Feb 08 Surveyed 300.10
CO 08 194 INFILL 200801.19 8400264.55 4270.69 01 Feb 08 14 Feb 08 Surveyed 315.85
CO 08 195 INFILL 201090.07 8400412.42 4289.35 07 Feb 08 16 Feb 08 Surveyed 329.80
CO 08 196 INFILL 201124.60 8400059.98 4267.04 08 Feb 08 16 Feb 08 Surveyed 300.15
CO 08 197 INFILL 201122.93 8400342.00 4299.14 09 Feb 08 17 Feb 08 Surveyed 300.00
CO 08 198 INFILL 200905.92 8400063.05 4266.09 11 Feb 08 20 Feb 08 Surveyed 297.35
CO 08 199 INFILL 200923.06 8400272.84 4282.79 14 Feb 08 25 Feb 08 Surveyed 307.20
CO 08 200 INFILL 200799.28 8400155.22 4252.79 14 Feb 08 26 Feb 08 Surveyed 303.60
CO 08 201 INFILL 201089.45 8400511.01 4287.32 17 Feb 08 25 Feb 08 Surveyed 343.10
CO 08 202 INFILL 201229.67 8400168.27 4307.31 17 Feb 08 24 Feb 08 Surveyed 305.95
CO 08 203 INFILL 201186.42 8400411.50 4310.25 18 Feb 08 26 Feb 08 Surveyed 300.55
CO 08 204 INFILL 201031.89 8400060.33 4273.66 18 Feb 08 01 Mar 08 Surveyed 298.70
CO 08 205 INFILL 201284.96 8400222.60 4310.82 24 Feb 08 29 Feb 08 Surveyed 334.65
CO 08 206 INFILL 201188.22 8400512.56 4308.24 27 Feb 08 09 Mar 08 Surveyed 301.40
CO 08 207 INFILL 201286.19 8400411.56 4334.32 27 Feb 08 03 Mar 08 Surveyed 300.00
CO 08 208 INFILL 201386.76 8400406.74 4353.32 28 Feb 08 06 Mar 08 Surveyed 307.30
CO 08 209 INFILL 201488.06 8400407.53 4358.14 27 Feb 08 08 Mar 08 Surveyed 300.00
CO 08 210 INFILL 201384.03 8400215.10 4315.25 01 Mar 08 14 Mar 08 Surveyed 467.40
CO 08 211 INFILL 201587.38 8400408.07 4368.04 02 Mar 08 10 Mar 08 Surveyed 301.15
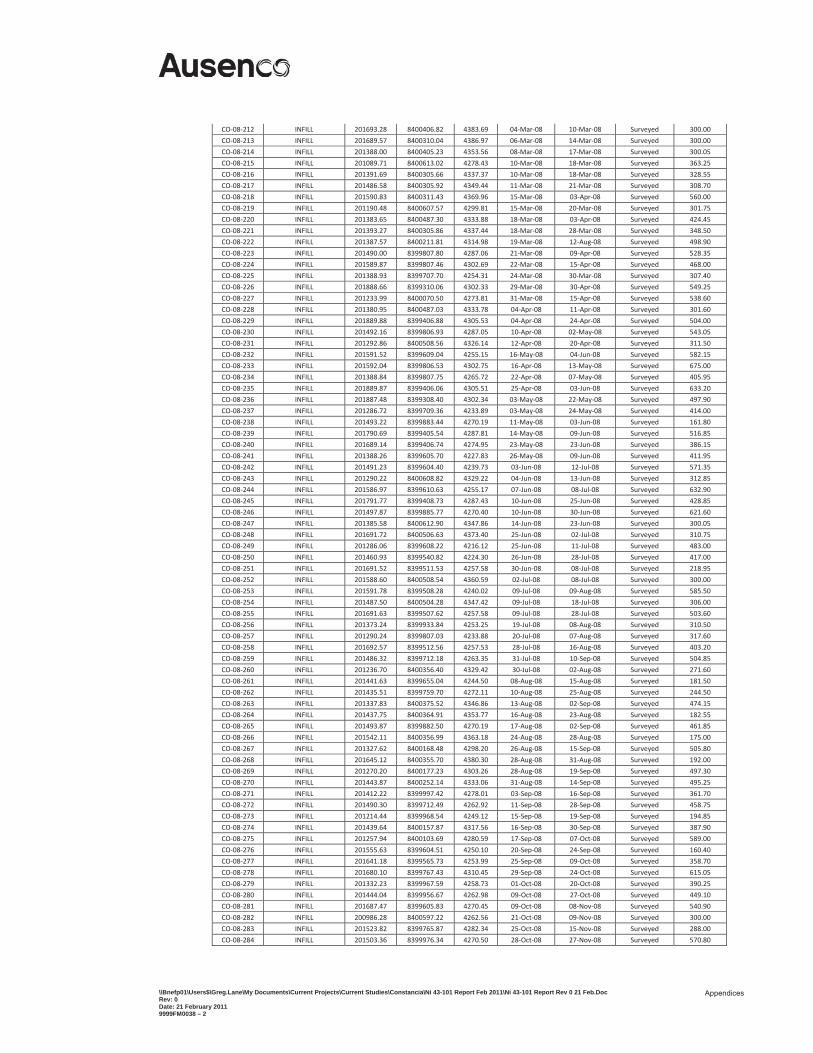
\\Bnefp01\Users$\Greg.Lane\My Documents\Current Projects\Current Studies\Constancia\Ni 43-101 Report Feb 2011\Ni 43-101 Report Rev 0 21 Feb.Doc Rev: 0 Date: 21 February 2011 9999FM0038 – 2
Appendices
CO 08 212 INFILL 201693.28 8400406.82 4383.69 04 Mar 08 10 Mar 08 Surveyed 300.00
CO 08 213 INFILL 201689.57 8400310.04 4386.97 06 Mar 08 14 Mar 08 Surveyed 300.00
CO 08 214 INFILL 201388.00 8400405.23 4353.56 08 Mar 08 17 Mar 08 Surveyed 300.05
CO 08 215 INFILL 201089.71 8400613.02 4278.43 10 Mar 08 18 Mar 08 Surveyed 363.25
CO 08 216 INFILL 201391.69 8400305.66 4337.37 10 Mar 08 18 Mar 08 Surveyed 328.55
CO 08 217 INFILL 201486.58 8400305.92 4349.44 11 Mar 08 21 Mar 08 Surveyed 308.70
CO 08 218 INFILL 201590.83 8400311.43 4369.96 15 Mar 08 03 Apr 08 Surveyed 560.00
CO 08 219 INFILL 201190.48 8400607.57 4299.81 15 Mar 08 20 Mar 08 Surveyed 301.75
CO 08 220 INFILL 201383.65 8400487.30 4333.88 18 Mar 08 03 Apr 08 Surveyed 424.45
CO 08 221 INFILL 201393.27 8400305.86 4337.44 18 Mar 08 28 Mar 08 Surveyed 348.50
CO 08 222 INFILL 201387.57 8400211.81 4314.98 19 Mar 08 12 Aug 08 Surveyed 498.90
CO 08 223 INFILL 201490.00 8399807.80 4287.06 21 Mar 08 09 Apr 08 Surveyed 528.35
CO 08 224 INFILL 201589.87 8399807.46 4302.69 22 Mar 08 15 Apr 08 Surveyed 468.00
CO 08 225 INFILL 201388.93 8399707.70 4254.31 24 Mar 08 30 Mar 08 Surveyed 307.40
CO 08 226 INFILL 201888.66 8399310.06 4302.33 29 Mar 08 30 Apr 08 Surveyed 549.25
CO 08 227 INFILL 201233.99 8400070.50 4273.81 31 Mar 08 15 Apr 08 Surveyed 538.60
CO 08 228 INFILL 201380.95 8400487.03 4333.78 04 Apr 08 11 Apr 08 Surveyed 301.60
CO 08 229 INFILL 201889.88 8399406.88 4305.53 04 Apr 08 24 Apr 08 Surveyed 504.00
CO 08 230 INFILL 201492.16 8399806.93 4287.05 10 Apr 08 02 May 08 Surveyed 543.05
CO 08 231 INFILL 201292.86 8400508.56 4326.14 12 Apr 08 20 Apr 08 Surveyed 311.50
CO 08 232 INFILL 201591.52 8399609.04 4255.15 16 May 08 04 Jun 08 Surveyed 582.15
CO 08 233 INFILL 201592.04 8399806.53 4302.75 16 Apr 08 13 May 08 Surveyed 675.00
CO 08 234 INFILL 201388.84 8399807.75 4265.72 22 Apr 08 07 May 08 Surveyed 405.95
CO 08 235 INFILL 201889.87 8399406.06 4305.51 25 Apr 08 03 Jun 08 Surveyed 633.20
CO 08 236 INFILL 201887.48 8399308.40 4302.34 03 May 08 22 May 08 Surveyed 497.90
CO 08 237 INFILL 201286.72 8399709.36 4233.89 03 May 08 24 May 08 Surveyed 414.00
CO 08 238 INFILL 201493.22 8399883.44 4270.19 11 May 08 03 Jun 08 Surveyed 161.80
CO 08 239 INFILL 201790.69 8399405.54 4287.81 14 May 08 09 Jun 08 Surveyed 516.85
CO 08 240 INFILL 201689.14 8399406.74 4274.95 23 May 08 23 Jun 08 Surveyed 386.15
CO 08 241 INFILL 201388.26 8399605.70 4227.83 26 May 08 09 Jun 08 Surveyed 411.95
CO 08 242 INFILL 201491.23 8399604.40 4239.73 03 Jun 08 12 Jul 08 Surveyed 571.35
CO 08 243 INFILL 201290.22 8400608.82 4329.22 04 Jun 08 13 Jun 08 Surveyed 312.85
CO 08 244 INFILL 201586.97 8399610.63 4255.17 07 Jun 08 08 Jul 08 Surveyed 632.90
CO 08 245 INFILL 201791.77 8399408.73 4287.43 10 Jun 08 25 Jun 08 Surveyed 428.85
CO 08 246 INFILL 201497.87 8399885.77 4270.40 10 Jun 08 30 Jun 08 Surveyed 621.60
CO 08 247 INFILL 201385.58 8400612.90 4347.86 14 Jun 08 23 Jun 08 Surveyed 300.05
CO 08 248 INFILL 201691.72 8400506.63 4373.40 25 Jun 08 02 Jul 08 Surveyed 310.75
CO 08 249 INFILL 201286.06 8399608.22 4216.12 25 Jun 08 11 Jul 08 Surveyed 483.00
CO 08 250 INFILL 201460.93 8399540.82 4224.30 26 Jun 08 28 Jul 08 Surveyed 417.00
CO 08 251 INFILL 201691.52 8399511.53 4257.58 30 Jun 08 08 Jul 08 Surveyed 218.95
CO 08 252 INFILL 201588.60 8400508.54 4360.59 02 Jul 08 08 Jul 08 Surveyed 300.00
CO 08 253 INFILL 201591.78 8399508.28 4240.02 09 Jul 08 09 Aug 08 Surveyed 585.50
CO 08 254 INFILL 201487.50 8400504.28 4347.42 09 Jul 08 18 Jul 08 Surveyed 306.00
CO 08 255 INFILL 201691.63 8399507.62 4257.58 09 Jul 08 28 Jul 08 Surveyed 503.60
CO 08 256 INFILL 201373.24 8399933.84 4253.25 19 Jul 08 08 Aug 08 Surveyed 310.50
CO 08 257 INFILL 201290.24 8399807.03 4233.88 20 Jul 08 07 Aug 08 Surveyed 317.60
CO 08 258 INFILL 201692.57 8399512.56 4257.53 28 Jul 08 16 Aug 08 Surveyed 403.20
CO 08 259 INFILL 201486.32 8399712.18 4263.35 31 Jul 08 10 Sep 08 Surveyed 504.85
CO 08 260 INFILL 201236.70 8400356.40 4329.42 30 Jul 08 02 Aug 08 Surveyed 271.60
CO 08 261 INFILL 201441.63 8399655.04 4244.50 08 Aug 08 15 Aug 08 Surveyed 181.50
CO 08 262 INFILL 201435.51 8399759.70 4272.11 10 Aug 08 25 Aug 08 Surveyed 244.50
CO 08 263 INFILL 201337.83 8400375.52 4346.86 13 Aug 08 02 Sep 08 Surveyed 474.15
CO 08 264 INFILL 201437.75 8400364.91 4353.77 16 Aug 08 23 Aug 08 Surveyed 182.55
CO 08 265 INFILL 201493.87 8399882.50 4270.19 17 Aug 08 02 Sep 08 Surveyed 461.85
CO 08 266 INFILL 201542.11 8400356.99 4363.18 24 Aug 08 28 Aug 08 Surveyed 175.00
CO 08 267 INFILL 201327.62 8400168.48 4298.20 26 Aug 08 15 Sep 08 Surveyed 505.80
CO 08 268 INFILL 201645.12 8400355.70 4380.30 28 Aug 08 31 Aug 08 Surveyed 192.00
CO 08 269 INFILL 201270.20 8400177.23 4303.26 28 Aug 08 19 Sep 08 Surveyed 497.30
CO 08 270 INFILL 201443.87 8400252.14 4333.06 31 Aug 08 14 Sep 08 Surveyed 495.25
CO 08 271 INFILL 201412.22 8399997.42 4278.01 03 Sep 08 16 Sep 08 Surveyed 361.70
CO 08 272 INFILL 201490.30 8399712.49 4262.92 11 Sep 08 28 Sep 08 Surveyed 458.75
CO 08 273 INFILL 201214.44 8399968.54 4249.12 15 Sep 08 19 Sep 08 Surveyed 194.85
CO 08 274 INFILL 201439.64 8400157.87 4317.56 16 Sep 08 30 Sep 08 Surveyed 387.90
CO 08 275 INFILL 201257.94 8400103.69 4280.59 17 Sep 08 07 Oct 08 Surveyed 589.00
CO 08 276 INFILL 201555.63 8399604.51 4250.10 20 Sep 08 24 Sep 08 Surveyed 160.40
CO 08 277 INFILL 201641.18 8399565.73 4253.99 25 Sep 08 09 Oct 08 Surveyed 358.70
CO 08 278 INFILL 201680.10 8399767.43 4310.45 29 Sep 08 24 Oct 08 Surveyed 615.05
CO 08 279 INFILL 201332.23 8399967.59 4258.73 01 Oct 08 20 Oct 08 Surveyed 390.25
CO 08 280 INFILL 201444.04 8399956.67 4262.98 09 Oct 08 27 Oct 08 Surveyed 449.10
CO 08 281 INFILL 201687.47 8399605.83 4270.45 09 Oct 08 08 Nov 08 Surveyed 540.90
CO 08 282 INFILL 200986.28 8400597.22 4262.56 21 Oct 08 09 Nov 08 Surveyed 300.00
CO 08 283 INFILL 201523.82 8399765.87 4282.34 25 Oct 08 15 Nov 08 Surveyed 288.00
CO 08 284 INFILL 201503.36 8399976.34 4270.50 28 Oct 08 27 Nov 08 Surveyed 570.80
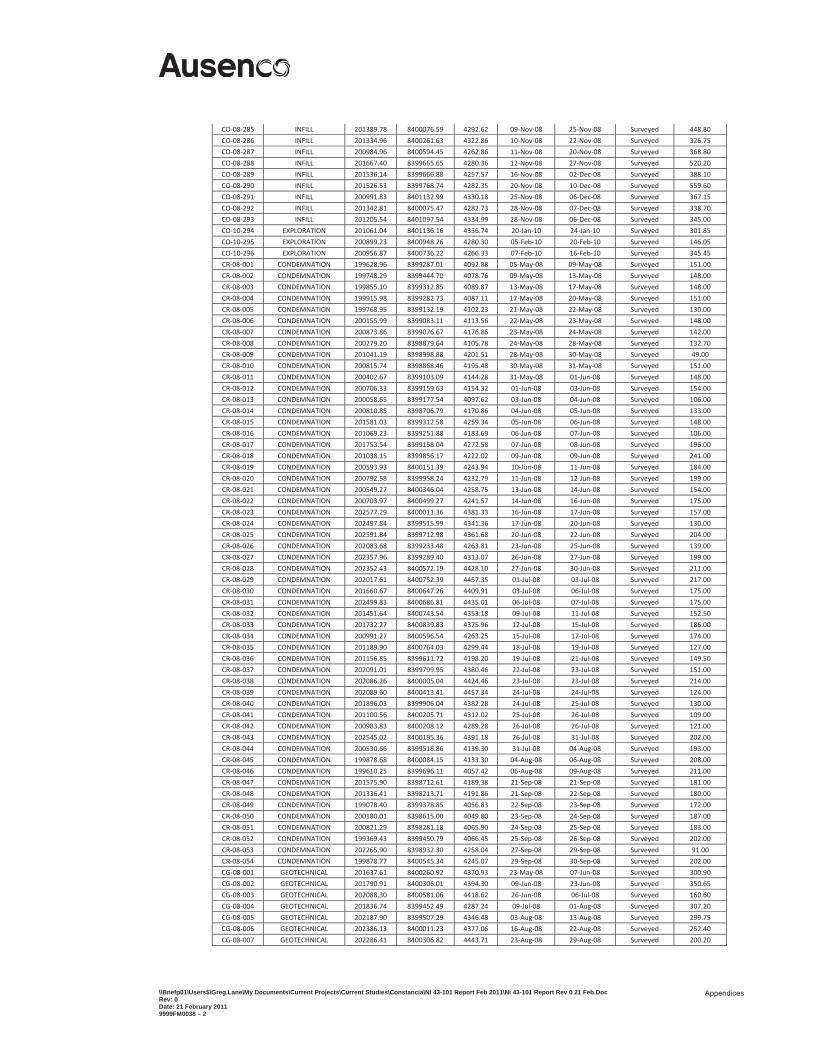
\\Bnefp01\Users$\Greg.Lane\My Documents\Current Projects\Current Studies\Constancia\Ni 43-101 Report Feb 2011\Ni 43-101 Report Rev 0 21 Feb.Doc Rev: 0 Date: 21 February 2011 9999FM0038 – 2
Appendices
CO 08 285 INFILL 201389.78 8400076.59 4292.62 09 Nov 08 25 Nov 08 Surveyed 448.80
CO 08 286 INFILL 201334.96 8400261.63 4322.86 10 Nov 08 22 Nov 08 Surveyed 326.75
CO 08 287 INFILL 200984.96 8400594.45 4262.86 11 Nov 08 20 Nov 08 Surveyed 368.80
CO 08 288 INFILL 201667.40 8399665.65 4280.36 12 Nov 08 27 Nov 08 Surveyed 520.20
CO 08 289 INFILL 201536.14 8399666.88 4257.57 16 Nov 08 02 Dec 08 Surveyed 388.10
CO 08 290 INFILL 201526.53 8399768.74 4282.35 20 Nov 08 10 Dec 08 Surveyed 559.60
CO 08 291 INFILL 200991.83 8401132.99 4330.18 25 Nov 08 06 Dec 08 Surveyed 367.15
CO 08 292 INFILL 201342.81 8400075.47 4282.73 28 Nov 08 07 Dec 08 Surveyed 338.70
CO 08 293 INFILL 201205.54 8401097.54 4334.99 28 Nov 08 06 Dec 08 Surveyed 345.00
CO 10 294 EXPLORATION 201061.04 8401136.16 4336.74 20 Jan 10 24 Jan 10 Surveyed 301.85
CO 10 295 EXPLORATION 200899.23 8400948.26 4280.30 05 Feb 10 20 Feb 10 Surveyed 146.05
CO 10 296 EXPLORATION 200956.87 8400736.22 4266.33 07 Feb 10 16 Feb 10 Surveyed 345.45
CR 08 001 CONDEMNATION 199628.96 8399287.01 4092.88 05 May 08 09 May 08 Surveyed 151.00
CR 08 002 CONDEMNATION 199748.29 8399444.70 4078.76 09 May 08 13 May 08 Surveyed 148.00
CR 08 003 CONDEMNATION 199855.10 8399312.85 4089.87 13 May 08 17 May 08 Surveyed 148.00
CR 08 004 CONDEMNATION 199915.98 8399282.73 4087.11 17 May 08 20 May 08 Surveyed 151.00
CR 08 005 CONDEMNATION 199768.95 8399132.19 4102.23 21 May 08 22 May 08 Surveyed 130.00
CR 08 006 CONDEMNATION 200155.99 8399083.11 4113.56 22 May 08 23 May 08 Surveyed 148.00
CR 08 007 CONDEMNATION 200873.86 8399076.67 4176.86 23 May 08 24 May 08 Surveyed 142.00
CR 08 008 CONDEMNATION 200279.20 8398879.64 4105.78 24 May 08 28 May 08 Surveyed 132.70
CR 08 009 CONDEMNATION 201041.19 8398998.88 4201.51 28 May 08 30 May 08 Surveyed 49.00
CR 08 010 CONDEMNATION 200815.74 8398868.46 4195.48 30 May 08 31 May 08 Surveyed 151.00
CR 08 011 CONDEMNATION 200402.67 8399103.09 4144.28 31 May 08 01 Jun 08 Surveyed 148.00
CR 08 012 CONDEMNATION 200706.33 8399159.63 4154.32 01 Jun 08 03 Jun 08 Surveyed 154.00
CR 08 013 CONDEMNATION 200058.65 8399177.54 4097.62 03 Jun 08 04 Jun 08 Surveyed 106.00
CR 08 014 CONDEMNATION 200810.85 8398706.79 4170.86 04 Jun 08 05 Jun 08 Surveyed 133.00
CR 08 015 CONDEMNATION 201581.03 8399312.58 4259.34 05 Jun 08 06 Jun 08 Surveyed 148.00
CR 08 016 CONDEMNATION 201069.23 8399251.88 4183.69 06 Jun 08 07 Jun 08 Surveyed 106.00
CR 08 017 CONDEMNATION 201753.54 8399158.04 4272.58 07 Jun 08 08 Jun 08 Surveyed 196.00
CR 08 018 CONDEMNATION 201038.15 8399856.17 4222.02 09 Jun 08 09 Jun 08 Surveyed 241.00
CR 08 019 CONDEMNATION 200593.93 8400151.39 4243.94 10 Jun 08 11 Jun 08 Surveyed 184.00
CR 08 020 CONDEMNATION 200792.58 8399958.24 4232.79 11 Jun 08 12 Jun 08 Surveyed 199.00
CR 08 021 CONDEMNATION 200549.27 8400346.04 4258.75 13 Jun 08 14 Jun 08 Surveyed 154.00
CR 08 022 CONDEMNATION 200703.97 8400499.27 4241.57 14 Jun 08 16 Jun 08 Surveyed 175.00
CR 08 023 CONDEMNATION 202577.29 8400011.36 4381.33 16 Jun 08 17 Jun 08 Surveyed 157.00
CR 08 024 CONDEMNATION 202497.84 8399515.99 4341.36 17 Jun 08 20 Jun 08 Surveyed 130.00
CR 08 025 CONDEMNATION 202591.84 8399712.98 4361.68 20 Jun 08 22 Jun 08 Surveyed 204.00
CR 08 026 CONDEMNATION 202083.68 8399233.48 4263.81 23 Jun 08 25 Jun 08 Surveyed 139.00
CR 08 027 CONDEMNATION 202357.96 8399289.40 4313.07 26 Jun 08 27 Jun 08 Surveyed 199.00
CR 08 028 CONDEMNATION 202352.43 8400572.19 4428.10 27 Jun 08 30 Jun 08 Surveyed 211.00
CR 08 029 CONDEMNATION 202017.61 8400752.39 4457.35 01 Jul 08 03 Jul 08 Surveyed 217.00
CR 08 030 CONDEMNATION 201660.67 8400647.26 4409.91 03 Jul 08 06 Jul 08 Surveyed 175.00
CR 08 031 CONDEMNATION 202499.83 8400686.81 4435.01 06 Jul 08 07 Jul 08 Surveyed 175.00
CR 08 032 CONDEMNATION 201451.64 8400743.54 4353.18 09 Jul 08 11 Jul 08 Surveyed 152.50
CR 08 033 CONDEMNATION 201732.27 8400839.83 4375.96 12 Jul 08 15 Jul 08 Surveyed 186.00
CR 08 034 CONDEMNATION 200991.27 8400596.54 4263.25 15 Jul 08 17 Jul 08 Surveyed 174.00
CR 08 035 CONDEMNATION 201189.90 8400764.03 4299.44 18 Jul 08 19 Jul 08 Surveyed 127.00
CR 08 036 CONDEMNATION 201156.85 8399611.72 4198.20 19 Jul 08 21 Jul 08 Surveyed 149.50
CR 08 037 CONDEMNATION 202091.01 8399799.95 4380.46 22 Jul 08 23 Jul 08 Surveyed 151.00
CR 08 038 CONDEMNATION 202086.26 8400005.04 4424.46 23 Jul 08 23 Jul 08 Surveyed 214.00
CR 08 039 CONDEMNATION 202089.60 8400413.41 4457.34 24 Jul 08 24 Jul 08 Surveyed 124.00
CR 08 040 CONDEMNATION 201896.03 8399906.04 4382.28 24 Jul 08 25 Jul 08 Surveyed 130.00
CR 08 041 CONDEMNATION 201100.56 8400205.71 4312.02 25 Jul 08 26 Jul 08 Surveyed 109.00
CR 08 042 CONDEMNATION 200983.83 8400208.12 4289.28 26 Jul 08 26 Jul 08 Surveyed 121.00
CR 08 043 CONDEMNATION 202545.02 8400195.36 4391.18 26 Jul 08 31 Jul 08 Surveyed 202.00
CR 08 044 CONDEMNATION 200530.66 8399518.86 4139.30 31 Jul 08 04 Aug 08 Surveyed 193.00
CR 08 045 CONDEMNATION 199878.68 8400084.15 4133.30 04 Aug 08 06 Aug 08 Surveyed 208.00
CR 08 046 CONDEMNATION 199610.25 8399696.11 4057.42 06 Aug 08 09 Aug 08 Surveyed 211.00
CR 08 047 CONDEMNATION 201575.90 8398712.61 4189.38 21 Sep 08 21 Sep 08 Surveyed 181.00
CR 08 048 CONDEMNATION 201336.41 8398213.71 4191.86 21 Sep 08 22 Sep 08 Surveyed 180.00
CR 08 049 CONDEMNATION 199078.40 8399378.85 4056.83 22 Sep 08 23 Sep 08 Surveyed 172.00
CR 08 050 CONDEMNATION 200180.01 8398615.00 4049.80 23 Sep 08 24 Sep 08 Surveyed 187.00
CR 08 051 CONDEMNATION 200821.29 8398281.18 4065.90 24 Sep 08 25 Sep 08 Surveyed 183.00
CR 08 052 CONDEMNATION 199369.43 8399450.79 4066.45 25 Sep 08 26 Sep 08 Surveyed 202.00
CR 08 053 CONDEMNATION 202265.90 8398932.30 4258.04 27 Sep 08 29 Sep 08 Surveyed 91.00
CR 08 054 CONDEMNATION 199878.77 8400545.34 4245.07 29 Sep 08 30 Sep 08 Surveyed 202.00
CG 08 001 GEOTECHNICAL 201637.61 8400260.92 4370.93 23 May 08 07 Jun 08 Surveyed 300.90
CG 08 002 GEOTECHNICAL 201790.91 8400306.01 4394.30 09 Jun 08 23 Jun 08 Surveyed 350.65
CG 08 003 GEOTECHNICAL 202088.30 8400581.06 4418.62 26 Jun 08 06 Jul 08 Surveyed 160.60
CG 08 004 GEOTECHNICAL 201836.74 8399452.49 4287.24 09 Jul 08 01 Aug 08 Surveyed 307.20
CG 08 005 GEOTECHNICAL 202187.90 8399507.29 4346.48 03 Aug 08 13 Aug 08 Surveyed 299.75
CG 08 006 GEOTECHNICAL 202386.13 8400011.23 4377.06 16 Aug 08 22 Aug 08 Surveyed 252.40
CG 08 007 GEOTECHNICAL 202286.41 8400306.82 4443.71 23 Aug 08 29 Aug 08 Surveyed 200.20
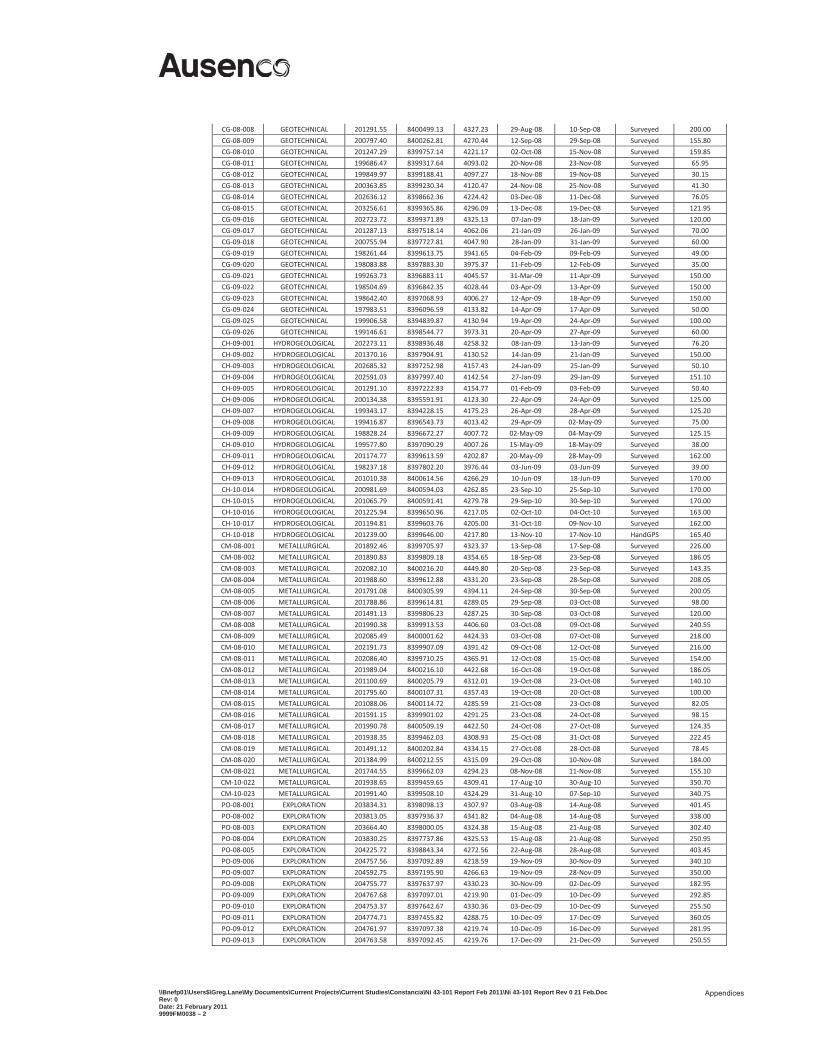
\\Bnefp01\Users$\Greg.Lane\My Documents\Current Projects\Current Studies\Constancia\Ni 43-101 Report Feb 2011\Ni 43-101 Report Rev 0 21 Feb.Doc Rev: 0 Date: 21 February 2011 9999FM0038 – 2
Appendices
CG 08 008 GEOTECHNICAL 201291.55 8400499.13 4327.23 29 Aug 08 10 Sep 08 Surveyed 200.00
CG 08 009 GEOTECHNICAL 200797.40 8400262.81 4270.44 12 Sep 08 29 Sep 08 Surveyed 155.80
CG 08 010 GEOTECHNICAL 201247.29 8399757.14 4221.17 02 Oct 08 15 Nov 08 Surveyed 159.85
CG 08 011 GEOTECHNICAL 199686.47 8399317.64 4093.02 20 Nov 08 23 Nov 08 Surveyed 65.95
CG 08 012 GEOTECHNICAL 199849.97 8399188.41 4097.27 18 Nov 08 19 Nov 08 Surveyed 30.15
CG 08 013 GEOTECHNICAL 200363.85 8399230.34 4120.47 24 Nov 08 25 Nov 08 Surveyed 41.30
CG 08 014 GEOTECHNICAL 202636.12 8398662.36 4224.42 03 Dec 08 11 Dec 08 Surveyed 76.05
CG 08 015 GEOTECHNICAL 203256.61 8399365.86 4296.09 13 Dec 08 19 Dec 08 Surveyed 121.95
CG 09 016 GEOTECHNICAL 202723.72 8399371.89 4325.13 07 Jan 09 18 Jan 09 Surveyed 120.00
CG 09 017 GEOTECHNICAL 201287.13 8397518.14 4062.06 21 Jan 09 26 Jan 09 Surveyed 70.00
CG 09 018 GEOTECHNICAL 200755.94 8397727.81 4047.90 28 Jan 09 31 Jan 09 Surveyed 60.00
CG 09 019 GEOTECHNICAL 198261.44 8399613.75 3941.65 04 Feb 09 09 Feb 09 Surveyed 49.00
CG 09 020 GEOTECHNICAL 198083.88 8397883.30 3975.37 11 Feb 09 12 Feb 09 Surveyed 35.00
CG 09 021 GEOTECHNICAL 199263.73 8396883.11 4045.57 31 Mar 09 11 Apr 09 Surveyed 150.00
CG 09 022 GEOTECHNICAL 198504.69 8396842.35 4028.44 03 Apr 09 13 Apr 09 Surveyed 150.00
CG 09 023 GEOTECHNICAL 198642.40 8397068.93 4006.27 12 Apr 09 18 Apr 09 Surveyed 150.00
CG 09 024 GEOTECHNICAL 197983.51 8396096.59 4133.82 14 Apr 09 17 Apr 09 Surveyed 50.00
CG 09 025 GEOTECHNICAL 199906.58 8394839.87 4130.94 19 Apr 09 24 Apr 09 Surveyed 100.00
CG 09 026 GEOTECHNICAL 199146.61 8398544.77 3973.31 20 Apr 09 27 Apr 09 Surveyed 60.00
CH 09 001 HYDROGEOLOGICAL 202273.11 8398936.48 4258.32 08 Jan 09 13 Jan 09 Surveyed 76.20
CH 09 002 HYDROGEOLOGICAL 201370.16 8397904.91 4130.52 14 Jan 09 21 Jan 09 Surveyed 150.00
CH 09 003 HYDROGEOLOGICAL 202685.32 8397252.98 4157.43 24 Jan 09 25 Jan 09 Surveyed 50.10
CH 09 004 HYDROGEOLOGICAL 202591.03 8397997.40 4142.54 27 Jan 09 29 Jan 09 Surveyed 151.10
CH 09 005 HYDROGEOLOGICAL 201291.10 8397222.83 4154.77 01 Feb 09 03 Feb 09 Surveyed 50.40
CH 09 006 HYDROGEOLOGICAL 200134.38 8395591.91 4123.30 22 Apr 09 24 Apr 09 Surveyed 125.00
CH 09 007 HYDROGEOLOGICAL 199343.17 8394228.15 4175.23 26 Apr 09 28 Apr 09 Surveyed 125.20
CH 09 008 HYDROGEOLOGICAL 199416.87 8396543.73 4013.42 29 Apr 09 02 May 09 Surveyed 75.00
CH 09 009 HYDROGEOLOGICAL 198828.24 8396672.27 4007.72 02 May 09 04 May 09 Surveyed 125.15
CH 09 010 HYDROGEOLOGICAL 199577.80 8397090.29 4007.26 15 May 09 18 May 09 Surveyed 38.00
CH 09 011 HYDROGEOLOGICAL 201174.77 8399613.59 4202.87 20 May 09 28 May 09 Surveyed 162.00
CH 09 012 HYDROGEOLOGICAL 198237.18 8397802.20 3976.44 03 Jun 09 03 Jun 09 Surveyed 39.00
CH 09 013 HYDROGEOLOGICAL 201010.38 8400614.56 4266.29 10 Jun 09 18 Jun 09 Surveyed 170.00
CH 10 014 HYDROGEOLOGICAL 200981.69 8400594.03 4262.85 23 Sep 10 25 Sep 10 Surveyed 170.00
CH 10 015 HYDROGEOLOGICAL 201065.79 8400591.41 4279.78 29 Sep 10 30 Sep 10 Surveyed 170.00
CH 10 016 HYDROGEOLOGICAL 201225.94 8399650.96 4217.05 02 Oct 10 04 Oct 10 Surveyed 163.00
CH 10 017 HYDROGEOLOGICAL 201194.81 8399603.76 4205.00 31 Oct 10 09 Nov 10 Surveyed 162.00
CH 10 018 HYDROGEOLOGICAL 201239.00 8399646.00 4217.80 13 Nov 10 17 Nov 10 HandGPS 165.40
CM 08 001 METALLURGICAL 201892.46 8399705.97 4323.37 13 Sep 08 17 Sep 08 Surveyed 226.00
CM 08 002 METALLURGICAL 201890.83 8399809.18 4354.65 18 Sep 08 23 Sep 08 Surveyed 186.05
CM 08 003 METALLURGICAL 202082.10 8400216.20 4449.80 20 Sep 08 23 Sep 08 Surveyed 143.35
CM 08 004 METALLURGICAL 201988.60 8399612.88 4331.20 23 Sep 08 28 Sep 08 Surveyed 208.05
CM 08 005 METALLURGICAL 201791.08 8400305.99 4394.11 24 Sep 08 30 Sep 08 Surveyed 200.05
CM 08 006 METALLURGICAL 201788.86 8399614.81 4289.05 29 Sep 08 03 Oct 08 Surveyed 98.00
CM 08 007 METALLURGICAL 201491.13 8399806.23 4287.25 30 Sep 08 03 Oct 08 Surveyed 120.00
CM 08 008 METALLURGICAL 201990.38 8399913.53 4406.60 03 Oct 08 09 Oct 08 Surveyed 240.55
CM 08 009 METALLURGICAL 202085.49 8400001.62 4424.33 03 Oct 08 07 Oct 08 Surveyed 218.00
CM 08 010 METALLURGICAL 202191.73 8399907.09 4391.42 09 Oct 08 12 Oct 08 Surveyed 216.00
CM 08 011 METALLURGICAL 202086.40 8399710.25 4365.91 12 Oct 08 15 Oct 08 Surveyed 154.00
CM 08 012 METALLURGICAL 201989.04 8400216.10 4422.68 16 Oct 08 19 Oct 08 Surveyed 186.05
CM 08 013 METALLURGICAL 201100.69 8400205.79 4312.01 19 Oct 08 23 Oct 08 Surveyed 140.10
CM 08 014 METALLURGICAL 201795.60 8400107.31 4357.43 19 Oct 08 20 Oct 08 Surveyed 100.00
CM 08 015 METALLURGICAL 201088.06 8400114.72 4285.59 21 Oct 08 23 Oct 08 Surveyed 82.05
CM 08 016 METALLURGICAL 201591.15 8399901.02 4291.25 23 Oct 08 24 Oct 08 Surveyed 98.15
CM 08 017 METALLURGICAL 201990.78 8400509.19 4422.50 24 Oct 08 27 Oct 08 Surveyed 124.35
CM 08 018 METALLURGICAL 201938.35 8399462.03 4308.93 25 Oct 08 31 Oct 08 Surveyed 222.45
CM 08 019 METALLURGICAL 201491.12 8400202.84 4334.15 27 Oct 08 28 Oct 08 Surveyed 78.45
CM 08 020 METALLURGICAL 201384.99 8400212.55 4315.09 29 Oct 08 10 Nov 08 Surveyed 184.00
CM 08 021 METALLURGICAL 201744.55 8399662.03 4294.23 08 Nov 08 11 Nov 08 Surveyed 155.10
CM 10 022 METALLURGICAL 201938.65 8399459.65 4309.41 17 Aug 10 30 Aug 10 Surveyed 350.70
CM 10 023 METALLURGICAL 201991.40 8399508.10 4324.29 31 Aug 10 07 Sep 10 Surveyed 340.75
PO 08 001 EXPLORATION 203834.31 8398098.13 4307.97 03 Aug 08 14 Aug 08 Surveyed 401.45
PO 08 002 EXPLORATION 203813.05 8397936.37 4341.82 04 Aug 08 14 Aug 08 Surveyed 338.00
PO 08 003 EXPLORATION 203664.40 8398000.05 4324.38 15 Aug 08 21 Aug 08 Surveyed 302.40
PO 08 004 EXPLORATION 203830.25 8397737.86 4325.53 15 Aug 08 21 Aug 08 Surveyed 250.95
PO 08 005 EXPLORATION 204225.72 8398843.34 4272.56 22 Aug 08 28 Aug 08 Surveyed 403.45
PO 09 006 EXPLORATION 204757.56 8397092.89 4218.59 19 Nov 09 30 Nov 09 Surveyed 340.10
PO 09 007 EXPLORATION 204592.75 8397195.90 4266.63 19 Nov 09 28 Nov 09 Surveyed 350.00
PO 09 008 EXPLORATION 204755.77 8397637.97 4330.23 30 Nov 09 02 Dec 09 Surveyed 182.95
PO 09 009 EXPLORATION 204767.68 8397097.01 4219.90 01 Dec 09 10 Dec 09 Surveyed 292.85
PO 09 010 EXPLORATION 204753.37 8397642.67 4330.36 03 Dec 09 10 Dec 09 Surveyed 255.50
PO 09 011 EXPLORATION 204774.71 8397455.82 4288.75 10 Dec 09 17 Dec 09 Surveyed 360.05
PO 09 012 EXPLORATION 204761.97 8397097.38 4219.74 10 Dec 09 16 Dec 09 Surveyed 281.95
PO 09 013 EXPLORATION 204763.58 8397092.45 4219.76 17 Dec 09 21 Dec 09 Surveyed 250.55
\\Bnefp01\Users$\Greg.Lane\My Documents\Current Projects\Current Studies\Constancia\Ni 43-101 Report Feb 2011\Ni 43-101 Report Rev 0 21 Feb.Doc Rev: 0 Date: 21 February 2011 9999FM0038 – 2
Appendices
PO 09 014 EXPLORATION 204780.70 8397446.82 4287.74 18 Dec 09 22 Dec 09 Surveyed 365.00
PO 10 015 EXPLORATION 204801.26 8397198.53 4224.48 29 Jun 10 03 Aug 10 Surveyed 366.45
PO 10 016 EXPLORATION 204800.73 8397201.79 4224.52 08 Aug 10 30 Aug 10 Surveyed 400.15
PO 10 017 EXPLORATION 204727.38 8397206.09 4252.59 09 Aug 10 26 Aug 10 Surveyed 389.75
PO 10 018 EXPLORATION 204493.77 8397726.30 4275.66 27 Aug 10 06 Sep 10 Surveyed 321.55
PO 10 019 EXPLORATION 204731.09 8397205.70 4252.19 01 Sep 10 11 Sep 10 Surveyed 274.60
PO 10 020 EXPLORATION 204587.51 8397066.95 4223.94 08 Sep 10 15 Sep 10 Surveyed 255.35
PO 10 021 EXPLORATION 204764.40 8397336.32 4267.81 09 Sep 10 15 Sep 10 Surveyed 336.65
PO 10 022 EXPLORATION 204672.91 8396957.64 4171.67 13 Sep 10 21 Sep 10 Surveyed 156.80
PO 10 023 EXPLORATION 204841.60 8397506.84 4289.56 15 Sep 10 19 Sep 10 Surveyed 196.65
PO 10 024 EXPLORATION 204586.27 8397062.26 4223.50 15 Sep 10 21 Sep 10 Surveyed 177.70
PO 10 025 EXPLORATION 204975.11 8397291.60 4247.15 21 Sep 10 26 Sep 10 Surveyed 196.85
PO 10 026 EXPLORATION 204955.34 8397171.53 4198.70 23 Sep 10 29 Sep 10 Surveyed 281.20
PO 10 027 EXPLORATION 204674.50 8396955.77 4171.47 25 Sep 10 01 Oct 10 Surveyed 151.20
PO 10 028 EXPLORATION 204848.95 8397313.60 4228.77 26 Sep 10 30 Sep 10 Surveyed 258.75
PO 10 029 EXPLORATION 204960.91 8397173.68 4198.52 29 Sep 10 07 Oct 10 Surveyed 149.60
PO 10 030 EXPLORATION 204829.41 8397676.55 4343.66 03 Oct 10 06 Oct 10 Surveyed 199.75
PO 10 031 EXPLORATION 204685.75 8397066.23 4221.97 05 Oct 10 14 Oct 10 Surveyed 283.80
PO 10 032 EXPLORATION 204831.22 8397676.98 4344.84 07 Oct 10 15 Oct 10 Surveyed 170.55
PO 10 033 EXPLORATION 204839.97 8397410.71 4260.60 08 Oct 10 11 Oct 10 Surveyed 203.50
PO 10 034 EXPLORATION 204837.81 8397148.73 4202.24 12 Oct 10 20 Oct 10 Surveyed 87.05
PO 10 035 EXPLORATION 204685.39 8397067.85 4222.12 16 Oct 10 27 Oct 10 Surveyed 237.40
PO 10 036 EXPLORATION 203957.81 8397527.44 4236.59 16 Oct 10 24 Oct 10 Surveyed 399.50
PO 10 037 EXPLORATION 204829.75 8397181.97 4210.79 22 Oct 10 28 Oct 10 Surveyed 250.20
PO 10 038 EXPLORATION 204518.55 8397082.75 4220.76 29 Oct 10 03 Nov 10 Surveyed 191.00
PO 10 039 EXPLORATION 204517.22 8397081.90 4221.46 05 Nov 10 09 Nov 10 Surveyed 149.25
PO 10 040 EXPLORATION 204793.00 8397014.00 4178.20 12 Nov 10 18 Nov 10 HandGPS 137.25
PO 10 041 EXPLORATION 204671.81 8397308.07 4295.11 19 Nov 10 01 Dec 10 Surveyed 345.80
PO 10 042 EXPLORATION 204783.21 8397020.67 4183.46 20 Nov 10 23 Nov 10 Surveyed 132.45
PO 10 043 EXPLORATION 204843.00 8397056.00 4182.10 25 Nov 10 04 Dec 10 HandGPS 259.85
PO 10 044 EXPLORATION 204901.00 8397223.00 4202.80 05 Dec 10 12 Dec 10 HandGPS 308.05
PO 10 045 EXPLORATION 204846.00 8397055.00 4182.10 07 Dec 10 17 Dec 10 HandGPS 311.00
PO 10 046 EXPLORATION 203976.00 8397521.00 4229.80 11 Dec 10 20 Dec 10 HandGPS 475.40
PO 11 047 EXPLORATION 204,638.00 8,397,501.00 4,319.30 06 Jan 11 being drilled HandGPS 133.25
PR 08 001 EXPLORATION 204210.51 8397997.24 4335.94 09 Aug 08 10 Aug 08 Surveyed 300.00
PR 08 002 EXPLORATION 205174.78 8398580.47 4369.46 11 Aug 08 14 Aug 08 Surveyed 286.50
PR 08 003 EXPLORATION 205348.33 8398201.47 4327.45 14 Aug 08 17 Aug 08 Surveyed 255.00
PR 08 004 EXPLORATION 205018.59 8398932.04 4317.75 17 Aug 08 18 Aug 08 Surveyed 240.00
PR 08 005 EXPLORATION 203565.07 8397593.69 4274.53 18 Aug 08 20 Aug 08 Surveyed 216.00
PR 08 006 EXPLORATION 203440.72 8397435.86 4232.96 21 Aug 08 22 Aug 08 Surveyed 261.00
PR 08 007 EXPLORATION 204976.12 8397586.61 4318.22 23 Aug 08 26 Aug 08 Surveyed 241.50
PR 08 008 EXPLORATION 204732.84 8397202.15 4252.32 26 Aug 08 31 Aug 08 Surveyed 289.50
PR 08 009 EXPLORATION 204252.12 8397020.71 4201.66 31 Aug 08 02 Sep 08 Surveyed 270.00
PR 08 010 EXPLORATION 204619.97 8397605.70 4302.92 02 Sep 08 05 Sep 08 Surveyed 301.50
PR 08 011 EXPLORATION 204622.01 8397599.97 4303.58 06 Sep 08 11 Sep 08 Surveyed 303.00
PR 08 012 EXPLORATION 204730.85 8397211.64 4252.59 11 Sep 08 15 Sep 08 Surveyed 298.50
PR 08 013 EXPLORATION 204244.38 8397023.11 4200.81 15 Sep 08 16 Sep 08 Surveyed 300.00
PR 08 014 EXPLORATION 204601.57 8397196.69 4268.12 17 Sep 08 18 Sep 08 Surveyed 217.50
PR 08 015 EXPLORATION 203841.81 8397192.37 4193.86 18 Sep 08 19 Sep 08 Surveyed 261.00
PR 10 016 EXPLORATION 204329.97 8397708.59 4247.33 21 Aug 10 22 Aug 10 Surveyed 280.00
PR 10 017 EXPLORATION 204258.74 8397501.85 4206.80 23 Aug 10 24 Aug 10 Surveyed 250.00
PR 10 018 EXPLORATION 204175.04 8397240.25 4175.45 25 Aug 10 26 Aug 10 Surveyed 250.00
PR 10 019 EXPLORATION 204027.20 8397093.07 4133.94 27 Aug 10 28 Aug 10 Surveyed 202.00
PR 10 020 EXPLORATION 204354.10 8397130.82 4233.40 29 Aug 10 29 Aug 10 Surveyed 166.00
PR 10 021 EXPLORATION 203829.03 8397023.36 4140.39 30 Aug 10 31 Aug 10 Surveyed 277.00
PR 10 022 EXPLORATION 203581.26 8397731.67 4278.23 01 Sep 10 02 Sep 10 Surveyed 193.00
PR 10 023 EXPLORATION 203332.65 8397258.82 4172.86 02 Sep 10 04 Sep 10 Surveyed 250.00
PR 10 024 EXPLORATION 203965.48 8397524.47 4236.87 05 Sep 10 07 Sep 10 Surveyed 202.00
PR 10 025 EXPLORATION 204676.12 8397408.53 4316.72 07 Sep 10 10 Sep 10 Surveyed 349.00
PR 10 026 EXPLORATION 204405.88 8397805.57 4275.11 10 Sep 10 11 Sep 10 Surveyed 199.00
PR 10 027 EXPLORATION 205086.83 8398965.84 4325.80 17 Sep 10 17 Sep 10 Surveyed 202.00
PR 10 028 EXPLORATION 204918.17 8397513.59 4295.95 18 Sep 10 19 Sep 10 Surveyed 229.00
SO 10 001 EXPLORATION 201196.87 8394889.99 4108.66 24 Jun 10 06 Jul 10 Surveyed 371.60
SO 10 002 EXPLORATION 201277.90 8394781.43 4122.68 25 Jun 10 07 Jul 10 Surveyed 436.90
SO 10 003 EXPLORATION 201407.83 8394775.09 4106.92 07 Jul 10 11 Jul 10 Surveyed 352.30
SO 10 004 EXPLORATION 201124.14 8393908.07 4165.29 09 Jul 10 21 Jul 10 Surveyed 401.55
SO 10 005 EXPLORATION 202659.49 8394819.24 4078.49 12 Jul 10 21 Jul 10 Surveyed 410.75
SO 10 006 EXPLORATION 202866.10 8394786.35 4084.33 22 Jul 10 31 Jul 10 Surveyed 503.55
SO 10 007 EXPLORATION 201160.20 8393566.56 4148.34 22 Jul 10 07 Aug 10 Surveyed 432.25
SO 10 008 EXPLORATION 202913.12 8394537.58 4086.23 02 Aug 10 15 Aug 10 Surveyed 558.45
SO 10 009 EXPLORATION 202634.66 8396112.71 4115.66 25 Oct 10 03 Nov 10 Surveyed 274.15
SO 10 010 EXPLORATION 202637.04 8396107.92 4116.04 03 Nov 10 06 Nov 10 Surveyed 228.65
SO 10 011 EXPLORATION 202628.85 8396108.77 4115.55 07 Nov 10 11 Nov 10 Surveyed 220.50
\\Bnefp01\Users$\Greg.Lane\My Documents\Current Projects\Current Studies\Constancia\Ni 43-101 Report Feb 2011\Ni 43-101 Report Rev 0 21 Feb.Doc Rev: 0 Date: 21 February 2011 9999FM0038 – 2
Appendices
SO 10 012 EXPLORATION 202938.23 8394359.37 4078.79 13 Nov 10 23 Nov 10 Surveyed 460.65
SO 10 013 EXPLORATION 202755.93 8395991.45 4123.77 23 Nov 10 27 Nov 10 Surveyed 248.20
SO 10 014 EXPLORATION 202624.00 8396230.00 4112.70 24 Nov 10 30 Nov 10 HandGPS 289.80
SO 10 015 EXPLORATION 202668.68 8394460.69 4065.59 25 Nov 10 04 Dec 10 Surveyed 482.85
SO 10 016 EXPLORATION 202766.00 8395985.00 4121.60 27 Nov 10 30 Nov 10 HandGPS 209.40
SO 10 017 EXPLORATION 202627.00 8396228.00 4112.70 30 Nov 10 08 Dec 10 HandGPS 452.20
SO 10 018 EXPLORATION 202760.10 8395993.64 4123.64 01 Dec 10 04 Dec 10 Surveyed 224.30
SO 10 019 EXPLORATION 202387.00 8395779.00 4118.10 04 Dec 10 09 Dec 10 HandGPS 280.75
SO 10 020 EXPLORATION 203128.00 8394624.00 4113.20 06 Dec 10 15 Dec 10 HandGPS 264.75
SO 10 021 EXPLORATION 201842.00 8394723.00 4085.50 10 Dec 10 being drilled HandGPS 719.40
SR 10 001 EXPLORATION 201332.24 8395065.95 4082.00 08 Jul 10 11 Jul 10 Surveyed 250.00
SR 10 002 EXPLORATION 200952.73 8394562.64 4081.06 12 Jul 10 18 Jul 10 Surveyed 298.00
SR 10 003 EXPLORATION 201450.33 8393751.75 4116.11 18 Jul 10 19 Jul 10 Surveyed 349.00
SR 10 004 EXPLORATION 200473.60 8393929.54 4097.21 20 Jul 10 24 Jul 10 Surveyed 127.00
SR 10 005 EXPLORATION 202379.80 8394907.16 4057.24 25 Jul 10 26 Jul 10 Surveyed 331.00
SR 10 006 EXPLORATION 202209.70 8395043.97 4052.60 30 Jul 10 03 Aug 10 Surveyed 334.00
SR 10 007 EXPLORATION 203605.02 8394964.98 4109.12 04 Aug 10 07 Aug 10 Surveyed 325.00
SR 10 008 EXPLORATION 203289.32 8394875.57 4081.41 08 Aug 10 09 Aug 10 Surveyed 349.00
SR 10 009 EXPLORATION 202285.49 8394460.16 4082.65 10 Aug 10 14 Aug 10 Surveyed 349.00
SR 10 010 EXPLORATION 202755.93 8395993.55 4123.63 14 Aug 10 16 Aug 10 Surveyed 283.00
SR 10 011 EXPLORATION 202617.76 8396246.46 4110.91 17 Aug 10 18 Aug 10 Surveyed 310.00
SR 10 012 EXPLORATION 204181.84 8396237.23 4186.84 19 Aug 10 20 Aug 10 Surveyed 217.00
SR 10 013 EXPLORATION 202634.52 8396114.37 4114.99 11 Sep 10 13 Sep 10 Surveyed 271.00
SR 10 014 EXPLORATION 202673.60 8396430.42 4089.58 14 Sep 10 16 Sep 10 Surveyed 349.00
UO 10 001 EXPLORATION 198569.76 8401864.56 4102.96 08 Jan 10 14 Jan 10 Surveyed 257.55
UO 10 002 EXPLORATION 198455.33 8401920.15 4102.26 19 Jan 10 24 Jan 10 Surveyed 225.45
UO 10 003 EXPLORATION 198502.81 8401728.32 4104.99 15 Jan 10 19 Jan 10 Surveyed 300.45
CO008 RIO TINTO 202196.38 8399852.20 4384.30 15 Feb 04 26 Feb 04 Surveyed 321.50
CO009 RIO TINTO 201781.76 8400351.58 4402.82 04 Apr 04 11 Apr 04 Surveyed 391.00
CO010 RIO TINTO 202211.65 8400169.20 4438.36 12 Apr 04 20 Apr 04 Surveyed 358.00
CO011 RIO TINTO 201037.14 8400265.48 4303.51 18 Apr 04 28 Apr 04 Surveyed 187.30
CO012 RIO TINTO 201824.69 8399881.36 4366.08 20 Apr 04 05 Dec 04 Surveyed 443.00
CO013 RIO TINTO 201308.45 8400311.60 4334.76 29 Apr 04 15 May 04 Surveyed 321.15
CO014 RIO TINTO 202468.58 8400074.40 4374.96 16 May 04 19 May 04 Surveyed 277.30
CO015 RIO TINTO 200739.96 8400309.28 4270.42 16 May 04 29 May 04 Surveyed 410.00
CO016 RIO TINTO 202461.41 8399700.28 4336.89 19 May 04 27 May 04 Surveyed 314.75
CO017 RIO TINTO 201676.02 8399836.84 4327.52 29 May 04 18 Jun 04 Surveyed 481.00
CO017A RIO TINTO 201676.86 8399836.72 4327.45 28 May 04 29 May 04 Surveyed 22.15
CO018 RIO TINTO 201215.63 8400626.03 4307.48 30 May 04 07 Jun 04 Surveyed 268.70
CO019 RIO TINTO 201939.06 8399402.05 4315.13 18 Jun 04 27 Jun 04 Surveyed 134.20
CO020 RIO TINTO 201349.38 8399370.99 4211.69 28 Jun 04 09 Jul 04 Surveyed 325.20
CO021 RIO TINTO 201190.27 8401186.52 4360.98 12 Jul 04 19 Jul 04 Surveyed 280.00
CO022 RIO TINTO 201986.49 8400514.61 4422.01 19 Jul 04 30 Jul 04 Surveyed 303.15
CS001 RIO TINTO 204095.73 8401011.18 4411.96 31 Jul 04 06 Aug 04 Surveyed 357.30
KA001 RIO TINTO 202063.78 8400346.32 4465.75 16 Dec 03 22 Dec 03 Surveyed 352.40
KA002 RIO TINTO 202492.47 8400408.32 4434.43 16 Dec 03 21 Dec 03 Surveyed 233.70
KA003 RIO TINTO 202210.60 8400734.59 4427.40 21 Dec 03 26 Dec 03 Surveyed 307.25
KA004 RIO TINTO 201932.34 8399648.50 4317.95 23 Dec 03 28 Dec 03 Surveyed 301.80
KA005 RIO TINTO 202194.43 8399850.19 4384.29 08 Jan 04 16 Jan 04 Surveyed 401.50
KA006 RIO TINTO 202015.53 8400014.65 4436.13 16 Jan 04 29 Jan 04 Surveyed 373.75
KA007 RIO TINTO 202288.57 8399323.39 4323.59 30 Jan 04 11 Feb 04 Surveyed 318.05