Embed Size (px)
Citation preview
RevisionRevision
Lecture 11Lecture 11
B405F Advanced Management AccountingB405F Advanced Management Accounting

2
Five-Step Decision ProcessFive-Step Decision Process
1 Gathering informationGathering information2 Making predictionsMaking predictions3 Choosing an alternativeChoosing an alternative4 Implementing the decisionImplementing the decision5 Evaluating performanceEvaluating performance
3
The Meaning of RelevanceThe Meaning of Relevance
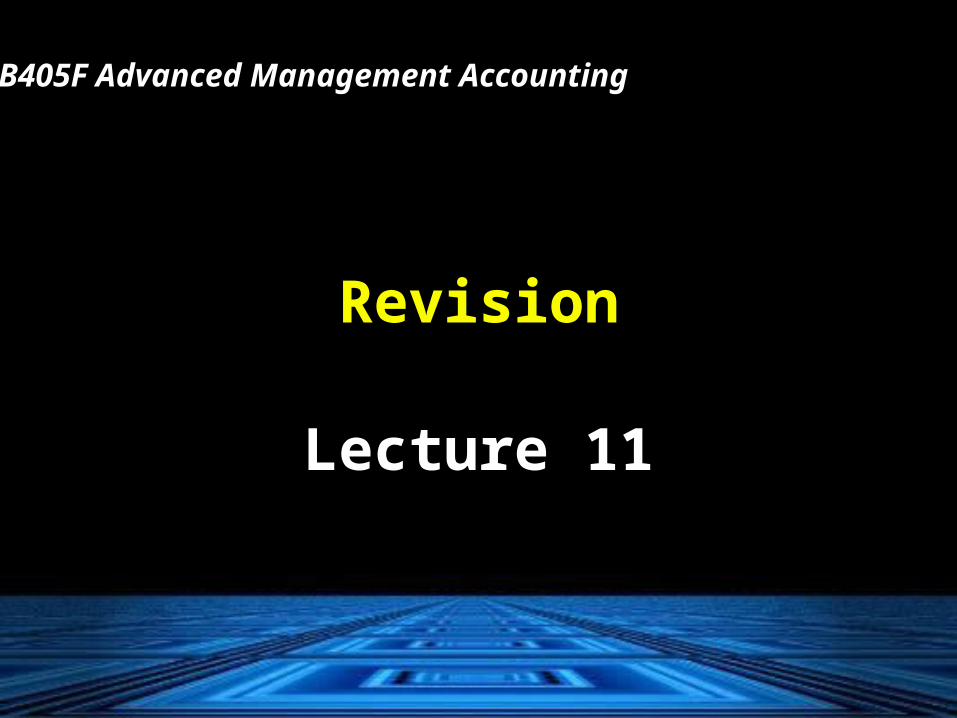
Relevant costs and relevant revenues are Relevant costs and relevant revenues are expected expected futurefuture costs and revenues that costs and revenues that differdiffer among alternative courses of action.among alternative courses of action.
Sunk costsSunk costs are irrelevant because they are are irrelevant because they are past past costscosts..
Common fixed costsCommon fixed costs are irrelevant because are irrelevant because they are they are non-differential costsnon-differential costs..

4
Quantitative and Qualitative Quantitative and Qualitative Relevant InformationRelevant Information
Quantitative factorsQuantitative factors are outcomes that are are outcomes that are measured in numerical terms:measured in numerical terms:– FinancialFinancial– NonfinancialNonfinancial
Qualitative factorsQualitative factors are outcomes that cannot are outcomes that cannot be measured in numerical terms:be measured in numerical terms:– NonfinancialNonfinancial

5
One-Time-Only Special OrderOne-Time-Only Special Order
Decision criteria: Decision criteria:
Accept the order if the revenue differential Accept the order if the revenue differential is greater than the cost differential.is greater than the cost differential.

6
Make or Buy DecisionMake or Buy Decision
Opportunity costsOpportunity costs are not recorded in formal are not recorded in formal accounting records since they do not generate accounting records since they do not generate cash outlays. cash outlays.
These costs also are not ordinarily These costs also are not ordinarily incorporated into incorporated into formal reportsformal reports..
7
Product-Mix Decisions Under Product-Mix Decisions Under Capacity ConstraintsCapacity Constraints
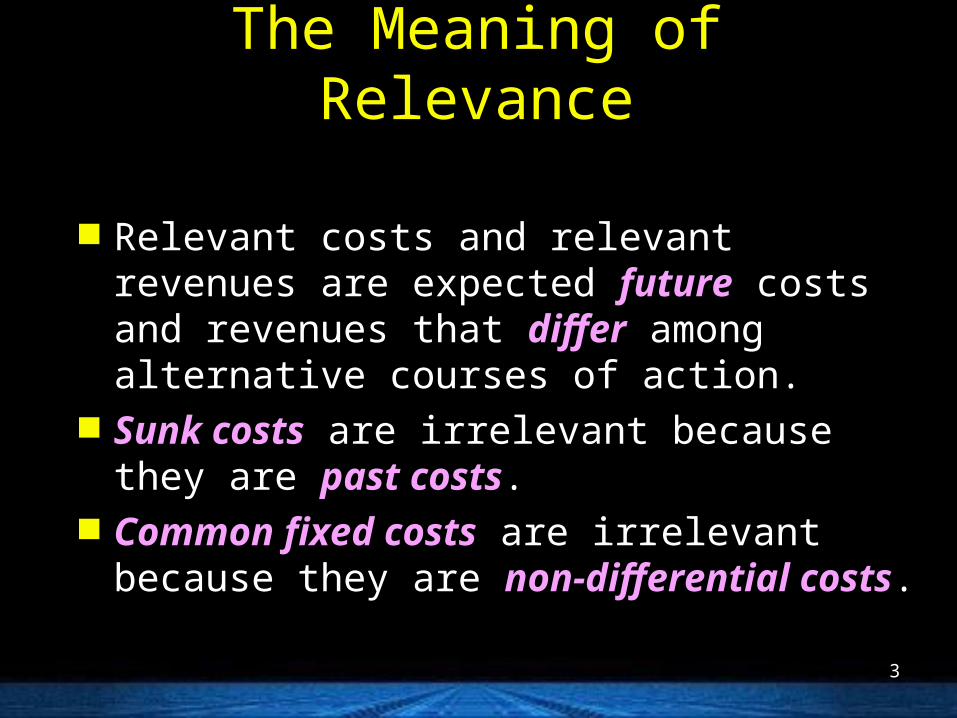
Decision criteria:Decision criteria: Aim for the highest contribution margin per Aim for the highest contribution margin per unit of the constraining factor.unit of the constraining factor.
When When multiple constraintsmultiple constraints exist, optimization exist, optimization techniques such as techniques such as linear programminglinear programming can be can be used in making decisions.used in making decisions.
8
Equipment ReplacementEquipment Replacement
The book value of existing equipment is The book value of existing equipment is irrelevant since it is neither a future cost nor irrelevant since it is neither a future cost nor does it differ among any alternatives (does it differ among any alternatives (sunk sunk costs never differcosts never differ).).
9
Decisions and Performance Decisions and Performance EvaluationEvaluation
Managers often behave consistent with their short-run Managers often behave consistent with their short-run interests and favor the alternative that yields best interests and favor the alternative that yields best performance measures in the short run.performance measures in the short run.
When conflicting decisions are generated, managers When conflicting decisions are generated, managers tend to favor the performance evaluation model.tend to favor the performance evaluation model.
Top management faces a challenge – that is, making Top management faces a challenge – that is, making sure that the sure that the performance-evaluation modelperformance-evaluation model of of subordinate managers is subordinate managers is consistent with the decision consistent with the decision modelmodel..

10
Time Horizon of Time Horizon of Pricing DecisionsPricing Decisions
Two key differences when pricing for the Two key differences when pricing for the long run relative to the short run:long run relative to the short run:
1 Costs that are often Costs that are often irrelevant for short-runirrelevant for short-run pricing decisions (fixed costs) are often pricing decisions (fixed costs) are often relevant in the long runrelevant in the long run..
2 Profit margins in long-run pricing decisions Profit margins in long-run pricing decisions are often set to earn a reasonable return on are often set to earn a reasonable return on investment.investment.
11
Alternative Long-Run Alternative Long-Run Pricing ApproachesPricing Approaches
– Market-basedMarket-based– Cost-basedCost-based (also called cost-plus) (also called cost-plus)

12
Target Price is...Target Price is...
– the estimated price for a product (or service) the estimated price for a product (or service) that potential customers will be willing to pay.that potential customers will be willing to pay.
The target price, calculated using The target price, calculated using customercustomer and and competitors inputscompetitors inputs, forms the basis for , forms the basis for calculating target costs.calculating target costs.

13
Target CostsTarget Costs
Target sales price per unitTarget sales price per unit– Target operating income per unitTarget operating income per unit= Target cost per unitTarget cost per unit

14
Implementing Target Pricing Implementing Target Pricing and Target Costingand Target Costing
Steps in developing target prices and target Steps in developing target prices and target costs:costs:
1 Develop a product that satisfies the needs of Develop a product that satisfies the needs of potential customers.potential customers.
2 Choose a target price.Choose a target price.3 Derive a target cost per unit.Derive a target cost per unit.4 Perform Perform value engineeringvalue engineering to achieve target to achieve target
costs.costs.
15
Value-Added CostsValue-Added Costs
A A value-added costvalue-added cost is a cost that customers is a cost that customers perceive as adding value, or utility, to a perceive as adding value, or utility, to a product or service:product or service:
– Adequate memory Adequate memory – Pre-loaded softwarePre-loaded software– ReliabilityReliability– Easy-to-use keyboardsEasy-to-use keyboards
16
Nonvalue-Added CostsNonvalue-Added Costs
A A nonvalue-added costnonvalue-added cost is a cost that is a cost that customers do not perceive as adding value, or customers do not perceive as adding value, or utility, to a product or service.utility, to a product or service.
– Cost of expeditingCost of expediting– ReworkRework– RepairRepair
17
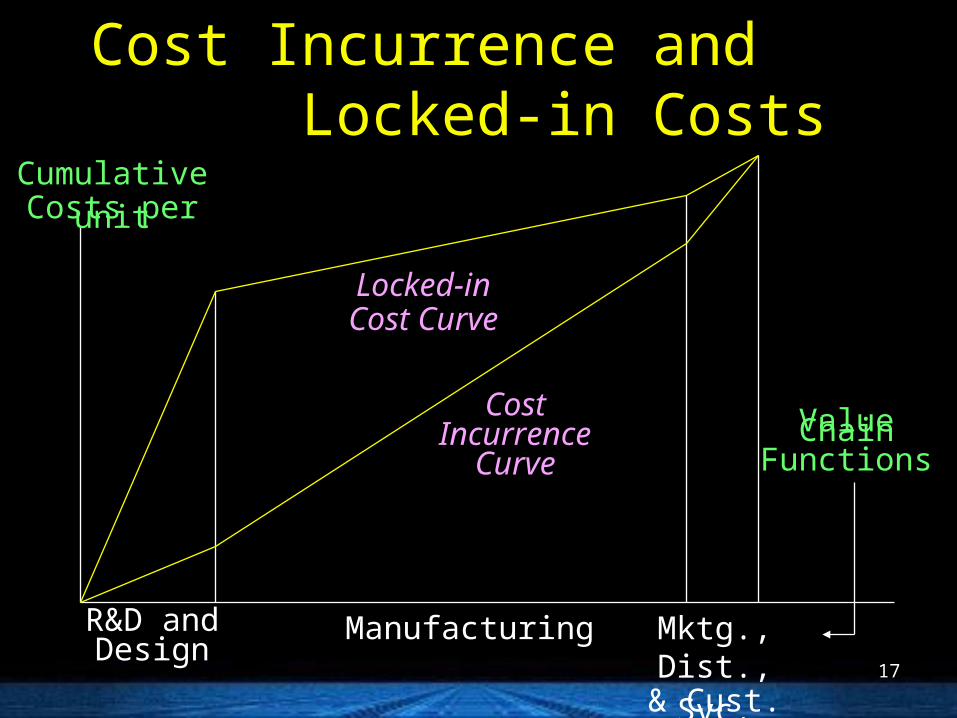
Cost Incurrence and Cost Incurrence and Locked-in CostsLocked-in Costs
CumulativeCosts per unit
Locked-inCost Curve
CostIncurrence
Curve
R&D andDesign
Manufacturing Mktg., Dist.,& Cust. Svc.
Value ChainFunctions

18
Cost-Plus PricingCost-Plus Pricing
The general formula for setting a cost-based The general formula for setting a cost-based price is to add a price is to add a markup componentmarkup component to the to the cost base.cost base.
Cost base $X Cost base $X Markup component Markup component Y Y Prospective selling price $X + YProspective selling price $X + Y

19
Life-Cycle BudgetingLife-Cycle Budgeting
The product life-cycle spans the time from The product life-cycle spans the time from original original research and developmentresearch and development, through , through salessales, to when , to when customer supportcustomer support is no longer is no longer offered for that product.offered for that product.
A A life-cycle budgetlife-cycle budget estimates revenues and estimates revenues and costs of a product over its costs of a product over its entire lifeentire life..
20
Predicted CostsPredicted Costs
Many of the production, marketing, Many of the production, marketing, distribution and customer service costs distribution and customer service costs are locked in the R&D and design stage.are locked in the R&D and design stage.
Life-cycle budgeting facilitates value Life-cycle budgeting facilitates value engineering at the design stage before engineering at the design stage before costs are locked in.costs are locked in.

21
StrategyStrategy
Strategy specifies how an organization Strategy specifies how an organization matchesmatches its its own capabilitiesown capabilities with the with the opportunitiesopportunities in the marketplace to in the marketplace to accomplish its objectivesaccomplish its objectives
A thorough understanding of the industry is A thorough understanding of the industry is critical to implementing a successful strategycritical to implementing a successful strategy
22
The Balanced ScorecardThe Balanced Scorecard
The The balanced scorecard balanced scorecard translatestranslates an an organization’s mission and organization’s mission and strategy intostrategy into a a comprehensive set of comprehensive set of performance measuresperformance measures..
The balanced scorecard does not focus solely The balanced scorecard does not focus solely on achieving on achieving financialfinancial objectives. objectives.
It highlights the It highlights the nonfinancialnonfinancial objectives that objectives that an organization must achieve in order to meet an organization must achieve in order to meet its financial objectives.its financial objectives.

23
The Balanced Scorecard FlowchartThe Balanced Scorecard Flowchart
Financial CustomerInternal
BusinessProcess
Learning&
Growth
24
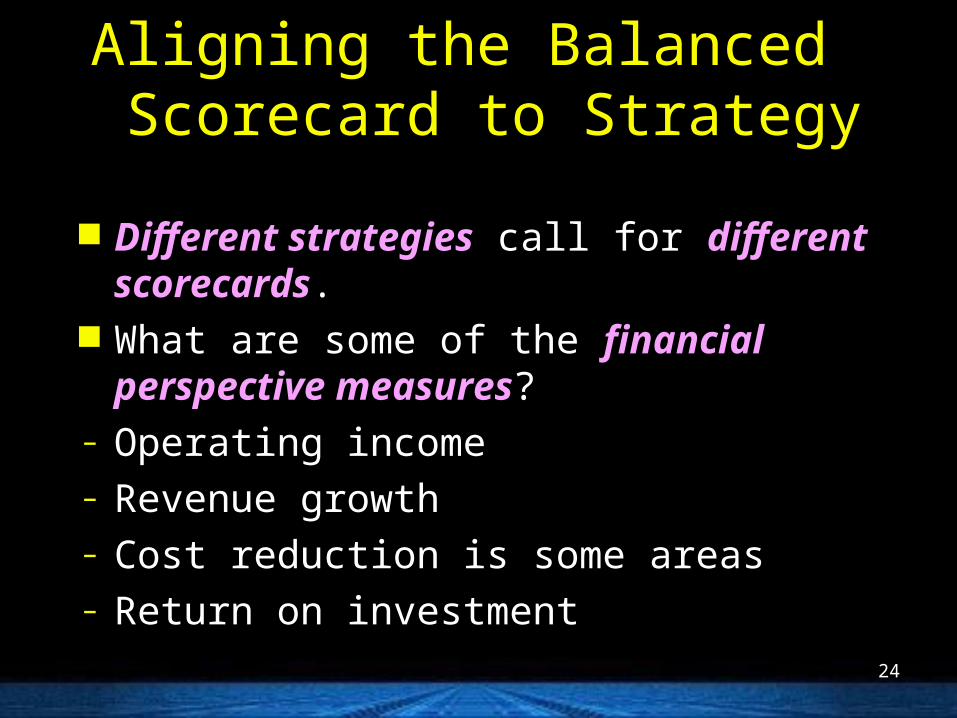
Aligning the Balanced Aligning the Balanced Scorecard to StrategyScorecard to Strategy
Different strategiesDifferent strategies call for call for different scorecardsdifferent scorecards.. What are some of the What are some of the financial perspective financial perspective
measuresmeasures??– Operating incomeOperating income– Revenue growthRevenue growth– Cost reduction is some areasCost reduction is some areas– Return on investmentReturn on investment

25
Aligning the Balanced Aligning the Balanced Scorecard to StrategyScorecard to Strategy
What are some of the What are some of the customer perspective customer perspective measuresmeasures??
– Market shareMarket share– Customer satisfactionCustomer satisfaction– Customer retention percentageCustomer retention percentage– Time taken to fulfill customers requestsTime taken to fulfill customers requests

26
Aligning the Balanced Aligning the Balanced Scorecard to StrategyScorecard to Strategy
What are some of the What are some of the internal business internal business process perspective measuresprocess perspective measures??
– Innovation ProcessInnovation Process Manufacturing capabilitiesManufacturing capabilities Number of new products or servicesNumber of new products or services New product development timeNew product development time Number of new patentsNumber of new patents

27
Aligning the Balanced Aligning the Balanced Scorecard to StrategyScorecard to Strategy
– Operations ProcessOperations Process YieldYield Defect ratesDefect rates Time taken to deliver product to customersTime taken to deliver product to customers Percentage of on-time deliveryPercentage of on-time delivery Setup timeSetup time Manufacturing downtimeManufacturing downtime

28
Aligning the Balanced Aligning the Balanced Scorecard to StrategyScorecard to Strategy
– Post-sales servicePost-sales service Time taken to replace or repair defective Time taken to replace or repair defective
productsproducts Hours of customer training for using the Hours of customer training for using the
productproduct

29
Aligning the Balanced Aligning the Balanced Scorecard to StrategyScorecard to Strategy
What are some of the What are some of the learning and growth learning and growth perspective measuresperspective measures??
– Employee education and skill levelEmployee education and skill level– Employee satisfaction scoresEmployee satisfaction scores– Employee turnover ratesEmployee turnover rates– Information system availabilityInformation system availability– Percentage of processes with advanced controlsPercentage of processes with advanced controls
30
Features of a Good Features of a Good Balanced ScorecardBalanced Scorecard
Tells the story of a firm’s strategy, articulating a Tells the story of a firm’s strategy, articulating a sequence of sequence of cause-and-effect relationshipscause-and-effect relationships: the : the links among the various perspectives that links among the various perspectives that describe how strategy will be implementeddescribe how strategy will be implemented
Helps Helps communicate the strategycommunicate the strategy to all members to all members of the organization by translating the strategy of the organization by translating the strategy into a coherent and linked set of understandable into a coherent and linked set of understandable and measurable operational targetsand measurable operational targets

31
Features of a Good Features of a Good Balanced ScorecardBalanced Scorecard
Must Must motivate managers to take actionsmotivate managers to take actions that that eventually result in improvements in financial eventually result in improvements in financial performanceperformance
Limits the number of measuresLimits the number of measures, identifying , identifying only the most critical onesonly the most critical ones
Highlights less-than-optimal tradeoffsHighlights less-than-optimal tradeoffs that that managers may make when they fail to consider managers may make when they fail to consider operational and financial measures togetheroperational and financial measures together

32
Balanced Scorecard Balanced Scorecard Implementation PitfallsImplementation Pitfalls
Managers Managers should not assume the cause-and-should not assume the cause-and-effect linkages are preciseeffect linkages are precise: they are merely : they are merely hypotheseshypotheses
Managers Managers should not seek improvements should not seek improvements across all of the measuresacross all of the measures all of the time all of the time
Managers Managers should not use only objective should not use only objective measuresmeasures: subjective measures are important : subjective measures are important as wellas well

33
Balanced Scorecard Balanced Scorecard Implementation PitfallsImplementation Pitfalls
Managers Managers must include both costs and must include both costs and benefitsbenefits of initiatives placed in the balanced of initiatives placed in the balanced scorecard: costs are often overlookedscorecard: costs are often overlooked
Managers Managers should not ignore nonfinancial should not ignore nonfinancial measuresmeasures when evaluating employees when evaluating employees
Managers Managers should not use too many measuresshould not use too many measures
34
Evaluating StrategyEvaluating Strategy
Strategic Analysis of Operating Income – 3 Strategic Analysis of Operating Income – 3 parts:parts:
1.1. Growth ComponentGrowth Component – measures the change in – measures the change in operating income attributable solely to the change in the operating income attributable solely to the change in the quantity of output sold between the current and prior quantity of output sold between the current and prior periodsperiods
2.2. Price-Recovery ComponentPrice-Recovery Component – measures the change in – measures the change in operating income attributable solely to changes in prices operating income attributable solely to changes in prices of inputs and outputs between the current and prior of inputs and outputs between the current and prior periodsperiods
3.3. Productivity ComponentProductivity Component – measures the change in – measures the change in costs attributable to a change in the quantity of inputs costs attributable to a change in the quantity of inputs between the current and prior periodsbetween the current and prior periods
35
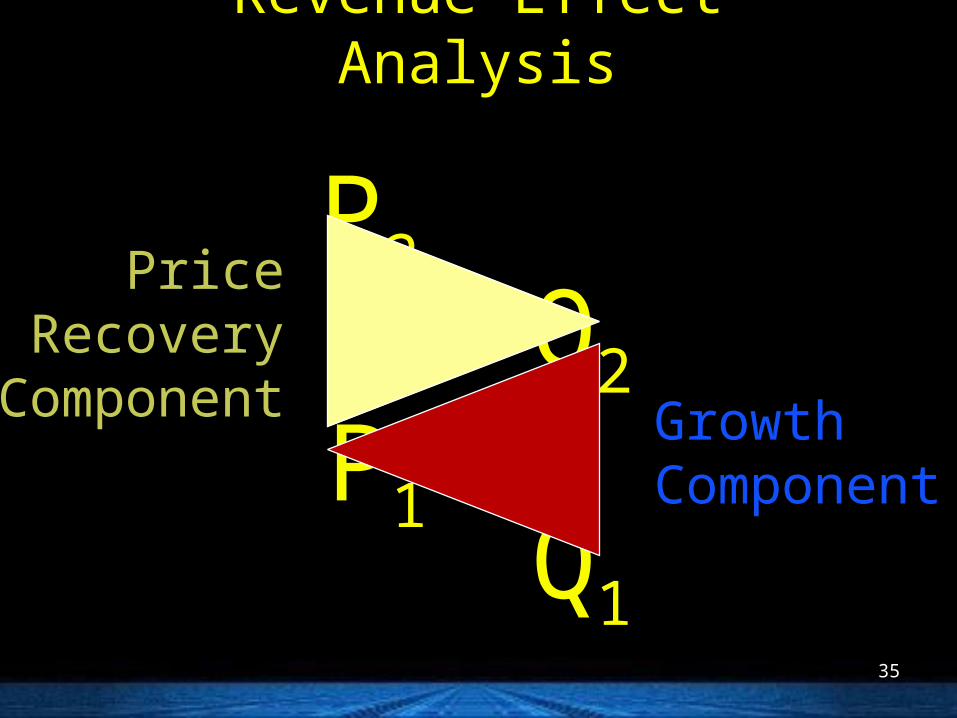
Revenue Effect AnalysisRevenue Effect Analysis
P2
Q1
P1
Q2
Price Recovery
Component Growth Component

36
Cost Effect AnalysisCost Effect Analysis
P2
Q1P1
Q
Q2
Price Recovery
ComponentGrowth Component
Productivity Component
37
The Management of CapacityThe Management of Capacity
Managers can reduce capacity-based fixed Managers can reduce capacity-based fixed costs by measuring and managing unused costs by measuring and managing unused capacitycapacity
Unused Capacity is the amount of productive Unused Capacity is the amount of productive capacity available over and above the capacity available over and above the productive capacityproductive capacity employed to meet employed to meet consumer demand in the current periodconsumer demand in the current period
38
Analysis of Unused CapacityAnalysis of Unused Capacity
Two Important Features:Two Important Features:
1.1. Engineered CostsEngineered Costs result from a cause-and- result from a cause-and-effect relationship between output and the effect relationship between output and the resources used to produce that outputresources used to produce that output
2.2. Discretionary CostsDiscretionary Costs have two parts: have two parts:1.1. They arise from periodic (annual) decisions They arise from periodic (annual) decisions
regarding the maximum amount to be incurredregarding the maximum amount to be incurred
2.2. They have no measurable cause-and-effect They have no measurable cause-and-effect relationship between output and resources usedrelationship between output and resources used
39
Managing Unused CapacityManaging Unused Capacity
DownsizingDownsizing (Rightsizing) is an integrated (Rightsizing) is an integrated approach of approach of configuring processes, products, configuring processes, products, and peopleand people to match costs to the activities that to match costs to the activities that need to be performed to operate effectively and need to be performed to operate effectively and efficiently in the present and futureefficiently in the present and future
Because identifying unused capacity for Because identifying unused capacity for discretionary costsdiscretionary costs is difficult, is difficult, downsizingdownsizing, , or otherwise managing this unused capacity, or otherwise managing this unused capacity, is alsois also difficult difficult..

40
Customer-Profitability ProfilesCustomer-Profitability Profiles
Customer profitability reports often Customer profitability reports often highlight that highlight that a small percentage of a small percentage of customers contribute a large percentage customers contribute a large percentage of operating incomeof operating income..
It is important that companies It is important that companies devote devote sufficient resourcessufficient resources to maintaining and to maintaining and expanding relationships with these expanding relationships with these key key contributors to profitabilitycontributors to profitability..

41
Other Factors in Evaluating Other Factors in Evaluating Customer ProfitabilityCustomer Profitability
Likelihood of customer retentionLikelihood of customer retention Potential for sales growthPotential for sales growth Long-run customer profitabilityLong-run customer profitability Increases in overall demand from having well-Increases in overall demand from having well-
known customersknown customers Ability to learn from customersAbility to learn from customers

42
Sales Volume VarianceSales Volume Variance
Sales Sales MixMix
Sales Sales QuantityQuantity
Market Market ShareShare Market Market
SizeSize
bMi
aMi
aQ
bQ
bX
aZ
bZ
aXBCMi
BCM

43
Purposes of Cost AllocationPurposes of Cost Allocation
There are four essential purposes of cost There are four essential purposes of cost allocation:allocation:
1 To provide information for economic decisionsTo provide information for economic decisions2 To motivate managers and other employeesTo motivate managers and other employees3 To justify costs or compute reimbursementTo justify costs or compute reimbursement4 To measure income and assets for reporting to To measure income and assets for reporting to
external partiesexternal parties

44
Cost Allocation CriteriaCost Allocation Criteria
Cost Object
Cost Allocationby Cause and Effect
Cost Allocationby Benefit Received
Cost Allocationby Ability to Bear
UserHow many benefitsare received by the user from using the cost object?
How many resources are consumed by thecost object?
The ability for the cost object to absorb additional cost given reasonable profit margin
45
Allocating Costs of a Supporting Allocating Costs of a Supporting Department to Operating DepartmentsDepartment to Operating Departments
Supporting (Service) Department – provides Supporting (Service) Department – provides the services that the services that assistassist other internal other internal departments in the companydepartments in the company
Operating (Production) Department – Operating (Production) Department – directly directly adds valueadds value to a product or service to a product or service

46
Allocation Method TradeoffsAllocation Method Tradeoffs
Single-rate methodSingle-rate method is simple to implement, is simple to implement, but treats fixed costs in a manner similar to but treats fixed costs in a manner similar to variable costsvariable costs
Dual-rate methodDual-rate method treats fixed and variable treats fixed and variable costs more realistically, but is more complex costs more realistically, but is more complex to implementto implement

47
Allocation BasesAllocation Bases
Under either method, allocation of support costs can Under either method, allocation of support costs can be based on one of the three following scenarios:be based on one of the three following scenarios:
1.1. Budgeted overhead rate and budgeted hoursBudgeted overhead rate and budgeted hours2.2. Budgeted overhead rate and actual hoursBudgeted overhead rate and actual hours3.3. Actual overhead rate and actual hoursActual overhead rate and actual hours
Choosing between actual and budgeted rates: Choosing between actual and budgeted rates: budgeted is known at the beginning of the period, budgeted is known at the beginning of the period, while actual will not be known with certainty until while actual will not be known with certainty until the end of the periodthe end of the period

48
Budgeted versus Actual RatesBudgeted versus Actual Rates
Budgeted rates let the user department Budgeted rates let the user department know know in advance the cost ratesin advance the cost rates they will be charged. they will be charged.
Users are better equipped to determine the Users are better equipped to determine the amount of the service to request. amount of the service to request.
Budgeted rates also Budgeted rates also help motivate the help motivate the manager of the supplier departmentmanager of the supplier department to to improve efficiency.improve efficiency.

49
Budgeted versus Actual Usage Budgeted versus Actual Usage Allocation BasesAllocation Bases
When budgeted usage is the allocation base, When budgeted usage is the allocation base, user divisions will know in advance their user divisions will know in advance their allocated costs.allocated costs.
This information helps the user divisions with This information helps the user divisions with both short-run and long-run planning.both short-run and long-run planning.
The main justification given for the use of The main justification given for the use of budgeted usage to allocate fixed costs relates budgeted usage to allocate fixed costs relates to long-run planning.to long-run planning.
50
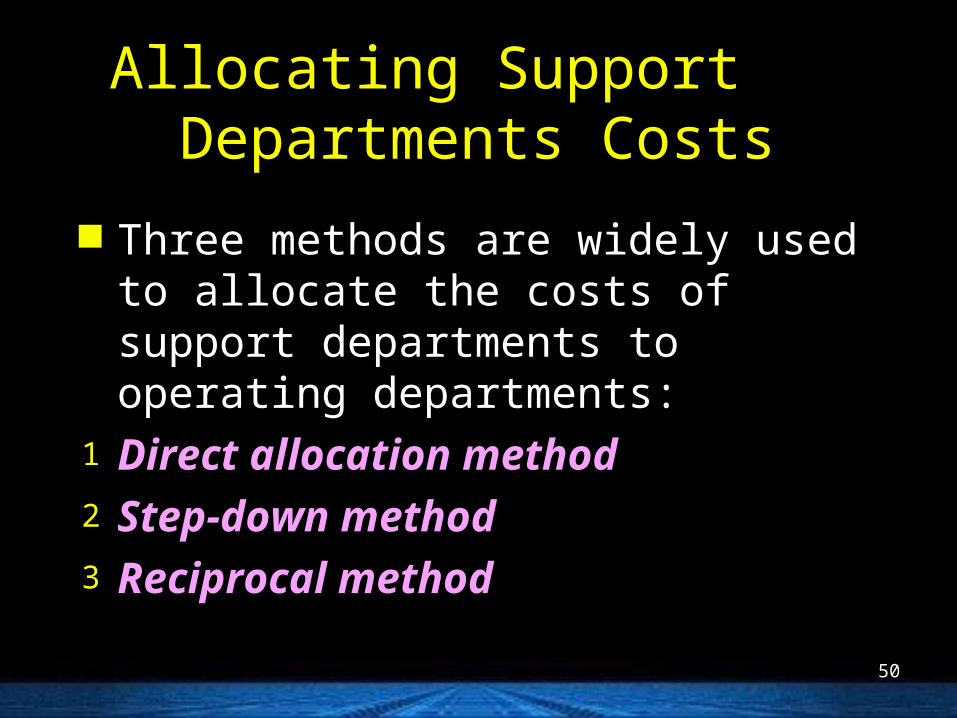
Allocating Support Allocating Support Departments CostsDepartments Costs
Three methods are widely used to allocate the Three methods are widely used to allocate the costs of support departments to operating costs of support departments to operating departments:departments:
1 Direct allocation methodDirect allocation method2 Step-down methodStep-down method3 Reciprocal methodReciprocal method
51
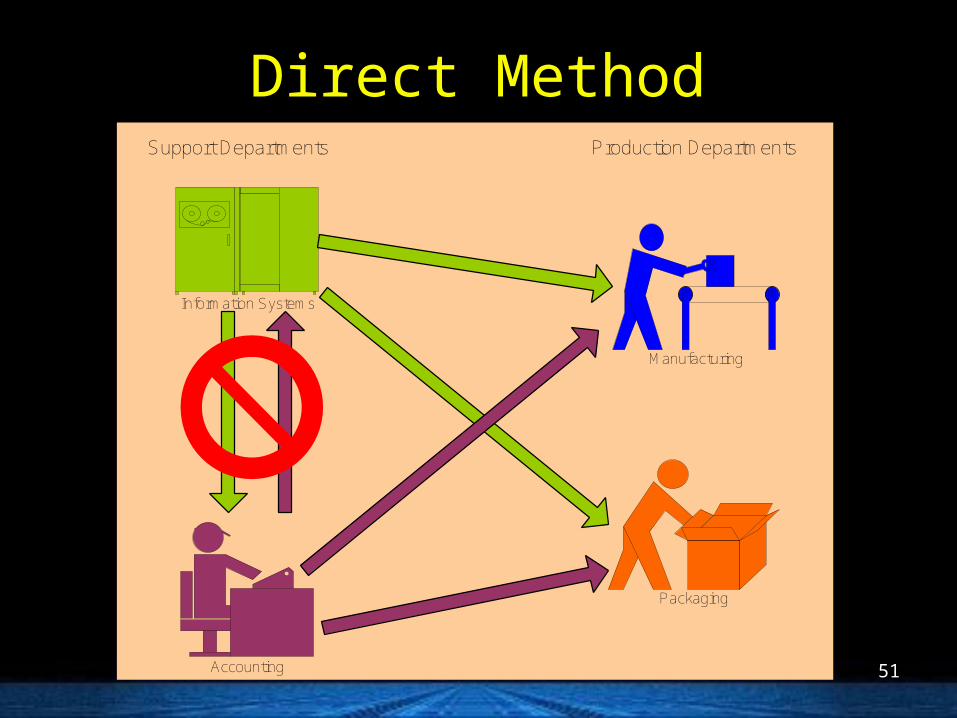
Direct MethodDirect Method
Manufacturing
Information Systems
Accounting
Packaging
Support Departments Production Departments

52
Step-Down MethodStep-Down Method
Manufacturing
Information Systems
Accounting
Packaging
Support Departments Production Departments
53
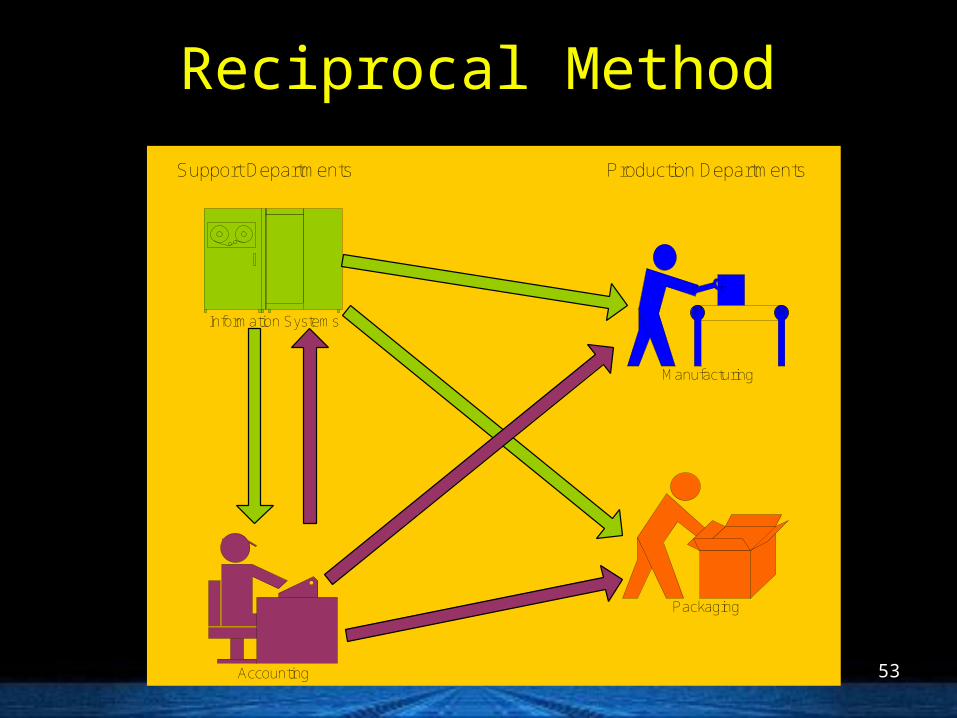
Reciprocal MethodReciprocal Method
Manufacturing
Information Systems
Accounting
Packaging
Support Departments Production Departments

54
Allocating Common CostsAllocating Common Costs
Common Cost – the cost of operating a Common Cost – the cost of operating a facility, activity, or like cost objectfacility, activity, or like cost object that is that is sharedshared by two or more users at a lower cost by two or more users at a lower cost than the individual cost of the activity to each than the individual cost of the activity to each useruser
Two methods for allocating common cost are:Two methods for allocating common cost are:1 Stand-alone cost-allocation methodStand-alone cost-allocation method2 Incremental cost-allocation methodIncremental cost-allocation method

55
Joint-Cost BasicsJoint-Cost Basics
Joint costs Joint costs are the costs of a are the costs of a single production single production process that yields multiple productsprocess that yields multiple products simultaneously.simultaneously.
Industries abound in which a single production Industries abound in which a single production process simultaneously yields two or more process simultaneously yields two or more products.products.

56
Joint Products and ByproductsJoint Products and Byproducts
Sales Value
High Low
Main Products
Joint Products Byproducts

57
Approaches to Allocating Approaches to Allocating Joint CostsJoint Costs
The two basic approaches to allocating joint The two basic approaches to allocating joint costs are:costs are:
Approach 1: Approach 1: Allocate costs using Allocate costs using market-market-based databased data such as revenues. such as revenues.
Approach 2: Approach 2: Allocate costs in some Allocate costs in some physical physical measure-basedmeasure-based datadata such as weight or such as weight or volume.volume.
58
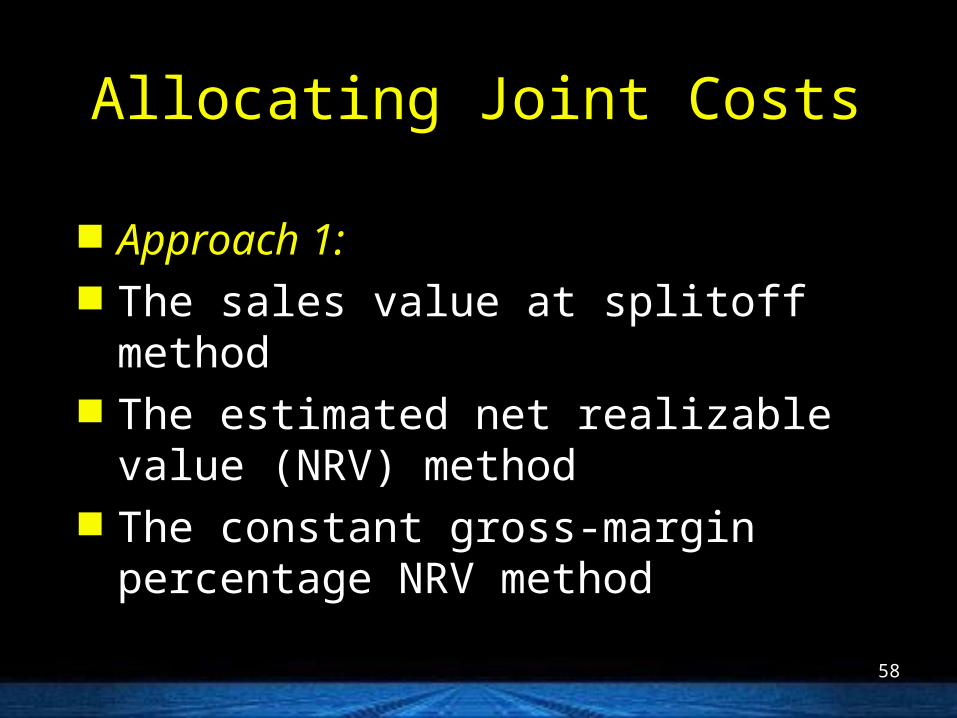
Allocating Joint CostsAllocating Joint Costs
Approach 1:Approach 1: The sales value at splitoff methodThe sales value at splitoff method The estimated net realizable value (NRV) The estimated net realizable value (NRV)
methodmethod The constant gross-margin percentage NRV The constant gross-margin percentage NRV
methodmethod

59
Constant Gross-Margin Constant Gross-Margin Percentage NRV MethodPercentage NRV Method
Step 1: Compute the Step 1: Compute the overall gross-margin overall gross-margin percentage percentage..
Step 2: Use the overall gross-margin Step 2: Use the overall gross-margin percentage and percentage and deduct the gross deduct the gross margin from the final sales values to margin from the final sales values to obtain obtain the total coststhe total costs that each product that each product should bear. should bear.
Step 3: Step 3: DeductDeduct the expected separable costs the expected separable costs from the total costs from the total costs to obtain the joint- to obtain the joint- cost allocation.cost allocation.

60
Comparison of MethodsComparison of Methods
Why is the sales value at Why is the sales value at splitoff methodsplitoff method widely used?widely used?
– It is It is objectiveobjective. . – It does It does not anticipatenot anticipate subsequent management subsequent management
decisions on decisions on further processingfurther processing..– It uses a It uses a meaningful common denominatormeaningful common denominator..– It is It is simplesimple..

61
Irrelevance of Joint Costs Irrelevance of Joint Costs for Decision Makingfor Decision Making
No techniques for allocating joint-product No techniques for allocating joint-product costs should guide decisionscosts should guide decisions about whether a about whether a product should be sold at the splitoff point or product should be sold at the splitoff point or processed beyond splitoff.processed beyond splitoff.

62
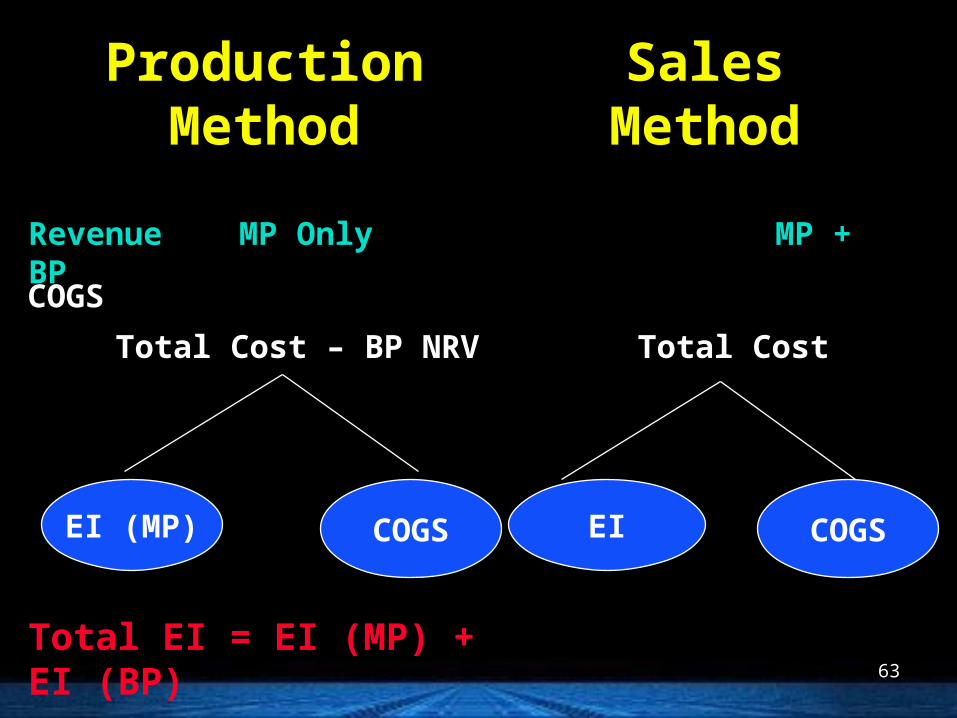
Accounting for ByproductsAccounting for Byproducts
Although byproducts have much lower sales Although byproducts have much lower sales value than do joint or main products, value than do joint or main products, the the presence of byproducts can affect the presence of byproducts can affect the allocation of joint costsallocation of joint costs..
Byproduct accounting methods differ on Byproduct accounting methods differ on whether byproducts are whether byproducts are recognizedrecognized in the in the financial statements financial statements at the time of production at the time of production or the time of saleor the time of sale..
63
Production Production MethodMethod
Sales Sales MethodMethod
Revenue MP Only MP + BP
COGS
Total Cost – BP NRV
EI (MP) COGS
Total Cost
EI COGS
Total EI = EI (MP) + EI (BP)
64
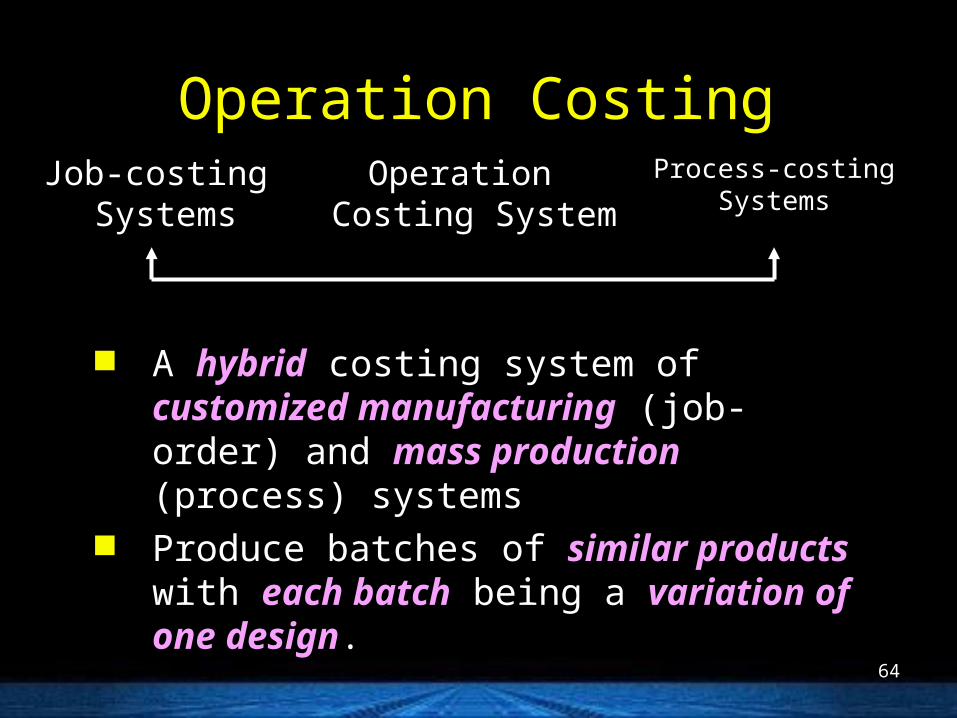
Operation CostingOperation Costing
A A hybridhybrid costing system of costing system of customized customized manufacturingmanufacturing (job-order) and (job-order) and mass mass productionproduction (process) systems (process) systems
Produce batches of Produce batches of similar productssimilar products with with each batcheach batch being a being a variation of one variation of one designdesign..
Process-costingProcess-costingSystemsSystems
Job-costingJob-costing SystemsSystems
Operation Costing Operation Costing SystemSystem
65
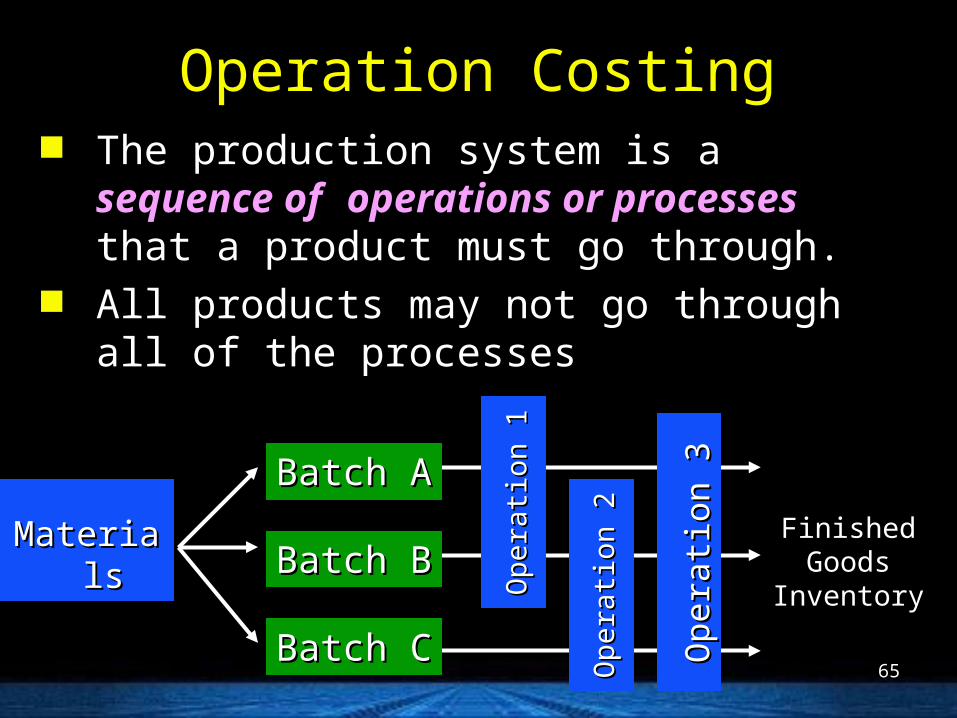
Operation CostingOperation Costing The production system is a The production system is a sequence ofsequence of
operations or processesoperations or processes that a product that a product must go through.must go through.
All products may not go through all of the All products may not go through all of the processesprocesses
MaterialsMaterials
Batch ABatch A
Batch BBatch B
Batch CBatch C
Ope
rati
on 1
Ope
rati
on 1
Ope
rati
on 2
Ope
rati
on 2
Ope
rati
on 3
Ope
rati
on 3
FinishedFinishedGoodsGoods
InventoryInventory

66
Accounting for Operation Costing Accounting for Operation Costing
Separate WIP for each operationSeparate WIP for each operation (or process). (or process). As the product moves between operations, debit As the product moves between operations, debit
receiving operation's WIP, credit sending receiving operation's WIP, credit sending operation's WIP.operation's WIP.
Direct materials are traced directly to each Direct materials are traced directly to each batchbatch (or order). (or order).
Conversion costs are accumulated by operation. Conversion costs are accumulated by operation. A A single average conversion costsingle average conversion cost is then is then applied toapplied to units that go through the units that go through the operationoperation, , regardless of which batch they belong to. regardless of which batch they belong to.

67
Spoilage, Rework and Scrap Spoilage, Rework and Scrap TerminologyTerminology
There are three types of There are three types of costscosts that arise as a that arise as a result of result of defectsdefects::
1 Spoilage (Spoilage ( 損壞品損壞品 ))2 Rework (Rework ( 重製品重製品 ))3 Scrap (Scrap ( 剩餘物資剩餘物資 )) Some amount of spoilage, rework, or scrap Some amount of spoilage, rework, or scrap
appears to be an inherent part of many appears to be an inherent part of many production processes.production processes.

68
Abnormal SpoilageAbnormal Spoilage
Abnormal spoilageAbnormal spoilage costs are costs are written off as written off as losses of the accounting periodlosses of the accounting period in which in which detection of the spoiled units occurs.detection of the spoiled units occurs.
Companies record the units of abnormal Companies record the units of abnormal spoilage and keep a spoilage and keep a separateseparate Loss from Loss from Abnormal Spoilage accountAbnormal Spoilage account..

69
FIFO: SpoilageFIFO: Spoilage
The FIFO method of process costing keeps The FIFO method of process costing keeps costs in the costs in the beginning inventory separate beginning inventory separate fromfrom the costs in the the costs in the current periodcurrent period when when determining the costs of good units (which determining the costs of good units (which includes a normal spoilage amount) and the includes a normal spoilage amount) and the costs of abnormal spoilage.costs of abnormal spoilage.

70
Job Costing: Spoilage or ReworkJob Costing: Spoilage or Rework
Normal spoilageNormal spoilage or rework can be assigned to or rework can be assigned to a a specific jobspecific job or, if or, if common to all jobscommon to all jobs, as part , as part of manufacturing overhead.of manufacturing overhead.
Abnormal spoilage or rework is written off as Abnormal spoilage or rework is written off as a cost of the period.a cost of the period.
71
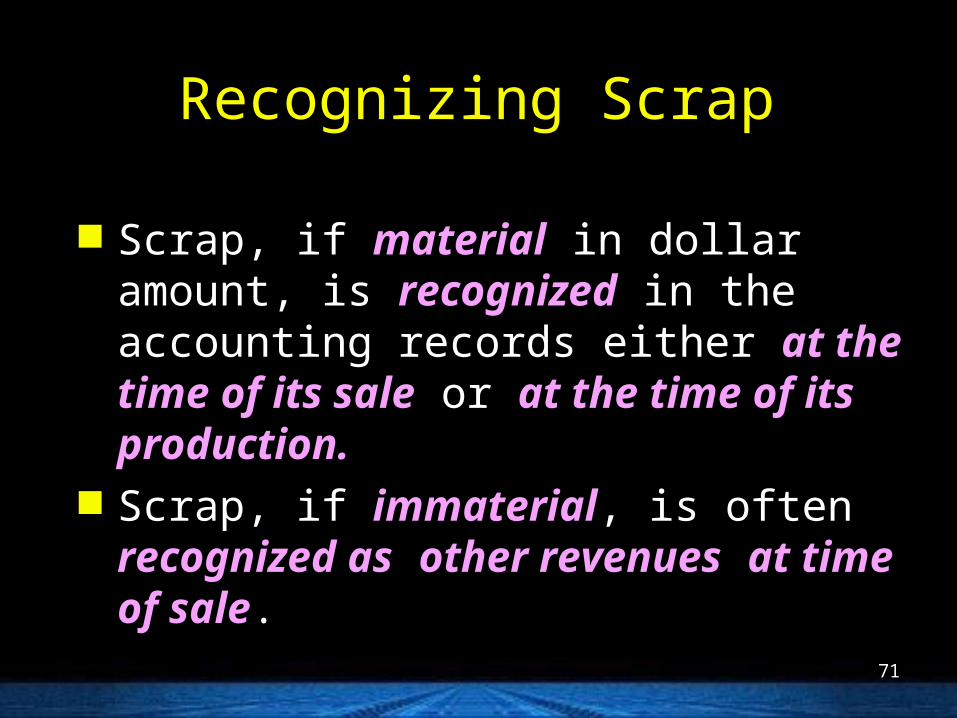
Recognizing ScrapRecognizing Scrap
Scrap, if Scrap, if materialmaterial in dollar amount, is in dollar amount, is recognizedrecognized in the accounting records either in the accounting records either at at the time of its salethe time of its sale or or at the time of its at the time of its production.production.
Scrap, if Scrap, if immaterialimmaterial, is often , is often recognized asrecognized as other revenuesother revenues at time of saleat time of sale..

72
Recognizing Material Scrap Recognizing Material Scrap at Time of Saleat Time of Sale
Recognizing sale of scrap specific to Job #10:Recognizing sale of scrap specific to Job #10: Cash or Accounts ReceivableCash or Accounts Receivable 300 300
Work-in-Process (Job #10)Work-in-Process (Job #10)300 300
Recognizing sale of scrap common to all jobs:Recognizing sale of scrap common to all jobs: Cash or Accounts ReceivableCash or Accounts Receivable 300 300
Manufacturing Overhead ControlManufacturing Overhead Control300 300
73
Recognizing Material Scrap Recognizing Material Scrap at Time of Productionat Time of Production
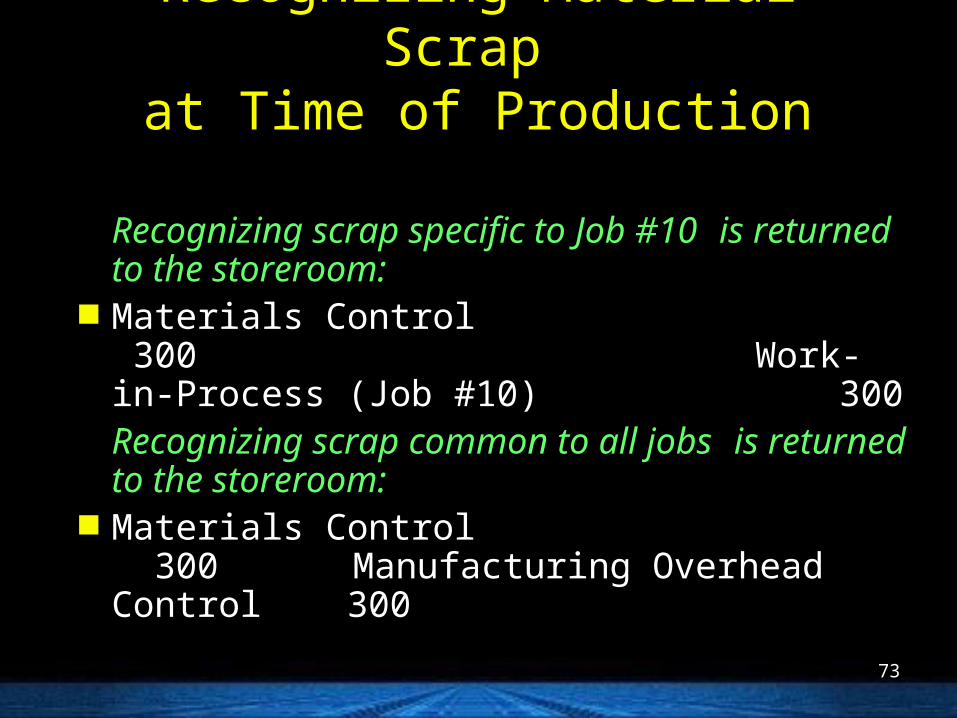
Recognizing scrap specific to Job #10Recognizing scrap specific to Job #10 is is returned to the storeroom:returned to the storeroom:
Materials Control 300 Materials Control 300 Work-in-Process (Job #10) 300Work-in-Process (Job #10) 300Recognizing scrap common to all jobsRecognizing scrap common to all jobs is is returned to the storeroom:returned to the storeroom:
Materials Control 300 Materials Control 300 Manufacturing Overhead Control 300Manufacturing Overhead Control 300

74
Quality and FailureQuality and Failure
ActualPerformance
DesignSpecifications
CustomerSatisfaction
ConformanceQualityFailure
DesignQualityFailure

75
The Financial Perspective: The Financial Perspective: Costs of QualityCosts of Quality
The The costs of quality costs of quality (COQ) refer to costs (COQ) refer to costs incurred incurred toto preventprevent, or , or costs arising as a result costs arising as a result ofof, the production of a , the production of a low-quality productlow-quality product..
These costs These costs focus on conformance qualityfocus on conformance quality and and are incurred in all business functions of the are incurred in all business functions of the value chain.value chain.

76
The Financial Perspective: The Financial Perspective: Costs of QualityCosts of Quality
1 Prevention costsPrevention costs--costs incurred in --costs incurred in precludingprecluding the production of products that do not the production of products that do not conform to specifications.conform to specifications.
2 Appraisal costsAppraisal costs--costs incurred in --costs incurred in detectingdetecting which of the individual units of products do which of the individual units of products do not conform to specifications.not conform to specifications.

77
The Financial Perspective: The Financial Perspective: Costs of QualityCosts of Quality
3 Internal failure costsInternal failure costs--costs incurred by a --costs incurred by a nonconforming product detected nonconforming product detected before it is before it is shipped to customersshipped to customers..
4 External failure costsExternal failure costs--costs incurred by a --costs incurred by a nonconforming product detected nonconforming product detected after it is after it is shipped to customersshipped to customers..
78
Cost of Quality ExclusionsCost of Quality Exclusions
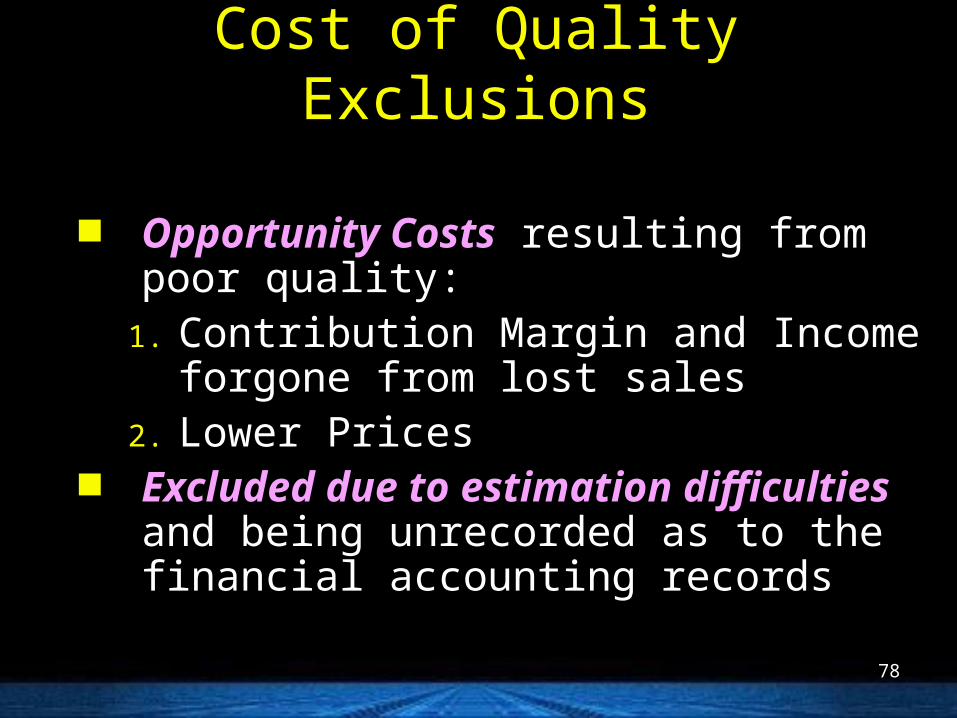
Opportunity CostsOpportunity Costs resulting from poor resulting from poor quality:quality:
1.1. Contribution Margin and Income forgone Contribution Margin and Income forgone from lost salesfrom lost sales
2.2. Lower Prices Lower Prices Excluded due to estimation difficultiesExcluded due to estimation difficulties and and
being unrecorded as to the financial being unrecorded as to the financial accounting recordsaccounting records
79
Nonfinancial MeasuresNonfinancial Measures
Nonfinancial measures of customer-satisfactionNonfinancial measures of customer-satisfaction Nonfinancial measures of internal performanceNonfinancial measures of internal performance Measures of learning and growthMeasures of learning and growth

80
Evaluating Quality PerformanceEvaluating Quality Performance
Advantages of Financial COQ measures:Advantages of Financial COQ measures:– Financial measures are helpful to Financial measures are helpful to evaluateevaluate
tradeoffstradeoffs among prevention costs, appraisal costs, among prevention costs, appraisal costs, and failure costs.and failure costs.
– Financial COQ measures assist in problem solving Financial COQ measures assist in problem solving by comparing different quality-improvement by comparing different quality-improvement programs and programs and setting prioritiessetting priorities for achieving for achieving maximum cost reduction.maximum cost reduction.
– COQ provides a COQ provides a single, summary measure of single, summary measure of quality performancequality performance..

81
Evaluating Quality PerformanceEvaluating Quality Performance
Advantages of nonfinancial measures of Advantages of nonfinancial measures of quality:quality:– Nonfinancial measures of quality are often Nonfinancial measures of quality are often easy to easy to
quantify and understandquantify and understand..– Nonfinancial measures direct Nonfinancial measures direct attention toattention to physical physical
processesprocesses and hence focus attention on the and hence focus attention on the precise precise problem areasproblem areas that need improvement. that need improvement.
82
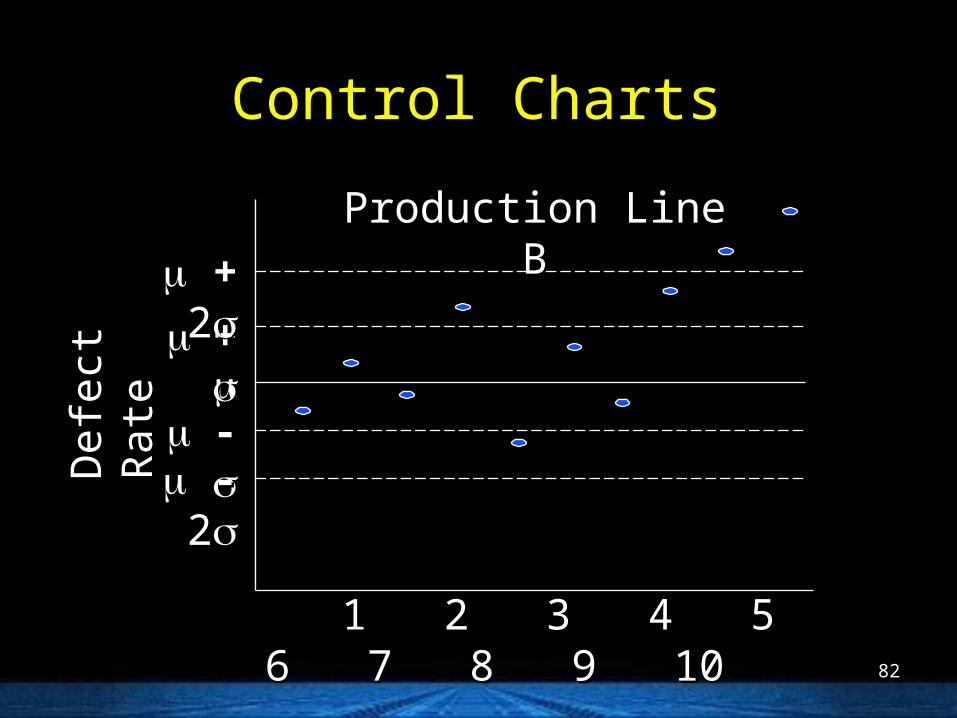
Control ChartsControl Charts
1 2 3 4 5 6 7 8 9 101 2 3 4 5 6 7 8 9 10
DaysDays
+ +
+ + 22Production Line B
- - - - 22D
efec
t Rat
eD
efec
t Rat
e
83
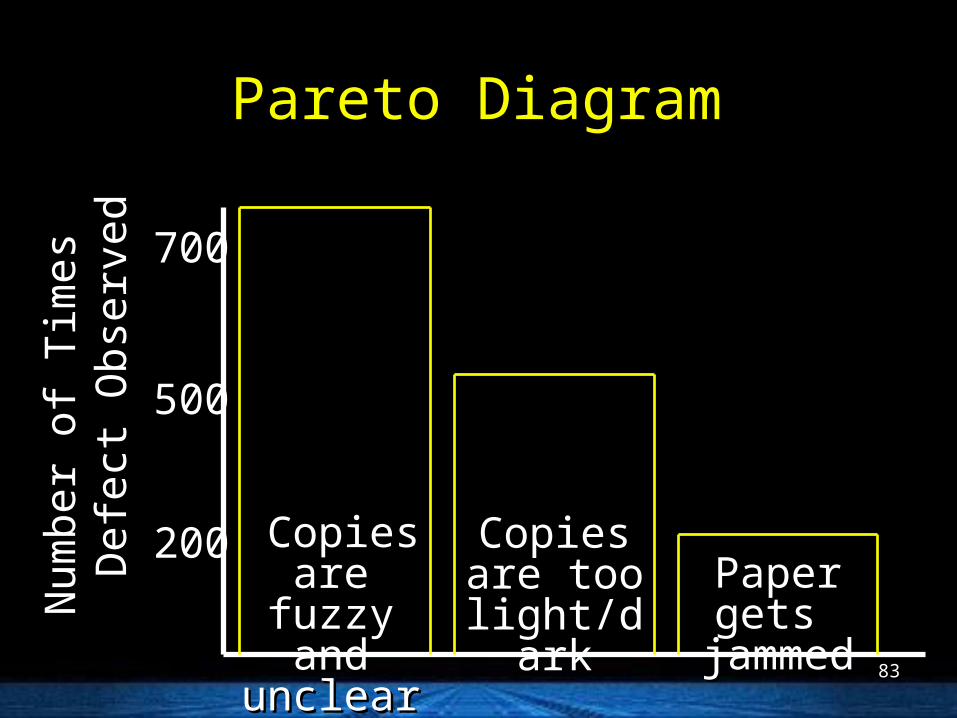
Pareto DiagramPareto Diagram
Copies are Copies are fuzzy and fuzzy and unclearunclear
Copies are Copies are too too
light/darklight/darkPaper gets Paper gets
jammedjammed
Num
ber
of T
imes
Num
ber
of T
imes
Def
ect O
bser
ved
Def
ect O
bser
ved 700
500
200
84
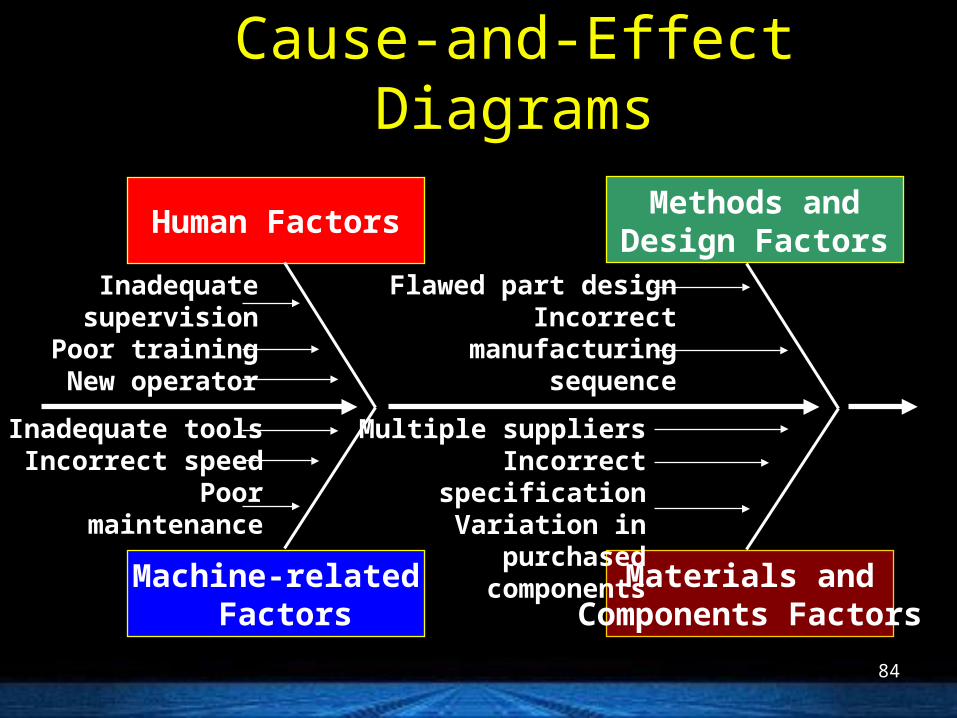
Cause-and-Effect DiagramsCause-and-Effect Diagrams
Methods andDesign Factors
Human Factors
Machine-related Factors
Materials andComponents Factors
Multiple suppliersIncorrect specification
Variation in purchasedcomponents
Flawed part designIncorrect
manufacturingsequence
Inadequate toolsIncorrect speed
Poormaintenance
Inadequatesupervision
Poor trainingNew operator
85
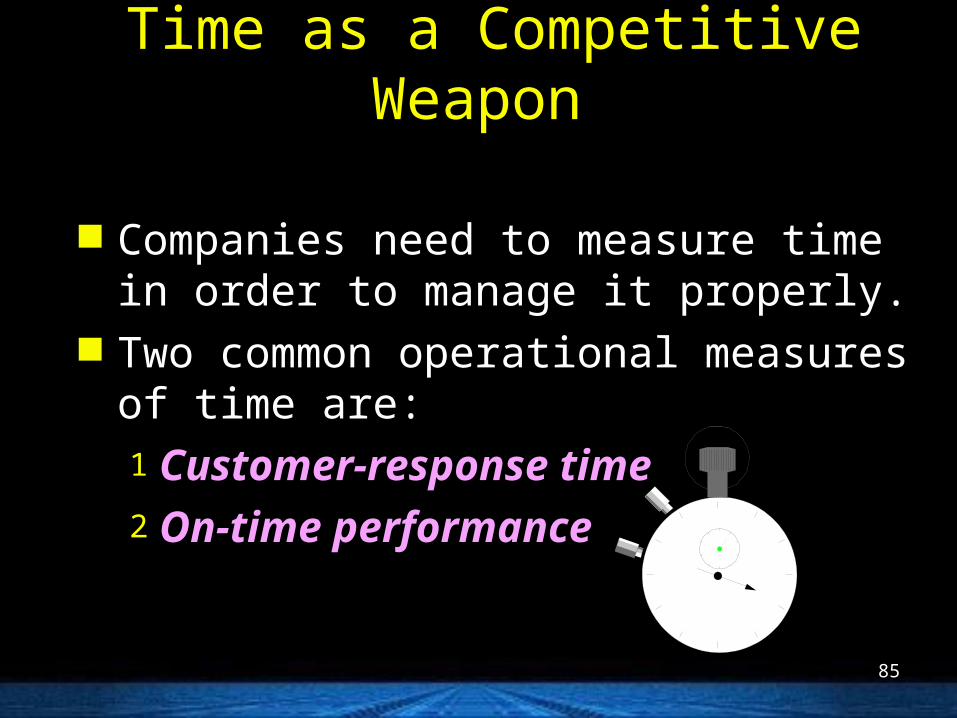
Time as a Competitive WeaponTime as a Competitive Weapon
Companies need to measure time in order to Companies need to measure time in order to manage it properly.manage it properly.
Two common operational measures of time Two common operational measures of time are:are:1 Customer-response timeCustomer-response time2 On-time performanceOn-time performance

86
Customer-Response TimeCustomer-Response Time
Order isplaced
Order isreceived
Order isset up
Order ismanufactured
Order isdelivered
WaitingTime
Mfg.Time
ReceiptTime
ManufacturingLead Time
DeliveryTime
Customer-Response Time

87
Theory of ConstraintsTheory of Constraints
The objective of TOC is to The objective of TOC is to increase increase throughput contributionthroughput contribution while while decreasing decreasing investments and operating costsinvestments and operating costs..
TOC considers a TOC considers a short-run time horizonshort-run time horizon and and assumes assumes operating costs to be fixedoperating costs to be fixed costscosts..

88
Theory of ConstraintsTheory of Constraints
The theory of constraints emphasizes the The theory of constraints emphasizes the management of bottlenecksmanagement of bottlenecks as the keyas the key to to improving the performance of the production improving the performance of the production system as a whole.system as a whole.

89
Methods to Relieve BottlenecksMethods to Relieve Bottlenecks
Eliminate idle time at the bottleneckEliminate idle time at the bottleneck operation operation Process onlyProcess only those parts or products those parts or products that that
increase throughput contributionincrease throughput contribution, not parts or , not parts or products that will remain in finished goods or products that will remain in finished goods or spare parts inventoriesspare parts inventories
Shift productsShift products that do not have to be made on that do not have to be made on the bottleneck operation the bottleneck operation to nonbottleneck to nonbottleneck processesprocesses, , or to outside processing facilitiesor to outside processing facilities

90
Methods to Relieve BottlenecksMethods to Relieve Bottlenecks
Reduce setup time and processing time at Reduce setup time and processing time at bottleneckbottleneck operations operations
ImproveImprove the the qualityquality of parts or products of parts or products manufactured at the bottleneck operationmanufactured at the bottleneck operation

91
Costs Associated with Costs Associated with Goods for SaleGoods for Sale
Five categories of costs associated with goods Five categories of costs associated with goods for sale are:for sale are:
1 Purchasing costsPurchasing costs2 Ordering costsOrdering costs3 Carrying costsCarrying costs4 Stockout costsStockout costs5 Quality costsQuality costs

92
Economic-Order-Quantity Economic-Order-Quantity Decision ModelDecision Model
The formula for the EOQ model is:The formula for the EOQ model is:
EOQ =EOQ =
D = Demand in units for a specified time periodD = Demand in units for a specified time periodP = Relevant ordering costs per purchase orderP = Relevant ordering costs per purchase orderC = Relevant carrying costs of one unit inC = Relevant carrying costs of one unit in stock for the time period used for Dstock for the time period used for D
2DP
C

93
Considerations in Obtaining Considerations in Obtaining Estimates of Relevant CostsEstimates of Relevant Costs
Obtaining Obtaining accurate estimatesaccurate estimates of the of the cost cost parametersparameters used in the EOQ decision model used in the EOQ decision model is a is a challenging taskchallenging task..
What are the What are the relevant incremental costsrelevant incremental costs of of carrying inventory?carrying inventory?
– Only those costsOnly those costs of the purchasing company of the purchasing company that that change with the quantity of inventory change with the quantity of inventory heldheld

94
Considerations in Obtaining Considerations in Obtaining Estimates of Relevant CostsEstimates of Relevant Costs
What is the What is the relevant opportunity costrelevant opportunity cost of of capital?capital?
– It is the It is the return forgone by investing capital in return forgone by investing capital in inventoryinventory rather than elsewhere. rather than elsewhere.
– It is calculated as the required rate of return It is calculated as the required rate of return multiplied by multiplied by thosethose costs per unit thatcosts per unit that vary vary with the number of units purchasedwith the number of units purchased and that and that are incurred at the time the units are received.are incurred at the time the units are received.

95
Economic-Order-Quantity Economic-Order-Quantity Decision ModelDecision Model
What are the relevant total costs?What are the relevant total costs? The formula for The formula for relevant total costsrelevant total costs (RTC)(RTC) is: is: RTC = RTC =
Annual relevant ordering costs + Annual relevant Annual relevant ordering costs + Annual relevant carrying costscarrying costs
RTC = RTC = (( )) × P + × P + (( ) ) × C = + × C = +
Q can be any order quantity, not just EOQQ can be any order quantity, not just EOQ..
DQ
Q 2
DP Q
QC 2
96
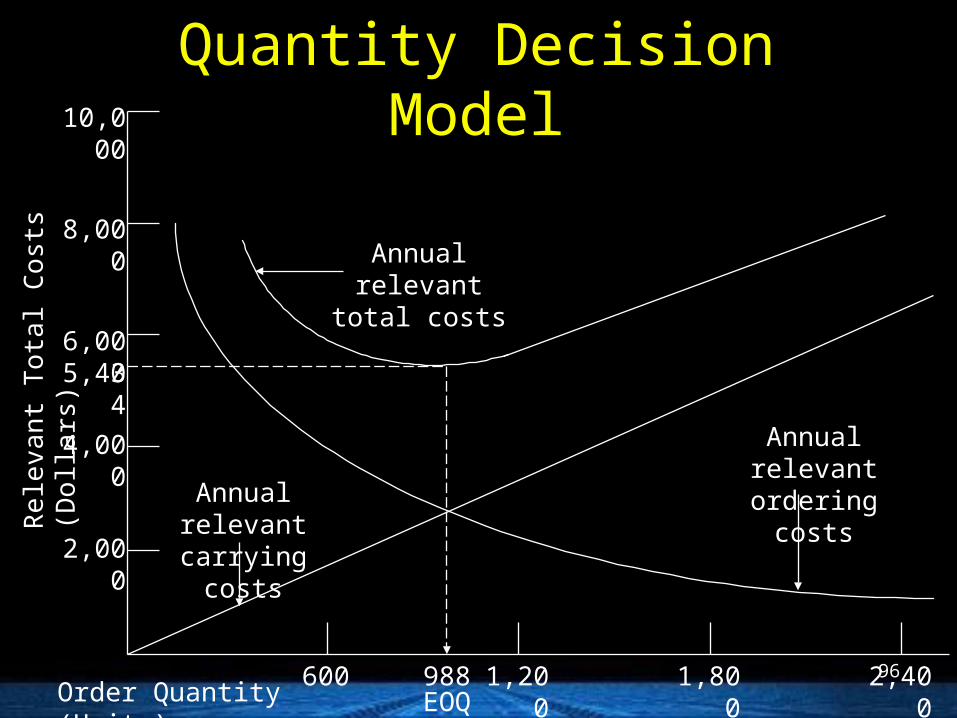
Economic-Order-Quantity Economic-Order-Quantity Decision ModelDecision Model
Rel
evan
t Tot
al C
osts
(D
olla
rs)
2,000
4,000
6,000
8,000
10,000
5,434
600 1,200 1,800 2,400988EOQ
Annual relevant carrying costs
Annual relevant total costs
Annual relevant ordering costs
Order Quantity (Units)
97
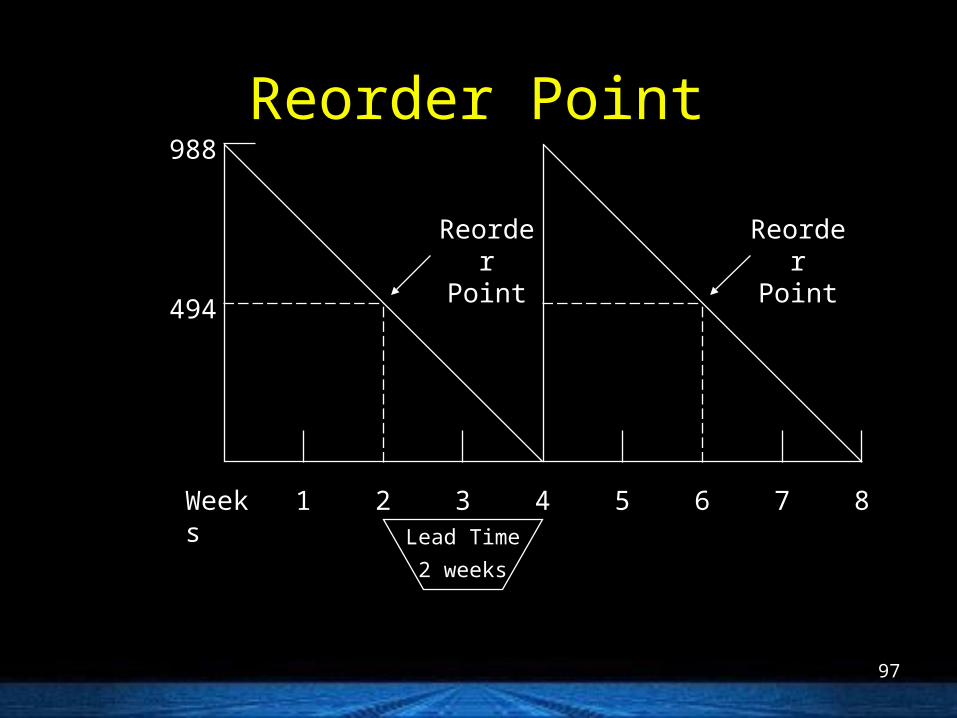
Reorder PointReorder Point988
494
Weeks 1 2 3 4 5 6 7 8
Reorder Point
Reorder Point
Lead Time
2 weeks
98
Safety StockSafety Stock
Safety stock Safety stock is is inventory held at all timesinventory held at all times regardless of the quantity of inventory ordered regardless of the quantity of inventory ordered using the EOQ model.using the EOQ model.
Safety stock is used as a Safety stock is used as a buffer against buffer against unexpected increases in demandunexpected increases in demand or lead time or lead time and unavailability of stock from suppliers.and unavailability of stock from suppliers.

99
Evaluating Managers and Evaluating Managers and Goal-Congruence IssuesGoal-Congruence Issues
Goal-congruenceGoal-congruence issues can arise when there issues can arise when there is an is an inconsistency between the EOQ decision inconsistency between the EOQ decision model and the model used to evaluate the model and the model used to evaluate the performanceperformance of the manager implementing of the manager implementing the inventory management decisions.the inventory management decisions.

100
Materials Requirement Materials Requirement Planning (MRP)Planning (MRP)
Materials requirements planning (MRP) Materials requirements planning (MRP) systems systems take a “take a “push-throughpush-through” approach that ” approach that manufactures finished goods for inventory on manufactures finished goods for inventory on the basis of the basis of demand forecastsdemand forecasts..
MRP predetermines the necessary outputs at MRP predetermines the necessary outputs at each stage of production.each stage of production.
Inventory management is a key challenge in Inventory management is a key challenge in an MRP systeman MRP system..

101
Just-In-Time Production SystemsJust-In-Time Production Systems
Just-in-time (JIT) production systems Just-in-time (JIT) production systems take a take a ““demand pulldemand pull” approach in which goods are ” approach in which goods are only manufactured to satisfy customer ordersonly manufactured to satisfy customer orders ..
Demand triggersDemand triggers each step of the each step of the productionproduction process, starting with customer demand for a process, starting with customer demand for a finished product at the end of the process, to finished product at the end of the process, to the demand for direct materials at the the demand for direct materials at the beginning of the process.beginning of the process.
102
Major Features of a JIT SystemMajor Features of a JIT System
The five major features of a JIT system are:The five major features of a JIT system are:1 Organizing production in Organizing production in manufacturing cellsmanufacturing cells2 Hiring and retaining Hiring and retaining multi-skilled workersmulti-skilled workers3 Emphasizing Emphasizing total quality managementtotal quality management4 Reducing manufacturing lead time and setup Reducing manufacturing lead time and setup
timetime5 Building Building strong supplier relationshipsstrong supplier relationships

103
Benefits of JIT SystemsBenefits of JIT Systems
Benefits of JIT production:Benefits of JIT production:– Lower carrying costsLower carrying costs of inventory of inventory– EliminatingEliminating the root causesthe root causes of rework, scrap, of rework, scrap,
waste, and manufacturing lead time.waste, and manufacturing lead time.

104
Performance Measures and Performance Measures and Control in JIT ProductionControl in JIT Production
To manage and reduce inventories, the To manage and reduce inventories, the management accountant must design performance management accountant must design performance measures to measures to controlcontrol and and evaluate JIT productionevaluate JIT production..
What information may management accountants What information may management accountants use?use?– Personal observationPersonal observation by production line workers and by production line workers and
managersmanagers– Financial performance measuresFinancial performance measures, such as inventory , such as inventory
turnover ratiosturnover ratios
105
Performance Measures and Performance Measures and Control in JIT ProductionControl in JIT Production
What are What are nonfinancial performance nonfinancial performance measures of time, inventory, and qualitymeasures of time, inventory, and quality??– Manufacturing lead timeManufacturing lead time– Units produced per hourUnits produced per hour– Days’ inventory on handDays’ inventory on hand– Total setup time for machines/Total Total setup time for machines/Total
manufacturing timemanufacturing time– Number of units requiring rework or scrap/Total Number of units requiring rework or scrap/Total
number of units started and completednumber of units started and completed

106
Backflush CostingBackflush Costing
A A unique production systemunique production system such as JIT often such as JIT often leads to its own leads to its own unique costing systemunique costing system..
Organizing manufacturing in cells, reducing Organizing manufacturing in cells, reducing defects and manufacturing lead time, and defects and manufacturing lead time, and ensuring timely delivery of materials enables ensuring timely delivery of materials enables purchasing, production, and sales to occur in purchasing, production, and sales to occur in quick succession with minimal inventoriesquick succession with minimal inventories..

107
Backflush CostingBackflush Costing
Where Where journal entriesjournal entries for one or more stages for one or more stages in the cycle are in the cycle are omittedomitted, the journal entries for , the journal entries for a subsequent stage a subsequent stage use normal or standard use normal or standard costs to work backward to flush outcosts to work backward to flush out the costs the costs in the cycle for which journal entries were not in the cycle for which journal entries were not made.made.

108
Trigger PointsTrigger Points
Stage A: Purchase of direct materialsStage A: Purchase of direct materials Stage B: Production resulting in work in Stage B: Production resulting in work in
processprocess Stage C: Completion of a good finished unit Stage C: Completion of a good finished unit
or productor product Stage D: Sale of finished goodsStage D: Sale of finished goods

109
Trigger PointsTrigger Points
Assume Assume trigger points A, C, and D.trigger points A, C, and D. This company would have two inventory accounts:This company would have two inventory accounts:
Type Account Title Type Account Title 1. Combined materials1. Combined materials Inventory: MaterialInventory: Material and materials in work-in- and materials in work-in- and In-Processand In-Process process inventoryprocess inventory ControlControl
2. Finished goods2. Finished goods Finished GoodsFinished GoodsControlControl

110
Trigger PointsTrigger Points
Assume Assume trigger points A and D.trigger points A and D. This company would have one inventory account:This company would have one inventory account: Type Account Title Type Account Title
Combines direct materials Combines direct materials InventoryInventory inventory and any direct inventory and any direct ControlControl materials in work-in-process materials in work-in-process and finished goods inventories and finished goods inventories
111
Special Considerations in Backflush Special Considerations in Backflush CostingCosting
Backflush costing does Backflush costing does not necessarily not necessarily comply with GAAPcomply with GAAP– However, However, inventory levelsinventory levels may be may be
immaterialimmaterial, negating the necessity for , negating the necessity for compliancecompliance
Backflush costing does Backflush costing does not leave a good audit not leave a good audit trailtrail – the ability of the accounting system to – the ability of the accounting system to pinpoint the uses of resources at each step of pinpoint the uses of resources at each step of the production processthe production process