Embed Size (px)
Citation preview

1
1 REVISION 2
Crystallization experiments in rhyolitic systems: the effect of 2
temperature cycling and starting material on crystal size 3
distribution 4
Marize Muniz da Silva1,2*
, Francois Holtz1 and Olivier Namur
15
1 Leibniz Universität Hannover, Institut of Mineralogy, Callinstr. 3, 30167, Hannover, Germany; 6
2 Departamento de Geologia, Instituto de Geociências, Universidade Federal do Rio de 7
Janeiro, Cidade Universitária, 21949-900 Ilha do Fundão, Rio de Janeiro, RJ, Brazil; 8
E-mail: [email protected]; [email protected];9
11
Abstract 12
One of the various problems faced in experimental petrology is the fact that most 13
experimental products obtained by crystallization experiments are too small, making their 14
accurate identification by electron microprobe and laser ablation analyses very difficult. This 15
problem is magnified when a highly polymerized starting material is used for experiments at 16
low temperature (e.g. 700°C - 800°C). In this study, we present the results of crystallization 17
experiments performed using a rhyolitic starting glass in which we test the potential of 18
temperature cycling and pre-hydrated starting material to increase crystal size and discuss the 19
effect of those variables on the attainment of chemical equilibrium. Experiments were 20
performed at different temperatures (725 to 815°C) and pressures (1 and 2 kbar), under water-21
saturated conditions (aH2O = 1; with aH2O being the water activity). During the experiments, 22
temperature was either constant or cycled to ± 15°C around the target temperature during the 23
first half of the runs. We used either a pre-hydrated (7 wt.% H2O) rhyolitic glass or a dry 24
rhyolitic glass to which 7 wt.% H2O was added during capsule preparation. 25

2
Our results differ between 1 and 2 kbar experiments. At 1 kbar, plagioclase and 26
orthopyroxene were the main crystalline phases affected and temperature cycling (±15°C) did 27
not increase the crystal size of these phases. In contrast, if only the nature of the starting 28
material is considered (dry glass vs. pre-hydrated), the use of a pre-hydrated starting material 29
successfully increased the overall crystal size and decreased the crystal number density. At 2 30
kbar, plagioclase and amphibole were the main phases and the largest crystals were also 31
obtained when pre-hydrated starting material was used. Contrary to experiments at 1 kbar, 32
temperature cycling also increased the overall crystal size. The different effects of 33
temperature cycling at 1 and 2 kbar are attributed (1) to the different cation diffusivities at 1 34
and 2 kbar caused by different melt water concentrations and (2) the negligible effect of 35
temperature cycling at 1 kbar (±15°C) is explained by little dissolution of phases, so that 36
small crystals were already too large to be completely consumed by the dissolution process in 37
the high temperature interval. The results demonstrate that temperature oscillation (depending 38
on the amplitude) and the nature of the starting material (pre-hydrated vs. dry glass + water) 39
are two parameters that can contribute to increase crystal sizes in experiments with rhyolitic 40
melts. However, we also observed that the use of a pre-hydrated starting material increased 41
the occurrence of zoned plagioclase crystals which may indicate that chemical equilibrium 42
was not perfectly reached. 43
Keywords: Crystallization experiment, Temperature cycling, Crystal size distribution, 44
Rhyolite 45
Introduction 46
Experimental petrology and high pressure technologies have been widely used in the last 47
century to understand the crystallization history of magmatic systems. In addition, all 48
thermodynamic models predicting liquid lines of descent are based on experimental 49
databases. The pre-requisite for accurate models is that equilibrium between solid phases, 50
fluids and silicate melts is reached. However, attaining complete equilibrium between highly 51

3
polymerized melts and silica-rich crystals, such as feldspar, is difficult and becomes even 52
more complicated when crystallization experiments are performed under low temperature 53
conditions (700 – 800°C). This is mainly due to the high viscosity of the melt that makes 54
diffusion of chemical components very slow and extremely long experimental durations are 55
thus needed to obtain complete chemical equilibration between crystals and melt (e.g. 56
Pichavant et al. 2007; Fenn 1977). 57
Two fundamentally different methods to experimentally constrain phase equilibria in 58
magmatic systems are generally used: crystallization experiments (e.g. Scaillet et al. 2016) 59
and melting experiments (e.g., Rushmer 1995; Patino Douce et al. 1996; Patino Douce and 60
Harris 1998). Phase equilibria experiments in dacitic to rhyolitic systems need to be 61
conducted at low temperature (700°C – 900°C). At these conditions melting experiments 62
usually fail to reach bulk equilibrium due to slow diffusion of chemical components. For 63
melting experiments, if a natural rock powder with grain sizes of 30 – 60 µm is used as 64
starting material, there will be a large proportion of minerals that may not reach complete 65
equilibrium. This is commonly observed when using plutonic rock powders as starting 66
material as well as volcanic rock powders, which contain microlites or phenocrysts (e.g, 67
Venezky and Rutherford 1999; Shea and Hammer 2013). For crystallization experiments, 68
synthetic oxide powders are often used (e.g. Charlier and Grove 2012; Nandedkar et al. 2014) 69
and succeed in reaching equilibrium in high temperature experiments with basaltic systems. 70
They can however lead to the formation of meta-stable phases in experiments with high 71
viscosity melts (e.g. formation of mullite from Al2O3, for example; Holtz et al., 1992). The 72
use of an amorphous phase such as a gel (e.g., Tuttle and Bowen 1958; James and Hamilton 73
1969) or a glass (e.g., Pichavant 1987; Scaillet et al. 2016) is therefore better suited for phase 74
equilibria experiments in silicic systems. With an amorphous starting material, equilibrium 75
conditions are easier to reach in rhyolitic and dacitic systems, but experimental products 76
usually contain extremely small crystals. These small crystals represent a severe limitation in 77

4
experimental petrology because they very often cannot be identified or accurately measured 78
by methods such as electron microprobe or laser ablation inductively coupled plasma mass 79
spectrometry (LA-ICPMS). 80
Temperature cycling during experiments has recently been proven extremely helpful 81
to increase the size of crystals in basaltic systems at 1 atm (Mills & Glazner 2013) or under 82
pressure (Erdmann & Koepke 2016), but the benefit of this approach has never been 83
quantitatively tested in rhyolitic systems. Crystal nucleation and growth strongly depend on 84
the degree of undercooling with low undercooling resulting in larger crystals (Lofgren, 1974; 85
Fenn 1977). Thermal cycling provides another opportunity to form large crystals because 86
components can be redistributed among phases. Melting the small crystals during heating 87
episodes of a temperature oscillation may lead to the formation of larger crystals during the 88
cooling episodes. Here we tested the potential of temperature cycling to increase crystal and 89
melt pool sizes in a highly polymerized rhyolitic system at low temperature (725°C - 815°C) 90
and moderate pressure (1 and 2 kbar). We also investigated the effect of temperature cycling 91
on the attainment of chemical equilibrium. We used two different approaches to perform our 92
crystallization experiments. The first approach, which is the most commonly applied in 93
experimental petrology, is to use a dry glass powder to which we add water (or other 94
volatiles) during capsule preparation. The second approach, which is less commonly used, is 95
to pre-saturate the glass with volatiles using high pressure vessels. In the first case, the 96
hydrous glass is produced during the experimental run by diffusion of H2O from a vapor 97
phase into an initially dry glass. This implies that when the experiment starts, the fluid phase 98
is heterogeneously distributed in the capsule. In the second approach, crystals grow from a 99
melt in which volatiles are already distributed homogeneously. Our experiments show that 100
temperature cycling does not affect phase relationships or composition of the crystals but may 101
significantly increase crystal sizes, as does the use of pre-hydrated starting material. 102
Methodology 103

5
General experimental strategy 104
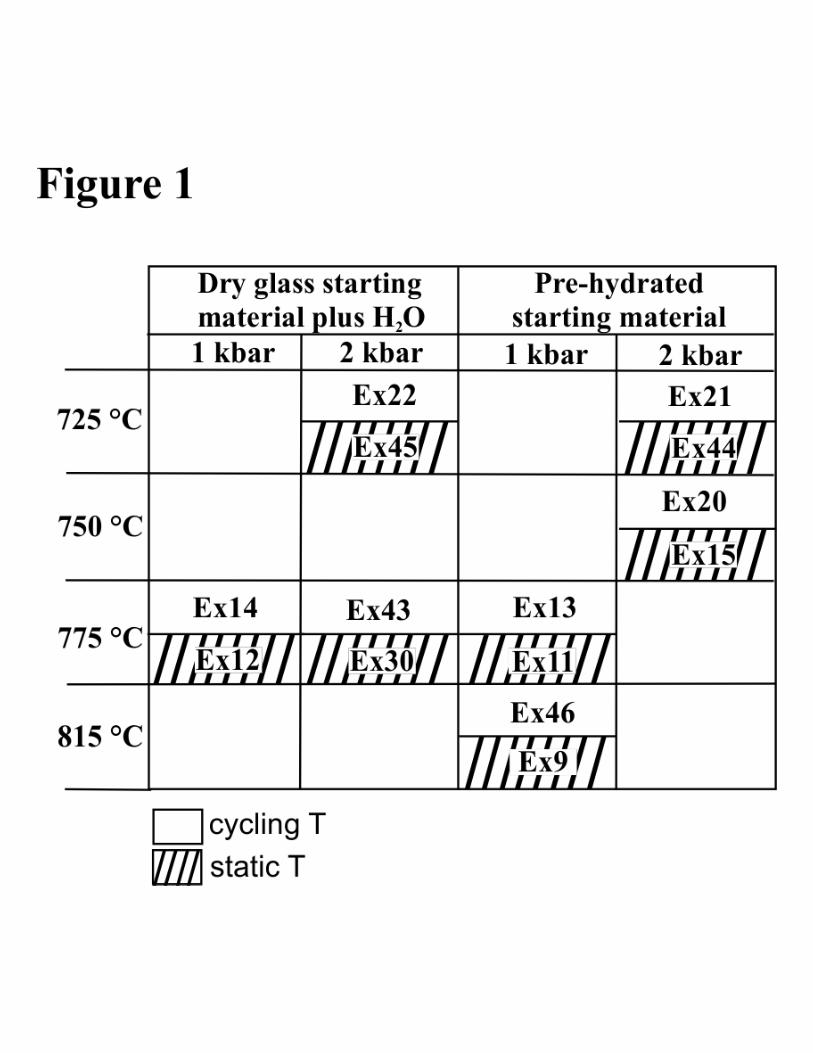
The general methodology and the experimental conditions applied in this study are shown 105
schematically in Fig. 1 and are designed to compare four types of experimental approaches: 106
crystallization from a dry powder plus added water during capsule preparation, with and 107
without temperature cycling and crystallization from a pre-hydrated glass powder, with and 108
without temperature cycling. We performed a total of 14 crystallization experiments on a 109
single composition, at temperatures between 700°C and 815°C and pressures of 1 and 2 kbar. 110
111
Starting material 112
Dry glasses: All experiments were performed using a synthetic glass of rhyolitic composition 113
prepared from a mixture of pure oxide (SiO2, TiO2, Al2O3, Fe2O3, MnO) and carbonate 114
(CaCO3, Na2CO3, K2CO3) powders, mixed using an agate ball mill. The starting material was 115
melted twice in a platinum crucible at a temperature of 1600°C and 1 atm for 4 hours, 116
followed by immersion of the crucible in water for rapid quench. Between the two melting 117
procedures, the sample was crushed and ground in a rotary mortar. The composition and 118
homogeneity of the glass were determined by electron microprobe analyses (Table 1). 119
120
Pre-hydrated glasses: A total of three capsule were prepared where 93 wt.% of dry glass 121
(400, 400 and 700 mg) and 7% wt.% of H2O were loaded in gold/palladium (Au80Pd20) 122
capsules (to avoid Fe loss). Capsules were then run in an internally heated pressure vessel 123
(IHPV) at 1200°C and at a pressure of 3 kbar for 24 hours. After the runs, the water content in 124
the quenched glass was measured by Karl-Fischer titration (see details in Behrens et al. 1996). 125
Measurements were performed on 10 to 24 mg of pre-hydrated material, which is sufficient to 126
obtain reliable results with an uncertainty smaller than 0.15 wt.% H2O. To check the 127
homogeneity of the samples, the analyzed aliquots were taken from the top and the bottom of 128

6
each gold/palladium capsule. Measured water concentrations range from 6.86 to 7.02 wt.% 129
H2O and we did not find any obvious vertical variability. 130
131
Capsule preparation for crystallization experiments: (1) pre-hydrated starting material was 132
crushed in a mortar and ~30 mg of this material were loaded in 12 mm long Au capsules (3.2 133
mm outer diameter and 0.2 mm wall thickness) that were welded shut or (2) dry glass powder 134
(93 wt.%; 30 mg) and 7 wt.% of deionized H2O were loaded into Au capsules (same size as 135
before) and welded shut. To ensure that no fluid escaped during welding, the weight of the 136
loaded capsule was measured before and after the welding procedure. 137
138
Experimental Apparatus 139
Crystallization experiments were performed at the Leibniz Universität Hannover (LUH) in 140
Renee-41 cold-seal pressure vessels (CSPV). The CSPVs are arranged horizontally and water 141
is used as the pressure medium. The temperature during the experiments was continuously 142
recorded by an external sheathed K-type thermocouple, placed in a borehole at the end of the 143
autoclave near the hot zone. The CSPVs are equipped with a ramp/soak temperature 144
controller REX-P24 that allows automatic temperature oscillation as a function of time. The 145
relation between the measured temperature (external thermocouple) and the temperature at the 146
sample position was calibrated at: (1) atmospheric pressure in the temperature interval of 200 147
to 850°C using a self-made calibration device and a certified thermocouple and (2) at 1 kbar 148
over the same temperature interval using the self-made calibration device. This device 149
consists of three K-type thermocouples positioned side by side, with three different lengths 150
(positions A, B and C) covering the hot zone of the CSPV. Positions A, B and C are at 7, 27 151
and 46 mm respectively from the end of the borehole of the vessel. The uncertainties of the 152
thermocouples is ±1.3°C for temperatures > 700°C and ±0.6°C for temperatures < 700°C. 153
During calibration, temperature fluctuations (in each position) were not higher than ±2°C and 154

7
we estimated that the uncertainty of the temperature measured during experiments is ±5°C. 155
We found that the temperature gradient along the hot zone of the CSPV is variable and may 156
reach up to 60°C. To minimize temperature variation during experiments, our capsules did not 157
exceed 12 mm in length in order to fit in the position closest to the external thermocouple 158
(position A). Water pressure was monitored with a transducer calibrated against a strain gauge 159
monometer, with an uncertainty of ±0.03 kbar. The amount of water needed to increase the 160
pressure from 0 to 2 kbar is 300 ml. The intrinsic oxygen fugacity of the CSPV is close to 161
NNO (Ni-NiO) oxygen fugacity buffer (Gardner et al. 1995). 162
163
Experimental procedure 164
In each experimental run, two capsules were inserted into each CSPV and placed side by side 165
in position A. For each run, one capsule contained a dry glass with 7 wt.% H2O while the 166
other one contained the pre-hydrated glass. The pressure vessel was then inserted into a pre-167
heated furnace and 20 to 30 minutes were sufficient to reach the target temperature. Run 168
durations were 21 days for twelve experiments and 14 days for two experiments (Table 2). As 169
shown in Fig. 1, we applied temperature cycling to some experiments. For cycled 170
experiments, the temperature path was as follows: temperature oscillation was started at the 171
beginning of the experiment, with a amplitude of +15°C above and then -15 °C below the 172
final equilibrium temperature (e.g., 725°C, 750°C, 775 °C and 815°C). The variation of 30°C 173
between the high and low temperatures was attained within two hours (0.5°C/min). The upper 174
and lower temperatures were held constant for one hour (Supplementary Dataset A). No 175
significant pressure change (< 0.07 kbar) was observed as a result of the temperature 176
variation. Temperature cycling was conducted for 14 days (only 7 days for one of the 177
experiments) and the temperature was then kept constant for another 7 days. At the end of the 178
experiments, the products were quenched by cooling the autoclave with a stream of 179

8
compressed air for 30 to 40 minutes. During quenching, the pressure was kept constant until 180
the autoclave reached ~20°C. Pressure was then released. 181
182
Analytical techniques 183
Run products were mounted in epoxy and polished for analysis. Experiments were analyzed 184
with an electron microprobe (Cameca SX100) at LUH. For mineral analysis, we used a 185
focused beam with a current of 15 nA. For glasses, we used a beam current of 4 nA and a spot 186
size of 10 µm. Minerals and glasses were analyzed with an acceleration voltage of 15 kV. 187
Counting times were 10 s on peaks and 5 s for background on both sides. Calibration of the 188
electron microprobe was based on natural and synthetic standards: albite for Na; wollastonite 189
for Ca and Si; orthoclase for K, Durango apatite for P; Al2O3 for Al; Mn2O3 for Mn; TiO2 for 190
Ti; MgO for Mg; and Fe2O3 for Fe. Calibrations were independently checked against external 191
natural mineral standards: plagioclase (Labradorite) Lake County (USNM 115900); 192
hornblende, Kakanui, New Zealand (USNM 143965); augite, Kakanui, New Zealand (USNM 193
122142; Jarosewich et al. (1980), and glasses: rhyolite from Yellowstone, USA (Nash 1992) 194
and Ja-rhyolite (USNM72857 VG-568; Jarosewich et al. 1980). 195
196
Crystal size distribution analysis 197
Crystal size distribution (CSD) analyses of plagioclase, amphibole or pyroxene were 198
performed using back-scattered electron (BSE) images acquired with the electron microprobe. 199
The analysis consisted of the measurement of two-dimensional parameters corresponding to 200
the longer axis and the orthogonal short axis (length and width respectively) of each crystal 201
using the open source computer program ImageJ (Schneider et al. 2012; 202
http://imagej.nih.gov/ij/). For the characterization of the crystal sizes, at least seven BSE 203
pictures at the same magnifications (1600X, 800X or 400X) were analyzed for each sample. 204
The magnifications were chosen based on the average size and number of crystals to ensure 205

9
that a minimum of 90 crystals could be measured for each experiment. The magnifications 206
translate to sample area per image of 0.27 mm2 (400X) and 0.02 mm2 (1600X). The crystal 207
size measurement was manual and each crystal in the image was measured individually. The 208
data (length and width) were used to calculate the approximate area of the surface of each 209
crystal, their frequency distribution, crystal area fraction (ϕ) and crystal number density. The 210
crystal number density (NA) is the frequency, for each size interval (bins), divided by the total 211
area measured (Higgins 2000) while the crystal surface area was calculated by multiplying 212
length and width and was used to obtain crystal area fraction. The crystal area fraction was 213
calculated by dividing the total crystal area by the total area measured. The ϕ and NA were 214
then used to calculate a characteristic crystal size (SN = (ϕ/NA)0.5) and volume crystal density 215
(Nv = NA/ SN) (Blundy and Cashman 2008). 216
The number of crystals analyzed per photo mosaic was variable: plagioclase from 210 to 217
2017; amphibole from 115 to 605; and pyroxene from 98 to 370. In all experimental samples, 218
amphibole or pyroxene crystals have lower crystal number densities than plagioclase. 219
220
Experimental results 221
Dry powder vs. pre-hydrated melt 222
Plagioclase and pyroxene were used for two-dimension crystal size analyses for experiments 223
performed at 1 kbar while plagioclase and amphibole were used for experiments performed at 224
2 kbar (their compositions can be found in Supplementary Datasets B, C and D). All 225
experiments with pre-hydrated glass as starting material (Ex11, Ex13 at 1 kbar and Ex44 at 2 226
kbar; Fig. 1) have larger plagioclase (Figs. 2A and 3A), pyroxene (Figs. 2B) or amphibole 227
crystals (Fig. 3B) than those found in experiments with dry glass and H2O as starting material 228
(Ex12 and Ex14 at 1 kbar and Ex45 at 2 kbar). 229

10
At 1 kbar, when we compare crystal sizes in the runs in which temperature was kept constant 230
(Ex11 and Ex12), we observe that the experiment with pre-hydrated glass (Ex11) exhibits 231
plagioclase and pyroxene crystals up to a maximum of four times larger than those found in 232
the experiment where dry glass and water was used (Ex12) (Figs. 2A and 2B). In experiments 233
where temperature was cycled (Ex13 and Ex 14) plagioclase and pyroxene are only slightly 234
larger in the pre-hydrated experiments (Ex13) than in experiments with dry glass plus water 235
(Ex14) (Supplementary Dataset E). Similar crystal size distributions are observed in 236
experiments performed at 2 kbar. Plagioclase and amphibole present a maximum crystal size 237
up to two times larger in the experiments performed with pre-hydrated starting material 238
(Ex44) than in the one with dry glass (Ex45) (Fig. 3A and 3B). 239
In experiments performed at static temperature, we observe that in the charges with dry glass 240
and water (Ex12 and Ex45) plagioclase and pyroxene are respectively 50% to 90% and 20% 241
to 30% more abundant in number of crystals than in experiments where pre-hydrated starting 242
material (Ex14 and Ex44) was used, considering the same area. For experiments in which 243
temperature was cycled, we observe that only the number of plagioclase crystals was more 244
abundant using dry glass rather than pre-hydrated starting material. In contrast, the pyroxene 245
crystal number was found to be lower. 246
Qualitative analyses of crystal morphology (Lofgren, 1974) show that plagioclase crystal 247
shape was strongly affected by changing the nature of the starting material. In runs performed 248
with pre-hydrated glass, skeletal crystals dominate. In contrast, when dry starting material and 249
water was used tabular crystals prevail (see Figs. 4 and 5). 250
Concerning mineral compositions, no chemical zoning was observed in plagioclase, pyroxene 251
or amphibole crystals in Ex11, Ex12, Ex13, Ex14 (1 kbar) and in Ex44, Ex45 (2 kbar). 252
However, a significant variability of the plagioclase An (anorthite) content is observed 253
between crystals of individual experiments (see Supplementary Dataset A; Fig. 6). This 254
variability is usually larger for experiments performed on dry glass plus water than on pre-255

11
hydrated glass. Pyroxene compositions equivalent in Ex13 and Ex14, while in Ex12 this 256
mineral is slightly enriched in Fe in comparison to Ex11 (Fig. 7). Amphibole composition 257
also present small variation between experiments and Ex44 shows higher amphibole Mg 258
number [Mg/(MA+Fe2+)] than Ex45 (see Supplementary Dataset B; Fig. 8). Residual melt 259
composition present small variability with Ex11 (pre-hydrated; 1 kbar), Ex14 (dry glass; 1) 260
and Ex45 (dry glass; 2 kbar) showing higher Na2O than Ex12 (dry glass; 1), Ex13 (pre-261
hydrated; 1 kbar), and Ex44 (pre-hydrated; 2 kbar). In addition, Ex14 exhibits higher K2O 262
content than Ex13 (Table 3). 263
264
1 kbar vs. 2 kbar experiments 265
At 1 kbar orthopyroxene is the dominant mafic phase but amphibole and biotite are observed 266
in experiments performed at 2 kbar. Plagioclase, ilmenite and magnetite were identified at 267
both pressures. Plagioclase is the only mineral that can be used to estimate the effect of 268
pressure on crystal sizes. Experiments performed at 2 kbar (Ex30 and Ex43) produced larger 269
crystals than experiments performed at 1 kbar (Ex12 and Ex14). When dry starting material 270
was used under static temperature, the maximum size of plagioclase crystals was up to three 271
times larger in the 2 kbar experiment (Ex30) than in the 1 kbar experiment (Ex12) (Fig. 9A). 272
When temperature was cycled, the maximum size of plagioclase crystals was up to five times 273
larger at 2 kbar (Ex43) than at 1 kbar (Ex14) (Fig. 9B). 274
Regardless of the temperature path (cycling vs. static temperature), experiments at 2 kbar 275
exhibit a lower plagioclase density than experiments at 1 kbar. For experiments with 276
temperature cycling, considering the same area, Ex14 (1 kbar) has 99% more plagioclase 277
crystals in number than Ex43 (2 kbar). For experiments at constant temperature, Ex12 (1 278
kbar) exhibits only 6% more plagioclase crystals than Ex30 (2 kbar). No change of crystal 279
morphology is observed by changing pressure, and plagioclase at 2 kbar is more enriched in 280
An-component compared to plagioclase at 1 kbar (Fig. 6). A slight change of residual melt 281

12
composition is observed when comparing experiments at 2 kbar (Ex30 and Ex43) and 1 kbar 282
(Ex12 and Ex14) with higher Al2O3, CaO, Na2O and lower K2O content at high pressure (Tab. 283
3). 284
285
Constant temperature vs. temperature cycling 286
1 kbar experiments – Crystal size analyses were performed for plagioclase and pyroxene. 287
Comparing experiments performed with dry glass plus 7% of water, the experiment at static 288
temperature (Ex12) with very small plagioclase crystals (≤ 3 µm2) presents a higher crystal289
number density than the experiment in which temperature was cycled (Ex14) (Fig. 10A). 290
However, both experiments show a similar crystal number density of large plagioclase 291
crystals (~13 µm2) with Ex14 having slightly larger plagioclase crystals than Ex12 (Fig. 10A).292
For pyroxene, temperature cycling did not effectively influence crystal growth and the static 293
experiment (Ex12) resulted in larger crystals than the cycled one (Ex14) (Fig. 10B). Based on 294
analyses of BSE images, we conclude that, considering the same area, Ex12 (constant 295
temperature) displays ~24% more plagioclase and ~17% more pyroxene (Fig. 4) crystals than 296
Ex14 (cycled temperature). 297
When pre-hydrated starting material is used, experiments with temperature cycling (Ex13 and 298
Ex46) exhibit higher crystal number density of small plagioclase crystals than the static ones 299
(Ex9 and Ex11) (Fig. 10A). For pyroxene, the experiment with temperature cycling performed 300
at 775°C (Ex13) presents higher crystal number density of small crystals (≤ 3 µm2) than the301
static one (Ex11) (Fig. 10B). However, in the experiment performed at 815°C the static 302
experiment (Ex9) presents a slightly higher crystal number density of small crystals ( ≤ 3 303
µm2) than the one with temperature cycling (Ex46) (Supplementary Dataset F). All static304
experiments resulted in larger plagioclase and pyroxene crystals than the cycled ones. In 305
terms of crystal fractions, BSE image analyses show that considering the same area, the 306
cycling experiment with dry powder (Ex13) contains, in number of crystals, ~89% more 307

13
plagioclase and ~67% more pyroxene crystals than the corresponding static one (Ex11) while 308
Ex46 (cycling; pre-hydrated melt) contains ~66% more plagioclase and ~17% less pyroxene 309
crystals than the static one (Ex9). No changes in crystal morphology are observed when only 310
the temperature oscillation is taken into account (Fig. 4). 311
Plagioclase from experiments using pre-hydrated starting material and temperature cycling 312
(Ex13 and Ex46) show a smaller An range than plagioclases from experiments at constant 313
temperatures (Ex11 and Ex9). In contrast, when dry glass and water is used, the plagioclase 314
from the experiment at constant temperature (Ex14) exhibits a larger variation in An-content 315
than its conjugate run with cycling temperature (Ex12) (Fig. 6). Pyroxene shows a very 316
homogenous composition within individual samples but small compositional differences are 317
observed between static and cycling experiments (Fig. 7). 318
Normalized glass composition values do not show significant differences between the 815°C 319
experiments (Ex9-Ex46). For the 775°C experiments (Ex11 and Ex13), glass composition in 320
Ex11 is slightly more enriched in Al2O3, FeO, CaO and Na2O than Ex13, at the expense of 321
SiO2 (Table 3). 322
323
2 kbar experiments – Under this condition plagioclase and amphibole were the phases used 324
for crystal size analyses. Experiments with temperature cycling show consistently larger 325
plagioclase crystals than the static ones (Fig. 11A). For amphibole, we obtained contrasting 326
results. When dry starting material was used the largest amphibole crystals in cycling 327
experiments are approximately four times larger than those of static experiments (Fig. 11B). 328
When pre-hydrated starting material was used amphibole is slightly larger in experiments at 329
constant temperature (Fig. 11B). However, in experiments performed at 725°C, temperature 330
cycling (Ex21) resulted in a higher concentration of very small amphibole crystals (≤ 3 µm2) 331
than at static temperature (Ex44), while in experiments performed at 750°C we observe the 332
opposite. 333

14
In terms of number of crystals, experiments performed with static temperature always contain 334
more crystals that experiments performed with cycled temperature (Figs. 4 and 5). In most of 335
the experiments the morphology of plagioclase did not change when using temperature 336
cycling. However, in Ex22 (dry glass plus water) we observe the occurrence of tabular and 337
skeletal crystals while the corresponding static experiment (Ex45) only shows tabular crystals. 338
Plagioclase crystals do not display chemical zoning in most experiments performed at 2 kbar 339
with the exception of two charges (Ex20 and Ex21), with an compositional zoning varying 340
from ~38 mol% (core) to 32-34 mol% (rim) in An content. In addition to zoning, plagioclase 341
exhibits a significant compositional range of An within a single charge, with Ex15 (static 342
temperature) showing the largest range of An-content (An33 to An48) of all experiments 343
performed at 2 kbar (Fig. 6). No significant compositional variability was observed in 344
amphibole in individual experiments, with the exception of Ex43, but the amphibole Mg 345
number [Mg/(Mg+Fe2+)] varies between experiments (Fig. 8). Melt compositions vary 346
slightly between cycling and static experiments. Ex21 and Ex22 (cycling temperature) exhibit 347
higher Na2O and K2O than Ex44 and Ex45, while Ex15 (static temperature) present higher 348
Na2O and K2O than Ex20 (cycling temperature) (Table 3). 349
350
Discussion 351
Attainment of equilibrium 352
Reaching complete equilibrium between crystals and melt is difficult in experimental 353
petrology, and even more so at low temperatures (700 to 800°C) for highly polymerized melts 354
(high Si content). To reach near-equilibrium conditions in these situations, long run duration 355
experiments (weeks to a month) and homogenous starting materials are required. In this study, 356
we performed experiments with a run duration of 14 to 21 days using crushed homogenous 357
glass as starting material and under water-saturated conditions, which should facilitate the 358
attainment of equilibrium. 359

15
Classical evidences for equilibrium as mentioned in the literature are and identified in our 360
experiments are: (1) euhedral crystal shapes, without inclusions and evenly distributed 361
throughout the gold capsules and (2) chemically unzoned crystals, as well as homogeneous 362
melt composition. In our study, plagioclase crystals are usually euhedral, evenly distributed 363
throughout the capsules and unzoned in most of the experiments with exception of four runs 364
performed with pre-hydrated starting material (Ex9 and Ex46 at 1 kbar, and Ex20 and Ex21 at 365
2 kbar). However, when crystals from different locations within a single charge are analyzed, 366
they can present significant variations in anorthite content. The largest An range was observed 367
in Ex15 where plagioclase crystals show an An content ranging between An33 to An48. This 368
relatively large compositional variation can be observed in many studies of phase equilibria in 369
felsic systems (e.g., Scaillet et al., 1995). However, in such studies, only few plagioclase 370
crystals from each experiment were usually analyzed, in contrast to the systematic in this 371
study. Previous studies interpreted the variation of plagioclase An-content within individual 372
experiments to be caused by heterogeneous distribution of water at the beginning of 373
experiments, where the more calcic plagioclase crystallized before the water-melt equilibrium 374
was attained (Scaillet & Evans 1999; Costa 2004). However, this explanation probably needs 375
to be reconsidered, at least for the experiments in which pre-hydrated glasses were used as 376
starting material. For example, in Ex15 which was conducted with pre-hydrated glass, the 377
results may indicate that although plagioclase is not in complete equilibrium at the sample 378
scale, local equilibrium was attained. Such local variations may be due to different 379
crystallization rates of plagioclase and other Ca-bearing minerals such as amphibole. If 380
amphibole crystallizes faster than plagioclase, the local environment of this mineral may be 381
depleted in constituents forming amphibole, and plagioclase growing in the vicinity may 382
record this local change of melt composition (e.g., Pichavant et al. 2007). 383
In two charges (Ex20 and Ex21) a few plagioclase crystals show zoning with a relatively large 384
variation in An content between the core (37-38 mol% An) and the rim (31-34 mol% An). 385

16
Both experiments were performed with temperature cycling and pre-hydrated starting 386
material. The zoned plagioclase crystals were usually larger than the average minerals. We 387
speculate that diffusion in pre-hydrated glass is faster than in dry glass in the first hours of 388
experiments which helped crystal growth and consequently increased the chances of forming 389
crystals with normal zoning. 390
We carried out an additional test to evaluate equilibrium conditions comparing the glass and 391
mineral compositions of experiments performed at the same pressure and temperature. We 392
observed that experiments run in the same vessel are similar in composition, while 393
experiments run in separate vessels at the same P and T conditions may present variations in 394
Fe and Mg content. For example, Ex11 and 12 were run together at constant T in a new vessel 395
of the laboratory while, Ex13 and Ex14 (cycling T) were run in one of the oldest vessels. We 396
assigned the difference in Fe and Mg content between one set of experiments and the other to 397
possible differences in fO2 prevailing in the vessels, independently of temperature cycling. 398
The CSPVs are made of a Ni-based alloy and therefore, the intrinsic fO2 may change. 399
According to the results presented here, with pyroxenes from the older vessel showing higher 400
Mg and lower Fe content than those from the newer vessel, we assume that the intrinsic fO2 401
becomes slightly more oxidizing with time. 402
403
The effect of starting material on crystal phases 404
The experiment pairs conducted either at static temperature or with cycling temperature lead 405
to the same conclusions: (1) we observe the same mineral assemblages, and no systematic 406
change in mineral compositions between experiments performed with pre-hydrated glass and 407
dry glass. This means that the starting material does not influence phase relationships or 408
compositions; (2) most experiments conducted with pre-hydrated glass have larger and less 409
crystals than experiments conducted with dry powder. One possible explanation to this 410
observation is that the absence of fluid between the grains of the starting powder and the 411

17
homogeneous distribution of volatiles in the pre-hydrated starting glasses contribute to 412
reducing the nucleation of phases along grain boundaries during the initial stages of the 413
experiment. This observation also implies that fluid-absent experiments can be conducted at a 414
water activity which is controlled very accurately if pre-hydrated glasses with well-415
characterized water concentrations are used. However, it should be noted that all strongly 416
zoned plagioclase crystals identified in this study are in experiments performed using pre-417
hydrated starting material; (3) a possible inconvenience of using pre-hydrated starting 418
material is its strong effect on plagioclase crystal morphology. Skeletal, anhedral crystals with 419
rough surface are more common in such experiments than in those performed with a dry 420
glass. 421
Previous experimental studies demonstrated that plagioclase crystal morphology is strongly 422
dependent on the degree of supercooling (Lofgren, 1974; Corrigan, 1982). They showed that 423
the shape of plagioclase changes from tabular to skeletal with formation of dendrites and 424
spherulites when cooling rate increases. However, we obtained changes in plagioclase crystal 425
morphology from experiments with identical cooling rates, when we used a pre-hydrated 426
starting material (see Fig. 4 (Ex11 vs. Ex12); (Ex13 vs. Ex14) and Fig. 5 (Ex44 vs. Ex21)). 427
We speculate that a change of the dominant process of crystal growth occurs from interface-428
controlled when dry glass plus water is used to diffusion-controlled when pre-hydrated 429
starting material is used. Interface-controlled growth leads to planar, faceted morphology and 430
smooth surface (Kirkpatrick, 1975) while diffusion-controlled growth leads to cellular 431
morphology and skeletal shapes (Kirkpatrick, 1975; Hammer, 2008). 432
433
The effect of pressure on crystal phases 434
As already noted in several studies, variation of P in the range of 1 - 2 kbar can have a strong 435
effect on the stability of mafic phases. The mineral assemblage formed at 1 kbar is made up of 436
plagioclase, orthopyroxene, magnetite and ilmenite, while in 2 kbar experiments the 437

18
assemblage is integrated by plagioclase, amphibole, biotite, magnetite and ilmenite. Thus, this 438
study confirms that hydrous minerals such as amphibole and biotite are not stable at low 439
pressure when the water content of the melt is close to or below 4 wt% H2O (e.g., Rutherford 440
and Hill 1993; Venezky and Rutherford 1999; Cichy et al. 2011). 441
Interestingly, temperature cycling (±15°C) at 2 kbar increased plagioclase crystal size, while 442
at 1 kbar we observed the opposite effect. These differences are interpreted as being due to 443
properties of the silicate melt such as viscosity and diffusivity that are influenced, among 444
other parameters, (e.g. degree of polymerization and temperature) by the amount of water 445
dissolved in the melt. As our experiments were conducted at nearly water-saturated 446
conditions, one major difference between 1 and 2 kbar runs is that the water content in the 447
melt was in the range of 3.5 - 4 wt% H2O at 1 kbar and between 6 - 6.5 wt% H2O at 2 kbar. 448
Assuming that small changes in temperature (25°C) do not affect water solubility significantly 449
(Holtz et al. 1995) and using the models of water solubility from Behrens and Jantos (2001) 450
and the the model of Hess and Dingwell (1996) for calculation of viscosity, we calculate that 451
the melt viscosity in our experiments perfomed at 1 and 2 kbar is of 105.3 and 104.6 Pa.s, 452
respectively. Additionally, at 1 kbar, orthopyroxene (Ca-free phase) dissolved at high 453
temperature and crystallized at low temperature together with plagioclase, while at 2 kbar, 454
amphibole (Ca-bearing phase) was the mineral affected. This change in Ca concentration in 455
the melt with temperature cycling will be different in the 1 and 2 kbar experiments, possibly 456
affecting the kinetics of dissolution and growth of plagioclase. 457
458
The effect of temperature cycling on crystal phases 459
Experiments performed at 1 kbar. One possible explanation for the small effect of 460
temperature cycling on the crystal size at 1 kbar may be that the cycling amplitude chosen 461
(±15°C) was not high enough to completely dissolve the small crystals during the high 462
temperature interval. In one series of experiments, the experiment in which the temperature 463

19
was cycled not only has smaller crystals, but also presents a higher crystal number density 464
than the counterpart experiment in which temperature was constant (see Fig. 3A and Fig. 3B). 465
This observation could indicate that new nuclei, together with the growth of crystals that 466
survived dissolution at high temperature, formed when temperature decreased. As a 467
consequence, the overall crystal number density increased and the crystal size decreased. The 468
results observed in experiments at 815 (±15°C) corroborate this interpretation, since the 469
minerals exhibit less prominent size differences than those in the experiments performed at 470
775°C (±15°C). We also observed that in the experiments performed at 775°C (±15°C) the 471
largest plagioclase and pyroxene crystals are ~3 times larger in the static experiments (Fig. 472
3A). At 815 °C (±15 °C) the largest plagioclase is only ~2 times larger (Fig. 6A) and 473
pyroxene just slightly larger (Fig. 6B) in static than in cycling experiments. We speculate that 474
at the high temperature stage of 815°C ±15°C (830°C) experiments, the conditions are closer 475
to the liquidus temperature of pyroxene and therefore small crystals start to completely 476
dissolve. 477
Mills & Glazner (2013) demonstrated that at atmospheric pressure, the amplitude is one of the 478
major parameters that directly control the degree of crystal coarsening. Our results show that 479
for a highly polymerized starting material at 1 kbar and temperature of ≤ 815°C, the 480
amplitude of ±15°C will not increase the crystal size. However, at the same conditions, pre-481
hydrated starting material at constant temperature does indeed significantly increase crystal 482
size. 483
Experiments performed at 2 kbar. A large difference in the amount (number of 484
crystals considering the same surface area) of plagioclase and amphibole crystals was 485
observed between Ex30 (775°C) and Ex43 (775 ±15°C). Ex30 has ~99% more plagioclase 486
crystals and ~89% more amphibole crystals than Ex43. Approximately 97% of plagioclase 487
crystals in Ex30 (constant T) have a surface area of ≤ 0.00001 mm2 while the smallest 488
plagioclase crystal in Ex43 (cycling) has an area of 0.00005 mm2. A possible explanation for 489

20
this difference in crystal size and proportion is that with a temperature of 775°C and a cycling 490
amplitude of ±15°C, the maximum temperature reaches 790°C. The textures observed in Ex43 491
(Fig. 7) have lower crystal densities and larger and cleaner melt pools than other experiments, 492
indicating that this sample is close to liquidus temperature, therefore resulting in improved 493
dissolution of small crystals at the peak temperature and a smaller crystal number density. 494
495
Implications 496
This study shows that the best approach to increase plagioclase, pyroxene or amphibole 497
crystal sizes in crystallization experiments performed from highly polymerized melts, under 498
water-saturated conditions and at low temperatures (700°C – 800°C) is to use pre-hydrated 499
glass as starting material. However, the formation of zoned plagioclase crystals seems to be 500
favored by using pre-hydrated glass. 501
The effect of temperature cycling on crystal size changes between experiments at 1 kbar and 502
those performed at 2 kbar. Our explanation for this different behavior is that temperature 503
cycling is more effective if melt viscosities and cation diffusivities are low, which increases 504
the kinetics of crystal growth and dissolution. The temperature amplitude of cycling is also 505
important and cycling may have strong or minor effects, depending on the amount of phases 506
present during the high temperature stage of the temperature path. Finally, our methodological 507
study of crystallization processes indicates that the composition of plagioclase can vary by 508
nearly 10 mol% within one experiment, which may be due to small local compositional 509
variations related to the crystallization of other neighbor phases. This compositional range is 510
slightly lower in experiments with cycling temperature than in experiments performed at 511
static temperature (Fig. 6). 512
513
514
515

21
Acknowledgements 516
We would like to thank the head of the workshop at the Institute for Mineralogy at Leibniz 517
University Hannover, Ulrich Kroll, for technical support and Julian Feige for sample 518
preparation. Further thanks go to Eric Wolff and Chao Zhang for analytical support and to 519
Adriana Currin for language revision. We also would like to thank the editor Charles Lesher, 520
as well as the reviewers Julia Hammer and Ryan D. Mills for their comments and suggestions 521
that helped improve the manuscript. This work was funded by the DAAD and CNPq 522
(fellowship to the first author) and the Deutsche Forschungsgemeinschaft (DFG; project 523
HO1337/31 in the frame of the ICDP program). Olivier Namur acknowledges support from an 524
Emmy Noether program from the DFG. 525
526

22
REFERENCES CITED527
Behrens, H., Roman, C., Nowak, M., and Holtz, F. (1996) Near-infrared spectroscopic determination of water 528 species in glasses of the system MAlSi , O , ( M = Li , Na , K ) : an interlaboratory study, 2541. 529
Behrens, H., and Jantos, N. (2001) The effect of anhydrous composition on water solubility in granitic melts. 530 American Mineralogist, 86, 14–20. 531
Blundy, J., and Cashman, K. (2008) Petrologic Reconstruction of Magmatic System Variables and Processes. 532 Reviews in Mineralogy and Geochemistry, 69, 179–239. 533
Charlier, B., and Grove, T.L. (2012) Experiments on liquid immiscibility along tholeiitic liquid lines of descent. 534 Contributions to Mineralogy and Petrology, 164, 27–44. 535
Cichy, S.B., Botcharnikov, R.E., Holtz F., and Behrens, H. (2011) Vesiculation and Microlite Crystallization in 536 the ascending rhyodacitic magma of the 1991-95 Eruption of Unzen Volcano. Japan Journal of 537 Petrology, 52, 1469-1492. 538
Corrigan, G.M. (1982) The crystal morphology of plagioclase feldspar produced during isothermal supercooling 539 and constant rate cooling experiments. Mineralogical Magazine, 46, 433–439. 540
Costa, F. (2004) Petrological and experimental constraints on the pre-eruption conditions of holocene dacite 541 from volcan San Pedro (36 S, Chilean Andes) and the importance of sulphur in silicic subduction-542 related magmas. Journal of Petrology, 45, 855–881. 543
Erdman, M., and Koepke, J. (2016) Experimental temperature cycling as a powerful tool to enlarge melt pools 544 and crystals at magma storage conditions. American Mineralogist, 101, 960–969. 545
Fenn, P. (1977). The Nucleation and Growth of Alkali Feldspars From Hydrous Melts. The Canadian 546 Mineralogist, v. 15, p. 135–161. 547
Gardner, J.E., Rutherford, M., Carey, S., and Sigurdsson, H. (1995) Experimental constraints on pre-eruptive 548 water contents and changing magma storage prior to explosive eruptions of Mount St Helens volcano. 549 Bulletin of Volcanology, 57, 1–17. 550
Hammer, J.E. (2008) Experimental Studies of the Kinetics and Energetics of Magma Crystallization. Reviews in 551 Mineralogy and Geochemistry, 69, 9–59. 552
Hess, K.U., and Dingwell, D.B. (1996) Viscosities of hydrous leucogranitic melts : a non-Arrhenian model. 553 American Mineralogist, 81, 1297–1300. 554
Higgins, M.D. (2000) Measurement of crystal size distributions. American Mineralogist, 85, 1105–1116. 555 Holtz, F., Pichavant, M., Barbey, P., and Johannes, W. (1992) Effects of H2O on liquidus phase relations in the 556
haplogranitic system at 2 and 5 kbar. American Mineralogist, 77, 1223-1241. 557 Holtz, F., Behrens, H., Dingwell, D.B., and Johannes W. (1995) Water solubility in haplogranitic melts. 558
Compositional, pressure and temperature dependence. American Mineralogist, 80, 94-108. 559 James, R.S., and Hamilton, D.L. (1969) Phase relations in the system NaAlSi3O8-KAlSi3O8-CaAl2Si2O8-SiO2 at 560
1 kilobar water vapour pressure. Contributions to Mineralogy and Petrology, 21, 111-141. 561 Jarosewich, E., Nelen, J.A, and Norberg, J.A. (1980) Reference samples for electron microprobe and scanning 562
electron micropobe analyses. Geostandards Newsletter, 4, 43-47. 563 Kirkpatrick, R.J. (1975) Crystal Growth from the Melt : A Review. Am. Mineral., 60, 798–814. 564 Lofgren, G. (1974). An Experimental Study of Plagioclase Crystal Morphology: Isothermal Crystallization 565
American Journal of Science. 566 Mills, R.D., and Glazner, A.F. (2013) Experimental study on the effects of temperature cycling on coarsening of 567
plagioclase and olivine in an alkali basalt. Contributions to Mineralogy and Petrology, 166, 97–111. 568 Nandedkar, R.H., Ulmer, P., and Müntener, O. (2014) Fractional crystallization of primitive, hydrous arc 569
magmas: an experimental study at 0.7 GPa. Contributions to Mineralogy and Petrology, 167, 1–27. 570 Nash, W.P. (1992) Analysis of oxygen with the electron microrpobe: aplications to hydrated glasses and 571
minerals. American Mineralogist, 77, 453-7. 572 Pichavant, M. (1987) Effects of B and H2O on liquidus phase relations in the haplogranite system at 1 Kbar. 573
American Mineralogist, 72, 1056-1070. 574 Pichavant, M. Costa, F., Burgisser, A., Scaillet, B., M.C, and Poussineau, S. (2007) Equilibration scales in silicic 575
to intermediate magmas. Implications for experimental studies. Journal of Petrology, 00, 1-18 576 Patiño Douce, A.E., and Beard, J.S (1996) Effects of P, f(O2) and Mg/Fe ratio on dehydration melting of model 577
metagreywackes. Journal of petrology, 37, 999-1024. 578 Patino Douce, A.E., and Harris, N. (1998) Experimental constraints on Himalayan anatexis. Journal of petrology, 579

23
39, 689-710. 580 Rushmer, T. (1995) An experimental deformation study of partially molten amphibolite—application to low-581
melt fraction segregation. Journal of Geophysical Research, 100, 15681–15695. 582 Rutherford, M.J., and Hill, P.M. (1993). Magma ascent rates from amphibole breakdown: an experimental study 583
applied to the 1980-1986 Mount St. Helens eruption. Journal of Geophysical Research, 98, 19667-584 19685. 585
Scaillet, B., and Evans, B.W. (1999) The 15 June 1991 eruption of Mount Pinatubo. I. Phase equilibria and pre-586 eruption P–T–fO2–fH2O conditions of the dacite magma. Journal of Petrology, 40, 381–411. 587
Scaillet, B., Pichavant, M., and Roux, J. (1995) Experimental crystallization of Leucogranite Magmas. Journal of 588 Petrology, 36, 663-705. 589
Scaillet, B. Holtz, F., and Pichavant, M. (2016) Experimental constraints on the formation of silicic magmas. 590 Elements, 12, 109-114. doi: 10.2110/gelements.12.2.109 . 591
Schneider, C.A., Rasband, W.S., and Eliceiri, K.W. (2012) NIH Image to ImageJ: 25 years of image analysis. 592 Nature 445 Methods, 9, 671-675. 593
Shea, T.; Hammer, J. E. (2013). Oxidation in CSPV experiments involving H2O-bearing mafic magmas: 594 Quantification and mitigation. American Mineralogist, v. 98, n. 7, p. 1285–1296. 595
Tuttle, O.F., and Bowen, N.L. (1958) Origin of granite in light of experimental studies in the system 596 NaAlSi3O8-KAlSi3O8-SiO2-H2O. Geological Society of America Memoir, 74, 145 p. 597
Venezky, D.Y., and Rutherford, M.J. (1999) Petrology and FeTi oxide reequilibration of the 1991 Mount Unzen 598 mixed magma. Journal of Volcanology and Geothermal Research 89, 212–230. 599
600

24
Figure captions 601
Figure 1. Flow-chart of the experimental strategy. 602
603
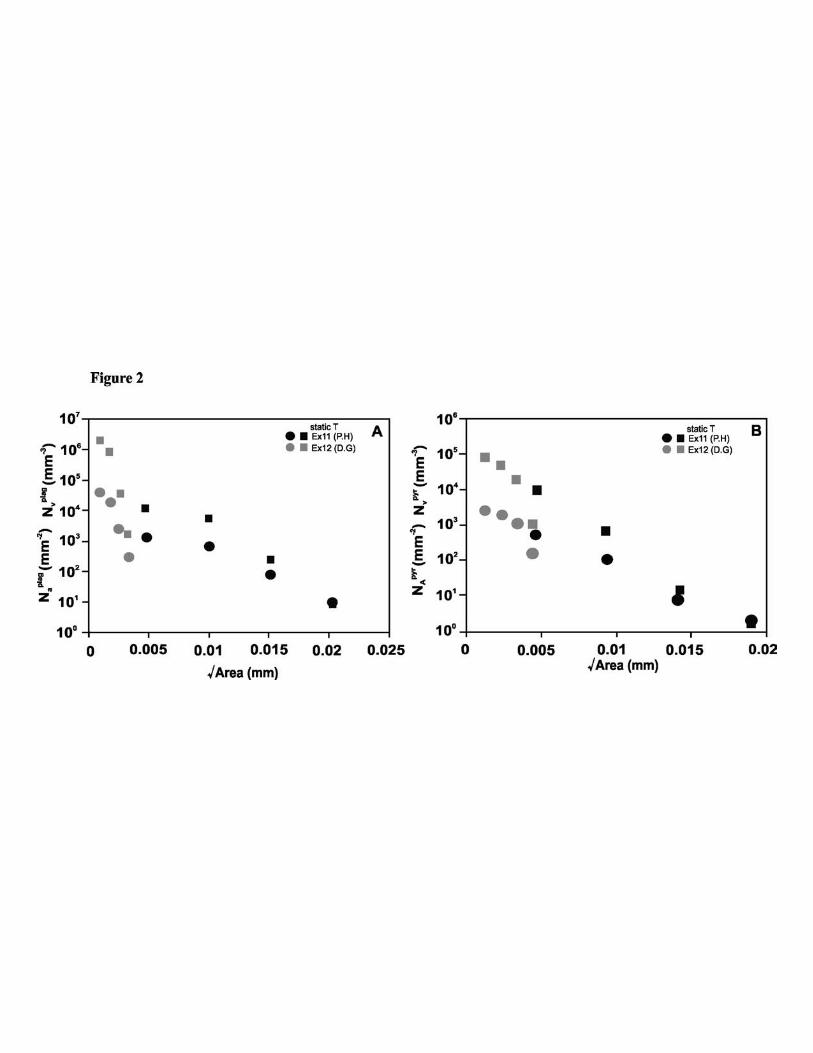
Figure 2. Log-plot of crystal and population number density vs. square root of plagioclase 604
(NAplag) and pyroxene (NA
pyr) surface area for Ex12 and Ex11. This figure illustrates the effect 605
of starting material on crystal size and on crystal number density. We observe that pre-606
hydrated starting material greatly increases plagioclase (A) and pyroxene (B) crystal sizes. 607
Experiments performed with dry glass exhibit higher crystal number density of smaller 608
plagioclase and pyroxene crystals. Circles represent area number density (NA, mm-2) and 609
squares represent population number density (Nv, mm-3). 610
611
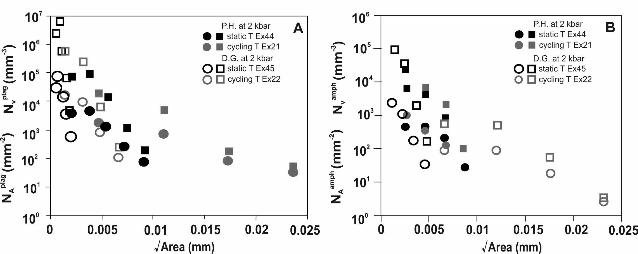
Figure 3. Log-plot of crystal and population number density of plagioclase (NAplag) and 612
amphibole (NAamph) vs. the square root of the mineral surface area for Ex45 and Ex44. At 2 613
kbar experiments performed with pre-hydrated starting material (Ex44) also present larger 614
plagioclase (A) and amphibole (B) crystals than those performed with dry glass (Ex44). In 615
addition, the experiment with dry glass (Ex45) exhibits a higher crystal number density than 616
the pre-hydrated experiment (Ex44). Circles represent area number density (NA, mm-2) and 617
squares represent population number density (Nv, mm-3). 618
619
Figure 4. Backscattered electron images (BSE) (see table 2 for run details) of experiments 620
performed at 1 kbar. The images show the differences in texture and in abundance of crystals 621
of different experiments. P.H.: Pre-hydrated and D.G.: Dry glass. Phase abbreviation: Pl, 622
plagioclase; OPX, orthopyroxene. 623
624

25
Figure 5. Backscattered electron (BSE) images (see table 2 for run details) of 2 kbar 625
experiments showing the differences in texture and crystal abundance between experiments 626
performed under constant or cycling temperature. P.H.: Pre-hydrated and D.G.: Dry glass. 627
Phase abbreviations: Pl, plagioclase; Amph, amphibole, Bt, biotite. 628
629
Figure 6. Ternary diagram of plagioclase composition. (A) Plagioclase chemical variation in 630
experiments performed at 1 kbar and (B) plagioclase compositional variation of experiments 631
performed and 2 kbar. Experiments performed at 2 kbar show a larger variation of An 632
(anorthite) content than experiments performed at 1 kbar. 633
634
Figure 7. Ternary diagram of orthopyroxene for experiments performed at 1 kbar. Pyroxene 635
crystals exhibit a homogenous composition within the same charge. 636
637
Figure 8. Amphibole compositional diagram for experiments performed at 2 kbar. Amphibole 638
Mg number [Mg/(Mg+Fe2+)] does not show a significant variation present within individual639
charges in almost all experiments with the exception of Ex43. It is however variable between 640
experiments. 641
642
Figure 9. Log-plot of crystal and population number density of plagioclase (NAplag) vs. the643
square root of the mineral area for Ex12 and Ex30, Ex14 and Ex43. Experiments performed at 644
2 kbar present larger plagioclase crystals than those performed at 1 kbar. Circles represent 645
area number density (NA, mm-2) and squares represent population number density (Nv, mm-3).646
647
Figure 10. Log-plot of crystal number density and population number density of plagioclase 648
(NAplag) and pyroxene (NA
pyr) vs. the square root of the mineral surface area. (A) Ex12 649
presents a higher concentration of small plagioclase crystals (≤ 3 µm2) than Ex14, while both 650
26
experiments present very similar crystal number densities of the larger (~13 µm2) crystals.651
Ex11 (static T) present larger plagioclase crystal number density than Ex13 (cycling T). 652
(B) Ex12 and 11 (static T) presents larger pyroxene crystals than Ex14 and Ex13 (cycling).653
Circles represent area number density (NA, mm-2) and squares represent population number 654
density (Nv, mm-3).655
656
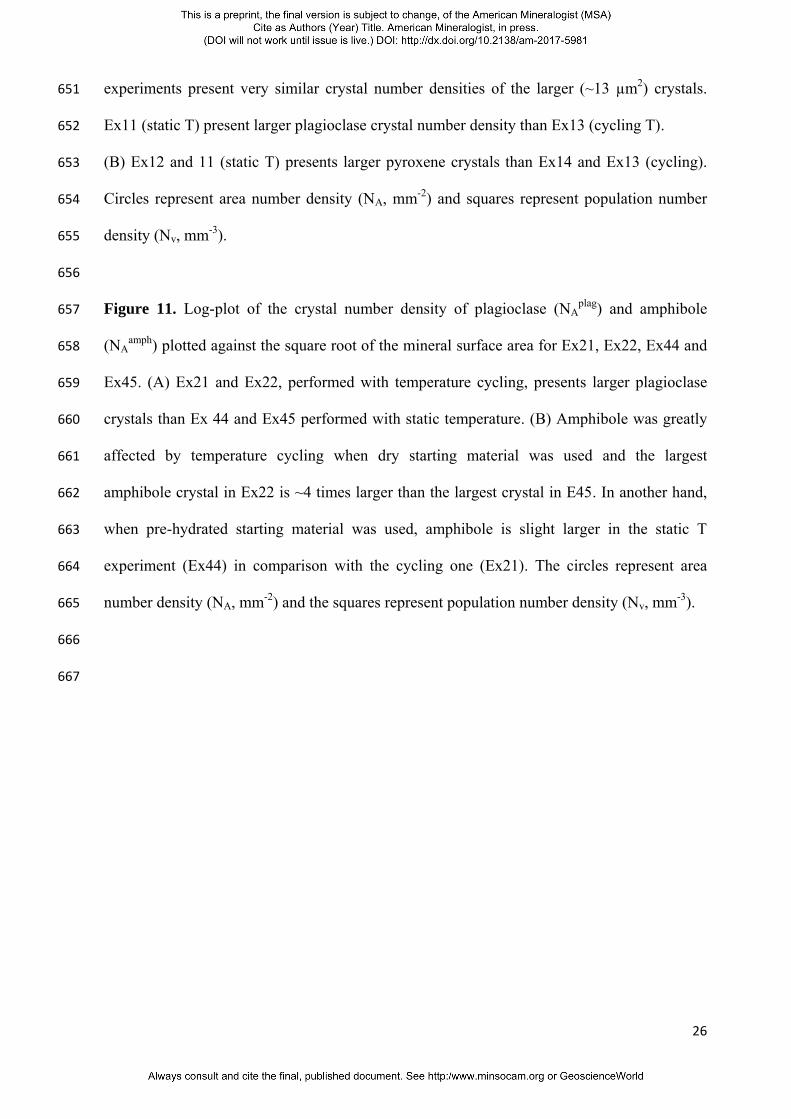
Figure 11. Log-plot of the crystal number density of plagioclase (NAplag) and amphibole657
(NAamph) plotted against the square root of the mineral surface area for Ex21, Ex22, Ex44 and658
Ex45. (A) Ex21 and Ex22, performed with temperature cycling, presents larger plagioclase 659
crystals than Ex 44 and Ex45 performed with static temperature. (B) Amphibole was greatly 660
affected by temperature cycling when dry starting material was used and the largest 661
amphibole crystal in Ex22 is ~4 times larger than the largest crystal in E45. In another hand, 662
when pre-hydrated starting material was used, amphibole is slight larger in the static T 663
experiment (Ex44) in comparison with the cycling one (Ex21). The circles represent area 664
number density (NA, mm-2) and the squares represent population number density (Nv, mm-3).665
666
667

27
Table 1. Starting composition (wt%)
Sample Pre-hydrated starting material Dry glass starting material
n:1 15 24
SiO2 70.834 (0.45)3 70.63 (0.46)
TiO2 0.42 (0.03) 0.45 (0.04)
Al2O3 14.87 (0.23) 15.23 (0.50)
FeO 3.07 (0.17) 3.02 (0.20)
MnO b.d2 b.d
MgO 0.93 (0.06) 1.01 (0.06) CaO 2.71 (0.15) 2.83 (0.12)
Na2O 3.54 (0.23) 3.77 (0.23)
K2O 3.61 (0.09) 3.48 (0.12)
Total5 92.15 100.41
Notes: 1Number of analyses 2Below detection limit
3Number in parentheses indicates one standard deviation of replicate analyses
4Pre-hydrated analyses values were normalized to 100%
5Original total 668
669

28
Table 2. Experimental conditions, durations and run products
Run P [kbar] P. H.2 or D. G.3 T [°C] Cycling or constant T Duration [Days] Results
Ex 11 1 P.H 775 constant 21 Pl, Opx, Ox Ex 13 1 P.H 775± 15 cycling 21 Pl, Opx, Ox Ex 12 1 D.G 775 constant 21 Pl, Opx, Ox Ex14 1 D.G 775± 15 cycling 21 Pl, Opx, Ox Ex 9 1 P.H 815 constant 21 Pl, Opx, Ox Ex 46 1 P.H 815± 15 cycling 21 Pl, Opx, Ox Ex 45 2 D.G 725 constant 21 Pl, Amph, Bt, Ox Ex 22 2 D.G 725± 15 cycling 21 Pl, Amph, Bt, Ox Ex 44 2 P.H 725 constant 21 Pl, Amph, Bt, Ox Ex 21 2 P.H 725± 15 cycling 21 Pl, Amph, Bt, Ox Ex 15 2 P.H 750 constant 21 Pl, Amph, Bt, Ox Ex 20 2 P.H 750± 15 cycling 21 Pl, Amph, Bt, Ox Ex 30 2 D.G 775 constant 14 Pl, Amph, Bt, Ox Ex 43 2 D.G 775± 15 cycling 14 Pl, Amph, Bt, Ox
Notes: All experiments were run with 7 wt% of H2O contend 2Pre-hydrated starting material 3Dry starting material
Phase abbreviation: Pl, plagioclase; OPX, orthopyroxene; Amph, amphibole; Bt, biotite; Ox, oxides.
670
671

29
672
Table 3. Composition of residual melt
Run Ex 11 Ex 13 Ex 12 Ex14 Ex 9 Ex 46 Ex 45 Ex 22 Ex 44 Ex 21 Ex 15 Ex 20 Ex 30 Ex 43
T [°C] 775 775 ±15 775 775 ±15 815 815 ±15 725 725 ±15 725 725 ±15 750 750 ±15 775 775 ±15 P [kbar] 1 1 1 1 1 1 2 2 2 2 2 2 2 2
n1 14 8 20 14 11 9 13 13 8 18 13 11 13 9
P. H2. or D. G3 P.H P.H D.G D.G P.H P.H D.G D.G P.H P.H P.H P.H D.G D.G
SiO2 71.72 (0.69)4 74.18 (0.72) 70.94 (0.32) 72.58 (0.58) 71.16 (0.32) 71.24 (0.74) 70.57 (0.67) 72.69 (0.37) 71.59 (0.57) 72.34 (0.30) 68.88 (0.55) 71.37 (0.49) 69.12 (0.50) 68.04 (0.39)
TiO2 0.21 (0.03) 0.13 (0.03) 0.21 (0.04) 0.16 (0.02) 0.25 (0.03) 0.22 (0.03) 0.12 (0.06) 0.12 (0.04) 0.15 (0.05) 0.12 (0.04) 0.20 (0.04) 0.09 (0.04) 0.17 (0.06) 0.20 (0.02)
Al2O3 12.73 (0.22) 11.77 (0.27) 12.16 (0.28) 12.04 (0.23) 12.61 (0.23) 12.60 (0.24) 12.32 (0.36) 12.23 (0.26) 11.88 (0.25) 12.10 (0.14) 13.28 (0.08) 12.57 (0.18) 13.20 (0.25) 13.94 (0.34)
FeO 1.24 (0.22) 1.09 (0.31) 1.43 (0.20) 1.11 (0.31) 1.38 (0.12) 1.37 (0.22) 1.06 (0.31) 0.89 (0.15) 1.11 (0.38) 0.90 (0.05) 0.95 (0.20) 0.92 (0.16) 1.10 (0.25) 1.63 (0.22)
MnO b.d5 b.d b.d b.d b.d b.d b.d b.d b.d b.d b.d b.d b.d b.d
MgO 0.18 (0.05) 0.45 (0.20) 0.49(0.19) 0.59 (0.18) 0.22 (0.04) 0.40 (0.16) 0.63 (0.25) 0.16 (0.09) 0.30 (0.14) 0.18 (0.07) 0.49 (0.22) 0.15 (0.04) 0.61 (0.18) 0.65 (0.25) CaO 1.09 (0.08) 0.96 (0.16) 1.17 (0.11) 0.96 (0.07) 1.19 (0.14) 1.23 (0.06) 1.37 (0.13) 1.22 (0.05) 1.28 (0.13) 1.24 (0.09) 1.73 (0.09) 1.36 (0.09) 1.63 (0.10) 1.83 (0.1)
Na2O 2.92 (0.23) 2.57 (0.39) 2.22 (0.46) 2.74 (0.16) 3.12 (0.34) 2.99 (0.17) 2.60 (0.17) 2.83 (0.11) 2.49 (0.22) 2.71 (0.11) 3.07 (0.18) 2.80 (0.15) 2.73 (0.10) 2.99 (0.09)
K2O 4.45 (0.12) 4.54 (0.16) 4.05 (0.17) 4.44 (0.08) 4.37 (0.15) 4.12 (0.11) 3.63 (0.10) 3.82 (0.11) 3.65 (0.11) 3.78 (0.06) 3.73 (0.15) 3.57 (0.12) 3.50 (0.07) 3.48 (0.13)
Total6 94.54 95.69 92.66 94.61 94.3 94.17 92.31 91.19 92.45 93.36 92.34 91.19 92.06 92.76
Notes: 1Number of analyses 2Pre-hydrated starting material 3Dry starting material
4Number in parentheses indicate one standard deviation of replicate analyses 5Below detection limit
6Original total 673