Embed Size (px)
Citation preview
REVISION # 2 1
Mapping the distribution of melt during anatexis at the source area of crustal granites 2
by synchrotron -XRF 3
4
Fabio Ferri1,2*, Antonio Acosta-Vigil2,3,4, Carlos Alberto Perez5 and Nicolás Hayek1 5
6
(1) Universidad de los Andes, Bogotá, Colombia, 7
(2) Universitá degli Studi di Padova, Padua, Italy, 8
(3) The Australian National University, Canberra, Australia, 9
(4) Instituto Andaluz de Ciencias de la Tierra, CSIC-Universidad de Granada, Spain, 10
(5) LNLS, Laboratório Nacional de Luz Sincrotron, Campinas, Brazil 11
12
13
14
15
* Corresponding author. Tel: +39-049-8279197; Fax: +39-049-8272010. 16
E-mail addresses: [email protected]
18
Abstract 19
The garnet-biotite-sillimanite enclaves from El Hoyazo are quenched anatectic metapelites 20
found within peraluminous dacites (Betic Cordillera, SE Spain), representing a residual lower 21
crust in the area after 40-60 % of melt extraction. Anatexis occurred concomitantly with 22
deformation in a regional metamorphic setting during the Upper Miocene at the base of the 23
continental crust. Previous studies have provided detailed information on the pressure-24
temperature evolution, sequence of melting reactions and associated melt proportions and 25
compositions. They show that enclaves mostly record peak metamorphic assemblages, 26
mineral compositions and, likely, microstructures, with minor changes upon entrapment 27
within the dacite magma and rapid ascent and extrusion. The enclaves still preserve a 28
proportion of the primary melt, that solidified to glass in abundant melt inclusions (MI) and 29
matrix melt, permitting the study of the microstructural relationships between melt and 30
residue. This study focuses on the geometry of the glass network at the micro-scale which, 31
combined with the previously reported anatectic history, helps shed light on the mechanisms 32
and history of melt drainage from these rocks. 33
A representative sample of the enclaves was investigated by synchrotron -XRF and 34
Scanning Electron Microscopy to map the distribution of glass and minerals on three thin 35
sections cut perpendicularly to the foliation. The combination of major and trace element -36
XRF distribution maps and detailed backscattered electron images evidence the presence of a 37
pervasive and mostly interconnected glass network through the studied centimeter-scale 38
sections. Interconnection is due to the crosscutting of films and glass-rich domains oriented 39
parallel and at high angle with foliation. Although enclaves lost ≈40-60 % of melt, they still 40
contain ≈10-15 % of glass, with a considerable proportion of it stored within the Mix – an 41
aggregate of micron-sized fibrolitic sillimanite and glass. The distribution of glass (former 42
melt) is not in textural equilibrium with the solid residue, and resembles the interconnected 43
network of deformation bands observed in migmatites of anatectic terranes at the meso-scale. 44
Microstructural studies of melt pseudomorphs in migmatites and granulites of anatectic 45
terranes are scarce, but the following remarkable interpretations can be made combining our 46
observations of these enclaves: melt formed an interconnected network during anatexis that 47
permitted melt segregation and extraction, though melt-residue textural disequilibrium is the 48
rule rather than the exception. The proportion of melt present in residual migmatites can be 49
much higher than the permeability threshold for crustal protoliths; in this particular study, two 50
reasons for this might be that (i) melt was still being produced and flowing through the 51
residual migmatite right before disaggregation and inclusion within the host dacite, where 52
additional melt drainage was impeded by the hydrostatic stress field, and (ii) a particular 53
microstructure produced at the onset of anatexis, such as the Mix, acted as a trap for melt 54
impeding or delaying melt segregation. 55
1. Introduction 56
The extraction of granitic magma sensu lato from middle to lower anatectic continental 57
crust and its ascent and intrusion into the upper crust to form granitoid plutons, or extrusion to 58
form volcanic deposits, is the principal process by which continents differentiate into a more 59
mafic deep portion and a more felsic shallow domain, and represents the most important mass 60
transfer mechanism affecting the continental crust (Brown et al., 2011, and references 61
therein). The magmas feeding these high-level plutons and volcanic deposits may contain 62
variable proportions of minerals from their source areas (Chappell et al. 1987; Stevens et al. 63
2007; Garcia-Arias and Stevens 2016), and partially crystallize and differentiate upon 64
extraction and ascent (Morfin et al. 2014; Brown et al. 2016; Carvalho et al. 2016). 65
Nevertheless, the genesis of such magmas requires crustal melts to largely segregate from the 66
solid residue at their source areas in the lower crust, and move along some kind of network 67
that eventually feeds these intrusions or volcanic deposits. Segregation of the melt from its 68
residue in the anatectic terrane by melt flow and/or mass flow along grain boundaries and 69
fractures (e.g. Marchildon and Brown 2002) is the first step in this process, and knowing its 70
mechanisms and timing is important to gain information about (i) its control on the 71
composition of the extracted melt and magma, (ii) the extent of equilibration between 72
extracted melt and residue and, upon magma extraction and ascent, (iii) its role on crustal 73
differentiation. Understanding melt segregation starts by recognizing the geometry of this 74
grain-scale melt drainage network at the source area (Sawyer 2001). 75
Theoretical considerations and experimental observations indicate that, under textural 76
equilibrium conditions, granitoid melts produced during the anatexis of crustal rocks reach 77
interconnection throughout the solid residue at very low degrees of melting (<1 to a few 78
volume % of melt: Laporte and Watson 1995; Laporte et al. 1997; Rosenberg and Handy 79
2005; Holness 2006). This fact, coupled with (i) the realization about the importance of 80
pressure gradients produced by tectonic stress and heterogeneous deformation of the anatectic 81
crust on melt migration, (ii) field observations that regional anatexis is systematically 82
accompanied by stress and deformation (McLellan 1988; Sawyer 1994, 2008; Brown et al. 83
1995; Rutter and Neumann 1995; Brown and Solar 1998), as well as with (iii) several 84
geochemical studies showing that leucosomes are frequently undersaturated in trace elements 85
controlled by the dissolution of accessory minerals (e.g. Barbey et al. 1989; Sawyer 1991), 86
have led to the general consensus that anatectic melts can be rapidly segregated from the 87
residue and extracted from the anatectic terrane (Brown et al. 1995, 2011). 88
The main evidence for crustal melting and melt segregation and extraction from the lower 89
levels of the continental crust comes from petrological and geochemical studies of exhumed 90
regional-scale migmatite-granite complexes. In general, the geometry and orientation of the 91
melt drainage network is controlled by the distribution of fertile layers and minimum melting 92
assemblages, by fabrics and location of low-pressure sites formed during differential stress 93
affecting heterogeneous rocks, and by the nature and orientation of the strain field (e.g. 94
Brown et al. 1995; Collins and Sawyer 1996; Olivier and Barr 1997; Brown and Solar 1999; 95
Solar and Brown 2001; Sawyer 2001; Guernina and Sawyer 2003; Brown 2004, 2007; White 96
et al. 2004; Brown et al. 2011; Závada et al., 2007). At the mesoscale, this drainage network 97
is more evident and manifested as interconnected leucosomes (and/or their associated 98
melanosomes) and discordant granitic veins and dikes; these structures collect the melt 99
produced in the adjacent partially melted domains, and transfer it out of the anatectic region 100
(Brown 1994, 2007; Sawyer 2001, 2014; Brown et al. 1999; Guernina and Sawyer 2003; 101
Marchildon and Brown 2003). At the grain-scale, however, the network connecting partially 102
melted domains being drained and macroscopic leucosomes is not evident. This is mostly 103
because (i) anatexis in regional metamorphic terranes is accompanied by deformation, and 104
melt is thought to mostly segregate and migrate from the residue, remaining only in very 105
small proportions at the site of generation; and (ii) any former intergranular melt present 106
above the solidus may have reacted back with the residue and crystallized during the slow 107
cooling at depth. As a consequence, the geometry of the grain-scale melt paths during the 108
early stages of segregation remains one of the least known parts of the melt segregation and 109
extraction process (Sawyer 2001, 2014). 110
The investigation of this topic has been approached through detailed microstructural 111
studies of melt pseudomorphs (Harte et al. 1993; Clemens and Holness 2000) in a limited 112
number of residual anatectic terranes (Sawyer 2001, 2014; Marchildon and Brown 2002; 113
Holness and Sawyer 2008). These studies indicate that the inferred distribution of melt is not 114
in textural equilibrium with the solid residue, mostly because textural equilibration was not 115
achieved during anatexis, even if the investigated residual anatectic rocks show that a large 116
proportion of melt (≈15-35%) was extracted during partial melting. Thus former melt appears 117
mostly as thin films along many of the grain boundaries (including frequently two-grain 118
junctions), a few to a few tens of µm in thickness, one to several grain diameters in length, 119
and variable degrees of interconnection depending on melt proportion. More rarely, it also 120
occurs as pools hundreds of µm in size. Melt commonly appears in between reactant minerals, 121
with an orientation controlled by the rock fabric, a proportion that varies at the mm-cm scale 122
between ≈2-6, 12 or even 20-25 vol.%, and associated dihedral angles grouped within two or 123
more populations, commonly ≈10-30°, 60-80° and 80-100°. 124
In the present study we report the X-ray grain-scale mapping of the intergranular melt 125
network in one sample of very particular migmatites, the foliated and residual anatectic 126
metasedimentary enclaves hosted by peraluminous dacites at El Hoyazo, SE Spain. Detailed 127
petrological and geochemical studies have concluded that these rocks are mostly equilibrated 128
at the peak anatectic conditions, and that most of the anatectic history recorded in them took 129
place in a regional syn-deformation environment (Cesare 2008; Acosta-Vigil et al. 2010). The 130
process of regional anatexis was frozen due to apparently minor modifications of the studied 131
enclaves after incorporation into the dacite magma, and quenching upon rapid ascent and 132
extrusion. Melt present during anatexis solidified to glass and hence the rocks are ideal to 133
investigate the distribution and segregation of melt during crustal anatexis at or near peak 134
conditions. This contrasts with anatectic terranes whose inferred melt distributions might 135
record variable stages of the process of melt production and segregation, and that may have 136
been modified by melt-residue back reaction, melt crystallization and subsolidus 137
equilibration. The melt network mapped within the studied sample is compared with 138
intergranular melt distributions described from previous studies of anatectic terranes. This, in 139
addition to providing information on the geometry of the grain-scale melt pathways during 140
segregation at peak conditions, may also help to assess the nature of the information provided 141
by melt pseudomorphs in anatectic terranes. Eventually, it also might help understanding the 142
relationships between grain-scale and mesoscale melt distributions in anatectic complexes. 143
2. Sample description 144
2.1 Geological setting 145
The studied sample is a metapelitic enclave collected from the dacitic lava of El Hoyazo, a 146
volcanic centre located in the Neogene Volcanic Province (NVP) of SE Spain, in the Betic 147
Cordillera (Fig. 1; Lopez Ruiz and Rodriguez Badiola 1980). The dome comprises strongly 148
peraluminous cordierite-bearing dacites, which host abundant enclaves (~20-25 vol.%) of 149
predominantly anatectic metapelites (~10-15 vol.%) classified into three main petrographic 150
groups: Grt-Bt-Sil, Spl-Crd and Qz-Crd rocks (Zeck 1970,1992) (abbreviations after Whitney 151
and Evans 2010). Garnet-Bt-Sil enclaves are predominant at El Hoyazo, and the 152
representative Grt-Bt-Sil enclave HO1 was selected for mapping the distribution of glass. 153
HO1 was previously used as well in the experimental investigation of Ferri et al. (2007) 154
aiming at measuring the P-waves seismic velocities of pelitic lower continental crust up to 155
conditions of partial melting. 156
Garnet-Bt-Sil enclaves are foliated, medium- to coarse-grained granulite-facies rocks, that 157
preserve abundant fresh leucogranitic glass (quenched melt, hereafter “glass”) as both primary 158
MI in most minerals and along grain boundaries (Cesare et al. 1997; Acosta-Vigil et al. 2007). 159
The melt was produced by anatexis of the metasedimentary protolith and did not infiltrate 160
from the enclosing dacite (Cesare et al. 1997; Acosta-Vigil et al. 2010). Together with a 161
residual bulk-rock geochemistry, this is evidence of partial melting and melt extraction 162
(Cesare et al. 1997; Cesare and Maineri 1999; Cesare and Gómez-Pugnaire 2001). 163
The estimated peak conditions of anatexis for the Grt-Bt-Sil enclaves at El Hoyazo are 164
≈850 ± 50°C and 0.5–0.7 GPa (Cesare et al. 1997; Cesare and Gómez -Pugnaire 2001), 165
implying partial melting at ≈20 km depth (assuming a crustal density of ~ 2.7 g cm-3), a value 166
which approximates the depth of the actual Moho in the area (~ 21 km, Torne et al. 2000). U-167
Pb dating of MI-bearing zircons and monazites (Cesare et al. 2003b, 2009) indicates an age 168
for anatexis (metamorphic peak) of 9.3-9.9 Ma, whereas the host dacite extruded at 6.3 Ma 169
(Zeck and Williams 2002), suggesting melt residence times of ≈3 Ma at the source area 170
(Cesare et al. 2003b). Similar anatectic enclaves are abundant in dacites outcropping 171
throughout the ≈200-km long volcanic belt constituting the NVP (Cesare and Gómez -172
Pugnaire 2001; Álvarez-Valero and Kriegsman 2007, 2008). Hence the studied Grt–Bt–Sil 173
enclave may be considered as an analogue of the deep anatectic crust beneath the El Hoyazo 174
volcano in the late Miocene. These observations constitute also a first indication that anatexis 175
of the enclaves was likely not a consequence of their incorporation into the dacite magma, but 176
occurred in a regional setting (see below). 177
2.2 Bulk rock composition, petrography and anatectic history 178
The bulk composition of sample HO1 is reported in Table 1. It is very low in SiO2 (≈45 179
wt.%) and high in Al2O3 (≈32 wt.%) and Fe2O3 (≈11 wt.%), with a C content up to ≈1 wt.%. 180
The composition is similar to other Grt-Bt-Sil enclaves from El Hoyazo (e.g., Cesare et al. 181
1997; Acosta-Vigil et al. 2010, Cesare and Acosta-Vigil 2011), and their extreme residual 182
character is consistent with high degrees of extraction of a granite melt component. 183
Geochemical work by Acosta-Vigil et al. (2010) determined that more than 60% cumulative 184
melt should have been produced during the prograde P-T evolution of these enclaves (see 185
below), whereas mass balance calculations by Cesare et al. (1997) indicate ≈40–60 wt.% of 186
this melt was extracted. 187
The enclave is made of garnet, biotite, sillimanite, plagioclase, glass, graphite and minor 188
ilmenite and hercynite. Accessory minerals include apatite, zircon and monazite. Quartz is 189
absent. The rock is medium-grained and displays a well-developed foliation defined by 190
biotite–sillimanite rich layers and oriented graphite (Fig. 2). Most sillimanite is fibrolitic, 191
appears intimately intergrown with rhyolitic melt (hereafter called the “Mix” after Cesare et 192
al. 1997), and was apparently produced by Ms breakdown-melting reactions (Cesare and 193
Gomez-Pugnaire, 2001). Locally, the Mix is in rounded knots apparently pseudomorphosing 194
porphyroblasts such as garnet. The foliation anastomoses around garnet porphyroblasts (up to 195
8 mm diameter) and the Mix knots. The plagioclase is elongated parallel to the foliation. 196
Glass is abundant, both as primary MI in all minerals (particularly in garnet and plagioclase) 197
and in the matrix, e.g. constituting part of the Mix or locally intermixed with plagioclase, or 198
in tens to hundred of µm–thick films parallel to the foliation, as coatings around garnets, or in 199
pockets located in strain shadows around porphyroblasts. 200
According to Cesare et al. (1997) and Acosta-Vigil et al. (2010), the abundance of Bt and 201
Sil may be explained because either (i) these phases were already present in the lower-grade 202
protolith and/or (ii) they were produced, together with H2O, during rapid heating by 203
dehydration reactions involving Ms, Chl, Grt, St and Qz (e.g. Yardley 1989). The presence of 204
MI in all minerals, including common reactants in crustal melting reactions e.g. Pl, supports 205
rapid melting of a low-grade protolith and crystallization of high grade assemblages, by-206
passing melting reactions (Cesare and Maineri 1999). The large amount of melt produced by 207
anatexis of these enclaves, as well as the presence of quite a large amount of Bt is in 208
accordance with H2O having remained sequestered in the system by rapid incorporation into 209
the melt during rapid heating and melting. The presence of Sil + melt intergrowths (the 210
“Mix”) strongly suggests the occurrence of a peritectic melting reaction involving Ms + Pl + 211
Qz (Acosta-Vigil et al. 2010). 212
A considerable number of detailed petrological and geochemical studies have concluded 213
that melt was mostly produced in a regional setting in the presence of stress and deformation, 214
by the following reactions along the prograde path until reaching peak conditions (see section 215
5.2 for details): (i) H2O-rich fluid-present melting of Ms at ≈700 ºC producing ≈15-20 wt.% 216
of melt, whose remains are represented now as MI in Pl; (ii) fluid-absent breakdown-melting 217
of muscovite at ≈750 ºC producing ≈15-25 wt.% of melt, registered now as MI in Grt; and 218
(iii) the beginning of the fluid-absent breakdown-melting of biotite starting at ≈800 ºC, ending 219
at peak conditions and producing ≈15 wt.% of melt, manifested as glass films in the matrix 220
(Acosta-Vigil et al. 2010). There are several arguments supporting that most of the anatectic 221
history of these enclaves occurred in a regional setting, and that enclaves only experienced 222
minor modifications after entrapment into the dacite magma, ascent, extrusion and quenching. 223
Peak metamorphic conditions, using Grt, Pl and Bt either wrapped by or defining the main 224
foliation, indicate melting at the base of the continental crust of the area (850±50 ºC, 0.5-0.7 225
GPa; Cesare et al. 1997). Melt inclusions, representing the remains of about ≈45 wt.% of melt 226
produced by the breakdown-melting of muscovite, are present within Grt and Pl which are 227
wrapped within or aligned along the main foliation of the rock (Cesare et al. 1997; Cesare and 228
Gómez-Pugnaire 2001). Matrix melt commonly forms films parallel to the main foliation or is 229
present in strain shadows of porphyroblast and intermixed with other phases mostly 230
sillimanite (Mix) and plagioclase (Cesare et al. 1997; Cesare and Gómez-Pugnaire 2001). 231
During incorporation into the dacite and decompression, the enclaves presumably stagnated in 232
a shallow magma chamber for < 103–104 years (Alvarez-Valero et al. 2007) and partially 233
equilibrated at ≈820 ± 50°C and ≈0.5 GPa (Alvarez-Valero et al. 2007; Tajcmanová et al. 234
2009). The rapid ascent caused the fast cooling of rocks and melt, preventing the 235
crystallization of the melt entrained within inclusions and in the matrix, that was quenched to 236
glass. 237
2.3 Mineral and glass chemistry. 238
The compositions of minerals of the enclave HO1 (Table 2) are very homogeneous and 239
similar to that of other Grt-Bt-Sil El Hoyazo enclaves reported by Cesare et al. (1997, 2003a, 240
2003b, 2005) and Acosta-Vigil et al. (2010). Biotite has XFe = 0.62-0.67 and TiO2 ~ 5.0 wt.%. 241
Garnet is weakly zoned within the ranges Alm78-81Pyp10-14Sps1-7Grs2-10. Plagioclase is a low-242
Ca andesine (An30-33). 243
Despite slight compositional variations among MI and interstitial glass (Acosta-Vigil et al. 244
2007 and 2010), glass in Grt-Bt-Sil enclaves is leucogranitic (FeO + MgO + TiO2 < 1.65 245
wt.%), peraluminous (Al2O3/(CaO + Na2O + K2O) > 1.11) and hydrous. Mean H2O 246
concentration, calculated by the difference of the electron microprobe totals from 100% 247
(Morgan and London, 1996), is around 3-4 wt.% (Acosta-Vigil at el. 2007). Mean wt.% 248
normative compositions plot in the vicinity of the H2O-undersaturated (aH2O=0.1–0.4) 249
haplogranite eutectics (Acosta-Vigil et al. 2010). 250
The minerals have also characteristic minor and trace element concentrations (Acosta-251
Vigil et al. 2010), which can help, together with the major elements, the identification of 252
phases from the combination of different XRF chemical maps (see below). For instance, the 253
glass controls the majority of B, As and Cs of the enclave. Biotite hosts a large amount of Cs, 254
Ba, Nb, Ta and most of the Rb, V, Cr, Co, Ni and Zn. Garnet concentrates Sc, Dy, Ho and 255
most of the Y and HREE. Plagioclase show high concentrations of Li, Be, Pb and hosts most 256
of the Sr and Eu, while the scarce residual K-feldspar controls Ba, Pb and part of the Rb, Sr 257
and Eu. Cordierite, when present, concentrates most of the Be. 258
3. Analytical methods 259
The distribution of glass within sample HO1 was determined at the X-ray 260
microfluorescence station available at the D09B XRF Fluorescence beamline of the Brazilian 261
Synchrotron Light Laboratory (LNLS) in Campinas, Brazil (Perez et al. 1999), using an X-ray 262
optic based on a pair of dynamically figured mirrors in a so-called KB mirror arrangement. 263
The microfocusing system, fabricated by the X-ray optic group (Zhang et al. 1998) of the 264
European Synchrotron Radiation Facility (ESRF) in France, is able to produce an X-ray 265
microbeam of ≈12 μm × 22 μm in size. Measurements were performed under room 266
temperature and atmospheric pressure conditions. An iron (Fe) filter was placed in front of the 267
incoming beam in order to reduce distortion of the XRF spectra due to the high X-ray 268
fluorescence intensity contribution of the Fe-K lines coming from the sample matrix. Samples 269
were put in the focus plane within an accuracy of 1 with precise remote-controlled 270
motorized stages. An optical microscope (~ 500x magnification) was used to precisely locate 271
the irradiated area. 2D-XRF mapping was tested with different combinations of beam size, 272
step and counting time to get the best compromise between spatial resolution and signal 273
intensity. All maps were acquired at 22 m diameter beam, 40 µm steps and 0.3 sec counting 274
time, with the exception of a high-resolution map acquired at 25 µm steps and 1.0 sec 275
counting time. Elemental composition per pixel was determined at a standard geometry (45–276
45°) using a silicon drift detector (KETEK GmbH) with a resolution of 140 eV (FWHM) at 277
5.9 keV. Spectra processing and elemental imaging reconstructions were done with the 278
PyMca software (Solé et al. 2007), an advanced fitting program developed by the ESRF. 279
Detailed BSE images of the studied samples were acquired in a variety of specific 280
microstructural locations, using the Scanning Electron Microscopes (SEM) of the Universidad 281
de los Andes in Bogotá and the Universita’ di Padova. 282
The major element composition of the glass throughout the sample was measured using a 283
Cameca SX-50 electron microprobe (EMP) at the University of Oklahoma. Analyses were 284
conducted on areas previously studied by SEM at the Universita’ di Padova and the 285
Universidad de Granada. To avoid or minimize alkali loss and changes in major elemental 286
ratios, analytical conditions were used as recommended by Morgan and London (1996, 2005), 287
with a 5 m spot size and conducting analyses of secondary glass standards during the same 288
analytical session. 289
3.1 Samples analyzed by -XRF 290
Due to experimental time limitations, it was not possible to perform a three-dimensional 291
XRF tomography; instead the investigation was performed on several thin sections oriented 292
perpendicular according to the axes X, Y and Z of Fig. 3, where the XY plane is parallel to 293
the biotite – graphite foliation, and Z is normal to the foliation. The axis X is along a weak 294
lineation marked by plagioclase and sillimanite crystals. The thin sections were derived from 295
rock volumes adjacent but not directly in contact with each other, as schematically reported in 296
Fig. 3. The thin section (1) HO1YZ is parallel to the YZ plane. Thin sections (2) and (3), 297
HO1XZ and HO1XZexp respectively, are parallel to the XZ plane; thin section HO1XZexp 298
was derived from a core used in the experiments conducted by Ferri et al. (2007), in a position 299
close to that of sections (1) and (2). Section (4) corresponds to a detail area of thin section (1), 300
measured at high resolution with shorter step distance and longer counting time (see details 301
above). The investigated areas were 10 mm x 20 mm for section (1), 9 mm x 9 mm for 302
sections (2) and (3), and 3 mm x 3 mm for section (4). 303
Thin section HO1XZexp was derived from an experimentally treated HO1 sample which 304
was re-heated at 0.5 GPa up to 700°C, under hydrostatic conditions in a gas pressure vessel, 305
in order to measure the change in P-wave velocity with pressure and temperature (Ferri et al. 306
2007). These authors showed that, after the experiment, the volume of the enclave was 307
reduced without any sign of phase reactions, i.e. without affecting the original mineral 308
assemblage. Even though the authors did not characterize the fraction or nature of porosity 309
during the experiment, they inferred a porosity reduction after the experiment, as indicated by 310
a decrease in volume of the sample measured at ambient pressure with a Helium pycnometer. 311
In order to determine such volume variations, samples were heated in steps, and then 312
extracted and measured at progressively increasing temperatures of 400°C, 600°C, 650°C and 313
700°C. The volume reduction was almost linear from room temperature to 600°C, with a 314
porosity reduction of ca. ~ 2.0-2.5% at 600°C, and of 0.5 % from 600°C to 700°C 315
corresponding to a density increase from 2.96 g/cm3 in the starting material to 3.01 g/cm3 316
after the experiment (see Fig. 6 in Ferri et al. 2007). Since neither mineral reactions nor glass 317
crystallization were observed to occur up to 700°C, this volume reduction was attributed to 318
partial closure of pores and microfractures produced by relaxation of interstitial glass. The 319
experiment was performed at P-T conditions below the liquidus (≈800-850 ºC; Holtz et al. 320
2001) but above the glass transition temperature (≈450 ºC; Giordano et al. 2008) estimated for 321
the mean composition of the matrix glass, and hence glass behaved as a liquid during the 322
experiment. The calculated high viscosities for that melt (≈108 Pa s; Giordano et al. 2008) and 323
the hydrostatic conditions of the experiment, however, likely prevented the melt from flowing 324
during the short ≈3-hour experiment, and hence the glass distribution was not modified with 325
respect to the natural rock. Distributions of glass obtained from HO1YZexp (re-heated) and 326
HO1YZ (not re-heated) are quite similar (see below). 327
4. Results 328
4.1 Melt distribution 329
The major and trace element abundances collected during the -XRF mapping were 330
combined by means of the RGB Correlator tool of PyMca (Solé et al. 2007), in order to obtain 331
2D distribution maps of phases in the four thin sections of the studied migmatite. Fig. 4 332
reports an example of the data processing performed on thin section (4) of Fig. 3. The Fig. 4A 333
was obtained by the RGB combination of signals from Si (red), K (green) and Fe (blue). 334
Biotite is light blue due to the high concentration of Fe and K; the Mix is vermilion due to the 335
abundance of Si; the glass is orange due to the combination of Si, K and Fe. The software 336
ENVI® was used to discriminate the phases by selecting the region of interest (ROI) 337
corresponding to every phase. The -XRF spectra were averaged over a large number of 338
pixels (> 10.000), to reduce the variability caused by decay of the beam intensity or mixed 339
analyses. Six ROIs were defined corresponding to the phases biotite, garnet, plagioclase, K-340
feldspar, glass and the Mix (Figs. 4B and 5B). In order to identify the distribution of Spl and 341
Ilm in the thin section, a second triplet was analyzed by the RGB combination of signals from 342
Mn (red), Ti (green) and Zn (blue). Due to the limited amount of Spl and Ilm in the thin 343
sections (<0.1 – 0.4 area %) and their small average grain size (< 20–40 m), however, their 344
distribution could not be included in the images Figs. 4 and 5. Also, the peak of carbon could 345
not be identified from the XRF model profiles defined with the PyMca software, thus the 346
areal distribution of graphite could not be mapped either. 347
Depending on the size of the glass regions, a major limitation of the RGB maps regarding 348
the studied problem could be the spatial resolution, which is defined by the beam size, 22 m. 349
In the large mapped areas (sections 1-3; using a beam diameter of 22 m and 40 m steps), 350
this may result in mixed analyses of glass+minerals, or even glass might go unnoticed, if glass 351
is present as ≤ 20-30 m-thick films at the contact between minerals, or when the glass is 352
intimately intergrown with fibrolitic sillimanite as in the Mix. This means that, in areas where 353
glass is ≤ 20-30 m across, results might show a fuzzy image of the distribution of glass and 354
the proportions of detected glass will likely correspond to minimum values. We evaluated this 355
potential problem in two ways: (i) mapping a small part of section 1 (=section 4; Fig. 3) 356
conducting more closely spaced analyses (beam diameter of 22 m, 25 m steps); (ii) 357
conducting SEM-BSE imaging of particular areas of the investigated sections (see below). 358
Nevertheless this technique should provide a reasonable first-order approach to the 359
microscopic distribution of melt in the studied migmatite. 360
On the basis of the obtained trace element distributions, sillimanite seems to systematically 361
show high concentrations of Gallium (Fig. 4C). The combination of the Gallium 362
concentration map (= sillimanite distribution) with the glass distribution obtained from the Si-363
K-Fe chemical maps (black areas in Fig. 4B) yields the image of Fig. 4D which evidences 364
that, in this particular area, most of the glass is concentrated within the Mix at the contact 365
with biotite crystals. This procedure was applied to all thin sections and results are reported in 366
Fig. 5, where the Gallium concentration map is not reported separately as in Fig. 4C but 367
directly overlapped to the Fig. 5B, showing the spatial distribution of the phases of Fig. 5C. 368
Despite the absence of a 3D tomography of the distribution of melt, and even if we have 369
not studied a section subparallel to foliation, results indicate that glass seems to form a 370
pervasive and mostly interconnected network made of melt films and pools, together with 371
melt-rich domains (intermixture with sillimanite as in the Mix, or with plagioclase) 372
throughout the cm-scale studied volume. This is due mostly to the crosscutting of melt films 373
and melt-rich domains oriented parallel and at a high angle with foliation. Despite the 374
presence of ≈1-5 mm Bt and Mix domains subparallel to foliation, and Grt and Pl 375
porphyroblast, all of which tend to make melt paths more tortuous or irregular, matrix melt 376
seems largely interconnected. They also invade to some extent the Bt domains. It is difficult 377
to precisely estimate the thickness of melt films and melt-rich domains (see above), but in 378
most cases they are probably ≤ 100 m (Fig. 6B-D); melt pools are ≈0.1-1 mm across (Fig. 379
6E,F). Distances between melt domains vary between ≈0.25-2 mm. Melt films wet most of 380
the grain boundaries; those oriented parallel to foliation are thinner than those perpendicular 381
or at high angle to the foliation (Fig. 6C, E, F).. We do not observe any main channel (in 382
terms of size) into which smaller channels drain the melt, at least at the scale of several cm 383
and in the studied rock volume, but in general a pervasive and mostly interconnected grain-384
scale melt network. 385
Although sample HO1-XZexp –section (3), Fig. 3– was reheated up to 700 ºC at 0.5 GPa 386
(Ferri et al. 2007), its glass distribution looks similar to that observed in HO1-XZ and HO1-387
YZ (see also section 3.1). The absence of garnet and plagioclase in HO1-XZexp is due to 388
some small-scale mineralogical variability in Grt-Bt-Sil enclaves. 389
The grain-scale melt network in this migmatite seems to be mostly controlled by syn-390
anatectic deformation and the orientation of the main foliation, which is largely marked by the 391
alignment of biotite. However, it is also controlled to some extent by metamorphic 392
microstructures, such as the shape and distribution of the Mix (sometimes this Sil+glass 393
aggregate does not follow but truncates the main foliation, and melt films anastomose around 394
it) and the nature of the Mix (see section 5.2). For the same reason, in rock domains where 395
garnet and plagioclase are particularly abundant, as in section HO1-XZ, the glass network 396
becomes more irregular as it anastomoses around porphyroblasts of these minerals. 397
The correspondence between the phase distributions reported in Figs. 4 and 5 using -XRF 398
mapping, and the petrography of the studied sample, was verified on detailed SEM-BSE 399
images acquired in specific microstructural positions of the studied thin sections (Figs. 6 and 400
7). The SEM analysis confirms that glass forms either thin films or pools in between most of 401
the minerals, e.g. plagioclase and garnet (Fig. 6A), plagioclase and biotite (Figs. 6B), garnet 402
and biotite (Figs. 6D, F and 7B), biotite and the Mix (Fig. 6D), garnet and the Mix, (Figs. 403
6C), plagioclase and the Mix (Fig. 7A). Fig. 6G corresponds to a representative portion of the 404
Mix characterized by a relatively large proportion of glass and the segregation of melt pools 405
≈10-20 m across, while Fig. 6H corresponds to a portion of the Mix far from the contact 406
Mix–biotite, with a very low glass percentage. The SEM study shows also that: (i) melt films 407
in between minerals can be as thin as a few (≤5) microns across (Figs. 6C, E, F), which are 408
extremely difficult to detect via -XRF mapping; (ii) glass can be also mostly absent from 409
some of the mineral boundaries (Fig. 7B); and (iii) the geometry of the glass network down to 410
the micrometer scale is quite complex and irregular compared to equilibrium microstructures 411
described in experiments (compare Figs. 6-7 with e.g. Fig. 5 from Laporte et al. 1997), even if 412
experiments lasted days whereas, in the case of enclaves, geochronology suggests that melt 413
coexisted with minerals at high temperature for a few million years. 414
4.2 Modal analysis 415
It is important to know the modal amount of phases in the enclave HO1, particularly the 416
glass percentage, in order to understand the controls on the distribution of melt recorded in 417
these migmatites, and its role on the segregation of melt and on crustal rheology. Thus phase 418
abundances were determined by both mass balance calculation and image analysis. 419
The mass balance calculation was performed by the spreadsheet MINSQ (Hermann and 420
Berry 2002) which is a modification of the least squares method to quantitatively estimate the 421
proportions of constituent minerals in rocks from bulk rock XRF chemical analysis and EMP 422
mineral compositions. Table 1 reports the bulk composition of enclave HO1 from Ferri et al. 423
(2007), and Table 2 shows representative compositions of the matrix glass and minerals used 424
for the mass balance calculation. The selected composition for the matrix glass (Gl-3 in Table 425
2) was measured in HO1 next to a Grt and is similar to the average composition of matrix 426
glass for this particular enclave, while the compositions of the minerals are from Cesare 427
(2000) (enclave HO-42, Table 1 in Cesare 2000) who observed that the mineral chemistry of 428
different Grt-Bt-Sil enclaves is very homogeneous. The calculated glass proportion is 8.9 429
wt.% (Table 3) together with 16.5 wt.% plagioclase, 22.4 wt.% biotite, 15.7 wt.% garnet, 24.9 430
wt.% sillimanite, 10.1 wt.% K-feldspar and 2.1 % of spinel. The content of ilmenite is 431
virtually zero even if it is observed in limited amounts within the enclave. The residuals sum 432
of squares (SSQ) of the mass balance calculation corresponds to 0.2. 433
The image analysis was performed using the ROIs definition and software ENVI® (see 434
section 4.1) for the phases glass, biotite, garnet, sillimanite, plagioclase, K-feldspar, spinel 435
and ilmenite. The results are reported in Table 3 for all thin sections. The area appearing as 436
glass (e.g., the dark-red areas of Figs. 4D and 5C) is between 22-32 area % but does not 437
necessarily correspond to pure glass, because glass may appear sometimes intermixed with 438
minerals such as plagioclase (Figs. 6A, B) or sillimanite as in the Mix (Figs. 6C, D, F-G). 439
Pools of pure glass, from tens up to a few hundred m in diameter, are also observed. In order 440
to get a more precise estimate of the proportion of glass, we constrained the amount of glass 441
in the Mix, and along the contacts between the biotite–plagioclase, biotite–garnet, and garnet–442
plagioclase pairs, as follows: 443
1) The glass content of the Mix was determined on selected areas of BSE images (e.g., 444
Figs. 6D, E, G) with the software ImageJ® to be around 29 - 45 area %. This value is in 445
excellent agreement with the 25-50 vol.% of glass in the Mix reported by Cesare et al. (1997), 446
who expressed the chemical composition of the Mix from different areas as a linear 447
combination of the compositions of matrix glass and sillimanite. 448
2) The glass proportion in pools and films between selected pairs of minerals, such as 449
garnet – plagioclase (e.g., Fig. 6A) and biotite – plagioclase (e.g., Fig. 6B), varies between 450
40-100 area %. 451
Based on the previous considerations, the bulk content of glass in the rock was calculated 452
as the sum of two contributions: (1) the glass within the Mix corresponding to an average of 453
40 area % of the Mix (red area of Fig. 5B), and (2) the glass along the mineral boundaries 454
corresponding to an average of 70 area % (black area of Fig. 5B). The resulting glass 455
percentage varies between 12.9 area % and 14.8 area % (Table 3). The glass content of the 456
enclave HO1 calculated in this study is in agreement with the estimated glass proportion of 457
10-15% obtained from Rietveld refinement by Ferri et al. (2007), and with the 11 wt.% glass 458
percentage calculated by mass balance for another Grt-Bt-Sil enclave from El Hoyazo (HO-459
50; Table 1 in Acosta-Vigil et al. 2010). Simple calculations considering the amount of 460
sillimanite and mean proportion of glass in the Mix, indicate that most of the glass in the 461
enclave (close to 10%) is present within the Mix, whereas glass as melt films and pools 462
amounts up to a few %. 463
4.3 Microprobe analysis 464
An important topic regarding crustal anatexis is the composition of the primary melt and 465
its variability throughout the anatectic area, controlled by the composition of the protolith, the 466
microstructural environment and the kinetics of melting (e.g. Acosta-Vigil et al. 2017). The 467
existence of melt compositional heterogeneities in major elements during anatexis at the grain 468
scale has been documented by Braun and Kriegsman (2001) via analyses of glass (quenched 469
melt) in anatectic metapelitic xenoliths brought to the surface by basanites. Other authors 470
have reported the preservation of major and trace element as well as isotopic heterogeneities 471
in apparently homogeneous granitic bodies; these heterogeneities have been interpreted as 472
inherited from their source area (e.g., Deniel et al. 1987; Pressley and Brown 1999; Clemens 473
and Benn 2010; Farina et al. 2014). Even though the compositional variations of the glass in 474
the studied enclave HO1 is beyond the main topic of this work, we have conducted glass 475
analyses at different microstructural locations of the interconnected glass network in the 476
enclave, located up to several mm apart from each other, and compared them to matrix glass 477
compositions in other Grt-Bt-Sil enclaves from El Hoyazo. 478
We analyzed the compositions of glasses at the contact with garnet, biotite, plagioclase and 479
the Mix. Fig. 7A reports the locations of glass analyses close to Pl and Sil, or in between the 480
two phases in section HO1XZ, and Fig. 7B shows the locations of glass analyses close to Grt 481
and Bt. Analyses show a relatively homogeneous major element composition of the glass, 482
independently of the nature of the adjacent mineral, with high SiO2 (70-75 wt.%), Al2O3 483
(12.4-14.7 wt.%), K2O (5.0-5.4 wt.%), P2O5 (0.5-0.6 wt.%) and #K (0.52-0.60), moderate to 484
low FeOt (1.8-2.0 wt.%), and low MgO (0.15-0.19), CaO (0.3-0.5 wt.%) and #Mg (0.11-485
0.16). The Aluminum Saturation Index (ASI) ranges between 1.10-1.30 and H2O, calculated 486
by difference, between 1-6 wt.% (Table 4). It is interesting that matrix glass compositions in 487
this (HO1) and two other Grt-Bt-Sil enclaves (HO-50 and PFHz3) are quite similar, even if 488
these three enclaves represent decimetric fragments of a similar metasedimentary protolith 489
undergoing anatexis at the base of the continental crust, that were likely originally separated 490
in the source area at least some meters if not more (Fig. 8 and Table 5 Supplementary 491
Material). 492
5. Discussion 493
5.1. Geometry of the microscopic-scale melt network and its origin 494
On the basis of the -XRF mapping of major and trace element concentrations and SEM 495
observations, we were able to provide a reasonably detailed picture of the distribution of glass 496
(former melt) at the grain boundary scale within a migmatite represented by a Grt-Bt-Sil 497
anatectic enclave present within El Hoyazo dacites (SE Spain). Detailed petrologic and 498
geochemical studies have shown that during anatexis these rocks lost several tens of wt.% of 499
melt, implying that melt formed an interconnected network throughout the original protolith 500
at a scale larger than domains represented by the Grt-Bt-Sil enclaves (of cm-dm scale), and 501
that there was a driving force for melt segregation and extraction from these domains into 502
either other melt-enriched domains within the migmatite and/or out of the migmatite and into 503
the overlying subsolidus crust. 504
The estimated volume of glass in the enclave is ≈10-15 wt.%, well below that required for 505
isolation of individual grains within the melt and rock disaggregation (≈25%; e.g. Rosenberg 506
and Handy 2005), but similar or quite close to the minimum energy porosity for equilibrium 507
dihedral angles of ≈20-40° (≈12-22%; e.g. Laporte and Watson 1995). With this proportion of 508
melt and under textural equilibrium, melt should have formed during anatexis an 509
interconnected network of three-grain junctions channels and, in two dimensional sections of 510
the anatectic rocks, melt should mostly appear in three-grain junctions with cuspate 511
terminations and melt-solid-solid dihedral angles of 20-60° (Jurewicz and Watson 1984, 512
1985; Laporte and Watson 1995; Laporte et al. 1997; Holness 2006; Holness and Sawyer 513
2008; Holness et al. 2011). 514
This and previous studies (e.g. Cesare et al. 1997; Cesare and Gómez-Pugnaire 2001; 515
Cesare 2008) show however that glass forms thin coats around many of the minerals (e.g. Grt, 516
Bt) and localizes along most of the grain boundaries, as a few to tens of µm–thick films, 517
intermixtures and irregular or rounded tens to hundreds of µm-diameter pockets. In detail and 518
down to the micrometer scale, the geometry of the melt network is quite complex and 519
irregular (Figs. 6 and 7) even if a tendency to develop low apparent dihedral angles can be 520
observed (Figs. 6E, F, 7B). In addition sillimanite and the glass form a fine-grained felt (the 521
“Mix”), with glass proportion increasing towards the mineral grains (e.g. biotite) rims (Figs. 522
6C, D, F, G) and segregation of some local glass pockets (Fig. 6E, F). Nearly pure sillimanite 523
(i.e. mostly glass-free Mix) is observed away from Mix-mineral boundaries (Fig. 6H), 524
corresponding to the grey areas of Figs. 4D and 5C. Glass films and pockets seem to form a 525
pervasive and mostly interconnected network in between the major minerals throughout the 526
studied sample, due mostly to the crosscutting of melt films and pools parallel and at high 527
angle with the main foliation, with some glass-rich domains reaching dimension of up to a 528
few hundred micrometers (Fig. 6). Previous studies have also described glass-filled 529
discontinuities, ≤50 µm-thick and a few mm-long, oriented at high angle with respect to the 530
main foliation, that likely connected melt films parallel to foliation during anatexis (Fig. 4f of 531
Cesare et al. 1997). 532
These observations indicate that the grain-scale distribution of melt in the studied 533
migmatite is not in textural equilibrium with the solid residue. Given that enclaves show in 534
general quite homogeneous mineral compositions recording peak or close to peak P-T 535
conditions, and that former melt solidified to glass with very minor crystallization (Cesare et 536
al. 1997; Cesare 2008; Acosta-Vigil et al. 2007, 2010), this implies that: (i) enclaves were 537
quenched during extrusion while having the mineral assemblage and mineral compositions of, 538
or close to, peak P-T conditions; (ii) the timeframes between entrainment in the dacitic 539
magma and extrusion were short (≤103-104 years for the particular case of Grt-Bt-Sil enclaves 540
showing post-deformation coronitic microstructures around Grt or reaction rims between Bt-541
Sil, interpreted to have occurred after entrainment within the host dacite: Cesare 2008; 542
Alvarez-Valero et al. 2005, 2007; these static microstructures are absent in the studied 543
enclave, and hence its ascent and extrusion could be even faster); (iii) although some 544
modifications might have occurred after entrainment and during ascent, the reported grain-545
scale glass distribution should largely reflect the distribution of melt at or close to peak 546
anatectic conditions during anatexis due to fluid-absent, breakdown-melting of biotite, as melt 547
did not have time to react back with the residue or crystallize, as it happens during slow 548
cooling of anatectic terranes; and (iv) hence the melt network did not achieve microstructural 549
equilibrium with the residue during regional anatexis of these rocks, even if geochronological 550
studies have inferred that melt resided within its source area in contact with the solid residue 551
for about 3 Ma (Cesare et al. 2003b). 552
The observation that the melt network seems still largely interconnected indicates that this 553
network did not collapse, likely implying that melt was being produced within, and flowing 554
throughout the protolith in the lower continental crust right before disaggregation and 555
entrainment of fragments into the magma. Once into the magma, hydrostatic stress prevented 556
any further intergranular melt flow or, at least, melt segregation out of the residual enclave. 557
These observations, together with the homogeneity of matrix glass throughout the enclave, 558
and similarity with matrix glass compositions from other Grt-Bt-Sill enclaves, suggest that the 559
composition of the matrix glass is close to that of the primary melt being produced during 560
anatexis of the protolith right before entrainment into the magma (see Sawyer 2001), and that 561
it might not strictly represent melt produced in situ but within adjacent domains, as an 562
example of a quenched inter-granular melt flow through a residual migmatite in its way 563
towards e.g. macroscopic leucosomes. In this context, matrix melt homogeneity might not 564
only be due to small minimum volumes for equilibration and associated short diffusion 565
distances (Acosta-Vigil et al. 2017) but also to mechanical mixing during inter-granular flow. 566
The above observations indicate that melt can form an interconnected network even if 567
melt-residue textural equilibrium has not been achieved. Previous experimental programs 568
dealing with the disequilibrium partial melting of macroscopic solid cylinders of crustal 569
protoliths under hydrostatic conditions have already described the development of an 570
interconnected melt network at low degrees of partial melting (Wolf and Wyllie 1991; 571
Acosta-Vigil et al. 2006). This in turn has implications for the rapid segregation and 572
extraction of melt from migmatites before any major melt-residue equilibration has taken 573
place and, together with slow diffusion in crystals and lack of major recrystallization of the 574
residue (e.g. Acosta-Vigil et al. 2017), may explain the fact that chemical disequilibrium 575
between melt and residue seems to be the rule rather than the exception (Bea 1996). 576
Previous studies of melt pseudomorphs in migmatites and granulites (Sawyer 2001; 577
Marchildon and Brown 2002; Holness and Sawyer 2008) show the following similarities with 578
the El Hoyazo enclaves regarding inferred former melt distributions: (i) in most cases melt 579
pseudomorphs seem to record melt-solid residue disequilibrium textural distributions, with 580
melt films located along many grain boundaries, due mostly to lack of achievement of textural 581
equilibrium during anatexis; (ii) the distribution of melt is in most cases controlled by the 582
rock fabric developed during syn-anatectic deformation, with melt films preferentially located 583
along grain boundaries parallel to that fabric (foliation, shear surfaces), which are thinner and 584
longer with respect to those perpendicular to it. There are, however, some differences, 585
including: (i) the melt proportion found in the residual enclaves (10-15 %) is similar or higher 586
with respect to described melt proportions in residual domains of studied migmatites (2-12 587
%); (ii) this ≈10-15% of melt left in the residual enclaves forms mostly an interconnected 588
network, whereas similar to lower proportions of melt in residual migmatites (2-12 %) form 589
small ≈0.1-1 mm across interconnected branching networks, separated by basically melt-590
absent regions ≈0.5-2 mm in size. This difference might be due in part to the entrainment of 591
enclaves within the dacite magma before the collapse of the grain-scale melt drainage 592
network. Overall though, the studies of both melt pseudomorphs in migmatites and granulites 593
of anatectic terranes, and grain-scale glass distribution in the residual anatectic enclaves of El 594
Hoyazo, seem to indicate that textural melt-residue equilibrium during crustal anatexis might 595
not be as common as we initially thought. Coupled with experimental studies on rock core 596
melting indicating interconnection at low degrees of melting of a melt network in textural 597
disequilibrium with the residue (Wolf and Wyllie 1991; Acosta-Vigil et al. 2006), it indicates 598
that melt-residue textural disequilibrium during anatexis does not prevent from rapid melt 599
interconnection and segregation. Indeed more studies of melt pseudomorphs in migmatites are 600
required to asses the extent of textural equilibration during crustal anatexis and its role of melt 601
segregation/extraction, melt compositions, and crustal rheology (Sawyer 2001, 2014; 602
Marchildon and Brown 2002; Holness and Sawyer 2008). 603
Regarding the architecture and microscale-to-mesoscale connection of the melt drainage 604
network in anatectic terranes, it is worth pointing out that the grain-scale glass network 605
mapped in the enclave via µ-XRF resembles the mesoscale interconnected network of 606
deformation bands (leucosomes) in migmatites (Brown 2007); thus glass is dominantly 607
located in films and domains parallel to foliation (compaction bands), which are connected by 608
films and pools oblique to foliation. This might suggest that grain-boundary melt flow parallel 609
to the main fabric might be as important as perpendicular flow to segregate and drain melt out 610
of migmatite residual domains. The flow perpendicular to the main fabric perhaps dominates 611
at ≤5 mm away from the contact with leucosomes (Sawyer 2001) while branching of the melt 612
network may become important mostly after melt leaves the suprasolidus crust. 613
5.2. Anatexis, deformation and melt drainage 614
The El Hoyazo enclaves provide the opportunity to constraint the melt drainage history 615
during the anatexis of this particular rock, by integrating the analysis of the distribution of 616
glass and the multistage melting history reported by the abundant previous literature dealing 617
with the microstructures, petrology, geochemistry and geochronology of these quenched 618
migmatites (e.g. Cesare et al. 1997, 2003b, 2005; Cesare and Maineri 1999; Cesare and 619
Gómez-Pugnaire 2001; Zeck and Williams 2002; Álvarez-Valero et al. 2005, 2007; Acosta-620
Vigil et al. 2007, 2010, 2012; Cesare 2008; Tajcmanová et al. 2009; Álvarez-Valero and 621
Waters 2010; Ferrero et al. 2011; Bartoli 2017). 622
Cesare et al. (1997) and Cesare and Gómez -Pugnaire (2001) demonstrated that partial 623
melting took place mostly under stress and associated deformation of the protolith 624
(syntectonic melting), on the base of several microstructural features: 625
a) The presence of a well-developed main foliation, generally marked by subparallel 626
crystals of biotite, graphite and acicular sillimanite, in which the biotite flakes contain MI and 627
are commonly deflected; 628
b) The biotite foliation anastomoses around garnet porphyroblasts which contain MI as 629
well, or around knots of acicular sillimanite immersed in interstitial melt which presumably 630
pseudomorphs pre-existing garnets (see reaction (5) in Acosta-Vigil et al., 2010); 631
c) The matrix glass occurs along thin foliation-parallel layers and in strain shadows around 632
garnet. Relicts of an earlier foliation can be observed in the strain shadows around garnet and 633
within microlithons in the main foliation. The earlier foliation is marked by graphite and 634
biotite, which is involved in iscoclinal folding and slight crenulation. Minerals of the earlier 635
foliation also contain MI or are intergrown with glass, but are generally undeformed; 636
d) In some cases, glass occurs in apparently extensional discontinuities at high angle with 637
the foliation, sometimes appearing as result of boudinage. 638
All these observations imply that MI and at least part of the matrix glasses were generated 639
in a regional metamorphic setting previously to or during the deformation that produced the 640
main foliation in the anatectic metapelites (Cesare et al. 1997, 2003b; Cesare and Maineri 641
1999; Cesare 2000; Cesare and Gómez-Pugnaire 2001; Acosta-Vigil et al. 2007; Acosta-Vigil 642
et al. 2010). Since the foliation postdates or is synchronous with anatexis, it follows that the 643
enclaves deformed and partially melted before being enclosed in the host dacite (Cesare and 644
Gómez-Pugnaire 2001). 645
The sequence of melt producing reactions taking place during the prograde history of the 646
Grt-Bt-Sil enclaves was reconstructed on the base of the major and trace element 647
compositions of MI preserved in plagioclase and garnet, and intergranular glass films. It was 648
concluded that MI in plagioclase reflect the earliest granitic melts produced at ≈700 °C by 649
fluid-present melting of muscovite evolving rapidly to fluid-absent conditions, whereas MI in 650
garnet were produced concomitantly or slightly later via fluid-absent breakdown-melting of 651
muscovite at ≈750°C. The intergranular melt represents the latest melt produced by fluid-652
absent breakdown-melting of biotite starting at ≈800 °C and ending at peak conditions of 653
≈850 ± 50 °C and 0.5-0.7 GPa (Cesare et al. 1997, 2005; Acosta-Vigil et al. 2007, 2010; 654
Ferrero et al. 2011). Cesare and Maineri (1999) suggested that the temperature overstepping 655
for the enclaves was very high, so it is very likely that most of the prograde melting reactions 656
actually occurred simultaneously. A minority of enclaves record a final static decompression 657
event, likely occurring after incorporation in the host dacite magma, at ≈820 °C and < 0.5 658
GPa, as evidenced by the presence of Spl + Ilm + Crd + feldspar + melt coronas after Grt 659
(Alvarez-Valero et al. 2007). 660
Acosta- Vigil et al. (2010) reconstructed the melt production during prograde heating and 661
determined that ~20 wt.% of anatectic melt was produced by muscovite fluid-present melting, 662
~25 wt.% by muscovite fluid-absent melting and ~15 wt.% by biotite fluid-absent melting, 663
making about 60 wt.% of total melt. Such percentage is in good agreement with the estimate 664
of Cesare et al. (1997) who suggested that the enclaves experienced about 40 – 60% melt 665
extraction that was assisted by deformation. The volume of melt produced after the enclaves 666
were incorporated into the dacitic magma was not constrained by Cesare et al. (1997) or 667
Acosta-Vigil et al. (2010), but it may reasonably be limited to a few percentages (< 3 - 4 668
wt.%) based on: 1) microstructural observations and algebraic calculations based on reaction 669
coronas around Grt (Alvarez-Valero et al. 2007); and 2) thermodynamic modelling and 670
isopleths calculated by Bartoli (2017). No retrogressive coronas after Grt were observed, 671
however, in the analyzed thin sections of sample HO1. 672
The amount of glass retained within the sample HO1, constrained by combination of -673
XRF chemical maps, image analysis, mass balance calculation and XRPD Rietveld 674
refinement (Ferri et al. 2007) is ≈10-15 wt.%. If we combine this value with previous 675
estimations of melt produced and extracted from these residual rocks, and exclude the small 676
percentage of melt potentially formed during static melting during transport to the surface, we 677
infer that a considerable proportion of the melt produced during regional metamorphism was 678
not extracted from the protolith represented by the Grt-Bt-Sil enclaves but stored at deep 679
crustal levels, when the crust was still deforming at the regional scale. These melt percentages 680
are high compared to the proportion of melt required for melt interconnection in anatectic 681
crustal protoliths (<1 to a few volume %; e.g. Wolf and Wyllie 1991; Laporte et al. 1997; 682
Acosta-Vigil et al. 2006), and have been described as well in some residual though contact 683
anatectic migmatite (≈12 %; Sawyer 2001). 684
The above observation seems to contradict the generally accepted idea that, once melt 685
becomes interconnected, and in the presence of a differential stress, the proportion of melt 686
above the permeability threshold can be rapidly segregated from the solid residue (e.g. 687
Clemens and Stevens 2016). Laporte et al. (1997) argued that melt segregation might be 688
inefficient at such low degrees of melting due to the high viscosity of granite melt, and that 689
there might be a range of melt percentages above the percolation threshold (≈5-10 vol.%) 690
over which melt is interconnected but nearly stagnant. They suggested that it would be melt 691
viscosity, instead of melt interconnection, that should be the limiting factor in the segregation 692
of granitic melts from its source area. This could be applied to the case of the El Hoyazo 693
enclaves, though there might be at least two other reasons for the high proportion of melt 694
present in these regionally metamorphosed residual migmatites: the timing of melting versus 695
fragmentation and incorporation into the dacite magma; and the presence of particular 696
microstructures in the rock that favoured melt retention. This is explained below. 697
The protolith represented by the Grt-Bt-Sil enclaves may have been disaggregated and 698
included into the dacitic magma while melt was being produced within, and flowing through 699
the residual anatectic rock, before any major collapse of the melt network, as suggested by the 700
observed interconnection of the grain-scale glass network (see above). 701
The enclaves have abundant fine-grained sillimanite needles intermixed with glass in 702
variable proportions (the Mix), which may have resulted from muscovite-breakdown melting 703
reaction involving Ms + Pl + Qtz (compare with microstructures in Patiño Douce and Harris 704
1998; Buick et al. 2004), and hence formed at the onset of anatexis (see Acosta-Vigil et al. 705
2010). Based on conclusions on melt production from Acosta-Vigil et al. (2010) (see above) 706
and observations from the present manuscript, a large proportion of melt formed during these 707
muscovite melting reactions should have been segregated from the protolith. The Mix, 708
however, might have played a significant role regarding the accumulation and retention of 709
some of this melt. Because of the high aspect ratio and apparently random orientation of 710
sillimanite needles in the Mix (Figs. 6C, D, G, H; see also Fig. 3b of Cesare et al. 1997), this 711
mineral frame can accommodate variable porosities and store elevated proportions of melt 712
when such porosity is high. In fact, a large proportion of the glass present in the enclaves 713
seems to be located within the Mix (see above). The rheology of the Mix during syn-anatectic 714
deformation might have been different from that of the biotite+melt domains, and the enclave 715
may have behaved as a composite material with an inhomogeneous distribution of matrix 716
stiffness. Bons and Urai (1994) reported rock analogue deformation experiments on a two-717
phase system represented by mixtures of camphor and octachloropropane (OCP) in different 718
proportion, as representative of rocks close to their melting temperature. Despite the higher 719
rheological complexity of the El Hoyazo enclave containing also garnet and plagioclase as 720
major minerals, the comparison between Fig. 5C and Fig. 2 of Bons and Urai (1994) suggests 721
that during anatexis the enclaves were likely constituted by two principal domains in terms of 722
matrix stiffness, the Mix (+ Grt + Pl?) with higher stiffness and the biotite (+ melt) with lower 723
stiffness. Thus it is possible that the presence of the Mix from the initial stages of anatexis 724
prevented a proportion of the melt from being easily segregated, in a similar fashion as 725
Sawyer (2014) described how another microstructure –an infertile framework made of 726
plagioclase+cordierite, constituting ≈40-60% of the rock and representing impermeable and 727
strong rock domain enclosing smaller volumes of fertile material– delayed compaction-driven 728
melt segregation in contact metamorphic migmatites developed at the base of the Duluth 729
Complex, Minnesota. 730
6. Implications and conclusions 731
This study likely provides the closest picture we have so far for the syn-anatectic grain-732
scale distribution of melt during regional metamorphism at or close to peak conditions, by 733
mapping the distribution of glass in quenched migmatites from El Hoyazo using synchrotron 734
μ-XRF. The study has implications for three main topics: (i) the architecture of the melt 735
drainage network during anatexis of the continental crust, (ii) the extent of melt-residue 736
textural equilibration during crustal anatexis, and (iii) the composition of the melt and extent 737
of melt-residue chemical equilibration during anatexis before melt segregates from its source. 738
This study indicates that the distribution of melt is largely controlled by syn-anatectic 739
deformation and orientation of the associated foliation and potential dilation/shear surfaces at 740
high angle to the foliation. Interconnection of the grain-scale melt network is due to the 741
crosscutting of melt films and pools located along these deformation-related microstructures: 742
foliation and dilation/shear surfaces. This pattern resembles the mesoscale interconnected 743
network of leucosomes described in migmatites, and suggests that grain-boundary melt flow 744
parallel to the main fabric (e.g. foliation) might be as important as flow perpendicular to it in 745
order to drain melt out of migmatite residual domains. It follows that branching of the melt 746
network may become important mostly after the melt leaves the suprasolidus crust. This 747
dominant pattern for the grain-scale distribution of the melt is somewhat modified by: 748
metamorphic microstructures such as the presence of porphyroblast or mineral aggregates 749
(e.g. the Mix, an intimate intergrowth between melt and fibrolitic sillimanite), that truncate 750
foliation or along which foliation anastomoses; and the nature of the Mix, which may become 751
important to store melt in migmatites during syn-anatectic deformation above the small 752
percentages required for melt interconnection. 753
Contrary to the apparently general consensus (e.g. Laporte and Watson 1995; Laporte et al. 754
1997), and in accordance with most of the findings during studies of melt pseudomorphs in 755
migmatites of anatectic terranes (Sawyer 2001; Marchildon and Brown 2002; Holness and 756
Sawyer 2008), melt and mineral residue did not reach textural equilibration during anatexis of 757
the El Hoyazo enclaves. However, melt was extracted from most of these migmatites as their 758
residual nature indicates, implying melt interconnection at some point. Melt-residue textural 759
equilibrium guarantees melt interconnection at low degrees of partial melting (e.g. Laporte 760
and Watson 1995; Laporte et al. 1997; Holness et al. 2011). Experimental studies on the 761
melting of solid rock cores, however, indicate that melt interconnection can be reached at low 762
degrees of melting as well even if melt-residue textural equilibrium has not been achieved, in 763
the case of both lineated amphibolites (Wolf and Wyllie 1991) and isotropic granites (Acosta-764
Vigil et al. 2006). This observation might be important for the rapid segregation and 765
extraction of melt from the source rock during crustal anatexis, and explain the current 766
general consensus that melt-residue chemical disequilibrium during anatexis is the rule rather 767
than the exception (Bea 1996). 768
Previous studies of melt pseudomorphs in migmatites of anatectic terranes have found the 769
same picture regarding the controls of deformation, foliation and metamorphic 770
microstructures on the grain-scale distribution of melt, and regarding the extent of mineral-771
melt textural equilibration during anatexis (Sawyer 2001, 2014; Marchildon and Brown 2002; 772
Holness and Sawyer 2008). Indeed more of these detailed studies of melt pseudomorphis in 773
migmatites are needed to assess issues such as whether textural disequilibrium during 774
anatexis is the rule rather that the exception, and the role of grain-scale melt distribution on 775
melt composition, extent of melt-residue equilibration before melt segregation, and crustal 776
rheology (Sawyer 2001; Marchildon and Brown 2002). 777
778
AKNOWLEDGMENTS 779
This work was funded by the Proyecto FAPA, Universidad de Los Andes (Bogotá, 780
Colombia); the Centro Nacional de Pesquisa em Energia e Materiais, Brazilian Synchrotron 781
Light Laboratory (LNLS), proposal n. XAFS1 – 17105; the CARIPARO (Cassa di Risparmio 782
di Padova e Rovigo) project MAKEARTH. We are grateful to Charles LeLosq for advice on 783
granite glass properties, two anonymous reviewers that provided numerous comments and 784
suggestions on a previous version of this manuscript, Bernardo Cesare, an anonymous 785
reviewer for their thorough and positive reviews; all of them greatly improved the original 786
manuscript. S. Penniston-Dorland is thanked for insightful review and very careful editorial 787
handling. 788
REFERENCES 789
Acosta-Vigil, A., Buick, I., Hermann, J., Cesare, B., Rubatto, D., London, D., and Morgan, 790
G.B. VI (2010) Mechanisms of crustal anatexis: a geochemical study of partially melted 791
metapelitic enclaves and host dacite, SE Spain. Journal of Petrology, 51, 785-821. 792
793
Acosta-Vigil, A., Buick, I., Cesare, B., London, D., and Morgan, G.B. (2012) The extent 794
of equilibration between melt and residuum during regional anatexis and its implications for 795
differentiation of the continental crust: A study of partially melted metapelitic enclaves. 796
Journal of Petrology, 53, 1319-1356. 797
798
Acosta-Vigil, A., Cesare, B., London, D., and Morgan, G.B. VI (2007) Microstructures 799
and composition of melt inclusions in a crustal anatectic environment, represented by 800
metapelitic enclaves within El Hoyazo dacites, SE Spain. Chemical Geology, 237, 450-465. 801
802
Acosta-Vigil, A., Cesare, B., London, D., and Morgan, G.B., VI, Cesare, B., Hermann, J., 803
Bartoli, O. (2017) Primary crustal melt compositions: Insights into the controls, mechanisms 804
and timing of generation from kinetics experiments and melt inclusions. Lithos, 286-287, 805
454-479. 806
807
Acosta-Vigil, A., London, D., and Morgan, G.B., VI (2006) Experiments on the kinetics of 808
partial melting of a leucogranite at 200 MPa H2O and 690-800°C: Compositional variability 809
of melts during the onset of H2O-saturated crustal anatexis. Contribution to Mineralogy and 810
Petrology, 151, 539-557 811
812
Álvarez-Valero, A. M. and Kriegsman, L. M. (2007) Crustal thinning and mafic 813
underplating beneath the Neogene Volcanic Province (Betic Cordillera, SE Spain): Evidence 814
from crustal xenoliths. Terra Nova, 19, 266-271. 815
816
Álvarez-Valero, A. M. and Kriegsman, L. M. (2008) Partial crustal melting beneath the 817
Betic Cordillera (SE Spain): The case study of Mar Menor volcanic suite. Lithos 101, 379-818
396. 819
820
Álvarez-Valero, A.M. and Waters, D.J. (2010) Partially melted crustal xenoliths as a 821
window into sub-volcanic processes: Evidence from the Neogene Magmatic Province of the 822
Betic Cordillera, SE Spain. Journal of Petrology, 51, 973-991. 823
824
Álvarez-Valero, A. M., Cesare, B., and Kriegsman, L.M. (2005) Formation of elliptical 825
garnet in a metapelitic enclave by melt-assisted dissolution and reprecipitation. Journal of 826
Metamorphic Geology, 23, 65-74. 827
828
Álvarez-Valero, A. M., Cesare, B. and Kriegsman, L. M. (2007) Formation of spinel-829
cordierite-feldspar-glass coronas after garnet in metapelitic xenoliths: reaction modeling and 830
geodynamic implications. Journal of Metamorphic Geology, 25, 305-320. 831
832
Barbey, P., Bertrand, J.-M., Angoua, S. and Dautel, D. (1989) Petrology and U/Pb 833
geochronology of the Telohat migmatites, Aleksod, Central Hoggar, Algeria. Contributions to 834
Mineralogy and Petrology, 101, 207–219. 835
836
Bartoli, O. (2017) Phase equilibria modeling of residual migmatites and granulites: an 837
evaluation of the melt-reintegration approach. Journal of Metamorphic Geology, 35, 919-942. 838
839
Bea, F. (1996) Controls on the trace element composition of crustal melts. Transactions of 840
the Royal Society of Edinburgh: Earth Sciences, 87, 33–41. 841
842
Bons, P.D., and Urai, J.L. (1994) Experimental deformation of two-phase rock analogues. 843
Materials Science and Engineering, A175, 221-229. 844
845
Braun, I. and Krlegsman, L.M. (2001) Partial Melting in Crustal Xenoliths and Anatectic 846
Migmatites: A Comparison. Physics and Chemistry of the Earth (A), 26, 261-266. 847
848
Brown, M. (1994) The generation, segregation, ascent and emplacement of granite magma: 849
the migmatite-to-crustally-derived granite connection in thickened orogens. Earth-Science 850
Reviews, 36 (1-2), 83-130 851
852
Brown, M. (2004) The mechanism of melt extraction from lower continental crust of 853
orogens. Transactions of the Royal Society of Edinburgh: Earth Sciences, 95, 35-48. 854
855
Brown, M., and Solar, G.S. (1998) Shear zone systems and melts: feedback relations and 856
self-organization in oregenic belts. Journal of Structural Geology 20, 211–227. 857
858
Brown, M., and Solar, G.S. (1999) The mechanism of ascent and emplacement of granite 859
magma during transpression: a syntectonic granite paradigm. Tectonophysics, 312, 1–33. 860
861
Brown,.M., Averkin, Y.A., McLellan, E.L., Sawyer, E.W. (1995) Melt segrergation in 862
migmatites. Journal of Geophysical Research 100(B8), 15655-15679. 863
864
Brown, M.A., Brown, M., Carlson, W.D., and Denison, C. (1999) Topology of syntectonic 865
melt-flow networks in the deep crust: Inferences from three-dimensional images of leucosome 866
geometry in migmatites. American Mineralogist, 84, 1793–1818. 867
868
Brown, M., Korhonen, F.J., and Siddoway, C.S. (2011) Organizing melt flow through the 869
crust. Elements 7, 261-266. 870
871
Brown, C.R., Yakymchuk, C., Brown, M., Fanning, C.M., Korhonen, F.J., Piccoli, P.M., 872
and Siddoway, C.S. (2016). From source to sink: petrogenesis of Cretaceous anatectic 873
granites from the Fosdick migmatite-granite complex, West Antarctica. Journal of Petrology, 874
57, 1241–1278. 875
876
Buick, I. S., Stevens, G., and Gibson, R. L. (2004) The role of water retention in the 877
anatexis of metapelites in the Bushveld Complex Aureole, South Africa: an experimental 878
study. Journal of Petrology, 45, 1777-1797. 879
880
Carvalho, B.B., Sawyer, E.W., and Janasi, V.A. (2016) Crustal reworking in a shear zone: 881
transformation of metagranite to migmatite. Journal of Metamophic Geology, 882
http://dx.doi.org/10.1111/jmg.12180. 883
884
Cesare, B. (2000) Incongruent melting of biotite to spinel in a quartz-free restite at El 885
Joyazo (SE Spain): textures and reaction characterization. Contributions to Mineralogy and 886
Petrology, 139, 273–284. 887
888
Cesare, B. (2008) Crustal melting: working with enclaves. In: E.W. Sawyer and M. Brown, 889
Eds., Working with Migmatites. Mineralogical Association of Canada, Short Course Series, 890
38, 37–55. 891
892
893
Cesare, B. and Acosta-Vigil A. (2011) Using melt inclusions for understanding crustal 894
melting processes. McGraw-Hill Yearbook of Science and Technology, 355-359. 895
896
Cesare, B. and Gómez-Pugnaire, M. T. (2001) Crustal melting in the Alborán domain: 897
constraints from enclaves of the Neogene Volcanic Province. Physics and Chemistry of the 898
Earth, 26, 255–260. 899
900
Cesare, B. and Maineri, C. (1999) Fluid-present anatexis of metapelites at El Joyazo (SE 901
Spain): constraints from Raman spectroscopy of graphite. Contributions to Mineralogy and 902
Petrology, 135, 41–52. 903
904
Cesare, B., Cruciani, G., and Russo, U. (2003a) Hydrogen deficiency in Ti- rich biotite 905
from anatectic metapelites (El Joyazo—SE Spain): crystal-chemical aspects and implications 906
for high-temperature petrogenesis. American Mineralogist, 88, 583–595. 907
908
Cesare, B., Gómez-Pugnaire, M.T., and Rubatto, D. (2003b) Residence time of S-type 909
anatectic magmas beneath the Neogene Volcanic Prov- ince of SE Spain: a zircon and 910
monazite SHRIMP study. Contributions to Mineralogy and Petrology, 146, 28–43, 911
doi:10.1007/s00410-003-0490-x. 912
913
Cesare, B., Meli, S., Nodari, L., and Russo, U. (2005) Fe3+ reduction during biotite 914
melting in graphitic metapelites: another origin of CO2 in granulites. Contributions to 915
Mineralogy and Petrology, 149, 129–140. 916
917
Cesare B., Rubatto D., and Gómez-Pugnaire M.T. (2009) Do extrusion ages reflect magma 918
generation processes at depth? An example from SE Spain. Contributions to Mineralogy and 919
Petrology, 157, 267-279. 920
921
Cesare, B., Salvioli Mariani, E., and Venturelli, G. (1997) Crustal anatexis and melt 922
extraction during deformation in the restitic xenoliths at El Joyazo (SE Spain). Mineralogical 923
Magazine, 61, 15–27. 924
925
Chappell, B.W., White, A.J.R., and Wyborn, D. (1987). The importance of residual source 926
material (restite) in granite petrogenesis. Journal of Petrology, 28, 1111–1138. 927
928
Clemens, J.D., and Benn, K. (2010) Anatomy, emplacement and evolution of a shallow-929
level, post-tectonic laccolith: the Mt Disappointment pluton, SE Australia. Journal of the 930
Geological Society, London, 167, 915–941. 931
932
Clemens, J. D., and Holness, M.B. (2000) Textural evolution and partial melting of arkose 933
in a contact aureole: a case study and implications. Electronic Geosciences, 5, 4. 934
935
Clemens, J.D. and Stevens, G. (2016) Melt segregation and magma interactions during 936
crustal melting: Breaking out the matrix. Earth-Science Reviews, 160, 333-349. 937
938
Collins, W.J., and Sawyer, E.W. (1996) Pervasive magma transfer through the lower–939
middle crust during non-coaxial compressional deformation: an alternative to diking. Journal 940
of Metamorphic Geology, 14, 565–579. 941
942
Deniel, C., Vidal, P., Fernandez, A., Lefort, P. and Pecaut, J.J. (1987) Isotopic study of the 943
Manaslu granite (Himalaya, Nepal): inferences of the age and source of Himalayan 944
leucogranites. Contributions to Mineralogy and Petrology, 96, 78–92. 945
946
Farina, F., Dini, A., Rocchi, S., and Stevens, G. (2014) Extreme mineral-scale Sr isotopic 947
heterogeneity in granites by disequilibrium melting of the crust. Earth and Planetary Science 948
Letters, 399, 103-115. 949
950
Ferrero, S., Bodnar, R.J., Cesare, B., and Viti, C. (2011) Reequilibration of primary fluid 951
inclusions in peritectic garnet from metapelitic enclaves, El Hoyazo, Spain. Lithos, 124, 117–952
131. 953
954
Ferri, F., Burlini, L., Cesare, B., and Sassi, R. (2007) Seismic properties of lower crustal 955
xenoliths from El Hoyazo (SE Spain): experimental evidence up to partial melting. Earth and 956
Planetary Science Letters, 253, 239–253. 957
958
Garcia-Arias, M., and Stevens, G. (2016) Phase equilibrium modelling of granite magma 959
petrogenesis: A. An evaluation of the magma compositions produced by crystal entrainment 960
in the source. Lithos, doi: 10.1016/j.lithos.2016.09.028. 961
962
Giordano, D., Russell, J.K., and Dingwell, D.B. (2008) Viscosity of magmatic liquid: a 963
model. Earth and Planetary Science Letters, 271, 123-134. 964
965
Guernina, S., and Sawyer, E.W (2003) Large-scale melt-depletion in granulite terranes: an 966
example from the Archean Ashuanipi Subprovince of Quebec. Journal of Metamorphic 967
Geology, 21, 181–201. 968
969
Harte, B., Hunter, R. H. and Kinny, P. D. (1993) Melt geometry, movement and 970
crystallisation, in relation to mantle dykes, veins and metasomatism. Philosophical 971
Transactions of the Royal Society of London, 342, 1-21. 972
973
Hermann, W., and Berry, R.F. (2002) MINSQ – a least squares spreadsheet method for 974
calculating mineral proportions from whole rock major element analyses. Geochemistry: 975
Exploration, Environment, Analysis, 2, 361–368. 976
977
Holness, M.B., (2006) Melt-solid dihedral angles of common minerals in natural rocks. 978
Journal of Petrology, 47, 791-800. 979
980
Holness, M.B., and Sawyer, E.W. (2008) On the pseudomorphing of melt-filled pores 981
during the crystallization of migmatites. Journal of Petrology, 49, 1343–1363. 982
983
Holness, M.B., Cesare, B., Sawyer, E.W. (2011) Melted rocks under the microscope: 984
Microstructures and their interpretation. Elements, 74, 247-252. 985
986
Jurewicz, S.R., and Watson, E.B. (1984) Distribution of partial melt in a felsic system: the 987
importance of surface energy. Contributions to Mineralogy and Petrology, 85, 25-29. 988
989
Jurewicz, S.R., and Watson, E.B. (1985) The distribution of partial melt in a granitic 990
system: the application of liquid phase sintering theory. Geochimica et Cosmochimica Acta, 991
49, 1109-1121. 992
993
Laporte, D., and Watson, E.B. (1995). Experimental and theoretical contraints on melt 994
distribution in crustal sources: the effect of crystalline anisotropy on melt interconnectivity. 995
Chemical Geology, 124, 161-184. 996
997
Laporte, D., Rapaille, C., and Provost, A. (1997) Wetting angles, equilibrium melt 998
geometry, and the permeability threshold of partially molten crustal protoliths. In: Bouchez, 999
J.L., Hutton, D.H.W., Stephens, W.E. (Eds.), Granite: From Segregation of Melt to 1000
Emplacement Fabrics, p. 31-54. Kluwer Academic Publishers, Dordrecht, The Netherlands. 1001
1002
Lopez Ruiz, J., and Rodriguez Badiola, E. (1980) La región volcánica Neógena del sureste 1003
de España. Estudios Geològicos, 36, 5–63. 1004
1005
Marchildon, N., and Brown, M. (2002) Grain-scale melt distribution in two contact aureole 1006
rocks: implication for controls on melt localization and deformation. Journal of Metamorphic 1007
Geology, 20, 381–396. 1008
1009
Marchildon, N., and Brown, M. (2003) Spatial distribution of melt-bearing structures in 1010
anatectic rocks from Southern Brittany: Implications for melt transfer at grain- to orogen-1011
scale. Tectonophysics, 364, 215–235, doi:10.1016/S0040-1951(03)00061-1. 1012
1013
McLellan, E.L. (1988) Migmatite structures in the Central Gneiss Complex, Boca de 1014
Quadra, Alaska. Journal of Metamorphic Geology, 6, 517–542. 1015
1016
Morfin, S., Sawyer, E.W., and Bandyayera, D. (2014) The geochemical signature of a 1017
felsic injection complex in the continental crust: Opinaca Subprovince, Quebec. Lithos, 196–1018
197, 339–355. 1019
1020
Morgan, G.B., VI and London, D. (1996) Optimizing the electron microprobe analysis of 1021
hydrous alkali aluminosilicate glasses. American Mineralogist, 81, 1176–1185. 1022
1023
Morgan, G.B., VI, and London, D. (2005) The effect of current density on the electron 1024
microprobe analysis of alkali aluminosilicate glasses. American Mineralogist, 90, 1131–1138. 1025
1026
Olivier, N.H.S. and Barr, T.D. (1997) The geometry and evolution of magma pathways 1027
through migmatites of the Halls Creek Orogen, Western Australia. Mineralogical Magazine, 1028
61, 3-14. 1029
1030
Patiño Douce, A. E. and Harris, N. (1998) Experimental constraints on Himalayan 1031
anatexis. Journal of Petrology, 39, 689-710. 1032
1033
Perez, C.A., Radtke, M., Sanchez, H.J., Tolentino, H., Neuenshwander, R.T., Barg, W., 1034
Rubio, M., Bueno, M.I.S., Raimundo, I.M., and Rohwedder, J.J.R. (1999) Synchrotron 1035
radiation X-ray fluorescence at the LNLS: beamline instrumentation and experiments. X-Ray 1036
Spectrometry, 28, 320–326. 1037
1038
Pressley, R.A., and Brown, M. (1999) The Phillips pluton, Maine, USA: evidence of 1039
heterogeneous crustal sources and implications for granite ascent and emplacement 1040
mechanisms in convergent orogens. Lithos, 46, 335–366. 1041
1042
Rosenberg, C. L., and Handy, M.R. (2005) Experimental deformation of partially melted 1043
granite revisited: implications for the continental crust. Journal of Metamorphic Geology, 23, 1044
19-28. 1045
1046
Rutter, E., and Neumann, D. (1995) Experimental deformation of partially molten 1047
Westerly granite under fluid-absent conditions, with implications for the extraction of granitic 1048
magmas. Journal of Geophysical Research, 100, 697–715. 1049
1050
Sawyer, E.W. (1991) Disequilibrium melting and the rate of melt-residuum separation 1051
during migmatization of mafic rocks from the Grenville Front, Quebec. Journal of Petrology, 1052
32, 701–738. 1053
1054
Sawyer, E.W. (1994) Melt segregation in the continental crust. Geology, 22, 1019–1022. 1055
1056
Sawyer, E.W. (2001) Melt Segregation in the Continental Crust: Distribution and 1057
Movement of Melt in Anatectic rocks. Journal of Metamorphic Geology, 19, 291–309. 1058
1059
Sawyer, E.W. (2008) Working with migmatites: nomenclature for the constituent part. In: 1060
Sawyer, E. W., and Brown, M. (eds) Working with Migmatites. Mineralogical Association of 1061
Canada, Short Course Series 38. 1062
1063
Sawyer, E.W. (2014) The inception and growth of leucosomes: microstructure at the start 1064
of melt segregation in migmatites. Journal of Metamorphic Geology, 32, 695–712. 1065
1066
Solar, G.S., and Brown, M. (2001) Deformation partitioning during transpression in 1067
response to Early Devonian oblique convergence, northern Appalachian orogen, USA. 1068
Journal of Structural Geology, 23, 1043–1065. 1069
1070
Solé, V.A., Papillon, E., Cotte, M., Walter, Ph., and Susini, J. (2007) A multiplatform code 1071
for the analysis of energy-dispersive X-ray fluorescence spectra. Spectrochimica Acta, B 62, 1072
63–68. 1073
1074
Stevens, G., Villaros, A., and Moyen, J.-F. (2007) Selective peritectic garnet entrainment 1075
as the origin of geochemical diversity in S-type granites. Geology, 35, 9–12. 1076
1077
Tajčmanová, L., Connolly, J.A.D, and Cesare, B. (2009) A thermodynamic model for 1078
titanium and ferric iron solution in biotite. Journal of Metamorphic Geology, 27, 153-165. 1079
1080
Torne, M., Fernàndez, M., Comas, M.C., and Soto., J.I. (2000) Lithospheric Structure 1081
Beneath the Alborán Basin: Results from 3D Gravity Modeling and Tectonic Relevance. 1082
Journal of Geophysical Research, 105(B2), 3209–3228, doi:10.1029/1999JB900281. 1083
1084
White, R.W., Powell, R. and Halpin, J.A. (2004) Spatially-focused melt formation in 1085
aluminous metapelites from Broken Hill, Australia. Journal of Metamorphic Geology, 22, 1086
825–845. 1087
1088
Wolf, M.B., and Wyllie, P.J. (1991) Dehydration-melting of solid amphibolite at 10 kbar: 1089
textural development, liquid inter-connectivity and applications to the segregation of magmas. 1090
Mineralogy and Petrology, 44, 151-179. 1091
1092
Závada, P., K. Schulmann, J. Konopásek, S. Ulrich, and O. Lexa (2007) Extreme ductility 1093
of feldspar aggregates—Melt- enhanced grain boundary sliding and creep failure: Rheological 1094
implications for felsic lower crust, Journal of Geophysical Research, 112, B10210, 1095
doi:10.1029/2006JB004820. 1096
1097
Zeck, H.P. (1970) An erupted migmatite from Cerro del Hoyazo, SE Spain. Contributions 1098
to Mineralogy and Petrology, 26, 225–246. 1099
1100
Zeck, H.P. (1992) Restite-melt and mafic-felsic magma mingling in an S-type dacite, 1101
Cerro del Hoyazo, southeastern Spain. Transactions of the Royal Society of Edinburgh: Earth 1102
Sciences, 83, 139–144. 1103
1104
Zeck H.P. and Williams, I.S. (2002) Inherited and magmatic zircon from Neogene Hoyazo 1105
cordierite dacite, SE Spain–Anatectic source rock provenance and magmatic evolution. 1106
Journal of Petrology, 43, 1089–1104. 1107
1108
Zhang, L., Hustache, R., Hignette, O., Ziegler, E., and Freund, A. (1998) Design 1109
optimization of a flexural hinge-based bender for X-ray optics. Journal of Synchrotron 1110
Radiation, 5, 804–807. 1111
1112
Whitney, D.L. and Evans, B.W. (2010) Abbreviations for names of rock-forming minerals. 1113
American Mineralogist, 95, 185–187. 1114
1115
FIGURE CAPTIONS 1116
Fig. 1 – Geographical location and schematic tectonic elements of the Neogene Volcanic 1117
Province (NVP), SE Spain. a) Location map of the study area in the western Mediterranean; 1118
b) Enlargment of the area shown by the box in (a), with locations of the El Hoyazo volcanics 1119
and main outcrops of the Neogene Volcanic Province. 1120
1121
Fig. 2 – (A) Field image of a typical Grt-Bt-Sil (abbreviations according to Whitney and 1122
Evans 2010) enclave within the dacitic lava of El Hoyazo, and (B) microscopic, plane-1123
polarized light view of the sample HO1 with euhedral Grt, well-oriented Pl and Bt layers, and 1124
the Mix, a mixture of Sil + glass replacing a former Grt. 1125
1126
Fig. 3 – Orientation of the four sections mapped with -XRF: (1) HO1-YZ, (2) HO1-XZ, 1127
(3) HO1-XZexp, (4) HO1-YZdetail. The planes XY are oriented parallel to the main foliation 1128
marked by biotite and graphite. Section (4) is a selected area of section (1) mapped with high 1129
resolution (see text for details). 1130
1131
Fig. 4 – -XRF results and data processing of section (4): (A) RGB map combining the 1132
chemical signals of Si (red), K (green) and Fe (blue); (B) distribution of Bt, Mix and glass 1133
performed on the base of the Regions of Interests (ROIs) defined on RGB maps. White arrow 1134
tips point to glass films, yellow arrow tips point to glass pools; (C) chemical distribution of 1135
the element Gallium, which is characteristically present in sillimanite (grey tones, white = 1136
maximum concentration, black = minimum concentration); (D) superposition of the images B 1137
and C indicating that the glass is mostly concentrated at the outer borders of the Mix at the 1138
contact with biotite. 1139
1140
Fig. 5 – -XRF results and data processing of sections (1), (2) and (3). (A) RGB maps 1141
combining the chemical signals of Si (red), K (green) and Fe (blue); (B) distribution of Bt, 1142
Grt, Pl, Kfs, Mix and glass on the base of the Regions of Interests (ROIs) defined on RGB 1143
maps (white arrow tips=glass films, yellow arrow tips=glass pools); (C) superposition of the 1144
phase distribution (B) and the Gallium concentration maps (not reported here). Biotite is 1145
black and glass is dark red. The grey areas correspond to Mix, Grt, Pl and Kfs. 1146
1147
Fig. 6 - Backscattered electron images (BSE) of glass distribution in selected areas (white 1148
arrow tips=glass films, yellow arrow tips=glass pools or intermixed glass). (A) between Pl 1149
and Grt, (B) between Pl and Bt with Spl, (C) between Bt, Grt and the Mix, (D) and (F) 1150
between Bt and the Mix, (E) in Bt aggregates (F) eventually with Grt. Detailed images of the 1151
Mix away from the contact with biotite displaying (G) pools of glass or (H) no visible glass. 1152
1153
Fig. 7 – Backscattered electron images (BSE) with location of EMP glass analyses 1154
reported in Table 4 (yellow arrows pointing to glass). 1155
1156
Fig. 8 – Harker diagrams showing the major element concentrations (wt.%) and the 1157
Aluminum Saturation Index (ASI) of the matrix melt in HO1 (Table 4) and in crustal enclaves 1158
HO-50 and PFHZ3 (Table 5 – Supplementary Material, unpublished data from Acosta-Vigil). 1159
(A) Al2O3 vs. SiO2, (B) CaO vs. SiO2, (C) ASI vs. SiO2, (D) K2O vs. MgO + FeOt + TiO2. 1160
1161
TABLE CAPTIONS 1162
1163
Table 1 – Bulk composition of the enclave HO1 in weight %. 1164
1165
Table 2 – Representative EMP chemical analysis of minerals and glass from the enclave 1166
HO1 in weight %. 1167
1168
Table 3 - Modal composition of the enclave HO1 from mass balance calculation (weight 1169
%) and from image analysis (area %) on the four thin sections. 1170
1171
Table 4 –- EMP analyses of matrix glass in weight % in HO1 (with indication of the 1172
mineral in proximity). Selected points are reported in Fig. 7. 1173
1174
Table 5 Supplementary Material - EMP analyses of matrix glass in weight % from two 1175
Grt-Bt-Sil enclaves from El Hoyazo (HO-50 and PFHz3, unpublished data from Acosta-1176
Vigil). 1177
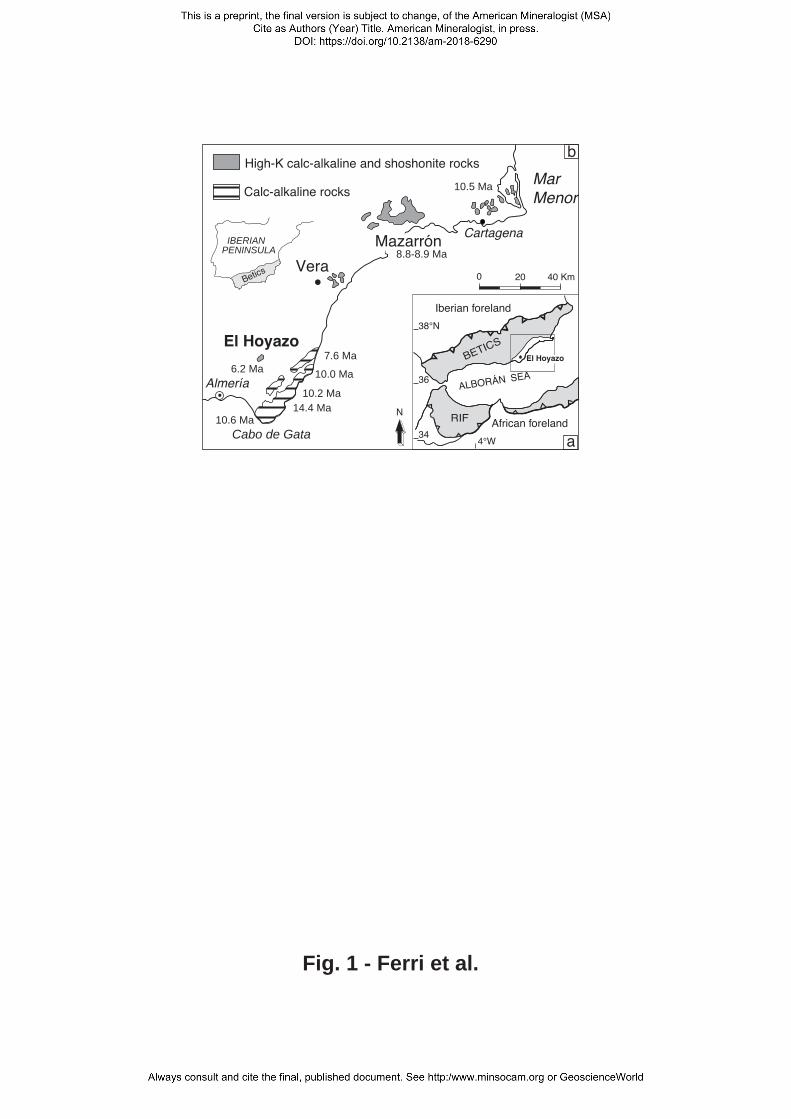
ALBORÁN SEA
BETICS
Betics
El Hoyazo
Cabo de Gata
Almería
Cartagena
Calc-alkaline rocks
High-K calc-alkaline and shoshonite rocks
IBERIANPENINSULA
40 Km200
38°N
36
34 a4°W
Iberian foreland
African foreland
El Hoyazo
RIFN
b
Mazarrón
Vera
Mar Menor
Fig. 1 - Ferri et al.
8.8-8.9 Ma
10.5 Ma
7.6 Ma
10.0 Ma
10.2 Ma
6.2 Ma
14.4 Ma10.6 Ma
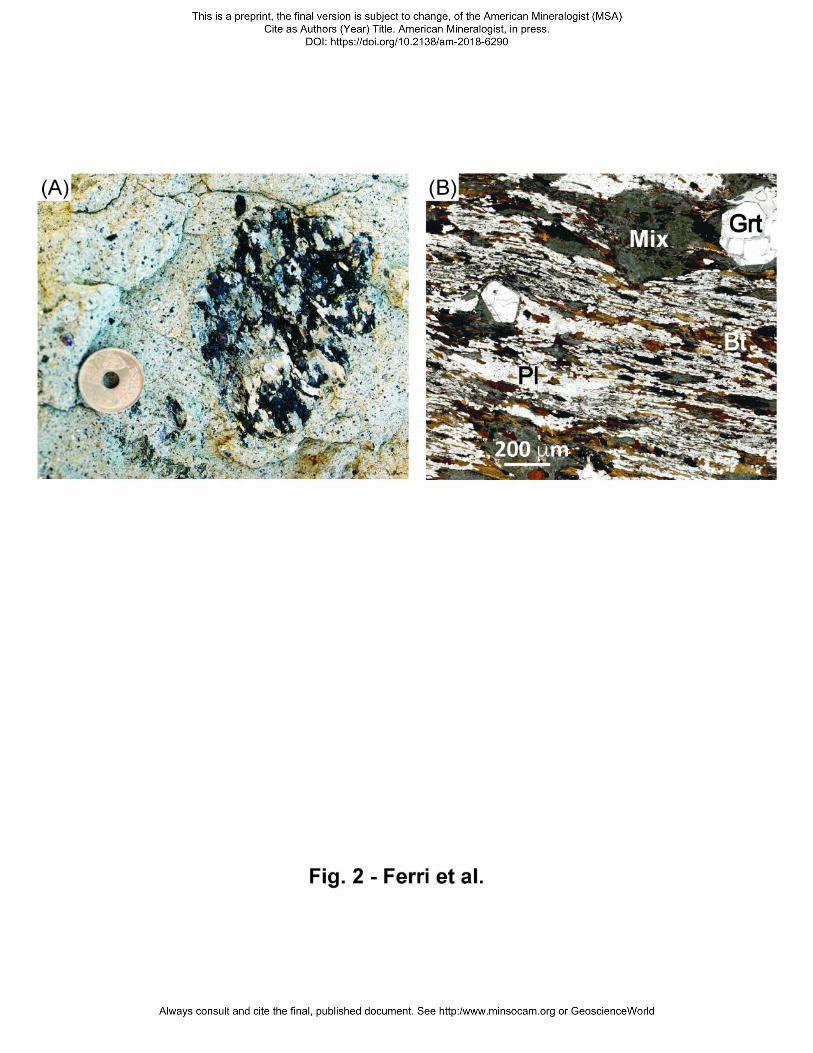
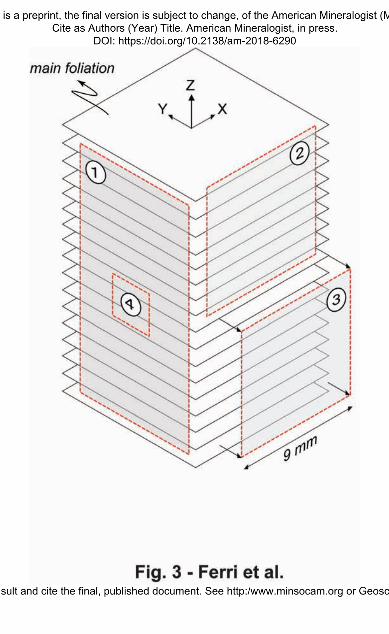
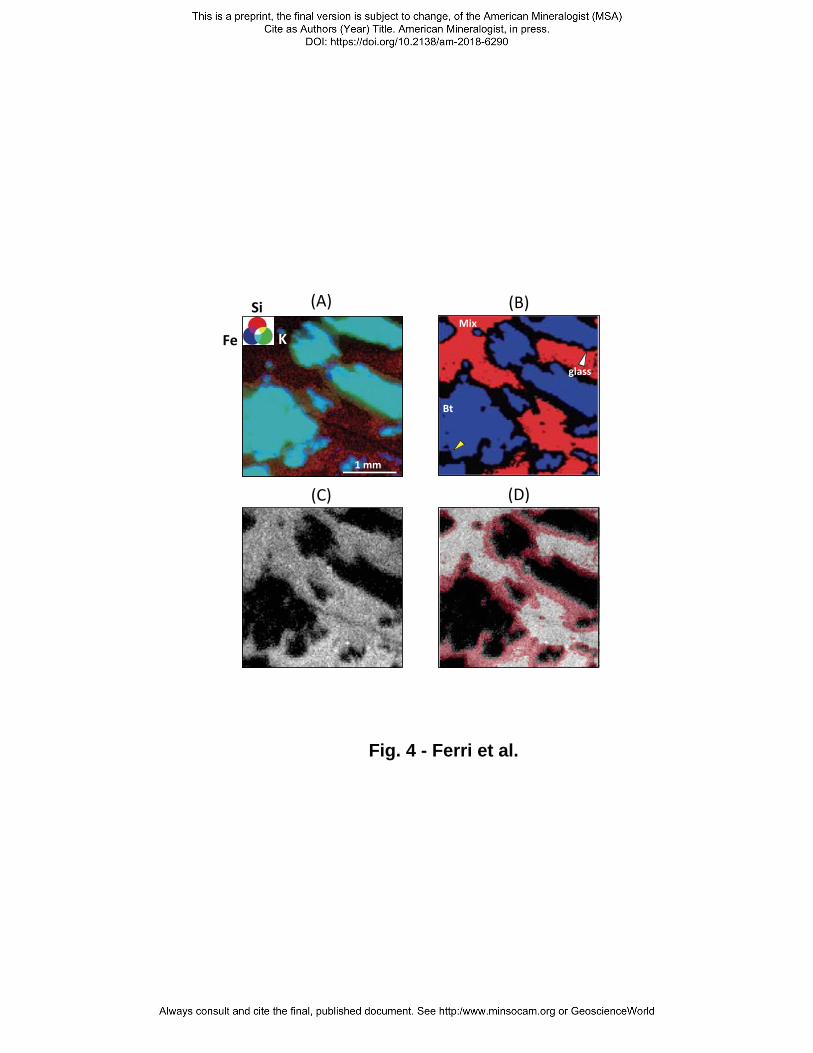
(A) (B)
(C) (D)
Bt
Mix
glass
Fig. 4 - Ferri et al.
Si
Fe K
1 mm
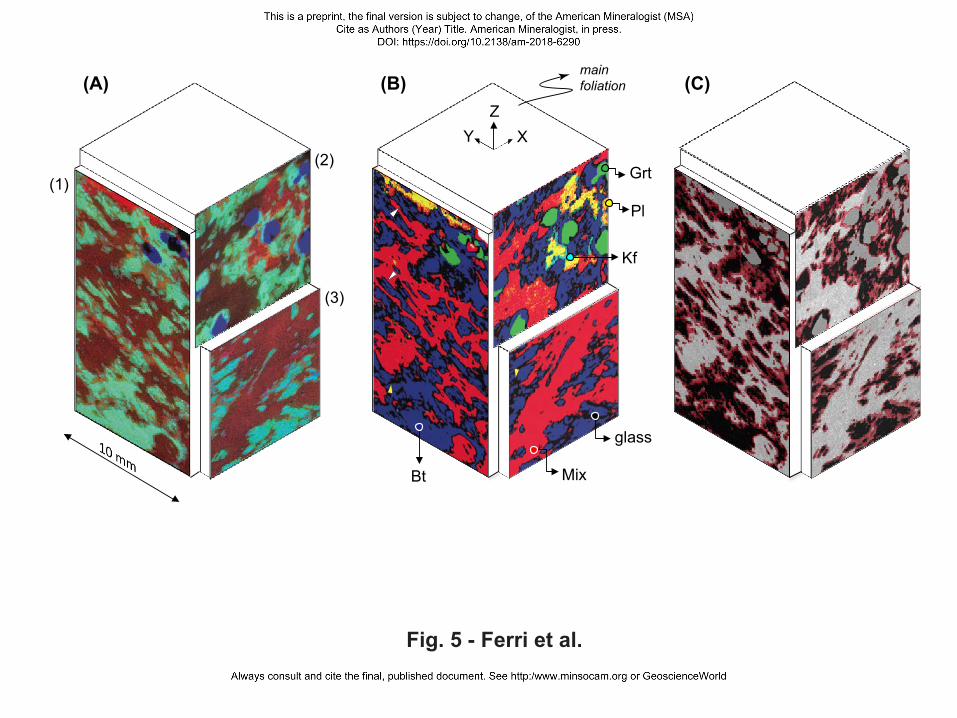
"
(A) (B) (C)
Pl
Kf
glass
MixBt
Grt
XYZ
XYZ
Fig. 5 - Ferri et al.
(1)(2)
(3)
main foliation
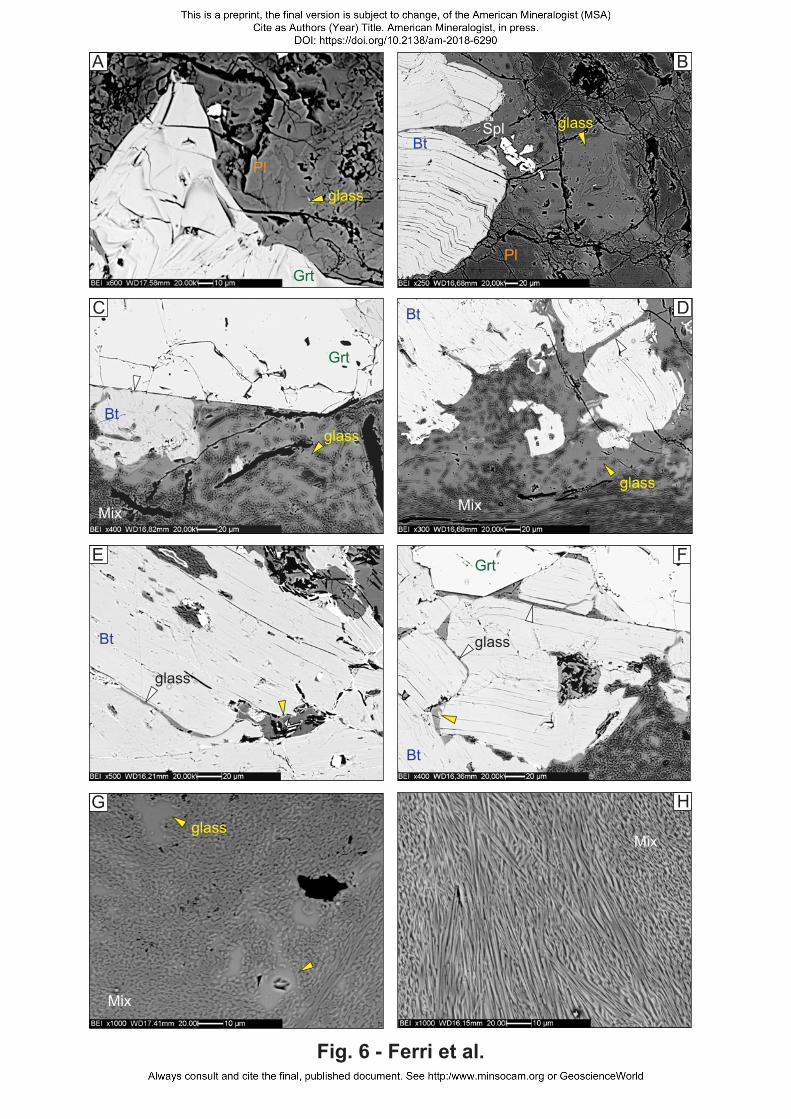
Fig. 6 - Ferri et al.
Mix
H
FGrt
Bt
glass
Pl
glass
Grt
A
Mix
glassG
Bt D
glassMix
Bt
glass
E
Grt
C
Mix
Btglass
Pl
Btglass
B
Spl
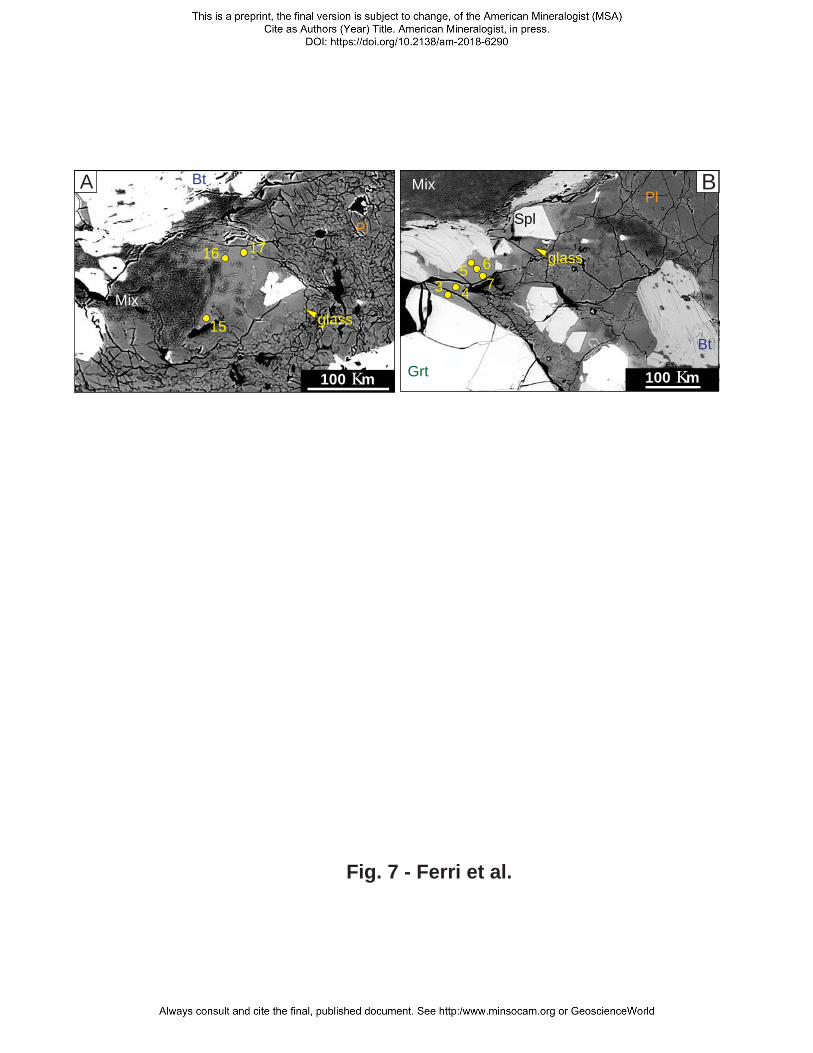
Fig. 7 - Ferri et al.
glass
3 45 6
7
BPl
Bt
Grt
Mix
100 Κm
Spl
Bt
Mixglass15
16 17
A
Pl
Bt
100 Κm
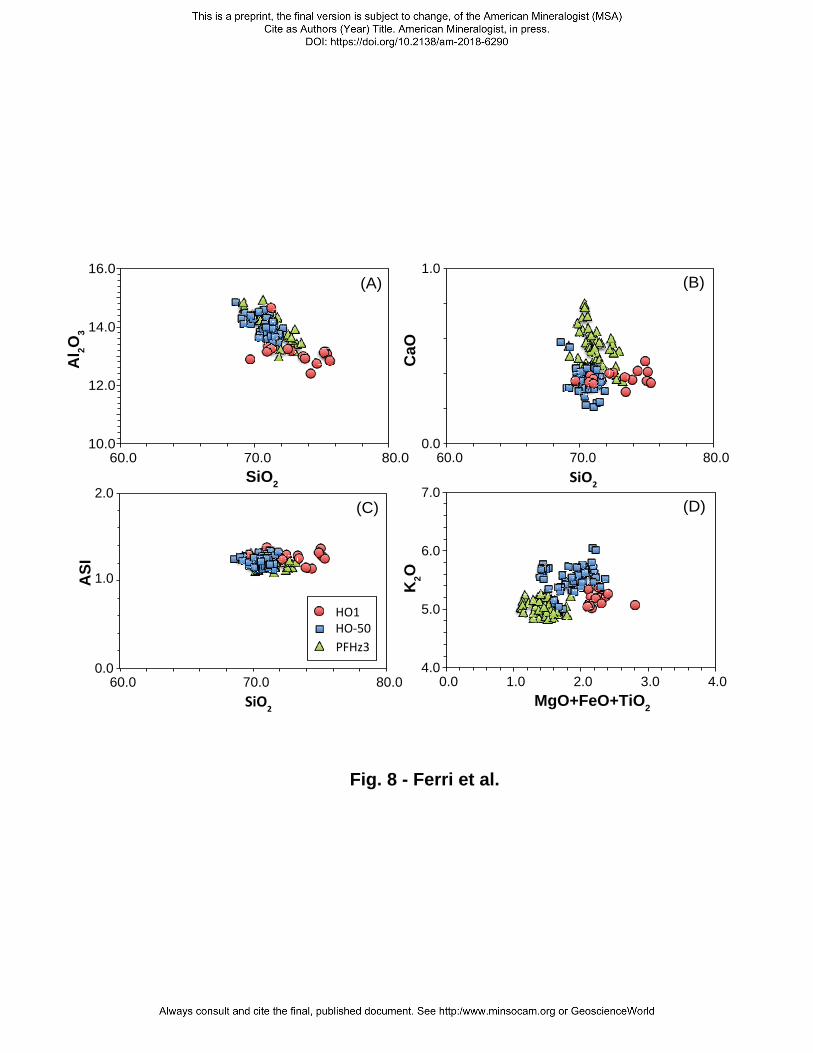
10.0
12.0
14.0
16.0
60.0 70.0 80.0
Fig. 8 - Ferri et al.
Al 2O
3
(A)
0.0
2.0
60.0 70.0 80.0
ASI 1.0
HO1HO-50PFHz3
SiO2
(C)
4.0
5.0
6.0
7.0
0.0 1.0 2.0 3.0 4.0MgO+FeO+TiO2
SiO2
K2O
(D)
0.0
1.0
60.0 70.0 80.0
CaO
SiO2
(B)
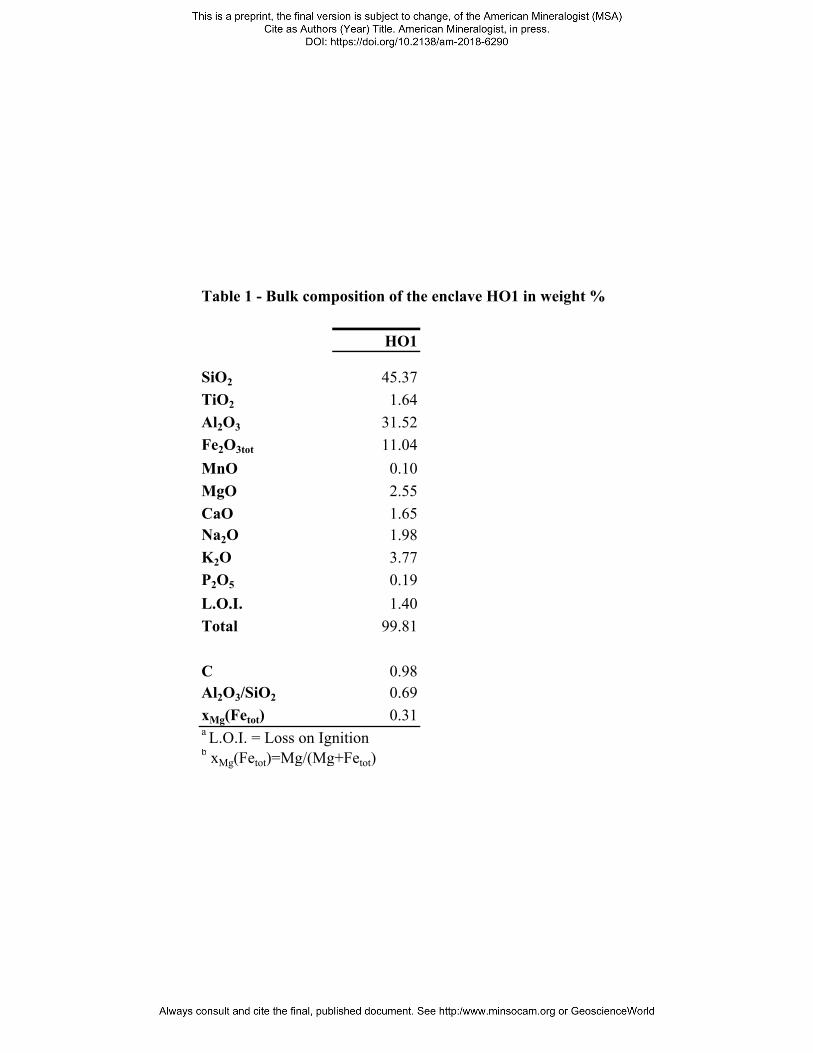
Table 1 - Bulk composition of the enclave HO1 in weight %
HO1
SiO2 45.37TiO2 1.64Al2O3 31.52Fe2O3tot 11.04MnO 0.10MgO 2.55CaO 1.65Na2O 1.98K2O 3.77P2O5 0.19L.O.I. 1.40Total 99.81
C 0.98Al2O3/SiO2 0.69xMg(Fetot) 0.31a L.O.I. = Loss on Ignitionb xMg(Fetot)=Mg/(Mg+Fetot)
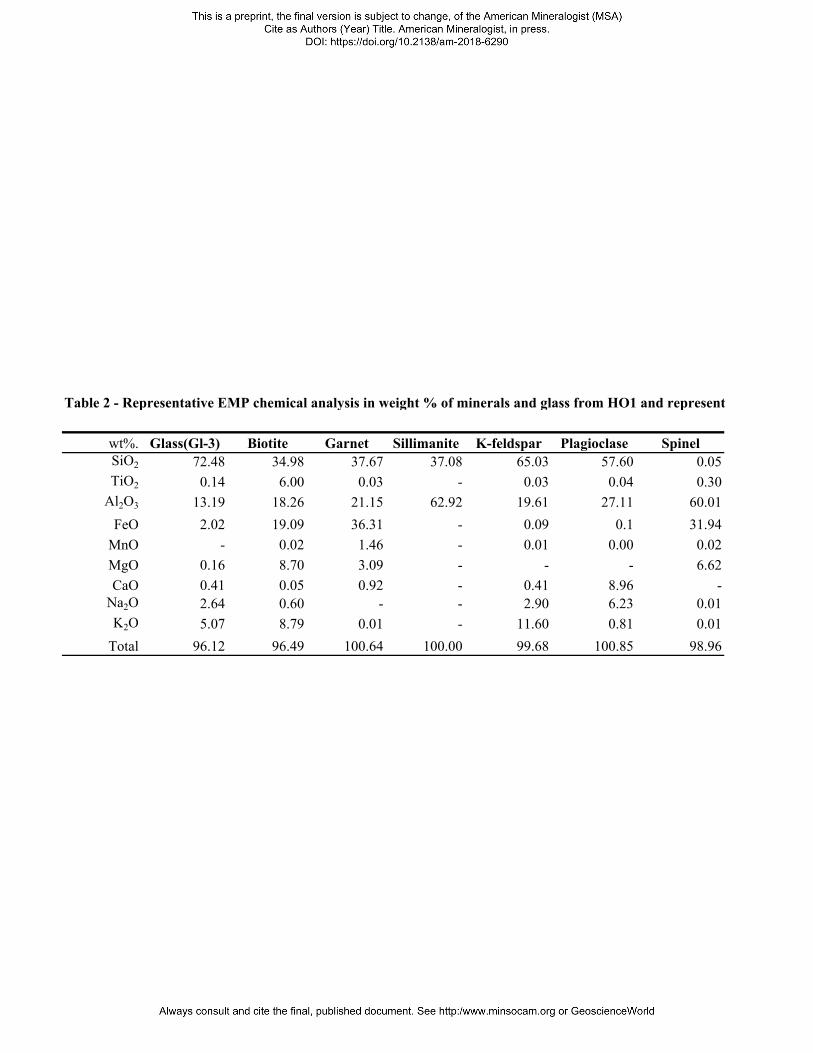
Table 2 - Representative EMP chemical analysis in weight % of minerals and glass from HO1 and represent
wt%. Glass(Gl-3) Biotite Garnet Sillimanite K-feldspar Plagioclase SpinelSiO2 72.48 34.98 37.67 37.08 65.03 57.60 0.05TiO2 0.14 6.00 0.03 - 0.03 0.04 0.30Al2O3 13.19 18.26 21.15 62.92 19.61 27.11 60.01FeO 2.02 19.09 36.31 - 0.09 0.1 31.94MnO - 0.02 1.46 - 0.01 0.00 0.02MgO 0.16 8.70 3.09 - - - 6.62CaO 0.41 0.05 0.92 - 0.41 8.96 -Na2O 2.64 0.60 - - 2.90 6.23 0.01K2O 5.07 8.79 0.01 - 11.60 0.81 0.01Total 96.12 96.49 100.64 100.00 99.68 100.85 98.96
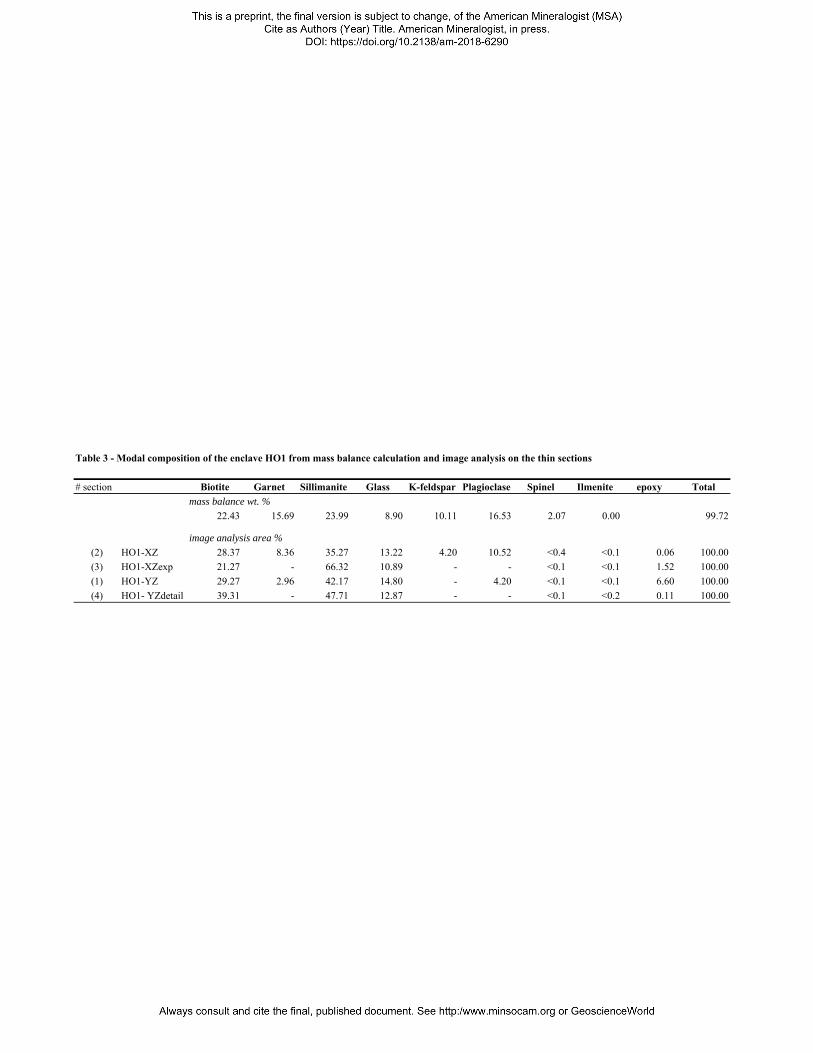
Table 3 - Modal composition of the enclave HO1 from mass balance calculation and image analysis on the thin sections
# section Biotite Garnet Sillimanite Glass K-feldspar Plagioclase Spinel Ilmenite epoxy Totalmass balance wt. %
22.43 15.69 23.99 8.90 10.11 16.53 2.07 0.00 99.72
image analysis area %(2) HO1-XZ 28.37 8.36 35.27 13.22 4.20 10.52 <0.4 <0.1 0.06 100.00(3) HO1-XZexp 21.27 - 66.32 10.89 - - <0.1 <0.1 1.52 100.00(1) HO1-YZ 29.27 2.96 42.17 14.80 - 4.20 <0.1 <0.1 6.60 100.00(4) HO1- YZdetail 39.31 - 47.71 12.87 - - <0.1 <0.2 0.11 100.00
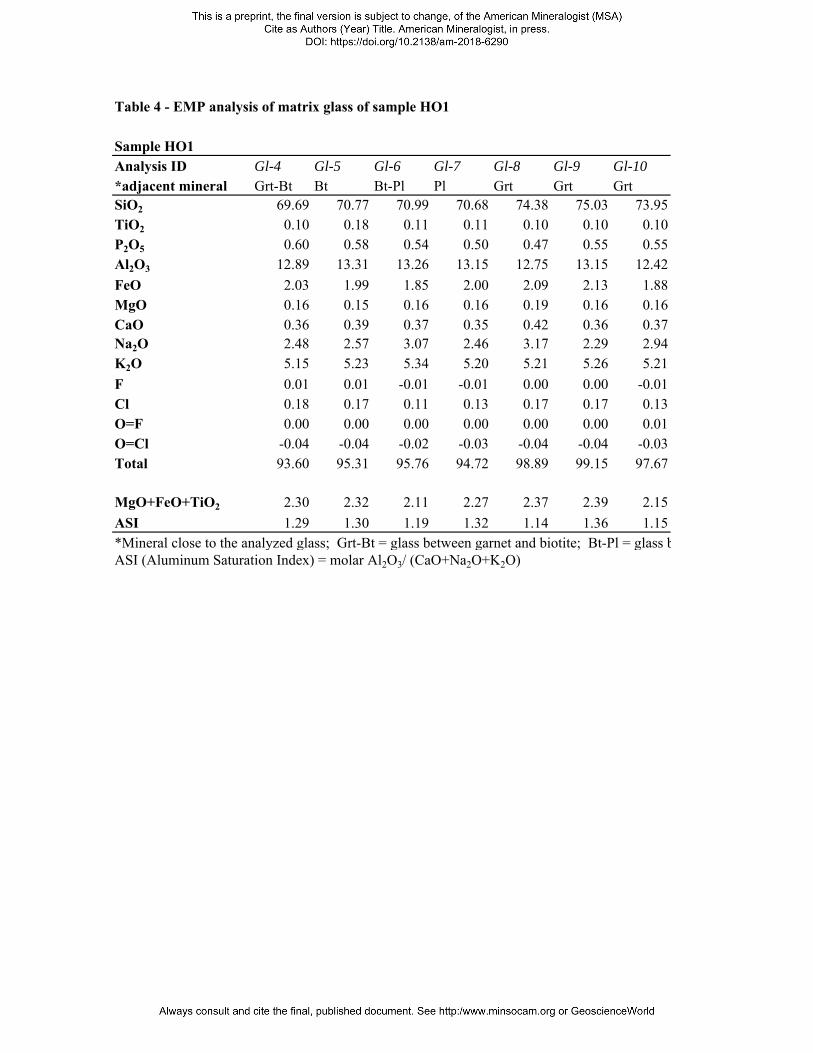
Table 4 - EMP analysis of matrix glass of sample HO1
Sample HO1Analysis ID Gl-4 Gl-5 Gl-6 Gl-7 Gl-8 Gl-9 Gl-10*adjacent mineral Grt-Bt Bt Bt-Pl Pl Grt Grt GrtSiO2 69.69 70.77 70.99 70.68 74.38 75.03 73.95TiO2 0.10 0.18 0.11 0.11 0.10 0.10 0.10P2O5 0.60 0.58 0.54 0.50 0.47 0.55 0.55Al2O3 12.89 13.31 13.26 13.15 12.75 13.15 12.42FeO 2.03 1.99 1.85 2.00 2.09 2.13 1.88MgO 0.16 0.15 0.16 0.16 0.19 0.16 0.16CaO 0.36 0.39 0.37 0.35 0.42 0.36 0.37Na2O 2.48 2.57 3.07 2.46 3.17 2.29 2.94K2O 5.15 5.23 5.34 5.20 5.21 5.26 5.21F 0.01 0.01 -0.01 -0.01 0.00 0.00 -0.01Cl 0.18 0.17 0.11 0.13 0.17 0.17 0.13O=F 0.00 0.00 0.00 0.00 0.00 0.00 0.01O=Cl -0.04 -0.04 -0.02 -0.03 -0.04 -0.04 -0.03Total 93.60 95.31 95.76 94.72 98.89 99.15 97.67
MgO+FeO+TiO2 2.30 2.32 2.11 2.27 2.37 2.39 2.15ASI 1.29 1.30 1.19 1.32 1.14 1.36 1.15*Mineral close to the analyzed glass; Grt-Bt = glass between garnet and biotite; Bt-Pl = glass bASI (Aluminum Saturation Index) = molar Al2O3/ (CaO+Na2O+K2O)
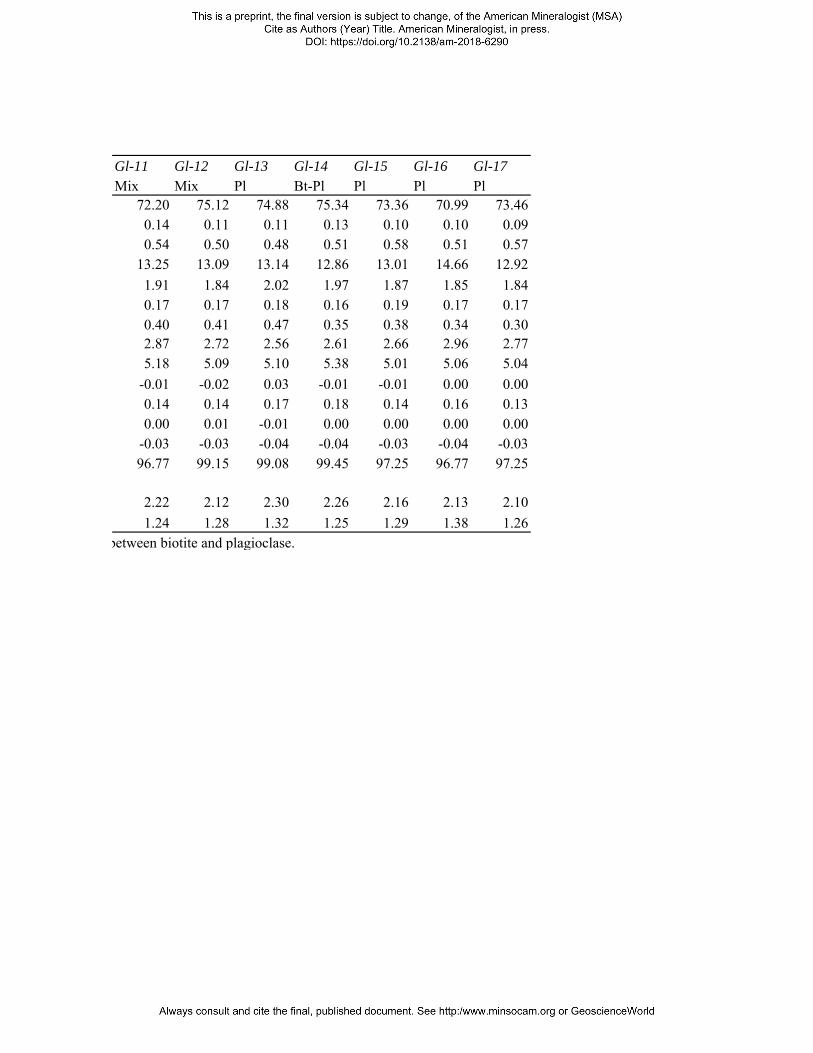
Gl-11 Gl-12 Gl-13 Gl-14 Gl-15 Gl-16 Gl-17Mix Mix Pl Bt-Pl Pl Pl Pl
72.20 75.12 74.88 75.34 73.36 70.99 73.460.14 0.11 0.11 0.13 0.10 0.10 0.090.54 0.50 0.48 0.51 0.58 0.51 0.57
13.25 13.09 13.14 12.86 13.01 14.66 12.921.91 1.84 2.02 1.97 1.87 1.85 1.840.17 0.17 0.18 0.16 0.19 0.17 0.170.40 0.41 0.47 0.35 0.38 0.34 0.302.87 2.72 2.56 2.61 2.66 2.96 2.775.18 5.09 5.10 5.38 5.01 5.06 5.04
-0.01 -0.02 0.03 -0.01 -0.01 0.00 0.000.14 0.14 0.17 0.18 0.14 0.16 0.130.00 0.01 -0.01 0.00 0.00 0.00 0.00
-0.03 -0.03 -0.04 -0.04 -0.03 -0.04 -0.0396.77 99.15 99.08 99.45 97.25 96.77 97.25
2.22 2.12 2.30 2.26 2.16 2.13 2.101.24 1.28 1.32 1.25 1.29 1.38 1.26
between biotite and plagioclase.