Embed Size (px)
Citation preview

Revision 0 – 11/02/01
U.S. Environmental Protection Agency
Environmental Technology Verification Program
For Metal Finishing Pollution Prevention Technologies
Verification Test Plan
for the
Evaluation of the Kaselco Electrocoagulation Treatment System
Revision 0
November 2, 2001
Concurrent Technologies Corporation is the Verification Partner for the EPA ETV Metal Finishing Pollution Prevention Technologies Center under EPA Cooperative Agreement
No. CR826492-01-0.

Revision 0 – 11/02/01
U.S. Environmental Protection Agency
Environmental Technology Verification Program
For Metal Finishing Pollution Prevention Technologies
Verification Test Plan
for the
Evaluation of Kaselco Electrocoagulation
Treatment System
November 2, 2001
i
Revision 0 – 11/02/01
TITLE: Environmental Technology Verification Program for Metal Finishing Pollution Prevention Technologies Verification Test Plan for the Evaluation of Kaselco Electrocoagulation Treatment System
ISSUE DATE: November 2, 2001
DOCUMENT CONTROL
This document will be maintained by Concurrent Technologies Corporation (CTC) in accordance with the EPA Environmental Technology Verification Program Quality and Management Plan for the Pilot Period 1995-2000 (EPA/600/R-98/064). Document control elements include unique issue numbers, document identification, numbered pages, document distribution records, tracking of revisions, a document MASTER filing and retrieval system, and a document archiving system.
ACKNOWLEDGMENT
This is to acknowledge Valerie Whitman (CTC), Paul Morkovsky (Kaspar Electroplating Company), and Kelly Mowry (Gull Industries) for their help in preparing this document.
Concurrent Technologies Corporation is the Verification Partner for the EPA ETV Metal Finishing Pollution Prevention Technologies Center under EPA Cooperative Agreement No.
CR826492-01-0.
ii

Revision 0 – 11/02/01
Environmental Technology Verification Program for Metal Finishing Pollution Prevention Technologies Verification Test Plan for the Evaluation of the Kaselco Electrocoagulation
Treatment System
APPROVED BY:
Signature denotes acceptance of this test plan as written regarding experimental design, quality assurance, test and analysis methods, operational procedures, equipment configuration, project management and current system operating effectiveness prior to testing.
iii

Revision 0 – 11/02/01
TABLE OF CONTENTS
Page 1.0 INTRODUCTION..............................................................................................................1
2.0 TECHNOLOGY DESCRIPTION ....................................................................................2
2.1 Theory of Operation.................................................................................................2
2.2 Description of Kaselco System................................................................................5
2.3 Description of the Ion Exchange Polishing System.................................................6
2.4 Commercial Status ...................................................................................................8
2.5 Environmental Significance .....................................................................................8
2.6 Local Installation......................................................................................................8
3.0 EXPERIMENTAL DESIGN...........................................................................................15
3.1 Test Goals and Objectives......................................................................................15
3.2 Critical and Non-Critical Measurements ...............................................................15
3.3 Test Matrix.............................................................................................................16
3.4 Testing and Operating Procedures .........................................................................18
3.4.1 Set-Up and System Initialization Procedures ............................................18
3.4.2 System Operation.......................................................................................19
3.4.3 Sample Collection and Handling ...............................................................20
3.4.4 Process Measurements and Information Collection ..................................22
3.4.4.1 Duration of Treatment and Wastewater Volume Processed .......23
3.4.4.2 Polymer Usage Data....................................................................24
3.4.4.3 Volume of Ion Exchange Regenerant .........................................24
3.4.4.4 Ion Exchange System Regeneration Chemical Use ....................24
3.4.4.5 Quantity of Sludge ......................................................................26
3.4.4.6 Electricity Use Data ....................................................................26
3.4.4.7 System Operation and Maintenance Data ...................................26
3.4.4.8 Cost Data.....................................................................................26
3.4.4.9 Steel Plate Consumption.............................................................26
3.4.4.10 Ion Exchange System Operational Data .....................................26
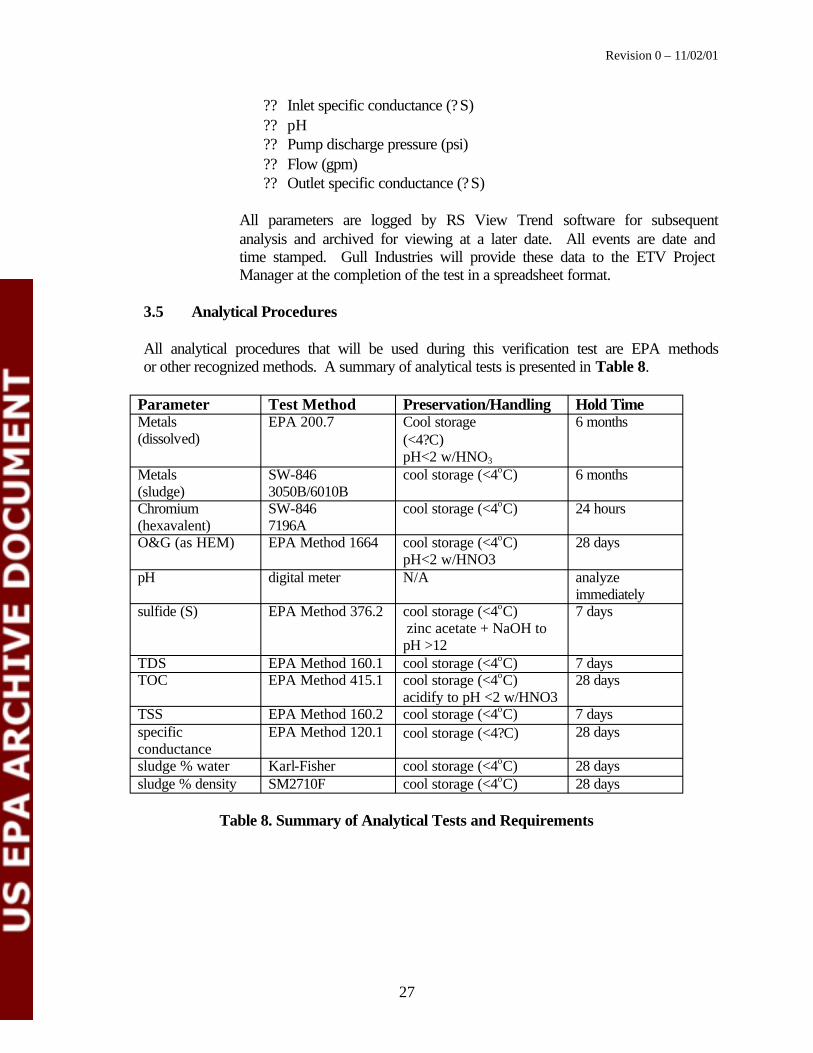
3.5 Analytical Procedures ............................................................................................27
4.0 QUALITY ASSURANCE/QUALITY CONTROL REQUIREMENTS .....................28
4.1 Quality Assurance Objectives ................................................................................28
iv
Revision 0 – 11/02/01
4.2 Data Reduction, Validation, and Reporting ...........................................................28
4.2.1 Internal Quality Control Checks ................................................................28
4.2.2 Calculation of Data Quality Indicators ......................................................29
4.2.2.1 Precision......................................................................................29
4.2.2.2 Accuracy .....................................................................................30
4.2.2.3 Completeness ..............................................................................30
4.2.2.4 Comparability..............................................................................33
4.2.2.5 Representativeness......................................................................33
4.2.2.6 Sensitivity....................................................................................33
4.3 Additional Data Calculations .................................................................................34
4.3.1 Ability to Meet Metal Finishing and Proposed MP&M Limitations .........34
4.3.2 Mass Balance .............................................................................................35
4.3.3 Pollutant Removal Efficiency....................................................................36
4.3.4 Reusability of Treated Wastewater............................................................36
4.3.5 Energy Use .................................................................................................36
4.3.6 Cost Analysis .............................................................................................37
4.3.7 Sludge Generation Analysis.......................................................................37
4.3.8 Environmental Benefit ...............................................................................37
4.4 Test Plan Modifications .........................................................................................38
4.5 Quality Audits........................................................................................................38
5.0 PROJECT MANAGEMENT..........................................................................................39
5.1 Organization/Personnel Responsibilities ...............................................................39
6.0 EQUIPMENT AND UTILITY REQUIREMENTS .....................................................40
7.0 HEALTH AND SAFETY PLAN ....................................................................................40
7.1 Hazard Communication .........................................................................................40
7.2 Emergency Response Plan.....................................................................................40
7.3 Hazard Controls Including Personal Protective Equipment ..................................40
7.4 Lockout/Tagout Program.......................................................................................40
7.5 Material Storage .....................................................................................................41
7.6 Safe Handling Procedures ......................................................................................41
8.0 WASTE MANAGEMENT..............................................................................................41
9.0 TRAINING .......................................................................................................................41
10.0 REFERENCES .................................................................................................................42
v
Revision 0 – 11/02/01
11.0 DISTRIBUTION ..............................................................................................................42
LIST OF FIGURES Page
Figure 1. Diagram of Kaselco System ........................................................................................... 3
Figure 2. Photograph of Kaselco System....................................................................................... 4
Figure 3. Photograph of Interior of Electrocoagulation Reactor (Rx) ........................................... 5
Figure 4. Diagram of Ion Exchange Polishing System.................................................................. 7
Figure 5. Photograph of Gull Industries' Decorative Chromium Plating Line .............................. 9
Figure 6. 20,000 Liter Equalization Tank ..................................................................................... 9
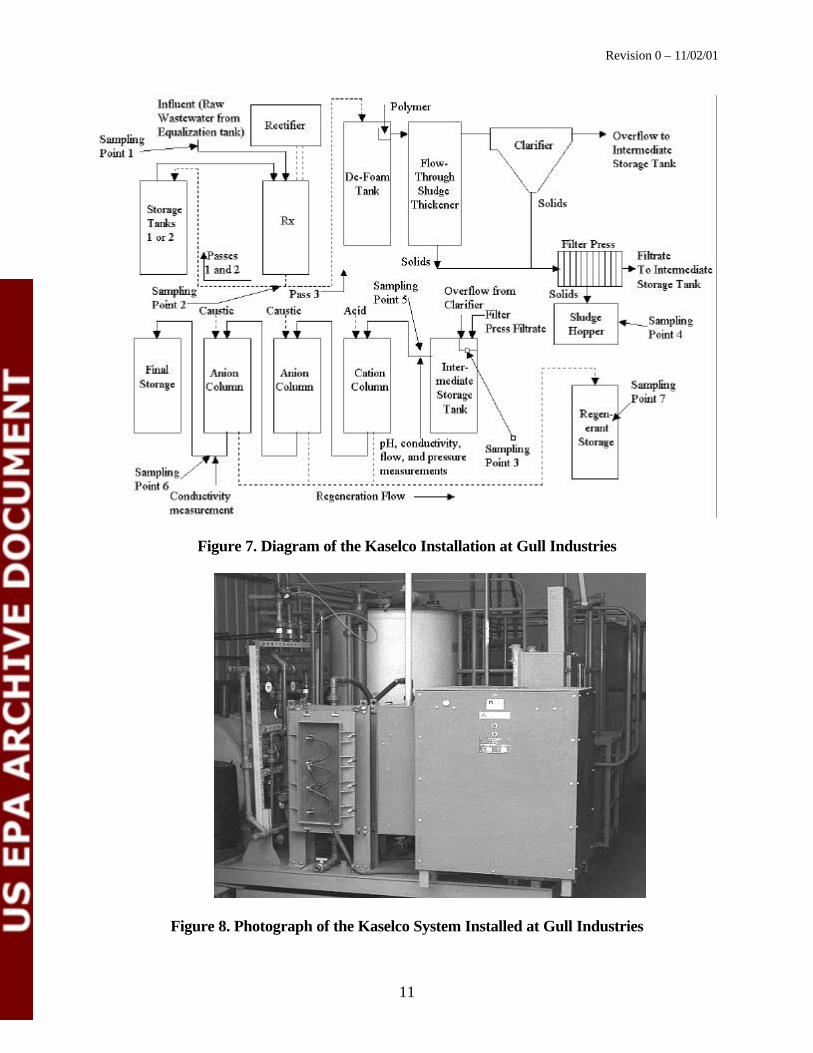
Figure 7. Diagram of the Kaselco Installation at Gull Industries ................................................ 11
Figure 8. Photograph of the Kaselco System Installed at Gull Industries ................................... 11
Figure 9. Photograph of the Ion Exchange Polishing System Installed at Gull Industries .......... 13
Figure 10. Photograph of the Kaselco System Showing Sample Point 1 .................................... 21
Figure 11. Photograph of the Kaselco System Showing Sample Point 4 .................................... 22
LIST OF TABLES
Table 1. Preliminary Analytical Results ...................................................................................... 12
Table 2. Summary of Current and Proposed Regulations Applicable to Gull Industries ............ 14
Table 3. Test Matrix for the Kaselco System and Ion Exchange Polishing System.................... 17
Table 4. Test Objectives and Related Test Measurements for Evaluation of the
Kaselco System.............................................................................................................. 18
Table 5. Sampling Sequence for Batch Treatment and Test Runs ............................................... 20
Table 6. Sampling Locations, Frequency and Parameters ........................................................... 23
Table 7. Sample Quantities from Each Sampling Point ............................................................... 25
Table 8. Summary of Analytical Tests and Requirements ........................................................... 27
Table 9. QA Objectives................................................................................................................ 32
Table 10. Applicable Pretreatment Standards for Existing Sources for the
Metal Finishing Subcategory (40 CFR 433) ................................................................ 34
Table 11. Applicable Proposed Pretreatment Standards for Existing Sources for the
MP&M Job Shop Subcategory (66 FR 424) ................................................................ 35
vi
Revision 0 – 11/02/01
LIST OF APPENDICES
APPENDIX A: Operating Procedures for Kaselco System………………………….. A-1
APPENDIX B: Data Collection Forms for Kaselco and Ion Exchange Polishing Systems……………………………………………………………… B-1
APPENDIX C: Test Plan Modification Request……………………………………... C-1
APPENDIX D: ETV-MF Operation Planning Checklist……………………………... D-1
APPENDIX E: Job Training Analysis Form…………………………………………. E-1
APPENDIX F: ETV-MF Project Training Attendance Form………………………... F-1
vii
Revision 0 – 11/02/01
ACRONYMS & ABBREVIATIONS
BPT Best Practical Treatment C Celsius cfm Cubic Feet per Minute cm Centimeter COC Chain of Custody CTC Concurrent Technologies Corporation DAF Dissolved Air Flotation DC Direct Current EHS Extremely Hazardous Substances EPA Environmental Protection Agency ETV-MF Environmental Technology Verification – Metal Finishing ft Feet g Gram gal Gallon gpm Gallons per Minute hp Horsepower hr Hour ICP Inductively Coupled Plasma ID Identification IDL Instrument Detection Limit JTA Job Training Analysis Kaselco Kaselco Electrocoagulation Treatment System kg Kilogram kW Kilowatt kWh Kilowatt Hour L Liter L/min Liter per Minute LM Laboratory Manager
3m Cubic Meters MDL Method Detection Limit ? S Microsiemens mg/L Milligram/Liter min Minute mL Milliliter MP&M Metal Products & Machinery MRL Method Reporting Limit MSDS Material Safety Data Sheet(s) ND Not Detected NR Not Regulated NRMRL National Risk Management Research Laboratory O&G Oil and Grease O&M Operating & Maintenance P Percent Recovery
viii
Revision 0 – 11/02/01
ACRONYMS & ABBREVIATIONS (continued)
PARCCS Precision, Accuracy, Representativenss, Comparability, Completeness and Sensitivity
PLC Programmable Logic Controller PM Program Manager POC Point of Contact POTW Publicly Owned Treatment Works ppb Parts per Billion PPE Personal Protective Equipment ppm Parts per Million PQL Practical Quantification Limit psi Pounds per Square Inch QA/QC Quality Assurance/Quality Control QMP Quarterly Management Plan R Raw Wastewater Samples RPD Relative Percent Difference Rx Reactor SOP Standard Operating Procedure SR Sample Result SSR Spiked Sample Result STL Severn Trent Laboratories T Treated Wastewater Samples TDS Total Dissolved Solids TMDL Total Maximum Daily Limit TOC Total Organic Carbon TPMR Test Plan Modification Request TSA Technical System Audit TSS Total Suspended Solids U.S. United States
ix
Revision 0 – 11/02/01
1.0 INTRODUCTION
The purpose of this test plan is to document the objectives, procedures, equipment, and other aspects of testing that will be utilized during verification testing of the Kaselco Electrocoagulation Treatment System. This test plan has been prepared in conjunction with the U.S. Environmental Protection Agency’s (EPA’s) Environmental Technology Verification Program for Metal Finishing Pollution Prevention Technologies (ETV-MF). The objective of this program is to identify promising and innovative pollution prevention technologies through EPA-supported performance verifications. The results of the verification test will be documented in a verification report that will provide objective performance data to metal finishers, environmental permitting agencies, and industry consultants. A verification statement, which is an executive summary of the verification report, will be prepared and signed by the EPA National Risk Management Research Laboratory (NRMRL) Director.
1.1 Background
The Kaselco system is designed to treat wastewaters containing dissolved metals, including hexavalent chromium, and organics such as oil. During this test, the Kaselco system will be used in conjunction with an ion exchange polishing1 system to treat the wastewater from a metal finishing job shop.
The focus of testing will be to determine the quality of the effluent produced by the Kaselco system alone and in combination with the ion exchange system, the quantity and characteristics of wastewater sludge produced during treatment, the quantity and characteristics of ion exchange regenerant produced during treatment, and the cost of operation. In terms of effluent water quality, of particular interest is the ability of the treatment systems to meet existing effluent standards for the Metal Finishing point source category [Ref. 1] and proposed effluent standards for the Metal Products and Machinery (MP&M) point source category [Ref. 2]. The metal finishing regulations were promulgated in July 1983, which for most metal finishing companies are the applicable current standards. The proposed MP&M limitations were published on January 3, 2001.
Testing of the Kaselco system will be conducted at Gull Industries, located in Houston, Texas. Gull Industries is a metal finishing job shop that performs decorative chromium electroplating, electroless nickel plating, and passivation of stainless steel. The Kaselco system has been installed at Gull Industries for approximately five years. During this time period, the Kaselco system was under development and several versions of the technology have been used. The present Kaselco system installed at Gull Industries is a 38-liter/min(l/min)/10gallons/minute (gpm) commercial unit with two electrocoagulation reactors (Rxs) connected in series. It is operated on a batch basis. The ion exchange
1 "Polishing" is a term used to describe a system that is utilized to remove residual contaminants following treatment by a preliminary technology. Typically, the preliminary technology removes the bulk of the contaminants and the polishing technology removes most of the remaining contaminants. Polishing technologies are frequently utilized as final treatment prior to water recycling or when stringent discharge standards exist.
1

Revision 0 – 11/02/01
polishing system at Gull Industries was installed in 2001. It can be operated as a stand alone treatment system or as a polishing technology. It has a design flow rate of 83 L/min (22 gpm) and can be operated in a batch or continuous mode.
Wastewater from the Gull Industries electroplating line will be processed during testing. Testing will consist of three test runs, with each test run treating approximately 3,400 L of wastewater. During testing, samples of raw and treated wastewater, sludge, and ion exchange regenerant will be collected and analyzed.
This test plan has been structured based on a format developed for ETV-MF projects. This document describes the intended approach and explains testing plans with respect to areas such as test methodology, procedures, parameters, and instrumentation. Also included are quality assurance (QA)/quality control (QC) requirements of this task that will ensure the accuracy of data, data interpretation procedures, and worker health and safety considerations.
1.2 Data Quality Obje ctives (DQO)
The systematic planning elements of the data DQO process identified in “Guidance for the Data Quality Objectives Process” (EPA QA/G-4, August 2000), were specifically utilized during preparation of this verification test plan. The project team, composed of representatives from CTC, the testing organization, the technology vendor, the host site, the analytical laboratory, and the US EPA, who assisted in preparing this test plan, jointly developed: the test objectives, critical and non-critical measurements, the test matrix, sample quantity, type, and frequency, analytical methods, and QA objectives to arrive at an optimized test designed to verify the performance of the technology.
2.0 TECHNOLOGY DESCRIPTION
2.1 Theory of Operation
The Kaselco system (see diagram of system in Figure 1 and photograph of system in Figure 2) is a series of tanks and associated equipment used to process industrial wastewater containing dissolved metals and organics such as oil. According to the manufacturer, use of the Kaselco electrocoagulation system can replace conventional chemical treatments such as pH adjustment, sulfide compound chromium reduction, oil removal, and chemical coagulation.
The unique aspect of the Kaselco system is the electrocoagulation step. Electrocoagulation is a process that uses electricity (direct current) and metal plates to cause metal contaminants in wastewater to become destabilized and precipitate. Several materials such as steel, aluminum, and titanium are available for the reactor plates. Steel plates are used in the Kaselco system that will be tested during this verification project. The unit is configured with anode, cathode and non-polarized steel plates. The plates are stacked in a reactor tank with small gaps separating each plate. Wastewater flows in a serpentine pattern around the plates causing electrical current to flow from plate to plate.
2
Revision 0 – 11/02/01
The current flow causes the steel anode plates to dissolve slowly, thereby releasing ferrous ions into the wastewater. The polarity of the plates is automatically reversed on a periodic basis. This action maintains a clean steel plate surface and equalizes the corrosion rates of the plates. A photograph showing the inside of an electrocoagulation reactor with electro-corroded steel plates is shown in Figure 3. The ferrous iron that is dissolved in the wastewater chemically reacts with the hexavalent chromium and reduces it to the trivalent state. During this reduction process, the iron is converted to trivalent iron hydroxide and other compounds, which results in a co-precipitation effect, where the iron hydroxide adsorbs heavy metal cations (e.g., nickel) onto its surface. The process has the advantage of being able to reduce chromium at neutral pH. The conventional chromium reduction process (sodium bisulfate reduction process) is operated between pH 2.0 and 3.0. Since the incoming wastewater is usually above this pH range, acid is added to lower the pH. This is a drawback of the conventional process since the subsequent metal removal step (i.e., precipitation) is performed at an elevated pH (7.0 to 9.5), and therefore the introduction of an acid increases the subsequent need for alkali reagent.
The electrocoagulation system also removes oil. According to the manufacturer, this is accomplished by converting oil to a metallic soap scum and removing it by settling in a clarifier, as with the system that will be tested, or by using dissolved air flotation (DAF). DAF is used when the solids component of the wastewater tends to rise (e.g., high hydrocarbon concentration).
Figure 1. Diagram of Kaselco System
3
Revision 0 – 11/02/01
Figure 2. Photograph of Kaselco System
According to the manufacturer, the benefit of electrocoagulation is threefold:
?? Wastewaters containing hexavalent chromium or oil do not need to be segregated and pretreated (i.e., hexavalent chromium reduction, emulsion breaking) prior to metals precipitation.
?? Use of treatment reagents is substantially reduced or eliminated, resulting in cost savings.
?? Because fewer or no reagents are used, the effluent is lower in total dissolved solids (TDS) than with use of standard chemical treatment precipitation, thus increasing the recycle potential of the effluent.
The installed ion exchange polishing system consists of three skid-mounted pressure vessels, with interconnecting piping and control valves. It is also equipped with a programmable logic controller (PLC)-based control system.
Ion exchange is a chemical reaction wherein an ion from solution is exchanged for a similarly charged ion attached to an immobile solid particle (i.e., ion exchange resin). Ion exchange reactions are stoichiometric (i.e., predictable based on chemical relationships) and reversible. The strategy employed in using this technology is to exchange somewhat harmless ions (e.g., hydrogen and hydroxyl ions), located on the resin, for ions of interest in the solution (e.g., regulated metals). In the most basic sense, ion exchange materials are classified as either cationic or anionic. Cation resins exchange hydrogen ions for positively charged ions such as nickel, copper, and sodium.
4
Revision 0 – 11/02/01
Anion resins exchange hydroxyl ions for negatively charged ions such as chromates, sulfates, and cyanide [Ref. 3].
Ion exchange resins are usually contained in vessels referred to as columns. The basic column consists of a resin bed, which is retained in the column with inlet and outlet screens, and service and regeneration flow distributors. Piping and valves are required to direct flow and instrumentation is required to monitor water quality and control regeneration timing. The systems are operated in cycles consisting of the following four steps:
1. Service (exhaustion) - Water solution containing ions is passed through the ion exchange column or bed until the exchange sites are exhausted.
2. Backwash - The bed is washed (generally with water) in the reverse direction of the service cycle in order to expand and resettle the resin bed.
3. Regeneration - The exchanger is regenerated by passing a concentrated solution of the ion originally associated with it through the resin bed; usually a strong mineral acid or base.
4. Rinse - Excess regenerant is removed from the exchanger, usually by passing water through it.
Figure 3. Photograph of Interior of Electrocoagulation Reactor (Rx)
2.2 Description of Kaselco System
Various configurations of the Kaselco system are in use. A diagram of a typical system is shown in Figure 1. Wastewater initially flows into the electrocoagulation Rx. In the
5
Revision 0 – 11/02/01
system Rx, a direct current (100 to 120 amps, 0 to 40 volts DC) is applied using an associated rectifier and sacrificial anode plates. The typical residence time in the Rx is 14 seconds. Reactions occur in the Rx, including the reduction of Cr+6 to Cr+3, and the generation of insoluble oxides and hydroxides. Single or dual Rx units can be used. Also, single or multiple pass systems can be designed. The wastewater flows from the Rx to a de-foam tank, which has a residence time of 30 min. Electrolysis gases are separated from the wastewater in the de-foam tank, which is agitated by a mechanical mixer. A polymer is sometimes added to improve floc formation as the wastewater exits the de-foam tank (not all Kaselco systems use polymer). The wastewater is then transferred through a sludge thickener to a conventional clarifier where solids separation takes place. The overflow from the clarifier is discharged to a storage tank. The underflow from the clarifier goes to a thickener. Thickened sludge is dewatered on a filter press and sent off-site for recovery or disposal.
Kaselco systems are designed to operate on either a continuous flow or batch basis. The system that will be tested is a batch treatment process and is described in section 2.6.
2.3 Description of the Ion Exchange Polishing System
The installed polishing system consists of skid-mounted pressure vessels, with interconnecting piping and control valves. The process parameters and equipment status are constantly monitored and fed back to a PLC-based control system. The system status and process parameters are viewed on a display located in the control panel, which is also mounted on the skid.
A schematic diagram of the ion exchange polishing system is shown in Figure 4. The system operates by receiving influent from a tank via a three-way valve, to the suction side of a pump. The water is then discharged from the pump under pressure, and is monitored for pH, specific conductance, pressure, and flow. The resultant analog signals are sent to the PLC for subsequent processing and display. Each of the analog signals has two high-level and two low- level alarms. The alarms cause the valve systems to either open or close, which cause a change of direction or stopping of flow. The alarms cause a change in direction of flow, or they cause the valve systems to either open or close). The water is allowed to enter the top of the first vessel containing a cation resin to remove the initial shock loading of heavy metals; and exits at the bottom of that vessel.
6
Revision 0 – 11/02/01
Figure 4. Diagram of Ion Exchange Polishing System
The partially de-ionized water then enters the second and third vessels (anion columns) in the same manner as the first vessel, whereupon the remaining ionic loading is removed. The resultant discharge from vessel number 3 is again monitored for pH and specific conductance, and can then be reused in the metal finishing process.
The contaminants from the influent remain in each of the three vessels bonded to each of the special purpose resins. The water is allowed to flow continuously through the system until such time that the resin is exhausted (i.e., its ability to remove cations and anions from the water has ended). This is determined by the specific conductance of the water exiting the system at vessel number 3. At this point the system goes off line (usually outside production hours) and regenerates itself in situ.
The regeneration process (the process of removing cations and anions from the resin, which were captured during normal operation) is carried out automatically. Each vessel regenerates itself in turn starting with vessel number 1. Passing acids and/or bases over the resins to remove the captured cations and anions carries out regeneration of the resin. City water is used as a rinse following regeneration. The regenerant exits each of the vessels and is captured in a holding tank for subsequent processing and disposal. At this point, the unit is ready to go back on line for the processing of influent.
7
Revision 0 – 11/02/01
2.4 Commercial Status
The Kaselco system is a fully commercialized product. The ion exchange polishing system is a separate commercial product.
2.5 Environmental Significance
The Kaselco system treats metal finishing wastewaters with little or no use of chemical reagents such as acids, alkalis, or sodium metabisulfite. These materials effectively remove metals, but they add to the TDS content of the wastewater. The Kaselco system effluent is thus expected to be lower in dissolved solids and, therefore, is more amenable to recycling back to the metal finishing process. Also, the Kaselco system effluent is reported to be below 10 milligrams/liter (mg/L) oil and grease (O&G). By producing an effluent that is very low in O&G content, the effluent is more amenable to recycling. This is due to the fact that oil can render ineffective technologies that are used for final polishing prior to water reuse such as ion exchange resins and membranes. Also, oil can cause precipitated particles to remain suspended or float in clarifiers, resulting in carryover of solids to the discharge. Therefore, by lowering the O&G concentration, the concentration of metals in the effluent may also be decreased.
The overall quantity of sludge produced by the Kaselco system may be lower than for conventional systems that use lime or sodium hydroxide for metals precipitation. The conventional systems generate bulky hydroxide precipitants, while much of the precipitated material from the Kaselco system is reported to be in the form of metal oxides.
The ion exchange polishing system reportedly removes toxic metals to near or below detection limits and effectively deionizes wastewater. Resultant discharges of the wastewater contain little or no measurable concentrations of toxic metals. Also, the processed water may be sufficiently purified for reuse in the electroplating process, which may entirely eliminate the discharge of liquid to the sewer or receiving streams.
2.6 Local Installation
The Kaselco and ion exchange polishing systems will be tested at Gull Industries, located in Houston, Texas. Gull Industries is a metal finishing job shop that performs nickel and chromium electroplating, electroless nickel plating, and passivation using nitric acid. A photograph of the decorative chromium plating line is shown in Figure 5. The Kaselco system installed at Gull Industries is rated at 38 L/min and has dual electrocoagulation Rxs piped in series. The ion exchange polishing system installed at Gull Industries is rated at 83 L/min. It has one cation column (1.02 cubic meters (m3) of resin) and two anion columns (total of 1.13 m3 of resin).
8
Revision 0 – 11/02/01
Figure 5. Photograph of Gull Industries' Decorative Chromium Plating Line
The majority of wastewater generated at Gull Industries is rinse water and to a lesser extent spent cleaning baths. Approximately 7,500 L of wastewater is generated on a daily basis at Gull Industries. The concentration of regulated metals in the wastewater is typically above 300 mg/L (mostly nickel and chromium). Raw wastewater is stored in a 20,000-L equalization tank (Figure 6) prior to treatment.
Figure 6. 20,000 Liter Equalization Tank
9
Revision 0 – 11/02/01
A diagram of the combined Kaselco/ion exchange system installed at Gull Industries is shown in Figure 7. It consists of electrocoagulation (two Rxs in series), de-foam tank, flow-through sludge thickener, clarifier, filter press, ion exchange system, storage tanks, and associated pumps, piping and controls. The treatment tanks (de-foam tank, flowthrough sludge thickener, clarifier) have a total liquid capacity of approximately 3,400 liters (900 gallons).
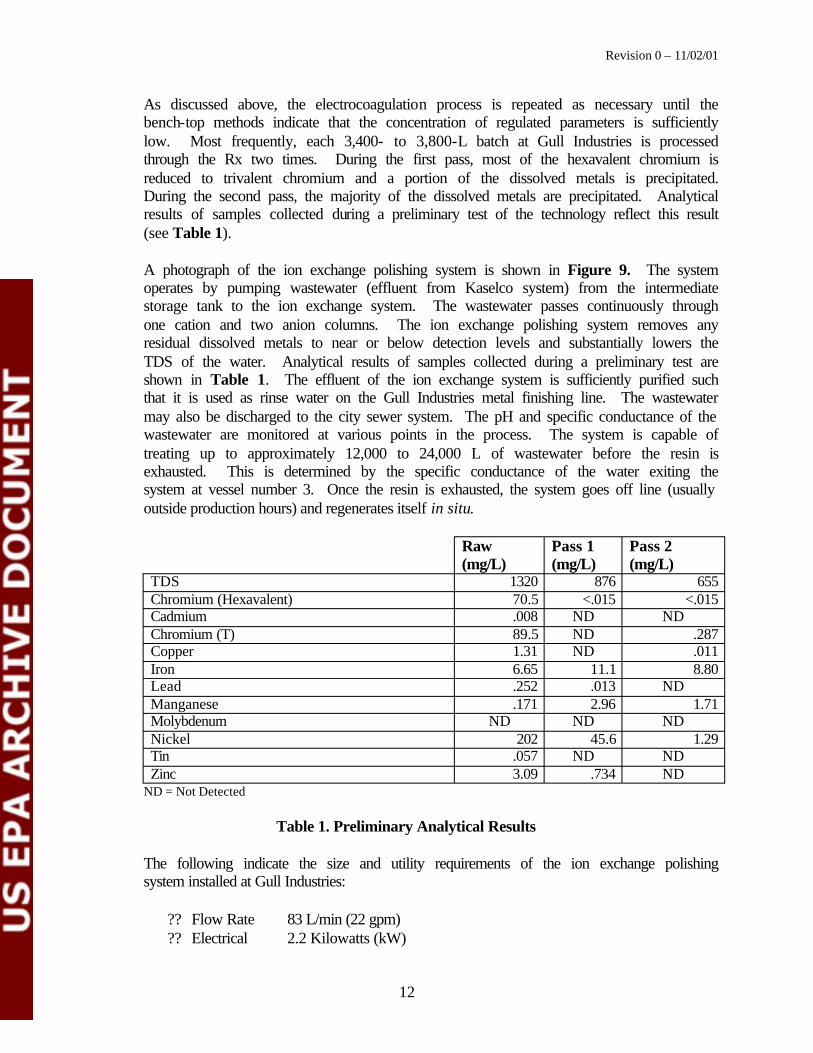
A photograph of the Kaselco system at Gull Industries is shown in Figure 8. The large plastic box on the right side of the photograph is the rectifier, and the box on the left side is the electrocoagulation unit.
Wastewater treatment is performed on a batch basis. Each batch consists of approximately 3,400 liters (900 gal.) and the processing rate is 38 L/min. One to two batches are processed each day. During treatment, wastewater is pumped from the 20,000-L equalization tank through the Rx. Wastewater exiting the Rx is diverted to one of two storage tanks (tanks 1 and 2). Once the entire batch has been processed, the wastewater in the storage tank is tested using bench-top methods2. If the wastewater is insufficiently treated, it is reprocessed through the electrocoagulation system and diverted to a different storage tank, and retested using the bench-top methods. If the wastewater is determined to be sufficiently treated, the wastewater is reprocessed through the electrocoagulation unit and the discharge is diverted to the de-foam tank. The wastewater then flows through the sludge thickener and the clarifier and is collected in the intermediate storage tank. From this point, the wastewater is processed through the ion exchange polishing system.
2 A sample of the wastewater from the storage tank is subjected to a simulated treatment process, performed in a beaker. A small amount of polymer is added to the beaker, which causes precipitated solids in the wastewater to form a dense floc and settle to the bottom of the beaker. The clarified wastewater or "supernatant" is then sampled and tested for nickel and chromium using bench-top analytical procedures.
10
Revision 0 – 11/02/01
Figure 7. Diagram of the Kaselco Installation at Gull Industries
Figure 8. Photograph of the Kaselco System Installed at Gull Industries
11
Revision 0 – 11/02/01
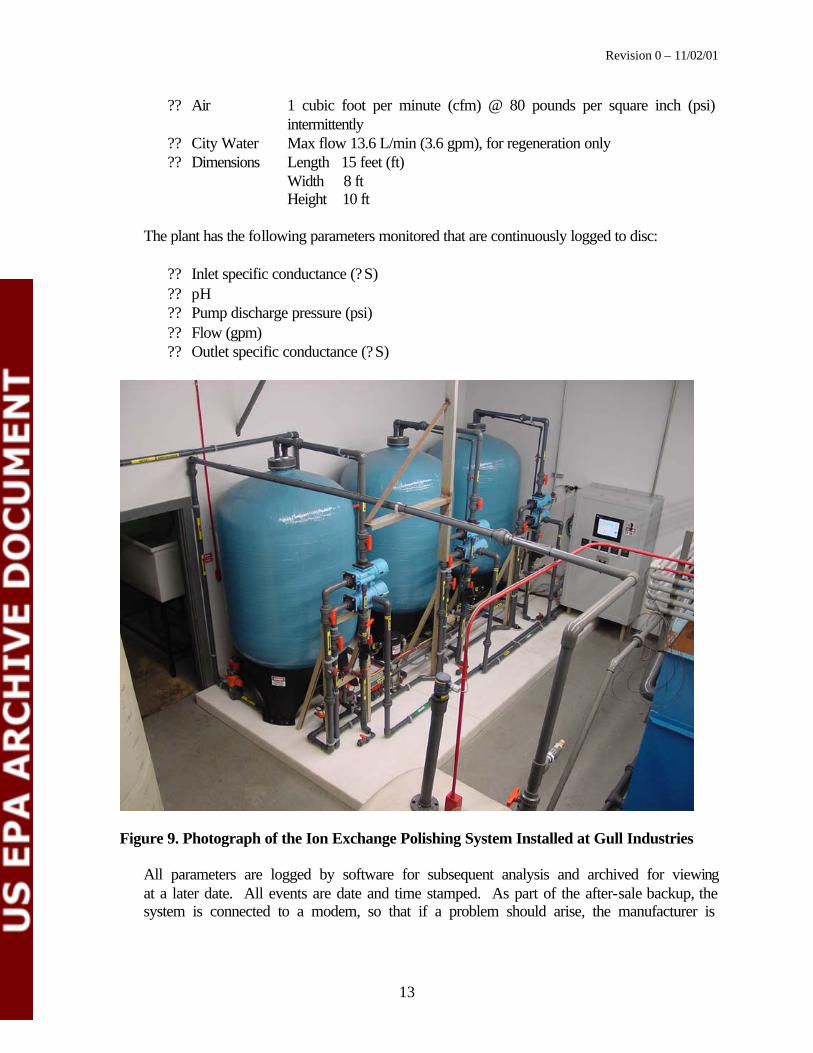
As discussed above, the electrocoagulation process is repeated as necessary until the bench-top methods indicate that the concentration of regulated parameters is sufficiently low. Most frequently, each 3,400- to 3,800-L batch at Gull Industries is processed through the Rx two times. During the first pass, most of the hexavalent chromium is reduced to trivalent chromium and a portion of the dissolved metals is precipitated. During the second pass, the majority of the dissolved metals are precipitated. Analytical results of samples collected during a preliminary test of the technology reflect this result (see Table 1).
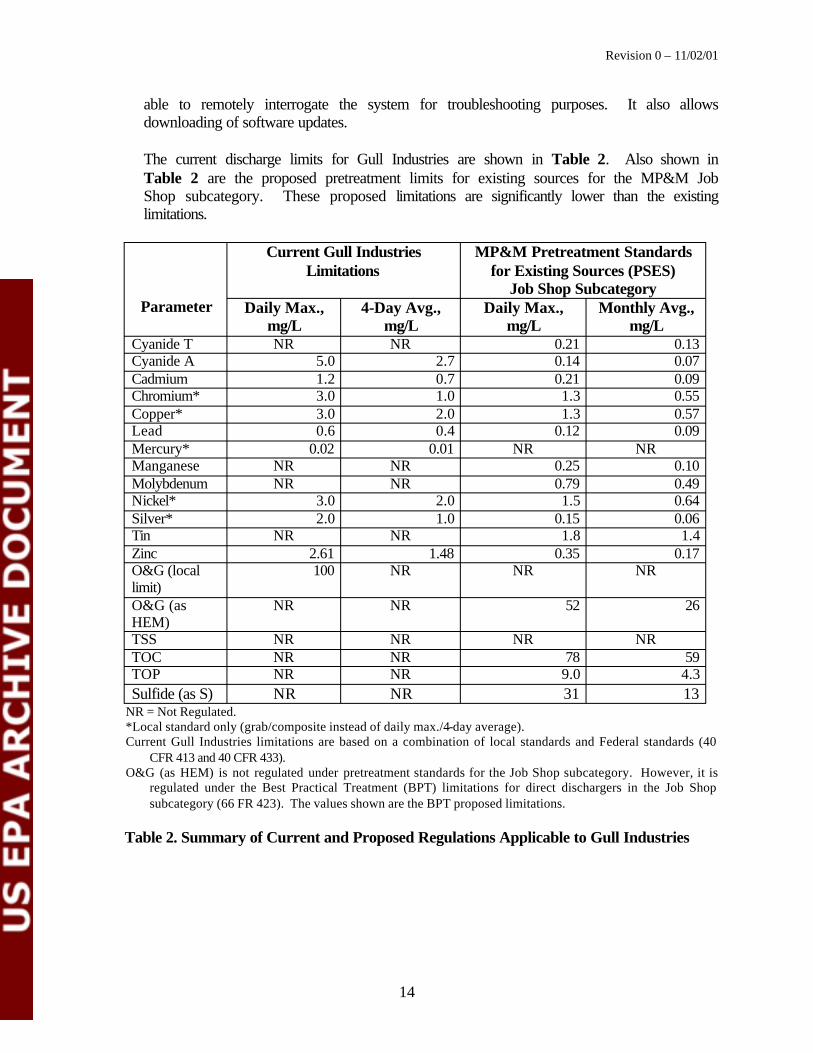
A photograph of the ion exchange polishing system is shown in Figure 9. The system operates by pumping wastewater (effluent from Kaselco system) from the intermediate storage tank to the ion exchange system. The wastewater passes continuously through one cation and two anion columns. The ion exchange polishing system removes any residual dissolved metals to near or below detection levels and substantially lowers the TDS of the water. Analytical results of samples collected during a preliminary test are shown in Table 1. The effluent of the ion exchange system is sufficiently purified such that it is used as rinse water on the Gull Industries metal finishing line. The wastewater may also be discharged to the city sewer system. The pH and specific conductance of the wastewater are monitored at various points in the process. The system is capable of treating up to approximately 12,000 to 24,000 L of wastewater before the resin is exhausted. This is determined by the specific conductance of the water exiting the system at vessel number 3. Once the resin is exhausted, the system goes off line (usually outside production hours) and regenerates itself in situ.
Raw Pass 1 Pass 2 (mg/L) (mg/L) (mg/L)
TDS 1320 876 655 Chromium (Hexavalent) 70.5 <.015 <.015 Cadmium .008 ND ND Chromium (T) 89.5 ND .287 Copper 1.31 ND .011 Iron 6.65 11.1 8.80 Lead .252 .013 ND Manganese .171 2.96 1.71 Molybdenum ND ND ND Nickel 202 45.6 1.29 Tin .057 ND ND Zinc 3.09 .734 ND
ND = Not Detected
Table 1. Preliminary Analytical Results
The following indicate the size and utility requirements of the ion exchange polishing system installed at Gull Industries:
?? Flow Rate 83 L/min (22 gpm) ?? Electrical 2.2 Kilowatts (kW)
12
Revision 0 – 11/02/01
?? Air 1 cubic foot per minute (cfm) @ 80 pounds per square inch (psi) intermittently
?? City Water Max flow 13.6 L/min (3.6 gpm), for regeneration only ?? Dimensions Length 15 feet (ft)
Width 8 ft Height 10 ft
The plant has the following parameters monitored that are continuously logged to disc:
?? Inlet specific conductance (? S)?? pH?? Pump discharge pressure (psi)?? Flow (gpm)?? Outlet specific conductance (? S)
Figure 9. Photograph of the Ion Exchange Polishing System Installed at Gull Industries
All parameters are logged by software for subsequent analysis and archived for viewing at a later date. All events are date and time stamped. As part of the after-sale backup, the system is connected to a modem, so that if a problem should arise, the manufacturer is
13
Revision 0 – 11/02/01
able to remotely interrogate the system for troubleshooting purposes. It also allows downloading of software updates.
The current discharge limits for Gull Industries are shown in Table 2. Also shown in Table 2 are the proposed pretreatment limits for existing sources for the MP&M Job Shop subcategory. These proposed limitations are significantly lower than the existing limitations.
Current Gull Industries MP&M Pretreatment Standards Limitations for Existing Sources (PSES)
Parameter Job Shop Subcategory
Daily Max., mg/L
4-Day Avg., mg/L
Daily Max., mg/L
Monthly Avg., mg/L
Cyanide T NR NR 0.21 0.13 Cyanide A 5.0 2.7 0.14 0.07 Cadmium 1.2 0.7 0.21 0.09 Chromium* 3.0 1.0 1.3 0.55 Copper* 3.0 2.0 1.3 0.57 Lead 0.6 0.4 0.12 0.09 Mercury* 0.02 0.01 NR NR Manganese NR NR 0.25 0.10 Molybdenum NR NR 0.79 0.49 Nickel* 3.0 2.0 1.5 0.64 Silver* 2.0 1.0 0.15 0.06 Tin NR NR 1.8 1.4 Zinc 2.61 1.48 0.35 0.17 O&G (local 100 NR NR NR limit) O&G (as NR NR 52 26 HEM) TSS NR NR NR NR TOC NR NR 78 59 TOP NR NR 9.0 4.3 Sulfide (as S) NR NR 31 13
NR = Not Regulated. *Local standard only (grab/composite instead of daily max./4-day average). Current Gull Industries limitations are based on a combination of local standards and Federal standards (40
CFR 413 and 40 CFR 433). O&G (as HEM) is not regulated under pretreatment standards for the Job Shop subcategory. However, it is
regulated under the Best Practical Treatment (BPT) limitations for direct dischargers in the Job Shop subcategory (66 FR 423). The values shown are the BPT proposed limitations.
Table 2. Summary of Current and Proposed Regulations Applicable to Gull Industries
14
Revision 0 – 11/02/01
Gull Industries has established water recycling specifications that must be met in order to reuse treated wastewater. These specifications are:
?? TDS of 250 mg/L?? Specific conductance: maximum of 500 ? S?? pH: within the range of 5.0 to 9.0 standard units
3.0 EXPERIMENTAL DESIGN
3.1 Test Goals and Objectives
The overall goals of this ETV-MF project are: (1) evaluate the ability of the Kaselco and ion exchange polishing systems to remove pollutants from metal finishing job shop wastewaters, with the metal finishing effluent guidelines used as target effluent concentrations, (2) determine the ability of the combined systems to recover water for reuse in the electroplating process, (3) evaluate the operating characteristics of the systems with respect to sludge and regenerant generation and operating costs, and (4) evaluate the environmental benefit by determining the reduction in metals discharged to the city sewer system.
The following is a summary of primary project objectives. For the installation at Gull Industries, verification testing is being conducted in order to:
?? Determine the ability of the Kaselco and ion exchange polishing systems to remove specific contaminants from wastestreams and meet the applicable daily maximum metal finishing limitations and Gull Industries' target specification for water reuse.
?? Determine the quantity and chemical characteristics of the sludge generated by the Kaselco treatment system.
?? Determine the cost of operating the Kaselco and ion exchange polishing systems for the specific conditions encountered during testing: 1) Determine the amount and cost of operating and maintenance (O&M) labor. 2) Determine the quantity and cost of chemical reagents used and other materials
(e.g., filters), including ion exchange regeneration. 3) Determine the quantity and cost of steel plates (anodes) consumed. 4) Determine the quantity and cost of energy consumed by operating the systems. 5) Determine the cost of sludge disposal.
?? Quantify the environmental benefit by determining the reduction in metals discharged to the sewer system beyond that required by the metal finishing standards.
3.2 Critical and Non-Critical Measurements
Measurements that will be taken during testing are classified below as either critical or non-critical. Critical measurements are those that are necessary to achieve the primary project objectives. Non-critical measurements are those related to process control or general background readings.
15
Revision 0 – 11/02/01
Critical Measurements:
?? volume of wastewater treated (L/test run) ?? quantity (kilogram (kg)/test run) and costs ($/test run) of chemical treatment reagents
and other materials used in treatment ?? mass of steel plates consumed (kg)/volume processed ?? volume of filter press sludge generated (L/test) ?? chemical characteristics of raw wastewater (specific conductance (? S)3, mg/L of total
suspended solids (TSS), O&G (as HEM), total organic carbon (TOC), cadmium, chromium (+6), chromium (T), copper, iron, lead, manganese, molybdenum, nickel, tin, sulfide (as S), zinc, and TDS)
?? chemical characteristics of treated effluent from the Kaselco system (specific conductance (? S), mg/L of TSS, O&G (as HEM), TOC, cadmium, chromium (+6), chromium (T), copper, iron, lead, manganese, molybdenum, nickel, tin, sulfide (as S), zinc, and TDS)
?? chemical characteristics of treated effluent from the ion exchange polishing system (specific conductance (? S), pH, mg/L of TSS, O&G (as HEM), TOC, cadmium, chromium (+6) chromium (T), copper, iron, lead, manganese, molybdenum, nickel, tin, sulfide (as S), zinc, and TDS)
?? chemical characteristics of filter press sludge from the Kaselco system (density, mg/L of solids, cadmium, chromium (T), copper, lead, manganese, molybdenum, nickel, tin, zinc)
?? O&M labor requirements (hours/test run) and costs ($/test run) ?? energy use (kilowatt (kWh)/test run) and costs ($/test run)of components of the
Kaselco and ion exchange polishing systems (e.g., rectifier, pumps) ?? Chemical use during ion exchange regeneration
Non-Critical Measurements:
?? Kaselco rectifier DC output (amp-hours) ?? pH of raw wastewater ?? pH of treated wastewater following treatment by the Kaselco system ?? flow, pH and specific conductance of wastewater at various internal points within the
ion exchange polishing system
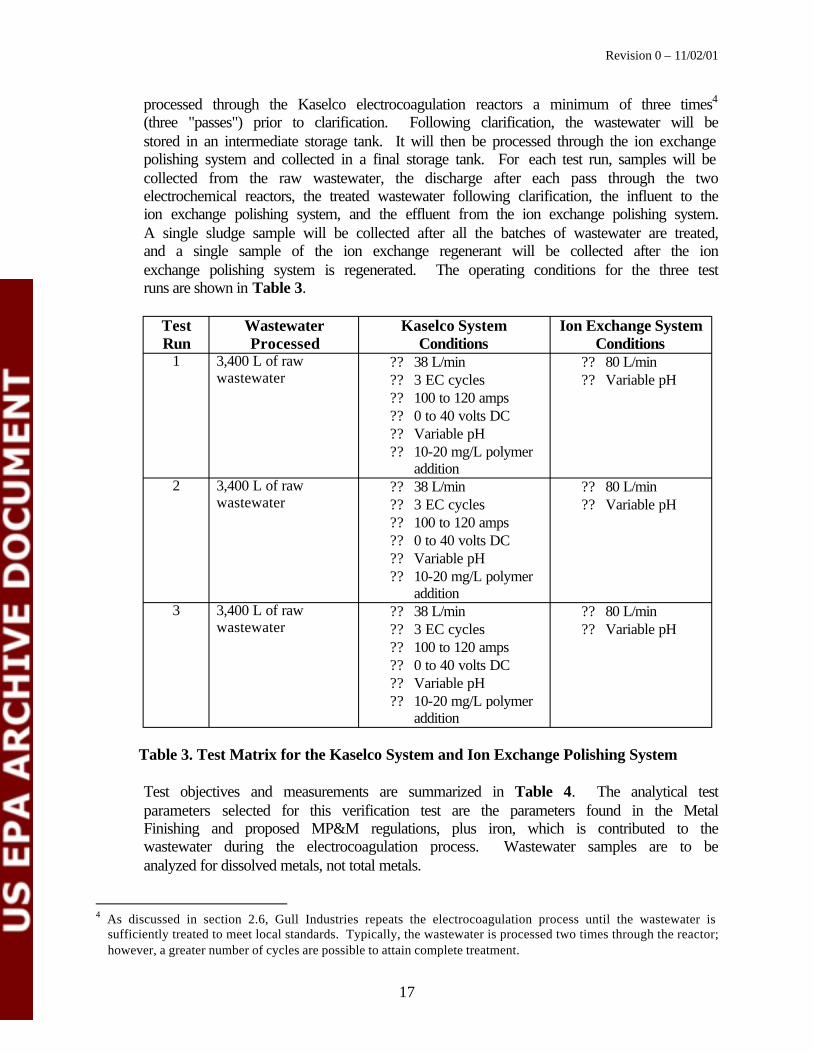
3.3 Test Matrix
The verification test will be conducted by processing 3,400-L batches of raw wastewater through the Kaselco system and subsequently through the ion exchange polishing system (each completely treated batch is referred to as a "test run"). Each batch will be
3 Specific conductance is a measure of the ability of a water solution to conduct an electrical current. It is commonly expressed in microsiemens (µs). Specific conductance is related to the type and concentration of ions in solution and can be used for approxima ting the dissolved-solids content of the water.
16
Revision 0 – 11/02/01
processed through the Kaselco electrocoagulation reactors a minimum of three times4
(three "passes") prior to clarification. Following clarification, the wastewater will be stored in an intermediate storage tank. It will then be processed through the ion exchange polishing system and collected in a final storage tank. For each test run, samples will be collected from the raw wastewater, the discharge after each pass through the two electrochemical reactors, the treated wastewater following clarification, the influent to the ion exchange polishing system, and the effluent from the ion exchange polishing system. A single sludge sample will be collected after all the batches of wastewater are treated, and a single sample of the ion exchange regenerant will be collected after the ion exchange polishing system is regenerated. The operating conditions for the three test runs are shown in Table 3.
Test Run
Wastewater Processed
Kaselco System Conditions
Ion Exchange System Conditions
1 3,400 L of raw wastewater
?? 38 L/min ?? 3 EC cycles ?? 100 to 120 amps ?? 0 to 40 volts DC ?? Variable pH ?? 10-20 mg/L polymer
addition
?? 80 L/min ?? Variable pH
2 3,400 L of raw wastewater
?? 38 L/min ?? 3 EC cycles ?? 100 to 120 amps ?? 0 to 40 volts DC ?? Variable pH ?? 10-20 mg/L polymer
addition
?? 80 L/min ?? Variable pH
3 3,400 L of raw wastewater
?? 38 L/min ?? 3 EC cycles ?? 100 to 120 amps ?? 0 to 40 volts DC ?? Variable pH ?? 10-20 mg/L polymer
addition
?? 80 L/min ?? Variable pH
Table 3. Test Matrix for the Kaselco System and Ion Exchange Polishing System
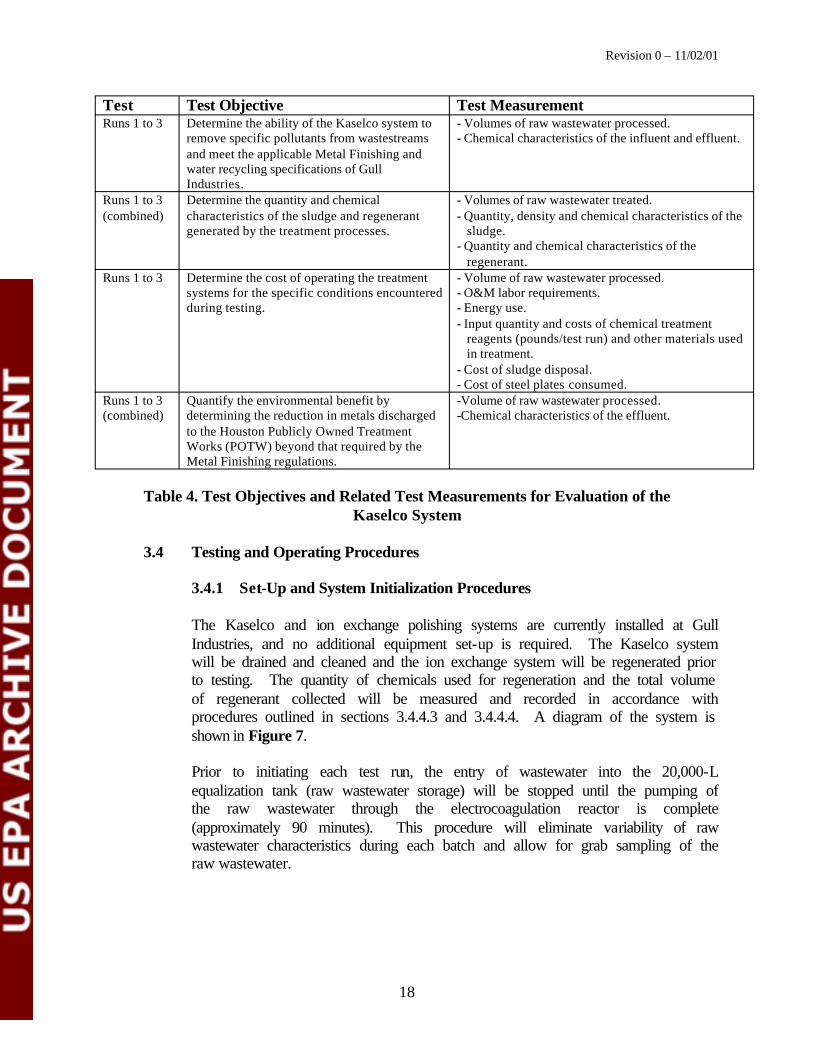
Test objectives and measurements are summarized in Table 4. The analytical test parameters selected for this verification test are the parameters found in the Metal Finishing and proposed MP&M regulations, plus iron, which is contributed to the wastewater during the electrocoagulation process. Wastewater samples are to be analyzed for dissolved metals, not total metals.
4 As discussed in section 2.6, Gull Industries repeats the electrocoagulation process until the wastewater is sufficiently treated to meet local standards. Typically, the wastewater is processed two times through the reactor; however, a greater number of cycles are possible to attain complete treatment.
17
Revision 0 – 11/02/01
Test Test Objective Test Measurement Runs 1 to 3 Determine the ability of the Kaselco system to
remove specific pollutants from wastestreams - Volumes of raw wastewater processed. - Chemical characteristics of the influent and effluent.
and meet the applicable Metal Finishing and water recycling specifications of Gull Industries.
Runs 1 to 3 Determine the quantity and chemical - Volumes of raw wastewater treated. (combined) characteristics of the sludge and regenerant
generated by the treatment processes. - Quantity, density and chemical characteristics of the
sludge. - Quantity and chemical characteristics of the
regenerant. Runs 1 to 3 Determine the cost of operating the treatment
systems for the specific conditions encountered during testing.
- Volume of raw wastewater processed. - O&M labor requirements. - Energy use. - Input quantity and costs of chemical treatment
reagents (pounds/test run) and other materials used in treatment.
- Cost of sludge disposal. - Cost of steel plates consumed.
Runs 1 to 3 (combined)
Quantify the environmental benefit by determining the reduction in metals discharged
-Volume of raw wastewater processed. -Chemical characteristics of the effluent.
to the Houston Publicly Owned Treatment Works (POTW) beyond that required by the Metal Finishing regulations.
Table 4. Test Objectives and Related Test Measurements for Evaluation of the Kaselco System
3.4 Testing and Operating Procedures
3.4.1 Set-Up and System Initialization Procedures
The Kaselco and ion exchange polishing systems are currently installed at Gull Industries, and no additional equipment set-up is required. The Kaselco system will be drained and cleaned and the ion exchange system will be regenerated prior to testing. The quantity of chemicals used for regeneration and the total volume of regenerant collected will be measured and recorded in accordance with procedures outlined in sections 3.4.4.3 and 3.4.4.4. A diagram of the system is shown in Figure 7.
Prior to initiating each test run, the entry of wastewater into the 20,000-L equalization tank (raw wastewater storage) will be stopped until the pumping of the raw wastewater through the electrocoagulation reactor is complete (approximately 90 minutes). This procedure will eliminate variability of raw wastewater characteristics during each batch and allow for grab sampling of the raw wastewater.
18
Revision 0 – 11/02/01
3.4.2 System Operation
During testing, the system will be operated by Gull Industries according to the procedures found in Appendix A. These are the standard procedures used on a daily basis at Gull Industries for conducting wastewater treatment. Representatives of Kaselco and the ion exchange system manufacturer will assist with operation of the systems. The source of raw wastewater during testing is the equalization tank that is part of the existing Gull Industries wastewater treatment system. The effluent from the ion exchange polishing system will be collected into a final storage tank and tested by Gull Industries and reused on their metal finishing lines or discharged to the city sewer system in accordance with their present discharge permit.
During verification testing, both the Kaselco system and the ion exchange system will be operated in batch modes, and only one system will be operated at a time. Initially the Kaselco system will process a batch of raw wastewater, and the treated water will be collected in the intermediate storage tank. The Kaselco system will then be idled. The ion exchange system will then be initiated; it will process the batch of wastewater in the intermediate storage tank and discharge it to the final storage tank. This cycle will be repeated three times.
As discussed in section 2.6, the treatment tanks installed at Gull Industries have a liquid capacity of approximately 3,400 L. Prior to the start of the first test run, the tanks will be drained and cleaned. The system will then process one batch (3,400 L) of wastewater using three passes through the Rx units before diverting the wastewater to the de-foam tank, thickener, and clarifier. Processing the first batch of wastewater through the Kaselco system will fill the treatment tanks (de-foam, thickener, and clarifier) with wastewater, but little or no discharge of treated wastewater to the intermediate storage tank will occur. When the second batch of wastewater is treated and passes through these tanks, this will cause an overflow of approximately 3,400 L of wastewater from the clarifier to the intermediate storage tank. In effect, the raw wastewater volume from one batch treatment is discharged to the intermediate storage tank during the treatment of the subsequent batch. Some commingling of wastewater batches will occur. However, due to the "plug-flow" design of the system, samples of the raw wastewater from one run can be accurately paired with intermediate and final discharge samples of the subsequent run to determine the approximate pollutant removal efficiency of the systems. For example, when the Run 2 influent is being processed, samples from the intermediate storage tank, ion exchange influent, and final treated wastewater will be collected and the results are paired with the Run 1 influent results.
The collection of samples from each batch treatment event and its relation to test runs is described in Table 5.
19
Revision 0 – 11/02/01
Batch
Test Run
Raw Wastewater
Sample Point 1
EC Reactor
Discharge Sample Point 2
Intermediate Treated
Wastewater Sample Point 3
Sludge Sample Point 4
Ion Exchange Inffluent. Sample Point 5
Final Treated
Wastewater Sample Point 6
Regenerant Sample Point 7
1 Run 1 R1 EC1 - - - - -2 Run
1/2 R2 EC2 I1 - IX1 F1 -
3 Run 2/3
R3 EC3 I2 - IX2 F2 -
4 Run 3 R4 - I3 S1-3 IX3 F3 REG
Table 5. Sampling Identifiers and Sequence for Batch Treatment and Test Runs
3.4.3 Sample Collection and Handling
Samples will be collected from seven sampling points. The locations of the sampling points are shown in Figure 7. Sampling procedures are described below. The contents of all tanks will be thoroughly mixed prior to sampling.
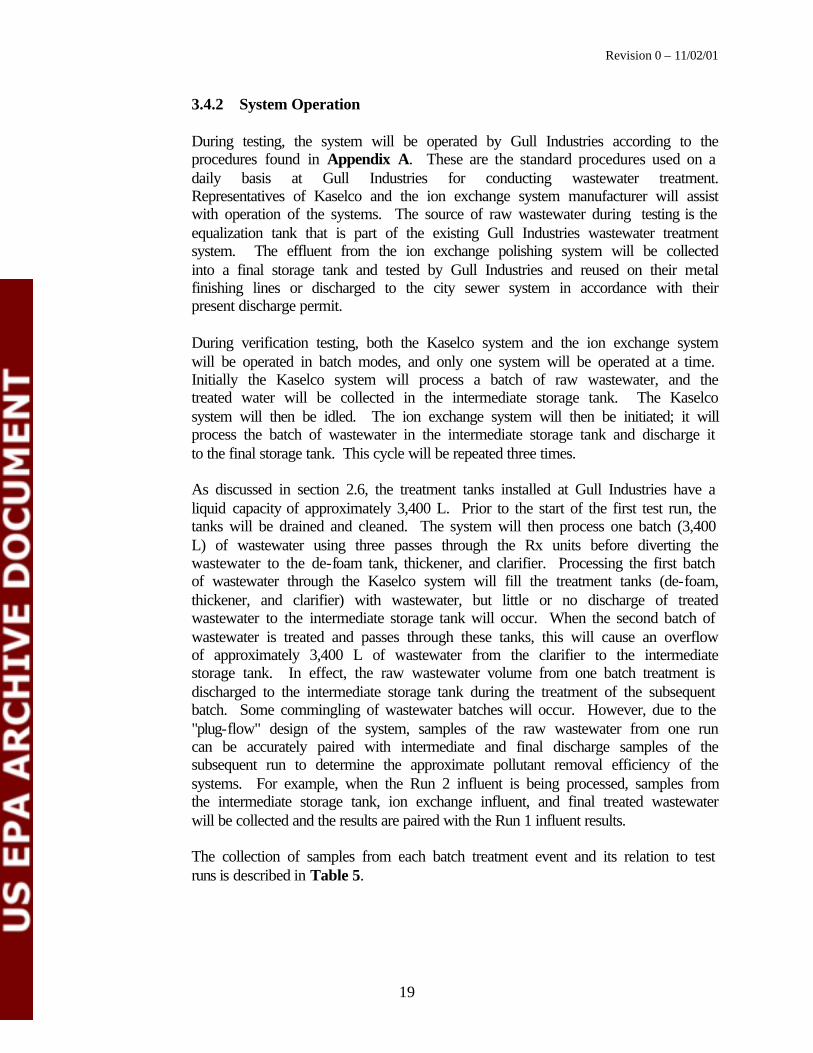
?? Raw wastewater (sample point 1). Kaselco has installed a sampling port (see Figure 10) from which the raw wastewater samples will be collected. Grab samples of the raw wastewater will be collected 30 minutes (+/- 10 minutes) after initiation of each test run and placed into the appropriate sample containers. In order to generate a treated wastewater sample for the final test run, it will be necessary to process a fourth batch of raw wastewater. A grab sample from this batch will also be collected, since some commingling of batches will occur. Although this sample will not be paired with a treated wastewater sample, the analytical results of this sample may be useful during the evaluation of data. The sampling sequence is described in Table 5.
?? Electrocoagulation reactor discharge (sample point 2). Kaselco has installed a sampling port from which the electrocoagulation Rx discharge samples will be collected. Grab samples of the discharge for hexavalent chromium and other metals analyses will be collected 30 minutes (+/- 10 minutes) after the first and second passes are initiated and placed into the appropriate sample containers. The electrocoagulation discharge contains both water and precipitated solids. These samples will be filtered at the analytical laboratory prior to preservation with acid by the analytical laboratory.
?? Intermediate treated wastewater (sample point 3). Treated wastewater is discharged from the clarifier and filter press (separate pipes) to an intermediate storage tank. This tank cannot be fully drained due to its design. Therefore, to collect a representative sample, it is necessary to intercept the incoming flow before it commingles with the water in the intermediate storage tank. To accomplish this, a five-gal container will be hung inside the storage tank, above the water level, to intercept the two discharges. The discharges will enter the container and overflow into the intermediate storage tank. Grab
20
Revision 0 – 11/02/01
samples for hexavalent chromium, other metals, pH, TDS, specific conductance, O&G, and sulfide will be collected 30-min (+/- 10 minutes) following initiation of the third pass. Samples will be collected using a glass ladle to draw treated wastewater from the five-gal container and pour it into the appropriate sample bottles.
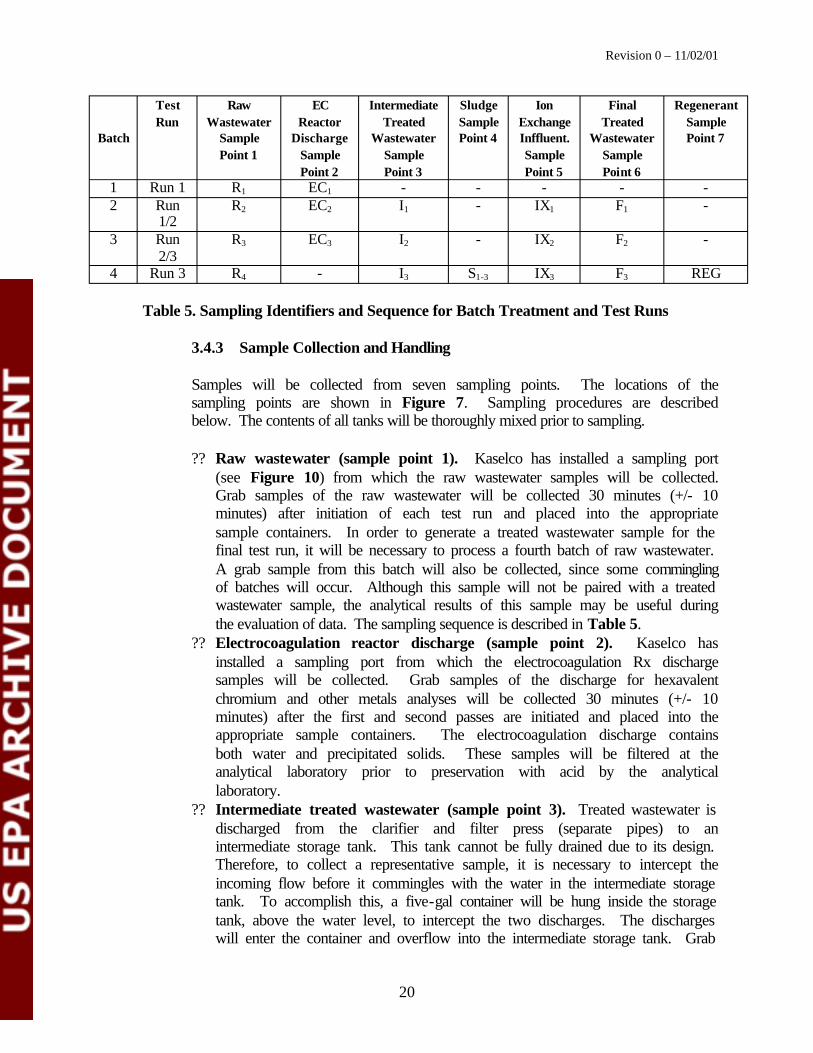
?? Wastewater treatment sludge (sample point 4). After completion of the three test runs, the filter press will be discharged to the sludge hopper. Grab samples of the sludge will be collected from the sludge hopper at five separate points (see Figure 11) using a clean spatula, after first completely mixing the material. The sludge sample will be placed into 1-L, wide mouth glass jars and mixed again.
?? Ion Exchange System Influent (sample point 5). Grab samples of influent to the ion exchange polishing system will be collected from a sampling port for hexavalent chromium, other metals, pH, TDS, and specific conductance analyses. The samples will be collected 10 minutes (+/- 5 minutes) after initiation of the ion exchange treatment cycle.
?? Final treated wastewater (sample point 6). Grab samples of treated wastewater from the ion exchange polishing system will be collected from a sampling port. Grab samples will be collected 20 minutes (+/- 5 minutes) after initiation of the ion exchange treatment process for hexavalent chromium, other metals, pH, TDS, specific conductance, O&G, and sulfide analyses.
?? Ion exchange system regenerant (sample point 7). The ion exchange polishing system is regenerated approximately every 20 days. The regenerant is collected in a storage tank. A Gull Industries employee, who will be trained by the ETV-MF Project Manager, will take grab samples of the regenerate from the storage tank for metals analyses.
Figure 10. Photograph of the Kaselco System Showing Sample Point 1
21
Revision 0 – 11/02/01
Samples will be collected according to the schedule presented in Tables 6 and 7. All sampling events will be recorded on the form shown in Appendix B.
At the time of sampling, each sample container will be labeled with the date, time, and sample identification (ID) number. Samples to be analyzed at an off-site laboratory will be accompanied by a chain of custody (COC) form. The COC form will provide the following information: project name, project address, sampler's name, sample numbers, date/time samples were collected, matrix, required analyses, and appropriate COC signatures. All samples will be transported in appropriate sample transport containers (e.g., coolers with packing and blue ice) directly to the laboratory. The transport containers will be secured with chain of custody tape to ensure sample integrity during the delivery process to the analytical laboratory. The Project Manager (or trained designee in the case of ion exchange regenerant) will perform sampling and labeling and ensure that samples are properly secured and shipped to the laboratory for analysis.
Figure 11. Photograph of the Kaselco System Showing Sample Point 4
3.4.4 Process Measurements and Information Collection
Process measurements and information collection will be conducted to provide the following data: duration of treatment, volume of wastewater processed, reagent usage, steel plate (anode) consumption, sludge quantity, electricity use,
22
Revision 0 – 11/02/01
and O&M activities. The methods that will be used for process measurements and information collection are discussed in this section.
3.4.4.1 Duration of Treatment and Wastewater Volume Processed
The duration of each treatment cycle will be measured by recording the start and stop times for both the Kaselco and ion exchange polishing systems onto the data collection form found in Appendix B. The volume of wastewater processed during each batch will be measured after the first pass using the graduated scale found on storage tanks 1 and 2.
Sample Sample Location Frequency/Type Parameters Raw wastewater Sample point 1 (sample
port) One/test pass, plus a sample from the fourth batch. Grab
TSS, TOC, cadmium, chromium (+6), chromium (T),
sample collected after 30 min. (+/- 10 min.) of initiation of test run.
copper, iron, lead, manganese, molybdenum, nickel, tin, zinc, TDS, O&G, sulfide, pH
electrocoagulation reactor discharge
Sample point 2 (sample port)
One/test pass. Grab sample collected after 30 min. (+/10 min.) of initiation of test
cadmium, chromium (+6), chromium (T), copper, iron, lead, manganese,
run. molybdenum, nickel, tin, zinc, pH
Intermediate treated wastewater
Sample point 3 (container located in
One/test pass. Grab sample collected after 30 min. (+/-
TSS, TOC, cadmium, chromium (+6), chromium (T),
mouth of intermediate storage tank)
10 min.) of initiation of test run.
copper, iron, lead, manganese, molybdenum, nickel, tin, zinc, TDS, O&G, sulfide, pH, specific conductance
Sludge Sample point 4 (sludge hopper)
One/verification test. Representative grab sample collected after completion of
% solids, density, cadmium, chromium, copper, iron, lead, manganese, molybdenum,
the test runs. nickel, tin, zinc Ion exchange system influent
Sample point 5 (sample port)
One/test run. Grab sample collected after 15 min. (+/- 5 min.) of initiation of test run.
TSS, TDS, TOC, cadmium, chromium (+6), chromium (T), copper, iron, lead, manganese, molybdenum, nickel, tin, zinc, TDS, O&G, sulfide, pH, specific conductance
Final treated Sample point 6 (sample One/test run. Gr ab sample TSS, TDS, TOC, cadmium, wastewater port) collected after 20 min. (+/- 5
min.) of initiation of test run. chromium (+6), chromium (T), copper, iron, lead, manganese, molybdenum, nickel, tin, zinc, TDS, O&G, sulfide, pH, specific conductance
Ion exchange system re generant
Sample point 7 (storage tank)
One/verification test. Representative grab sample
cadmium, chromium (+6), chromium (T), copper, iron,
collected after completion of the ion exchange system regeneration.
lead, manganese, molybdenum, nickel, tin, zinc
Table 6. Sampling Locations, Frequency, and Parameters
23
Revision 0 – 11/02/01
3.4.4.2 Polymer Usage Data
The quantity of polymer used by the Kaselco system will be measured and recorded after completion of the verification test. This will be accomplished by subtracting the quantity of polymer in the feed tank at the start and completion of the verification test (four batches). Measuring the height of the polymer in the cylindrical feed tank and calculating the volume using the formula for a right circular cylinder will determine the quantity of polymer. The depth of polymer at the start and completion of the verification test will be entered into the form in Appendix B.
3.4.4.3 Volume of Ion Exchange Regenerant
The ion exchange polishing system will be regenerated prior to the verification test in order to initialize the system and to determine the volume of regenerant produced. During regeneration, the columns are flushed with hydrochloric acid (cation column), sodium hydroxide (anion columns), and water. These solutions are combined into a single storage tank. The storage tank will be emptied prior to testing. The depth of regenerant at the completion of the ion exchange cycle will be entered into the form in Appendix B. The volume of wastewater processed during each batch will be measured after the first pass using the graduated scale found on storage tank 3.
3.4.4.4 Ion Exchange System Regeneration Chemical Use
The quantity of hydrochloric acid and sodium hydroxide used by the ion exchange polishing system for regeneration will be determined after completion of the system regeneration described in section 3.4.4.3. This will be accomplished by subtracting the quantity of hydrochloric acid and sodium hydroxide in their respective feed tanks at the start and completion of the ion exchange cycle. Measuring the height of the hydrochloric acid and sodium hydroxide in the cylindrical feed tanks and the circumferences of the tanks and calculating the volume using the formula for a right circular cylinder will determine the quantity of hydrochloric acid and sodium hydroxide. The depths of hydrochloric acid and sodium hydroxide at the start and completion of the ion exchange cycle will be entered into the form in Appendix B.
3.4.4.5 pH
The pH provides a general indication of the acidity or alkalinity of a wastewater. It is also a regulated parameter for most dischargers. The pH of the influent and effluent samples will be determined by using a digital meter (electrometric). The digital meter will be calibrated using pH 4 and 10 buffers, and the calibration verified with a pH 7 buffer. The ETV-MF
24
Revision 0 – 11/02/01
Project Manager will record the manufacturer, lot number and the expiration date of the buffer in the field notebook.
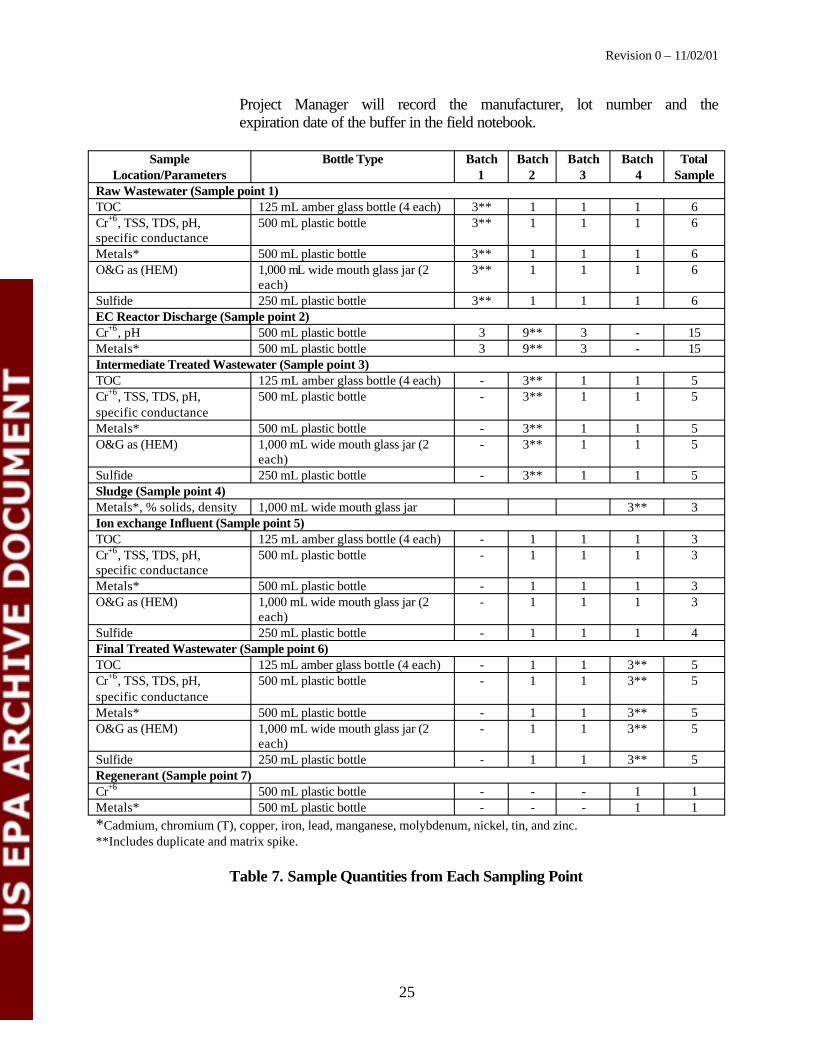
Sample Location/Parameters
Bottle Type Batch 1
Batch 2
Batch 3
Batch 4
Total Sample
Raw Wastewater (Sample point 1) TOC 125 mL amber glass bottle (4 each) 3** 1 1 1 6 Cr+6 , TSS, TDS, pH, specific conductance
500 mL plastic bottle 3** 1 1 1 6
Metals* 500 mL plastic bottle 3** 1 1 1 6 O&G as (HEM) 1,000 mL wide mouth glass jar (2
each) 3** 1 1 1 6
Sulfide 250 mL plastic bottle 3** 1 1 1 6 EC Reactor Discharge (Sample point 2) Cr+6 , pH 500 mL plastic bottle 3 9** 3 - 15 Metals* 500 mL plastic bottle 3 9** 3 - 15 Intermediate Treated Wastewater (Sample point 3) TOC 125 mL amber glass bottle (4 each) - 3** 1 1 5 Cr+6 , TSS, TDS, pH, specific conductance
500 mL plastic bottle - 3** 1 1 5
Metals* 500 mL plastic bottle - 3** 1 1 5 O&G as (HEM) 1,000 mL wide mouth glass jar (2
each) - 3** 1 1 5
Sulfide 250 mL plastic bottle - 3** 1 1 5 Sludge (Sample point 4) Metals*, % solids, density 1,000 mL wide mouth glass jar 3** 3 Ion exchange Influent (Sample point 5) TOC 125 mL amber glass bottle (4 each) - 1 1 1 3 Cr+6 , TSS, TDS, pH, specific conductance
500 mL plastic bottle - 1 1 1 3
Metals* 500 mL plastic bottle - 1 1 1 3 O&G as (HEM) 1,000 mL wide mouth glass jar (2
each) - 1 1 1 3
Sulfide 250 mL plastic bottle - 1 1 1 4 Final Treated Wastewater (Sample point 6) TOC 125 mL amber glass bottle (4 each) - 1 1 3** 5 Cr+6 , TSS, TDS, pH, specific conductance
500 mL plastic bottle - 1 1 3** 5
Metals* 500 mL plastic bottle - 1 1 3** 5 O&G as (HEM) 1,000 mL wide mouth glass jar (2
each) - 1 1 3** 5
Sulfide 250 mL plastic bottle - 1 1 3** 5 Regenerant (Sample point 7) Cr+6 500 mL plastic bottle - - - 1 1 Metals* 500 mL plastic bottle - - - 1 1 *Cadmium, chromium (T), copper, iron, lead, manganese, molybdenum, nickel, tin, and zinc. **Includes duplicate and matrix spike.
Table 7. Sample Quantities from Each Sampling Point
25
Revision 0 – 11/02/01
3.4.4.5 Quantity of Sludge
The quantity of sludge generated will be measured at the end of the verification test. This will be accomplished by transferring the sludge that is discharged from the filter press into an empty drum, measuring the height of the sludge and the circumference of the drum and calculating the sludge volume using the formula for a right circular cylinder. The height of sludge in the drum will be recorded on the form found in Appendix B. The analytical laboratory will determine the density of the sludge, and the mass of sludge will be calculated by multiplying the sludge volume by its density.
3.4.4.6 Electricity Use Data
Electricity use will be calculated by determining the input power requirements of pumps, the rectifier, and other powdered devices associated with the Kaselco system and ion exchange polishing system.
3.4.4.7 System Operation and Maintenance Data
System operation and maintenance activities will be observed during each test run. Any non-routine operational or maintenance procedures performed will be documented. This includes changes to the flow rate or chemical feed rate, filter replacement, and similar activities. Labor requirements (hrs.) will also be recorded. The team leader will record notes pertaining to these activities on the data form in Appendix B.
3.4.4.8 Cost Data
Gull Industries will provide the cost data for electricity, labor, chemical reagents, and sludge disposal. Gull Industries will also provide one month of historical data for chemical reagent use and volumes of wastewater treated.
3.4.4.9 Steel Plate Consumption
Steel plate consumption is relatively slow and cannot be accurately measured during the short duration of the verification test. Therefore, six months of historical data will be collected from Gull Industries regarding steel plate consumption.
3.4.4.10 Ion Exchange System Operational Data
Data from the internal logging system of the ion exchange unit will be used to provide operational data (non-critical). The system has the following parameters monitored and continuously logged to disc:
26
Revision 0 – 11/02/01
?? Inlet specific conductance (? S)?? pH?? Pump discharge pressure (psi)?? Flow (gpm)?? Outlet specific conductance (? S)
All parameters are logged by RS View Trend software for subsequent analysis and archived for viewing at a later date. All events are date and time stamped. Gull Industries will provide these data to the ETV Project Manager at the completion of the test in a spreadsheet format.
3.5 Analytical Procedures
All analytical procedures that will be used during this verification test are EPA methods or other recognized methods. A summary of analytical tests is presented in Table 8.
Parameter Test Method Preservation/Handling Hold Time Metals EPA 200.7 Cool storage 6 months (dissolved) (<4?C)
pH<2 w/HNO3
Metals SW-846 cool storage (<4oC) 6 months (sludge) 3050B/6010B Chromium SW-846 cool storage (<4oC) 24 hours (hexavalent) 7196A O&G (as HEM) EPA Method 1664 cool storage (<4oC) 28 days
pH<2 w/HNO3 pH digital meter N/A analyze
immediately sulfide (S) EPA Method 376.2 cool storage (<4oC) 7 days
zinc acetate + NaOH to pH >12
TDS EPA Method 160.1 cool storage (<4oC) 7 days TOC EPA Method 415.1 cool storage (<4oC) 28 days
acidify to pH <2 w/HNO3 TSS EPA Method 160.2 cool storage (<4oC) 7 days specific conductance
EPA Method 120.1 cool storage (<4?C) 28 days
sludge % water Karl-Fisher cool storage (<4oC) 28 days sludge % density SM2710F cool storage (<4oC) 28 days
Table 8. Summary of Analytical Tests and Requirements
27
Revision 0 – 11/02/01
4.0 QUALITY ASSURANCE/QUALITY CONTROL REQUIREMENTS
Quality Assurance/Quality Control activities will be performed according to the applicable section of the Environmental Technology Verification Program Metal Finishing Technologies Quality Management Plan (ETV-MF QMP) [Ref. 4].
4.1 Quality Assurance Objectives
The first QA objective is to ensure that the process operating conditions and test methods are maintained and documented throughout each test and laboratory analysis of samples. The second QA objective is to use standard test methods (where possible) for laboratory analyses. The test methods to be used are listed in Table 8.
4.2 Data Reduction, Validation, and Reporting
4.2.1 Internal Quality Control Checks
Raw Data Handling. Raw data are generated and collected by laboratory analysts at the bench and/or sampling site. These include original observations, printouts, and readouts from equipment for sample, standard, and reference QC analyses. Data are collected both manually and electronically. At a minimum, the date, time, sample ID, raw signal or processed signal, and/or qualitative observations will be recorded. Comments to document unusual or non-standard observations also will be included on the forms, as necessary. The form presented in Appendix B will be used for recording data on-site.
The on-site Project Team member will generate COC forms, and these forms will accompany samples when they are shipped off-site.
Raw data will be processed manually by the analyst, automatically by an electronic program, or electronically after being entered into a computer. The analyst will be responsible for scrutinizing the data according to laboratory precision, accuracy, and completeness policies. Raw data bench sheets and calculation or data summary sheets will be kept together for each sample batch. From the standard operating procedure and the raw data bench files, the steps leading to a final result may be traced. The ETV-MF Project Manager will maintain process-operating data for use in verification report preparation.
Data Package Validation. The generating analyst will assemble a preliminary data package, which shall be initialed and dated. This package shall contain all QC and raw data results, calculations, electronic printouts, conclusions, and laboratory sample tracking information.
A second analyst will review the entire package and check sample and storage logs, standard logs, calibration logs, and other files, as necessary, to ensure that all-tracking, sample treatments, and calculations are correct. After the package is
28
Revision 0 – 11/02/01
reviewed in this manner, a preliminary data report will be prepared, initialed, and dated. The entire package and final report will be submitted to the Laboratory Manager (LM).
The LM shall be ultimately responsible for all final data released from the laboratory. The LM or designee will review the final results for adequacy to task QA objectives. If the manager or designee suspects an anomaly or nonconcurrence with expected or historical performance values, or with task objectives for test specimen performance, the raw data will be reviewed, and the generating and reviewing analysts queried. If suspicion about data validity still exists after internal review of laboratory records, the manager will authorize a retest. If sufficient sample is not available for re-testing, a re-sampling shall occur. If the sampling window has passed, or re-sampling is not possible, the manager will flag the data as suspect. The LM signs and dates the final data package.
Data Reporting. A report signed and dated by the LM will be submitted to the ETV-MF Project Manager. The ETV-MF Project Manager will decide the appropriateness of the data for the particular application. The final report contains the laboratory sample ID, date reported, date analyzed, the analyst, the standard operating procedure (SOP) used for each parameter, the process or sampling point identification, the final result, units, and all QC data generated. The CTC ETV-MF Program Manager shall retain the data packages as required by the ETV-MF QMP [Ref. 4].
4.2.2 Calculation of Data Quality Indicators
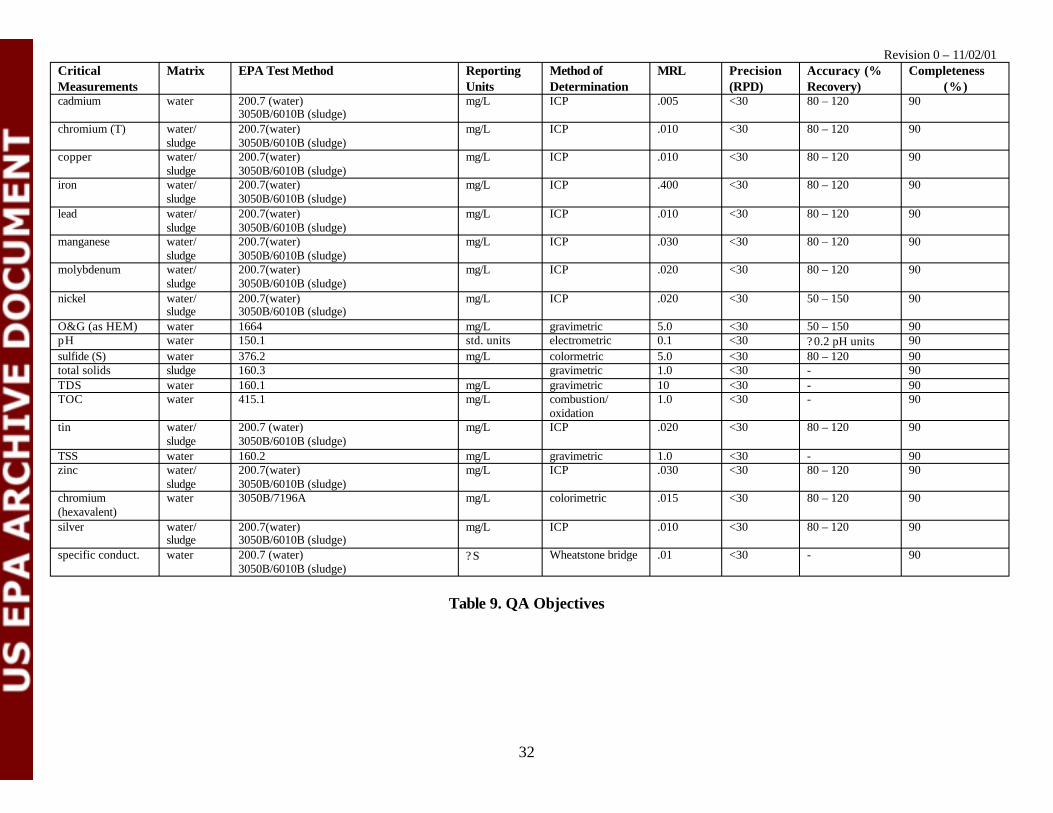
Analytical performance requirements are expressed in terms of precision, accuracy, representativeness, comparability, completeness, and sensitivity (PARCCS). Summarized below are definitions and QA objectives for each PARCCS parameter.
One sample from each sampling point shall be submitted with a field duplicate. All analytes from this sample will have matrix spike and matrix spike duplicate analyses performed.
4.2.2.1 Precision
Precision is a measure of the agreement or repeatability of a set of replicate results obtained from duplicate analyses made under identical conditions. Precision is estimated from analytical data and cannot be measured directly. The precision of a duplicate determination can be expressed as the relative percent difference (RPD), and calculated as:
29
Revision 0 – 11/02/01
?? ???
???
X ?X1 2RPD = {(|X1 – X2|)/(X1 + X2)/2} x 100% = x 100 % X1? ?? X2?
?? 2???
where: X1 = larger of the two observed values X2 = smaller of the two observed values
Multiple determinations will be performed for each test on the same test specimen. The replicate analyses must agree within the relative percent deviation limits provided in Table 8.
4.2.2.2 Accuracy
Accuracy is a measure of the agreement between an experimental determination and the true value of the parameter being measured. Accuracy is estimated through the use of known reference materials or matrix spikes. It is calculated from analytical data and is not measured directly. Spiking of reference materials into a sample matrix is the preferred technique because it provides a measure of the matrix effects on analytical accuracy. Accuracy, defined as percent recovery (P), is calculated as:
?? ?SSR - SR?P = x 100 %?
?????SA
where: SSR = spiked sample result
SR = sample result (native) SA = the concentration added to the spiked sample
Analyses will be performed with periodic calibration checks with traceable standards to verify instrumental accuracy. These checks will be performed according to established procedures in the contracted laboratory(s) that have been acquired for this verification test. Analysis with spiked samples will be performed to determine percent recoveries as a means of checking method accuracy. QA objectives will be satisfied if the average recovery is within the goals described in Table 9.
4.2.2.3 Completeness
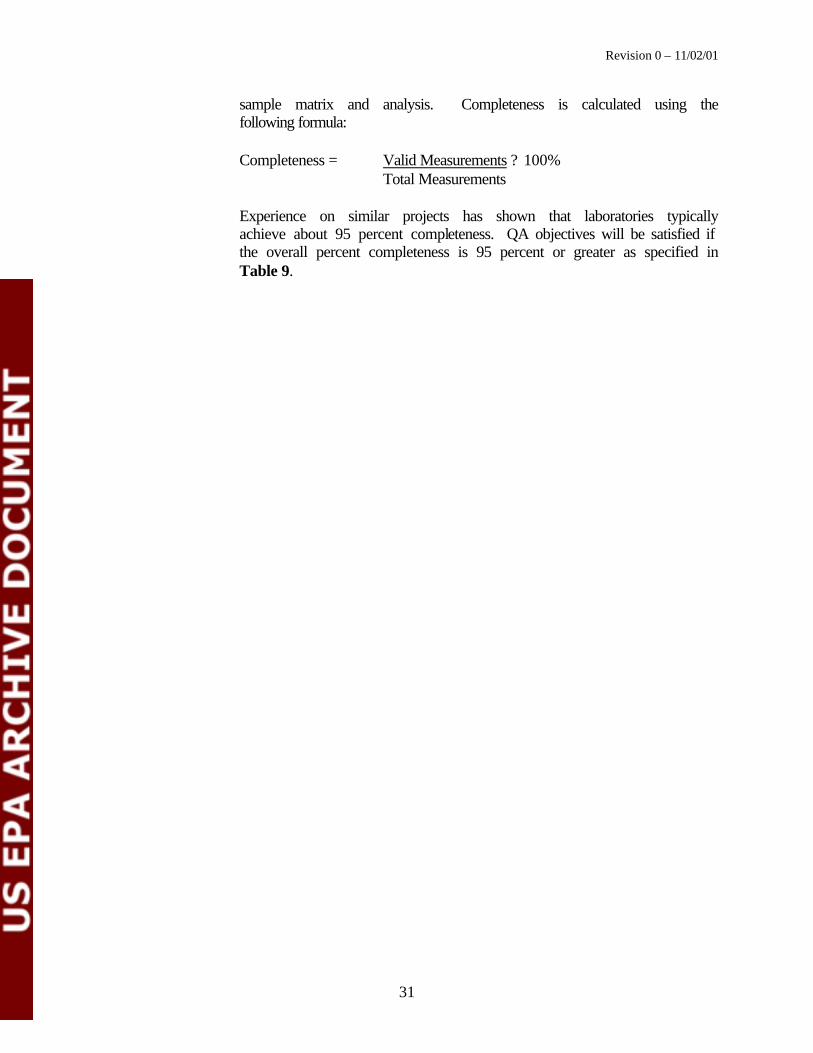
Completeness is defined as the percentage of measurements judged to be valid compared to the total number of measurements made for a specific
30
Revision 0 – 11/02/01
sample matrix and analysis. Completeness is calculated using the following formula:
Completeness = Valid Measurements ? 100% Total Measurements
Experience on similar projects has shown that laboratories typically achieve about 95 percent completeness. QA objectives will be satisfied if the overall percent completeness is 95 percent or greater as specified in Table 9.
31
Revision 0 – 11/02/01 Critical Measurements
Matrix EPA Test Method Reporting Units
Method of Determination
MRL Precision (RPD)
Accuracy (% Recovery)
Completeness (%)
cadmium water 200.7 (water) 3050B/6010B (sludge)
mg/L ICP .005 <30 80 – 120 90
chromium (T) water/ sludge
200.7(water) 3050B/6010B (sludge)
mg/L ICP .010 <30 80 – 120 90
copper water/ sludge
200.7(water) 3050B/6010B (sludge)
mg/L ICP .010 <30 80 – 120 90
iron water/ sludge
200.7(water) 3050B/6010B (sludge)
mg/L ICP .400 <30 80 – 120 90
lead water/ sludge
200.7(water) 3050B/6010B (sludge)
mg/L ICP .010 <30 80 – 120 90
manganese water/ sludge
200.7(water) 3050B/6010B (sludge)
mg/L ICP .030 <30 80 – 120 90
molybdenum water/ sludge
200.7(water) 3050B/6010B (sludge)
mg/L ICP .020 <30 80 – 120 90
nickel water/ sludge
200.7(water) 3050B/6010B (sludge)
mg/L ICP .020 <30 50 – 150 90
O&G (as HEM) water 1664 mg/L gravimetric 5.0 <30 50 – 150 90 pH water 150.1 std. units electrometric 0.1 <30 ? 0.2 pH units 90 sulfide (S) water 376.2 mg/L colormetric 5.0 <30 80 – 120 90 total solids sludge 160.3 gravimetric 1.0 <30 - 90 TDS water 160.1 mg/L gravimetric 10 <30 - 90 TOC water 415.1 mg/L combustion/
oxidation 1.0 <30 - 90
tin water/ sludge
200.7 (water) 3050B/6010B (sludge)
mg/L ICP .020 <30 80 – 120 90
TSS water 160.2 mg/L gravimetric 1.0 <30 - 90 zinc water/
sludge 200.7(water) 3050B/6010B (sludge)
mg/L ICP .030 <30 80 – 120 90
chromium (hexavalent)
water 3050B/7196A mg/L colorimetric .015 <30 80 – 120 90
silver water/ sludge
200.7(water) 3050B/6010B (sludge)
mg/L ICP .010 <30 80 – 120 90
specific conduct. water 200.7 (water) 3050B/6010B (sludge)
? S Wheatstone bridge .01 <30 - 90
Table 9. QA Objectives
32
Revision 0 – 11/02/01
4.2.2.4 Comparability
Comparability is another qualitative measure designed to express the confidence with which one data set may be compared to another. Sample collection and handling techniques, sample matrix type, and analytical method all affect comparability. Comparability is limited by the other PARCCS parameters because data sets can be compared with confidence only when precision and accuracy are known. Comparability will be achieved in this technology verification by the use of consistent methods during sampling and analysis and by traceability of standards to a reliable source.
4.2.2.5 Representativeness
Representativeness refers to the degree to which the data obtained from the sample accurately and precisely represent the conditions or characteristics of the population as a whole. For the purposes of this demonstration, representativeness will be achieved by presenting identical analyte samples to the specified lab(s) and executing consistent sample collection and mixing procedures. Three identical samples (one each of influent, effluent, and sludge) will be collected during the course of the verification test. Representativeness will be satisfied if the analytical results for each parameter are within 30 percent of the results for the associated duplicate sample.
4.2.2.6 Sensitivity
Sensitivity is the measure of the concentration at which an analytical method can positively identify and report analytical results. The sensitivity of a given method is commonly referred to as the detection limit. Although there is no single definition of this term, the following terms and definition of detection will be used for this program.
Instrument Detection Limit (IDL) is the minimum concentration that can be measured from instrument background noise.
Method Detection Limit (MDL) is a statistically determined concentration. It is the minimum concentration of an analyte that can be measured and reported with 99 percent confidence that the analyte concentration is greater than zero as determined in the same or a similar matrix. (Because of the lack of information on analytical precision at this level, sample results greater than the MDL but less than the practical quantification limit (PQL) will be laboratory qualified as “estimated.”)
33
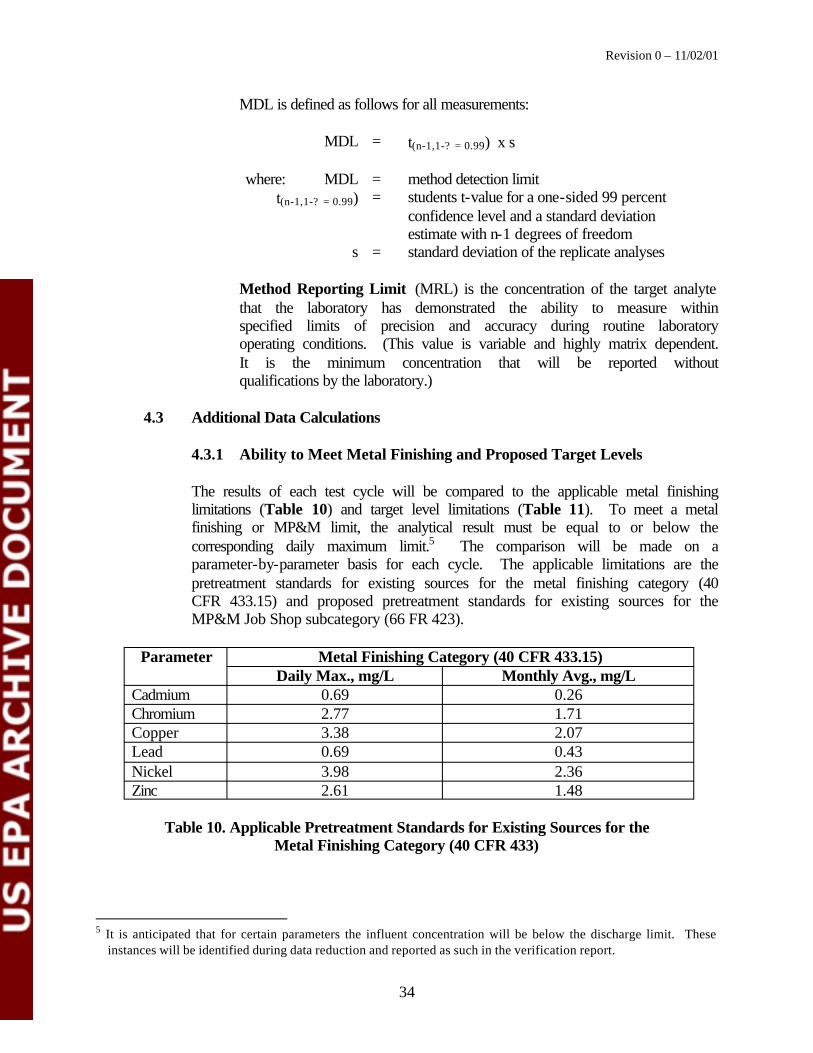
Revision 0 – 11/02/01
MDL is defined as follows for all measurements:
MDL = t(n-1,1-? = 0.99) x s
where: MDL = method detection limit t(n-1,1-? = 0.99) = students t-value for a one-sided 99 percent
confidence level and a standard deviation estimate with n-1 degrees of freedom
s = standard deviation of the replicate analyses
Method Reporting Limit (MRL) is the concentration of the target analyte that the laboratory has demonstrated the ability to measure within specified limits of precision and accuracy during routine laboratory operating conditions. (This value is variable and highly matrix dependent. It is the minimum concentration that will be reported without qualifications by the laboratory.)
4.3 Additional Data Calculations
4.3.1 Ability to Meet Metal Finishing and Proposed Target Levels
The results of each test cycle will be compared to the applicable metal finishing limitations (Table 10) and target level limitations (Table 11). To meet a metal finishing or MP&M limit, the analytical result must be equal to or below the corresponding daily maximum limit.5 The comparison will be made on a parameter-by-parameter basis for each cycle. The applicable limitations are the pretreatment standards for existing sources for the metal finishing category (40 CFR 433.15) and proposed pretreatment standards for existing sources for the MP&M Job Shop subcategory (66 FR 423).
Parameter Metal Finishing Category (40 CFR 433.15) Daily Max., mg/L Monthly Avg., mg/L
Cadmium 0.69 0.26 Chromium 2.77 1.71 Copper 3.38 2.07 Lead 0.69 0.43 Nickel 3.98 2.36 Zinc 2.61 1.48
Table 10. Applicable Pretreatment Standards for Existing Sources for the Metal Finishing Category (40 CFR 433)
5 It is anticipated that for certain parameters the influent concentration will be below the discharge limit. These instances will be identified during data reduction and reported as such in the verification report.
34
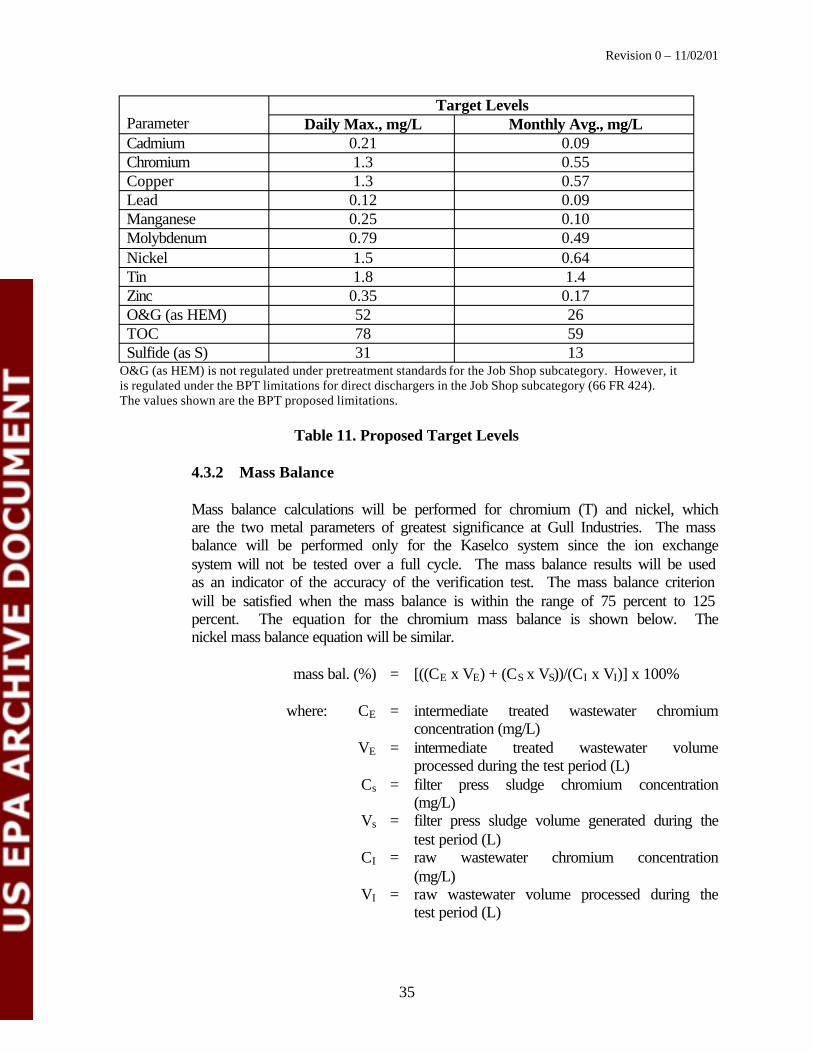
Revision 0 – 11/02/01
Parameter Target Levels
Daily Max., mg/L Monthly Avg., mg/L Cadmium 0.21 0.09 Chromium 1.3 0.55 Copper 1.3 0.57 Lead 0.12 0.09 Manganese 0.25 0.10 Molybdenum 0.79 0.49 Nickel 1.5 0.64 Tin 1.8 1.4 Zinc 0.35 0.17 O&G (as HEM) 52 26 TOC 78 59 Sulfide (as S) 31 13
O&G (as HEM) is not regulated under pretreatment standards for the Job Shop subcategory. However, it is regulated under the BPT limitations for direct dischargers in the Job Shop subcategory (66 FR 424). The values shown are the BPT proposed limitations.
Table 11. Proposed Target Levels
4.3.2 Mass Balance
Mass balance calculations will be performed for chromium (T) and nickel, which are the two metal parameters of greatest significance at Gull Industries. The mass balance will be performed only for the Kaselco system since the ion exchange system will not be tested over a full cycle. The mass balance results will be used as an indicator of the accuracy of the verification test. The mass balance criterion will be satisfied when the mass balance is within the range of 75 percent to 125 percent. The equation for the chromium mass balance is shown below. The nickel mass balance equation will be similar.
mass bal. (%) = [((CE x VE) + (CS x VS))/(CI x VI)] x 100%
where: CE = intermediate treated wastewater chromium concentration (mg/L)
VE = intermediate treated wastewater volume processed during the test period (L)
Cs = filter press sludge chromium concentration (mg/L)
Vs = filter press sludge volume generated during the test period (L)
CI = raw wastewater chromium concentration (mg/L)
VI = raw wastewater volume processed during the test period (L)
35
Revision 0 – 11/02/01
4.3.3 Pollutant Removal Efficiency
The pollutant removal efficiency is calculated based on a comparison of raw wastewater and treated wastewater concentrations for each pollutant parameter and each test run. The equation for zinc removal is shown below. The removal efficiency rate for each pollutant parameter will be separately calculated. These include: O&G (as HEM), TOC, cadmium, hexavalent chromium, chromium (T), copper, lead, manganese, molybdenum, nickel, sulfide (as S), tin, and zinc.
Zremove (%) = [((ZI x VI) – (ZE x VE)) / (ZI x VI)] x 100%
where: Zremove = zinc removal efficiency
ZI = raw wastewater zinc concentration (mg/L) VI = raw wastewater volume processed during the
test cycle (L) ZE = treated wastewater zinc concentration (mg/L) VE = treated wastewater volume processed during
the test cycle (L)
As a result of its design, the Kaselco system retains a volume of wastewater in the treatment system tanks approximately equal to the volume of one batch. The tanks operate as a plug-flow reactor; as a batch of wastewater is processed through the tanks, the existing wastewater in the tanks is pushed through the system and is discharged to the final storage tank. To account for this design, the treated wastewater samples (E) will be paired with the raw wastewater samples (R) from the previous batch as described in Table 4.
4.3.4 Reusability of Treated Wastewater
The reusability of the treated wastewater as process water will be determined by comparing the results of the pH and specific conductance analytical tests of the final treated water to standards used by Gull Industries for water reuse. Treated water meeting both of these standards will be deemed reusable. The Gull Industries standards are:
?? Specific conductance: maximum of 500 ? S ?? pH: within the range of 5.0 to 9.0 standard units ?? TDS: maximum of 250 mg/L
4.3.5 Energy Use
Energy requirements for the Kaselco and ion exchange polishing systems will be calculated by summing the total quantity of horsepower (hp) hours for each system and dividing by 1.341 HP-hr/kWh to arrive at electricity needs. The energy requirements will be calculated separately for each system.
36
Revision 0 – 11/02/01
4.3.6 Cost Analysis
This analysis will determine the operating cost of the Kaselco and ion exchange polishing systems considering the following cost parameters: chemical reagents, steel plates, other materials (e.g., filters), electricity, labor, and sludge management. Costs will be calculated and expressed in dollars per thousand liters processed ($/1000 L) by dividing the cost by the total volume of wastewater processed during the verification test. Total costs will be calculated separately for each system by summing the individual cost elements. The calculation of treatment cost for either system is shown below.
Ctreat cost = (R + A + M + E + L + S)/V
where: Ctreat cost = cost of treatment ($/1000 L) R = cost of chemical reagents used ($/1000 L) A = cost of steel plates consumed ($/1000 L) M = cost of materials used ($/1000 L) E = cost of electricity used ($/1000 L) L = cost of labor ($/1000 L) S = cost of sludge management ($/1000 L) V = volume of wastewater processed during the
verification test (1000 L)
4.3.7 Sludge Generation Analysis
The quantity of sludge generated will be measured at the end of the verification test as described in section 3.4.4.5. The quantity will be expressed as volume of sludge generated (wet basis) and weight of sludge generated (wet and dry basis). The weight of the sludge on a dry-weight basis will be calculated as follows:
Sdry = (Swet x % solids) x / 100%
where: Sdry = dry weight of sludge Swet = wet weight of sludge as measured during
verification test % solids = percent solids from lab analysis of sludge
4.3.8 Environmental Benefit
This analysis will quantify the environmental benefit of the Kaselco/ion exchange polishing technologies installed at Gull Industries by determining the quantity of regulated pollutants removed beyond the level required by the metal finishing regulations (40 CFR 433).
37
Revision 0 – 11/02/01
PB = PV – PH
where: PB = the quantity of regulated pollutants removed beyond the level required (gram (g)/1000 L)
PV = sum of allowable pollutant discharged (g/1000 L) (calculated by multiplying the daily maximum limit times the volume of wastewater processed and summing over all regulated parameters)
PH = sum of actual pollutant mass discharged during verification test (g/1000 L) (calculated by multiplying the average final concentration for the three test runs times the volume of wastewater processed and summing over all regulated parameters.)
4.4 Test Plan Modifications
In the course of verification testing, it may become necessary to modify the test plan due to unforeseen events. These modifications will be documented using a Test Plan Modification Request (Appendix C) that must be submitted to the CTC Project Manager for approval. Upon approval, the modification request will be assigned a number, logged, and transmitted to the requestor for implementation.
4.5 Quality Audits
Technical System Audits. An audit will be performed during verification testing by the CTC QA Manager according to section 2.9.3 Technical Assessments of the ETV-MF QMP [Ref. 4] to ensure testing and data collection are performed according to the test plan requirements. In addition to the CTC Technical System Audit (TSA), the EPA QA Manager may also conduct an audit to assess the quality of the verification test.
Internal Audits. In addition to the internal laboratory quality control checks, internal quality audits will be conducted to ensure compliance with written procedures and standard protocols.
Corrective Action. Corrective action for any deviations to established QA and QC procedures during verification testing will be performed according to section 2.10 Quality Improvement of the ETV-MF QMP [Ref. 4].
Laboratory Corrective Action. Examples of non-conformances include invalid calibration data, inadvertent failure to perform method-specific QA, process control data outside specified control limits, failed precision and/or accuracy indicators, etc. Such non-conformances will be documented on a standard laboratory form. Corrective action will involve taking all necessary steps to restore a measuring system to proper working
38
Revision 0 – 11/02/01
order and summarizing the corrective action and results of subsequent system verifications on a standard laboratory form. Some non-conformances are detected while analysis or sample processing is in progress and can be rectified in real time at the bench level. Others may be detected only after a processing trial and/or sample analyses are completed. Typically, the LM detects these types of non-conformances. In all cases of non-conformance, the LM will consider sample re-analysis as one source of corrective action. If insufficient sample is available or the holding time has been exceeded, complete re-processing may be ordered to generate new samples if a determination is made by the Project Manager that the non-conformance jeopardizes the integrity of the conclusions to be drawn from the data. In all cases, a non-conformance will be rectified before sample processing and analysis continues.
5.0 PROJECT MANAGEMENT
5.1 Organization/Personnel Responsibilities
The ETV-MF Project Team that is headed by CTC will conduct the evaluation of the Kaselco and ion exchange polishing systems. The CTC ETV-MF Program Manager, Donn Brown, will have ultimate responsibility for all aspects of the technology evaluation. The ETV-MF Project Manager assigned to this evaluation is George Cushnie. Mr. Cushnie and/or his staff member will be on-site throughout the series of batch treatments and will conduct or supervise all sampling and related measurements, with one exception.6 The operating cycle of the ion exchange polishing system will extend beyond the testing of the Kaselco system and the ETV-MF team will no longer be on-site. At the end of the operating cycle, a Gull Industries employee will collect a sample of the ion exchange regenerate from the storage tank (sample point 7) and ship the sample to the laboratory. The ETV-MF Project Manager will train the Gull Industries employee with regard to sampling protocol, sample preservation, and chain of custody.
Paul Morkovsky will head the Kaselco staff. He will be on call throughout the entire test period to answer questions concerning operation of the system.
Gull Industries personnel will be responsible for operating the Kaselco and ion exchange polishing systems and providing historical wastewater volume and cost information. Gull Industries will also be responsible for the disposal of all residuals generated during the verification test.
Severn Trent Laboratories (STL) in Houston, Texas, is responsible for analyzing verification test samples. The LM, Jodi Romine, will be point of contact (POC). The State of Texas approves STL for the analyses identified in this test plan.
The ETV-MF Project Manager and Gull Industries (host facility) have the authority to stop work when unsafe or unacceptable quality conditions arise. The CTC ETV-MF
6 The CTC ETV-MF Program Manager, Donn Brown, will make a determination as to the qualifications of any staff member assigned to the project. This will occur prior to testing.
39
Revision 0 – 11/02/01
Program Manager will provide periodic assessments of verification testing to the EPA ETV Center Manager.
6.0 EQUIPMENT AND UTILITY REQUIREMENTS
The Kaselco system and ion exchange polishing system are permanently installed at Gull Industries. The only utility requirements for operating the systems are electricity, compressed air, and city water.
7.0 HEALTH AND SAFETY PLAN
This Health and Safety Plan provides guidelines for recognizing, evaluating, and controlling health and physical hazards throughout the workplace. More specifically, the Plan specifies for assigned personnel the training, materials, and equipment necessary to protect themselves from hazards created by chemicals, and any waste generated by the process.
7.1 Hazard Communication
All personnel assigned to the project will be provided with the potential hazards, signs and symptoms of exposure, methods or materials to prevent exposures, and procedures to follow if there is contact with a particular substance. The Gull Industries (host facility) Hazard Communication Program will be reviewed during training and will be reinforced throughout the test period. All appropriate Material Safety Data Sheet(s) (MSDS) forms will be available for chemical solutions used during testing.
7.2 Emergency Response Plan
Gull Industries (host facility) has a contingency plan to protect employees, assigned project personnel, and visitors in the event of an emergency at the facility. This plan will be used throughout the project. All assigned personnel will be provided with information about the plan during training.
7.3 Hazard Controls Including Personal Protective Equipment
All assigned project personnel will be provided with appropriate personal protective equipment (PPE) and any training needed for its proper use, considering their assigned tasks. The use of PPE will be covered during training as indicated in section 9.0.
The following PPE will be required and must be worn at all times while in the Gull Industries (host facility) facility: eyeglasses with side splashguards.
7.4 Lockout/Tagout Program
The Kaselco and ion exchange polishing systems are fully installed. There is no need for implementation of a lockout/tagout program.
40
Revision 0 – 11/02/01
7.5 Material Storage
Any materials used during the project will be kept in proper containers and labeled according to Gull Industries requirements. Proper storage of the materials will be maintained based on associated hazards. Spill trays or similar devices will be used as needed to prevent material loss to the surrounding area.
7.6 Safe Handling Procedures
All chemicals and wastes or samples will be transported on-site in non-breakable containers used to prevent spills. Spill kits will be strategically located in the project area. These kits contain various sizes and types of sorbents for emergency spill clean up. Emergency spill clean up will be performed according to the Emergency Response Plan.
8.0 WASTE MANAGEMENT
The Kaselco and ion exchange polishing systems will process wastewater generated by manufacturing operations at Gull Industries. After processing, the effluent from treatment will be transferred to the existing Gull Industries storage tanks and subsequently reused as process water and/or discharged to the Houston Publicly Owned Treatment Works (POTW). Any residuals generated by the Kaselco or ion exchange polishing systems will be managed by Gull Industries in accordance with Federal, state, and local laws. Prior to testing, local and state authorities will be notified of the verification test.
9.0 TRAINING
It is important that the verification activities performed by the ETV-MF Program be conducted with high quality and with regard to the health and safety of the workers and the environment. By identifying the quality requirements, worker safety and health, and environmental issues associated with each verification test, the qualifications or training required for personnel involved can be identified. Training requirements will be identified using the Job Training Analysis (JTA) Plan [Ref. 5].
The purpose of this JTA Plan is to outline the overall procedures for identifying the hazards and quality issues and training needs for each verification test project. This JTA Plan establishes guidelines for creating a work atmosphere that meets the quality, environmental, and safety objectives of the ETV-MF Center. The JTA Plan describes the method for studying ETV-MF project activity and identifying training needs. The ETV-MF Operation Planning Checklist (Appendix D) will be used as a guideline for identifying potential hazards, and the JTA Form (Appendix E) will be used to identify training requirements. After completion of the form, applicable training will be performed. Training will be documented on the ETV-MF Project Training Attendance Form (Appendix F). Health and safety training will be coordinated with Gull Industries personnel.
41
Revision 0 – 11/02/01
10.0 REFERENCES
1) EPA, Effluent Limitations Guidelines, Pretreatment Standards, and New Source Performance Standards for the Metal Finishing Point Source Category (40 CFR 433).
2) EPA, Effluent Limitations Guidelines, Pretreatment Standards, and New Source Performance Standards for the Metal Products and Machinery Point Source Category; Proposed Rule (66 FR 424, January 3, 2001).
3) Cushnie, George C., Pollution Prevention and Control for Plating Operations, National Center for Manufacturing Sciences, Ann Arbor, MI, 1994.
4) Concurrent Technologies Corporation, “Environmental Technology Verification Program Metal Finishing Technologies (ETV-MF) Quality Management Plan,” Rev. 1, March 26, 2001.
5) Concurrent Technologies Corporation, “Environmental Technology Verification Program Metal Finishing Technologies (ETV-MF) Pollution Prevention Technologies Pilot Job Training Analysis Plan,” May 10, 1999.
11.0 DISTRIBUTION
Alva Daniels, EPA (3)
J. Kelly Mowry, Gull Industries
Jerry Givens, Gull Industries
Paul Morkovsky, Kaselco
Ian Tunnicliffe, Lobo Liquids
George Cushnie, CAI Resources, Inc. (2)
Donn Brown, CTC (3)
Clinton Twilley, CTC
Jodi Romine, Severn Trent Laboratories
42
APPENDIX A
Operating Procedures for Kaselco System
OPERATING PROCEDURES
The elctrocoagulation process uses electrical current to bind undesirable molecules of chemicals in water to each other and to the materials in the reactor cell. The undesirable chemicals in the reacted fluid are then removed by precipitation or filtering. Your unit is constructed with steel plates, and is specifically designed for removal of heavy metals. The amount of energy required depends on the fluid being processed. The typical waste from a rinsing operation will contain less than 10 ppm of heavy metals. This system is designed to process up to 20 times that concentration.
Beginning at too low current (voltage and amperage), the unit will not have a visible effect on the solution. As the current is increased, treatment begins, along with some gas evolution, principally hydrogen and oxygen. A floc of agglomerated particles becomes visible and settles when the solution is left standing. A further increase in energy will cause more thorough and rapid treatment with excessive evolution of gas. This gas causes the floc initially to rise rather than settle. As the amount of gas generation increases, the durability of the floc increases along with a decrease in its density. Floc generated at an excessive voltage will quickly rise above the liquid as foam and, depending on the fluid’s components, may not settle without significant agitation. The ideal energy level will treat the waste with only minor foaming.
Some waste streams, such as oils and fats, may be best treated using excessive energy, intentionally causing foaming. The constituents in the foam may be removed by vacuum. Unless such recovery is intended, foaming is discouraged.
A diaphragm pump at a constant velocity that can be controlled by the operator feeds the reactor cell. The operating air pressure supplied to the pump and the needle valve setting determines the pumping rate. CAUTION: The pump pressure should never be set above the level recommended by the manufacturer. If sufficient volume is not generated at this pressure, then the pump or the cell needs service.
The cell is connected to the pump by pipes and valves that allow flow in either direction through the cell, sampling, draining, and air blowdown. The normal flow of fluid in the cell is from bottom to top. Flow may be reversed for short periods, if necessary, to clear obstructions. An upward flow allows all cell parts to remain wetted and prevents accumulation of gas in the cell.
The output from the cell may be returned to a tank for re-processing or sent on for separation of coagulated solids. Processing the fluid through the cell several times until the desired treatment level is achieved is preferred. The pH of the solution being treated will rise with each pass. If the pH rises above ten before the waste reaches the desired treatment level, then pH adjustment may be necessary. This should not occur unless the waste is extremely concentrated, usually above 350 ppm. If the unit is used in the single pass mode, then excessive energy levels may be necessary to ensure full treatment unless the concentration of the contaminants is very uniform.
Foam may be removed by vacuum or by agitation. If the unit produces a heavy, durable foam, vacuuming may be necessary to prevent flotation of solids in the clarifier.
A-1
Solids separation may be accomplished by the addition of a chemical flocculant and clarification, or by filtration. Clarification is usually the most efficient means as only the settled solids, rather than the entire waste stream, must be filtered. A good flocculant should be effective at a feed ratio of less than 0.5 percent.
The flocculant is added to the treated stream immediately prior to the clarifier but far enough upstream to allow thorough mixing. This system adds the flocculant either to the tank following treatment or to the overflow of this tank, depending on the amount of foam generated. If excessive foam is being produced, the floc is added to the tank discharge with aggressive tank agitation to break the foam. If the waste will not form a heavy, sinking floc, then it may be necessary to add 25 percent calcium chloride solution to the agitated tank at the rate of 0.1 – 0.5 percent.
The clarifier spreads the flow of the discharge over a large area, slowing its movement and allowing solids to fall into a zone of stillness. Solids must be periodically removed from the bottom of the clarifier to ensure the stillness zone depth is maintained.
The clarified stream overflows from the top of the clarifier for further use or discharge. The outlet weir of the clarifier is adjustable to ensure an even flow across the entire width of the clarifier.
The controls of the unit allow automatic operation at present levels. The system will automatically shut down when the waste feed supply is exhausted, the destination tank is full, the unit experiences either high or low fluid pressure at the cell, or the air supply is interrupted. It will not re-start without operator input. The controller also operates the filter press, but each cycle must be selected and initiated by the operator. The controller allows pressure setting adjustments and manual initiation of any single function to aid in troubleshooting and testing. Valve selections are manual.
OPERATION
This section contains general instructions on operation. It does not include step-by-step details such as which valve or switch to operate. For more details, consult the specific section for that item of equipment.
PRE-OPERATION CHECKS
A pre-operational check must be made each time the unit is turned on. Checks should include:
?? Fluid levels in all associated tanks to ensure waste supply and holding capacity are available.
?? Solids level in clarifier.
A-2
?? Flocculant pump hose condition and flocculant supply, if used. ?? Valve settings. At least one “F” and “T” valve must be open. Caution: Incorrect valve
settings may result in injury to the operator and damage to the pipes and seals. ?? Power settings on the rectifier. Caution: The rectifier should be set to the lowest
settings for startup to avoid danger from a short circuit. If the rectifier produces excess amperage at the low settings, check for a short.
?? Air supply pressure. Caution: If the pump does not circulate fluid in the cell, a gas buildup could occur.
STARTUP
Perform the pre-operation checks.
Turn on electrical main breakers and air supply valve.
Set the rectifier to a low setting.
Pull the emergency stop button to the outward position and turn the key to “ON” and select the automatic mode (see Controller Operation section).
Check the cell “flow” pressure and compare it with the last pressure recorded in the operator’s log. An increase in pressure may mean an incorrect valve setting or constriction in the piping or cell.
After the cell is full, check the rectifier output. Caution: If the rectifier shows unusual amperage or voltage, refer to troubleshooting. A short in the system will show high amperage at low voltage, while an open circuit will show the opposite. Gradually increase the current until the expected treatment value is reached.
Flush the sample line until newly treated fluid reaches the end. Take a sampling and check for treatment. In a batch mode with metals below 400 ppm, the contaminant level should be reduced by on the first pass, and to zero after the third pass. Check for flotation. If significant foam occurs, reduce the current. Caution: Foam must not be allowed to reach the clarifier outlet wire, as it contains significant contaminants. If treatment does not occur, increase the current. In a direct-discharging mode, treatment must be complete after the first pass. Reduce the current to the minimum possible setting for the final pass to aid in flocculation.
Re-sample after any current adjustments are made. If problems occur which can not be correct by current adjustment, see the troubleshooting section.
Once the desired settings are reached, let the system run until the supply is exhausted. Note: If the treated waste is re -circulated from and back to the same vessel, then it may require additional passes.
A-3
Caution: Air agitation should not be used in a tank while it is being filled, as it could cause foaming, which would interfere with level sensors .
DURING OPERATION
Check the treatment level each time a batch volume is run through the system. For example, a 10-gpm system processing a 1000-gal batch should be checked at least every 100 minutes.
Check the cell “flow” pressure and compare it with the startup pressure. If the pressure has increased more than 25 percent, stop treatment and blow down the cell.
A system discharging to sewer should be checked at least every 30 minutes. Caution: When a cell is fully depleted, treatment ends abruptly. If the cell is expected to reach the end of its useful life during the run, then more frequent checks should be made. Check the amperehours total in the operator’s log to predict cell life.
If discharging to the clarifier, check the floc initially and each time treatment is checked. If the floc is too small to separate or is non-existent, then recycle the fluid from the clarifier back through the cell. Take a 250-mL sample from the sample port and stir in four drops of chemical flocculant. If floc does not form here, then the solids will not floc in the clarifier. You may speed flocculation by adding a small amount of calcium chloride solution to initiate the floc. See the troubleshooting section for additional information.
If the sample of a fluid that will not produce floc is found to produce floc when more flocculant is added, increase the flocculant feed rate. Caution: An excessive flocculant feed rate may result in a sticky floc that generates gas and that bridges in the bottom of the clarifier.
Maintain at least the minimum level of the chemical flocculant in its supply tank. Record the opening of each new container in the chemical usage section of the operator’s log.
Periodically, visually check the solids level in the clarifier. Solids should be removed by pumping to the filter press or draining to another reservoir. Caution: Do not allow solids to build higher than four inches from the top of the clarifier plates, as this decreases the volume of the stillness zone. If floc attempts to overflow the plates, remove it immediately. Occasionally cycle the slide valve to a different position to draw solids from the full width of the clarifier. Refer to the clarifier section to see the relative drain port positions.
Operate the filter press to remove solids as they are generated. The clear water from the filter press may be sent to a supply reservoir or to drain in the direct discharge mode, or to a supply tank in batch mode. If the filter press is full and the clarifier solids capacity is reached, then either stop treatment until the clarifier is emptied and re-started, or remove the solids to some other reservoir for later filtering.
A-4

SHUTDOWN
Read and record the pressure near the end of the run in the operator’s log.
When the supply of waste is exhausted or the destination tank is full, the unit will automatically turn off.
Operate the filter press until the solids in the clarifier are lowered to an acceptable level, preferably leaving enough solids to reach the bottom of the longest plates, then turn off the filter press pump.
If the reactor will not be operated again the same day, it should be drained and blown down. Set the valves to the “DRAIN” setting on the valve diagram. Once the cell is drained, set the valves to the “BLOWDOWN” setting and apply regulated air pressure for 30 seconds. Caution: Any fluid in the lines used for blowdown will reach a high velocity near the end of blowdown and can cause splashing. Make sure that the fluid is directed downward into a reservoir.
After blowdown, return the valves to the normal treatment position to avoid error on re-start EXCEPT that the feed supply valves to the waste pump should be left OFF.
Record the date, hourmeter hours, and ampere-hours in the operator’s log. Note: The pressure, ampere hours, and clock hours recorded in the log are used to predict cell life. Omitting entries could result in unexpected cell failure .
Record any maintenance done, failures encountered, or other observations in the chronological section of the operator’s log.
Turn off the key switch and the air supply.
STORAGE
If the unit will not be operated for an extended period of time, it should be prepared as if for storage.
Disconnect the waste feed pump from the supply line and cycle the pump until it is dry. Thenturn off the first valve(s) after the pump.
Drain first, and then blow down the cell toward the clarifier.
Blow down all lines in a direction away from the cell.
Back-flush the cell with fresh water. Add the water through the sample port and remove it byway of the drain.
A-5

Blow down the cell toward the drain.
Pump down the clarifier completely (through the filter press). Continue to cycle the filter press pump until it is empty, and then turn off the first valve after the pump.
Blow down and empty the filter press. Caution: If the filter press is not full or nearly full, a longer blowdown is required. Always be prepared to capture wet sludge when the press is opened while less than full.
Leave the valves in the settings for “storage” on the valve chart.
WINTERIZATION
The system should be winterized any time it will be idle while being subjected to freezing temperatures.
A-6
APPENDIX B
Data Collection Forms for Kaselco and Ion Exchange Polishing Systems
______________________________________________________________________________ ______________________________________________________________________________ ______________________________________________________________________________
______________________________________________________________________________ ______________________________________________________________________________
______________________________________________________________________________ ______________________________________________________________________________
______________________________________________________________________________ ______________________________________________________________________________
______________________________________________________________________________ ______________________________________________________________________________ ______________________________________________________________________________
______________________________________________________________________________
______________________________________________________________________________
______________________________________________________________________________
______________________________________________________________________________
______________________________________________________________________________
______________________________________________________________________________
Data Collection Form for Kaselco and Ion Exchange Polishing Systems
General Test Data
Date: ______________________ETV-MF Project Manager: ______________________Gull Industries Operator: ______________________
Parameter Reading Observations/Comments Polymer Tank Dimensions IX Acid Tank Dimensions IX Caustic Tank Dimensions Sludge Generation Volume: Electricity Cost: Labor Cost: Acid Cost: Caustic Cost: Steel Plate Cost: Steel Plate Usage:
Notes:
B-1
______________________________________________________________________________ ______________________________________________________________________________
______________________________________________________________________________ ______________________________________________________________________________
______________________________________________________________________________ ______________________________________________________________________________
______________________________________________________________________________
______________________________________________________________________________
______________________________________________________________________________
Data Collection Form for Kaselco System Cycle Specific Data
Date: ______________________ETV-MF Project Manager: ______________________Gull Industries Operator: ______________________
Parameter/Time Reading or Sample # Observations/Comments Batch ___/Pass___ Kaselco Start Time:
Amp-hour reading A at start: Amp-hour reading B at start: Kaselco Stop Time:
Amp-hour reading A at stop: Amp-hour reading B at stop: Volume Treated (L): Polymer Height: Sample Point 1: Sample Point 2: Sample Point 3: Sample Point 4:
Batch ___/Pass___ Kaselco Start Time: Amp-hour reading A at start: Amp-hour reading B at start: Kaselco Stop Time:
Amp-hour reading A at stop: Amp-hour reading B at stop: Volume Treated (L): Polymer Height: Sample Point 1:
Sample Point 2: Sample Point 3: Sample Point 4:
Notes:
B-2
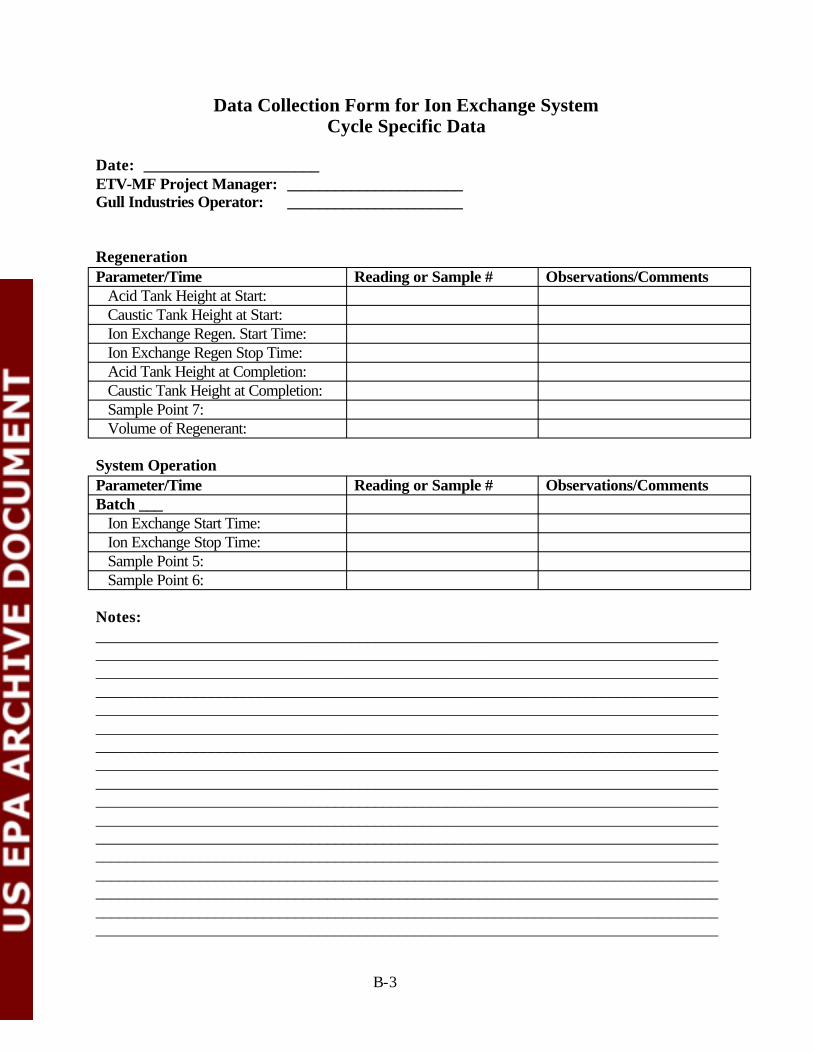
______________________________________________________________________________ ______________________________________________________________________________
______________________________________________________________________________ ______________________________________________________________________________
______________________________________________________________________________ ______________________________________________________________________________ ______________________________________________________________________________
______________________________________________________________________________ ______________________________________________________________________________
______________________________________________________________________________ ______________________________________________________________________________
______________________________________________________________________________
______________________________________________________________________________
______________________________________________________________________________
______________________________________________________________________________
______________________________________________________________________________
______________________________________________________________________________
Data Collection Form for Ion Exchange System Cycle Specific Data
Date: ______________________ETV-MF Project Manager: ______________________Gull Industries Operator: ______________________
RegenerationParameter/Time Reading or Sample # Observations/Comments Acid Tank Height at Start: Caustic Tank Height at Start: Ion Exchange Regen. Start Time: Ion Exchange Regen Stop Time: Acid Tank Height at Completion: Caustic Tank Height at Completion: Sample Point 7: Volume of Regenerant:
System Operation Parameter/Time Reading or Sample # Observations/Comments Batch ___ Ion Exchange Start Time: Ion Exchange Stop Time: Sample Point 5: Sample Point 6:
Notes:
B-3
APPENDIX C
Test Plan Modification Request

TEST PLAN MODIFICATION REQUEST
In the course of verification testing, it may become necessary to modify the test plan due to unforeseen events. The purpose of this procedure is to provide a vehicle whereby the necessary modifications are documented and approved.
The Test Plan Modification Request form is the document to be used for recording these changes. The following paragraphs provide guidance for filling out the form to ensure a complete record of the changes made to the original test plan.
The person requesting the change should record the date and project name in the form’s heading. Program management will provide the request number.
Under Original Test Plan Requirement, reference the appropriate sections of the original test plan, and insert the proposed modifications in the section titled Proposed Modification. In the Reason section, document why the modification is necessary; this is where the change is justified. Under Impact, give the impact of not making the change, as well as the consequences of making the proposed modification. Among other things, the impact should address any changes to cost estimates and project schedules.
The requestor should then sign the form and obtain the signature of the project manager. The form should then be transmitted to the CTC Program Manager, who will either approve the modification or request clarification. Upon approval, the modification request will be assigned a number, logged, and transmitted to the requestor for implementation.
C-1

_______________________________________________________________________ _______________________________________________________________________ _______________________________________________________________________
_______________________________________________________________________ _______________________________________________________________________
_______________________________________________________________________
_______________________________________________________________________
_______________________________________________________________________
_______________________________________________________________________
_______________________________________________________________________
TEST PLAN MODIFICATION REQUEST
Date:__________ Number:__________ Project:_________________________
Original Test Plan Requirement:_____________________________________________
Proposed Modification:____________________________________________________
Reason: ________________________________________________________________
Impact:_________________________________________________________________
Approvals:
Requestor:____________________________
Project Manager:_______________________
Program Manager:______________________
C-2

APPENDIX D
ETV-MF Operation Planning Checklist

ETV-MF Operation Planning Checklist
The ETV-MF Project Manager prior to initiation of verification testing must complete this form. If a “yes” is checked for any items below, an action must be specified to resolve the concern on the Job Training Analysis Form.
Project Name: Expected Start Date: ETV-MF Project Manager:
Will the operation or activity involve the following: Yes No Initials & Date Completed
Equipment requiring specific, multiple steps for controlled shutdown? (e.g. in case of emergency, does equipment require more than simply pressing a “Stop” button to shut off power?) Special Procedures for emergency shutdown must be documented in Test Plan. Equipment requiring special fire prevention precautions? (e.g. Class D fire extinguishers) Modifications to or impairment of building fire alarms, smoke detectors, sprinklers or other fire protection or suppression systems? Equipment lockout/tagout or potential for dangerous energy release? Lockout/tagout requirements must be documented in Test Plan. Working in or near confined spaces (e.g., tanks, floor pits) or in cramped quarters? Personal protection from heat, cold, chemical splashes, abrasions, etc.? Use Personal Protective Equipment Program specified in Test Plan. Airborne dusts, mists, vapors and/or fumes? Air monitoring, respiratory protection, and /or medical surveillance may be needed. Noise levels greater than 80 decibels? Noise surveys are required. Hearing protection and associated medical surveillance may be necessary. X-rays or radiation sources? Notification to the state and exposure monitoring may be necessary. Welding, arc/torch cutting, or other operations that generate flames and/or sparks outside of designated weld areas? Follow Hot Work Permit Procedures identified in Test Plan. The use of hazardous chemicals? Follow Hazard Communication Program, MSDS Review for Products Containing Hazardous Chemicals. Special training on handling hazardous chemicals and spill clean up may be needed. Spill containment or local ventilation may be necessary. Working at a height of six feet or greater?
D-1

ETV-MF OPERATION PLANNING CHECKLIST
The ETV-MF Project Manager prior to initiation of verification testing must complete this form. If a “yes” is checked for any items below, an action must be specified to resolve the concern on the Job Training Analysis Form.
Project Name:
ETV-MF Project Manager:
Will the operation or activity involve the following: Yes No Initials & Date Completed
Processing or recycling of hazardous wastes? Special permitting may be required. Generation or handling of waste?
Work to be conducted before 7:00 a.m., after 6:00 p.m. and/or on weekends? Two people must always be in the work area together. Contractors working in CTC facilities? Follow Hazard Communication Program. Potential discharge of wastewater pollutants?
EHS aspects/impacts and legal and other requirements identified?
Contaminants exhausted either to the environment or into buildings? Special permitting or air pollution control devices may be necessary. Any other hazards not identified above? (e.g. lasers, robots, syringes) Please indicate with an attached list.
The undersigned responsible party certifies that all applicable concerns have been indicated in the “yes” column, necessary procedures will be developed, and applicable personnel will receive required training. As each concern is addressed, the ETV-MF Project Manager will initial and date the “initials & date completed" column above.
ETV-MF Project Manager: (Name) (Signature) (Date)
D-2

APPENDIX E
Job Training Analysis Form
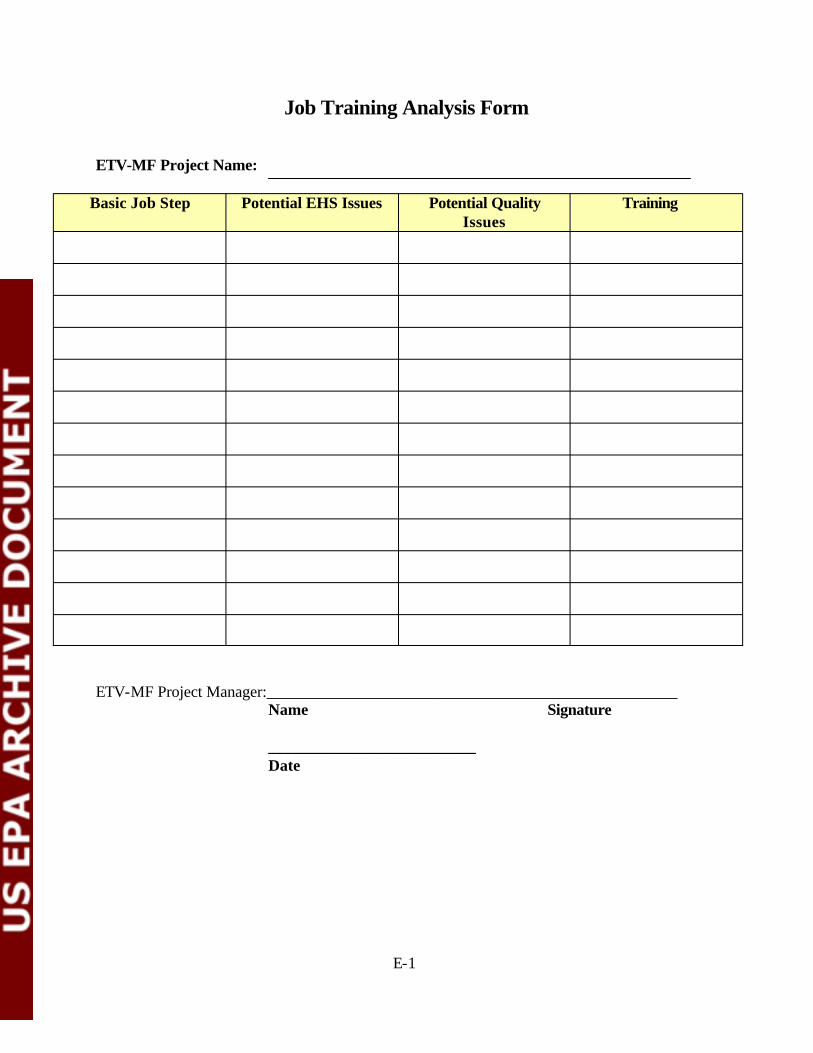
__________________________
Job Training Analysis Form
ETV-MF Project Name:
Basic Job Step Potential EHS Issues Potential Quality Issues
Training
ETV-MF Project Manager:____________________________________________________ Name Signature
Date
E-1

APPENDIX F
ETV-MF Project Training Attendance Form
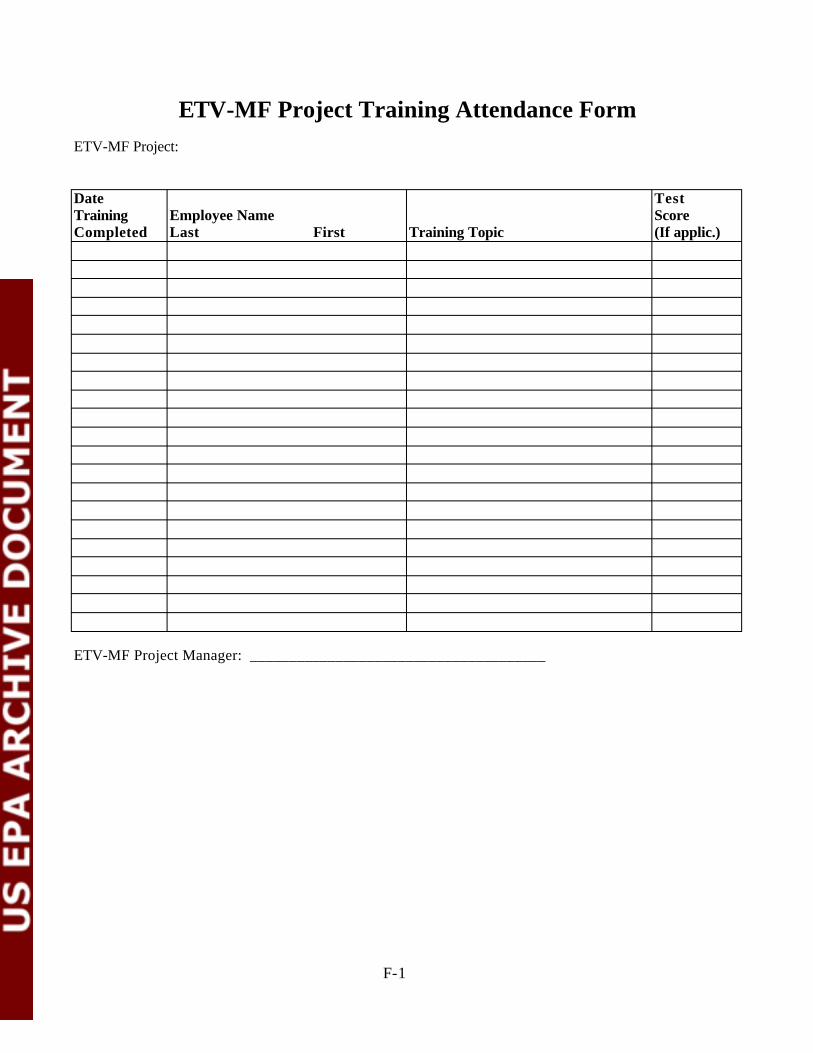
ETV-MF Project Training Attendance Form ETV-MF Project:
Date Training Completed
Employee Name Last First Training Topic
Test Score (If applic.)
ETV-MF Project Manager: ______________________________________
F-1