Embed Size (px)
Citation preview

'DOCUMENT RESUME
iD 231 328 IR 010 725
AUTHOR Corder-Bolz, Charles R.TITLE Family Educational Use of Television. Final Report.
Revised.INSTITUTION Southwest Educational Development Lab., Austin,
Tex..SPONS AGENCY National Inst. of Education (ED), Washington, DC.PUB DATE w Dec 82NOTE 176p.; For related,document, see ED 222 194.PUB TYPE Reports Research/Technical (143)
EDRS PRICEDESCRIPTORS
MF01/PC08 Plus Postage.Adolescents; *Broadcast Television; Children;Educational Television; *Family Life; Interviews;
-Observation; *Parent Role; Questionnaires; *ResearchMethodology; Television Research; *TelevisionViewing; *Use Studies
ABSTRACTUsing a new telephone-observation methodology which
permitted low-cost observation of home teleVimsion viewing behayiors,this study examined how families use home television, parentalinvolvement in their children's television viewing, and families'educational use of hbme television. Following initial calls to 2,922household phones, a total of 490 families with school-age children athome were identified. Findings indAcate that in families with youngchildren, parents view television with their children about half ofthe time during evening hours; however, family conversationsconcerning the viewing occur only about 10% of the time. Only about8% of fhe families studied watch television programs for educationalpurposes, and more than half of the parents do not think theirchildren learn from television programs. Family parameters, homeenvironment, child parameters (e.g., age) appear to influence.familyusage of television, while the number of parents present,in thefamily does not. Appendices to this report include data gatheringinstruments, 1981 spring telephone survey results, and tablesdisplaying results of special analyses of the data-: (LMM)
***********************************************************************Reproductions supplied by EDRS are the best that can be made
from the original document.**************************************k********************************

U.S. DEPARTMENT OF EDUCATIONNATIONAL INSTITUTE OF EDUCATION
EDUCATIONAL RESOURCES INFORMATIONCEN.TER
51. This document has been reproduced asreceived from the person or organizationoriginating h.
0 Minor ch8nges have.been made to improvereproduction quality.
Points of view or opinions stated in this docu-ment do not necessarily represent officCal NIE
position or Policy.
Family Educational Use of Television
Final Report FY.1981
y.
Charles R. Corder-Bolz
Submitted to:
National Institute of EducationWashington, D. C.
Submitted by:
Southwest Educational Development Laboratory211 East Seventh Street,Austin, Texas 78701
August 1981Revised September 1981Revised January 1982
Revised December 1982

AB'STRACT
\\
American children spend more of their waking hours wa,tching television\
than in any other activity. Television viewing is the predominant family
activity. A large number of studies have generated evidence-that children
learn and mis-learn much from television. Television has become one of the
prime educational resources. In controlled studies the evidence indicates
that parents' inv;lvement in their children's television viewing is the
critical eleMent determining the_education benefits of children's television_
viewing experiences.- However, little is known about family television viewing
'6ehaviors in the home. Virtually all of the available data were acquired
through self-report studies. Since most television viewing behaviors are out
of awareness, self-report data are suspect and often have been found to be
contradictory. A new telephopp-observation methodology was developed that
permitted reasonably accurate4observation of television viewing behaviors in
the home at a low cost and which is compatible with sophisticated sampli
techniques,
A total' Of 2,522 household phones were called. Excluding households not
at home or refusiiig to participate, 1,298 households provided informatton in
the Study. A,total of 490 households were families with school-ago children
at home,
The Study proVided important insights into how families use home tele-
vision, parental involvement,in. their children's television viewing, and
,familfes educational use of home teTevision. In general, it was found that
in families with young children, parents viewed television with their children
about half of the time durineLevening hours-. However, family conversations
about the television program occurred only about 10% of the title. Further,SO

only about 8% of families with young children watched,a television program
for educational purposes, and more than half of the parents did not think
,ir children learn from television programs.
It was hypothesized that family parameters would influence family use ,of
television. Although there may be distortions in the data from.the sub-sample
of families with young children,-the data do indicate that Mexican American
parents view television with their children less frequently than do Anglo or
black parents.- Further, family conversations while viewing television are
much less frequent in Mexican American families. There appears to be.no sub-
stantial differences in the proportion of Anglo, black, and Mexican American
families viewing television programs for edutational purposes. Though, black
parents are more skeptical that their children learn from television programs.
-The general environment of the family appears to influence families' use
of television. For particular, families in rural settings appear.to be less
likely to have family conversattons about a-television program,yand much less
likely to watch television far educattonal purposes. Finaify,-fewer parents
in-rural families believe their chfldren learn from teleVision.
It was thought that the number_of-oarents present in the family would\
greatly alter the -family s use of home,televtsion; however, the data do not
support this hypothesis. While,sfrigle parents are much more likely to view
television with their chtldren, there are no-dramatic differences between
single-parent and two-parent families in the areas of family conversations
while viewing televisfon,..reasons for watching television, or parentaT belief
that their children.learn from televtsien,
The second hypothesis was that,child parameters would aftect television
yiewing behaviors. The data indicate that in families with high-school-age
children, there is less frequent parent-child co-viewing of television, fewer

family conversations about television programs, less frequent television
viewing for educational purposes, and less belief that 'children' learn from
televisiorprograms than in families with grade-school-age children.
The third hypothesis was that parental involvement would influence the
edubational benefits.of children's television viewing. The data appear to
indicate that in families wheruarents co-view with their children more fre-
quently, there are more parent-child conversations about television programs,
more television viewing for educational purposes, and a greater belief that
children learn from televisfon programs.
The overall picture of family television viewing, however, is that while
television.viewing is a dbminant, if not almost a constant, family activitya
for most families with children during'most evenings, television viewing is
not a joint activity in that family conversations about television are rare
events, television yiewi,ng'is not planned, progr'am selection is not a family
decision; and television viewing itself is an ine*pensive and easy way to fill
the evening hours. Fdrther, the overwhelming proportion of parents do not
believe that children learn from television.

TABLE OF CONTENTS
page
Statement of Purpose 1
ScoO 4
RevieW of Relevant Literature 5
C ildren Mis-Learning from Television 7
E ucational Use of Television 9
Viewing educational Programs 9
Viewing informative programs 10
Evaluatilig all TV programming .10
. ,Special educational uses of television 10
Families' Educational Use of Television 11
Pare tal Involvement 12
Pare.tal Mediation 1.- 14
Telev sion and Parenting 18
Model of. Family Use of Television 20
Research Hy otheses 24
Family Parameters 24'.'
Child P rameters 24
Parenta Involvement 25
Methodology 26
Procedures.Pilot Stu 3_2r.---;,,,-::;'-;,",-
-----study---6-1 -arlifTies', Edpcational Use of Televis.i.an 34.'-'-:
Varia leS....-
34 ,
Sampl 35
Instr ments 36
Sampli g Procedure 38
Results
Discussion
Conclusions
-Availability of Da a
References
APPENDIX A: Telephckne Observation and Questionnaire,
APPENDIX B: 1981 Telephone.S&Ady Results
APPENDIX C: First S ecial Analysis Tables
U!2.:
39
52
57
62
63
Forms 69
= 76
123

'STATEMENT OF PURPOSE-
The critical issue of children educationally benefiting from television
prbgramming appears to involve'the extent and nature of parental.involvement,
especially parental commentarY and mediation of programming content. Several
studies have provided strong evidence that parental involvement is,the
determining factor. While the evidence indicates that parents can help
-their children to learn from TV, very little is known regarding how often
and in what ways parents do attempt to make their children's TV iewing
educational.
Television and parental' invOlvement is a particularly critical issue.N
for most Contemporary families. .1.elevision has become a primary educational
resource for most students. 'for a society which relies upon an educated and
informed public, it is becoming intreasingly imperative that children and
--families utilize television as'an education resource (Corder-Bolz, 1980).
It is now evident that there is an important need to understand how families
use television- and-then to devejop strategies for encouragino more educational
utilization of television.
-This stuO-WaS designeckand conducted to provide information on a
variety of potentially important questions regarding parent involvement and
Children's educational use of telemision. The general model of FAMILY AS. .
EOUCATOR; Utilizing Television as an Educational Resource, presented in
Figure 1, is propoad as an organizational approach of structuring the
many possible elements and their inter-relationships. It is hoped that the
current study will provide descriptive inform tion about families with
children and how they.educationally use and benefit from televisiomprograMming:. 7
1

FIGURE 1
FAMILY AS EDUCATOR:
Utilizing TV as an Educational Resource
ily ascator. .
ily Structure:. nuclear
single -.tarentextended
ents' Age
ents' Educatibq
ily Values
ild RearingViewing Habits
ily Interactionatter ns
Teleyision as- Educational
an. Educational Methods
Resource
Programming:newsdramacartoonscommercialscomedydocumentariesgame showssportseducationa Iadventures
Content:a. .knowledgeb. languageC. cultural
-d. values
Form:a. wordsb. colorc. shape
Rules
Mbdeling
Content Selection-
Behavior Shaping
Direct Mediation
I nd irect Mediation
Springboard Techniques
Life Choices
Learner
CognitiveDevelopment
Sex Roles
CulturalRoles
Age Roles
EthicationalObjective
Cognitive:a. information.b. language developmentc. literacyd. critical of informatione. cause of/effect of
human interaction
Affective:a. social norms,
and valuesb. social developmentc. personar developmentd. life choices
Performance:.a. academicb. so'cial interaction
*c_Leflective conductd. behavioral options'
'17.1

j.
The model suggests five major kinds of variables: Family as Educator,
Television as an Educational Resource, Educa ional Methods, Learner, and
Educational-Objectiyes.. While many hypothesized elements will need to be
ehplored in experiMental settings (e.g., t e relative effectiveness of direct
!mediation and indirect mediation, or the interactive effects of mediation
method and age of child), a descriOtivelata base is'first needed for most
of.the Vafiables. _Thus the current studj collected descriptive data on what
differenticindstof families '(e.g, AnglO, Black, Mexican American, urban,
Suburban, rural, single-parent, Wo-parent) and different-ages Of children
did while watching television. In particular, it Was hypothesized. that .
family Conversations about television prOgram4content,- the family'Members
co-viewing, and the regularity and/or planfulness of viewing would-be impor-,
tant family behaviors to monitor. Finally, information on whether the
family was Viewing a program for educational purposes and what parent's
thought.their children were learningyfrom a program.was also collected. The
data collected from families regarding these variables provide the nee
description information of what families do when they view television, and
provide the needed foundation from which to develop and explore experimental
hypotheses about causal relationships among the many elements of family
television viewing at home.

SCOPE OF REPORT
This report attemptt to clarify the issues of families''' se of televiciTn
and the potential educational 'benefits. The relevant scientificliterature'
is 'reviewed and potentially important parameters are isolated uldidisssed.. ,
A model of family ute-of television is developed. The-design. of a study td-
.
collectIPthe needed descriptive information of families activities while
viewing television, especially activities that could be related to television
viewing as an educational experience is completed. FinallY, the data are
presented and ttie implfcations are reviewed.
a

:REVIEW OF RELEVANT LITERATOE
The field of television research lacks an accurate description ur. how
different kinds of families use television. A major problem in-researching
family US-e of TV is the reliance upon self-report (Dorr, 1978). 'EVen on
the issue of how much TV children Watch; reports Vary'so widely thatv.one,must
questiOn'the validity of. reported correlations.between viewing'and other
variables. Lo.Sciuto (1971) fo`und that people reported a range of 183a-
minutes per day for .an "average" day to 105 minutes on an average diary
day's viewing. Roper (1971) reported 170 minutes and Nielsen (1970). reported
190-220 minutes average viewing per day. In comparing taped in-home obser-
vations with diary-reported viewing, Bechtel, Achelpohl, and Akera (1972)
found a strong tendency to over-report viewing time. Lyle. (1972) suggested
that the question of amount of TV viewing time is per'haps not very important,
.but it is merely'an example of a very simple question.that is not answered
beCause of the myriad difficulties arising from self-report or parental
report of child TV viewing behavior.
Children Learning from Television
Children watcha lot of television'and-learn many things from television.
While the available evidence is contradictory regarding the impact of tele-
vision Upon4phildreOs academic development, nonetheless, there are oVer-,
whelmdng data which indicate that childrem not,only learn from televisiOn
programming, but alsollearn a. diverse array of things. Postman (1979) argues
. forceably that TV is a curriculum, is children's first curriculum, and in
many ways may be children's most effective curriculum.
5

Imany studies have foUnd that televiSion programming is ery effective,
In a number of speCific areas. / Regarding children's.knowledge of the wOrking
World and occupations and children's occupational'aspirations, television.,
has proven to be a very,effective teacher.. DeFldUrand DeFleur (196,7)
reported that."a considerable amount-,of information about occupational roles
is gained from. the medium (p. 785) and that "the influence of television as
learning source was substantial concerning:the 7soCial rankings of ocCupa-,
tions" (p. 787). DeFleur and DeFleur concluded that "television is'a more, .
.
potent source.of occupational status kinowledge than either, personal contact
or the:general community culture" (1967; p 787). These(findings have beeh
replicated and expanded. Jeffries-FT and Signorielli (1978) found children's
concepttons of Occupations to be consistent with tiTiVised Ortrayals.
In experimental studies of traditional and non-traditional televised pOr-,
trayals of Occupations, television was found tO be an effective.teacher
(Miller and Reeves,'19.75; O'Bryant and Corder:Bolz, 1978a, 19780. In a 1 rge,
,quas17experimental study involving two cities in WhiCh currently syndicate1d
daily TV series had not been availbl&in the othercity during the last.-
five years, Abel, Fontes, Greenberg and Atkin (1980) found that "being exposed
.-
to the orograms'sUbStantially alters selected pe-rceptions of occuOational
roles and.,.exposure definitely affects the chilCs aspirations for the occu-
pations and their evaluation of the role" (Greenberg; 1980, p. 20).
Similarly, Nunnellee and Corder-Bolz (1980) reported that the portrayal of
occupatiOns in commercials could directly affect children's knowledge of
occupattona and their-aspirations for the occupations.
In the area of children's attitudes toward the elderly, Gerbner and
Slgnorierri(1-979)--fqund-that youngerAviewei.,a-andLperpie_Who_watch television
more frequently are more likely to believe the:common television portrayal
1 )6

of older people as being noi alert and-not capable. Korzenny,and Nevendorfv ,
(1979) foundanalogous results with zdults, including the elderly,
Similar results have been found in the-area of children's attitudes
regarding sex roles. Beuf (1974), MCGhee (1974) and Corder-Bolz (1980a)
have found that television's modeling of sex-relatO roles can be a very
effective curriculum with children. Similarly again, the dei/eloping
evidence suggests that television programming effectively teacheS children`-1
beliefs and values regarding familY structure and family roles.
Greenberg, and Buerkel(--.197-7-Ffound-the-ttel evisidn-por-tr-ayal--df-=-fami_l_i es
may teach viewing-children how family members should communicate'with each
other.. Walters (1978) suggests that television portrayals may be altering
children's beliefs about hOw parents and children should behave. Preliminary
findings from'a project by Buerkel-Rothfuss3 Greenberg, and Nevendorf
(reported in.Greenberg, 1980) pr6ide further evidence that television por-.
trayals of families have adirect-impadt on children's,perceived realities
of family behaviors and familyratff:
While the above appears to be a lengthy list of area's in which televisidn
provides'an effective currtcUlum, in actuality the list is much longer!.
There is at least limited evidence that-children learn about social issues,
political issues, about other cultures and other historic and future times,
.and about geography and animals from television. Indeed, as Corder-Bolz
0980a1 asserts, "it is important to realize that there are maiiy issues
presente&on television...(in many) cases television may be the sole source
of information." (p. 116).
Children Mis-learning from Television
A disturbing aspect of children's learning via'televiion is that often
0

children.do not understand nor realistically interpret what they see and
hear on television. rn a study usi4an episode from ALL IN THE FAMILY,
Meyer (1976) found that dhildren as old as 12 years failed to understand
the major points of the,plot. When asked what they saw in a television
program, children will report the viSually portrayed acts and events rather
than the plot or story. While large portions,of the story line in television
programs are presented by the verbal interactions among characters arid events
and consequences are implied as the Program goes from one scene to the next,
children appear to be unaware of the developing story and instead perceive
most television programming as a series of discrete, independent "picture"
actions.^
Further, young children do not understand the motives and consequences
of acts portrayed in television programs (Collins, 1973). Additionally,
Collins found that young children will often evaluate television characters
in terms-of the consequencesedf their acts, e.g., aggressors were bad
because they were sent to jail. Collins, and Westby (1975) found that young
children would come to "different:interpretations of inter-scene:relationships
than adUlts. would have:made themselves or would expect of children" (p. 6).
For example, in a study using an episode from ADAM-12 in which grade school
students playing hookey from school were taken to the police station to wait
for their'parents, four- .and five-year-old children viewing the Oisode
learned about playing hookey from school but failed to learn that.it is wrong.
Similarly, young children fail to understand television commercials (e.g
Wartella and Ettera, 1977-, Ward, 1972; Wartella, 1980). Even adolescents
fail to maturely interpret television portrayals. In a study of 13- to
18-year-old girls, Corder-Bolz and Co'x (1980) found that 33% of the girls
-
thought of adult heterosexual relationships portrayed in television programs
8

as being similar to real life relationships. Even more disturbing, in a
comparable sample of pregnant adolescent (unmarried) girls, 70% regarded the .
television portrayals as being realistic. Although there are little avail-
able data:many parents and educators believe that adolescents may similarly
misinterpret television portrayals of drug use, the use of physical force to
resolve conflict,,and other social behaViors:
Children and youth learn many things from television. As Corder-Bolz
(1980b): suggests, for a large proportion of American children, television has
becoMe the number one teacher and 'the nuMber one parent. Television has be-/
come,our most influential educator. rt presents a verY wide range of infor-
.
matfon. Because df its visual format, itS'.uSe is les restricted by.a child's
ability to read or to Understand a particular language. Children clearly
find television more accessible than books, newspapers or magazines. However,
an important problem with television as teacher is that many of the students
fail to understand or maturely interpret the curriculum .content.. Thus two
basic questions need to be answered:
1, how can home television be used as an educationalresource,..,and
2, 'how can families be encouraged to use televisionfor educational objeCtives?
Educational Use of Television
There is little literature on current or potential educational uses
of television. The few artidles and books written in the area contain even
less scientific data. In the absence of previous work to build upon, it
.may. be reasonable to propose,four categories of educational uses of television.
Viewing edilcation programs. The PBS statilms as well as many commercial
stations broadcast educational programs as regular.series and as special
9

programs. SESAME STREET, ELECTRIC COMPANY, THE BODY HUMAN, the CBS Reading
Program, and the NBC Special Treats are well known eXamples Some families
purposefully watch such programs because of the educatiOnal-value for their
children.
Viewing informative programs. Many commercial television programs such
as documentaries, news programs and docu-dramas are perceived by parents _
as being educational. ROOTS and ELEANOR are the probably best known ex-
amples. These programs often present carefully researched information.'
Evaluating all TV programming: All television viewers, especially young
viewers, can learn more from a television program by evaluating the program
content. Television: A.Family Focus, published by SEDL under a contract .
with USOE, is an example of encouraging children and their parents.to learn
more from television by asking questions about the programs during and after
viewing. Children can learn about life situatiOns-by asking questions such
as, "Are the characters realistic?", "Is the situation realistic?", "What
would I do?" Children can learn about 'different people and historic time--
periods by analyzing programs such as LITTLE HOUSE ON'THE PRAIRIE. Children
can learn about emotions, motives, and values by thinking and talking about
almost any dramatic television program.
Special educational uses of TV. As Potter (1976), DeFranco (1980),
and others have suggested, there are a multitude of ways in which television
can be used to teach specific skills. The various patterns and visuals
can be used to teach shapes and colors. The number of commercials, the number.
,of characters, the number of objects, etc., can be used to teach counting
.skills. 6reative and criticifl thinking can be taught by turning off the
sound and asking the students what is being said. Similarly, theyideo
can be turned off and children can be asked to Imagine what is happening.
10

Students can practice their grammar lessons by looking for grammatical
mistakes in television commercials. As Rosemary Potter says, the potent' 1
is limitless.
Families' Educational Use of Television
There is little literature on the issueS of families' educational use
of television, and even less data. The limited data, however, do permit
some insight. For example, apparently families make little use of educational
television programs. The 1977 Nielson data indicate,that approximately
11 million 2- to 11-year-old children watched prime time television. The
average 2- to 5-year-old watched 29 hours per week- of television, prodrammin
with 24% of the viewing occurring during prime. time, 28% during the after-
noon and early evening, and.29% during the day. The average 6- to 11-year-old
watched almost 27,hours.of television programming with 35% occurring during
the afternoon and early evening, and 29% during prime time. The MUPPETS
was the highest ranked prOgram among 2- to 11-year-old children with a
19.8% share,of that audience. THE BRADY.BUNCH followed-with a 18.6% share,'
WONDERAMA with a 15.5% share, DAKTARI with a 14.5% share, GILLIGAN'S ISLAND
,wfth a.13.1%-share, MY THREE 'SONS with a 12.5% share, and BEWITCHED and
MTGHTY MOUSE with a 12.0% share.
In a study by LeRoy (1978) in six cities, it was found that of the
day-time_viewing households with children, approximately 23%.viewed only
children's programs, approximately. 21% viewed only non-children4s .programs
and 16%.viewed both kinds of programs. Approximately 41% ofthe 2- to
6-year-old aiTdren and approximately 11% of the 7- to'.12-year-oldchilgren
viewed SESAME STREET at least once during the week of the study. Approx-
imately 22% of-the 2- to 6-year-old children.and 7% of the 7- to 12-year-olds.

viewed ELECTRIC COMPANY at least once. For MR. ROGERS, 21% of the 2- to.
6-year-old children and 6% of the 7- to 12-year=old children viewed at least
once. For ZOOM, approximately 12% of the 2- to 6-year-old children and
7% of the 7- to 12-year-old children viewed at least'once during the Oeek.
Even .more discouraging, in.a study of viewership of ESAA television
series by Applied Management Sciences (1978), it was found that 3% of 1st
graders,.2% of 2nd graders, and 0% of.7th and 10th graders watched CARRAS-
COLENDAS at least once during the:week prior to the study. Similarly, 1%
of the 1st graders and 10th graders, and 3% of the 4th and 7th graders
watched INFINITY FACTORY at least once. Five percent of the lst\graders,
3% of the 4th and 7th graders, and 1% of the 10th graders watched REBOP
at least once. Three percent of the fst graders.and 2% of the 4th graders
watched VEGETABLE SOUP at least once. In terins of students who "ever'
watched any particular series, the viewership percentages generallyncreased
to.15% tO 20% points..
Parental Involvement
The limited available data also suggest that parental involvement in
children's televi.sion viewing is very limited. Greenberg, Ericson and Vlahos
(1972) stated that television is generally not accompanied by any.signi-
ficant family interaction toward the television or-program content. Bower
(1973) found that from-25% to 46% of parents attempted to control" their
children's television'viewing, depending upon the 'education level of the
parents. Bower's data further suggests that parental control is not related
to the age of the child or children but likely a function of the family's
culture as represented by parents,' education level. Ward, yackman and
Wartella (1977) found a very.low incjdence of parent-child discussions
12

o
about television commercials. Robertson, Rossiter and Gleason.(1980)
found "moderate" parent-child interactiohs regarding certain categories of
commercials. Mohr (1976) it a large survey study reported, "The yast
majority of the students reported no parental guidance on the viewing of
each evening television program listed in the questionnaire.",(p. 124).
Eighty-eight percent of the students reported receiving ho parental 6uidance
on,75 of the 86 programs included in the study. The interesting question
raised by the Mohr study is that having observed the relatively low incidence
of parental -guidance, what kinds of programs are the object of parental
guidance? Sfudents reported receiving po itive parental guidance for
programs such as local news, 60 MINUTES, WILD KINGDOM, CAPTAIN gt TENNILLE,
HAPPY DAYS, LITTLE HOUSE ON THE PRAIRIE, MONDAY NITE FOOTBALL.and STARSKY
AND HUTCH. Students also/Teported receiving negative parental guidance-,,
,for such programs' as SYBIL, RICH MAN, POOR MAN II, EXECUTIVE SUITE, FAMILY,
MAUDE and SONNY AND CHER. However,"there was a positive correspondence
between the nature of the parental guidance reported by the students and their
preference for programs.
ln a study by Corder-Bolz and Marshall (1980) involvin9,3,321 families,
52% of the parents reported that they "always" or "often" try to limit the
amount of their children.'s viewing. Seventy-nine percent reported that they
were able.0 control television's influence on their children. Mowever,
only 54% of the paren.Es reported talking.to their children about specific
programs. Even these data can be expected to be inflated by the social
desirability of the responses being solicited. Interestingly, more Anglos
(37%) felt that television influenced their children's values than did
.Blacks (21%) or Mexican Americans (28%).1 'An unexpected finding is th'ae
apparently the parents were much more likely to talk about programs which
13

reflected their owntviews, rather than to discuss a TV program to overcome
negative portrayalg:
In a large interview study, Martin and Benson (1970) found "the working
clast child watchesi TV more but is less likely to discuss the educational. 1
implications of What he sees' with his father" (p. 413). Similarly, working:
class fathers repoft d the greatest use of parental rules for TV viewing
. . (with upper:middlie, and lower class fathert reporting-lest use-of-TV rules),
\\
but there apparen,ly was a pos#ive linear relationship between the.fathers
educatton and uselof TV rules. The data also indicated a strong positive
relationship for1social class and parents' education with "parental use
of-TV as an eduJtional aid." Seventy-three percent of'the.upper class
fathers-60-'75% of the upper class mothers reported using television as an
educational aidl in-\Contrast to 57% of the fathers and 63%-e-the mothers
I
in the working class sample reporting such use. Similarly, '81% of the
professional faJthers in comparison to 50% of th-e less_-than-high-school-
, i
educated-father reported usjng TV as an educational aid. While these data
suggest that parents-who already have a demonstrated concern for educational,
i .,
achievement report using television for educational purpotes, an'alternative
interpretationis that the higher educated interviewees'weft more sensitive
or alert to he social desirability of their responses. However, Dervin
(1970) also eported that youth from lower income,and from Black families
experienced f1es s parental control of viewing. Further, -Bower (1973) repor;ted
'-that collegle educated parents were more likely to control their, children's
television viewing than parents with a grade school education.
Parental Mediation
An *portant issue in families' educationaf uge of television is
14

that several studtes have found parents as well a's parent surrogates can
be very effective in enabling c011dren and youth, to better understand and
more realistically interpret television content. Perhaps the earlieSt
study to suggest that adult co-viewing with a child can change the impact
of televiSion content is one by.Hicks (1965) in whin an adult's comments
(either positive or negative) about a program portraying the use of violence
affecteTthe degree of aggression exhibited by children in a post-test
situation. Children who viewed the program with an'adult who made positive
comments'about the televised violence showed more aggression than children
who.heard the adult make a negative evaluation of the televised violence:
.0ther evidence of the significance of positive.impact of family verbal
interaction-during viewing is found in, Bogatz and Ball's (1'971) first-year
eNmluation of SESAME STREET: children who watched andlearned more came
from hoMeS where the mother watched the prograM with the child and lihere
the mother talked with the child about the show. Later, Salomon (1974)
found tha.t, when mothers were encoUraged to watch SESAME STREET with their
children for two hours a Week,, the children (particularly the lower-SES
group) developed more of the specific cognitive s-kills the-programs were
designed to teach.
The literature further supports the notion that other adults can affect
what a child learns and retains from television content. Singer and Singer
(1974) int uded in.one_of_their_treatment groups an adult who involved
-herself with the on-gofng program and who.called the Children'S attention
to specific points'. The.3- and 4-yearolds in that group gained significantly
more knowledge from the'episodes of MISTER ROGERS than did other groups.
, In 1976 James WallingpQrted results of a study in which effects
upon first-grade children wh.oSe mo ers interacted with their Child during

routine televiSion viewing were contrasted with effects upon children in
a "non-interaction" group whose mothers were present but who did not interact
during viewing, and in contrast with effects upon children in a "control"
group,who did not view television during the experimental period. After-
the one-week experimental period, children in the interaction and the non-
interaction groups had acquired a greater\ability to complete social problem-
\
solving tasks, This was interpreted by Walling to-indicate an important
positive,. social learning aspect oftelegii programming. In addition,
the gain for the interaction group was subtantially greater, which indicates
that mbthers can successfully mediate teleVision content. Although the
Wailing study is important, it suffers fromsome methodological weaknesses
andefrom a very small sample size, i.e., frdM seven to nine children in each
group.
A study to explore further adult mediation of TM was conducted by Corder-
Bolz & O'Bryant (1978). Sixteen boys and sixteen"girls who were 4 to 5
years old were randomly assigned in same-sex pairs to one of the two exper-
imental groups. The children watched an episode from the ADAM-12-series
and commercials used at the time the showEwas aired in the early spring
of 1976.- The ADA11-12.series is consideqd to be a family-hoirr program and
isnotableforitslackofviolenceandiits orientation towards children.
-The articular show used dealt with children being truant from school and
"/subsequently getting into trouble. j
In the first.group, pairs of/Ildren-watched the_30-minute episode
with a wellliked preschool teacher who made neutral comments about the
programH(e.g., "Let's sit here and watch a TV show."). In°the second'group,
pairs of children watched the same ADAM-12 episode with the same pre-Stfibbl
teacher.who made general explanatory comments (e.g., "Oh, no, that boy is
rlf.
16

in trouble." "He did not go to school when he was 'supposed to." -He was
playing hookey and that.is bad."). The children who watched the program with
the preschool teacher who talked about the program content showed a highly
significant increase in their knowledge of specific details of the progra
an intrease in their general knowledge of truancy, a decrease in ersaleous----'
1.)knowledge of truancy, and an increase in positive attitudes. These respective
increases and decrases were still very much.evident on a one-week post-test.
-One of the least empirical, but most provocative, studies is by Safran.
(1976); this is the only study in the literature in which parents. made a .
'joint effort to control the number of hours gach day that their children;
viewed TV. For a four-week period, the parents of a 'group of 15 preschool4-
7
age children limited their child'S viewing to just one hour a day. The
parrnts kept diaries on, Wha e. happened as they curtailed their child's viewing..4
Positive effects were reported by almdst all the families in the study: a
Ance.passive small girl became less.shy and more outgoing, an over-actil'
and aggressive .boy became calmer and less hurtful to his pets, and, for one
school-age cAild in the.study, grades Improyed appreciably once hothework Was
,no-longer done in front of the TV set:, Most importantly, the families
experienced an increase in mmun-'intra-family activities, and found that,co.
ication between all members,of the family increased and imOroved.
Chaffee and Tims (1976),reported that higher parentAl control over
their children's televiewing and higher.parent emphasis on non-aggressive
.behavior resulted in lower correlations between viewing televised violence
and self-reported aggressiveness. However-, parental interpretation of_
televised violence in.one S'ample (N = 147) raised the correlation, but
in a second sample (N = 423) slightly lowered tha correlat4on:
. In an early study by thaffee, McLeod, and Atkin (1971) in which
/,01 7

'survey and interview'data were collected from junior and senior high school
students and their parents in 1968, the viewing habits and preferences
"of the parent and child (were found to be) related to the values emphasized
I.:within families."
.Atkin and Greenberg (1977) surveyed 721'children in the 4th, 6th and .
8th grades, and additionally conducted interviews of a random subsample of
'' --- 293 mothers of.:the children. It is interesting that 49% of the mother's of
I the 4th graders reportedproviding interpre'tatiOn of televise'd'physical
aggression. For the mothers of 6th graders, parental'interpretation dropped
to 45% and for the 8th graders, pdrental inte6retation declined to 36%.
With regard to televised verbal aggression, parental interpretation was,
reported for 49% of the 4th graders, 40% of the 6th graders, and 26% of the
8th greders. Interestingly, with high parental mediation, the correlation
between children's exposure to verbal ajgression and the children's Self-
.
report of verbal aggression decreased. However, With high parental mediation,
the correlatjon between televised physical aggression, and chi1dren's self-,
report aggression increased. 'For televised pro-social behavior, parental
mediation increased-the Ifelation between exposure and behavior. Perhaps
most important, higher parent-child co-viewing appeared to significantly
lower the correlatiOlis of exposure to televised physical aggression and tele-
vised verbal aggression with children's aggresslve behavior.
Television and Parenting
Finally, there is a limited literature on possible,parenting approaches
regarding television. Barcus (1969) repbrtedithat parents controlled their
child'.s television viewing for the following reasons: (a) that the child
may otherwise be PrTmaturely exposed to the adult world; (b) that television
18.
.

is less important than other activities (such as schoolwork and outdoor /
-play); and (c) that they were fearful that their children might imitate
behavior in programs with theme's of violence.
Rossiter and Robertson (1975) posit four possible areas in which a
parent can intervene and control the child's TV viewing:
amount or number of television exposure;
amount of,,viewing supervision (i.e., parental control of content);
,
parental co-viewing of the child's television viewing; and
parent-child Interaction, i.e., frequency of tntrafamily activ-
ities other than TV watching.
Leichte," (1980), in a large interview study of-families, found television
to be a significant component of many families' lives. She fuither found
four different parental approaches to "mediating" the use of thL, family
television: di-respve, censoring, limiting and scheduling.
,Lemon (1976) presented several parenting approaches to teaching critical-
vieu!Ing skills. One major-approach is discussion of the many issues related
to television content and television viewing. The coMplex concept of reality
as it applies to television content can be discussed with students. The
different patterns of stereotyping can be discussed with students, Lemon
indicates that "Parent/child co-viewing and mutual dfs,cussion is impdrtant
because parents are themselVes a primary outside gource of information" (p.. 3).
,Exposure to magazin newspapers and practice in discussing information
from them can further h p a student.determine the extent-of the realism
of television programs. Lemon also suggests that parents and children need
to learn "more about how and why television Vigrams are produced and broadcast
and then discuss what this suggests about the reality of program content" (p. 3).
O'Bryant and Corder-Bolz (1978) outlined six methods parents could use
to help their children acquire and use critical TV.viewing
t,.. 19

Limited Viewing, Parents can help their children become aware
of the role and place of-television in their lives-by limiting
the amount of time they view TV. While television viewing.is a
.legitimate activity, there is alma variety of other activities
- for all members of the faMily.
Content Control. ManY parental values can be communicated by
limitlng the kinds of programs children are permitted to view.
In some cases, parents may-wish to encourage their children.to
watch a program; in other cases, parents may wish to discourage
or not allow the viewing bf a program
Purposeful Viewing. Probably the most difficult viewing skill
to learn is purposeful viewing. Because of easy access to TV
programming and, in many cases, its congtant presence in the
home, many children find it "easier".to:simpiy watch television,
regardless of what is on, rather than engage in anothe'r activity.
Since this vieWing skill involves.the re-formulation of.personal
habits, it is often the sloWest to be acquired.,
°Direct Mediation. Parents tan directly help children in the
use of specific viewing skills. By providing explanatory or
editorial cOmments, a parent causes a child to naturally, per-
,/ ceive the programming in a larget4 context.
Indirect Mediation. Parents "can modelcritical viewing skills
by%discussing and'evaluating the program:With a spouse or older
child in the presence of their children. 'This unintrusively
,teaches children not only how to critically view television but,
more important, that television should be viewA critically.
Springboard Technique. There are many applications'and impli-
cations of television relevant to contemporary and personal ,
situations. Television programming presents a wide rangeof
human situations such as cheating; stealing,'Orug abuse, and
pre-marital, sex. A TV program can be used as'a neutral setting'
for a parent to discuss a sensitive issue. As a consequence,
the child or adolegcent not only sees television as a.source of .
information and cultural value, but also sees those ideas and
values in a:larger and more mature context.
Models of Family Use'of Television
iBased upon the available data, it.appears that there are at least ten
,
different models of family use of te/evision. All of these approaches.to
use of home _television are probably further modified by a number of famfly.
characteristics. In addition, the ten models are not necessarily mutually
A

exlcusive, in that a family may incorporate two or more into their family
lifestyle.
La,issez-:faire: Parents don't regulate or control children's television
viewing. Withinthe limits.of school and bedtime schedules, the
.children mostly watch what they want to, jahen they want to. There of
course is usualTy a "negotiation" process to decide which program to
watch, though some children do have their own TV.
Stritt TV rulet: Parents eStablish and enforce TV viewing time limits
and content censorship.
Babysitter: Many parents appear to use television as a convenient
babysitter while they'condudt other family activities such as cooking
or cleaning.
i Tension avoidance: In at least some families, television viewing has
been found to be a family method of preventing or avoidihg family
tensions and hostilities (Rosenblatt and Cunningham, 1976). This may
be supported by the conclusion of Chaffee and Timt (1976) that adoles-
cents watched more teleVision if they had troubled interpersonal Te-
lationships. Murray (1972) and Bailyn (1959) repoked,data to support .
suCh an interpretation. But other studies have provided contradicting
; data (e.g., Lyle and Hoffman$01972'; Chaffee and McLeod,-1972). ;
Background noise: Medrich (1979) rePorted data which- supports the long
suspected notion that in many families, television, most of the-time,
is not watched but merely provides background noise.
*Television addiction: With many individuals watching morethan 40
hours of television prOgramming per week, it appears that the term
"addiction" may be,appropriate. Some appear to experience withdrawal
symptoms when denied TV (Winn, 1978). It has been reported that on
the average,.when the home TV is broken, it is fixed or replaced within
three days, .
Family entertainment: For many families, teleVision provides convenient,
inexpensive, and sometimes high quality entertainment.
At home education: From several studies, it is clear that some fam-
ilies use television as a means to supplement a child's formal education.
Family co-Oewing: For many families, evening television is one of the
few opportUhities for a family to;be together and to do something-to-
gether. Afong with Um/ling, campingapt-a few other activities,
television ts s6en as something the whole faMily can enjoy..
No TV or limited TV: A very small percentage of American families
has no television. ,In interview with parents of families with no
television, it lit often reported that having no TV in the home Was an
overt, hostqe and desperate,decision to liNe life without television.,
However, there are also many-famaies who are so,busy with-community,

school, social, and job-related activities that they have little timeor interest in television fare.
_
There is little data on what kinds of family processes are involved in
(determining family use of television. Chaffee, McLeod and Atkins (1971)
reported that perceived family cOmmunication emphasizing social conformity
and self-expression was related to higher viewing of news programs and
lower viewing of entertainment programs. Lyle.and Hoffman (1972) found
6th gi.'aders high viewing to be related with reported low frequency of parent-.
child discussions of current issues. In a large questionnaire study by
Corder-Bolz and 01,Bryant (1974),,three basic familY processes were found to.
.determine family usage of television.
Authority pattern: It was generally found that patriarchal familieswere more likely to control children's viewing time and content but
tepromote co-viewing or educational use of TV. Matri-
archal_families were found to promote at least sibling co-viewing.Egalitarian families were generally found to-watch the least television
but to watch the most educational programming.
Family organiZer: It was found that the family authority figure wasnot necessarily the family "organizer". In some families, the fatherhad the most authority, and established the family rules, organized
family activittes and planned family activities._ However, in many .
families, the father may haVe been the authority but-it was the motherwho organized the family. Usually it was the family organfzer whodetermined the educational uses, if any, of the family teleyision..
s
Child rearing: Several child rearing practices were also fOund to be
related to families' use of television. Strict vs loos_e_dfscipline_
practices and encouragiNg individuality-vs. authoritarian child rearingpractices-were "highly related to.parentalscontrol of the amOUnt,and
content of children's television viewing.1
In additiOn, there appear several other salient family variables. Family
structure prObably has a strong influence on home use of television. For
example, single-parent families mould be likely to use television as a baby-
.
sitter; in contract; extended families would likely have more co-viewing.
In addition, the number of children in a family also would influence the
amount of co-viewing and the total time the set is on. There are also some

imi tecV data which suggest that _family television usage patterns vary as a
funetfon of-the- famil-iesl_ethnicityand income., parenta1 education, and type
of _habitat (i .e.., urban, suburban, rural ).
.
23

RESEARCH HYPOTHESES
The literature suggests there may be three general categories of
family-related variables which affect the educational outcomes of children's
television viewing experiences.
1. Family parameiers It is hypothesized that the demographic
variables of ethnicity; hbUsing environment and family structure
ctly influence-(e.g., family structure) or reflect ottier
influential variables (e.g. ethnicity and housing environment)
that affect families' home television viewing.environment and
-families'.home television viewing behaviors.
There.is at least limited evidence, for example, that children in'
\Mexican American. families'are more likely than chijdren in An-glo and Black,, ,, ,
families to view television With theirl parents.- Families in urban environ-
ments appear to,view television more than families in suburban and rural
environments. hildren in families with a single parent appear to watch
television alon more than,children in families-with-two-Rarents:--Ad-diffeinally,
the number of children in a family, the age of the oldest 'child, the family's
income, and the ducation of the parents appear to affect a family's tele-.
vision viewing h bits and behaviors, and appear to affect the extent and
a
nature of the pa ents involvement in the children's television viewing.
2. Child arameters. It is hypothesized that a child's- age will
direcqy influence the kind and number of television programs
which are viewed and the nature of the educational benefits
derived from viewing television programs.
There is dir ct evidence that a child's,television vie i g preferences
and habits are to a .larg, extent a prodpct of the child's age. Further,

there is limited evidence that a child's sex influences his or her television
viewing preferences and habits.
3. Parental involvement. It is hypothesized that the nature and
extent of parents' involvement in their'children's television
viewing directly influences the educationerquality of-the
children's televisiOn viewing experiences.
There is Substantial evidefice that parent-child.co-viewing, parent-
parent and parent;cbild conversations about television content,.families'_
television NieWing, and families' reasons for teleVisioh'
viewing are important determinants of the content and complexitY of a
child's learning from television.programs. The major unanswered question
is that of how many parents are involved in what ways with-their children's
television Viewing.
a
re)

_ MET HO DOLO,GY
The scientific methodolpgy to be used in a study o'f families use of
television is a-serious andcontroversial issue. .
.
There is little question that self-report is a good measure of'sOthe
things .(e.g., attitudes and. olpinions). However, there is growing concern
that the kinds of data needed to understand television viewing in the home
can not be obtained through self-report methodologies. Much Of television
viewing behavior is out of awareness and not available for accurate\recall,
.and thus can not be validly measured by self-report instruments.
The occurrence of differences between parental perception and cn,ild
perception of the most basic issues (i.e., what is watched and when) as well ,
.as more cOmplex issues such as the nature and f:requency of interaction*hile- .
,
watching TV is an important-example of the questionable validity_of se*
. report data. Greenberg, Ericson, and Vlahose (1971), for instance, repor.ted
that mothers claim more family interaction occurs while watching. Martin\
and Benson (1970) found mothers claimed less viewing by their children, \
stricter rules, and more co-viewing than their children reported. The're
apparently is even little agreement in individua) famllies as to what tele- \
vision behavior is or means. Self-report, then, of television behavior is
of limited use in reporting aFtual behaviOr,as opposed o perceived,behavior.\
There is a clear need to conduct in-the-home observational studies of. .
how families use television. However, only three studies (Bechtel, Achelpohl,
& Akers,-1971; Frazer 4 Reid, 1978; Lull, 1980) have attempted to obserVe
im situ family TV viewing patteens. Bechtal et al. videotaped and then
classified famil§members' behavivs according,to the degree of attention
--
k 3 r)
26

paid to the TV set. However, Bechtel defined "watching TV" as eye contact,
which oversimplifies the complex act of watching TV. The importint contri-
bution of the Bechtel study is the Observation that "... watching television
is not a behavior in its own right but is a mixture with many theeads of
which the viewer seems only partially aware. ...Te+evis'ion Oewing does not
occur in a vacuum, it is always to some degree background to a complex
behavior in the home."
Frazer and Reid (1978) suggested that television is a social obfect
like any other which can be manipulated by the vieWer for any number of
social ends. In an in-home participant observation study of children's use ,
of TV commercials, they found that children did not generally-pay close
attention to commercials because of the product or for consumer information-
.
seeking, 60t used comMerciaTs as an opportunity to initiate a desired inter-
,
action within the family_setting, and 4n generalmani-pulatedTV-reSsages
for their own ends, such as singing and playing games. These, findings are
notably different from laboratory exper'Ilental findings regarding the effeCts
of television advertising (e.g., Ward, 1972; Atkins, 1975) While the focus
and the sample,of Frazer and Reid's study is small', ihe contextUal setting
and participant observation methodology suggests a useful approach tO under:
standing total family use ofTV.
The alternatives to self-report appear to be direct observation and
indirect obseryation (e.g., videotaping). An inescapable problem of obser-i
matimmethodology is the impact of the observer. In an open social environ-
ment such as a street corner and even a semi-closed social environment,
the impact.of an observer can be minimized. However, in a home setting,
the social environment is a closed setting. When another person is added,
the participants respond to and accommodate the addition. By the very
27
kj

preence of another person, the data collected by an observer is unavoidably
dis orted. Serious questions have ta be raised as to the generalizability
of the data.. Another problem of participant observation retrieval has been
ttlat replication of findings is difficult, if not impossible, particularly
Ince the'data observed at a particular-time by a particular observer may
t be opserved by another observer at another time in quite the same way.
A Studiof Methodologies
Alack of methodological develOpment has seriously flawed. many 'studies
and directly inhibits further growth in the field. ,Existing data suggest
not only that tacial desirabi.lity distorts Self-report data via questionnaire,,
interview, and diary methodologies1 but also that people are largely unaware
of how much TV they watch and of what_they do-whilewatching,
To prepare for an extensive study of how families pse television
conducted by SEDL in FY 1981, these methodological questions needed to be.
resolved. Specifically, an adequate methodological approach needed to be
developed to permit the subsequqnt collection of valid and generalizable
information. To determine the strengths and weaknesSes qf the several '
potential approaches, several different methodologies Were comparatively
eyaluated.
'During FY 1980, SEDL conacted a methodologicalstudy of families'
use of television. -Eight methodologies were developed and assessed:,
(1) questionnaire, (2) diary, (3) interview, (4) direct experimenter obser-
vation, (5) experimenter observation via telephone,.(6) observation by family
member, (7) audio recording, and (8) video recording. It was hoped that the
A
datawould provide the basis for a comparative evaluation of the nature of
the limitations of each metholodogy, and a determination of which methodologies
28

would be most appropriate to stut particular kinds of variables.
The methodological study was gonducted on family use of teleyiSion
utilizing the eight different approaches, some relatively novel, some well
known. Four variables constituted the focuSaf the study: (1) which family
members watch televisiOn, (2) what else famlly members 'do.while watching,
(3 ) wha talks to whom whlle watching, and (4) what is the content of family ,
verbal interactions while watching.
Four major conclusions were derived from the 1980 methodological study.
Conclusion 1. Much of a- family's TV Viewing is out of awareness.;
Furthermore, for many families, TV yielding is done in a muchJarger context
of the family members' individually and\gallectively conducting family
business, The television is often a part of the background given_occasional
attention by most fEmIll-meMberS. While tei-e-vision "viewing" is a part of ,
many familiesflife styles, mugh of the viewing behavior is secondary\to
:\other ongoing activities and thus mostly out of awareness jherefore, when
people are asked about their TV viewing behavior'through such methodologies
as questionnaire, interyiew, and even diary, they, are being asked about a
,part ,of the family interactions whi-chis xelatively minor and not given mug
forethought. These metho6ologies,in effect, ask the subjects to retro-
spectively create the events th , were not eventful at the time. The data
froth these methodologies:appear not to proyide reasonably accurate information
regarding what happened.=;7
Conclusion 2. There are large differences across families as to 6ow
families Use television. The research 6n family use-of TV reflects a finding
of the larger field of family research that there is;no single concept of
famTly. Along most major dimensions, virtually eveiy family is different.,
The variance of family use of television appears taexten6 in many _different
29

directions, including family size, fami' structure, parent employ ent, parent
education, ethnicity and .houging patterns,,as well as parental attitudes-'Ek
and child-rearing. pna-CticeS' .:;:T.teTefore,- a description of hoW-r 'lies use-. -
television muSt be based "Opon'data gathered from many kinds of fpilies..
Insights and generalizations based Upon a few families clearly w ll not'_
accommodate the many ways families use TV.
'Conollision 3. The introductiOn of an observer appears to change the
/family interacticin patterns.. 'A fundamental assumption of obqrvation methodo-
/
logies is let the observe, can, with practice and training,/collect data
twithout his or her presence biasing the phenomenon'being obsrved. In
-7
open social systems such as street corners,-as well as semilclosed social
systems such.as classrooms, the assumption appears to be cdrrect. However,
in closed social_ systems_such_es_a_famiWsl_hOme,._theidata suggest that the
assumption is rarely', if ever, reasonable: In a closed s cial system,
!
/every person accommodates every other person present!. T e introductiOn of,
another person, even a non-interested observer, caues a change in the
behavior of everyone.I ,
Conclusion 4. Most families prove,to be vey resjistañt to the obser-'.
vational methodologies, such as staff observation and yideo observation.f
Less-than 5t of the people cOntacted would eveniconsi er participating in\A
the staff observation. Therefore, a serious question is,raised regarding. / 'i ._ ,/
the generalizability of observational data c011ected/fromfaiiiilies who do1 I
volunteer for observational studies.I
The best compromise methodology appearedtto be the.telephone observation.
The data generated are very similar to that Oenerated by the audio tape
and .1cleo tape observation methodologies. Furthermore, the volunteer rate
s very high, over 50%. Finally, the te1eOhene_obse6ation methodology

can economically meet the need for large, even national,-samples of families.
Therefore, ft was concluded that,the telephone observation combined with
questionnaire is the best methodological approach to developing a descriptive
data base regarding families use of television.
3 7:31

Pilot ctudy
In pall 1980, a preliminary observational study was conducted. A
combination of the telephone.observation and questionnaire methodologies
was used. Questions were asked using the telephone about the immediate,
ongoing oe-recently occurrinsr.tamily activities, especially regarding'tele-
"tyt.
PROCEDURES .
vision viewfng. A 25-item interview schedUle was used which requiredapprox-
- .
imately six minutes to complete,over the phone. A follow-up questionnaire
was mailed to obtain information on questions of a more gene'ral nature, such
as "What programs do your children vtch for edUcational purposes?"
The households were 'randomly selected from.the Austin, Texas, telephone
directory. Random digit dialing was explored; however, the use of the
subject's name to initiate the phone conversation substantially increased
the participation rate. .Each hoUsehold was ca1lecrbetween_7:00 p.m. and
9:00 p.m. on a-Weekday evening (i.e., Monday,'-7uesday, Wednesday, or,Thurtday)v . .
While there it' considerable interest in famil use of televisio on the
weekends:and during the day and afternoon on the weekdays, it Would have
been impossible to study all the majbr:viewing times. To make the study
feasible,"the prime time viewing was'selected as being the most important.
Further, family TV viewing patterns during the day. of Saturday and Sunday,
and on the evening of.Fri'day, Satarday and Sunday appeared to be different
from the weekday evening viewing,pattern, and data from the different viewing
periods should not be mixed_ Thus, the study was restricted to 7:00 p.m.
to 9:00 p.m., Monday ,through Thursday.
A total of 1,722-hoUsehOlds was included in the study. ApprOiimately
-28%--p-atticipated-and-14%-re-fused--:.4_par_t_i_c_ipate.After three attempts, no

answer was obtaine.,d from 31% of the households, anA for another 27% the phone
listing was no longer correct.. Of the 484 participating households, 44%
were householdS with two parents.and at least one child, 3.5% were single-
parent with at least one child, and 53% were households with no children.
The observed proportion of Single-pareht families,is substantially below ,the
proportion in the community. it is possible that many of the 31% "no answer"
households were single-parent families. Another,possibility is that a very
large proportion of the single-parent faMilies does not have their telephone
number lista.
Almost 80% ov the two-parent families were watching televisioh when
alled. Another 19% were not watching television and appyoximately 1.5%
did not have a'television. Interestingly, a relatively high percentage of
the,/ two-parent families, 1'3%, reported a conversation-,Abotft the television
*gram immediately prior to the phone call. Another 17% reported conver-
sations uhrelated to the pr*ath. It was found thtNirtually all of the
conversations about the television program were not with regard to the content,
e.g., wanted to -change the channel, wanted to know the score, and "Anything'
else on?"
It is interesting that in almost 50% of the households with chtldren,
the children were not vtewing television. Of those children who were viewin
60% were involved in no other activity, while the other 40% were also in-
volved primarily in homework, reading, eating and blaying activities.. It
is also interesting-that of the children watching televiSion, almost 70%
were watching with a parent.. Thus the opportunity for parental commentary
during televisiOn vtewing is likely to be present in many, families.
;
.33

StUdy of Families' Educational Use of TV
Based upon ;:the results of the Fall 1980 pilot Study, several changes
were Made for tha Spring 1981 study. The telephone Observation questions
were changed to attempt to retrieve more in-depth information about those
relativelY rare events of families using television in a manner that would
educatiOnally benefit their child or children. Because.two educational-use
acti'vities were of particular interest, viewiweducationali prograM and
parental commentary during viewing, severaollow-up questions were added.
.Variables. The primary variable was the educational uses of television .
in which -families are involved . ln the hope of developing a more coMplete,-
,understandfng of how families educationally-use television and thefamily
.processes that, lead to faMily edudational use of televisiOn,the-te ephone,.
obServatton methodology was used to obtaiwdata, on the following queStiOns:, ,
,...What program is being viewed?I
Who is viewing the program?
Who selected the program?
Did the familiplan to watch.tne. program?
.DOesthe family usuallywatch. the program?
What other activities are occurring?
'i-laVe there been any'commen,szor discussion about the program?
If yes, who said what to whom?
Is there usually this kind of discussion when'the family views
thii program?
The telephone interview was also used to gather basic deMographic information,. '0
Although demographic informatien was additionally collected with the ques-
tionriaire, because the return rate of the questionnaires was expected to be ,
about 60%, demographic questions Were asked during the telephone interview
to obtain at.least basic'demographic information on 100% of the partidipants.
N I
4 11

-"
Information was collected on the following demographic variables:
Relationship of household members to head of household.
-Employment status of mother:
Education of parents. -
AO of parents.c.
Age and sex of children.,
- .Typl of neighborhood (urban, subur an, rui-al).
Finally; the opestionnaire Was used to collect information on general tele-
wrston viewinghabits:1
Average number of hours per day each 'child watches television.
4 1
The tt0e,limitson the children's TV Viiewing.11
iTbe content limits on children's TV viewing.
,I, ,,
Educatilonil programs usAllyviewed.
Informative programs utually viewed.
Co-viewipg patterns.
How'provams were selected.
When the television is usually turned on.
How deOision is made to turn on.
What attempts do parents make to explain program content to
their chil,giren?
The'frequency of parental commentary and explanation.
The'frequency of family, discussion after viewing a program.
What programs have prompted a family member to pursue the subject
of the program further?
Sample. The data.from the pilot study suggested that there is 'great
variance among families regarding family use of television. Furthermore,
how any famiTy uses television appeared to be dependent upon the family't

structure, ethnicity, values, and housing environment. Therefore, a large
sample with representation of Anglo, Black, and Mexican American families,
and families living in urban, suburban, and rural locations was selected.----
.
Given the complexity of the phenomenon and the relative uniqueness of each
famiTyLS,,use of television, the sample_of 400 or more participating families
was judged%to be necessary to provide sufficient representation Of each
major television viewing constellation.
Instruments. The telephone interview schedule and ttr questionnaire
(in Appendix A) were revised based upon the experience of the Fall 1980
r,piVot study. The-telephone interview requiyed.about ten minutes to execute,
. The revised questionnaire was expected td require approximately the same
amodbt of7time...-
Three hundred;Aelephone nubbers were/randomly selected'fromthe tele-. . .
phone" d1rectoi1es of 14 .areas inthe SouthwestAncluding Austin, Abilene;
HoustOn, Dallas, Corpus Christi, Waco, San Antonio, and Fort WorthrTexas;
Baton Rouge and Rougon, Louisiana; and Los Alamos, White Rock, Albuquerque,
and Santa Fe, New Mexico.. Additionally, the Houston Independent School
District provided a list of"20,600'student nam4/ With their parents name
and home telephone number:from which families were randomly selected-:'
The calling procedures were outlined ij the telephone interview
schedule:
. Hello, my name is and I'm calling from Southwest Educa-
tional Laboratory in Austini,.Texas. Weare conducting a national
telephone survey om family/TV viewing and would like to as you
aJew questiohS. Would that be all right? '
Is your TV on?: .
If TV is on, what program is on?
Did anyone say something in the two minutes before the phone rang?
How many children do you have living at home?
.36

-,What are their ages?
If nO chillen or TV not on,i,say "Thanks, goodbye:"/-
Who is Wayching.at least part of the program?
Are they/doing anything elSe?
Who,selected the program?
1.
Did yoll plan to watch.thefprogram?
Does/your family usually watch this program?
HaVe there been any commehts'or discussions about the TV programsince the TV was turned bn this evening?
If yes,' what?
yes, who was talking r listening in the discussion?
Is there usually (this 'kind of) or (no) discussion when your
family views this progra
WhY is your family watch ng this-program?
Do you think.your childr n are learning something from the program?
What are they learning?
We would alsb like Was]k a few background questions. These are
just voluntary./ -
How many/TVs.are inxymir. home?
What is your household structure?
Does the wife work outside the home?
,Do you live in an urban, suburban or rural neighborhood?
. Would you describe yourself as white black, Mexican American? ,
Thank you for helping us with our survey. We would also,like to
send you a more detailed queStionnaire on your TV viewing habits,
which would contain the same.types of questions. In return forfilling but-the questionnaire, we*will send you a free set of
parenting materials which contain activities such as games and
stories for you and your children. May we send you a qUestionnaire?
If yes,subject's correct address and zip code (explain subjects
are Obtained at random from the phone book),.
.Thank you.
'37

The major change.suggested by the pilot study was to determine early
in the phone call whether the.household had'aRy. children. If the houSehold
;-A4d not, the call was terminated and the household was dropped from the
sample. If there was no answer on the first attempt to reach a household,
two more attempts were made.that evening.
Sampling Procedure. A total of 4,200 households were randomly selected
from telephone books of cities and towns in the Southwest. Random digit
dialing was explored; however, the use of the subject's name to initiate
the phone conversation substantially increaed the participation rate. Each
househoTd was called between 7:00 p.m. and 9:00 p.m. on a weekday evening
(i.e., Monday, Tuesday, Wednesday or Thursday). While there is considerable.
interest in.family use of television on the weekends, and during the day
nd afternoon on the weedays, it $qoUId have been impossible to study all
the major viewing times. To make the study.feasible-, the prime time viewing
was selected as being the most important. Further, the\Wielson data
strongly indicate that television viewing patterns during the .day of
Saturday and Sunday, and 'on the evening of4riday, Saturdayiand Sunday'
appeared to be different from the weekday_eyening viewing patterns, and
data from the different viewing periods 'should not lib mixed. Thus the StUdy
'Was restricted to T:-00_ .m. to 9:00 p.m. Monday through 'Thursday.
Three hundred telephone nUm lyseretted from each'of the
telephone directories of 14 areas in. the Southwest, including Austin,
Abilene, Nous , Dallas,;Corpus Christi Waco, San Antonio, Fort Worth, Texas;
Baton Rouge and Rougon,;Louisiaha; Los.Alamos,Albuquerque, White Rock, and
Santa Fe, New.Mexico. !kdditionall.Y,'.the,Hodston Independent'School District
.provided.a li5t'pf 20000 student,hames with their parents' name andhome
telephone number from Oich,300,famil1es were randomly selected. Austin',
Corpu's Christi', San Antonio, Fort Worth, Baton Rouge,

--AlbuquerqUeand-Santa Fe were selected to provide representation of
_famflies in large cities 'and suburbs. Houston, Dallas and Fort Worth
were selected to provide representation of black families. Austin and
San Antonio were selected to provide representation of Mexican American
families. Abilene, Waco, Rougon,,Los Alamos and White Rock were selected
to provide representation of families in rural settings.
The teler4one lists were randomly distributed to the interviewer's
I. who called the phonejiumbers as time permitted. If there was no answer,
up to two additional calls to the number were conducted that same
evening. Thus-the total sample size.reflects the number of families called
rather than the number of.calls made.

RESULTS .
/f
A total of 2,922_KOusehold phones were called/. Participat;ag households
/
numbered 1,298; another 563 households refuse4,4 participate, with another
470 phones ho longer\operating and 591 househops not at home. Almost 500 o
the participating households had children living at home. A total of 443
households had children at home-and were VieWing television.
Approximately 65% of the 443 households with children and the television
on-were Anglo.. Another 12.4% were.bla0, and 14.0% were Mexican American;
Approximately 29% of the sample liv-ed'in an'urban setting; with 42.4% living
in a suburban setting and 17.4% 10ing in a rural setting. For-15.1% of.the
.households, the oldest child was between 1 month and 5 years old, and 18.1%
of the households had an otdest child between 6 years and 9 years old. For
30.0% of the households, the oldest child was between 10 years and r4 years
old, and 31.4% of th households had an oldest child between 15 years and 17
years old. /
APproximately 81% of the households were two-parent families. Another
he households were single-parent families and another 3,8% of the
households were classified as "other."
Of the 443 participating households with'children and the television on,
11.1% reported a family conversation "in the two minutes before the phone
rang" regarding the program or commercial. Another 20.1% reported a family
conversation regarding a topic other than the programming being viewed, In
/ approximately 69%_of the households, there was no observed conversation. 1
These data indicate that there are no family conversations during 69% of the
,
jamilies1 viewing time. Further, conversations about the programming Occur
It
39

approximately 11% of the families viewing time.
In a first special analy is based upon a sub-sample of faMilies with at
least one child 14 years old or younger watching television, it was found
that in almost 52% of the households a child was reported.to have selected
the program. APproximately 60% of the households hid planned or "sort of'
planned to watch the program. Approximately 6-2% of the families reported
that they usually for 'sometimes watch.the program.
.One of the most important aspects of the study,is the observation Of
family disCussions during family television viewing, In thi4 first special
analysis,"it was found that 23,6% of theifamilies had made comments about the
television programming that evening. Regarding those families, who did report
conversations about the programming, 66,c% were reported 4 being parent-
child conversations, 16.1% were reported as being child-child conversations,
and-8.9% were reported_as being parent-parent conversations,
In this first special analyaia; it was found that 63.7% of the families: .
reported they were'viewing the program for "entertainment" reacnns. Another.
10.5% of the families reported they were viewing the program for "educational"
reasons while 14.8% of the families reported viewing as "something to do" and
another 9.3% of the families did not know why they were viewing. Almost 50%
pf the families reported that their children viewing the program were not
learning froM the program. Approximately 27% of the families reported that
their child or children were learning from the program; and another 16% re-
ported that t'heir children were "maybe" learning from the program.
A second special analysis was conducted using a sub-sample qf families
--with at least one child 9 years old or younger watching teleiisio n Csee Tables 1
through 38). This sub-sample waa composed of 81 Anglo famllies, 19 black
40

TABLE 1
Second Special Analysis*
Families with Children andWith Television On By Ethnicity
Ethnicity -
Anglo
Black
Mexican.Ameilca6
Other
No Response
No. of.
kespopses
81
19
19
Percent. of
Sample
2
66.4%
1M%.15.6%
0.8%
1.6%
Total 122 100.0% -
*Sub-sample of 'families. with at least one child 9
years old or younger watching television.

families, and 19 Mexican American families. One family was categorized as
"other" and two families did not give,their ethnicity, bringing the sub-sample
to a total of 122 familieS-. Thirty percent of the families lived in,urban
settings;-44% of the families lived in suburban setting*s and 21% liVed in
rural settings (see Table 2). Eighty-one percent of the families wern two-
parent families and almost 14% were single-parent families. Another 4.9% of
the'families were categorized as "other" (e.g., child living with grandparents
or child living with two.adults of the-same sex) (see Table 3).
.
Children's co-vieWing television with a parent or sibling is an important
d Mension of children's television viewing behayior. If a. child is viewing
-
a television prOgram aione, then there is no opportunity for diredt verbal
interaction regarding the program content. Thirty percent of the families
reported that, at the time of the telephone call, a child was watching tele-
vision alone. Anothdr 21% reported that a child was watching television with
a. sibling or siblings, and 48%.rePorted that a child was watching television
With-a parent or parents (see i'sble 4).
.!
Inithe Anglo portion of the sub-samp1v*-y51% of.the families reported that
a child wes viewing television with a parent or, parents, while 17% reported
that -child was vieOug,television with la siblind or siblings, and 31% re-
.
ported that A child was viewing television alone (see Table 5). In contrast,
almost 53% of the black families reported a child viewing television with a
parent or ,parents, while 26% reported aichild viewing with a sibling or sib-,.
lings, and 21% .reported a child viewing television alone. Thirty percent of
the Mexican American families reported a child'vig4ing television vitt' a
parent or perents, while 30%'reported a child vfewing television with a sib-
ling or siblings, and 40(reported a child vieWing televisfon alone:
41

HousingPattern
Urban
Suburban
Rural
Other
No Re Sponse
Total--
TABLE 2
Second Special Analysis*
Families With Children andWith Televilio.n, On by Housing
0 .
No: ofResponses
--37
54
26
1°
4
122
Percent ofSample
30,3%
21.3%
0.8%
33%
100.0% Yr.
*Sub-sarhple of families with at least one child 9
years old co,- Younger watching television.

TABLE 3
Second Special !Analysis
Families With-C,ildren andWith Television On byFfly Structures
Family ..'
..Structure!
No. cif
Responi ses
'..,.
Pergento//Sample:;,
/ 3. ----.
..
MSrvied ParentFamiljes\
,
.Single ParentFamilies;
Other.---__
,.)
99. .
llf 7
,
6
;.,',
4
.:
;..f.%
,
13.9%.
.
4.9%
.
X 'Total 122_ 100.0%---.......
*Subsample off families with at least.one child 9
years old or younger watchiric television.

- 75. ^
t
mr
TABLE 4
Second Special Analysis*
Fami ly . Co-Viewing
Fami 1 i es ' I_ --
\
--7-.
No. of
----Response.s
I
P Ircent.of
Sliniffi-
.
Child Alone
... Child withSibling(s)
Child with, Parent(s)
37 \
26
69
,
,
30.3%
21.3%
...
48,4%
Total,
122 100.0%
-
*Sub-sample of families with t least one child 9
years old or yoUnger watching television.

TABLE 5
,Second Spedial Analysis*
Family Co-viewing by Ethnicity
Familts.--.
'Anglo
Percent ofSample Black
Percent ofSample'
MexicanAmerican
Percent ofSample
Child Alone 25 31.3% 4 21.1% .8 . 40.0%
Child with 14 17.5% 5 26.3% 6 30.0%
Sibling(s) l
Child with 41 51.2% 10 52.6% 6. 30.0% '
Parent(t)
Total 80 100.0% 19
1
100.0% 20,
. 100.0%1 ,
*Sub-sample cf--tamilies wfih at.)east one child 9 years old or younger watching television.

/ .....
rn the urban portion of the sUb-sample, almost 46% of the faMilies reportedZ. r
a child viewing with a parent or parents,Qwhile 27% reported a child viewing
with a sibling pr siblings and_another_27%,_reported-a-ohild-viewing-a-lon-67---;
(see Table 6). Fifty-five percent of the suburban families reported alchild
,viewing television with a parent or parents', while only 7.4% reported, a child
viewirig television with a sibling or siblings, and 37% reported a,child yiew-
;
ing television alone. In the rural portioh of the sub-sample, 42% of the
famiVies reported a child viewing television with a parent or parents, while
;
almost 35%,reported a child viewing with a sibling or siblings; and 23% of
the families reported a child viewing television" alon-d:-
lIn the tWO-parenf-faTiviVIOrtion-of th4LS-Utansample4-'47% Of the families
reported.a-child viewing television With a parent or parents, while 20% of
,
the -Fsamilies.,:reported a child viewing television with sibling or siblings,
,1
;1 ,.,
a`rid another 32% reporfetr -a ,child vie-Wing alone (see, Table 7). Forty-se'ven
i .
"percent of the'single-parent families reported a child viewing television with
a parent, while 29% of the families reported a child viewing television with')
a sibling,or siblings, and another 23% reported.a child viewing television
alone,
The next critical issue is the oCcurrerice of,conversations during.tele-,,
vision viewing, Whether ablaut the television Content or about-other topics.
Almost 64% of the_famflies.:,reported that no conveKtations had,occurred,durfng
the VW0 minutes immed
, 25% reported conversa
almost .12%. of the. fa
being viewed...,
)\,
ately prior to the telephone call ,(see Table 8). Another
ions about topics not related to thd television, and
ilies reported conversations about the televisiOn content
'2

*TABLE 6
Second Special Analysis*
Family Co-viewing by Housing
Families_ Urbanl'ercent of
. Sample Suburban
P rcent Of -'Sample \ Rural
Percent ofSample
Child Alone 10 27.0% 20-- 37.0% 23:1%
,
Chitd-wttfr_ --10-7 27.0% 4 7.4% 9 34.6%
Siblfpg(s),
Child with' 17 46.0% 30 55.6% 42.3%
Parprit(s)
;Total 37 54 100.0% ` 26 100.0%
*Sub-sample of families with at least one child 9 years old or younger watching television.

TABLE 7
Second SPecial Analysis*
Family Co-fiew4ng by Families StruCture
FamiliesTwo
ParentPercent Of
Sample!
,
OneParent
Percent ofSample
Percent ofOther Sample.
Child Alone
Child withSibling(s)
Child withParent(s)
Total
32
20
47
99
32.3%
47.5%
100.0%'
4.
8
17 -
23.5%
29.4%
47.1%
100.0%
16.7%
16.7%
66.6%
100.0%
*Sub-sample of families with;at least one child 9 years old or younger watching televislon\.

TABLE 8
Second Special Analysis*
Family Cohversation
FamiliesNo. ofResponses
Percent ofSample.
Conversationabout Program
14 11.5%
Other Conversa- 30 24.6%
tion.
No Conversation 78 63.9%-
Total 122.
.
100.Q%
.-
*Sub-saMple of families with at least one child 9
years old or younger watching television.

In the Anglo portion of the sub-sample, almost 54% reported no conver-
sation while viewing television, while almost 30% of the families reported
conversations not related to the television, and almost 17% of the families
reported convers;.tions about the television content (see Table 9). In the
black portion of the sub-sample, almost 79% of the families reported no
conversatiOns while vieWing television; another 10% reported conversations
about the television content. Eighty-five percent of the Mexican American
families reported no conversations had occurred, while 10% reported conver-
sations not'related to the television and only 5%.reported conve-Sations about
the television content.
Im the urban portion of the sub-sample, 62% of the families reported no
conversation had occuriTd, while 27% of the families reporied conversations
not related to the television, and almost 11% reported conversations about .
the television (see Table 10). Sixty-one percent of the suburbamfamilies
reported that no conversations had occurred, while 24% of the families reported
conversations not related to the television; and another 15% reported conver-
sations about the television content. Almost 77% of the rural-families reported
that no,conversations had occurred, While 19% of the families reported conver(-
sations not related to the television, and another 3.8% reported conversations
about the television content.
In the two-parent family portion of the sub-sample, almost 64% reported
that no conversation had occurred, while 23% reported conversations not re-
lated to the television, and another 13% of the families reported conversations
about the television content (see Table 11). Almost 65% of the single-parent
, families reported that no conversations had occurred, while 29% of.the families
reported conversations not related tO the television, and another 5.9% reported
.43

, -TABLE 9
Second Special Analysis*
Family Conversation by Ethnicity
,.
AngloPercent,ofSample Black
Percent ofSample
MexiCanAmerican
Percent ofSample
.,
Program 14 16,6% 2 10.5% .1 5.0%
Other 25 29.8% 2 10.5% 2 10.0%
None 45 53.6% 15 79,0% 17 85.0%.
Total 84 100.0% 19 100.0% 20 100.0%
*Sub-sample of families with at least one. child 9 years old or younger watchingtelevision.
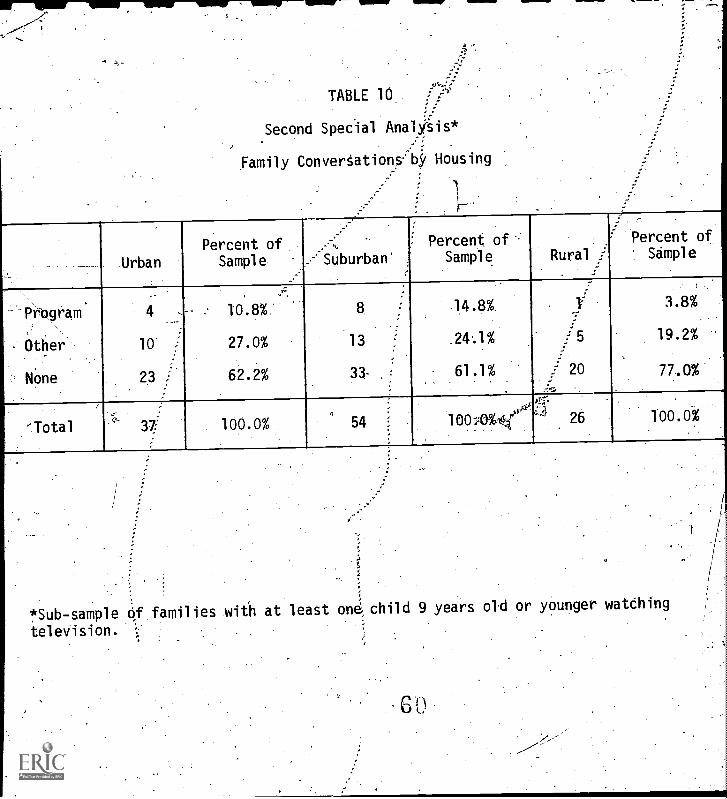
TABLE 10
Second Special AnalAis*
Family ConverSationby Housing
'F
Urban
Percent ofSample.
.
Suburban'
Percent ofSample Rural
Percent ofSample
--PfOgramc 4 10.8% 8 14.8%. 3.8%
Other. 10 27.0% 13 5 19.2%
Nixie 23 62.2% 33- 61.1% /20 77.0%
37 100.0% 54 26 100.0%
*Sub-sample of families with at least one child 9 years old or younger watdhing
television.

4.71111/11-11.--!.. 1111 .1110MO VOW IMMO
TABLE 11
Second Special,Analysis*
Family Conversation by Family Structure
^0
TwoParent
Percent of-Sample
OneParent
Petcent ofSample Other
Percent.pfSample.
Program 13 13.1% 1 5.9% 0 0%
Other 23 23.2% 5 29.4% 2 33.3%
Aone 63 63,7% 11 64.7% 4 66.7%
Total 99 . 100.0% 17 100.0% 100.0%
*Sub-sample of families with at'least one child 9 yers old or younget watching
television..t

convensation about the teleVision content.
Often, people view television while simultaneously engaged in other activL
:ides. However, almost 69% of the families repoi.i.ed that those who were vieWing
television were not engagedin any oeher activities.(see Table 12). Another
-
11% of the families reported one or more people were eating while watching
television, 8% reported viewers playing a dame, Z% reportedviewers also
doin homepork, while 4% reported other activities such as sleeping or grooming.
Data were collected regarding who selected the television'program being
viewed. More than 42% of families reported that tne parent or parents had
selected the program (see Table 13). Forty-three percent ofl-ihe families re-
ported that a 'child haCtelected the -program, and,almost 14% of the families
reported that nobody selected the,program being viewed.
In the Anglo portion of the sub-sample, 43% of the familids reported that
a parent had selected the program, while almost 40% reported tha.t a child
selected the program, and almost 18% reported that nobody selected the program
beinviewed(seeTable1/).Forty-twopercentetheblaafamiliesreported
a parent selected the program while 47% reported a child selected\the program,
and another 10% reported nobody selected the program being viewed.i Almost 37%
of the/Mexican Ameritan families reported a parent selected the program, while
63% of the families reported a child selected the prograM, and none, reported
that "nobody" had selected the program. ,
In the urban portion of.theAUb-saMple, 29% of the families reported that/1
a parent had selected thelprogrXm, while 54% reported that a child s lected.._ ,
the program and 16%-reporte,dihat nobody selected the program being lewed
/(see Tabie 15). Forty-eiOit percent of tqd.suburban families reporte parent
.//
selected the program, while 35% reported a child selected the program, and
44

TABLE 12
Second Special Analysis*
Question 14: "Are The Doing Anything Else?"
FamiliesNo. of
Responses
Percent of .
Sample
Homework 9 7.4%i,
Chores 1 0.8%,
Eating 13 , 10.7%
Playing Games 10 8.2%
Nothing 84 68.9%
Other 5 4.0%
Total 122 100.0%
,Sub-sample of families with at least one child 9
years old or younger watching television.

TABLE 13
Second Special Analysis
Question 15: "Who Selected the Program?"
FamiliesNo. ofResponses
Percent_ofSample
Parents 52 42.6%
, aild 53 43.4%
Nobody 17 14,0%
Total 122 100.0%
*Sub-sample of families with at least one child 9
years old or younger watching television.

TABLE 14
Second Special Analysis*
Who Selected the Program,by Ethnicity
Families Anglo
Parents
Child
- Nobody
Total
32
14
81
43.2%
39.5%
17,3%
42.1% 7
47.4%- 12
10.5% 0
100.0%-
19 100.0% 19
36.8%
63.2%
0%
.3 00.0% ,
*Sub-sample 'Of families with at least one child 9 years old or younger watching
television.

T1 ABLE 15:
SeCond Special Analysis*
. I
-Who Selected the Program by Housing
Fami 1 ies UrbanPercent of..Sample Suburban
Percent of.Sample Rural
Parents 11 29,7% 26 48.1% 12
Child 20 54.1% 19 35.2% 12
Nobod,y 6 '116.2% 9 16.7% 2
Total .37 100.0% 26
.Percent ofSamplk
46.2%
46:2%
7,6%,
*Sub-sample of families with at least one child 9 years old or younger watching
television;
_

almost 17% reported nobody selected the program being viewed. Forty-six
percent of the rural families reported alparent had selected the program,
while 46% reported a child selected the-program, and almost 8% reported nobody'
,
selected the program.
In the two-parent portion of the sub-sample, 43% reported a parent had
'selected the program, while 42%-reported that a child selected the program
and 14% reported that nobody selected the program being viewed (see Table 16).
Thirty-five percent of he single-parent famine§ reported that a Oarent se-
lected the program; while 47% reported that a child had selected the program,
and almost 18% 'reported that nobody, selected the program being viewed.
Purposeful'or planned'television-Viewing is an element thought to be
missing in most people's habitual television viewing. However, in thesub-.
sample, almost 57.% of the families reported that they had planned to watch
C
. the program (see Tabie 17), Another 11% of the families reported that they.
"sort of" Oanned to watch the program, while almost 30% reported that-they
.had:not pqnned to watch the program being viewed..,
In the'Anglo.portion of the sub-sample, almost 58%of the families,re-
ported that they had planneTto view the. program; While 11% reported they had
"Sort of" planned to'view, and almost 31% reported thatthey had not.planned
to view the program (see Table 18). Almost 'A% of the plack families reported
that.they had planned to view the,program, while almost 16% reported they had4
"sort.of" planned, and 10% reporfed they had not planned-,to view the program.
'' ./
Less than 37% of the MexiCan Arnerican families reported they had planned to
view the program, while another 10% repbrted they had "sort of" planned to
view, and almost 53% repOrted they had not planned to watch the program.
In the urban portion of the.sub-sample, almost 56% of the familjes
45
t .

TABLE 16
Second Special Analysis*
Mho'Selected the Program by Family Structure
3 FamiliesTwo
Parent
Percent ofSample
OneParent
Percent,ofSample ,Other
Percent ofSample ,
Parents 43 43.4% 35.3% 3 50.0%
Child 42- 42.4% 47.1% 3 50.0%.
Nobody '.14 14,2%- 3 17.6% 0 . 0%
Total 99 100.0% 17 100.0% 6 100.0%
*Sub-sample'of families with at least one child 9 years old or younger watching
tplevision.,4
(38

TABLE 17
Second Special Analysis*
Question 16:. "Did You Plan to Watch This Program?"
o'
1
FamiliesNo. of
Responses
Percent of-Sample
Yes ..
.
Sort of
No
No Response
69
14
36
3
56.6%.
..
'11.5%
, 29.5%
2.4%
.Total 122 100.0%
*Sub-sample of families with, at least one child 9 years
old or younger watching television.

---4MMEW UMW
TABLE 1.8 .
Second Special Analysis*
Planned to Watch Program by Ethnicity
Families AngloPercent ofSample . Black
Percent of, Sample
MexicanAmekcan
/ Percent of/ -Sample
Yes .45 57.7% 14 73.7% 7 36,9%
Sort of, 9 11.5% 3 15.8% '2 10.5%
No 24 30.8% 2 10.5% 10 52.6%,
Total ' 78 100.6% 19 100.0% 100.0%
*Sub7sample of families with at least. one chid 9 years old br younger watchirfg ,
television.

reported that they had planned to view the prOgram; while just under 6% re-
ported that they had "sort of" planned to view, and 38% reported that they
had.not planned to view the.program (see Table 19).- Fifty-five.percznt of
the suburban families reported that they ,had planned to view the program, and
9% of the families reported they had "sort of" planned, while 35% reported
they had not planned to view the program. Sixty-nine percent of the rural
families reported that they had planned to view the 'program, and 19% repOrted
they had "sort of" planned to view, while 11% reported that they had not planned
to view the program.
-In the.two-parent portion of the sub-sample, 53% reported that they had
.planned to view the prograM; and .13% reported they had "sort of" planned.to
_view, while 33% of the families repprted that they-had6not planned to view the
program (see Table 20). More than 70% of the single-parent famis-reported
that they had planned to view the program, and another'6% reported that they
"sort of" planned to view thelorogram, while 23% reported that they had not,
planned to view the pro ram
As-a-follow-up on the planned viewing question, families were asked if
they usually watch the program. More than 62% of the families reported that
they usually, watch the program being viewed (see Table 21),. Another 10% re-
ported that they sometimes viewed the program, and 19% reported that they don't
usually view the program.
In the Anglo.porOon of the sub-sample, 64% reported that they usually
watch the.program.and another 10% reported that they sometimes view the pro-
/
gram, while 26%-reported that they don't usually watch the program.(see Table 22).
Almost 89% of black families reported-that they usually watch the.program and
another 111 reported that they sometiMes watch the program, while none of the
46
,

TABLE 19
.Second Special Analysis*
\Planned to Watch Program by Housing
Urian
. . J.
Percent ofSample SubUrban
PercentofSample\ Rural
Percent of:Sample
Yes
Sort 'of
19
2,,
13.
55.9%
5.9%
38.2%
30
5
1.9k
i
55-.5%1
9.3%1
35.2%
18
5
3
69,3%
19.2%.
11.5% .
To al 34 100.0% 54_
100.0% 26
,..
100.0%
*Sub-sample of milies with at least one child 9 years o d or younger watching
television.
r-44'

TABLE 20
Second Special Analysis*A
Planned to Watch Program by Family-Structure
TwoParent
Percent ofSample
OneParent
Percent ofSample Other
Percent ofSample
Yes 51 53,2% 12 70.6% 6 100.0%
Sort of 13' 13.5% '1 5.9% 0 0%
No 32, 33.3% 4 23.5% 0 0%
Total 96 100.0% 17 100.0% 6 100.0%
,*Sub-sample of families with t least one child 9 years old or younger watchingtelevision.

TABLE 21
Second Special Analysis*
Question.17: "Does Mur Family Usually Watal This Program?"
F amiliesNo. of
Responses
Percent. of---'
Sample
Yes-- 76 62:3%---
Sometimes 12 9.8%
No 23 18.9%
Don't Know 2 1.6%
No ResponSe_
9 7.4%.
Total . 122 . 100:0%
*Sub-sample of families with t least one child 9 years .
old.or younger watching television.

TABLE 22*
Second Special Analysis*
Family Usually Watches Program by'Ethnicity
AngloPercent of
_Sample Black
Percent ofSample
MexicanAmerican
Petcent ofSample
Yes
Sometimes
No
46
7
19
63.9%
9.7%
26.4%
16
2
0
88.9%
11.1%
\ 0%
13
3
4 i
65.0%
15.0%
20.0%_Total
\,
72 100.0% 18. .
100.0% 20 , 100.0%
*Sub-sample of families with at least one child 9 years old or younger wátaingtelevision.

St
black families reported that they don't usually watch the program. Si ty-five
percent of the Mexican American families reported that they usually watch the
,program and another 15% reported that they sometimes watch the program, while
20%,reported that they don't usually watch the program bei4g viewed.
In the urban pOrtion of the sub-sample, 79% of the families reported that
Athey usually view the program and another 3% reported that they sometimes view
the program while almost 18% reported thafthey don't usually watch the pro-
gram being viewed (see Table 23). Sixty percent of the suburban families r6-
ported.that they usually watch the program and another 17% reported that they
sometimes watch the program, while almost 23% of the families reported they
don't usually view the'program. Almost 71% of the rural families reported
that they usually view the program and another 8% reported that they fometimes
view the program, while 21% reported that they don't usually watchle program.
In the two-parent portion of the sub-sample, 64% reported that they
usually view the program and another 11% reported that they sometime view the
program, while almost'25% reported that they 'usually don't watch the\program
(see Table 24). Almost 89% of the one-parent amilies reported that theY
usually watch the program and another 5% reported that they sometimes watch
the.program, while 5% reported that they don t usually watch the.program being
viewed.
Additional data were collected regarding family discussion in terms of
any that occurred since the television had beeh turned on that evening. Just
over 20% ofthe familias reported that there had been at least one comment or
discussion about a television program since the television was turned on (see
Table 25). Another 73%-cif the families reported that _there had been no tele-
vision related discussions and 5% of the families reported chat they didn't
know.
47
(ti

TABLE 23
écond Special Analysis*
Family.Usually Watches Program by Housing
UrbanPercent. of
Sample Suburban
Percent ofSample Rural
Percent ofSample
Yes. 27 79.4% 32 60.4% 17 70.8%
Sometimes_ _ -- 8.3%9 17.0%
No 6 17,7%12 22.6% 5 20.9%
Total 34 100,0% 53 100.0% 24 100.0%
*Sub-sample of families with at least one child 9 years old or younger wafching
television.

1111=
*TABLE1 24
Second Special Analysis*
Family Usually Watches Program by Family Structure
Two
,Parent
Percent ofSample
1 OneParent
Percent ofSample Other
Percent ofSample .
Yes _57 -- 64:0% -16----------88.8%1
75.0%
Sometimes 10 110% 1 5.6% 1 25.0%,
No 22 24.7% 1 5.6% 0 0%
Total 89 100.0% 18 100.0% 4 100.0%
*Sub-sample of families with at least one child 9 years old or younger watchingtelevision.

TABLE 25
Second Special Analysis*
Question 18: "Have There Been Any Comments or DiscussionAbout the TV Programs Since,the TV was turned on This Evening?
-,Families
No. ofResponses
- liercent of
Sample
Yes 25 20.5%
No 89 72.9%
Don't Know 6 5.0%
No Answer 2 1.6%
Total 122 100.0%
*Sub-sample of families with at least one child 9years old or younger watching television.

Second Special Analysis*
. Discussions of TV Programs by Ethnicity
\AngloPercent of
Sample \
.
.
Black
Percent ofSample
MexicanAmerican
Percent ofSample
Yes 17
59
22.4%
77.6%
a.
3-
14
17.6%
82.4%
4
15
21.1%
78.9%'No
Total 100.0% 17 100.0% - 19
,
100.0% ,
_ ,
,
*Sub-sample of families with at least one child 9 years old or younger watching
television.
80

TABLE 27
Second Special Analysis*
Di cussions of TV Programs by Housing
.
.
.Urban
Percent ofSample Suburban
POtent of-Sample Rural
Percent ofSample
Yes
r,..:
9 .'29.0%. 15 27.3% . 0 0%.
No 22 71:0% 40 72.7% . 23 100.0%
Total 31/ 100.0%. 55 10.0% 23 100.0%
*Sub-sample of families with at least one child 9 years old or younger Watching
television.

-gm rine, we,111101. 111110 MOO- MOO
,
TABLE 28,
,
Se1c Ond.Special Analysis*
Discussfons Of TV Programs by Family Structur'ec:
, irtigo'
PArent
Percent ofSample,
,
One.
Parent'
Percent ofSample
9
Other
.
Percent ofSample'
Yes
No
-----------------------21
71
22.8%
77.2%
4
13
23:5%
: 76.5%
.
,
5
0%. .
-
100.0%
_ Total 92 - 100.0% 17 100.0%,
100.0%
c.
4
*S1.11-salle o families with atleast one child 9..yearS*old or younger watching
television.

TABLE 29
Second Special Analysis*
Question 18-A. "If Yes Who was Talking or Listening?"
Families'.No, of
Responses
Percent ofSample
Parent-!Parent 3 12.0%
Parent-Child 17 68.0%
Child.-Chil0 4 16.0%
Other 1 4.0%
:Total 25 100.0%
*S:e-jaMple of families with at least one child 9 years
cad or younger watching television.

TABLE 30
Second Special Analysis*
-Question 19: "Is There Usually This Kind ofDiscussion When Your Family Views This Prbgram?"..\
FamiliesNo. of
Responses
,
Percent of \
Sample
1
Yes 29 23.8%
Sometimes 24 19.7%
-No_ 28 22.9%o
Don't Know 41 33.6%N
Total 122 '100.0%
*Sub-sample of famiiies with at least one child 9
years old or younger watching television.

TABLE 31
Second Special Analysis*
Question 20: "Why is Your FamilyWatching This Program?"
. FamiliesNo. ofResponses
Percent ofSample
Educational 10 8.2%
Entertainment ' 83 68.0%
Something Tb Do 19 15.6%
Don't Know 10 8.2%
Total 122 100.0%
*Sub-sample of families with at least one child 9
years old or younger matching feleviion.
,

In the Anglo portion of the sub-sample, 22% of the families reported at
-
least one conversation about television content-while 78% reported that no
television related conversations had occurred since,..the teleVisinn was.turned
on (see.Table 26). Just over 17% of the black families reported television
related conversations and 21% of the Mexican American families reported tele-
vision related cOnversations.
In the urban portion of the sub-sample, 29% of the families reported
television related ccinversations since the television was turned on, and 27%
of the suburban and none of the rural families reported television'related.
conversations_(see Table 27).
In the two-parent portion of.the sub-sample, almost 23% reported tele-
vision related conversations, while 23% of the sinble-parent families reported
televlsion related conversations (see Table 28).
Of the famiiies who reported television related conversations, 68% re-
ported parent-child.conversation about television content (see Table 29).
Another 12% reported parent-parent conversations and 16% reported,child-child
conversations related to television programs being viewed.
The next question,asked if the previously reported family conversations
are typicaT of the family's television viewing,behavior (see Table'30),
Almost 24% of the families responded "yes" and another 20% responded "some-
times." Twenty-three percent of the families, however, responded "no" and
another 34% reported that they didn't know.
Data were collected on the issue of why the families were watching the
television program. Only 8% mentioned any education'reason, (;see Table 31).
Sixty-elght percent reported entertainmeni .purposes for viewing the program,
another 16% reported that viewing the television gave them something to do
48
L.,

and another 8% of the families repOr ted that they didn't know.
In the Anglo 'portion of the sub-sample, almost 9% reported an education
reason for viewing the program, while 69% reported aft entPrtainment purpose',"
16% reported that viewing was "something to do" and 61 reported that they0
didn't know (see Table321, $lightly more. than 5% of the black families
reported an education'reason, while 79°k1reported entertainment, and G% re-
ported "something to do" reasons, and atiother 16% reported that they didn t
know. Ten percent of the Mexican American families reported'an educ'ation
reason, while 50% reported an entertainment reason, 30% reported "something
to do" as a reason, and 10% reported that they didn't know why they were
watching the program.
In the urban .tib-sahple, 15% reported an educational re,asoh, while 6G%
reported an entertainment reason 12% reported it was °something to do" and
another 12% of the faMilies reported that they didn t know (see Table 33).,
-AlMost 6% of the suburban families_ reported an edutational reason for viewf.P9
the program, while 69% reported an entertainment reason, 22% reported that
watching thetelevision gave them something to ,do and 4% reported that they
didn t know why they were watching the television. Less than 4% of the0110 4,
urual families reported an education reason, while 77%'reported an entertain-
ment reason, 11% reported a somethi g-to-do reason and another. 8% didn't know,'
In the two-parent family portiOn of the sub-sample, 8% reported an edu-
cational reason, while ;68% reported an entertainnient reason, 15% reported a
someihing-to-do reason, and-another 9% didn't know (see Table 34). Almost
11% of the'sing1e-parent families re0orted an education reason for viewing
the program, while 65% reported an entertainment reason, 18% reported a
something=to-do reason °and 6% reported that they didn't know why the famibit
49

TABLE 32
Second Special Analysis*tir
Reason.for Watching TV Program by Ethnicity
Anglo-
Percent ofSample
Educational e 8.6%
Entertainment 56 69.1%
Something To Do 13 16.1%
Don't Know 6.2%
'Total 81 100.0%
BlackPercent of'Sample
15
0
5.3
19 100.0%
*Sub--sample
MexicanAmerican .
Percent ofSample
10.0%
10 50.0%
6 30.0%
2 10.0%
20 100.0%
amiljes with at leasi one child 9 years old or younger watching televiston.

.TABLE 33
,Second Special Analysis*
Reason.for Watching TV Program by HouSing..
Urban
Percent ofSample
Educational 6 15.0%
Entertdifiment 24 60.6%
Something To Do . 5 12.5%
Don't Know 12.5%
Total 40 100.0%
.Suburban.
1
35
11
2
Percent ofSample
5.9%
68.6%
21.6%
3.9%
51 100.0%
eercent'ofSample
3.9%
26
*Sub-sample of families with at least one child 9 years old qr younger watching television.

TABLE 34
Second Special Analysis*
Reason for Watching TV Program by Family Structure
TwoParent
Percent ofSample
One.Pa6int
Percent ofSample Other
Percent OfSample
Educational 8 8.1% 11.8% 0 0%
Entertainment 67 67.7% 1 1 64.7% 5 83.3%
Something To Do 15 .15.1% 3 17.6%, 1 16.7%
Don't Know 9 9.1% 5.9% 0 0%
Total 99 100.0% 17 100.0% 100.0%
'Tr*
\. -
*Sub-sample of famjlies with at least one child 9 years old or younger watching television.
)

was watching the television program.
Finally, each family was asked if they thought their child or children
were learning something from the program being viewed.,, Almost 28% of the
families,responded "yes" and another 14% responded "maybe." 'ilowever, the
majority (52%) responded "no," while another 7% reported that they didn't
-know (see Tab1e-35)-.4
In the Anglo portfoh of the sub,sample, 27% and 17% responded "y s" and
"maybe" respectively (see Table 36). Forty-nine percent responded "no" and.
6% didn t know. More than 68% of black families reported "no," while 26%
and 0% reported "yes" and "maybe" respectively, and another 5% reported that
they didn't know. More than 47% of the Mexican American families repOrted
'Ino&mbile 32% and 16% reported "yes" and "maybe" -sespectively, 4nd another
5% reported that they didn't know.
In the urban portion of the sub-sample, 43% of the families reported "no,"
that they did not think their child Or children were learning from the tele-
vision program, while 30% and.16% reported "yes" and "maybe" respectively,
and another 11% reported that they didn't know (see Table 37). More thanN\
46% of the suburban families reported "no" while 37% and 15% reported "yes"
and "maybe'respectively, and another 2% reported that they didn:t'know.
More than 65% of the rural families reported that they did not think their
.child or children were learning from the program whAle 12% reported "yes,"
another 12% reported "maybe" and another 12% reported that'they didn't know.
rn the two-parent family portion of the sub-sample, almost 52% of the
familie5 reported that they didn't think their child or,children were learning
from.the program, while 26% and 14% reported lyes" and "maybe" respectively,
and another 8% reported that they didn't know. Almost 59% of the single-parent
50

TABLE 35
Second Special Analysis*
Question 21: "Do You Think r Children areLearning Something.from the Program?"
FamiliesNo. ofResponses
Percent ofSample
Yes , 34 27.9%
Maybe 17 13.9%
No 63 51.6%
*Don't Know 8 6.6%
/
Total 122 100.0%
__
o*Sub-sample of families with at least one Child 9
years old or younger witching television.

TABLE 36
Second Special Analysis*
Children Learning from TV Program by Ethnicity
.
Anglo
Percent.ofSample Black
Percent ofSample
MexicanAmerican
Percent.OfSample
1
Yes 22 27..1% 5 26:3% 6 31:6%.
Maybe 14 17.3% 0 -0% f 3 15.8%
' No N. 40 49'.4% 13! 68:4% _47.4% 1
,
.9
---
Don't Know 5 6.2% 1 5:3% 1
.
5.2%
.
.
Total 81 100.0% 19 100.0% 19 100.0%.
*Sub=sample of families with at least one child 9 years old or younger watching
televisi3n.
se
0 91/4)

moo sm. ommo gm Immo mom, mow omms mow
TABLE 37
Second.Special Analysis*
Children Learning from TV Program by Housing
,
Urban
Percent ofSaMple Suburban
.--
Percent'ofSample Rural
Percent of, Sample:-
Yes. 11 .
29.7% 20. 37.0% 3 11.5%
'Maybe 6 _16.2% -8 14.8% 3 . 11,..5%
Nd -16 43.3% 25 46.'3% 17 65.'5%
Don't.Know 4 10.8%0 1 1.9% 3 11.5%.
-Total 37 100,0% ,...54 100_0% 26 . 100.0%
/
*SUb-sample of families with at least one child 9 years old or yowler watching
-television.
a
(4
6

families reported "no" while 35% and 6% reported "yes" and "maybe" respect-
ively, and none reported that they didn't know (see Table 38).
There were several important age difference. Families were grouped
into five categories according to the age of the oldest child. Since data
were collected from families instead of children, the data could not be
segregated according to the age of particular children. Further, the age of'
the oldest child was considered to be an imPortant family parameter.
Fifteen percent of the families with chirdren had an oldest child between7
the age of 0 years and 5 years old,,18% betWeen 6 years and 9 years old,
30% lyetween 10 years Ond 14 years old,'and 31% between 15 and 1,7 years old.
Family converstaionsabout television program content were more prevalent
in families with an Oldest child 6 to 9 years old (24%) and'in families
with an oldest child 10 to 14 years old (2,5%) than'in families with an
oldest child 0 to 9 ;years old (13%) and tn families with an oldest child
15 to 17 Years old (18%). Generally, as the age'of the oldest child
increased, it was mare common for a child to select the television program
being viewed, ranging from 7.1.1 in families with an oldest child 0 to 5
yearS old to 44.6% in families with an oldest child 15 to 17 years old.
On 'the critical
program being viewed
familY groups, follo
small fluctuations i
educational reasons.
9.0% were watching,t
with an oldest cild
issue of the reason for wat hing the.televission
, "entertainment" was th rity reSponse in all
wed ty the'response,j'something to do". There were
n'the percent of amilies.wIlo were watching for
Of families,with-an aldest child 0 to 5 years old,
he TV program for educational purposes: In families.
6 to 9 years old the rate increased to 12.5% and in
families with an oldest child 10 to 14 years old, the rate was 12.8%.
A
families with an oldest(ld 15 Ao'17 years old, the rate dropped to .9%.
One the'important heoretical issues is whether' families'plan eir
51

television viewing or simply watch whatever'happens,to be on. There was
Ha slightly higher rate of,planfultAiess of faMilies' television viewing in
families with an olde,st child 6 to 9 years pld (58%) and families with an
()iciest child 10 to 14 years-old (59%), thn in families with an oldest child 0 to
5 years old (48%) and in families with an oldest child 15 to 17 years.old
(55%). The greatest stability of family'television viewing in terms of
r '
watching a program usually viewed by-the family was found in families with.
an oldest chil 10 to 14 years old.
)Finall , the question of parents' perception of their children's learn-
ing from tne4e1evision program beihg viewed yielded,data similar to that_ //
solicited by other questions. Of families with an oldest child 0 to 5 years
old, p% thought their child or children were learning from the program
.-being viewed. In.families withr an.olde.st child 6 to 9 years Pild, 29%
thought their child or children were learning from the televl/sion program.
In families 10 to 14 years old, the response.rate was 27%. And in families
with an oldest child 15 to.17 years old, 16% thought their child or
children Were learning from the television program being viewed.
mztx

umarAmm Immo AMMO MOE mum Emmy
TABLE 38
Second Special Analysis*
Children Learning from TV Program by Family Structure
TwoParent
Percent ofSample
OneParent
Percent ofSample Other
Percent of,Sample
Yes 26 26.3% 6 35.3% 2 33.3%
.Maybe " 14 14.1% 1 5.9% 2 33.3%
No 51 10 58.8% 2 33.4%
PoWt_Know 8 8,1% 0 0% 0%
Tot61 99 100.0% 17 100.0% 6 100.0%
*Sub-sample of families with at least one child 9 years old or younger watching
television.
()'q..... I

DISCUSSION
The,sub-sample composed of families with a nine-year-old child or younger.
watching television generally appears t---\
flbe
a representative of the Southwest
region with 66% Anglo, 15% black and 15% can American families. The sub-
sample also appears to be generally representative with regard to housing
with 30% in an urban setting, 44% in a suburban setting and 21% in a rural
setting. Further, the sub-sample appears to be representative with regard
to family structure with 81% two-parent families, and almost 14% single-parent
families.
Regarding the important issue of children's co-viewing, approximately
half of the favAies.reported achild viewing With his or her parent or
parents. This is significant because it suggests that in almost half of the
families with young children, the parents watch television with their chil-
dren on a regular basis and thus there is at least the opportunity for parents
to encourage discussion and analysis of television content. Unfortunately,
almost another third of the families reported a child viewing television alone..
This pattern was fairly consistent across Anglo, black and Mexican American
families, except fewer Mexican American families reported a child viewing
with his or her parent or parents. Suburban families reported the highest
co-viewing with parents (55.5%) and also reported the highest viewing alone
(37.0%). Unexpectedly, two-parent and single-parent families reported very
similar rates of children viewing with their parent or parents (47,5% and
47,1% respectively).
Family conversations about television content are probably one of the
most-critical alements of children's television viewing experiences,
52

Generally, it was, found that conversations during television viewing occurred
only about one-third of the time. Further, only one-third of the conversations
were about the television content. Thus, conversations about the television
content being viewed appear t occur only about 10% of the time. Minority
families appear tb have f er conversations, and even fewer conversations
about the television ntent. Similarly, rural families appear. to have fewer
conversations in g eral and fewer conversations about the television content
being viewed. ile a similar percentage of two-parent and single-parent
families reported conversations, single-parent families reported far fewer
conversati ns a'bout the television content. Generally, family conversation
about t evisinn content being viewed is a rare event. The problem appears
to be even more aggravated in minority and single-parent families.
Another indication of parents' involvement with their children's tele-
vision viewing is who selected the television programs to be viewed. There
appears to be an even split between parents and children, ith 42.6% of the
families reporting that a parent had selected the program and 43.4% .of the
families reporting that a child had selected the program. However, another
13.9% of the families reported that nobody had selected the prlogram being
viewed. M ority families reported a higher incidence of their children
selecting the television program, black and Mexican American families reported
47% and 63% respectively. Further, children in urban settings were also more
likely to select the program than a parent.
One of the most important elements to making television viewing bene-
ficial, and perhaps also ducational, is a person's viewing with a purpose,
having planned to Vj8W the program. Much of people's television viewing is
thought to be utilanned and to serve no purpose except crrilkill" some time.
53

However, over half of the families (56.6%) reported that they had planned
t6 view the program, and another 11% reported they had "sort of" planned to
view the prOgram. iNr6netheless, almost one-third (29.5%) of the families
reported that they had not planned to view the program. Unexpectedly, an
overwhelming majority of black families (73.7%) reported that they had pTanned.
to view the program, while only 36.8% of the Mexican American families re-
ported they had planned to view the program. A high proportion of rural
families (69.2%) and single-parent families (70.6%) also unexpectedly reported
that they had planned to view the program. .A possible interpretation of some
of these data is that for some families (especially rural and single-parent
families) television is an.integral part of family life and the family regu-
larly views certain programs.
'Indeed, the data generated by the question of whether the family usually
watches the program being viewed appear to support the interpretation that
rural and single-parent families regularly view specific programs. Almost
89%°of the single-parent families reported that they regularly watch the pro-
gram being viewed and 71% of rural families reported that they watch the program
regularly. This is in comparisbn to a sample-wide rate of,62% regularly watch-
ing the program being viewed.
A second question was asked regarding conversations related to the con-
tent of television programs being.viewed. Since conversations during television
viewing are relatively rare, families were asked if there had been any comments
or discussion about the television program since the television was turned on
that evening. Only 20% of the families reported any television related con-
versations. The major exception was the rural famill.is, none of whom reported
anytelevision related conversations. However, a follow-up question provided
54

some encouraging data. Of the families who did report television related
conversations, 68% reported that the conversation was between a parent and
child. This is particularly significant because parental'commentary and ex-
planations greatly enhance a child's ability to understand and realistically
interpret television content,
In another follow-up question, 23% of the families reported that the
evening's convftations were not typical f;r the family when it is watching
television. Another 34% reported that they didn't know. Almost 24% of the
families reported that the conversations (or the laCk of conversation) was
typical for e family and another 20% of the families reported that some-
times their family had this kind of discussibn while viewing television'. All
'of this further suggests that parent-ohil interactions during television
viewing are very irregular.
Undoubtedly the most discouraging finding of this study is that only 8%
of the families reported an educational reason or purpose for viewing the
television program. A full 68% reported entertainment reasons. Another 24%
reported a something-to-do reason or that they didn't know why they were
watching the program. This style of family viewing is directly opposite to
the kind of family viewing that makes television a positive, beneficial ex-
perience far children.
The ultimate concern is whether or not children are learning from the
televisloh-programs-they-View--This-question-was asked of-the-families who .
participated in the telephone-observation.study: Generally, at leaSt half
ofthe families reported that they did not think their child or children
were learning,from the program being viewed. The most -skeptical were rural
-4amfifes-wfth-65%1espandfng 'nu" and bTack 1amillers*-mIth-68T-respandihg
55

"no." The data, nonetheless, strongly suggest that most parents do not
believe that their children learn from the television programs they view:
Probably a more accurate perspective of these data is that most parents ue
unaware of what their children are learning from television programming.
56'

CONCLUSIONS
The overwhelming finding of the study was that while most families
(approximately 90%) view television regularly in the evening, family
conversations while viewing occur less than one-third of the time. More
importantly, discussions related to television occur approximately 10%
of the time. Finally, only a small proportion of the televlsion related
discussions include any explanation or commentary.of the television
content. The bottom line is that meaningful family discussions about
television content appear to occur only about 2.5% of families' viewing
to,time.
The experimental evidence strongly suggests that chilaren often learn
and mislearn from 'television. Further, the evidence strongly suggests
that family discussions greatly enhance the'positive benefits of children's
television viewing. The data generated by this study, however, indicate
that such family discussions are rare events. Assuming a variance across
families, it alipears that in many families, explanatory or'evaluative
commentary about television programming content hardly ever occur.
In contrast to thepirical evidence, a minority of parents realize
that their children are learning from.the television programs they view.
Approximately 20% of parents reported that they thought their children
were learning and another 10% reported "maybe". A full 90% of the families
reported watching a television program for entertainment, or something to
do, or just didn't know why they were viewing.
The study provided several important insights into how families use
home television; into parental involvement in their children's. television
1
viewing, and into families' e ucational use of home television. In general,
it was found that in families with young chiTdren, parents.viewed.television
with their children about half of the time during evening hours. However,
1 . )
57

family conversations.about the television program occurred only about
10%,of the time. Further, only about 8% of families with young.children
watched a television program for educational reasons, and more than half
of the. parents did not think their children learn from television programs.
It was hypothesized-that family parameters would influence family'
use of television.. Although there may be distortions in the data, the
data do indicate that Mexican American parents view teTevision with their
children less frequently than do Anglo or Black parents. Further, family
conversations-while viewing television are much fewer in Mexican American
families. There appear to be no sUbstantial differences in the proportiOn
of Anglo, Black and Mexican American families viewing television for
educational-purposes. Through, Black families-were more skeptical that
their children learn from television programs.
The general environment of the family appears to influence families'
use of television. In particular, families in rural settings appear to be
less likely to have-family conversations about 4television program and much
less likely to watch television for edueational purposes. Finally, fewer
parents in rural families believe their children learn from television-.
It was thought that the number of parents present in the family would
greatly alter the family's use of home television; however, the data do not
support this hypothesis. While single parents are much more likely to view
television with their children, there are no dramatic differences between
single-parent and two-parent families in the areas of famTly conversations
while viewing television, reasons for watching television, or parental
belief that their children learn from television.
The second hypothesis was that child parameters would affect television
viewing behaviors. The data indicate that in families with high-sc.hool7age
,children, there -4 less frequent parent-child Co-viewing of televisiOn,
58

fewer family conversations about television programs, less frequent tele-
\.vision viewing for educational purposes, and less belief that dhildreh
learn from television prcgrams than in families with grade-schoolrage
children. The third'hypothesis mas.that parental involvement would
influence the educational benefits of children's television viewing. The
data appear to indicate that in families where. parents'co-view with their
children more frequently, -Chere are more parent-child conversationsabout
television programs, mare television viewing for educational purposes,
and a greater belief that children-learn from television programs.
The overall picture of family television viewing, however, is that
while television viewing is a dominant, if not almost constant, family
aCtivity for most families with children during most evenings, television6
viewing is nOt a'joint activity in that family convensations about
, televiSion are rare events;,television,viewing is not planned; program
selection is not a family decision, and television viewing itself is
an inexpensive and easy way to fill the evening hours. Further, the
overwhelming proportion of parents do not believe that children learn from
television:
A portrait of sharp contradictions is presented by the. data. Television
is a very pervasive-elemeht in the lives of American families. Virtually
every family owns at least one working television. Parents deny any
importance of televiSion. Television is used for passing entertainment
and assigned an insignificant status. However', when families are at home
in the evening, the television is almostolways turned on. Further, parents
deny any impact of television on their dhildren. The many research studies,
nonetheless, continue to document more: areas in which, television shapes the
kilawiedge,-ideas, idaTs and-attIttides-df-child and-adults-. Finally
the portrait is dominated by the scene of families silently, in 'isolation
59

from'other families, and family niembers in virtual silent isolation
from eacia other, viewing television programs with passing interest.
Televon viewing $s frequently tnterrupteeto do family* or personal
chores:. However, s.ubstantive interaction's around the home television
.are indeed rare. '
'When television was first made available to families on a large
scale,.it was thought that teleViSion wou1d.brin4'families together.
. The ayailable evidence does indicate.that television has brought families
together. Howeve* , 'television appears to exclude or discourage many of
the family activities which are traditionally regarded as being important-
to a healthy, understanding and supportive family environment:-
It should be recognized that the data were generated by the relatively
novel and unvalidtted technique of using the telephone to make "observations"
into familices homes. This allowed an 1-forwarned entrance into families'.--
homes that appeared to be only-mildly_intruSive. In contrast to other
--observational approaches, --families did not "prepare" for the observation.
--The greatest area,of-Concern is the use of the person answering the tele-
- phone to conduct and report the actual observations. The reliability of
the observations appeared to be very high, and much higher than that of
non-observational approaches. Generally, the validity appeared to be much_
higher than other observational approaches and the non-observational
approaches because the technique is far less Intrusive than the former,
approaches and obtains data more direOtly than the latter approaches. .The
major threat to the validity-of the data generated-kUld be the social
desirability of response_opttanST,-. Since families were not given specific
-
response-options, the questions solicited detailed, factual information,
and-tile-qUestions-were-asked-ratheicid-Y, the recpc, ec_to be spontanenus
e)

and truthful. With the approximate cost reduction of 90% in collecting
factual data regarding family activities, the'telephone observation
approach makes it feasible to study families and the4r interactions.
Regarding the implications for parents and the-development of
programs to assist parents,,the data are very discouraging. The major
concern that parents are not involved in their children's television
viewing is not onty valid but even appears to 4ave been understated.
There are virtually no parental explanations of television-Content to
.chi'dren. This is in the context of television portraying very' complex
, and confusing content. As to public policy supporting interventions
and educational programs, these data,document a strong need. At the same
time, the data suggest that such programs would have great-difficulty
-in having a substantial impact. Parents need to be more aware of how much
television they and their children watch, and how much their children
learn from and are influenced by television programming. Once parents are
more aware, there a num rof strategies which parents could use to make
their childrgls television viewing positive and beneficial. There is
already preliminary data that these strategies are effective.
The major problem remains that most parents are unaware and
disbelieving of the impaet-of the nightly video visitor upon their family.-
If an intervention or educational program:is to have any success it .
will need to communicate information and raise aWareness. Once parents
have become aware, their concerns as parents will cause them to seek out
and try ways to change, modify or eliminate the impact of television.
17:

AVAILABILITY O DATA,
The.deta collected in the Fall pilot study and the Spring primary
study are housed at the Southwest Educational Development Laboratory.,
Access to these data may be arranged jointly tlirough Dr Oliver Moles
at the National Institute of Education and Dr. Prespn Kronkosky, the
Executiw?. Director of the SouthWest Educatibnal Development,Laboratory.
The data are organized:by groups of families as presente in the
first table of Appendix B, "1981 Spring Survey, Final'Summary
62

REFERENCES
c,
Abel, J., Fontes, B., Greenberg, B. and Atkin, C. "The Impact of Televisionon Children's Occupational Role Learning." (unpublished report),Michigan State University, East Lansing, 1980. _-
Atkin, C. K. The effects of television advertising on children. ReportNo. 2: Second year experimental evidence. East Lansing, MichiganState University, 1975. (ERIC Document Reproduction Service No. ED116 784)
Atkin, C. D. and Greenberg, B. S. "Parental Mediation of Children's SocialBehavior Learning from Television." MiChigan State University. Reportto, the U. S. Office of Child Development; HEW, Washington, D.C.August, 1977.
Applied Management Sciences, A survey of viewership of television seriesspons.ored hy ESAA legislation. Report prepared for Office of Educa-tion, DHEW, June 20, 19.78.
Bailyn, L. Mass media and children: A study of exposure habits and cogni-
tive effects. Psychological Monographs, 1959, 73 (1, Whole No. 471).
Barcus, F. E. Parental influence on children's televisioniewing. Tele-vision Quarterly, 1969, 8, 63-73.
Beuf, A. "Doctor, Lawyer, Household Drudge." Journal of Communication,1974, 24:2, 142-145.
Bechtel, R. B., Achelpohl, C., & Akers, R. Correlates between observed
behavior and questionnaire responses on television viewing- In E. A.
Rubinstein, G. A. Comstock&_.-F. P. Murray (Eds.), Television andsocial behavior (Vol. 4).f- Television in day-to-day life: Patterns
of use. Washington, D C.: U..S. Government Printing Office, 1972.
Bogatz, G. and Bail, S. The Second Year of Sesame Street: A Continuing
Evaluation. Princeton, Educational Testing Service, 1971.
Bower, R. T. Television and the Public. New York: Holt, Rinehart and
WinstOn, 1973.
Brady, G. H., Stoneman, Z. and Sanders, A. K. Effects of television view-
ing on family interactions: an observational study. Family Relations,
1980, 29, 216-220.
Bryce, J. Family styles and television use. Paper presented at the Con-
ference on Culture and Communication, Phila, Pa., April 1981.
Buerkel-Rothfuss, N. L. Children's family role learning from television:
a focus on mediating variables. Doctoral dissertation submitted at
Michigan State University, 1978.
1
63

Buerkel-Rothfuss, N., Greenberg, B., and Atkin, C. "Children's Family RoleLearning from Television." (unpublisheereport), Michigan State Uni-.versity, East Lansing, 1980.
Buerkel-Rothfuss, N., Greenberg, B. S., and Neuendorf, K. (with C. Atkin,M. Hines and T. Stock). "Two Seasons of Family Role Interactions onCommercial Television." Michigan State University. Report to theU. S. Office of Child Development, HEW, Washington, D. C. March, 1978.
Chaffee, S. H.Context."Vol. III:D. C.: U.
and McLeod, J. M. "Adolescent Television Use in the FamilyIn Television and Social Behavior, Repofts and Papers,Television and Adolescent Aggressiveness. Washington,
S. Government Printing Office, 1972.
Chaffee, S. A., McLeod, M. J. and Atkin, C. K. 1.1Parental influences onadolescent media use.:"American Behavioral Scientist, 1971, 14, 232-340.
Chaffee, S. H. and Tims', A. R. "Interpersonal Factors in Adolescent Tele-
vision Use." Journal of Social Issues, 1976, 32, 98-114.-
Collins, W. A. Learning of media content: A developmental study. Child
Development, 1970, 41 (4), 1133-1142.
Collins, W. A. Developmental aspects of understanding and evaluating tele-vision'content. Paper presented at the bienniel meeting of the Society .
for Research in Child Development, Philadelphia, March, 1973.
Collins, W. A. Cognitive processing aspects of television viewing. In
D. PearL;; L-..Bouthilet & J. Lazar (Eds.), Television and Behavior: TenYegrs-6-1-*Scientific Progress and Implications for the Eighties, Volume 2,
Washington, D. C.: DHHS, 1982.
Collins, W. A., & Westby, S. C. Children's processing of social informationfrom televised dramatic programs. Paper presented at the biennialmeeting of the Society for Research in Child Development, Denver.
Corder-Bolz, C. Television content and children's social attitudes.Technical Report submitted to the Office of Child Development, DHEW,June 30, 1976.
Corder-Bolz, C. R. Mediation: The riole of significant others. Journal
of Communication, 1980, 30 (3), 106-118. (a)
Corder-Bolz, C. R. Critical television vieWing skills for elementary schools.Television and Children, 1980, 3(2), 34-39. (b)
Corder-Bolz, C. R. TV literacy and critical TV viewing skills. In D. Pearl,
L. Bouthilet & J. Lazar (Eds.), Television and Behavior: Ten Years ofScientific Pro ress and Implications for the Eighties, Volume 2, Washing-
ton, D. C.: D1.1HS, 1982.
Corder7Bolz, C. and Cox, C. L. The roles of television in adolescent sexual
development. Paper presented at the 1981 Meeting of the Society forResearch in Child Development, Boston,. Mass., April 2, 1981
110

Corder-Bolz, C. R. and Marstall, A. M. Faualy i.uLeractwn and TV viewing.Paper presented at the 1980 Annual Meeting of the American EducationalResearch Association, Boston, April 8, 1980. (a)
Corder-Bolz, C. R. and Marshall,,A. M. Parental attitudes towards tele-vision's influence on their children. Paper presented at the 1980 Bien-nial Meeting of the Southwestern Society for Research in Human Develop-ment, Lawrence, Kansas, March 29, 1980. (b)
Corder-Bolz, C. R., & O'Bryant, S. L. "Can people affect television: Teacher
vs. program." Journal of Communication, 1978, 28, 97-103.
DeFleur, M. L. and DeFleur, L. B. "The Relative Contribution of Televisionas a Learning Source for Children's Occupational Knowledge." American
Sociological Review, 1967, 32:777-789.
Dorr, A. "TV as a Teacher, Interpersonal Factors Mediating Viewing and-Effects." Paper prepared for the National Institute of Education,April 1978.
Denzin, N. The Research Act: A. Theoretical Introduction to SociOlogical
Methods. Chicago: Ardine, 1970.
Frazer, F., and Reid, N. "A Sociological Study of Children's Use of Tele-vision Commercials to Initiate Social Interaction in Family GroupViewing Situation," paper presented to Adyertising Division, Associa-tion for Education in Journalism Annual Convention, Seattle, WAAugust 1978. ERIC document 159-726.
Gerbner, G. and Signorielli, N. "Women and Minorities on Television" (un-published report), Anrenberg, School of Communication, University ofPennsylvania, Philadelphia, 1979.
Greenberg, B. S. Television and role socialization. In D. Pearl, L. Bouthilet
& J. Lazar (Eds.), Television and Behavior: TEn Year's of Scientific
Progress and Implications for.the Eighties, Volume 2. Washington, D.C.:
DHHS 1982.
Greenberg, B. S., Ericson, P. M., & Valkes, M. Children's television be-
haviors as perceived by mother and child. Michigan State University,
East Lansing, College 'of Communication Arts, 1971. (ERIC Document
Reproduction Service No. ED 058 750)
Greenberg, B. S., Erikson, P. M. & Valkes, M. Children's television be-
havior as perceived by mother and child. In E. Rubenstein, G. Comstock,
& J. Murray (Eds.), Television and social behavior,(Vol.. 4). Washing-
ton, D. C.: U. S. Government Printing Office, 1972.
Hardy, B. W. and Corder-Bolz, C. R. Family activity vs. TV viewing.. The
PTA Communicator, 1978, 56 (3), 6-7., -
Hicks, D. J. Imitation and retention of fhm-mediated aggressive peer and
adult models. Journal of Personality and Social Psycholoa, 1965, 2
97-100.

Wines----M-Greenberg, B-and Buerkcl, N. "An-AnalStructures and Interactions in Commercial TeleVision." Project CASTLE:
(Report No. 6), Department of Communication,iiichigan State University,East Lansing, 1977.
'Jeffries-Fox, S. and Signorielli, N. "Televi.Sion and Children's Concep-.
tions of Occupations." Paper.presented/to the Airlie House Telecom-,munications Conference, Airlie House,. Virginia, 1978..
Korzenny, F. and Neuendorf, K. Television Viewing and Self-Concept of the
Elderly. Journal of Communication, 1980, 30:1, 71-80.
Lemon, J. Teaching children to become more critical cohsumers of television.Paper presented at the Annual Meeting of the American PsychologicalAssociation, Washington, D. C., September 5, 1976...
LeRoy, D. Children's programs and AID analysis. Paper presented at'meetingof the Corporation for Public Broadcasting, Arlington, Virginia, March, 1977.
Lo Solute, LA-___A_National Inventory of TV viewing behavior. In E. A.
Rubinstein, G. A. Comstock', & J. P. Murray (Eds.), Television and Social
Behavior (Vol. 4). Television in Day-to-Day. Life: Patterns of.Use.
Washington, D. C.: U. S. Government Printing Officei 1972.
Lull, J. The social use of television. Human Communication Research, 1980,
6 (3), 197-209.
Lyle, J. Television in daily life: Patterns of use (overview). In E. A.
Rubinstein, G. A. Comstock, & J. P. Murray (Eds.), Television and.Social
Behavior (Vol. 4).. Television in Day-to-Day Life: Patterns of Use.
Washington, D. C.: U, S. Government Printing Office, 1972.
"Lyle, J., & Hoffman, H. R. Explorations in patterns of television viewing
by preschool-age children. In E. A. Rubinstein, G. A. Comstock, & J.
P. Murray (Eds.), Television and Social Behavior (Vol. 4). Television
in Day-ti-Day Life: Patterns of Use. Washington, D. C.: U. S.
Governtent Printing Office, 1972.
Martin, C. A., & Benson, L. Parental perceptions of the role of television
in parent-child interaction. Journal of Marriage and the Family, 1970,
32, 410-414.
McGhee, P. "Television as a Source of Sex Role Stereotypes." Paper pre-
sented at the biennial meeting of the Society for Research in ChildDevelopment, Denver, 1975.
Medrich, E. A. Constant television: a background to daily life. Journal
of Communication, 1979; 29 (3), 1717176.
Meyer, T. P. Impact of "All in the Family" on children. Journal of Broad-
Casting, 1976, 20, 23-33.
Miller, M. M. and Reeves, B. "Linking Dramatic TV Content to Children's
Occupatis.inal Sex Role Sterotypes." Journal ol Broadcasting, 20:.35-50,
1976.

Mohr, P. J-.---=Pe- n, c ren an parents. Unpublishe report, Depart-
ment of Speech Communication, Wichita.State Universitf 1978.
Murray, J. P. Television in inner-city homes: Viewing bLhavior of youngboys. In E. A. Rubinstein, G. A.,Comstock, & J. P. Mrurray (Eds.),
Television and Social Behavior (Vol. 4). Television in Day-to-Day
Life: Patterns of Use. Washington, D. C.: Government Printing Office,
1972.
Nielsen, A. C. Nielsen Television 1977, Northbrook, Illinois: A.J. NielsenCompany, 1977. =
O'Bryant, S. L., & Corder-Bolz, C. R. The effects of television on children'sstereotyping of women's work roles. Journal of Vocational Behavior,
1978, 12, 233-244.
O'Bryant, S. L., & Corder-Bolz, C. R. Black children's learning of work
roles from television commercials. Psychological Reports, 1978, 42,
227-230. (b)
Postman, N. The first curriculum: comparing school and television. Phi
Delta Kappan, 1979, November, 163-172.
Potler, R. L. New Season: The Positive Use of Commercial Television withChildren. Ohio: Charles E. Merrill Publishing, 1976.
Robertson, T. S., Rosslter, J. R., and Gleason, T. C. Televised Medicine
Advertising and Children. New York: Praeger Publishers, 1980.
Rosenblatt, P. C., & Cunningham, M. R. Television watching and family ten-
' , sion. *Journal-of Marriage and the Family, 1976, 38 (1), 105-111.
fossiter, J. R., & Robertson, T. S. Children's television viewing: An
examination of parent-child consensus. Sociometry, 1975, 38, 308-326.
Roper 'Organization, Inc. "Changing Public Attitudes Toward Television and
Other Mass Media:. 1959-1976," New York: Television Information Office,
1977.
Safran, C. How TV changes children. Redbook, 1976 (November), 88, 91, 92,
95, 97.
Salomon, G. Internalization of filmic schematic operations in interactionwith learners' aptitudes. Journal of Educational Psychology, 1974,
66 (1), 499-511. (a)
-Singer, J. L., & Singer, D. G. Fostering imaginative play in pre-sChool
children: Effects of television viewing and.direct adult modeling.A paper presented at the annual meeting of "the American-PsychologicalAssociation, New Orleans, August 1974. (ERIC_Docum4nt Reproduction
Service No..ED 089 873)
Walling, J. I. The effect of parental interaction on learning from tele-
vision. Communication Education, 1975, 25, 16-26.

Ward, S. Effects of Television Advertising on Children and Adolescents.In E. A. Rubinstein, G. A. Comstock, and J. P. Murray (Eds.), Tele-
vision and Social Behavior (Vol. 4). Television in Day-to-Day Life:
Patterns of Use. Washington D. C. U. S. Government Printing Office,
1972.
Ward, S., Wackman, D. B., and Wartella, E. How Children Learn to Buy.
Beverly Hills, Cal." Sage Publications, 1977.
Wartella, E. and Ettema, J. S. "A Cognitive Developmental Study of Children's
Attention to Television Commercials." Communication Research 1(1), 1974,
pp. 69-88.
Wartella, E. Children and television: the development of the child's
understanding of the medium. Children's Report, Federal Communica-tions Commission, Washington, D. C., 1979. Reprinted in Communication
Yearbook, Vol. 1, Sage Publications, 1980.
Waters, H. Saving the faMily. Newsweek, May 15, 1978, 63-70.
Winn, M. The Plug-In Drug. New York: Viking Press, i977.

Telephone Observation
.and Questionnaire Forms

1. Interviewer
FAMILY LIFE AND TV TELEPHONE SURVEY'
First Evening:
Interviewee nameCompleted
Phone number.No answer
Interviewee sex (1=male, 2=female)Busy
Date (example: February 15 = 021581)Parents not in,
Time (example: 9:00 p.m. = 0900)othei
Address (as listed in phone book)
City
State
Final status: 1=participates 2=nÔ answer 3=refusal 4=wrong #
Hello, my name is and I'm calling from Southwest Educe-.
tional Laboratory in Austin, Texas. We are conducting a national tele-
phone survey on family TV viewing and would like to ask you,a few ques-
ions. Would that be all right? (f=72=n which terminates interview)
119. Is your TV on? (1=yes, 2=no, 3=don't own a TV)
10. If TV is on, what program is on?
111. Was there anything said in the two minutes before the phone rang?(1=p 2=o 3=no).
Program:
,Other:
12. How many children de- you haVe living at hoMe?
11
no children Or TV'not on, say Thanks,-goodbye."
3. Who is. watching at least part of the progrem?
Cl C2 C3 .C4
Is anyone doing anything
nothing
reading'
eating
grooming
playing games
handwork
homework
sleeping
chores
other
else?
1r . Who selected the program?
(1,father 2=mother 3=child 4-nobody)
1 . Did you plan_to watch the_program? (1=yes 2=sort of 3=no)
1.1 .

I.1 . Does your family usually watch this program.
II(1=yes 2=sometimes 3=no 4=NA)
18. Hive there been any comments or discussions about the TV program since
the TV-Was turned on thit evening? (1=yes 2=no 3=don't know)
If yes: Who was talking or lfstening in the discussion?
(1=p-p 2=p-c 3=c-c 4=0)
I 19. Is there usually thiS kind of discussion when your family views this
program? (1=yes 2=sometimes 3=no)
20. Why is your family watching this program?
(1=educational 2=entertainment (like program) 3=babysitter
4=something to do 5=don't know)
21. Do you think your children are,learning something from the program?
(1=yes 2=maybe 3=no)
What are they learning?
We would also like to ask a few demographic questions. These are just voluntary.
.22. How many TVs are in your home?
11 23.What is your household structure? For example, 2 parents and 1 child
1=married, no children2=married, children3=single parent, children4=single occupant
II 24., And your children's sex and ages?
(1=b, 2=g, then age.- Babiesless than 6 mos=6,greater than 6 mos=1
5=several adult same-sex6=several adult mixed-sex
7=other (explain) ,
II25. Do you live in an urban, suburban or rural neidhborhood?
.(1=urban 2=suburban 3=rural ,4=don't know),
- II 26. What is your ethnicjty .(or rate)? .
1=Anglo 2=MéXicanAMerican 3=Black -4=Other
(sex) (age
Thank you for helping us with our survey. We would also like to send you
a more detailed questionnaire on put 7/ viewirg habits, which would contain
11
the same types of questions. In mtum for,filling out the questionnaire,
Nere will send you a free set of parentmg materials which contain activities
as games and stories for you anr, your children. May we send you a.
questjonnaire? (1=yes 2=no)
II11 If yes, iubject's correct address and zip code (explain sub3ects are ob-
tained at 1.6ridom from the phone book):
IIThank you.

!hat is the,age and sex of each family member?
Age Sex
Husband
FAMI-LY TV QUESTIONNAIRE
Ilife
lildest child
, Second child
'third child
ilourther -Tiousehold
th child
membersRelationship
Relationship
'How many working televisions do you have? Color TVs
Black & white TVs
which-room is the TV that you most often watch together as a family?
Is cable se1'vice available in'your area? Yes No
Is HBO? Yes No
Do you subscribe to cable service? Yes No
To HBO? Yes NO
IIHow many channels do you receive?
Do you own a videotape recorder? Yes No
low many hours does your family watch TV in an average week?
nights of the week are you as a family likely to be watching TV together?
(Please circle as many answers as apply to you.)
Sunday Monday Tuesday Wednesday THursday Friday Saturday None regularly

Ilhich word(s) of those below best describe how you feel about rlur children's TV ,Ea
viewing?.(Please check as many as apply.)
Entertaining'Stimulating Harmful
BoringHarmlesS Amusing
RelaxingWorthwhile Stupid
A waste of NecesiaryFulfilling
time
ilease check off as many of the following statement's as apply to your TV set's operation.
At my house,:the TV is on most of the afternoon.
"At my house; the TV is usually on during dinner.
At my house' the TV. is on most of the evening.
11What do you as a familk talk about while you are watching TV?
I.
"Do you 'and/or other meMbers of your family often do any ing other than talk.while watch-.
ing TV? (Mark as many as, apply.,
11Read
Play gamesSleep
EatDo handwork
Hdusehold
11 rilgrxming
(crafts, paperwork)chores
Perso(self or others)
Do homework
Dther (whal?)
IIWhat shows do you as a family try to watch together whenever they are broadcast?
0,

. _ 3---- _
/tat programs tor types of programs) do you tigy to encourage your children to watch?
What programs (or types of programs) ao you discourage or not allow your children to
Irtch?
'rat programs (or types of programs) do you usually watch with your children?
that programs or types of programs) are your children most likely to ask you questions
out?
r77
!that programs (or types of programs) are most likely to lead to a family discussion?
'rave any shows led to taking a trip or reading a book?
11 If yes, what shows?
yes, 3 Or 4.times yes, more than 4 times no, never
During 1 hour of evening TV programming', when you are watching with your Children, how
Ilmany discussions or comments are usually made about the show or commercials?
0 1 2 3 4 5- _ _
On an.averege evening, what is the total amount of time yOur family spends talking
together .Epout the television pro-gram being viewed?
0 min, 1-5 min. 5-10 min. 10-20 min.
11What programs do your children watch for educational purposes? -----
more than20
What TV content do Stou try to expl ylur children'
II'Do you try to limit the amount Of tim-your-chiTdren watch TV?
IIyes no not relevant
II
If yes, how many hours peil day do you permit? -
1st child 2nd child 3rd ctiild
11<1
7dLs2
IIIf yes, holi often is the timited TV viewing rule enforc e
none rarely so*times often not applicable
120

- 4 -
w many hours did(do)-your children watch TV:
hours:
on an average weekday?. hours:
on an average Saturday? hours.:
IIon an average Sunday? hours:
ow many hours di,i_d(do) you and/or your spouse watch TV with your children:
yesterday?hours:
on an average weekday? hours:
on an average Saturday? hours:
on an average Sunday? hours:
1st child 2nd child 3rd child
tusband's occupationpart-time ,full time
Itife's occupationpart-time full'timi
Husband's highest year of school completed .
11Wife's highest year of school completed,9
irotal:fkrnily annual income: (check one)
$0 .:. 10,000 $11,000. - 20,000 $21,000 - 30,000 $31,000 -I:
"What clubs or organizations does, each family member actively participate in?
Husband
Wife
Oldest child
Second child
11 Third child .
Other household members
:Please mark one of the following categories:
Both husband and wife completed questionnaire
11\
Wife completed 'questionnaire':
Husband completed questnnaire
Another household meMbercompleted questionnaire
RelatiOnship
,THANK JOU YOR YOUR HELP

1981 Spring Telephone Study Results

No AnsWre)
Disconnected
Refus-
Participants
1981 Spring Survey, Final Summary
No. Percent
591 20.23%
470 16.08%
563 19.27%
1,298 44.42%
2,922 100.00%
Participants?
Children, w/TV on 443 90.41%]
Children, TV off 44 8.98% 137.75%
Children)kion't own TV 3 0.61% )
490 100.00%
No children, TV on 500 61.88% ).4 )
No children, TV off 283 '' 35.02% ) 62.25%
)
No children, no TV 25 3.09% )
808 100.00%
/ °
1 2
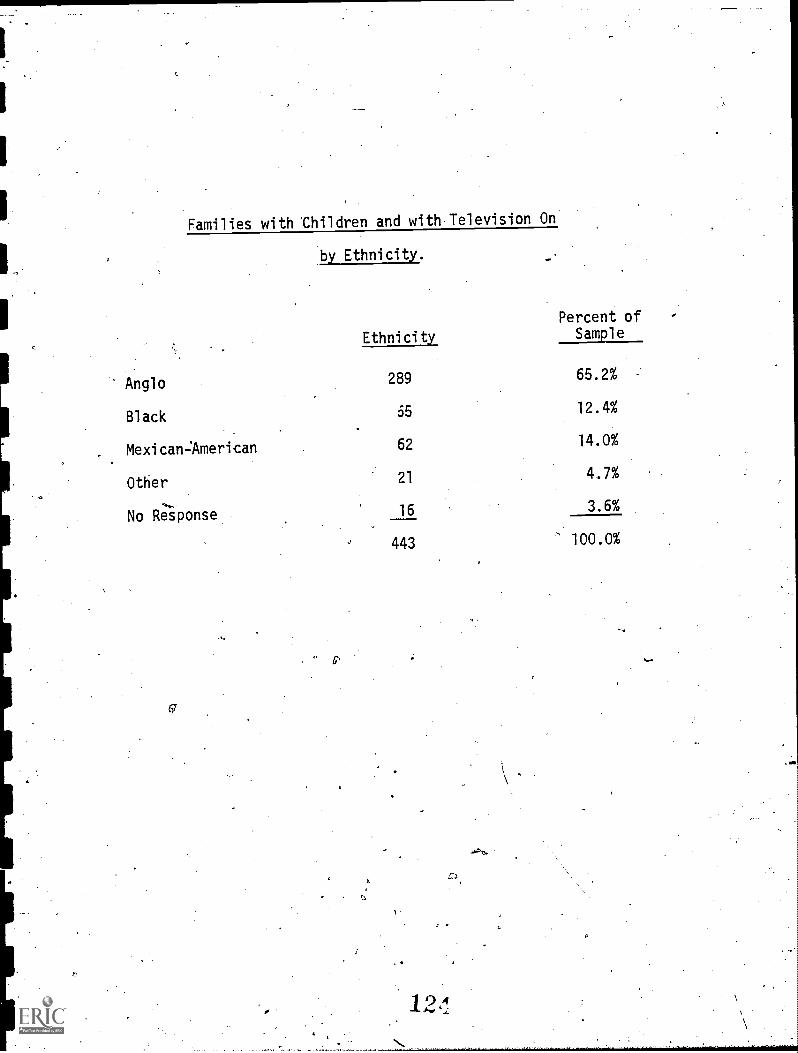
.
Families with Children and withTelevision On
by Ethnicity.
Ethnicity
Percent ofSample
Anglo 289 65.2%
Black 65 12.4%
Mexican-American 62 14.0%
Other 21 4.7%
No Response 16 3.6%
443 100.0%
a
12,4
a.sZt,

Families with Children and with Television On
by Housing.
HousingPattern
Percent ofSample
Urban 130 29.3%
Suburban 188 42.4%
Rural 77 17.4%
Other* 32 7.2%
No Response 16 3.6%
443 100.0%
* Includes "don't know" answers.

Families with Children with Television On by
Age of Oldest Child
0-5 Years 67 15.1%
6-9 Years 80 18.1%/
10-14 Years 133 30.0%
.15-17 'fears 139 31.4%
No Response 24 5.4%
443 100.0%

Families with Children with Television On
by Family Structure.
Married Parent
FamilyStructure
Percent ofSample .
Families ' 359 81.0%
Single ParentFamilies 51 11.5%
Other 17 3.8%
No Response 16 3.6%
443 100.0%

Question 11:
"Did anyone say something in .the twominutes before the phone rang?"
Families with Childrenwith Television ON
Program 49 11.1%
Non-program 89 20.1%
No 305 68.8%
443 100.0%
128

Program Commehtt in Two Minutes
Befdre Phone Rang.
:Program Comments Percent
Explanatory 6 12.2%
Evaluative 6 12.2%
Other 37 75.5%
49 100.0%
1°L,

Program Comments in Two Minutes
Before Phone Rang by Ethnicity.
Program Total
Comment Sample Percent
Anglo 34
Black 8
'Mexican-American 5
289 11.8%
55 14.5%
62 8.1%
13ea

1
1
I.
1
7
Program Comments in Two Minutes
Before Phone Rang by Family Structure.
Program Total
Comment Sample Percent
Married 9 359 12.0%
Single Parent 4 51 7.8%
Other 1 17 5.9%

Program Comments in Two. Minutes
Before ciibne Rang by Housing.
Program Total Percent of
Comments Sample Sample
Urban f8 130 13.8%
Suburban 25 188 ,l3.3%
Rural 5 77 6.5%

Question.14:
"Are they doing anything else?"
Nothing 246 55.5%
Talking 3 0.7%
Reading 22 5.0%
Eating 48 10.8%
Grooming 5 1.1%
Playing Games 20 4.5%
Handwork. '5 1.1%
Homework' 24 5.4%
Sleeping 5 1.1%
Chores 26 5.9%
Other 28 6.3%
No Response 11 2.5%
443 100.0%
13c

Fam o-Viewin
Child Alone
Child w/Sibling(
Child w/Adult(s)
Adult(s) Only
Other
No Respese
84 19.0%
44 9.9%
143 32.3%
156 35.2%
4 0.9%
12 2.7%
443' 100.0%
,

Family Co-Viewing by Ethnicity.
,% of
Anglo AngloCo-viewing. Samle
Child Alone 57 19.7%
Child w/Sibling(s) 28 9.7%
Child w/Adult(s),
101 349%,
Adult(s) Only 103 35.6%
BlackCo-viewing
% ofBlackSample
Mex-Amer.iclf.ffeylijis
% ofMex-Amer.Sample
17 30.9% 7 11.3%
7 12.7% 6 9.7%
15. 27.3% 25 _40.3%
16 29.1% 24 38.7%

Family Co-Viewing by Housing.
UrbanCo-viewing
% ofUrbanSample
SuburbanCo-viewing
% ofSuburbanSample
Rural
Co-viewin9
% ofRural
Sample
Child Alone 25 19.2% 41 21.8% 12- 15.6%
Child w/Sibling(s) 14 10.8% 12 6:4% 13
Child w/Adult(s) 43 33.1% 72 38.3% 22 28.6%
Adult(s) Only 48 36.9% 63 33.5% 30 38.9%
a
1 36
s

Family Co-Viewing by Family Structure.
Child Alone
Child w/Sibling(s)
'Child w/Adult(s)
Adult(s) Only
% ofStngle Single % of
Married Married Parent Parent Other Other
Co-viewing, Sample Co-viewing Sample. Co-viewing Sample
68 18.9%
,
11 21.6% 5 29.4%
36 10.0% 7 13.7% 1
120 33.4% 19 1-'1/.3% 4 23.5%
135 37.6% 14 27.4% 7 41.2%
gra'

Question 15: "Who Selected the Program?"
-
Father 79- 17.8%
Mother 325 28.2%
Child 154 34.8%
Nobody 48 10.8%
Don't know 18 4.1%
No response 19 4.3%
443 100.%
1 28

Who Selected Program by Age of Child
. 0-5Years
Percent ofSample '
6-9Years
Percent ofSample
10-14Years
Father 21 31.3% ,
/
. 15 18.8% 20
Mother 25 37.3% p 37.5% 31
Child 5 7.5% 24 30.0% 60
Nobody 10 14.9% 10 12.5% 18
Don't Know 6 9.0% 1:3% 3
Percent of 15-17 Percent of
Sample Years _Sample .
15.0% 29 20.9%
,23.,3% 34 24.5%
45.1% 62 44.6%
13.5% 9 6.5%
2.3% 5 3.6%

Who Selected the Program by Family Structure
TwoParent
Percent ofSample
SingleParent
Percent ofSample
Other Percent ofSample
Father 39 11.5% 7 13.7% 9.1%
Mother 126 37,2% 20 39.2% 4 36.4%
Child 102 30.1% 17 33.3% 6 54.5%
Nobody 72 21.2% 7 13.7% 0 0%

Who Selected the Program by Housing
, Percent of °. .Percentof .
Percent of,
Urban Sample SUburben : Sample Rural -Sample
-Fathef 13 10.4% 25 13.9% ,T7---------4.1
Mother 49 39.2% 61: -13.9%
'Chli'd134%
Nobody' 27 21.6% 34 18.9%
33 44.0%, 0
21, 2843-
14 18.7%

_
-- Who Seiected the Program by Eth icity
Percent otAnglo -Sample Black
Percent of Percent of
Sample Mex.-Am. Sam e
Father
Mother
Child
Nobody
33
101
87
52
12.1%
37.0%
31.9%
19.0%
5
25
19
13
8.1%
40.3%
30.6%
21.0%
7
21
13
11
40.4%
/ ,25.0%,
21.1%
_
Oto.:1

Question 16: "Did You Plan sto Watch This Program?"
Yes 233-- 52.6%
Sort of 31 7.0%
No 147 35.4%
No Response 22 5.0%
443 100.0%
I
;;0-

_ ---P-Tanne-dfollitdhs Program by Age of Child
0-5 Percent of 6-9 Percent of 10-14 Percent of 15-17 Percent of
Years' Sample Years Sample Years Sample Years Sample/
Yes , 32 47.8% 46 57.5%
Sort of 5 7.5% '7 8.8%
No 29 43.3% 26 '32.5%
2,
78 58.6% 76 54.7%
7 5.3% 12 8.6%
48 36.1% 50 36.0%
,4 n44

Planned to Watch Program by Family Structure
Two ,Percent- of ,, Single Percent of Percent of
Paf-ent Sample Parent Sample Other Sample
-,
Yes -,----188 53.0% 32 64.0% 10 90.9%
Sort of 28- 7.9% 4-1... 3 6.0% 0 0%
No 139 36.3%. 15 30.0% 1 9.1%,
ev.

Yes
Sort of
No
al
Planhed to Watch Program by Housing
Percent of Percent of
.Urban Sample Suburban Sample
',.... z..._
,
75 58.1% 95 50.5%,
7 5.4% 13 6.9%
47 36.4% 80 42.6%'
_
Rural
Percent ofSample
48 61.5%
7 9.0%
23 29.5%

\
Planned,tb Watch Pigram by Ethnicity
""
Percent of Percent of Percent of
/311:912 Sample Black Sample Mex.-Am: Sample ,
--
Yes 150 52.6%
Sort of 25 -- 8.8%.--
No 110 38.6%
-
.7
44 69.8% 29 53.7%
4 6.3% 2 3.7%
15 23.8% 23 42.6%

QuesifOri18: there been any comments or discussions
about the TV program since --ifie-TV----was-
/'turned on this evening?"
Yes 88 19.9%
No) 312 70.4%
Don't Know 23
No Response
443 1000%
1.4 0s,..)

Question 18a: "If yes who was talking or
listening in the discussion?"
Parent/parent 24 27.6%
Parent/child 39 44.8%
Child/child . 11 12.6%
Other 13 149%.
87 100.0%

Fami) Comments about TV Program by Age of Child
1
0-5 Percent of. 6-9 .Percent of 10-14 Percent of 15-17 .Percent'of
Years Sample Years Sample Years Sample , Years Sample
No
' t Know.
9 '-- 13.4% 19 23.8% 33 24.8% 25 18.0%
0
56. 83.6% 56 70.0% 86 64.7% 109 78.4%
1 1.5% 4 5.0% 10 7.5% 3 2.2%

Family Discussions about TV by Ethnicity
Djscussion
AngloPercent ofSample Black
Percent ofSample, Mex.-Am.
Percent ofSample
Reported 63 22.0% 11 17.5% 10 18.2%
.No DiscussionReported 211 73.5% 47 74.6% 41 74.5%
Don't KnoW 13 4.5% 5 7.9% 4 7.3%

_______
Family Discussions about TV by Family Structure
Two Percent of Single
Parent Sample Parent
DiscussionReported 72 20.2% 13
No DiscussionReported 167 74.8% 33
Don't Know 18 5.0% 5
Percent ofSample Other
Percent of/Sample
25.5% 2 18.2%
64.7% 9 81.8%
9.8% 0 0%

DiscussionReported
No DiscussionReported
Don't Know
Family Discussion about TV by Housing
Urban
Percent ofSample Suburban
Percent ofSample
32 24.4% 42 22.2%
93 71.0% 136 72.0%
6 4.6% 11 5.8%
.
Rural
Percent ofSample
10 12.8%
61 78.2%
7 9.0%

Question 19: "Is there usually discussion
when your family views this program?"
Yes Sometimes No Don't Know No Response
Discussion 60 13 13 1 2
Reported (67.4%)... (14.6%) . (14.6%) (1.1%) (2.2%)
No Discussion 46- 57 88 10 111
Reported (14.7%) (18.3%) (28.2%) (3.2%) (35.6%)
.

Question 20: "Why is your family watching this program?"
Educational 43 9.7%
Entertainment 254 57.3%
Babysitter. 1 0.2%
Something To Do 82 18.5%
Don't Know 40 9.0%
No Response 23 5.2%
443 100.0%

Reason for Family Watching Program by Age of'CHild
0-5Years
Percent ofSample
6-9Years
Percent of 10-14Sample 'Years
Percent ofSample
15-17Years
Percent of-,Sample
Educational 6 9.0% 10 12.5% , 17 12.8% 11 7.9%
Entertainment 36 53.7% . 52 65.0% 77 57.9% 85 61,41%
Babysitter 0 0% 0. 0% 0 0% 0 0%
Something To o 14 20.9% 11 13.8% 26 19.5% 28 20.1%
Don't Know 8 11.9% 5 6.3% 12 e9.0% 14 10.1%
15c

Reasons for Watching Program by Family Structure
Two Percent of
Parent Sample
SingleParent
Percent ofSample Other
Percent ofSample
Educational 57 15.3% 5 9.8% 1 9.1%
Entertainment 213 57.1% 29 56.9% 10 90.9%
Something To Do 70 18.8% 10 19.6% 0 0%
Don't Know 33 8.8% 7 13.7% 0 0%
157

Educational
Entertainment
Something To Do
Don't Know
; IReasons for Watch.i.n'a Pr ram b Ethnicit
AngloPertent of
Sample B1 ck
Percent ofSamp1e Mex.-Am.
Percent ofSample
\
3.1 11.0% 7 10.4% 2 4.0%
159 56.6% 50 74.6% 32 64,0%
63 22.4 4 / 6.0% 11 22.0%
28 10.0 6 9.0% 5 10.0%
1

Reasons for Watchin Pro ram Housin
Urban
Educational 21
Entertainment 75
Something To Do 23
Don't Know 15
Percent ofSample Suburban
Percent of-Sample Rural
Percent ofSample
17 9.2% '4 5.3%
111 60.3% 53 70.7%
42 22.8% 11 14.7%
14 7.6% 7 9.3%
1 5

Question 21: "Do you think your children are
learning something from the prograM4
Yes
Maybe
No
Don t know.
No response
92 20.8%
50
239 54.0%
26 59%
36 8.1%
443 100.0%

Children Learning from Program by Age of Chtld
0-5 Percent ofYears Sample
6-9Years
Percent of 10-14
Sample Years
Percent ofSample
15-17Years
Percent ofSample
Yes 9 13.4% 23 28.8% ----7=736 27.1% 22 15.8%
Maybe 3 4.5% 8 10.0% 20 15.0% 18 12.9%
No 44 65.7% 45 56.3% 61 45\9% 90 64.7%
\
Don't Know 6 8.9% 2 2.5% 11 8.3% 6 4.3%
16:

Children Learning from Program by Family Struciure
TwoParent
Yes 75
Maybe 45
No 200
Don't know 22
Percent ofSample
SingleParent
Percent ofSample Other
Percent ofSample
12 23.5% 4 40.0%
3 5.9% 1 10.0%
33 64.7% 4 40.0%
3 , 5.9% 1 10.0%
162

Children Learnin from Pro ram b Nou.sin
-Percent of
Urban Sample
Yes 28 23.0%-,
Maybe 17 13.9% tg
No 69 56.6% 1
Don't Know 8 6.6%
Suburban
Percent ofSample Rural
Percent.ofSample
46 25,.1% 14 18.2%
23 12.6% 8 10.4%
106 57.9% 49 63.6%-
8 4.4% 6 7.8%

Pa
Yes
Maybe
No'
Children Learning.froM Programby Ethnlci.ty
. Percent-of Percent pf Percent of
Anglo 'Sample Black Sample. Mex..7Am. Sample'
59
39
161
18
''.1.3% '17 -27.0% 14, 25.9%
14.1% 3 4,8%. 7 13-.0%
. 58.1% 41 65M; 29 53.7%,
t
6.5% . 2 317% 4
' 4

Children Learnin from ro ram\with Famil Discussion
Family No FamiTy
Discussion Percent of Discussion Percent of
Reported Sam le Reported Sample
yes 29 34.9% 53 18.0%
Maybe 18 21.7% 30 10.2%
No 36 43.4% 193 65.4%
Don't Know 0 0% 19 6.4%

QuestiOn 17: "Does your famil; usually
watch this program?"
Yes 188 42.4%
Sometimes 53 .12.0%
No 122 27.5%
Don t Know 10 2.3%
No Fesponse 70 15.8%
443 100.0%

Family Usually Watches Program by Age of Child
0-5Years
Percent ofSample
6-9Years
Percent ofSample
10-14Years
Percent ofSample
15-17Years
Percent'ofSample,
Yes 30 44.8% 44 55.0% 52 39.1% 67 48.2%
Sometimes 12 17.9% 6 7.5% 17 12.8% 16 11.5%
No 20 29.9% 22 27.5% 43 32.3%. 45 32.4%
Don't Know 0 0% 1 1.3% 3 2.2% 3 2.2%
"No Response 4 5.9% 7 8.8% 17 12.8% ' 8 5.8%

Children Learning from Program by
Program Usually Watched
Children
FamilUstarnLearning Yes Sometimes No Don't Know
Yes 57 7 19 0
Maybe 26 7 10 1
No 96 34 89 3
Don't Know 9 5 4 6
1.

APPENDIX C
Fir'st Special Analysis Tables
123

S ecial Anal sis of Who Selected Pro ram*
Parent 84 35.4%
Child 122 51.5%
Other 23 9.7%
Don't Know 8 3.4%
237 100.0%
.* Sub-sample of families with at least one
child 14 years old or younger and child
watching television
17

Special Analysis of Planning to Watch Program*
Yes, planned towatch program 138 58.2%'
Sort of planned towatch program 19 8.0%
No, did not plan towatch program 77 32.5%
No Answer 3 1.3%
237 100.0%
* Sub-sample of families with-at least one
child 14 years old or younger and child
watching television
171

Special Analysis of Family Usually Watches Program*
-
Yes 123
: Sometimes 25
No 64
Not Applicable 21
9
Don't Know 4
237
51.9%
10.5%
27,0%
.9%
1,7%
100.0%
* Sub-sample of families with at least one child 14
years old or younger and child watching television
'70

Special Analysis of Family Discussion
about TV Program*
Comments about Program 56
No Comments about Program 168 70.9%
Don't Know11 4.6%
No Answer2 0.8%
237 100.0%
.* Sub-sample of families with at-least one child
14 years old or younger and child watching tele-
vision

Speplal Analysis of Family Discussion'
') about TV'Program*
Parent/Parent 5 8.9%
Parent/Child a 37 66.1%
Child/Child 9 16.1%
Other 2 3.6%
No Answer 3 5.4%
56 100.0%
* Sub-sample of faMilies with at.least
one child 14 years olsi 'or younger and
child watching television

Special Analysis of Why Families Watch Program*
Educational 25 _10.5%.
Entertainment 154 63.7%
Babysitter 0 0
Something to do 35. . 14.8%
Don't know 2? 9.3%
Mo Answer. 1 0.4%.
237 100.0%
* Subsample of families wittrat least one child'
14 years old or younger and child watching
teleyision

a
Special Analysis of Children Learning
from TV Program*
Yes 65 27.4%
Maybe 37 16.0%
No 49.4%
0
.117
Don't Know 16 6.8%
No Answer 1 0.4%.
237 100.0%
* Sub-svp,le Of families:mith at least
One child'14 years old or younger and
;child weChing television