Embed Size (px)
Citation preview
Revised Mapping of Lava Flows on Mount Etna, Sicily Michael Abrams, Remo Bianchi, and Dave Pieri
Abstract Mt. Etna, Sicily, i s the most active volcano i n Europe, erupt- ing almost constantly. Historical records of eruptions for the last 350 years are accurate; prior to about 1650, the record is increasingly inaccurate and incomplete. Ages for pre-1650 lava flows, reported on recent geologic maps, are in conflict with ages determined from paleomagnetic measurements. Here we report on a different approach used to determine relative ages of Etnean lava flows. Multispectral image data were acquired from aircraft overflights of Etna i n 1992. The Thematic Mapper Simulator instrument obtained 12 chan- nels of data in the visible through thermal infrared wave- length regions. Supervised classification of these data allowed us to group Etnean flows into age groups based on their spectral properties. About 90 percent of the classifica- tion agrees with the mapped lava flow ages. Our results also generally support the paleomagnetic age determinations for pow ages that disagree with the mapped ages. In addition, several areas were remapped, correcting errors on the pub- lished map.
Introduction Mount Etna is a composite volcano, about 40 km in basal di- ameter, that lies in the eastern part of Sicily, close to the probable position of the junction between the African and Eurasian plates (Figure 1). Rising to an elevation of more than 3300 m, and dominating the landscape of the Mediter- ranean region, the volcano is almost continuously active, and historical accounts of eruptions go back more than 2500 years (Chester et al., 1985; Simkin and Siebert, 1994). Etnean lavas from major eruptions during the past 350 years are well known and documented. Contrary to popular ideas, however, eruptions from before about 1650 are poorly de- scribed, and the descriptions and attributed ages are often in- accurate. For example, for the period between 1300 and 1600, only three eruptions can be identified with a reasona- ble level of confidence (Tanguy et al., 1985), although many eruptions are assigned to this period (Simkin and Siebert, 1994) and are so shown on the latest geologic maps of Etna (Romano et al., 1979; Romano, 1990).
An accurate knowledge of the true dates of Etnean lavas has implications for the succession of eruptions, effusion rates, magmatic evolution, and eruptive models in general (Casetti et al. (1981) for example). The direct method to obtain this knowledge is through C-14 dating of charcoal samples re- liably associated with each flow. Unfortunately, finding this material has proven to be logistically difficult, requiring a field search of an area exceeding 1700 kmz. Intensive research into existing historical records has also proved less than satisfac-
M. Abrams and D. Pieri are at Mail Stop 183-501, Jet Propul- sion Laboratory, 4800 Oak Grove Dr., Pasadena, CA 91109.
R. Bianchi is at CNR Progetto Lara, Via Monte d'Oro 11, 00040 Pomezia (Roma), Italy.
tory (Tanguy, 1981), due to both the inaccuracy and incom- pleteness of written accounts.
One solution in the past 20 years has been to try to date Etnean flows through paleomagnetic analyses. This is done by determining the natural remnant magnetization of the flows, constructing curves which show the local secular vari- ation of the field in both direction and magnitude, then find- ing the values of the flows on these curves. The first person to do this for Etnean lavas was Tanguy (1970) and Tanguy et al. (1985); a similar analysis was done later by Rolph et al. (1987). Tanguy examined about 30 flows, and found that most of the flows reported to have been erupted between AD 1284 and 1651 were actually older than this period, some- times by more than 500 years. Rolph and his colleagues looked at about 40 flows, many of them being the same as those examined by Tanguy. Their results generally confirmed Tanguy's conclusions for the 1284 to 1651 period flows; pa- leomagnetic ages for eight flows were many hundreds of years older than their mapped ages.
In this paper, we present the results of a different ap- proach to determine relative ages of lava flows, through the use of remotely sensed data. Multispectral image data in the visible, near infrared (NIR), short wavelength infrared ( s ~ ) , and thermal infrared (TIR) wavelength regions can obtain re- flectance and emittance information for all areas in the image data set, with spatial resolutions dependent on the instru- ment and the platform altitude. Previous studies (Kahle et al., 1988; Abrarns et al., 1991) have demonstrated the use of visible, infrared, and thermal infrared airborne data for rela- tive age dating of lava flows in Hawaii. These data are sensi- tive to variations in vegetation type and percent cover, iron oxidation state of the surface, development of secondary coatings, and physical state of the surface. All of these fac- tors vary as a function of age; in addition, climatic environ- ment and human activities play a role in modifying the lava surface characteristics.
We report here on a study to map the relative ages of Et- nean lava flows using airborne remote sensing data. One of our principal objectives was to evaluate and, if confirmed, extend the results from the paleomagnetism studies, includ- ing flows older than those studied by Tanguy et al. (1985) and Rolph et al. (1987).
Eruptive History The eruptive history of Etna from about 150,000 BP to the present has been characterized by products of mildly alkalic affinity - the Alkalic Series - while the main construct of the volcano is composed of basic lavas (hawaiites, mugeari-
Photogrammetric Engineering & Remote Sensing, Vol. 62, No. 12 , December 1996, pp. 1353-1359.
0099-1112/96/6212-1353$3.00/0 O 1996 American Society for Photogrammetry
and Remote Sensing
PE&RS December 1996 1353
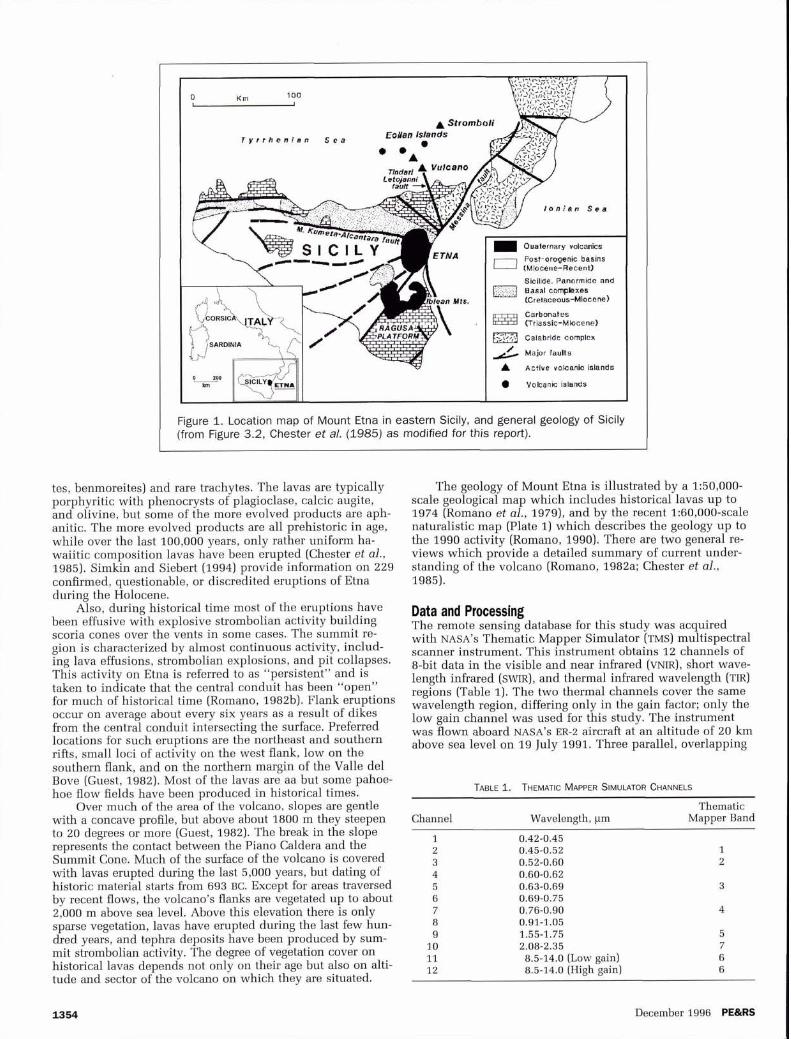
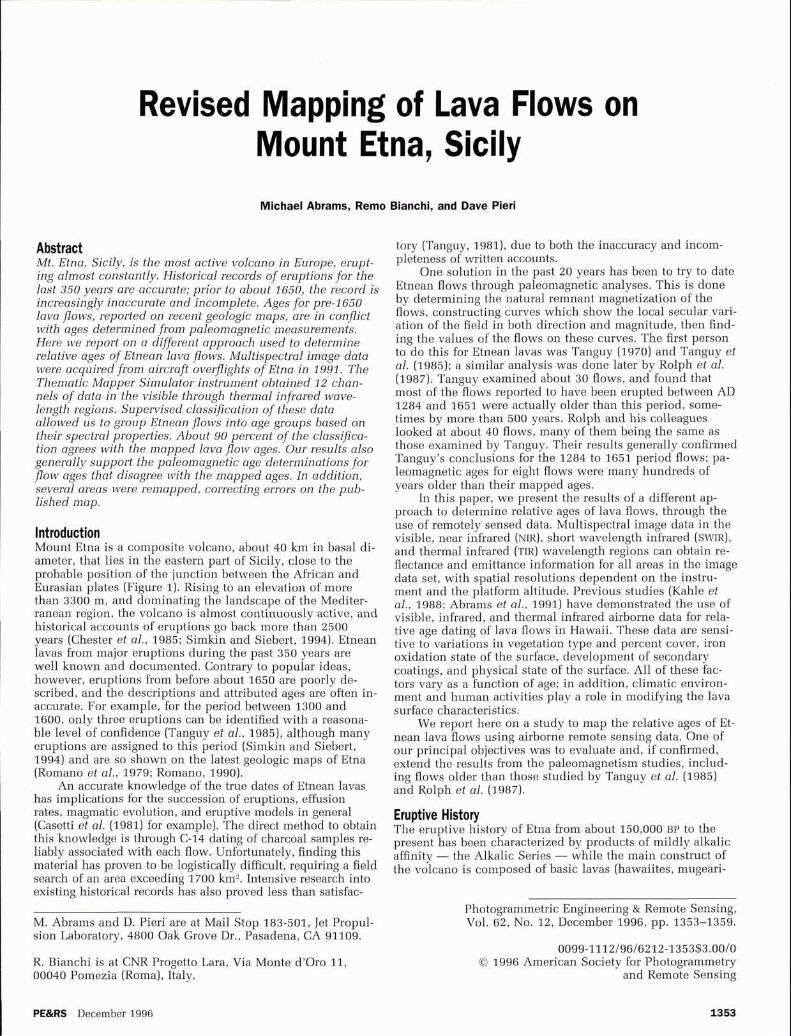
Figure 1. Location map of Mount Etna in eastern Sicily, and general geology of Sicily (from Figure 3.2, Chester et a/. (1985) as modified for this report).
r y r r h e n i a n S e a
l o n i a n S e a
Calabrlde cornplcx
Act ive voloanic islands
tes, benmoreites) and rare trachytes. The lavas are typically porphyritic with phenocrysts of plagioclase, calcic augite, and olivine, but some of the more evolved products are aph- anitic. The more evolved products are all prehistoric in age, while over the last 100,000 years, only rather uniform ha- waiitic composition lavas have been erupted (Chester et ul., 1985). Simkin and Siebert (1994) provide information on 229 confirmed, questionable, or discredited eruptions of Etna during the Holocene.
Also, during historical time most of the eruptions have been effusive with explosive strombolian activity building scoria cones over the vents in some cases. The summit re- gion is characterized by almost continuous activity, includ- ing lava effusions, strombolian explosions, and pit collapses. This activity on Etna is referred to as "persistent" and is taken to indicate that the central conduit has been "open" for much of historical time (Romano, 1982b). Flank eruptions occur on average about every six years as a result of dikes from the central conduit intersecting the surface. Preferred locations for such eruptions are the northeast and southern rifts, small loci of activity on the west flank, low on the southern flank, and on the northern margin of the Valle del Bove (Guest, 1982). Most of the lavas are aa but some pahoe- hoe flow fields have been produced in historical times.
Over much of the area of the volcano, slopes are gentle with a concave profile, but above about 1800 m they steepen to 20 degrees or more (Guest, 1982). The break in the slope represents the contact between the Piano Caldera and the Summit Cone. Much of the surface of the volcano is covered with lavas erupted during the last 5,000 years, but dating of historic material starts from 693 BC. Except for areas traversed by recent flows, the volcano's flanks are vegetated up to about 2,000 m above sea level. Above this elevation there is only sparse vegetation, lavas have erupted during the last few hun- dred years, and tephra deposits have been produced by sum- mit strombolian activity. The degree of vegetation cover on historical lavas depends not only on their age but also on alti- tude and sector of the volcano on which they are situated.
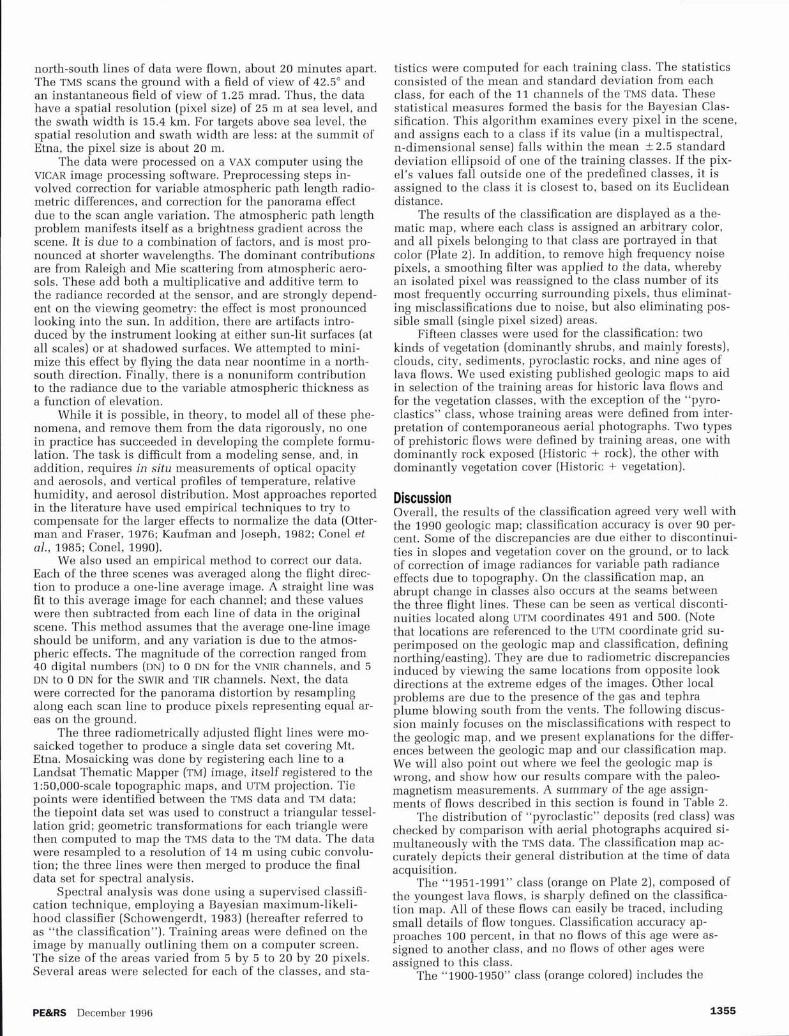
The geology of Mount Etna is illustrated by a 1:50,000- scale geological map which includes historical lavas up to 1974 (Romano et ul., 1979), and by the recent 1:60,000-scale naturalistic map (Plate 1) which describes the geology up to the 1990 activity (Romano, 1990). There are two general re- views which provide a detailed summary of current under- standing of the volcano (Romano, 1982a; Chester et a]., 1985).
Data and Processing The remote sensing database for this study was acquired with NASA's Thematic Mapper Simulator (TMS) multispectral scanner instrument. This instrument obtains 1 2 channels of 8-bit data in the visible and near infrared (VNIR), short wave- length infrared (SWIR), and thermal infrared wavelength (TE) regions (Table I). The two thermal channels cover the same wavelength region, differing only in the gain factor; only the low gain channel was used for this study. The instrument was flown aboard NASA's ER-2 aircraft at an altitude of 20 km above sea level on 19 July 1991. Three parallel, overlapping
Thematic Channel Wavelength, pm Mapper Band
1 0.42-0.45 0.45-0.52 0.52-0.60 0.60-0.62 0.63-0.69 0.69-0.75 0.76-0.90 0.91-1.05 1.55-1.75 2.08-2.35 8.5-14.0 (Low gain) 8.5-14.0 (High gain)
December 1996 PE&RS
north-south lines of data were flown, about 20 minutes apart. The TMS scans the ground with a field of view of 42.5' and an instantaneous field of view of 1.25 mrad. Thus, the data have a spatial resolution (pixel size) of 25 m at sea level, and the swath width is 15.4 krn. For targets above sea level, the spatial resolution and swath width are less: at the summit of Etna, the pixel size is about 20 m.
The data were processed on a VAX computer using the VICAR image processing software. Preprocessing steps in- volved correction for variable atmospheric path length radio- metric differences, and correction for the panorama effect due to the scan angle variation. The atmospheric path length problem manifests itself as a brightness gradient across the scene. It is due to a combination of factors, and is most pro- nounced at shorter wavelengths. The dominant contributions are from Raleigh and Mie scattering from atmospheric aero- sols. These add both a multiplicative and additive term to the radiance recorded at the sensor, and are strongly depend- ent on the viewing geometry: the effect is most pronounced looking into the sun. In addition, there are artifacts intro- duced by the instrument looking at either sun-lit surfaces (at all scales) or at shadowed surfaces. We attempted to mini- mize this effect by flying the data near noontime in a north- south direction. Finally, there is a nonuniform contribution to the radiance due to the variable atmospheric thickness as a function of elevation.
While it is possible, in theory, to model all of these phe- nomena, and remove them from the data rigorously, no one in practice has succeeded in developing the complete formu- lation. The task is difficult from a modeling sense, and, in addition, requires in situ measurements of optical opacity and aerosols, and vertical profiles of temperature, relative humidity, and aerosol distribution. Most approaches reported in the literature have used empirical techniques to try to compensate for the larger effects to normalize the data (Otter- man and Fraser, 1976; Kaufman and Joseph, 1982; Cone1 et a]., 1985; Conel, 1990).
We also used an empirical method to correct our data. Each of the three scenes was averaged along the flight direc- tion to produce a one-line average image. A straight line was fit to this average image for each channel; and these values were then subtracted from each line of data in the original scene. This method assumes that the average one-line image should be uniform, and any variation is due to the atmos- pheric effects. The magnitude of the correction ranged from 40 digital numbers (DN) to 0 DN for the VNIR channels, and 5 DN to 0 DN for the SWIR and TIR channels. Next, the data were corrected for the panorama distortion by resampling along each scan line to produce pixels representing equal ar- eas on the ground.
The three radiometrically adjusted flight lines were mo- saicked together to produce a single data set covering Mt. Etna. Mosaicking was done by registering each line to a Landsat Thematic Mapper (TM) image, itself registered to the 1:50,000-scale topographic maps, and UTM projection. Tie points were identified between the TMS data and TM data; the tiepoint data set was used to construct a triangular tessel- lation grid; geometric transformations for each triangle were then computed to map the TMS data to the TM data. The data were resampled to a resolution of 14 m using cubic convolu- tion; the three lines were then merged to produce the final data set for spectral analysis.
Spectral analysis was done using a supervised classifi- cation technique, employing a Bayesian maximum-likeli- hood classifier (Schowengerdt, 1983) (hereafter referred to as "the classification"). Training areas were defined on the image by manually outlining them on a computer screen. The size of the areas varied from 5 by 5 to 20 by 20 pixels. Several areas were selected for each of the classes, and sta-
tistics were computed for each training class. The statistics consisted of the mean and standard deviation from each class, for each of the 11 channels of the TMS data. These statistical measures formed the basis for the Bayesian Clas- sification. This algorithm examines every pixel in the scene, and assigns each to a class if its value (in a multispectral, n-dimensional sense) falls within the mean 2 2.5 standard deviation ellipsoid of one of the training classes. If the pix- el's values fall outside one of the predefined classes, it is assigned to the class it is closest to, based on its Euclidean distance.
The results of the classification are displayed as a the- matic map, where each class is assigned an arbitrary color, and all pixels belonging to that class are portrayed in that color (Plate 2). In addition, to remove high frequency noise pixels, a smoothing filter was applied to the data, whereby an isolated pixel was reassigned to the class number of its most frequently occurring surrounding pixels, thus eliminat- ing misclassifications due to noise, but also eliminating pos- sible small (single pixel sized) areas.
Fifteen classes were used for the classification: two kinds of vegetation (dominantly shrubs, and mainly forests), clouds, city, sediments, pyroclastic rocks, and nine ages of lava flows. We used existing published geologic maps to aid in selection of the training areas for historic lava flows and for the vegetation classes, with the exception of the "pyro- clastics" class, whose training areas were defined from inter- pretation of contemporaneous aerial photographs. Two types of prehistoric flows were defined by training areas, one with dominantly rock exposed (Historic + rock), the other with dominantly vegetation cover (Historic + vegetation).
Discussion Overall, the results of the classification agreed very well with the 1990 geologic map; classification accuracy is over 90 per- cent. Some of the discrepancies are due either to discontinui- ties in slopes and vegetation cover on the ground, or to lack of correction of image radiances for variable path radiance effects due to topography. On the classification map, an abrupt change in classes also occurs at the seams between the three flight lines. These can be seen as vertical disconti- nuities located along UTM coordinates 491 and 500. (Note that locations are referenced to the UTM coordinate grid su- perimposed on the geologic map and classification, defining northingleasting). They are due to radiometric discrepancies induced by viewing the same locations from opposite look directions at the extreme edges of the images. Other local problems are due to the presence of the gas and tephra plume blowing south from the vents. The following discus- sion mainly focuses on the misclassifications with respect to the geologic map, and we present explanations for the differ- ences between the geologic map and our classification map. We will also point out where we feel the geologic map is wrong, and show how our results compare with the paleo- magnetism measurements. A summary of the age assign- ments of flows described in this section is found in Table 2.
The distribution of "pyroclastic" deposits (red class) was checked by comparison with aerial photographs acquired si- multaneously with the TMS data. The classification map ac- curately depicts their general distribution at the time of data acquisition.
The "1951-1991" class (orange on Plate 2), composed of the youngest lava flows, is sharply defined on the classifica- tion map. All of these flows can easily be traced, including small details of flow tongues. Classification accuracy ap- proaches 100 percent, in that no flows of this age were as- signed to another class, and no flows of other ages were assigned to this class.
The "1900-1950" class (orange colored) includes the
PE&RS December 1996
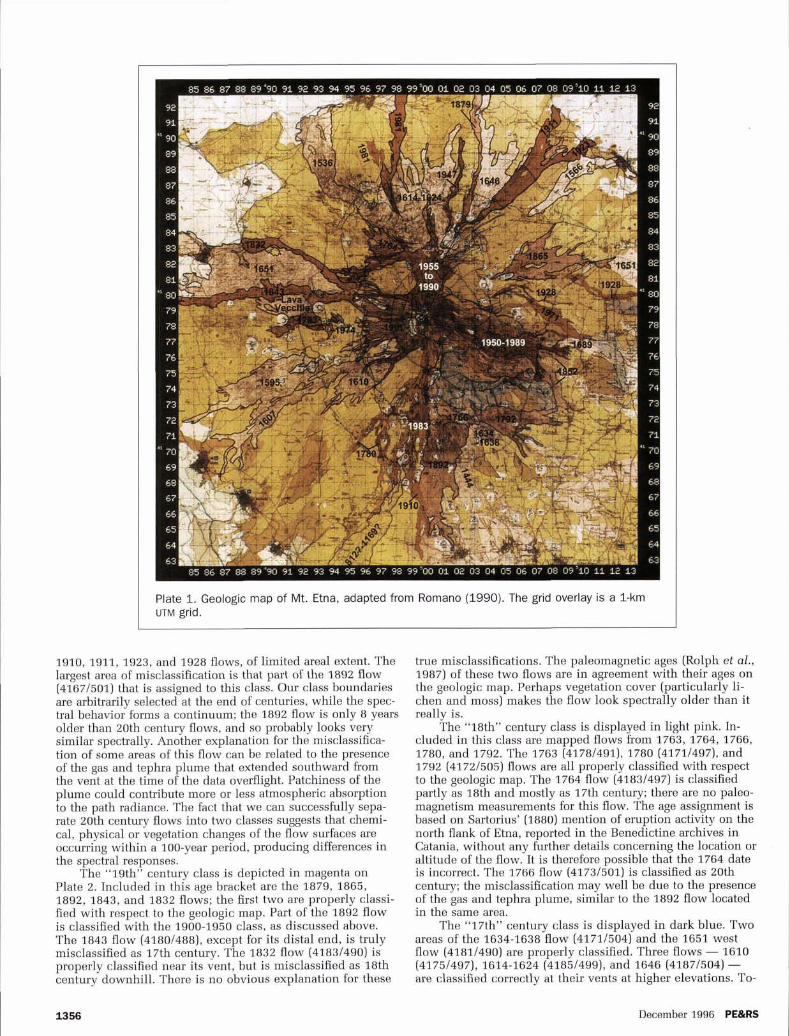
Plate 1. Geolog~c map of Mt. Etna, adapted from Romano (1990). The grid overlay is a 1-km UTM grid.
1910, 1911, 1923, and 1928 flows, of limited areal extent. The largest area of misclassification is that part of the 1892 flow (41671501) that is assigned to this class. Our class boundaries are arbitrarily selected at the end of centuries, while the spec- tral behavior forms a continuum; the 1892 flow is only 8 years older than 20th century flows, and so probably looks very similar spectrally. Another explanation for the misclassifica- tion of some areas of this flow can be related to the presence of the gas and tephra plume that extended southward from the vent at the time of the data overflight. Patchiness of the plume could contribute more or less atmospheric absorption to the path radiance. The fact that we can successfully sepa- rate 20th century flows into two classes suggests that chemi- cal, physical or vegetation changes of the flow surfaces are occurring within a 100-year period, producing differences in the spectral responses.
The "19th" century class is depicted in magenta on Plate 2. Included in this age bracket are the 1879, 1865, 1892, 1843, and 1832 flows; the first two are properly classi- fied with respect to the geologic map. Part of the 1892 flow is classified with the 1900-1950 class, as discussed above. The 1843 flow (4180/488), except for its distal end, is truly misclassified as 17th century. The 1832 flow (41831490) is properly classified near its vent, but is misclassified as 18th century downhill. There is no obvious explanation for these
true misclassifications. The paleomagnetic ages (Rolph et al., 1987) of these two flows are in agreement with their ages on the geologic map. Perhaps vegetation cover (particularly li- chen and moss) makes the flow look spectrally older than it really is.
The "18th" century class is displayed in light pink. In- cluded in this class are mapped flows from 1763, 1764, 1766, 1780, and 1792. The 1763 (4178/491), 1780 (4171/497), and 1792 (41721.505) flows are all properly classified with respect to the geologic map. The 1764 flow (41831497) is classified partly as 18th and mostly as 17th century; there are no paleo- magnetism measurements for this flow. The age assignment is based on Sartorius' (1880) mention of eruption activity on the north flank of Etna, reported in the Benedictine archives in Catania, without any further details concerning the location or altitude of the flow. It is therefore possible that the 1764 date is incorrect. The 1766 flow (41731501) is classified as 20th century; the misclassification may well be due to the presence of the gas and tephra plume, similar to the 1892 flow located in the same area.
The "17th" century class is displayed in dark blue. Two areas of the 1634-1638 flow (41711504) and the 1651 west flow (41811490) are properly classified. Three flows - 1610 (4175/497), 1614-1624 (4185/499), and 1646 (41871504) - are classified correctly at their vents at higher elevations. To-
December 1996 PE&R!
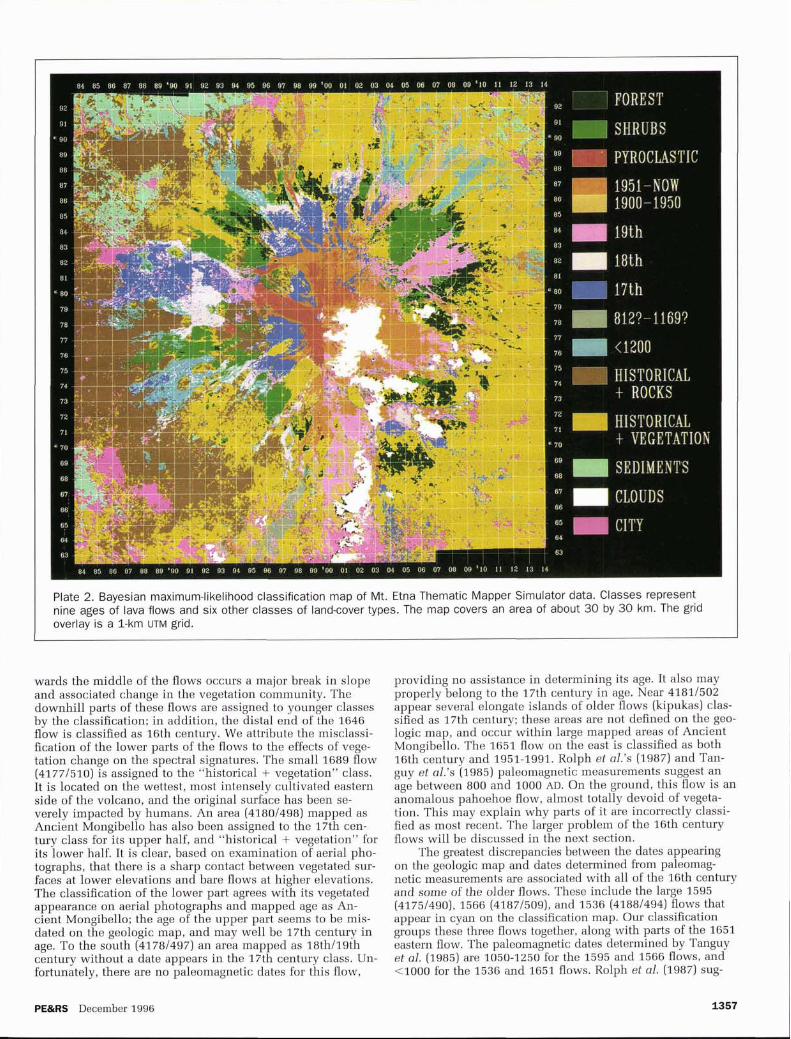
Plate 2. Bayesian maximum-likelihood classification map of Mt. Etna Thematic Mapper Simulator data. Classes represent nine ages of lava flows and six other classes of land-cover types. The map covers an area of about 30 by 30 km. The grid overlay is a 1-km UTM grid.
92 FOREST 81 -
'@. SBRUBS
+w 8 8 -
PYROCLASTIC 6 7 -
88 1351-NOW
85 - 1900-1950 04 19th
78
78 - 812?-1169? " 78 . < 1 2 0 0 75
74 HISTORICAL 73 + ROCKS 72
71 HISTORICAL * 70 + VEGETATION
wards the middle of the flows occurs a major break in slope and associated change in the vegetation community. The downhill parts of these flows are assigned to younger classes by the classification; in addition, the distal end of the 1646 flow is classified as 16th century. We attribute the misclassi- fication of the lower parts of the flows to the effects of vege- tation change on the spectral signatures. The small 1689 flow (41771510) is assigned to the "historical + vegetation" class. It is located on the wettest, most intensely cultivated eastern side of the volcano, and the original surface has been se- verely impacted by humans. An area (41801498) mapped as Ancient Mongibello has also been assigned to the 17th cen- tury class for its upper half, and "historical + vegetation" for its lower half. It is clear, based on examination of aerial pho- tographs, that there is a sharp contact between vegetated sur- faces at lower elevations and bare flows at higher elevations. The classification of the lower part agrees with its vegetated appearance on aerial photographs and mapped age as An- cient Mongibello; the age of the upper part seems to be mis- dated on the geologic map, and may well be 17th century in age. To the south (41781497) an area mapped as 18thl19th century without a date appears in the 17th century class. Un- fortunately, there are no paleomagnetic dates for this flow,
providing no assistance in determining its age. It also may properly belong to the 17th century in age. Near 41811502 appear several elongate islands of older flows (kipukas) clas- sified as 17th century; these areas are not defined on the geo- logic map, and occur within large mapped areas of Ancient Mongibello. The 1651 flow on the east is classified as both 16th century and 1951-1991. Rolph et al.'s (1987) and Tan- guy et al.'s (1985) paleomagnetic measurements suggest an age between 800 and 1000 AD. On the ground, this flow is an anomalous pahoehoe flow, almost totally devoid of vegeta- tion. This may explain why parts of it are incorrectly classi- fied as most recent. The larger problem of the 16th century flows will be discussed in the next section.
The greatest discrepancies between the dates appearing on the geologic map and dates determined from paleomag- netic measurements are associated with all of the 16th century and some of the older flows. These include the large 1595 (4175/490), 1566 (4187/509), and 1536 (41881494) flows that appear in cyan on the classification map. Our classification groups these three flows together, along with parts of the 1651 eastern flow. The paleomagnetic dates determined by Tanguy et a1. (1985) are 1050-1250 for the 1595 and 1566 flows, and <I000 for the 1536 and 1651 flows. Rolph et al. (1987) sug-
PE&RS December 1996 1357
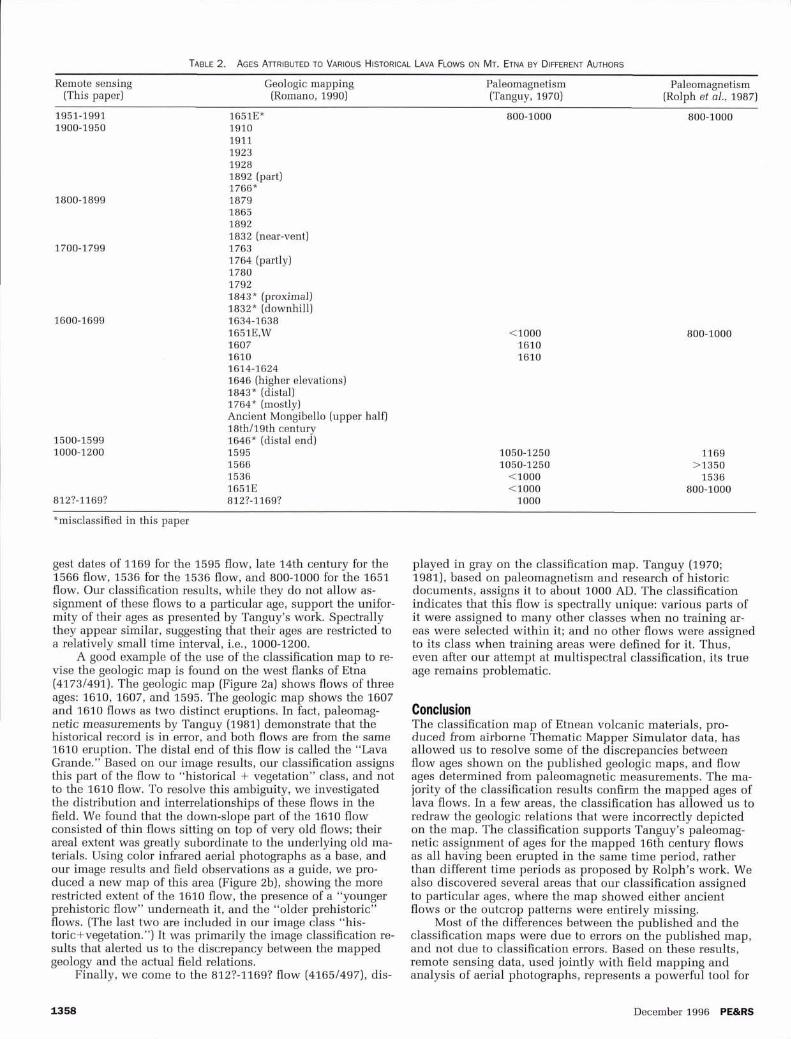
Remote sensing (This paper)
Geologic mapping (Romano, 1990)
--
Paleornagnetism Paleomagnetism (Tanguy, 1970) (Rolph et al., 1987)
1951-1991 1651E* 800-1000 800-1000 1900-1950 1910
1911 1923 1928 1892 (part) 1766* 1879 1865 1892 1832 (near-vent) 1763 1764 (partly) 1780 1792 1843 * (proximal) 1832" (downhill) 1634-1638 1651E,W 1607 1610 1614-1624 1646 (higher elevations) 1843* (distal) 1764* (mostly) Ancient Mongibello (upper half) 18thl19th century 1646* (distal end) 1595 1050-1250 1169 1566 1050-1250 >I350 1536 <I000 1536 1651E <lo00 800-1000
812?-1169? 812?-1169? 1000
*misclassified in this paper
gest dates of 1169 for the 1595 flow, late 14th century for the 1566 flow, 1536 for the 1536 flow, and 800-1000 for the 1651 flow. Our classification results, while they do not allow as- signment of these flows to a particular age, support the unifor- mity of their ages as presented by Tanguy's work. Spectrally they appear similar, suggesting that their ages are restricted to a relatively small time interval, i.e., 1000-1200.
A good example of the use of the classification map to re- vise the geologic map is found on the west flanks of Etna (41731491). The geologic map (Figure 2a) shows flows of three ages: 1610, 1607, and 1595. The geologic map shows the 1607 and 1610 flows as two distinct eruptions. In fact, paleomag- netic measurements by Tanguy (1981) demonstrate that the historical record is in error, and both flows are from the same 1610 eruption. The distal end of this flow is called the "Lava Grande." Based on our image results, our classification assigns this part of the flow to "historical + vegetation" class, and not to the 1610 flow. To resolve this ambiguity, we investigated the distribution and interrelationships of these flows in the field. We found that the down-slope part of the 1610 flow consisted of thin flows sitting on top of very old flows; their areal extent was greatly subordinate to the underlying old ma- terials. Using color inhared aerial photographs as a base, and our image results and field observations as a guide, we pro- duced a new map of this area (Figure 2b), showing the more restricted extent of the 1610 flow, the presence of a "younger prehistoric flow" underneath it, and the "older prehistoric" flows. (The last two are included in our image class "his- toric+vegetation.") It was primarily the image classification re- sults that alerted us to the discrepancy between the mapped geology and the actual field relations.
Finally, we come to the 812?-1169? flow (4165/497), dis-
played in gray on the classification map. Tanguy (1970; 1981), based on paleornagnetism and research of historic documents, assigns it to about 1000 AD. The classification indicates that this flow is spectrally unique: various parts of it were assigned to many other classes when no training ar- eas were selected within it; and no other flows were assigned to its class when training areas were defined for it. Thus, even after our attempt at multispectral classification, its true age remains problematic.
Conclusion The classification map of Etnean volcanic materials, pro- duced from airborne Thematic Mapper Simulator data, has allowed us to resolve some of the discrepancies between flow ages shown on the published geologic maps, and flow ages determined from paleomagnetic measurements. The ma- jority of the classification results confirm the mapped ages of lava flows. In a few areas, the classification has allowed us to redraw the geologic relations that were incorrectly depicted on the map. The classification supports Tanguy's paleomag- netic assignment of ages for the mapped 16th century flows as all having been erupted in the same time period, rather than different time periods as proposed by Rolph's work. We also discovered several areas that our classification assigned to particular ages, where the map showed either ancient flows or the outcrop patterns were entirely missing.
Most of the differences between the published and the classification maps were due to errors on the published map, and not due to classification errors. Based on these results, remote sensing data, used jointly with field mapping and analysis of aerial photographs, represents a powerful tool for
December 1996 PE&RS
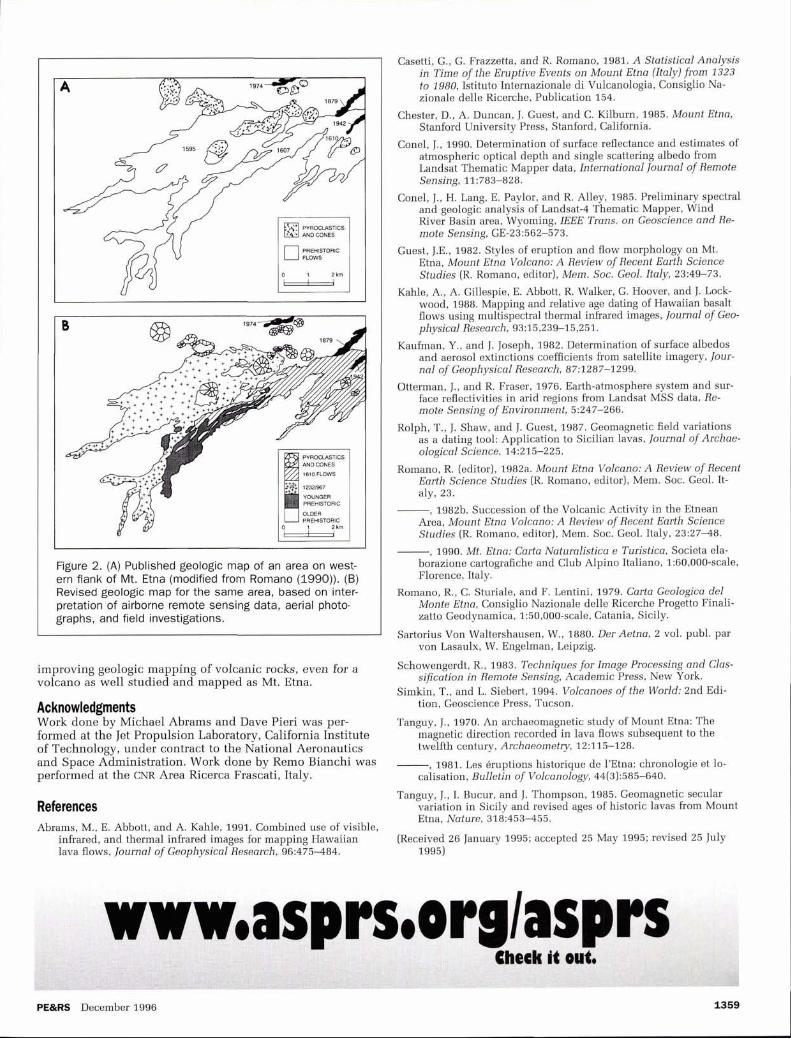
Figure 2. (A) Published geologic map of an area on west- ern flank of Mt. Etna (modified from Romano (1990)). (B) Revised geologic map for the s a m e area, based on inter- pretation of airborne remote sensing data, aerial photo- graphs, and field investigations.
improving geologic mapping of volcanic rocks, even for a volcano as well s tudied a n d mapped as Mt. Etna.
Acknowledgments Work done b y Michael Abrams a n d Dave Pieri was per- formed at the Jet Propulsion Laboratory, California Institute of Technology, under contract to the National Aeronautics a n d Space Administration. Work done by Remo Bianchi w a s performed a t t h e CNR Area Ricerca Frascati, Italy.
References Abrams, M., E. Abbott, and A. Kahle, 1991. Combined use of visible,
infrared, and thermal infrared images for mapping Hawaiian lava flows, Journal of Geophysical Research, 96:475484.
Casetti, G., G. Frazzetta, and R. Romano, 1981. A Statistical Analysis in Time of the Eruptive Events on Mount Etna (Italy) from 1323 to 1980, Istituto Internazionale di Vulcanologia, Consiglio Na- zionale delle Ricerche, Publication 154.
Chester, D., A. Duncan, J. Guest, and C. Kilburn, 1985. Mount Etna, Stanford University Press, Stanford, California.
Conel, J., 1990. Determination of surface reflectance and estimates 01
atmospheric optical depth and single scattering albedo from Landsat Thematic Mapper data, International Journal of Remote Sensing, 11:783-828.
Conel, J., H. Lang, E. Paylor, and R. Alley, 1985. Preliminary spectral and geologic analysis of Landsat-4 Thematic Mapper, Wind River Basin area, Wyoming, IEEE Trans. o n Geoscience and Re- mote Sensing, GE-23:562-573.
Guest, J.E., 1982. Styles of eruption and flow morphology on Mt. Etna, Mount Etna Volcano: A Review of Recent Earth Science Studies (R. Romano, editor), Mem. Soc. Geol. Italy, 23:49-73.
Kahle, A., A. Gillespie, E. Abbott, R. Walker, G. Hoover, and J. Lock- wood, 1988. Mapping and relative age dating of Hawaiian basalt flows using multispectral thermal infrared images, Journal of Geo- physical Research, 93:15,239-15,251.
Kaufman, Y., and J. Joseph, 1982. Determination of surface albedos and aerosol extinctions coefficients from satellite imagery, Jour- nal of Geophysical Research, 87:1287-1299.
Otterman, J., and R. Fraser, 1976. Earth-atmosphere system and sur- face reflectivities in arid regions from Landsat MSS data, Re- mote Sensing of Environment, 5247-266.
Rolph, T., J. Shaw, and J. Guest, 1987. Geomagnetic field variations as a dating tool: Application to Sicilian lavas, Journal of Archae- ological Science, 14215-225.
Romano, R. (editor), 1982a. Mount Etna Volcano: A Review of Recent Earth Science Studies (R. Romano, editor), Mem. Soc. Geol. It- aly, 23.
, 1982b. Succession of the Volcanic Activity in the Etnean Area, Mount Etna Volcano: A Review of Recent Earth Science Studies [R. Romano, editor), Mem. Soc. Geol. Italy, 23:27-48.
, 1990. Mt. Etna: Carta Naturalistica e Turistica, Societa ela- borazione cartografiche and Club Alpino Italiano, 1:60,000-scale, Florence, Italy.
Romano, R., C. Sturiale, and F. Lentini, 1979. Carta Geologica del Monte Etna, Consiglio Nazionale delle Ricerche Progetto Finali- zatto Geodynamica, 1:50,000-scale, Catania, Sicily.
Sartorius Von Waltershausen, W., 1880. Der Aetna, 2 vol. publ. par von Lasaulx, W. Engelman, Leipzig.
Schowengerdt, R., 1983. Techniques for Image Processing and Clas- sification in Remote Sensing, Academic Press, New York.
Simkin, T., and L. Siebert, 1994. Volcanoes of the World: 2nd Edi- tion, Geoscience Press, Tucson.
Tanguy, J., 1970. An archaeomagnetic study of Mount Etna: The magnetic direction recorded in lava flows subsequent to the twelfth century, Archaeometry, 12:115-128.
, 1981. Les Bruptions historique de 1'Etna: chronologie et lo- calisation, Bulletin of Volcanology, 44(3):585-640.
Tanguy, J., I. Bucur, and J. Thompson, 1985. Geomagnetic secular variation in Sicily and revised ages of historic lavas from Mount Etna, Nature, 318:453455.
(Received 26 January 1995; accepted 25 May 1995; revised 25 July 1995)
PE&RS December 1996