Embed Size (px)
Citation preview

EUROPEAN COMMISSION Employment, Social Affairs and Equal Opportunities DG Social protection and social integration Social and demography analysis
Brussels, September 2009
PORTFOLIO OF INDICATORS FOR THE MONITORING OF THE EUROPEAN STRATEGY FOR SOCIAL PROTECTION AND SOCIAL INCLUSION – 2009 UPDATE
SEPTEMBER 2009 UPDATE
1. USE OF INDICATORS AFTER STREAMLINING
1.1. The monitoring framework – National Reports on Strategy for social inclusion and social protection
Following the adoption by the Council of the Commission’s Communication on the streamlining of the Open Method of Coordination (OMC) on Social Protection and Social Inclusion, the first round of streamlined strategies for the period 2006-2008 were submitted to the Commission in the form of National Reports on Strategies for Social Protection and Social Inclusion in September 2006. In these reports, Member States reported on all the Common Objectives; overarching, social inclusion, pensions and health care and long-term care. However, while covering all objectives they emphasised certain of them.
1.2. The monitoring framework – reporting by the Commission and joint reporting
In the new monitoring framework, the Commission drafts a Report for joint adoption by the Commission and the Council prior to the subsequent Spring European Council. This report summarises main issues and trends and assesses Member States' progress in reaching the common streamlined objectives. In line with the Social Protection Committee/ Economic Policy Committee (SPC/EPC) joint opinion on streamlining endorsed by the March 2006 EPSCO Council, it also reviews how social protection and social inclusion policies are contributing to the Lisbon goals of employment and growth and assess how progress towards the Lisbon goals of employment and growth is impacting on social cohesion.
1.3. The new monitoring framework – the use of indicators
This section clarifies how indicators and statistics are used in this new reporting context.
To begin with, it has to be recalled that all commonly agreed indicators and context information are calculated and regularly updated by Eurostat on the basis of the commonly agreed definitions and presented on the Eurostat web-site on well identified and dedicated pages.

2
Indicators are used to monitor the overarching objectives, as well as the specific objectives of the three strands: social inclusion, pensions and health care. The EU level analysis of the indicators is carried out by the Commission, discussed with the indicators Sub-Group of the Social Protection Committee (SPC), and made available to Member States in advance of the preparation of the National reports on Social Protection and Social Inclusion. The Commission broadly reviews all indicators on the occasion of the full reporting years (e.g. joint reports 2007 and 2009), and draws on the relevant indicators in each portfolio (social inclusion, pensions, and health) to support more detailed analysis during the thematic years (e.g. child poverty, working longer, health inequalities for the Joint Report 2008).
Member States should primarily draw on the portfolio of commonly agreed indicators and statistics to support the analysis presented in their National Reports, according to the "guidelines" agreed for each reporting exercise. This analysis could however be supplemented with national indicators, highlighting national specificities in particular areas of social protection and social inclusion.
In the National Plans/strategies by strand, Member States are invited to adopt a focused approach by identifying a few priority objectives, while also addressing all streamlined objectives. In the area of social inclusion they should maintain an integrated and multi-dimensional approach to tackling poverty and social exclusion. The guidelines therefore suggest the priority objectives to be selected on the basis of a comprehensive analysis of the national social situation.
The adequate use of the commonly agreed indicators is essential to support this streamlined approach. Each portfolio (overarching, social inclusion, pensions, and health) has been designed to cover all key dimensions encompassed in the common objectives with a reduced number of primary indicators. This also meant to focus the presentation of the indicators on key sub-populations, and to include in the proposal the planned developments.
Each strand list therefore constitutes a commonly agreed condensed and comprehensive monitoring tool of a country's social situation with regards to the common objectives in each strand. Member States should therefore assess their situation using the primary level streamlined strand lists. This assessment, supported by relevant national level information, should provide a powerful tool to identify priority objectives. On this basis, Member States are invited to specify what indicators (common and national) will used to monitor progress towards the achievement of the national priority objectives.
2. GUIDING PRINCIPLES FOR THE SELECTION OF INDICATORS AND STATISTICS
The Indicators Sub-Group (ISG) has agreed on a broad common methodological framework for the development of the overarching portfolio, and the review/development of the three strand indicators lists. This framework builds on the methodological principles agreed for the Laeken portfolio. However, it departs from the original framework in two ways: the choice of indicators is not limited to outcome indicators in order to better reflect the action and impact of policies; and, as explained below, some flexibility is introduced as how strictly the criteria are applied, notably allowing for the inclusion in the list of “commonly agreed national indicators" based on commonly agreed definitions and assumptions.
3
Each of the four indicators portfolios (i.e. the portfolio of overarching indicators and each of the three strand indicators portfolios) should aim at providing a comprehensive and efficient tool for the monitoring of the common objectives:
(1) it should be comprehensive and cover all key dimensions of the common objectives;
(2) it should be balanced across the different dimensions;
(3) it should enable a synthetic and transparent assessment of a country's situation in relation to the common objectives.
The selection of individual indicators should, in principle, be guided by the following minimum set of methodological criteria:
(a) An indicator should capture the essence of the problem and have a clear and accepted normative interpretation
(b) An indicator should be robust and statistically validated
(c) An indicator should provide a sufficient level of cross countries comparability, as far as practicable with the use of internationally applied definitions and data collection standards
(d) An indicator should be built on available underlying data, and be timely and susceptible to revision
(e) An indicator should be responsive to policy interventions but not subject to manipulation
Past experience in the development of indicators by the ISG has however shown that specific key information might be essential to capture one of the key dimensions of a commonly agreed policy objective (portfolio criteria 1), while not fulfilling all criteria for the selection of indicators (e.g. comparability, normative value). In order to overcome this difficulty, the ISG has agreed to flag the indicators and statistics included in the different overarching and strand lists according to how they should be used. The following three categories (EU, National, Context) aim at warning the user of the specific purpose and limitations of each indicator in the list
Each portfolio would contain:
– Commonly agreed EU indicators contributing to a comparative assessment of MS's progress towards the common objectives. These indicators might refer to social outcomes, intermediate social outcomes or outputs.
– Commonly agreed national indicators based on commonly agreed definitions and assumptions that provide key information to assess the progress of MS in relation to certain objectives, while not allowing for a direct cross-country comparison, or not necessarily having a clear normative interpretation. These indicators are especially suited to measure the scale and nature of policy intervention. These indicators should be interpreted jointly with the relevant background information (exact definition, assumptions, representativeness).
4
– Context information: Each portfolio will have to be assessed in the light of key context information, and by referring to past, and where relevant, future trends. The list of context information proposed is indicative and leaves room to other background information that would be most relevant to better frame and understand the national context.
Within each strand portfolio, for the sake of streamlining, a reduced number of primary EU and national indicators has been suggested as a condensed set of lead indicators which cover all essential dimensions of the defined objectives and/or highlight the social situation of key sub-populations (portfolio criteria 1 and 2); whereas secondary (EU and national) indicators would support these lead indicators by providing a greater insight into the nature of the problem (portfolio criteria 3).
In chapters 3, 4 and 5 we describe how these overall guiding principles have been applied to the selection of an overarching portfolio (chapter 3), for a streamlined social inclusion portfolio (chapter 4), and for a streamlined pensions portfolio (chapter 5).
In 2006, the report adopted by the SPC only contained a preliminary list of indicators in the area of health care and long-term care, also highlighting areas for development.
In 2008, the SPC adopted a new list of indicators for the monitoring of the health care and long-term care objectives of the Open Method of Coordination on Social Protection and Social Inclusion, as well as two new health related indicators to be included in the overarching portfolio. Chapter 6 presents the newly adopted portfolio.
In 2009, the ISG made significant progress in the field of non-monetary measures. This led to the adoption by the SPC of material deprivation indicators (SI-P8 and SI-S4) as well as indicators and context information in the field of housing – housing costs, overcrowded households and poor housing quality (SI-S5, SI-S6, SI-C12 and SI-C13). It should be noted that in the field of housing no “primary indicators” could be adopted as yet; this will require further work, including further improvement of the quality of the data.
3. THE OVERARCHING PORTFOLIO
As agreed by the March 2006 EPSCO Council, the 3 overarching objectives of the social protection and social inclusion processes are to promote:
(a) social cohesion, equality between men and women and equal opportunities for all through adequate, accessible, financially sustainable, adaptable and efficient social protection systems and social inclusion policies;
(b) effective and mutual interaction between the Lisbon objectives of greater economic growth, more and better jobs and greater social cohesion, and with the EU's Sustainable Development Strategy;
(c) good governance, transparency and the involvement of stakeholders in the design, implementation and monitoring of policy.
5
3.1. Specific guiding principles for the selection of indicators for the overarching portfolio
On the basis of these objectives, the ISG has defined a reduced set of new or already agreed EU or national indicators to monitor each of these broad objectives. In selecting these indicators, the ISG has taken into account the current and planned common indicators used in the 3 social OMCs. In order to enhance the interaction with the Lisbon strategy and the Sustainable Development Strategy, it has also looked at the existing list of structural indicators used for monitoring the Lisbon strategy, as well as at the Sustainable Development Indicators recently adopted by the Commission.
While examining the appropriate methodological principles for the selection of overarching indicators, the ISG reached the following conclusions:
• The portfolio should reflect fully the overarching objectives, including dimensions that are "overarching" (Social Protection expenditures, Labour Market participation rates) and not specific to a strand in particular.
• Indicators do not need to be allocated to objectives (a) and (b) separately, since a number of them illustrate both objectives, as indicated in the first column of the table
• The portfolio should include indicators reflecting the link between the main policy areas and ultimate social cohesion outcomes, this could be achieved through an adequate combination of indicators reflecting social outcomes (e.g. at-risk-poverty rates, other income and living conditions indicators, unemployment rates, educational attainment, etc.) and indicators reflecting the scale and nature of social policy interventions (e.g. social protection expenditures, etc)
• The portfolio should reflect the main priorities of each strand in a balanced way (e.g., reinforce the health dimension)
The list of 14 indicators and 12 context information items presented below is the result of two plenary session discussions and two written consultations.
6
3.2. Overarching portfolio
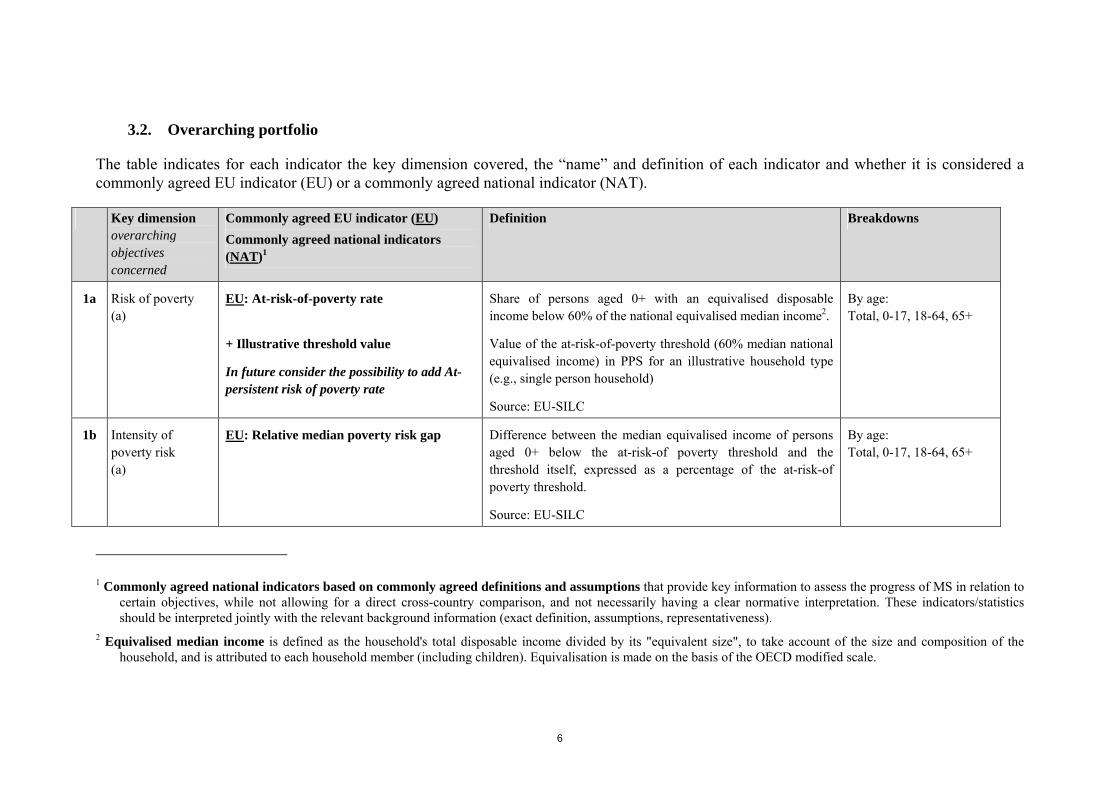
The table indicates for each indicator the key dimension covered, the “name” and definition of each indicator and whether it is considered a commonly agreed EU indicator (EU) or a commonly agreed national indicator (NAT).
Key dimension overarching objectives concerned
Commonly agreed EU indicator (EU) Commonly agreed national indicators (NAT)1
Definition Breakdowns
1a Risk of poverty (a)
EU: At-risk-of-poverty rate
+ Illustrative threshold value
In future consider the possibility to add At-persistent risk of poverty rate
Share of persons aged 0+ with an equivalised disposable income below 60% of the national equivalised median income2.
Value of the at-risk-of-poverty threshold (60% median national equivalised income) in PPS for an illustrative household type (e.g., single person household)
Source: EU-SILC
By age: Total, 0-17, 18-64, 65+
1b Intensity of poverty risk (a)
EU: Relative median poverty risk gap Difference between the median equivalised income of persons aged 0+ below the at-risk-of poverty threshold and the threshold itself, expressed as a percentage of the at-risk-of poverty threshold.
Source: EU-SILC
By age: Total, 0-17, 18-64, 65+
1 Commonly agreed national indicators based on commonly agreed definitions and assumptions that provide key information to assess the progress of MS in relation to certain objectives, while not allowing for a direct cross-country comparison, and not necessarily having a clear normative interpretation. These indicators/statistics should be interpreted jointly with the relevant background information (exact definition, assumptions, representativeness).
2 Equivalised median income is defined as the household's total disposable income divided by its "equivalent size", to take account of the size and composition of the household, and is attributed to each household member (including children). Equivalisation is made on the basis of the OECD modified scale.

7
Key dimension overarching objectives concerned
Commonly agreed EU indicator (EU) Commonly agreed national indicators (NAT)1
Definition Breakdowns
2 Income inequalities (a)
EU: S80/S20
Ratio of total income received by the 20% of the country's population with the highest income (top quintile) to that received by the 20% of the country's population with the lowest income (lowest quintile).
Income must be understood as equivalised disposable income.
Source: EU-SILC
None
3 Health inequalities (a)
NAT: Healthy life expectancy
Number of years that a person at birth, at 45, at 65 is still expected to live in a healthy condition (also called disability- free life expectancy).
To be interpreted jointly with life expectancy
Source: EUROSTAT
At birth, at 45, at 65 By sex

8
Key dimension overarching objectives concerned
Commonly agreed EU indicator (EU) Commonly agreed national indicators (NAT)1
Definition Breakdowns
4 Educational outcome and human capital formation
(a)/(b)
EU: Early school leavers Share of persons aged 18 to 24 who have only lower secondary education (their highest level of education or training attained is 0, 1 or 2 according to the 1997 International Standard Classification of Education – ISCED 97) and have not received education or training in the four weeks preceding the survey.
Source: LFS
By sex
5 Access to labour market (a)/(b)
EU: People living in jobless households Proportion of people living in jobless households, expressed as a share of all people in the same age group3. This indicator should be analysed in the light of context indicator N°8: jobless households by main household types
Source: LFS
By age: 0-17, 18-59 By sex (18+ only)
3 Students aged 18-24 years who live in households composed solely of students are not counted in neither numerator nor denominator
9
Key dimension overarching objectives concerned
Commonly agreed EU indicator (EU) Commonly agreed national indicators (NAT)1
Definition Breakdowns
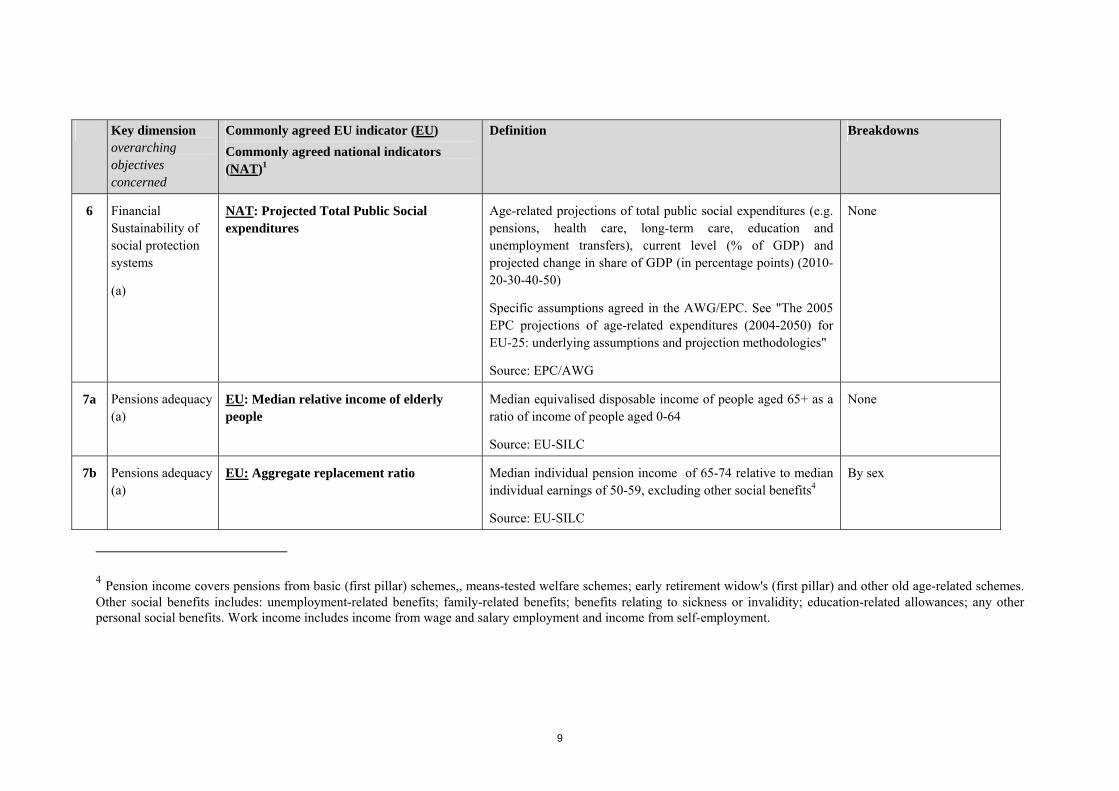
6 Financial Sustainability of social protection systems
(a)
NAT: Projected Total Public Social expenditures
Age-related projections of total public social expenditures (e.g. pensions, health care, long-term care, education and unemployment transfers), current level (% of GDP) and projected change in share of GDP (in percentage points) (2010-20-30-40-50)
Specific assumptions agreed in the AWG/EPC. See "The 2005 EPC projections of age-related expenditures (2004-2050) for EU-25: underlying assumptions and projection methodologies"
Source: EPC/AWG
None
7a Pensions adequacy(a)
EU: Median relative income of elderly people
Median equivalised disposable income of people aged 65+ as a ratio of income of people aged 0-64
Source: EU-SILC
None
7b Pensions adequacy(a)
EU: Aggregate replacement ratio Median individual pension income of 65-74 relative to median individual earnings of 50-59, excluding other social benefits4
Source: EU-SILC
By sex
4 Pension income covers pensions from basic (first pillar) schemes,, means-tested welfare schemes; early retirement widow's (first pillar) and other old age-related schemes. Other social benefits includes: unemployment-related benefits; family-related benefits; benefits relating to sickness or invalidity; education-related allowances; any other personal social benefits. Work income includes income from wage and salary employment and income from self-employment.
10
Key dimension overarching objectives concerned
Commonly agreed EU indicator (EU) Commonly agreed national indicators (NAT)1
Definition Breakdowns
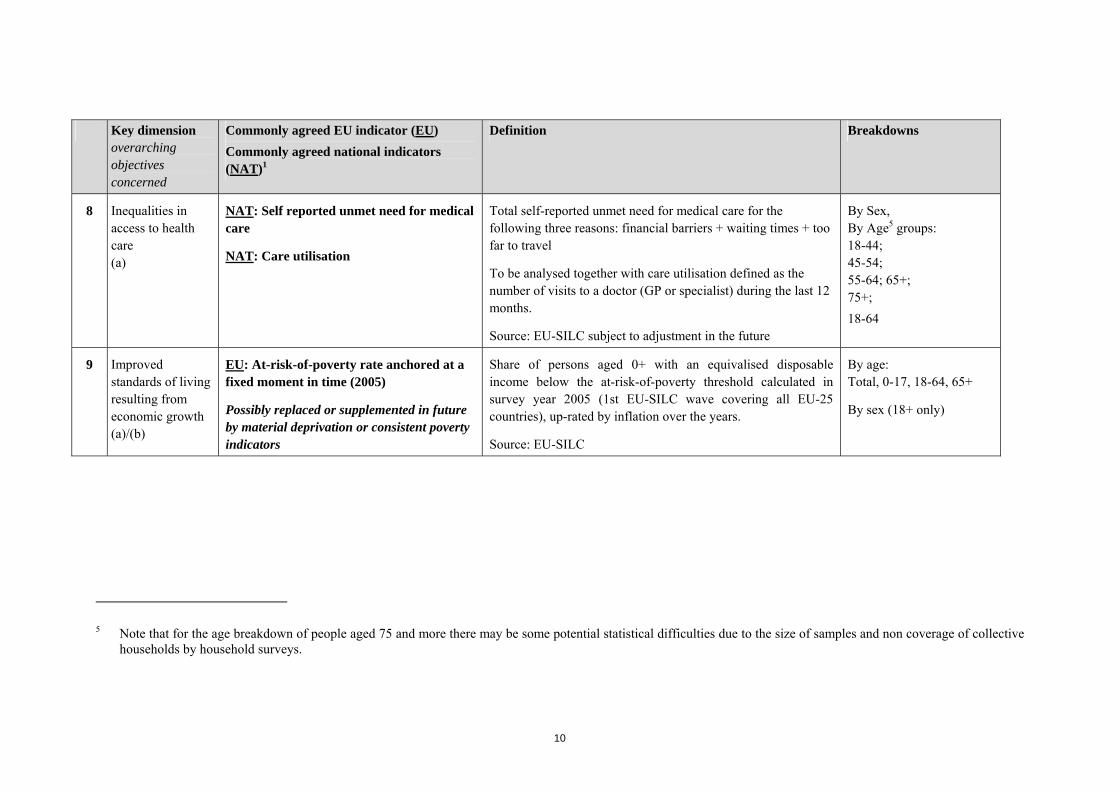
8 Inequalities in access to health care (a)
NAT: Self reported unmet need for medical care
NAT: Care utilisation
Total self-reported unmet need for medical care for the following three reasons: financial barriers + waiting times + too far to travel
To be analysed together with care utilisation defined as the number of visits to a doctor (GP or specialist) during the last 12 months.
Source: EU-SILC subject to adjustment in the future
By Sex, By Age5 groups: 18-44; 45-54; 55-64; 65+; 75+; 18-64
9 Improved standards of living resulting from economic growth (a)/(b)
EU: At-risk-of-poverty rate anchored at a fixed moment in time (2005)
Possibly replaced or supplemented in future by material deprivation or consistent poverty indicators
Share of persons aged 0+ with an equivalised disposable income below the at-risk-of-poverty threshold calculated in survey year 2005 (1st EU-SILC wave covering all EU-25 countries), up-rated by inflation over the years.
Source: EU-SILC
By age: Total, 0-17, 18-64, 65+
By sex (18+ only)
5 Note that for the age breakdown of people aged 75 and more there may be some potential statistical difficulties due to the size of samples and non coverage of collective
households by household surveys.
11
Key dimension overarching objectives concerned
Commonly agreed EU indicator (EU) Commonly agreed national indicators (NAT)1
Definition Breakdowns
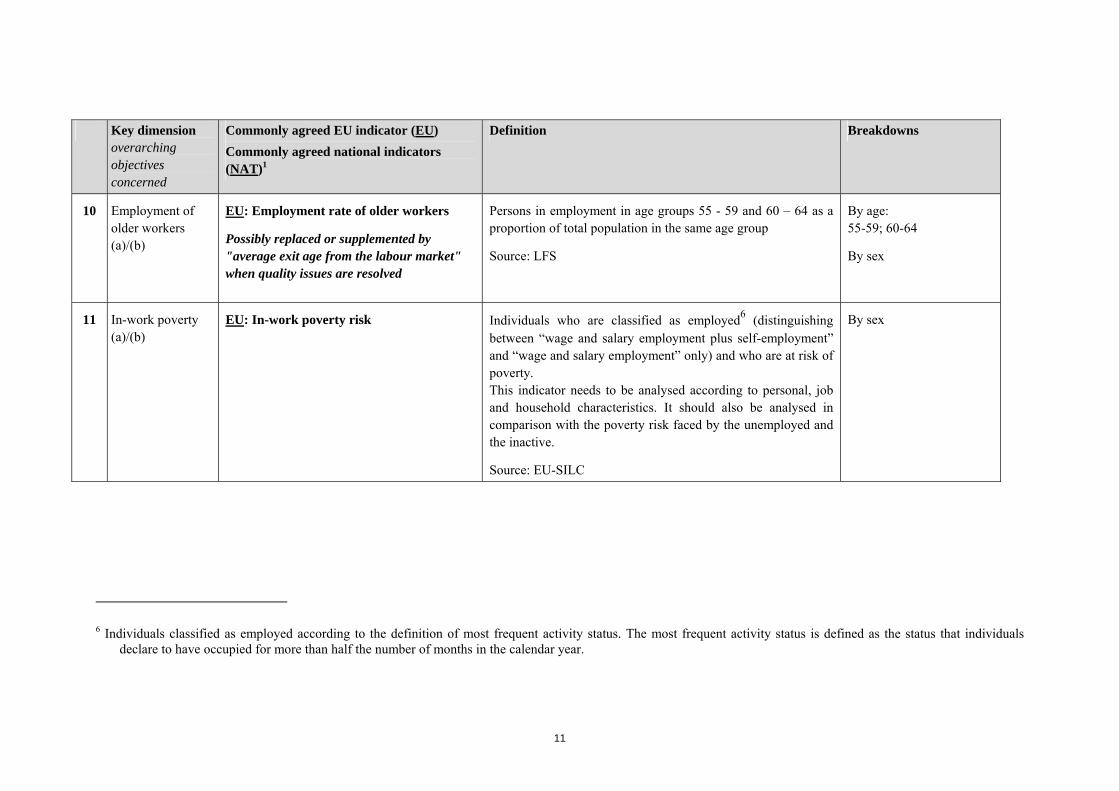
10 Employment of older workers (a)/(b)
EU: Employment rate of older workers
Possibly replaced or supplemented by "average exit age from the labour market" when quality issues are resolved
Persons in employment in age groups 55 - 59 and 60 – 64 as a proportion of total population in the same age group
Source: LFS
By age: 55-59; 60-64
By sex
11 In-work poverty (a)/(b)
EU: In-work poverty risk Individuals who are classified as employed6 (distinguishing between “wage and salary employment plus self-employment” and “wage and salary employment” only) and who are at risk of poverty. This indicator needs to be analysed according to personal, job and household characteristics. It should also be analysed in comparison with the poverty risk faced by the unemployed and the inactive.
Source: EU-SILC
By sex
6 Individuals classified as employed according to the definition of most frequent activity status. The most frequent activity status is defined as the status that individuals
declare to have occupied for more than half the number of months in the calendar year.

12
Key dimension overarching objectives concerned
Commonly agreed EU indicator (EU) Commonly agreed national indicators (NAT)1
Definition Breakdowns
12 Participation in labour market (a)/(b)
EU: Activity rate
Possibly replaced or supplemented in future by MWP indicators
Share of employed and unemployed people in total population of working age 15-64
Source: LFS
By sex and age: 15-24, 25-54, 55-59; 60-64; Total
13 Regional cohesion(a)/(b)
NAT: Regional disparities – coefficient of variation of employment rates
Standard deviation7 of regional employment rates divided by the weighted national average (age group 15-64 years). (NUTS II)
Source: LFS
14 Per capita health expenditure (a)/(b)
NAT: total health expenditure per capita Total health expenditure per capita in PPP
Source: EUROSTAT based on system of health accounts (SHA)
7 Standard deviation measures how, on average, the situation in regions differs from the national average. As a complement to the indicator a graph showing
max/min/average per country is presented. Possible alternative measures: Regional disparities – underperforming regions. Source LFS 1. Share of underperforming regions in terms of employment and unemployment (in relation to all regions and to the working age population/labour force) (NUTS II). 2. Differential between average employment/unemployment of the underperforming regions and the national average in relation to the national average of employment/unemployment (NUTS II) Thresholds to be applied: 90% and 150% of the national average rate for employment and unemployment, respectively. (An extra column with the national employment and unemployment rates would be included)
13
3.3. Context information
The overarching indicators will have to be assessed in the light of key context information and by referring to past, and where relevant, future trends. The list of context information is indicative and leaves room to other background information that would be most relevant to frame and understand better the national socio-economic context
(1) GDP growth
(2) Employment rate, by sex Unemployment rate, by sex, and key age groups Long term unemployment rate, by sex and key age groups
(3) Life expectancy at birth and at 65
(4) Old age dependency ratio, current and projected
(5) Distribution of population by household types, including collective households
(6) Public debt, current and projected, % of GDP
(7) Social protection expenditure, current, by function, gross and net (ESPROSS)
(8) Jobless households by main household types (see breakdown of Social Inclusion indicator 1a)
(9) Making work pay indicators (unemployment trap, inactivity trap (esp. second earner case), low-wage trap.
14
(10) Net income of social assistance recipients as a % of the at-risk of poverty threshold for 3 jobless household types8.
(11) At-risk of poverty rate before social transfers (other than pensions), 0-17, 18-64, 65+9
(12) NAT: Change in projected theoretical replacement ratio10 for base case 2004-2050 accompanied with information on type of pension scheme (DB, DC or NDC), and change in projected public pension expenditure 2004-2050. (These results should systematically be presented collectively in one table). + assumptions and relevant background information on representativeness + present also calculations of changes in replacement rates for one or two other cases, if suitable (for instance OECD)
8 This indicator refers to the income of people living in households that only rely on "last resort" social assistance benefits (including related housing benefits) and for
which no other income stream is available (from other social protection benefits – e.g. unemployment or disability schemes – or from work). The aim of such an indicator is to evaluate if the safety nets provided to those households most excluded from the labour market are sufficient to lift people out of poverty. This indicator is calculated on the basis of the tax-benefit models developed jointly by the OECD and the European Commission. It is only calculated for Countries where non-categorical social benefits are in place and for 3 jobless household types: single, lone parent, 2 children and couple with 2 children. This indicator is especially relevant when analysing MWP indicators
9 This indicator is meant to compare the observed risk of poverty with a hypothetical measure of a risk of poverty in absence of all social transfers (other than pensions) all things being kept equal. In particular, household and labour market structure are kept unchanged. This measure does not take into account other types of transfers that have an impact on household disposable income such as transfers in kind and tax rebates.
10 Definition: Change in the theoretical level of income from pensions at the moment of take-up related to the income from work in the last year before retirement for a hypothetical worker (base case), percentage points, 2004-2050, with information on the type of pension scheme (DB, DC or NDC) and changes in the public pension expenditure as a share of GDP, 2004-2050. This information can only collectively form the indicator called Projected theoretical replacement ratio. Results relate to current and projected, gross (public and private) and total net replacement rates, and should be accompanied by information on representativeness and assumptions (contribution rates and coverage rate, public and private). Specific assumptions agreed in the ISG. For further details, see 2006 report on Replacement Rates. Source: ISG and AWG
15
4. STREAMLINED SOCIAL INCLUSION PORTFOLIO
The new streamlined social inclusion objectives
For the social inclusion strand the aim is to make "a decisive impact on the eradication of poverty and social exclusion by ensuring:
(d) access for all to the resources, rights and services needed for participation in society, preventing and addressing exclusion, and fighting all forms of discrimination leading to exclusion;
(e) the active social inclusion of all, both by promoting participation in the labour market and by fighting poverty and exclusion;
(f) that social inclusion policies are well-coordinated and involve all levels of government and relevant actors, including people experiencing poverty, that they are efficient and effective and mainstreamed into all relevant public policies, including economic, budgetary, education and training policies and structural fund (notably ESF) programmes.
The methodological approach to reviewing the Laeken list
Indicators to be used for monitoring the social inclusion strand of the Social Protection and Social Inclusion Strategy largely draw from the existing set of "Laeken indicators" in its present form. Also the methodological framework that was originally used to set up the list is maintained in its essence. That is, it is proposed to maintain the distinction between primary and secondary indicators. Accordingly, primary indicators would still be a restricted number of "lead indicators which cover the broad fields that have been considered the most important elements in leading to social exclusion"; whereas secondary indicators would support these lead indicators by describing in greater detail the nature of the problem or by describing other dimensions of the problem. Member States are expected to use at least the primary indicators in their national strategy reports, if only to emphasise that in the context of the EU social inclusion process poverty and social exclusion are a relative concept that encompasses income, access to essential durables, education, health care, adequate housing, distance from the labour market.
The agreed list contains 11 primary indicators, 3 secondary indicators and 11 context indicators In practice, the primary list has been re-focused to contain only the most important indicators that describe the various dimensions of poverty and social exclusion. A few indicators that were in
16
the primary list became secondary indicators. Other Laeken indicators are now included in the overarching portfolio, either because they are considered as more appropriate to monitor overall social cohesion (in which case they are only kept as context information) or because they are considered crucial indicators to monitor both social cohesion (and/or its interaction with employment and growth) and social exclusion and poverty (in this case, they are included in both lists). Finally, a few indicators were considered redundant and were dropped: persistent poverty calculated with a 50% threshold, long-term unemployment share and very long-term unemployment rate.

17
4.1. Primary indicators
Commonly agreed EU indicator (EU) Commonly agreed national indicators (NAT)11
Definition Age break-down
Gender break-down
Other breakdowns and comments
SI-P1
EU: At-risk-of poverty rate
+ illustrative threshold values
Share of persons aged 0+ with an equivalised disposable income below 60% of the national equivalised median income.
Equivalised median income is defined as the household's total disposable income divided by its "equivalent size", to take account of the size and composition of the household, and is attributed to each household member. Equivalization is made on the basis of the OECD modified scale.
Complemented by the value of the at-risk-of-poverty threshold (60% median national equivalised income) in PPS for two illustrative households: a single-person household and a household consisting of two adults and two children.
Age groups: 0-17; 18-64; 65+
Yes, applying to people aged 18+
The full range of age breakdowns originally agreed upon for this indicator could be contained in the secondary list, as well as in the pension indicators' list for what concerns the older age group.
For each country, the poverty risk indicator must be assessed by looking at both the number of people whose income is below the threshold and the comparative level (in PPS) of this threshold.
This indicator is also included in the overarching portfolio (indicator 1a).
SI-P2
EU: Persistent at-risk of poverty rate
Share of persons aged 0+ with an equivalised disposable income below the at-risk-of-poverty threshold in the current year and in at least two of the preceding three years.
Age groups: 0-17; 18-64; 65+
Yes, applying to people aged 18+
This indicator will become available as from 2009, when four years of longitudinal data from EU-SILC will be available for the 13 EU countries that launched EU-SILC in 2004. It will be available for all EU-25 MS as from 2010 and a year or two later for BG and RO.
11 Commonly agreed national indicators based on commonly agreed definitions and assumptions that provide key information to assess the progress of MS in relation to certain objectives, while not allowing for a direct cross-country comparison, and not necessarily having a clear normative interpretation. These indicators/statistics should be interpreted jointly with the relevant background information (exact definition, assumptions, representativeness).
18
Commonly agreed EU indicator (EU) Commonly agreed national indicators (NAT)11
Definition Age break-down
Gender break-down
Other breakdowns and comments
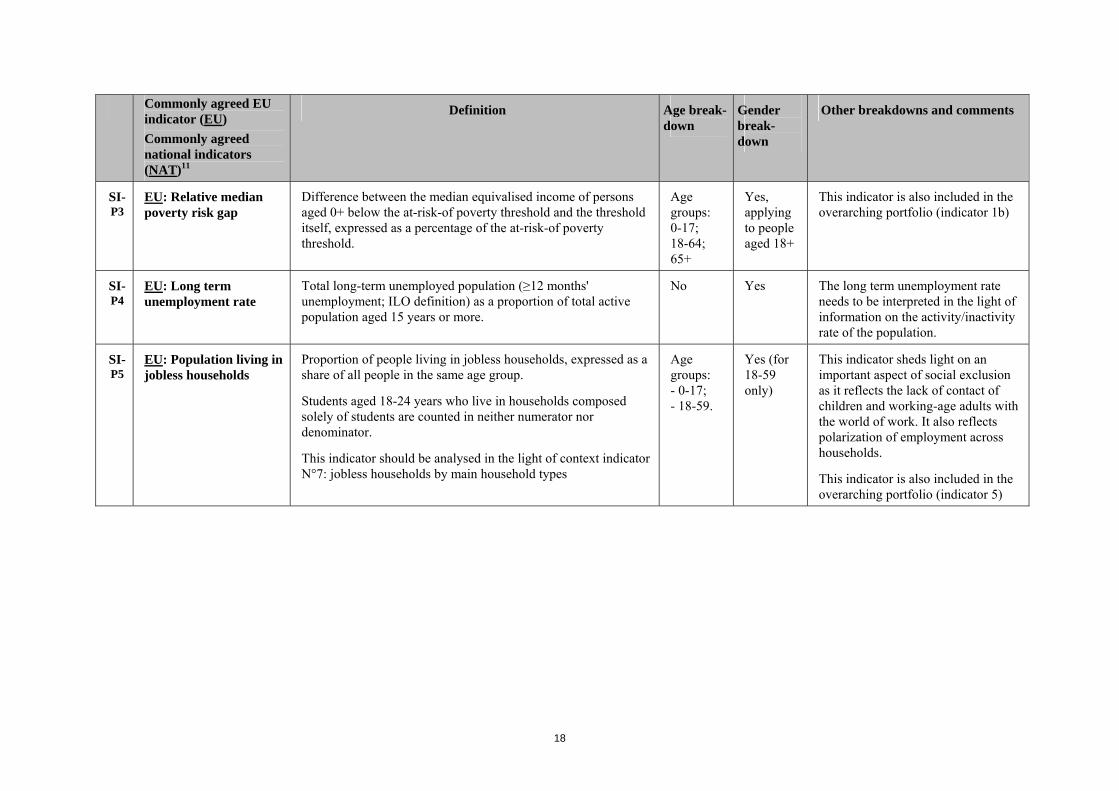
SI-P3
EU: Relative median poverty risk gap
Difference between the median equivalised income of persons aged 0+ below the at-risk-of poverty threshold and the threshold itself, expressed as a percentage of the at-risk-of poverty threshold.
Age groups: 0-17; 18-64; 65+
Yes, applying to people aged 18+
This indicator is also included in the overarching portfolio (indicator 1b)
SI-P4
EU: Long term unemployment rate
Total long-term unemployed population (≥12 months' unemployment; ILO definition) as a proportion of total active population aged 15 years or more.
No Yes The long term unemployment rate needs to be interpreted in the light of information on the activity/inactivity rate of the population.
SI-P5
EU: Population living in jobless households
Proportion of people living in jobless households, expressed as a share of all people in the same age group.
Students aged 18-24 years who live in households composed solely of students are counted in neither numerator nor denominator.
This indicator should be analysed in the light of context indicator N°7: jobless households by main household types
Age groups: - 0-17; - 18-59.
Yes (for 18-59 only)
This indicator sheds light on an important aspect of social exclusion as it reflects the lack of contact of children and working-age adults with the world of work. It also reflects polarization of employment across households.
This indicator is also included in the overarching portfolio (indicator 5)

19
Commonly agreed EU indicator (EU) Commonly agreed national indicators (NAT)11
Definition Age break-down
Gender break-down
Other breakdowns and comments
SI-P6
EU: Early school leavers not in education or training
Share of persons aged 18 to 24 who have only lower secondary education (their highest level of education or training attained is 0, 1 or 2 according to the 1997 International Standard Classification of Education – ISCED 97) and have not received education or training in the four weeks preceding the survey.
No Yes This indicator is also included in the overarching portfolio (indicator 4)
The definition of this indicator may be amended following the recommendation by Eurostat to focus on the age group 20-24 years (and in line with EMCO).
SI-P7
NAT: Employment gap of immigrants
Percentage point difference between the employment rate for non-immigrants and that for immigrants. Immigrants are defined on the basis of the variable "born abroad12" (and it is up to each Country to decide whether to include nationals born abroad or not, as appropriate)
No Yes This indicator needs to be supplemented by relevant national data covering other key aspects of inclusion of immigrants.
SI-P8
EU: Material deprivation rate
Share of population living in households lacking at least 3 items among the following 9 items: The household could not afford: i) to face unexpected expenses, ii) one week annual holiday away from home, iii) to pay for arrears (mortgage or rent, utility bills or hire purchase instalments), iv) a meal with meat, chicken or fish every second day, v) to keep home adequately warm, or could not afford (even if wanted to): vi) a washing machine, vii) a colour TV, viii) a telephone, ix) a personal car.
Age groups: 0-17; 18-64; 65+
Yes Other breakdown: at-risk-of-poverty/ not at-risk-of-poverty (see above, definition SI-P1); degree of urbanisation; household type
12 The indicator should be presented both for EU-27 and non EU-27 migrants.
20
Commonly agreed EU indicator (EU) Commonly agreed national indicators (NAT)11
Definition Age break-down
Gender break-down
Other breakdowns and comments
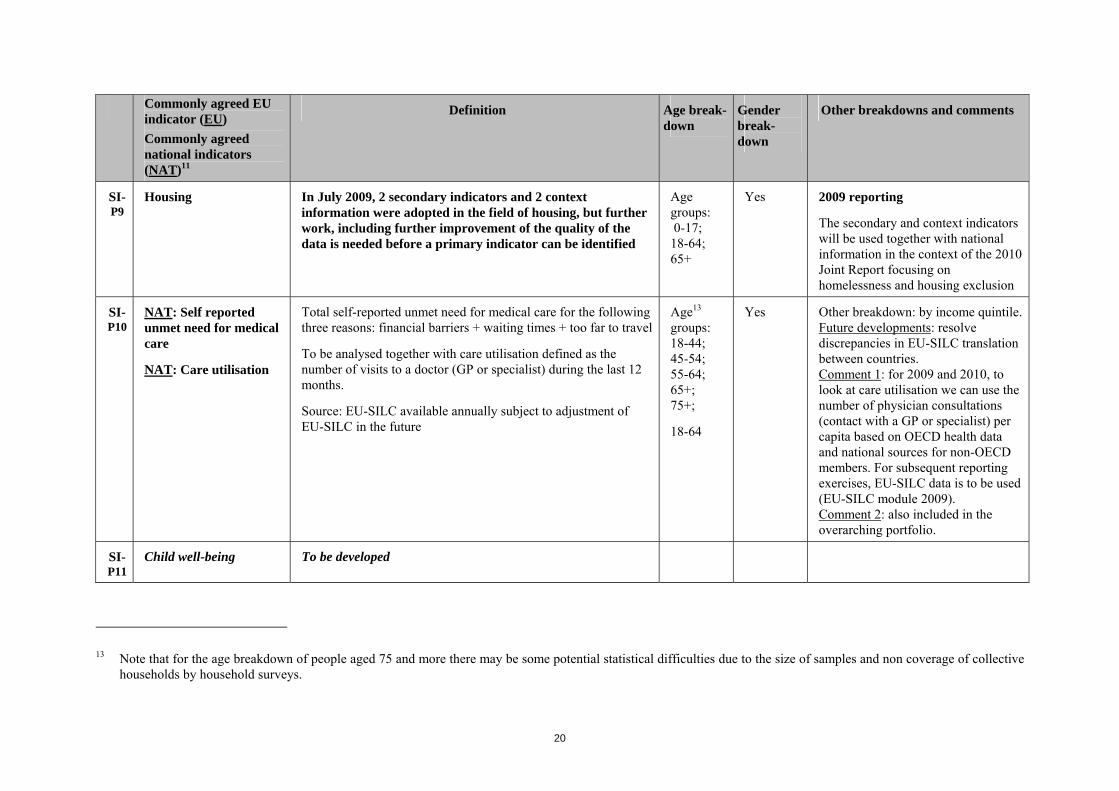
SI-P9
Housing In July 2009, 2 secondary indicators and 2 context information were adopted in the field of housing, but further work, including further improvement of the quality of the data is needed before a primary indicator can be identified
Age groups: 0-17; 18-64; 65+
Yes 2009 reporting
The secondary and context indicators will be used together with national information in the context of the 2010 Joint Report focusing on homelessness and housing exclusion
SI-P10
NAT: Self reported unmet need for medical care
NAT: Care utilisation
Total self-reported unmet need for medical care for the following three reasons: financial barriers + waiting times + too far to travel
To be analysed together with care utilisation defined as the number of visits to a doctor (GP or specialist) during the last 12 months.
Source: EU-SILC available annually subject to adjustment of EU-SILC in the future
Age13 groups: 18-44; 45-54; 55-64; 65+; 75+;
18-64
Yes Other breakdown: by income quintile. Future developments: resolve discrepancies in EU-SILC translation between countries. Comment 1: for 2009 and 2010, to look at care utilisation we can use the number of physician consultations (contact with a GP or specialist) per capita based on OECD health data and national sources for non-OECD members. For subsequent reporting exercises, EU-SILC data is to be used (EU-SILC module 2009). Comment 2: also included in the overarching portfolio.
SI-P11
Child well-being To be developed
13 Note that for the age breakdown of people aged 75 and more there may be some potential statistical difficulties due to the size of samples and non coverage of collective
households by household surveys.

21
4.2 Secondary indicators
Commonly agreed EU indicator (EU)
Commonly agreed national indicators (NAT)14
Definition Age break-down
Gender break-down
Other breakdowns and comments
SI-S1
EU: At-risk-of poverty rate
Share of persons aged 0+ with an equivalised disposable income below 60% of the national equivalised median income.
Age groups: 0-17; 18-24; 25-54; 55-64; 65+;
18-64
Yes, applying to people aged 18+
Full range of age breakdowns
For each country, the poverty risk indicator must be assessed by looking at both the number of people whose income is below the threshold and the comparative level (in PPS) of this threshold.
14 Commonly agreed national indicators based on commonly agreed definitions and assumptions that provide key information to assess the progress of MS in relation to certain objectives, while not allowing for a direct cross-country comparison, and not necessarily having a clear normative interpretation. These indicators/statistics should be interpreted jointly with the relevant background information (exact definition, assumptions, representativeness).

22
Commonly agreed EU indicator (EU)
Commonly agreed national indicators (NAT)14
Definition Age break-down
Gender break-down
Other breakdowns and comments
SI-S1a
EU: Poverty risk by household type
Poverty risk for the total population aged 0+ in the following household types:
Households with no dependent children: - Single person, under 65 years old - Single person, 65 years and over - Single women - Single men - Two adults, at least one person 65 years and over - Two adults, both under 65 years - Other households
Households with dependent children15: - Single parent, 1 or more dependent children - Two adults, one dependent child - Two adults, two dependent children - Two adults, three or more dependent children - Three or more adults with dependent children
Already specified in the typology of households.
Already specified in the typology of households.
15 Dependent children are all individuals aged 0 – 17 years as well as individuals aged 18 – 24 years if inactive and living with at least one parent.
23
Commonly agreed EU indicator (EU)
Commonly agreed national indicators (NAT)14
Definition Age break-down
Gender break-down
Other breakdowns and comments
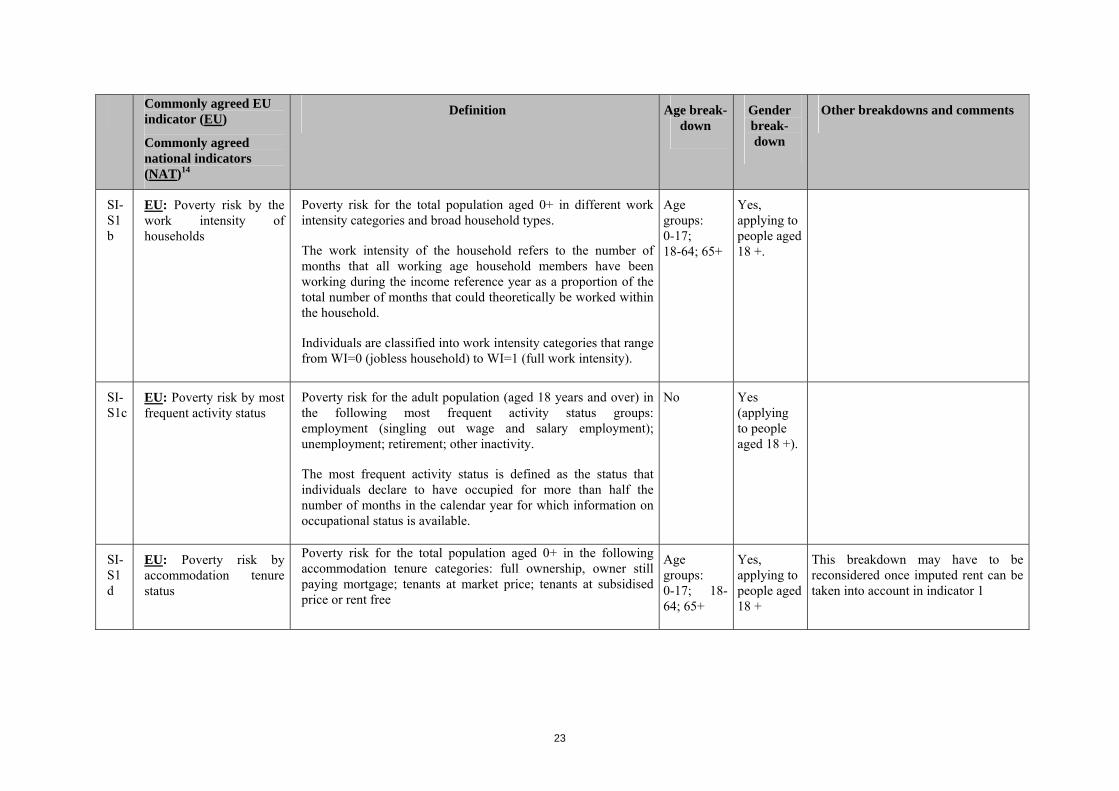
SI-S1b
EU: Poverty risk by the work intensity of households
Poverty risk for the total population aged 0+ in different work intensity categories and broad household types.
The work intensity of the household refers to the number of months that all working age household members have been working during the income reference year as a proportion of the total number of months that could theoretically be worked within the household.
Individuals are classified into work intensity categories that range from WI=0 (jobless household) to WI=1 (full work intensity).
Age groups: 0-17; 18-64; 65+
Yes, applying to people aged 18 +.
SI-S1c
EU: Poverty risk by most frequent activity status
Poverty risk for the adult population (aged 18 years and over) in the following most frequent activity status groups: employment (singling out wage and salary employment); unemployment; retirement; other inactivity.
The most frequent activity status is defined as the status that individuals declare to have occupied for more than half the number of months in the calendar year for which information on occupational status is available.
No Yes (applying to people aged 18 +).
SI-S1d
EU: Poverty risk by accommodation tenure status
Poverty risk for the total population aged 0+ in the following accommodation tenure categories: full ownership, owner still paying mortgage; tenants at market price; tenants at subsidised price or rent free
Age groups: 0-17; 18-64; 65+
Yes, applying to people aged 18 +
This breakdown may have to be reconsidered once imputed rent can be taken into account in indicator 1

24
Commonly agreed EU indicator (EU)
Commonly agreed national indicators (NAT)14
Definition Age break-down
Gender break-down
Other breakdowns and comments
SI-S1e
EU: Dispersion around the at-risk-of-poverty threshold
Share of persons aged 0+ with an equivalised disposable income below 40%, 50% and 70% of the national equivalised median income.
Age groups: 0-17; 18-64; 65+
Yes, applying to people aged 18 +
SI-S2
EU: Persons with low educational attainment
Share of the adult population (aged 25 years and over) whose highest level of education or training is ISCED 0, 1 or 2.
Definition subject to change following current Eurostat work on this indicator
Age groups: 25-34; 35-54; 55-64; 65+; 25-64.
Yes Please note the reduction of the age breakdowns
SI-S3
EU: Low reading literacy performance of pupils
Share of 15 years old pupils who are at level 1 or below of the PISA combined reading literacy scale
N.A. Yes Available every three years. Benchmark indicator of the education and training OMC

25
Commonly agreed EU indicator (EU)
Commonly agreed national indicators (NAT)14
Definition Age break-down
Gender break-down
Other breakdowns and comments
SI-S4
EU: Depth of material deprivation
Unweighted mean of the number of items lacked by the population concerned out of the nine items retained for the definition of the “material deprivation” indicator (see above, indicator SI-P8).
No Indicator to be provided for the total population as well as for the poor/non-poor breakdown (definition: SI-P1above) and the deprived/not-deprived breakdown (definition: SI-P8)
SI-S5
EU: Housing costs Percentage of the population living in a household where total housing costs (net of housing allowances) represent more than 40% of the total disposable household income (net of housing allowances).
Housing costs include mortgage interest payments (net of any tax relief) for owners and rent payments, gross of housing benefits for renters, housing benefits for rent free households. They also include structural insurance, mandatory services and charges (sewage removal, refuse removal, etc.), regular maintenance and repairs, taxes, and the cost of utilities (water, electricity, gas and heating). They do not include capital repayment for mortgage holders.
Housing allowances include rent benefits16 and benefits to owner-occupiers17
Sex: Yes Age: 0-17; 18-64; 65+
Eurostat will investigate the possibility of collecting the value of capital repayment as a component of housing costs. Currently, capital repayment is considered as investment (in line with national accounts principles). However, when measuring the current burden of housing costs for households, this part of the mortgage should also be taken into account.
Other breakdowns: income quintiles; poor/non-poor; tenure status (4 categories: full ownership, owner still paying mortgage; tenants at market price; tenants at subsidised price or rent free); degree of urbanisation; household type.
16 Rent benefit: a current means-tested transfer granted by public authority to tenants, temporarily or on a long-term basis, to help them with rent costs.

26
Commonly agreed EU indicator (EU)
Commonly agreed national indicators (NAT)14
Definition Age break-down
Gender break-down
Other breakdowns and comments
SI-S6
EU: Overcrowding Percentage of people living in an overcrowded household
- All households18 - excluding single households.
The person is considered as living in an overcrowded household if the household doesn't have at its disposal at least: - one room for the household; - one room for each couple; - one room for each single person aged 18+; - one room - for two single people of the same sex between 12 and 17 years of age; - one room - for each single person of different sex between 12 and 17 years of age; - one room - for two people under 12 years of age.
Sex: Age: 0-17; 18-64; 65+
Other breakdowns:
For all households: poor/non-poor; tenure status (4 categories: full ownership, owner still paying mortgage; tenants at market price; tenants at subsidised price or rent free); degree of urbanisation; household type.
Excluding single households: poor/non-poor;
17 Benefit to owner occupier: a means-tested transfer by public authority to owner-occupiers to alleviate their current housing costs; in practice, often help with mortgage
reimbursements.
18 The calculation includes single households and considers them as deprived if they live in a studio with a bedroom not separated from the living room. This calculation based on all households should systematically be used if the overcrowding criteria is analysed together with other housing quality criteria.
27
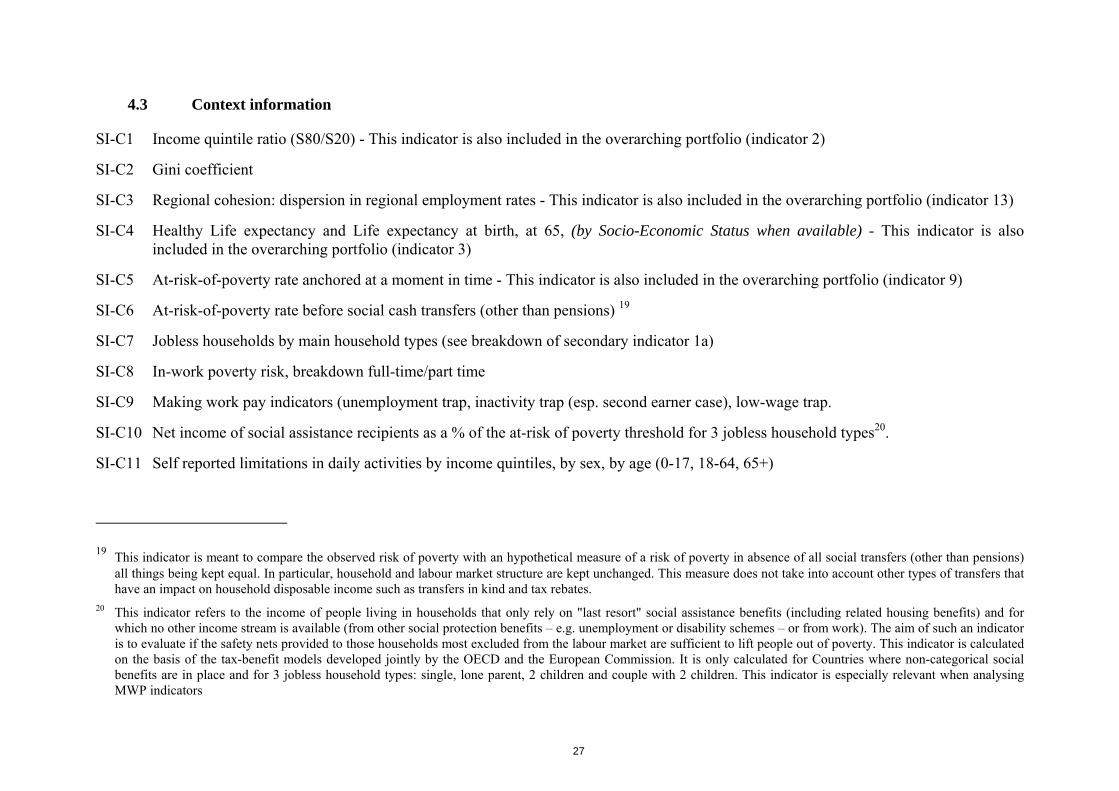
4.3 Context information
SI-C1 Income quintile ratio (S80/S20) - This indicator is also included in the overarching portfolio (indicator 2)
SI-C2 Gini coefficient
SI-C3 Regional cohesion: dispersion in regional employment rates - This indicator is also included in the overarching portfolio (indicator 13)
SI-C4 Healthy Life expectancy and Life expectancy at birth, at 65, (by Socio-Economic Status when available) - This indicator is also included in the overarching portfolio (indicator 3)
SI-C5 At-risk-of-poverty rate anchored at a moment in time - This indicator is also included in the overarching portfolio (indicator 9)
SI-C6 At-risk-of-poverty rate before social cash transfers (other than pensions) 19
SI-C7 Jobless households by main household types (see breakdown of secondary indicator 1a)
SI-C8 In-work poverty risk, breakdown full-time/part time
SI-C9 Making work pay indicators (unemployment trap, inactivity trap (esp. second earner case), low-wage trap.
SI-C10 Net income of social assistance recipients as a % of the at-risk of poverty threshold for 3 jobless household types20.
SI-C11 Self reported limitations in daily activities by income quintiles, by sex, by age (0-17, 18-64, 65+)
19 This indicator is meant to compare the observed risk of poverty with an hypothetical measure of a risk of poverty in absence of all social transfers (other than pensions) all things being kept equal. In particular, household and labour market structure are kept unchanged. This measure does not take into account other types of transfers that have an impact on household disposable income such as transfers in kind and tax rebates.
20 This indicator refers to the income of people living in households that only rely on "last resort" social assistance benefits (including related housing benefits) and for which no other income stream is available (from other social protection benefits – e.g. unemployment or disability schemes – or from work). The aim of such an indicator is to evaluate if the safety nets provided to those households most excluded from the labour market are sufficient to lift people out of poverty. This indicator is calculated on the basis of the tax-benefit models developed jointly by the OECD and the European Commission. It is only calculated for Countries where non-categorical social benefits are in place and for 3 jobless household types: single, lone parent, 2 children and couple with 2 children. This indicator is especially relevant when analysing MWP indicators

28
SI-C12 Housing deprivation by item: Percentage of the population deprived of each housing deprivation item, and by number of items. The following housing deprivation items are considered: - Leaking roof, damp walls/floors/foundations, or rot in window frames or floors; - no bath or shower in the dwelling; - no indoor flushing toilet for the sole use of the household; - Dwelling too dark. Breakdowns: sex, age (0-17; 18-64; 65+); for the 4 items only: poor/non-poor;
SI-C13 Share of housing costs in total disposable household income: Median of the distribution among individuals of the share of housing costs (net of housing allowances) in total disposable income (net of housing allowances) - median for the total population Breakdowns: sex, age (0-17; 18-64; 65+); poor/non-poor; degree of urbanisation
29
5. STREAMLINED PENSIONS PORTFOLIO
The list of streamlined indicators to reflect the three streamlined objectives as regards pensions is based on the available set of indicators developed by the ISG (as reflected by the list of indicators and data used for the 2005 National Strategy Reports on pensions and on previous ISG reports on work in progress as regards indicators on pensions in late 2002).
The agreed list contains 11 primary indicators, 11 secondary indicators and 5 context indicators regrouped according to the streamlined objective to which they refer. Since the perspective dimension is fundamental for pensions, national indicators based on commonly agreed definitions and assumptions (as explained in section 2) have also been included.
The ISG has also agreed to consider developing other indicators which would cover the following dimensions:
• Material deprivation of older people (regarding first streamlined objective for pensions); • Age of entry into the labour market (regarding first streamlined objective for pensions); • Coverage rate of public statutory pension schemes and private pensions (as a percentage of the working age population and active
population) (regarding first streamlined objective for pensions); • Financial incentives to work longer (regarding first two streamlined objectives for pensions); • Administrative costs of private pensions (regarding second streamlined objective for pensions); • Assets in all pension schemes (statutory and occupational, including reserve funds), current and projected (as percentage of GDP) up to
2050 (regarding second streamlined objective for pensions); • Past ten years performance on pension funds (average and standard deviation) (regarding second streamlined objective for pensions); • Share of active population having access to information on their individual pension entitlements (regarding third streamlined objective
for pensions); • Average typical length of vesting/waiting periods (regarding third streamlined objective for pensions); • Replacement rates associated with non standard careers (career breaks, succession of several pension schemes) (regarding third
streamlined objective for pensions); • Number of pensions' beneficiaries • Aggregate replacement ratio calculated with longitudinal data; • Further developments associated with theoretical prospective replacement rates (see below).
30
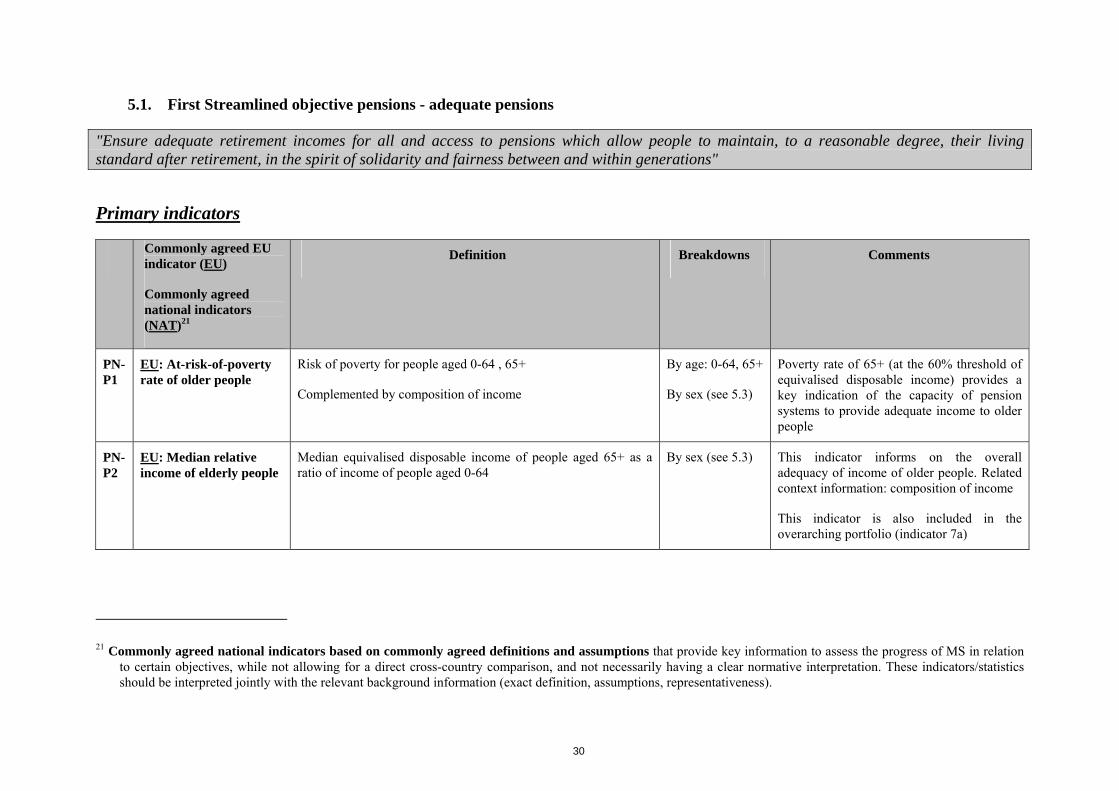
5.1. First Streamlined objective pensions - adequate pensions
"Ensure adequate retirement incomes for all and access to pensions which allow people to maintain, to a reasonable degree, their living standard after retirement, in the spirit of solidarity and fairness between and within generations"
Primary indicators
Commonly agreed EU indicator (EU)
Commonly agreed national indicators (NAT)21
Definition Breakdowns Comments
PN-P1
EU: At-risk-of-poverty rate of older people
Risk of poverty for people aged 0-64 , 65+
Complemented by composition of income
By age: 0-64, 65+
By sex (see 5.3)
Poverty rate of 65+ (at the 60% threshold of equivalised disposable income) provides a key indication of the capacity of pension systems to provide adequate income to older people
PN-P2
EU: Median relative income of elderly people
Median equivalised disposable income of people aged 65+ as a ratio of income of people aged 0-64
By sex (see 5.3) This indicator informs on the overall adequacy of income of older people. Related context information: composition of income
This indicator is also included in the overarching portfolio (indicator 7a)
21 Commonly agreed national indicators based on commonly agreed definitions and assumptions that provide key information to assess the progress of MS in relation to certain objectives, while not allowing for a direct cross-country comparison, and not necessarily having a clear normative interpretation. These indicators/statistics should be interpreted jointly with the relevant background information (exact definition, assumptions, representativeness).

31
Commonly agreed EU indicator (EU)
Commonly agreed national indicators (NAT)21
Definition Breakdowns Comments
PN-P3
EU: Aggregate replacement ratio
Median individual pensions of 65-74 relative to median individual earnings of 50-59, excluding other social benefits,
By sex (see 5.3) This indicator informs on the overall adequacy of income of pensioners, in relation to older workers
Currently pension income encompasses only first pillar schemes.
This indicator is also included in the overarching portfolio (indicator 7b)
32
Commonly agreed EU indicator (EU)
Commonly agreed national indicators (NAT)21
Definition Breakdowns Comments
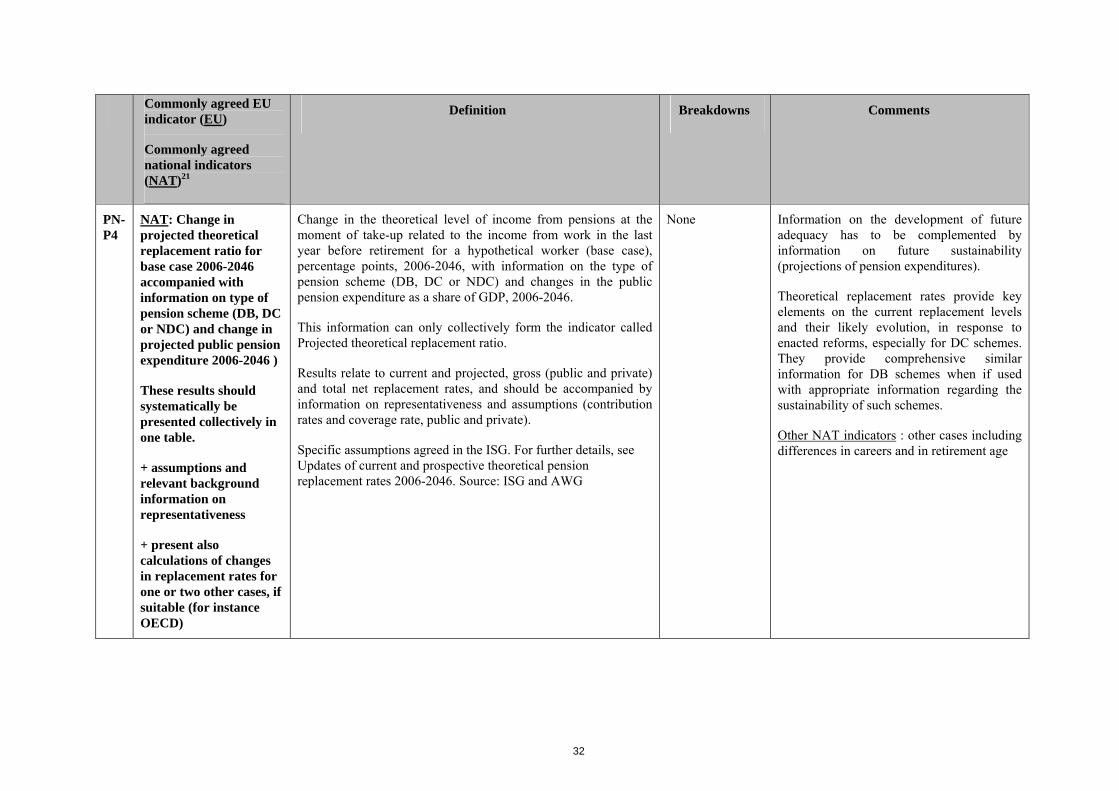
PN-P4
NAT: Change in projected theoretical replacement ratio for base case 2006-2046 accompanied with information on type of pension scheme (DB, DC or NDC) and change in projected public pension expenditure 2006-2046 )
These results should systematically be presented collectively in one table.
+ assumptions and relevant background information on representativeness
+ present also calculations of changes in replacement rates for one or two other cases, if suitable (for instance OECD)
Change in the theoretical level of income from pensions at the moment of take-up related to the income from work in the last year before retirement for a hypothetical worker (base case), percentage points, 2006-2046, with information on the type of pension scheme (DB, DC or NDC) and changes in the public pension expenditure as a share of GDP, 2006-2046.
This information can only collectively form the indicator called Projected theoretical replacement ratio.
Results relate to current and projected, gross (public and private) and total net replacement rates, and should be accompanied by information on representativeness and assumptions (contribution rates and coverage rate, public and private).
Specific assumptions agreed in the ISG. For further details, see Updates of current and prospective theoretical pension replacement rates 2006-2046. Source: ISG and AWG
None Information on the development of future adequacy has to be complemented by information on future sustainability (projections of pension expenditures).
Theoretical replacement rates provide key elements on the current replacement levels and their likely evolution, in response to enacted reforms, especially for DC schemes. They provide comprehensive similar information for DB schemes when if used with appropriate information regarding the sustainability of such schemes.
Other NAT indicators : other cases including differences in careers and in retirement age
33
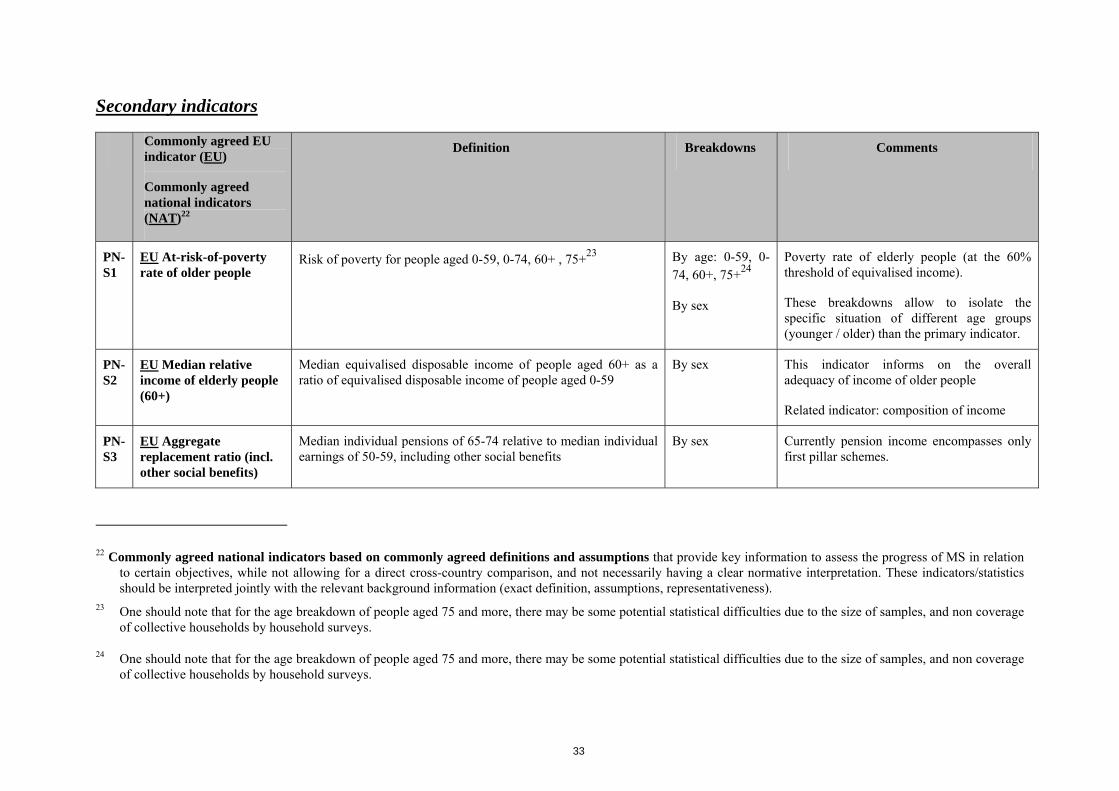
Secondary indicators
Commonly agreed EU indicator (EU)
Commonly agreed national indicators (NAT)22
Definition Breakdowns Comments
PN-S1
EU At-risk-of-poverty rate of older people
Risk of poverty for people aged 0-59, 0-74, 60+ , 75+23 By age: 0-59, 0-74, 60+, 75+24
By sex
Poverty rate of elderly people (at the 60% threshold of equivalised income).
These breakdowns allow to isolate the specific situation of different age groups (younger / older) than the primary indicator.
PN-S2
EU Median relative income of elderly people (60+)
Median equivalised disposable income of people aged 60+ as a ratio of equivalised disposable income of people aged 0-59
By sex This indicator informs on the overall adequacy of income of older people
Related indicator: composition of income
PN-S3
EU Aggregate replacement ratio (incl. other social benefits)
Median individual pensions of 65-74 relative to median individual earnings of 50-59, including other social benefits
By sex Currently pension income encompasses only first pillar schemes.
22 Commonly agreed national indicators based on commonly agreed definitions and assumptions that provide key information to assess the progress of MS in relation to certain objectives, while not allowing for a direct cross-country comparison, and not necessarily having a clear normative interpretation. These indicators/statistics should be interpreted jointly with the relevant background information (exact definition, assumptions, representativeness).
23 One should note that for the age breakdown of people aged 75 and more, there may be some potential statistical difficulties due to the size of samples, and non coverage of collective households by household surveys.
24 One should note that for the age breakdown of people aged 75 and more, there may be some potential statistical difficulties due to the size of samples, and non coverage of collective households by household surveys.
34
Commonly agreed EU indicator (EU)
Commonly agreed national indicators (NAT)22
Definition Breakdowns Comments
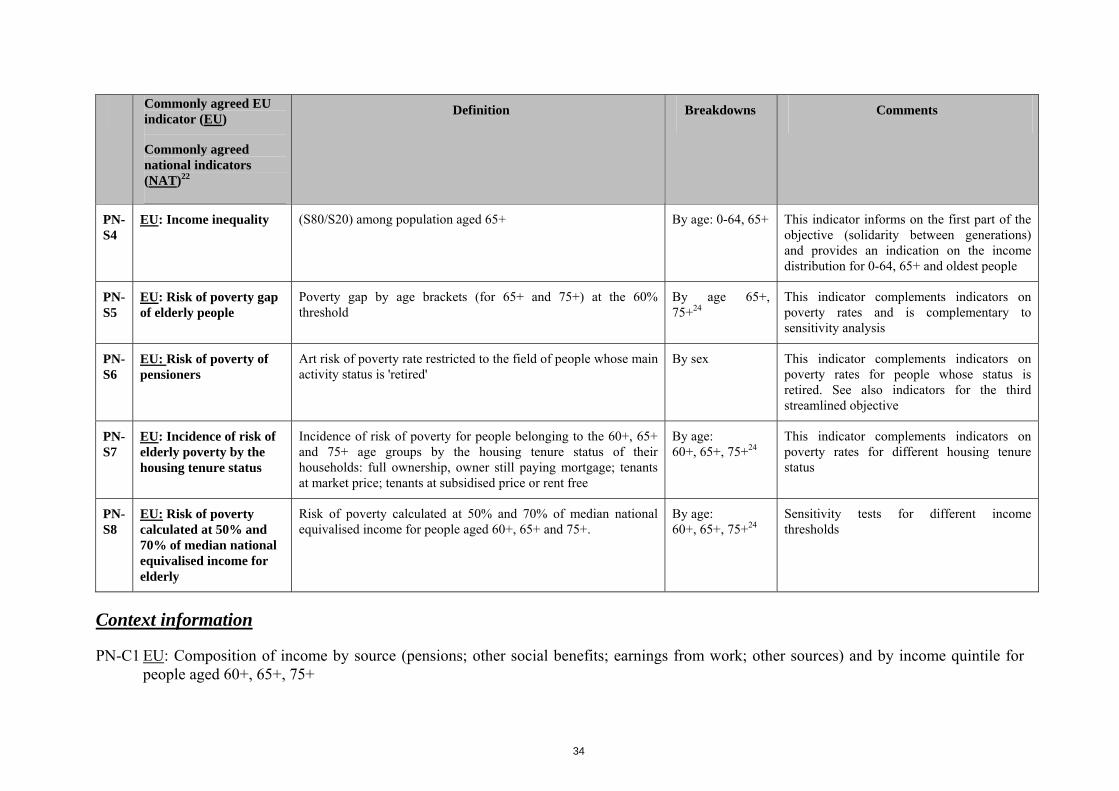
PN-S4
EU: Income inequality
(S80/S20) among population aged 65+ By age: 0-64, 65+ This indicator informs on the first part of the objective (solidarity between generations) and provides an indication on the income distribution for 0-64, 65+ and oldest people
PN-S5
EU: Risk of poverty gap of elderly people
Poverty gap by age brackets (for 65+ and 75+) at the 60% threshold
By age 65+, 75+24
This indicator complements indicators on poverty rates and is complementary to sensitivity analysis
PN-S6
EU: Risk of poverty of pensioners
Art risk of poverty rate restricted to the field of people whose main activity status is 'retired'
By sex This indicator complements indicators on poverty rates for people whose status is retired. See also indicators for the third streamlined objective
PN-S7
EU: Incidence of risk of elderly poverty by the housing tenure status
Incidence of risk of poverty for people belonging to the 60+, 65+ and 75+ age groups by the housing tenure status of their households: full ownership, owner still paying mortgage; tenants at market price; tenants at subsidised price or rent free
By age: 60+, 65+, 75+24
This indicator complements indicators on poverty rates for different housing tenure status
PN-S8
EU: Risk of poverty calculated at 50% and 70% of median national equivalised income for elderly
Risk of poverty calculated at 50% and 70% of median national equivalised income for people aged 60+, 65+ and 75+.
By age: 60+, 65+, 75+24
Sensitivity tests for different income thresholds
Context information
PN-C1 EU: Composition of income by source (pensions; other social benefits; earnings from work; other sources) and by income quintile for people aged 60+, 65+, 75+
35
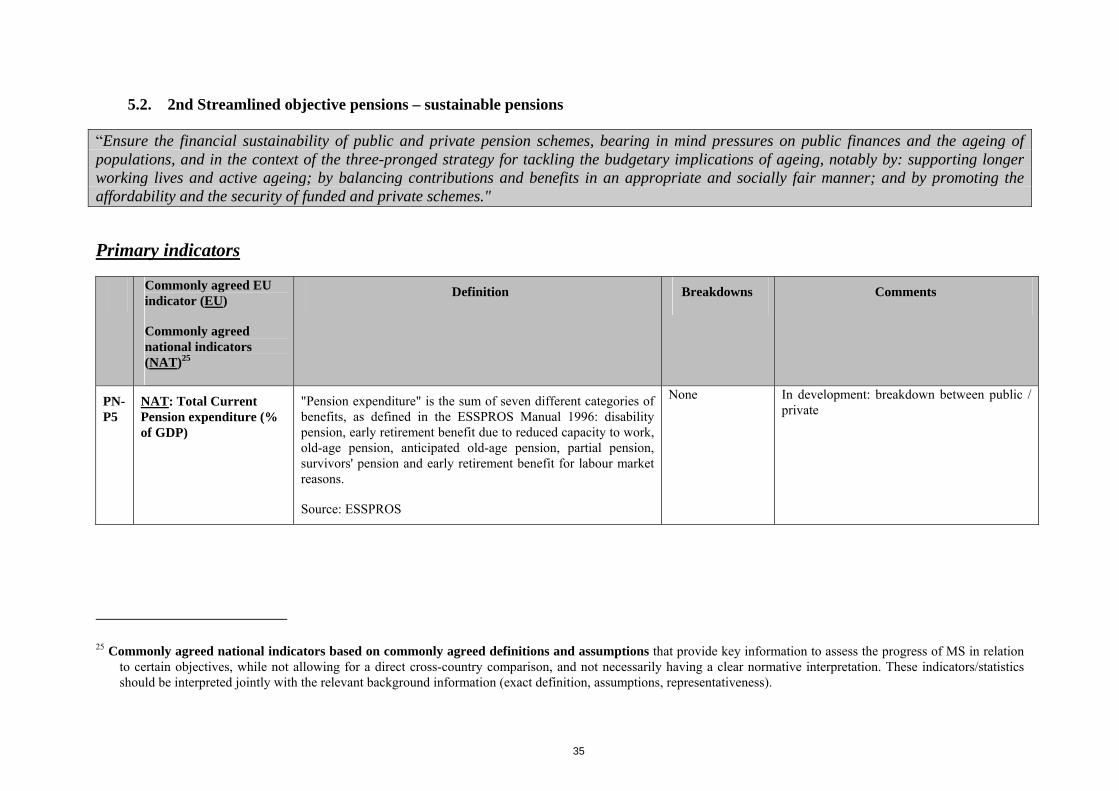
5.2. 2nd Streamlined objective pensions – sustainable pensions
“Ensure the financial sustainability of public and private pension schemes, bearing in mind pressures on public finances and the ageing of populations, and in the context of the three-pronged strategy for tackling the budgetary implications of ageing, notably by: supporting longer working lives and active ageing; by balancing contributions and benefits in an appropriate and socially fair manner; and by promoting the affordability and the security of funded and private schemes."
Primary indicators
Commonly agreed EU indicator (EU)
Commonly agreed national indicators (NAT)25
Definition Breakdowns Comments
PN-P5
NAT: Total Current Pension expenditure (% of GDP)
"Pension expenditure" is the sum of seven different categories of benefits, as defined in the ESSPROS Manual 1996: disability pension, early retirement benefit due to reduced capacity to work, old-age pension, anticipated old-age pension, partial pension, survivors' pension and early retirement benefit for labour market reasons.
Source: ESSPROS
None In development: breakdown between public / private
25 Commonly agreed national indicators based on commonly agreed definitions and assumptions that provide key information to assess the progress of MS in relation to certain objectives, while not allowing for a direct cross-country comparison, and not necessarily having a clear normative interpretation. These indicators/statistics should be interpreted jointly with the relevant background information (exact definition, assumptions, representativeness).
36
Commonly agreed EU indicator (EU)
Commonly agreed national indicators (NAT)25
Definition Breakdowns Comments
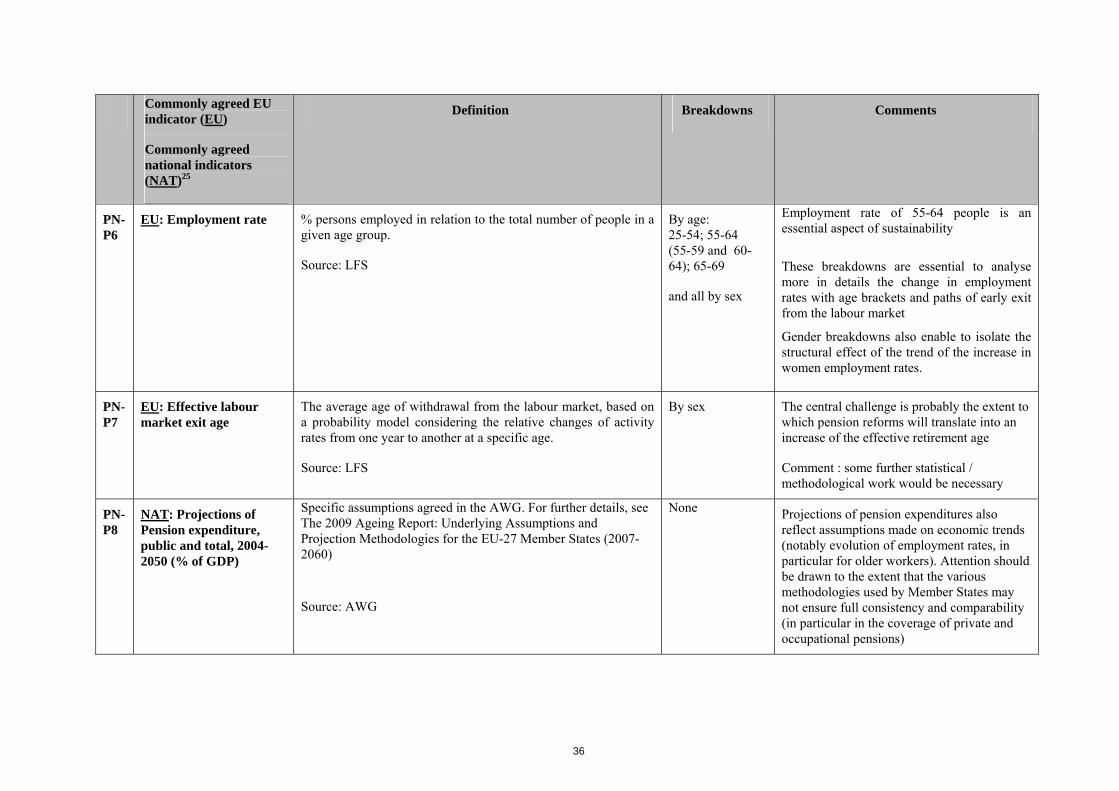
PN-P6
EU: Employment rate % persons employed in relation to the total number of people in a given age group.
Source: LFS
By age: 25-54; 55-64 (55-59 and 60-64); 65-69
and all by sex
Employment rate of 55-64 people is an essential aspect of sustainability
These breakdowns are essential to analyse more in details the change in employment rates with age brackets and paths of early exit from the labour market
Gender breakdowns also enable to isolate the structural effect of the trend of the increase in women employment rates.
PN-P7
EU: Effective labour market exit age
The average age of withdrawal from the labour market, based on a probability model considering the relative changes of activity rates from one year to another at a specific age.
Source: LFS
By sex The central challenge is probably the extent to which pension reforms will translate into an increase of the effective retirement age
Comment : some further statistical / methodological work would be necessary
PN-P8
NAT: Projections of Pension expenditure, public and total, 2004-2050 (% of GDP)
Specific assumptions agreed in the AWG. For further details, see The 2009 Ageing Report: Underlying Assumptions and Projection Methodologies for the EU-27 Member States (2007-2060)
Source: AWG
None Projections of pension expenditures also reflect assumptions made on economic trends (notably evolution of employment rates, in particular for older workers). Attention should be drawn to the extent that the various methodologies used by Member States may not ensure full consistency and comparability (in particular in the coverage of private and occupational pensions)

37
Secondary indicators
Commonly agreed EU indicator (EU)
Commonly agreed national indicators (NAT)26
Definition Breakdowns Comments
PN-S9
NAT: Total social Protection expenditures (% of GDP)
ESSPROS None In development: gross / net expenditure
PN-S10
NAT: Decomposition of the projected increase in public pension expenditure
Decomposition with the old age dependency ratio, the employment effect, the take-up ratio and the benefit ratio.
Specific assumptions agreed in the AWG.
For further details, see The 2009 Ageing Report: Underlying Assumptions and Projection Methodologies for the EU-27 Member States (2007-2060).
Source: AWG
None Projections of pension expenditures also reflect assumptions made on economic trends (notably evolution of employment rates, in particular for older workers).
Attention should be drawn to the extent that the various methodologies used by Member States may not ensure full consistency and comparability (in particular in the coverage of private and occupational pensions)
26 Commonly agreed national indicators based on commonly agreed definitions and assumptions that provide key information to assess the progress of MS in relation to certain objectives, while not allowing for a direct cross-country comparison, and not necessarily having a clear normative interpretation. These indicators/statistics should be interpreted jointly with the relevant background information (exact definition, assumptions, representativeness).

38
Context information
PN-C2 EU: Old-age dependency ratio (Current and projected for 2010, 2030, 2050) - ESTAT27
PN-C3 EU: Evolution of life expectancy at birth and at ages 60 and 65, by gender (current and projected)
PN-C4 NAT: Pension system dependency ratio (Number of pensioners relative to contributors, current and projected up to 2050. Specific assumptions by AWG)28
PN-C5 NAT: Contribution to public and private pension schemes (Pension contributions to public pension schemes as a share of GDP, current and projected to 2050) Source: AWG29
27 The development of dependency ratios provides key information on future pressures on pension systems expenditures and resources.
28 For further details, see "The 2005 EPC projections of age-related expenditure (2004-2050) for the EU-25 Member States: underlying assumptions and projection methodologies". Projections of pension expenditures also reflect assumptions made on economic trends (notably evolution of employment rates, in particular for older workers). Attention should be drawn to the extent that the various methodologies used by Member States may not ensure full consistency and comparability (in particular in the coverage of private and occupational pensions)
29 See above
39
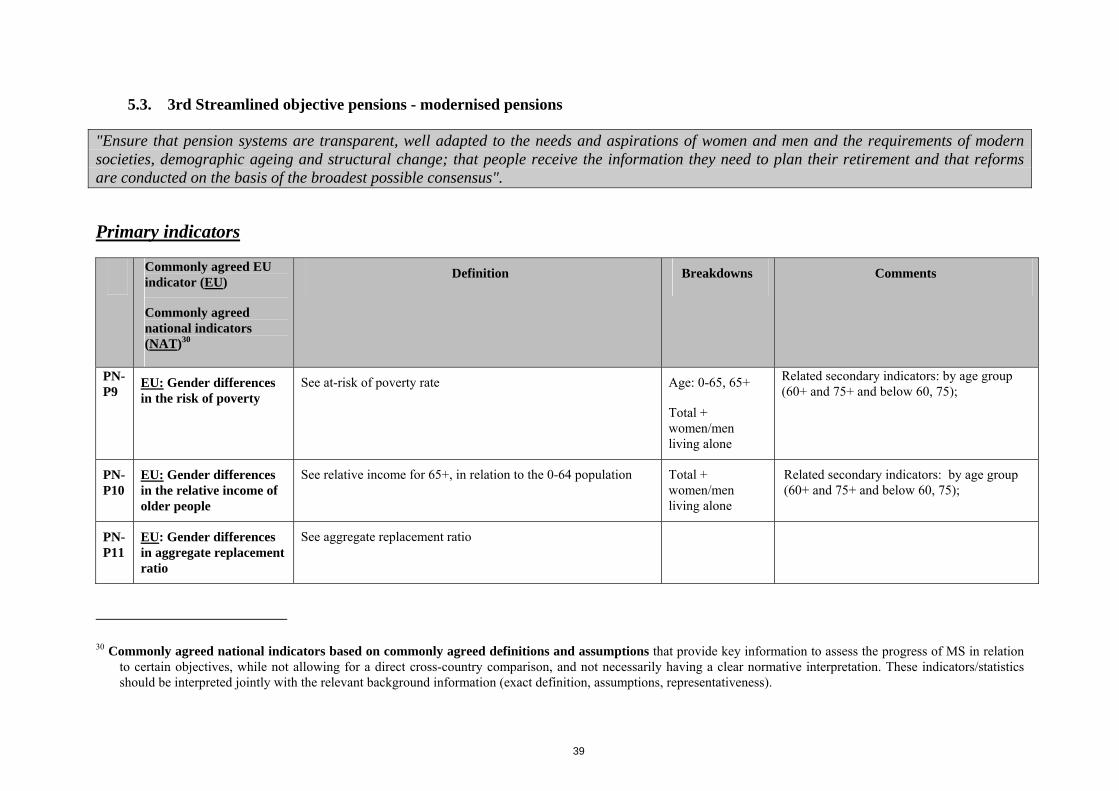
5.3. 3rd Streamlined objective pensions - modernised pensions
"Ensure that pension systems are transparent, well adapted to the needs and aspirations of women and men and the requirements of modern societies, demographic ageing and structural change; that people receive the information they need to plan their retirement and that reforms are conducted on the basis of the broadest possible consensus".
Primary indicators
Commonly agreed EU indicator (EU)
Commonly agreed national indicators (NAT)30
Definition Breakdowns Comments
PN-P9
EU: Gender differences in the risk of poverty
See at-risk of poverty rate Age: 0-65, 65+
Total + women/men living alone
Related secondary indicators: by age group (60+ and 75+ and below 60, 75);
PN-P10
EU: Gender differences in the relative income of older people
See relative income for 65+, in relation to the 0-64 population Total + women/men living alone
Related secondary indicators: by age group (60+ and 75+ and below 60, 75);
PN-P11
EU: Gender differences in aggregate replacement ratio
See aggregate replacement ratio
30 Commonly agreed national indicators based on commonly agreed definitions and assumptions that provide key information to assess the progress of MS in relation to certain objectives, while not allowing for a direct cross-country comparison, and not necessarily having a clear normative interpretation. These indicators/statistics should be interpreted jointly with the relevant background information (exact definition, assumptions, representativeness).
40
Secondary indicators
Commonly agreed EU indicator (EU)
Commonly agreed national indicators (NAT)31
Definition Breakdowns Comments
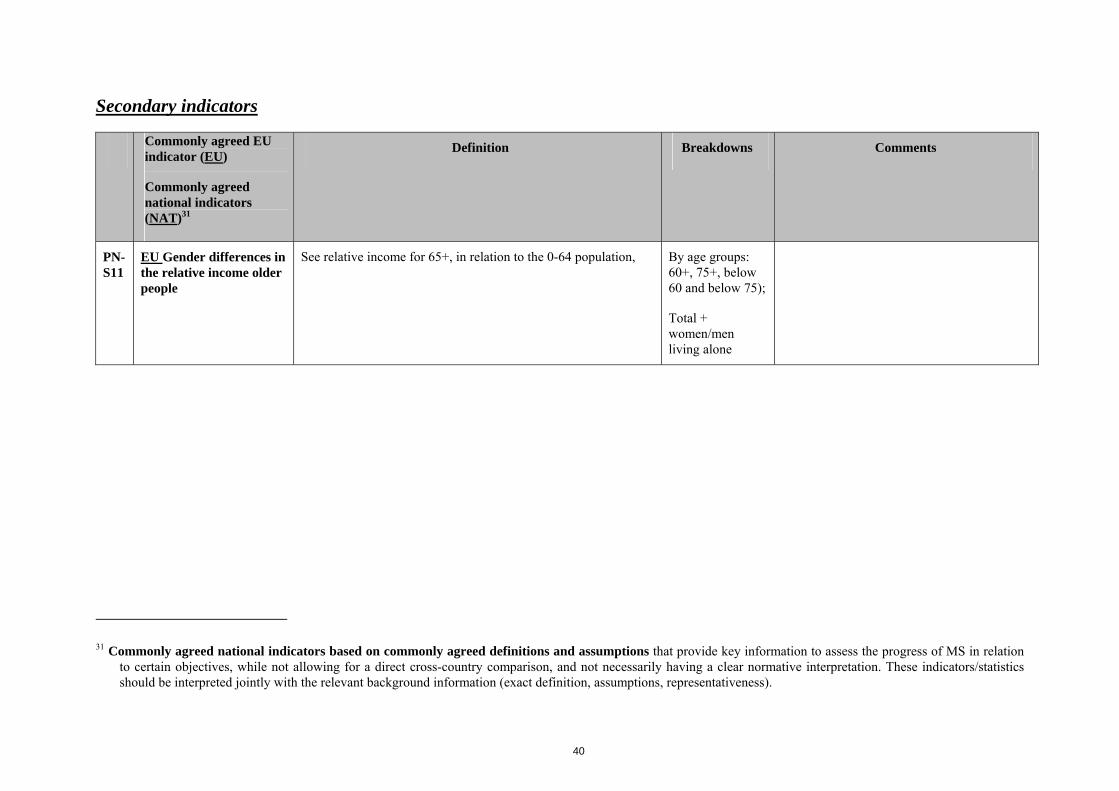
PN-S11
EU Gender differences in the relative income older people
See relative income for 65+, in relation to the 0-64 population, By age groups: 60+, 75+, below 60 and below 75);
Total + women/men living alone
31 Commonly agreed national indicators based on commonly agreed definitions and assumptions that provide key information to assess the progress of MS in relation to certain objectives, while not allowing for a direct cross-country comparison, and not necessarily having a clear normative interpretation. These indicators/statistics should be interpreted jointly with the relevant background information (exact definition, assumptions, representativeness).
41
6. HEALTH PORTFOLIO – PRELIMINARY LIST, WORK IN PROGRESS (LIST IS INCOMPLETE)
The following is a proposal for the set of common indicators to reflect the common objectives in the area of health care and long-term care. The proposed list is based on various meetings by the Indicators Sub-Group (ISG) and associated discussion papers regarding health and long-term care statistics that started in December 2004. These discussions built on the statistics used on the 2006 national reports on social protection and social inclusion, on various projects regarding the development of health indicators such as the European Community Health Indicators project (ECHI) and the OECD Health Care Quality Indicators project (OECD HCQI) amongst others reviewed, and on current data availability at international sources such as EUROSTAT, OECD health data, WHO health for all database (WHO-HFA) and national sources. It is the result of a joint effort by Member States delegates (notably of the ISG of the Social Protection Committee but also of Economic Policy Committee) and various Commission services such as DG EMPL, EUROSTAT, DG SANCO and DG ECFIN. Note that while there is a large pool of statistics related to health and health care, this proposal focuses on those indicators relevant to social protection and that best covered the agreed common objectives for health and long-term care as part of the Open Method of Coordination in the field of social protection and social inclusion.
The list includes EU and national indicators as defined in 2006 (see section 2). The list includes outcome indicators as well as input and process indicators, as a combination of such types of indicators was deemed necessary in the area of health care and long-term care especially when addressing health and long-term care issues from a social protection perspective. The proposed list is made up of 18 primary indicators, 12 secondary indicators and 4 context indicators regrouped according to the common objective they refer to.
The list is comprehensive and attempts to cover the three common objectives of 1) accessibility and health inequalities, 2) quality and 3) long-term sustainability. Nevertheless, the indicators based on EU surveys in development (EHIS available in 2010, and SHA) will be reviewed when the data becomes available before final adoption. Similarly, long-term care is becoming a growing field of interest which may not be fully reflected in the current set of indicators. This is mainly because of the lack of international and comparable data. Hence, the ISG has agreed to consider developing other indicators covering the following dimensions:
• Mortality, life expectancy and healthy life years by socio-economic status (related to health inequalities)
• Care utilisation including the probability of using various types of care and the number of visits or inpatient/day patient days notably by socio-economic status (related to access to care and inequity of access)
• Out-of-pocket payments by households (related to access to care and inequity of access)
• Avoidable mortality (related to health inequalities and also quality of care)
42
• Colorectal cancer screening (related to quality of care notably effectiveness of care)
• Diabetes screening and control (related to quality of care notably effectiveness of care)
• Asthma care (related to quality of care notably effectiveness of care)
• Infections acquired in the course of medical care (related to quality of care notably safety of care)
• Physical activity (related to long-term sustainability notably health promotion and disease prevention)
• Mental health (related to long-term sustainability notably health promotion and disease prevention)
• Long-term care including statistics regarding provision and dependency rates

43
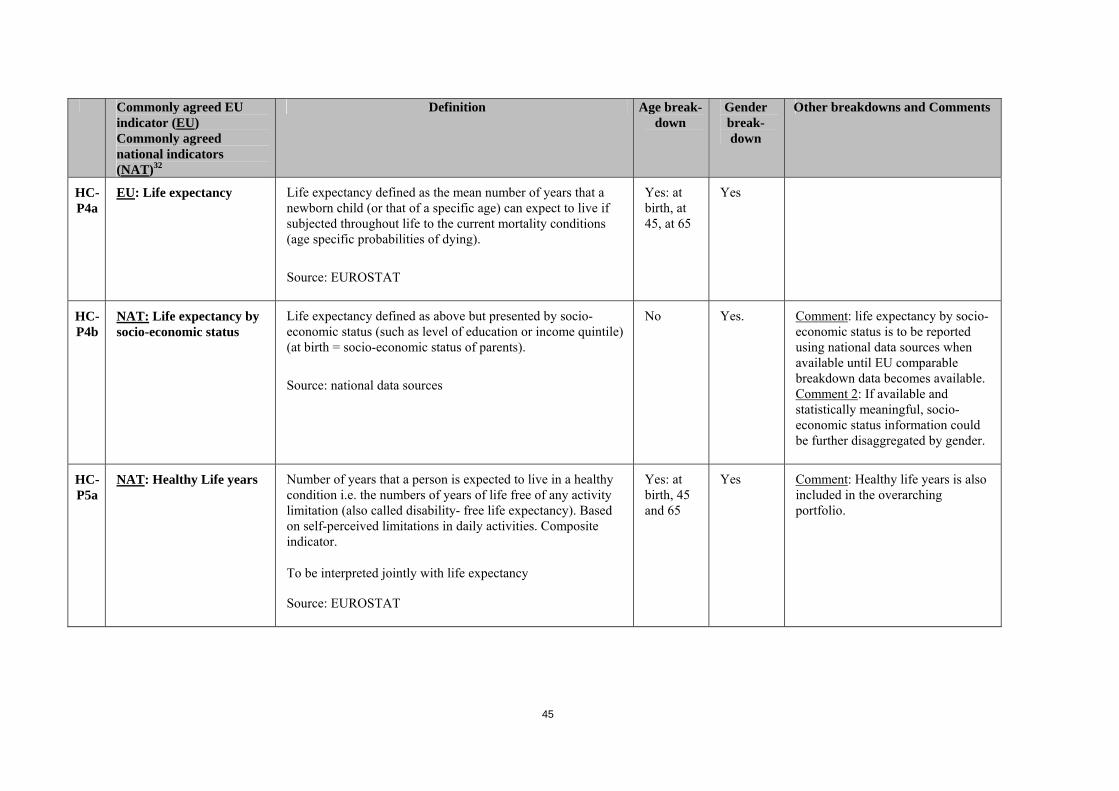
6.1. Indicators regarding access to care (including inequity in access to care) and inequalities in outcomes (objective 1)
Primary indicators
Commonly agreed EU indicator (EU) Commonly agreed national indicators (NAT)32
Definition Age break-down
Gender break-down
Other breakdowns and Comments
HC-P1
NAT: Self reported unmet need for medical care
NAT: Care utilisation
Total self-reported unmet need for medical care for the following three reasons: financial barriers + waiting times + too far to travel
To be analysed together with care utilisation defined as the number of visits to a doctor (GP or specialist) during the last 12 months.
Source: EU-SILC available annually subject to adjustment of EU-SILC in the future
Yes: Age33 groups: 18-44; 45-54; 55-64; 65+; 75+; 18-64
Yes Breakdown by income quintile. Future developments: resolve discrepancies in EU-SILC translation between countries. Comment 1: EU-SILC data on care utilisation i.e. the number of physician consultations (contact with a GP or specialist) is to be used (EU-SILC module 2009). Another source of data on on care utilisation i.e. the number of physician consultations (contact with a GP or specialist) is the OECD health data and the EHIS whose first wave data will be available in 2010. Comment 2: also included in the overarching portfolio.
32 Commonly agreed national indicators based on commonly agreed definitions and assumptions that provide key information to assess the progress of MS in relation to certain objectives, while not allowing for a direct cross-country comparison, and not necessarily having a clear normative interpretation. These indicators/statistics should be interpreted jointly with the relevant background information (exact definition, assumptions, representativeness).
33 Note that for the age breakdown of people aged 75 and more there may be some potential statistical difficulties due to the size of samples and non coverage of collective households by household surveys.
44
Commonly agreed EU indicator (EU) Commonly agreed national indicators (NAT)32
Definition Age break-down
Gender break-down
Other breakdowns and Comments
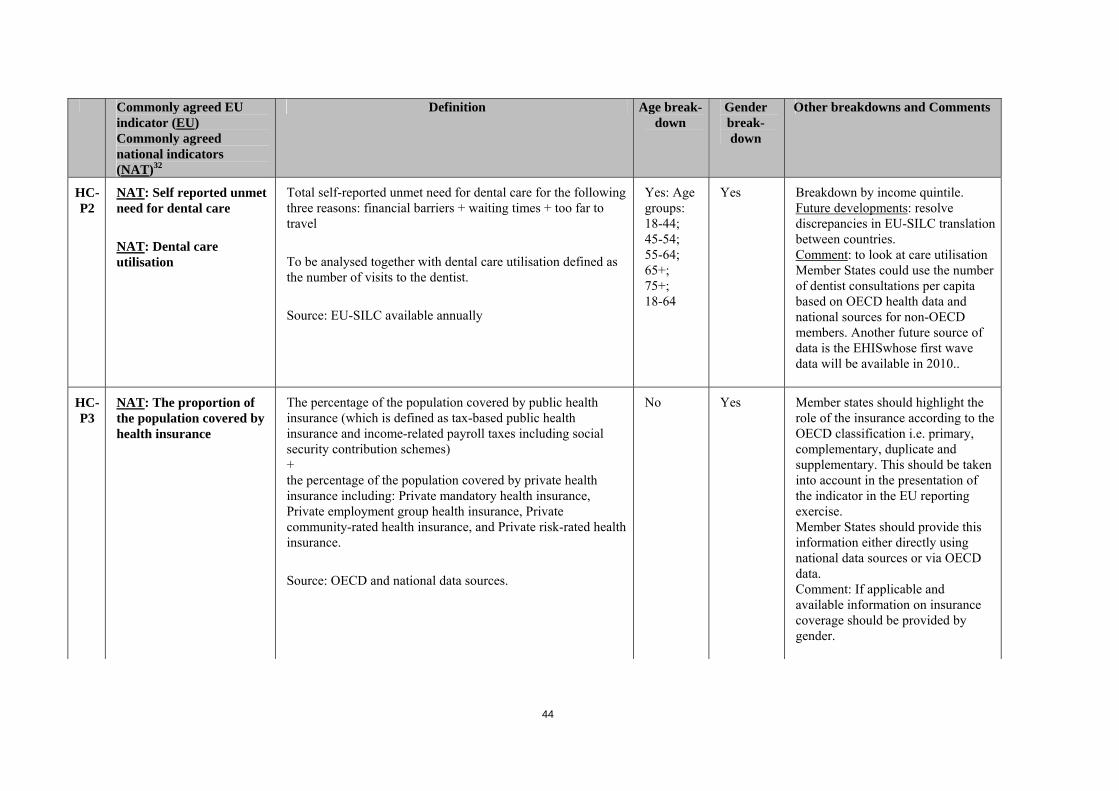
HC-P2
NAT: Self reported unmet need for dental care
NAT: Dental care utilisation
Total self-reported unmet need for dental care for the following three reasons: financial barriers + waiting times + too far to travel
To be analysed together with dental care utilisation defined as the number of visits to the dentist.
Source: EU-SILC available annually
Yes: Age groups: 18-44; 45-54; 55-64; 65+; 75+; 18-64
Yes Breakdown by income quintile. Future developments: resolve discrepancies in EU-SILC translation between countries. Comment: to look at care utilisation Member States could use the number of dentist consultations per capita based on OECD health data and national sources for non-OECD members. Another future source of data is the EHISwhose first wave data will be available in 2010..
HC-P3
NAT: The proportion of the population covered by health insurance
The percentage of the population covered by public health insurance (which is defined as tax-based public health insurance and income-related payroll taxes including social security contribution schemes) + the percentage of the population covered by private health insurance including: Private mandatory health insurance, Private employment group health insurance, Private community-rated health insurance, and Private risk-rated health insurance.
Source: OECD and national data sources.
No Yes Member states should highlight the role of the insurance according to the OECD classification i.e. primary, complementary, duplicate and supplementary. This should be taken into account in the presentation of the indicator in the EU reporting exercise. Member States should provide this information either directly using national data sources or via OECD data. Comment: If applicable and available information on insurance coverage should be provided by gender.
45
Commonly agreed EU indicator (EU) Commonly agreed national indicators (NAT)32
Definition Age break-down
Gender break-down
Other breakdowns and Comments
HC-P4a
EU: Life expectancy Life expectancy defined as the mean number of years that a newborn child (or that of a specific age) can expect to live if subjected throughout life to the current mortality conditions (age specific probabilities of dying).
Source: EUROSTAT
Yes: at birth, at 45, at 65
Yes
HC-P4b
NAT: Life expectancy by socio-economic status
Life expectancy defined as above but presented by socio-economic status (such as level of education or income quintile) (at birth = socio-economic status of parents).
Source: national data sources
No Yes. Comment: life expectancy by socio-economic status is to be reported using national data sources when available until EU comparable breakdown data becomes available. Comment 2: If available and statistically meaningful, socio-economic status information could be further disaggregated by gender.
HC-P5a
NAT: Healthy Life years Number of years that a person is expected to live in a healthy condition i.e. the numbers of years of life free of any activity limitation (also called disability- free life expectancy). Based on self-perceived limitations in daily activities. Composite indicator.
To be interpreted jointly with life expectancy
Source: EUROSTAT
Yes: at birth, 45 and 65
Yes Comment: Healthy life years is also included in the overarching portfolio.

46
Commonly agreed EU indicator (EU) Commonly agreed national indicators (NAT)32
Definition Age break-down
Gender break-down
Other breakdowns and Comments
HC-P5b
NAT: Healthy life years by socio-economic status
Healthy life years defined as above but presented by socio economic status (such as level of education, income quintile) (at birth = socio economic status of parents).
Source: national data sources
No Yes. Comment 1: healthy life years by socio-economic status is to be reported using national data sources when available until EU comparable breakdown data becomes available. Comment 2: If available and statistically meaningful, socio-economic status information could be further disaggregated by gender.
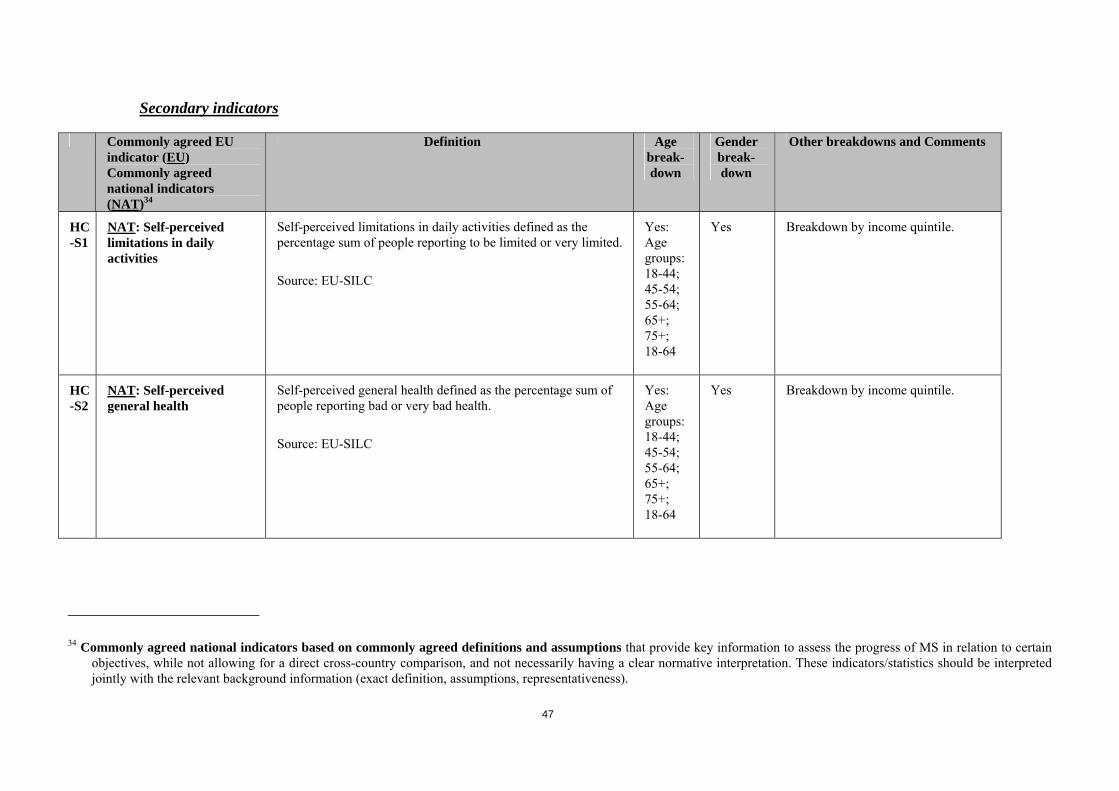
47
Secondary indicators
Commonly agreed EU indicator (EU) Commonly agreed national indicators (NAT)34
Definition Age break-down
Gender break-down
Other breakdowns and Comments
HC-S1
NAT: Self-perceived limitations in daily activities
Self-perceived limitations in daily activities defined as the percentage sum of people reporting to be limited or very limited.
Source: EU-SILC
Yes: Age groups: 18-44; 45-54; 55-64; 65+; 75+; 18-64
Yes Breakdown by income quintile.
HC-S2
NAT: Self-perceived general health
Self-perceived general health defined as the percentage sum of people reporting bad or very bad health.
Source: EU-SILC
Yes: Age groups: 18-44; 45-54; 55-64; 65+; 75+; 18-64
Yes Breakdown by income quintile.
34 Commonly agreed national indicators based on commonly agreed definitions and assumptions that provide key information to assess the progress of MS in relation to certain objectives, while not allowing for a direct cross-country comparison, and not necessarily having a clear normative interpretation. These indicators/statistics should be interpreted jointly with the relevant background information (exact definition, assumptions, representativeness).

48
Commonly agreed EU indicator (EU) Commonly agreed national indicators (NAT)34
Definition Age break-down
Gender break-down
Other breakdowns and Comments
HC-S3a
EU: Infant mortality Infant mortality rates defined as the ratio of the number of deaths of children under one year of age during the year to the number of live births in that year. The value is expressed per 1 000 live births.
Source: EUROSTAT
No Yes Comment: infant mortality by socio-economic status of parents is to be reported using national data sources when available until EU comparable breakdown data becomes available.
HC-S3b
NAT: Infant mortality by socio-economic status
Infant mortality as defined above but presented by socio-economic status of parents (such as level of education, income quintile).
No No Comment: infant mortality by socio-economic status of parents is to be reported using national data sources when available until EU comparable breakdown data becomes available.

49
6.2. Indicators regarding quality of care: effectiveness, safety and patient centeredness (2nd objective)
Primary indicators
Commonly agreed EU indicator (EU) Commonly agreed national indicators (NAT)35
Definition Age break-down
Gender break-down
Other breakdowns and Comments
35 Commonly agreed national indicators based on commonly agreed definitions and assumptions that provide key information to assess the progress of MS in relation to certain objectives, while not allowing for a direct cross-country comparison, and not necessarily having a clear normative interpretation. These indicators/statistics should be interpreted jointly with the relevant background information (exact definition, assumptions, representativeness).
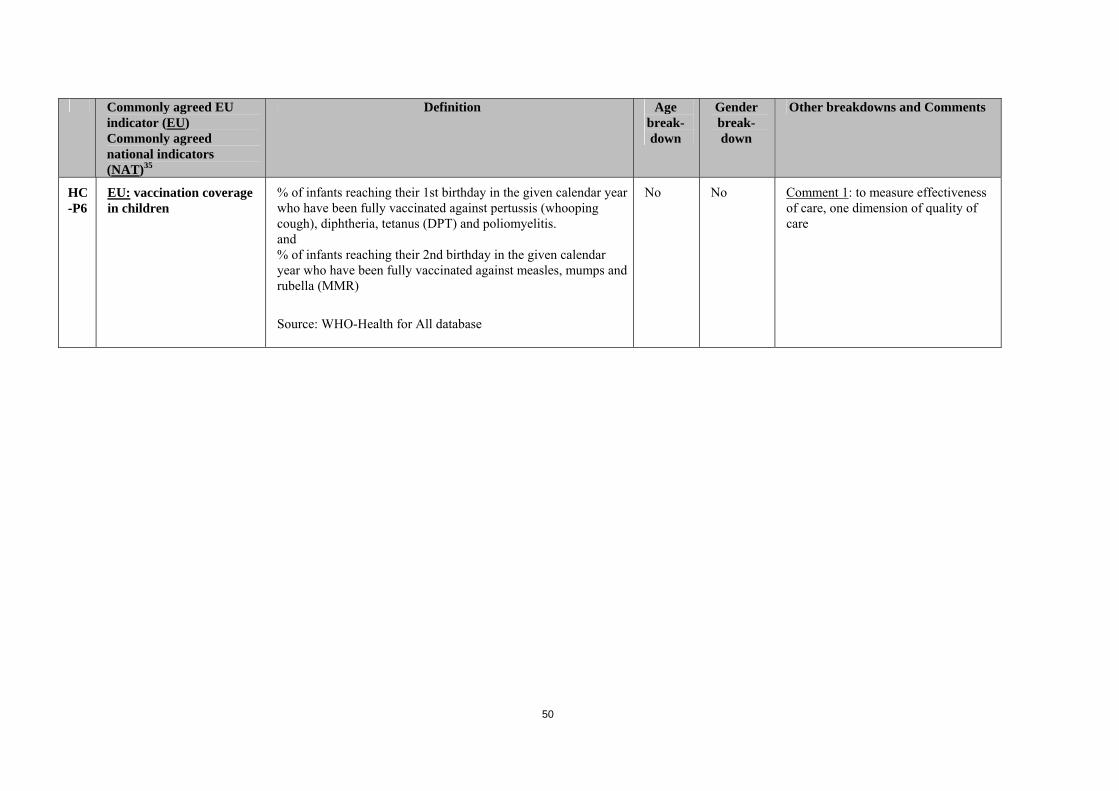
50
Commonly agreed EU indicator (EU) Commonly agreed national indicators (NAT)35
Definition Age break-down
Gender break-down
Other breakdowns and Comments
HC-P6
EU: vaccination coverage in children
% of infants reaching their 1st birthday in the given calendar year who have been fully vaccinated against pertussis (whooping cough), diphtheria, tetanus (DPT) and poliomyelitis. and % of infants reaching their 2nd birthday in the given calendar year who have been fully vaccinated against measles, mumps and rubella (MMR)
Source: WHO-Health for All database
No No Comment 1: to measure effectiveness of care, one dimension of quality of care
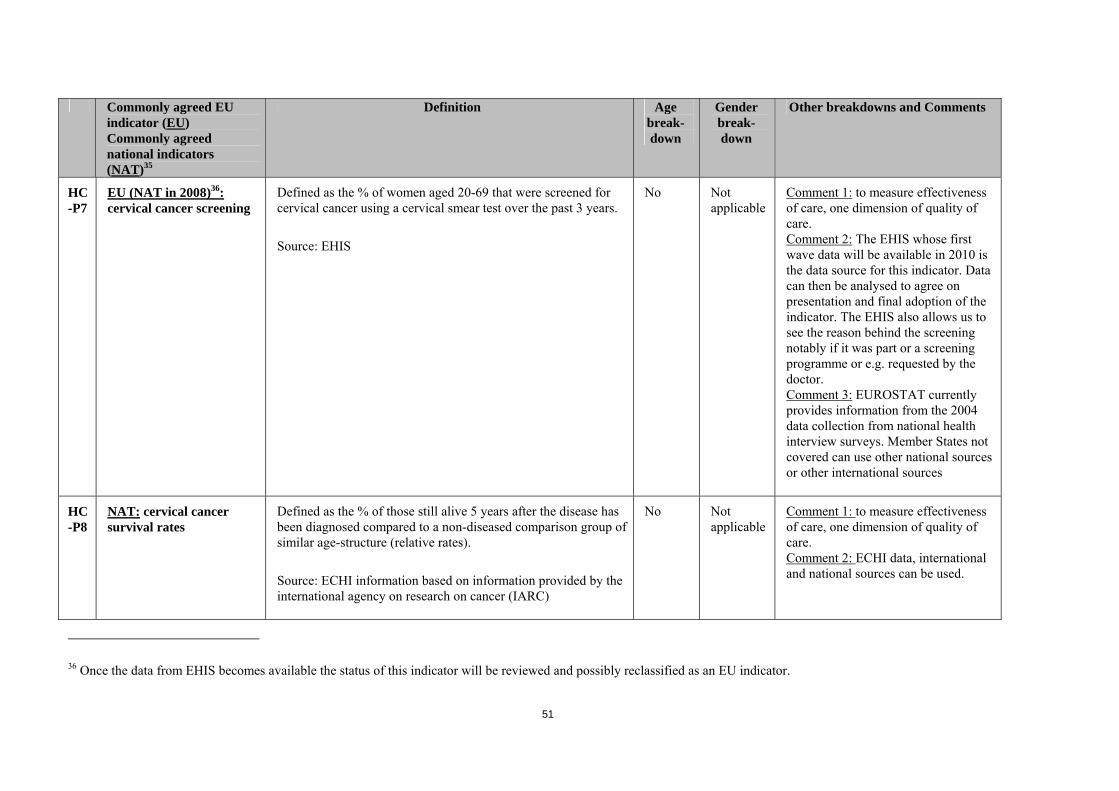
51
Commonly agreed EU indicator (EU) Commonly agreed national indicators (NAT)35
Definition Age break-down
Gender break-down
Other breakdowns and Comments
HC-P7
EU (NAT in 2008)36: cervical cancer screening
Defined as the % of women aged 20-69 that were screened for cervical cancer using a cervical smear test over the past 3 years.
Source: EHIS
No Not applicable
Comment 1: to measure effectiveness of care, one dimension of quality of care. Comment 2: The EHIS whose first wave data will be available in 2010 is the data source for this indicator. Data can then be analysed to agree on presentation and final adoption of the indicator. The EHIS also allows us to see the reason behind the screening notably if it was part or a screening programme or e.g. requested by the doctor. Comment 3: EUROSTAT currently provides information from the 2004 data collection from national health interview surveys. Member States not covered can use other national sources or other international sources
HC-P8
NAT: cervical cancer survival rates
Defined as the % of those still alive 5 years after the disease has been diagnosed compared to a non-diseased comparison group of similar age-structure (relative rates).
Source: ECHI information based on information provided by the international agency on research on cancer (IARC)
No Not applicable
Comment 1: to measure effectiveness of care, one dimension of quality of care. Comment 2: ECHI data, international and national sources can be used.
36 Once the data from EHIS becomes available the status of this indicator will be reviewed and possibly reclassified as an EU indicator.

52
Commonly agreed EU indicator (EU) Commonly agreed national indicators (NAT)35
Definition Age break-down
Gender break-down
Other breakdowns and Comments
HC-P9
NAT: colorectal cancer survival rate
Defined as the % of those still alive 5 years after the disease has been diagnosed compared to a non-diseased comparison group of similar age-structure (relative rates)..
Source: ECHI information based on information provided by the international agency on research on cancer (IARC)
No Yes Comment 1: to measure effectiveness of care, one dimension of quality of care. Comment 2: ECHI, international and national sources can be used.
HC-P10
NAT: satisfaction with health care services
Defined as the proportion of the population satisfied i.e. that find the following type of services good (very plus fairly good) a) GPs/family doctors b) specialists c) hospitals d) dental care services
Source: EHIS
No Yes Comment 1: to measure system responsiveness to patients or patient centeredness, one dimension of quality of care. Comment 2: In the future EHIS is to be the data source for this indicator. Currently the Special Eurobarometer 283 can be used.
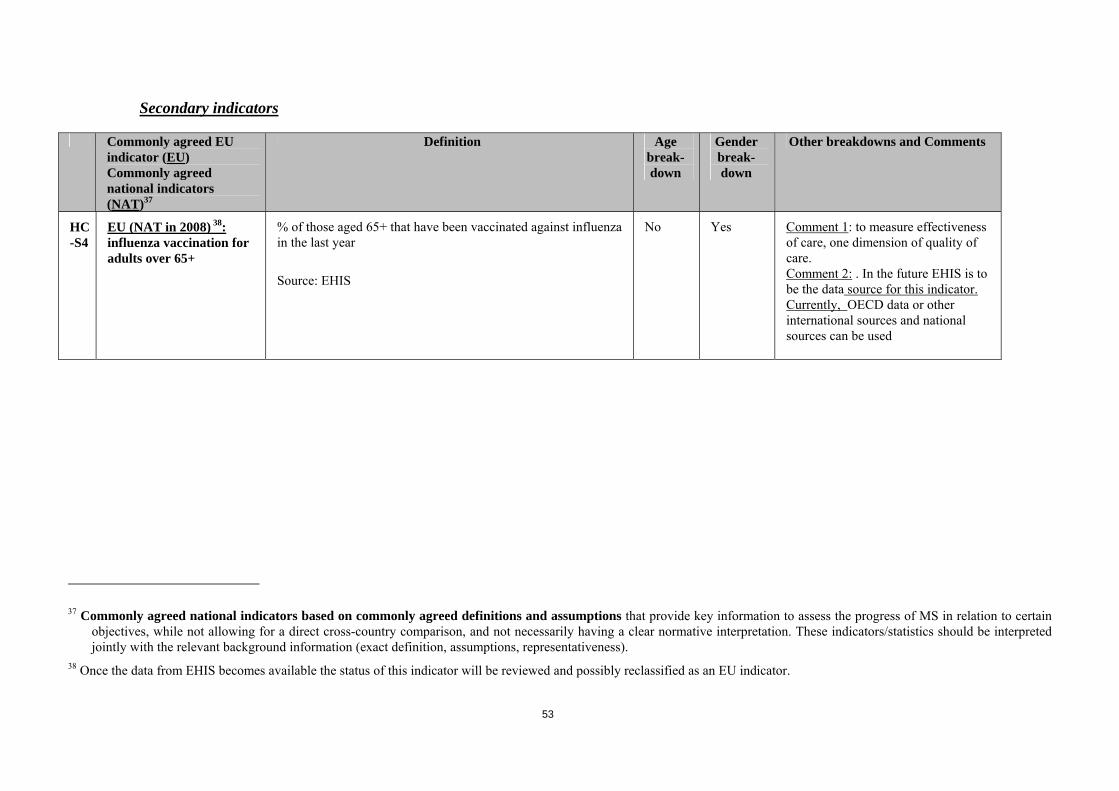
53
Secondary indicators
Commonly agreed EU indicator (EU) Commonly agreed national indicators (NAT)37
Definition Age break-down
Gender break-down
Other breakdowns and Comments
HC-S4
EU (NAT in 2008) 38: influenza vaccination for adults over 65+
% of those aged 65+ that have been vaccinated against influenza in the last year
Source: EHIS
No Yes Comment 1: to measure effectiveness of care, one dimension of quality of care. Comment 2: . In the future EHIS is to be the data source for this indicator. Currently, OECD data or other international sources and national sources can be used
37 Commonly agreed national indicators based on commonly agreed definitions and assumptions that provide key information to assess the progress of MS in relation to certain objectives, while not allowing for a direct cross-country comparison, and not necessarily having a clear normative interpretation. These indicators/statistics should be interpreted jointly with the relevant background information (exact definition, assumptions, representativeness).
38 Once the data from EHIS becomes available the status of this indicator will be reviewed and possibly reclassified as an EU indicator.

54
Commonly agreed EU indicator (EU) Commonly agreed national indicators (NAT)37
Definition Age break-down
Gender break-down
Other breakdowns and Comments
HC-S5
EU (NAT in 2008) 39: breast cancer screening
Defined as the % of women aged 50-69 that were screened for breast cancer using a mammography over the past year
Source: EHIS
No Not applicable
Comment 1: to measure effectiveness of care, one dimension of quality of care Comment 2: The EHIS whose first wave data will be available in 2010 is the data source for this indicator. Data can then be analysed to agree on presentation and final adoption of the indicator. The EHIS also allows us to see the reason behind the screening notably if it was part or a screening programme or e.g. requested by the doctor. Comment 3: Currently, EUROSTAT provides information from the 2004 data collection from national health interview surveys. Member States not covered can use other national sources or other international sources.
HC-S6
NAT: breast cancer survival rate
Defined as the % of those still alive 5 years after the disease has been diagnosed compared to a non-diseased comparison group of similar age-structure (relative rates).
Source: ECHI information based on information provided by the international agency on research on cancer (IARC)
No Not applicable
Comment 1: to measure effectiveness of care, one dimension of quality of care. Comment 2: ECHI, international and national sources can be used.
39 Once the data from EHIS becomes available the status of this indicator will be reviewed and possibly reclassified as an EU indicator.

55
Commonly agreed EU indicator (EU) Commonly agreed national indicators (NAT)37
Definition Age break-down
Gender break-down
Other breakdowns and Comments
HC-S7
NAT: perinatal mortality Defined as number of foetal deaths (over 1000g) plus neonatal deaths (0-6 days) per 1000 live births
Source: EUROSTAT based on WHO health for all database
No No Comment 1: to measure safety of care, one dimension of quality of care.
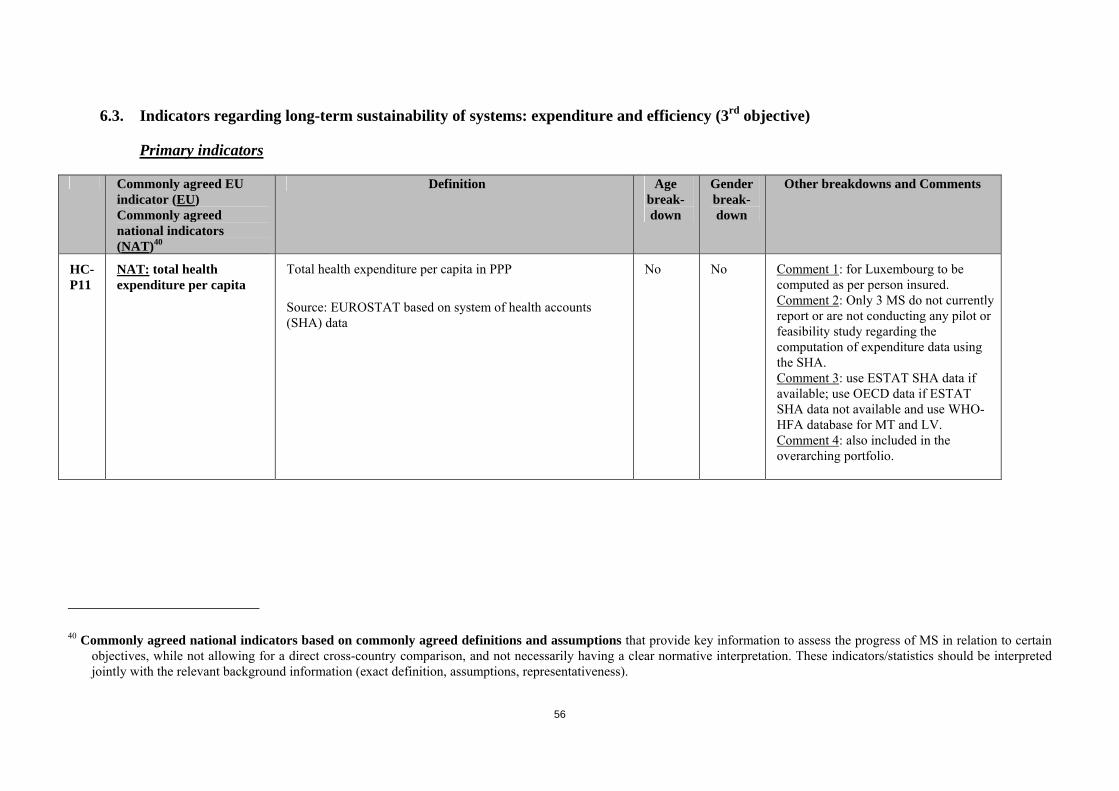
56
6.3. Indicators regarding long-term sustainability of systems: expenditure and efficiency (3rd objective)
Primary indicators
Commonly agreed EU indicator (EU) Commonly agreed national indicators (NAT)40
Definition Age break-down
Gender break-down
Other breakdowns and Comments
HC-P11
NAT: total health expenditure per capita
Total health expenditure per capita in PPP
Source: EUROSTAT based on system of health accounts (SHA) data
No No Comment 1: for Luxembourg to be computed as per person insured. Comment 2: Only 3 MS do not currently report or are not conducting any pilot or feasibility study regarding the computation of expenditure data using the SHA. Comment 3: use ESTAT SHA data if available; use OECD data if ESTAT SHA data not available and use WHO-HFA database for MT and LV. Comment 4: also included in the overarching portfolio.
40 Commonly agreed national indicators based on commonly agreed definitions and assumptions that provide key information to assess the progress of MS in relation to certain objectives, while not allowing for a direct cross-country comparison, and not necessarily having a clear normative interpretation. These indicators/statistics should be interpreted jointly with the relevant background information (exact definition, assumptions, representativeness).
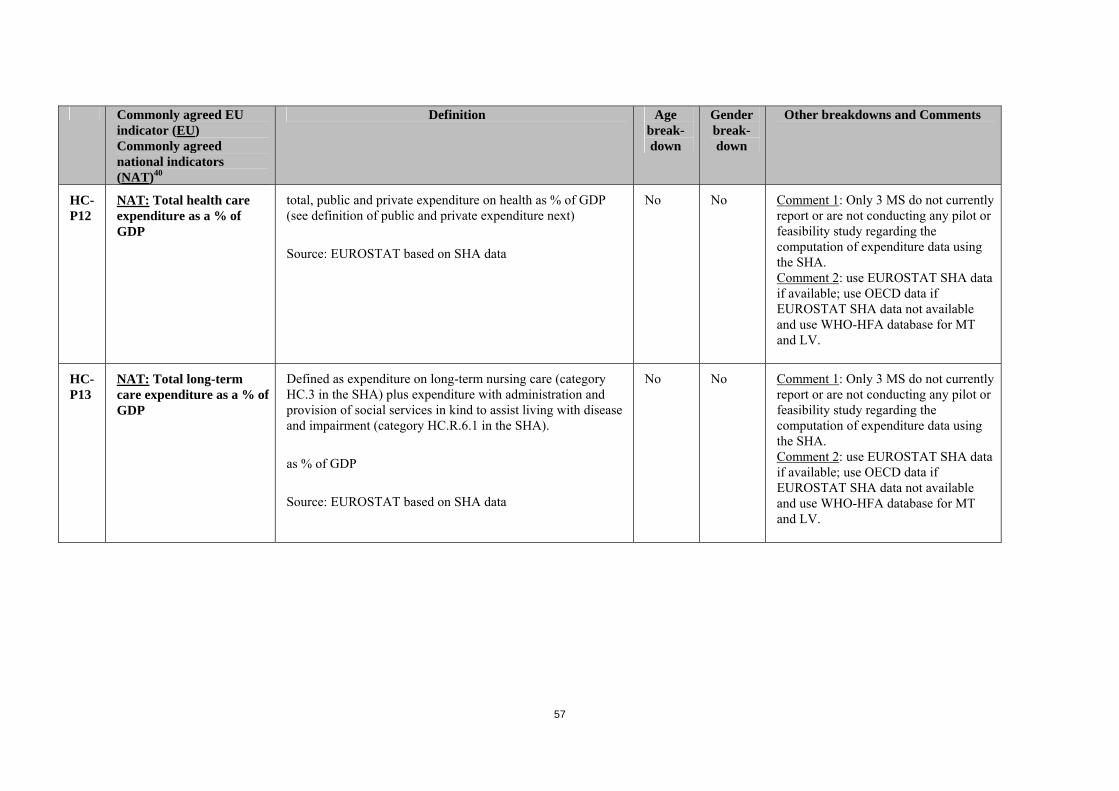
57
Commonly agreed EU indicator (EU) Commonly agreed national indicators (NAT)40
Definition Age break-down
Gender break-down
Other breakdowns and Comments
HC-P12
NAT: Total health care expenditure as a % of GDP
total, public and private expenditure on health as % of GDP (see definition of public and private expenditure next)
Source: EUROSTAT based on SHA data
No No Comment 1: Only 3 MS do not currently report or are not conducting any pilot or feasibility study regarding the computation of expenditure data using the SHA. Comment 2: use EUROSTAT SHA data if available; use OECD data if EUROSTAT SHA data not available and use WHO-HFA database for MT and LV.
HC-P13
NAT: Total long-term care expenditure as a % of GDP
Defined as expenditure on long-term nursing care (category HC.3 in the SHA) plus expenditure with administration and provision of social services in kind to assist living with disease and impairment (category HC.R.6.1 in the SHA).
as % of GDP
Source: EUROSTAT based on SHA data
No No Comment 1: Only 3 MS do not currently report or are not conducting any pilot or feasibility study regarding the computation of expenditure data using the SHA. Comment 2: use EUROSTAT SHA data if available; use OECD data if EUROSTAT SHA data not available and use WHO-HFA database for MT and LV.
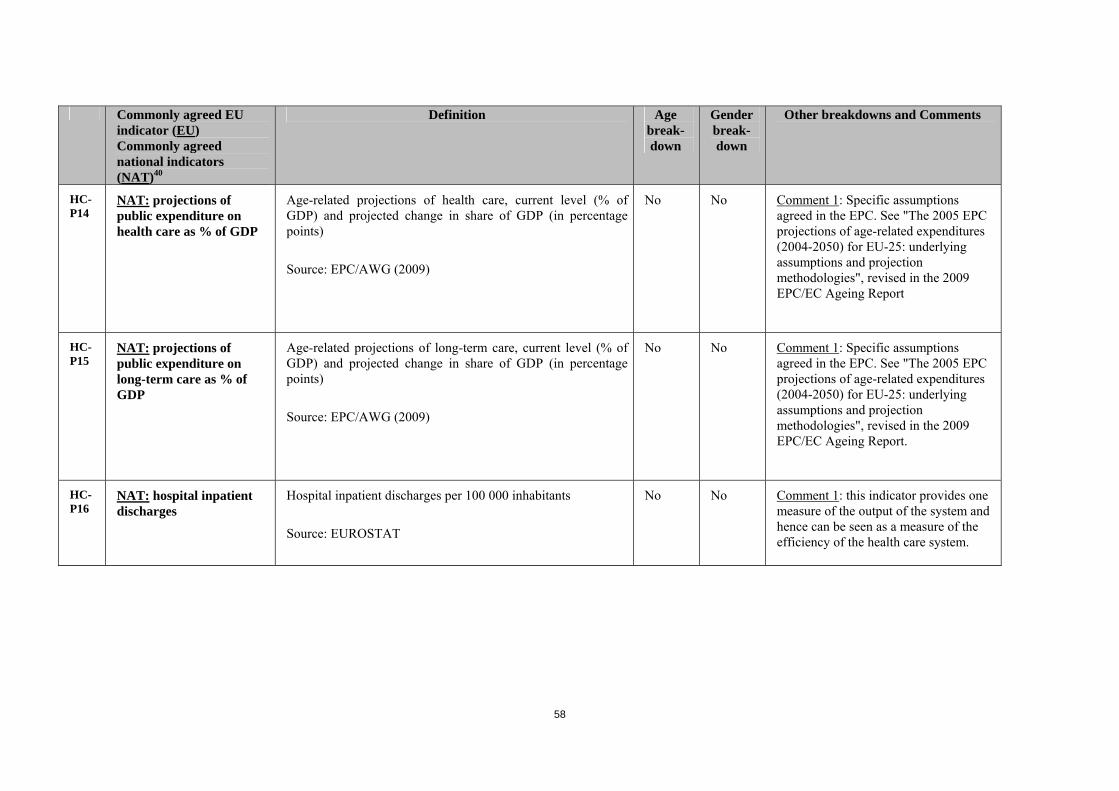
58
Commonly agreed EU indicator (EU) Commonly agreed national indicators (NAT)40
Definition Age break-down
Gender break-down
Other breakdowns and Comments
HC-P14
NAT: projections of public expenditure on health care as % of GDP
Age-related projections of health care, current level (% of GDP) and projected change in share of GDP (in percentage points)
Source: EPC/AWG (2009)
No No Comment 1: Specific assumptions agreed in the EPC. See "The 2005 EPC projections of age-related expenditures (2004-2050) for EU-25: underlying assumptions and projection methodologies", revised in the 2009 EPC/EC Ageing Report
HC-P15
NAT: projections of public expenditure on long-term care as % of GDP
Age-related projections of long-term care, current level (% of GDP) and projected change in share of GDP (in percentage points)
Source: EPC/AWG (2009)
No No Comment 1: Specific assumptions agreed in the EPC. See "The 2005 EPC projections of age-related expenditures (2004-2050) for EU-25: underlying assumptions and projection methodologies", revised in the 2009 EPC/EC Ageing Report.
HC-P16
NAT: hospital inpatient discharges
Hospital inpatient discharges per 100 000 inhabitants
Source: EUROSTAT
No No Comment 1: this indicator provides one measure of the output of the system and hence can be seen as a measure of the efficiency of the health care system.

59
Commonly agreed EU indicator (EU) Commonly agreed national indicators (NAT)40
Definition Age break-down
Gender break-down
Other breakdowns and Comments
HC-P17
NAT: hospital daycases Hospital daycases per 100 000 inhabitants
Source: EUROSTAT
No No Comment 1: this indicator provides one measure of the output of the system and hence can be seen as a measure of the efficiency of the health care system.
HC-P18
EU (NAT in 2008) 41: obesity
Defined as the % of obese persons in the population i.e. the % of the population with BMI >= 30kg/m2
Source: EHIS
Yes: Age groups: 18-44; 45-54; 55-64; 65+; 75+; 18-64
Yes By income quintile. Comment 1: to measure life-styles or healthy behaviour. Comment 2: The future source of this indicator is to be the EHIS. Currently, EUROSTAT provides information from the 2004 data collection from national health interview surveys. Member States not covered can use OECD health data or WHO-HFA database or other national sources.
41 Once the data from EHIS becomes available the status of this indicator will be reviewed and possibly reclassified as an EU indicator.

60
Secondary indicators
Commonly agreed EU indicator (EU) Commonly agreed national indicators (NAT)42
Definition Age break-down
Gender break-down
Other breakdowns and Comments
HC-S8
NAT: sales of generics Defined as the % of generics sales in all prescribed medicine sales
Source: national sources
No No Comment 1: this indicator provides one measure of the efficiency of the health care system.
HC-S9
NAT: acute care bed occupancy rates
Defined as the number of acute care beds effectively occupied in inpatient institutions divided by the number of available acute care beds and multiplied by 100.
Source: OECD health data and WHO-HFA database for non-OECD countries
No No Comment 1: this indicator provides one measure of efficiency of the health care system.
42 Commonly agreed national indicators based on commonly agreed definitions and assumptions that provide key information to assess the progress of MS in relation to certain objectives, while not allowing for a direct cross-country comparison, and not necessarily having a clear normative interpretation. These indicators/statistics should be interpreted jointly with the relevant background information (exact definition, assumptions, representativeness).
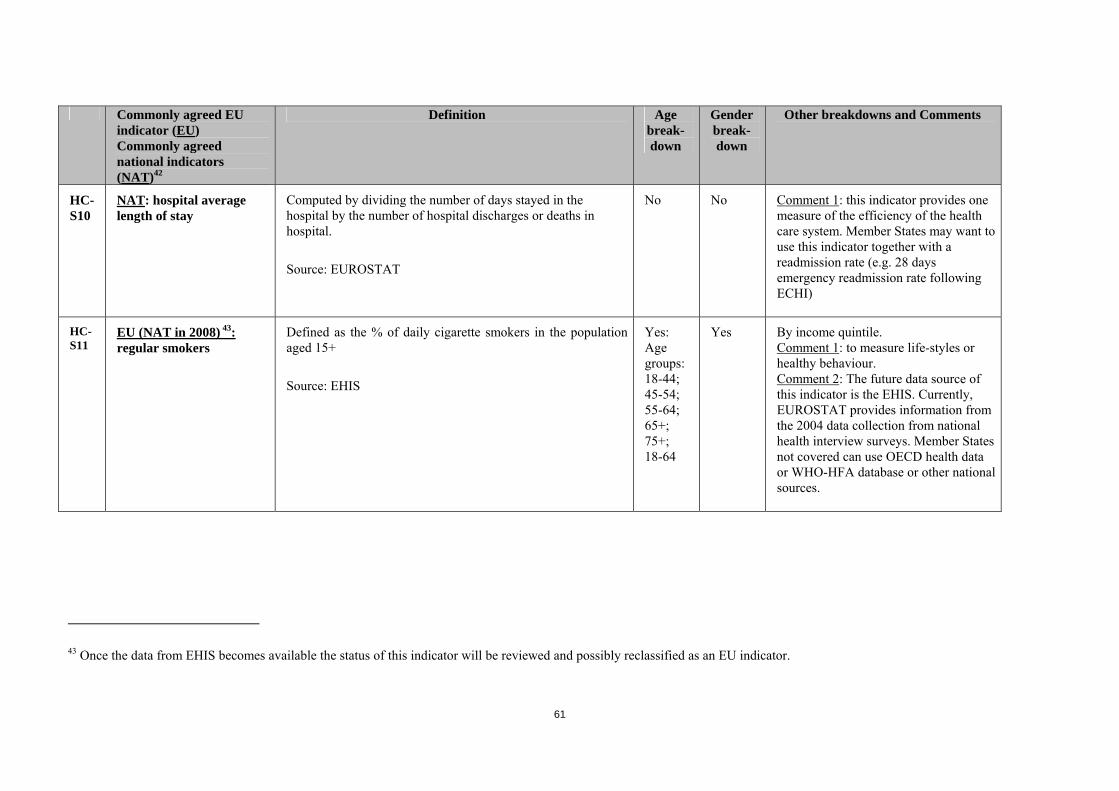
61
Commonly agreed EU indicator (EU) Commonly agreed national indicators (NAT)42
Definition Age break-down
Gender break-down
Other breakdowns and Comments
HC-S10
NAT: hospital average length of stay
Computed by dividing the number of days stayed in the hospital by the number of hospital discharges or deaths in hospital.
Source: EUROSTAT
No No Comment 1: this indicator provides one measure of the efficiency of the health care system. Member States may want to use this indicator together with a readmission rate (e.g. 28 days emergency readmission rate following ECHI)
HC-S11
EU (NAT in 2008) 43: regular smokers
Defined as the % of daily cigarette smokers in the population aged 15+
Source: EHIS
Yes: Age groups: 18-44; 45-54; 55-64; 65+; 75+; 18-64
Yes By income quintile. Comment 1: to measure life-styles or healthy behaviour. Comment 2: The future data source of this indicator is the EHIS. Currently, EUROSTAT provides information from the 2004 data collection from national health interview surveys. Member States not covered can use OECD health data or WHO-HFA database or other national sources.
43 Once the data from EHIS becomes available the status of this indicator will be reviewed and possibly reclassified as an EU indicator.
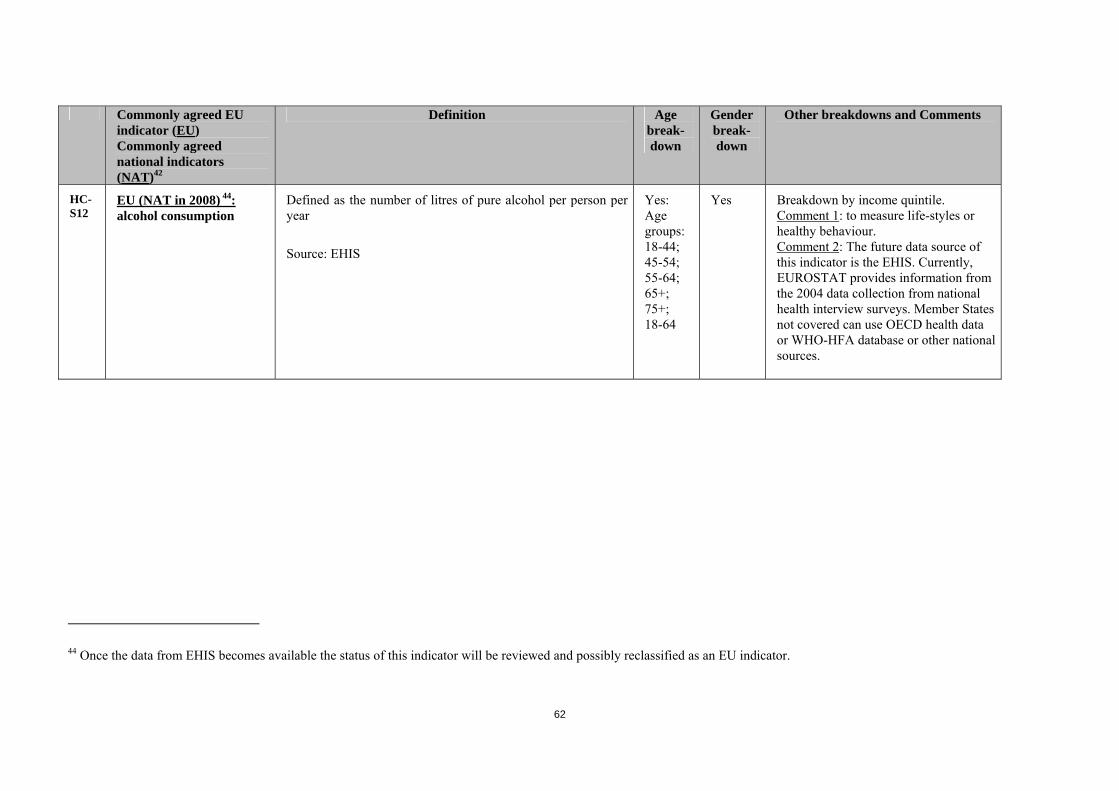
62
Commonly agreed EU indicator (EU) Commonly agreed national indicators (NAT)42
Definition Age break-down
Gender break-down
Other breakdowns and Comments
HC-S12
EU (NAT in 2008) 44: alcohol consumption
Defined as the number of litres of pure alcohol per person per year
Source: EHIS
Yes: Age groups: 18-44; 45-54; 55-64; 65+; 75+; 18-64
Yes Breakdown by income quintile. Comment 1: to measure life-styles or healthy behaviour. Comment 2: The future data source of this indicator is the EHIS. Currently, EUROSTAT provides information from the 2004 data collection from national health interview surveys. Member States not covered can use OECD health data or WHO-HFA database or other national sources.
44 Once the data from EHIS becomes available the status of this indicator will be reviewed and possibly reclassified as an EU indicator.

63
6.4. Context indicators
Commonly agreed EU indicator (EU) Commonly agreed national indicators (NAT)45
Definition Age break-down
Gender break-down
Other breakdowns and Comments
HC-C1
NAT: physicians Total number of practising physicians per 100.000 inhabitants.
This indicator can be use to look at staff needs for the whole country and the distribution of staff across the country. Time trends may also help us identify staff shortages due to migration.
Source: EUROSTAT
No No Comment: Member States may, if they wish, provide this information by health region as a proxy for geographical disparities of supply.
HC-C2
NAT: nurses and midwives
Total number of practising nurses and midwives per 100.000 inhabitants.
This indicator can be use to look at staff needs for the whole country and the distribution of staff across the country. Time trends may also help us identify staff shortages due to migration.
Source: EUROSTAT
No No Comment: Member States may, if they wish, provide this information by health region as a proxy for geographical disparities of supply.
45 Commonly agreed national indicators based on commonly agreed definitions and assumptions that provide key information to assess the progress of MS in relation to certain objectives, while not allowing for a direct cross-country comparison, and not necessarily having a clear normative interpretation. These indicators/statistics should be interpreted jointly with the relevant background information (exact definition, assumptions, representativeness).
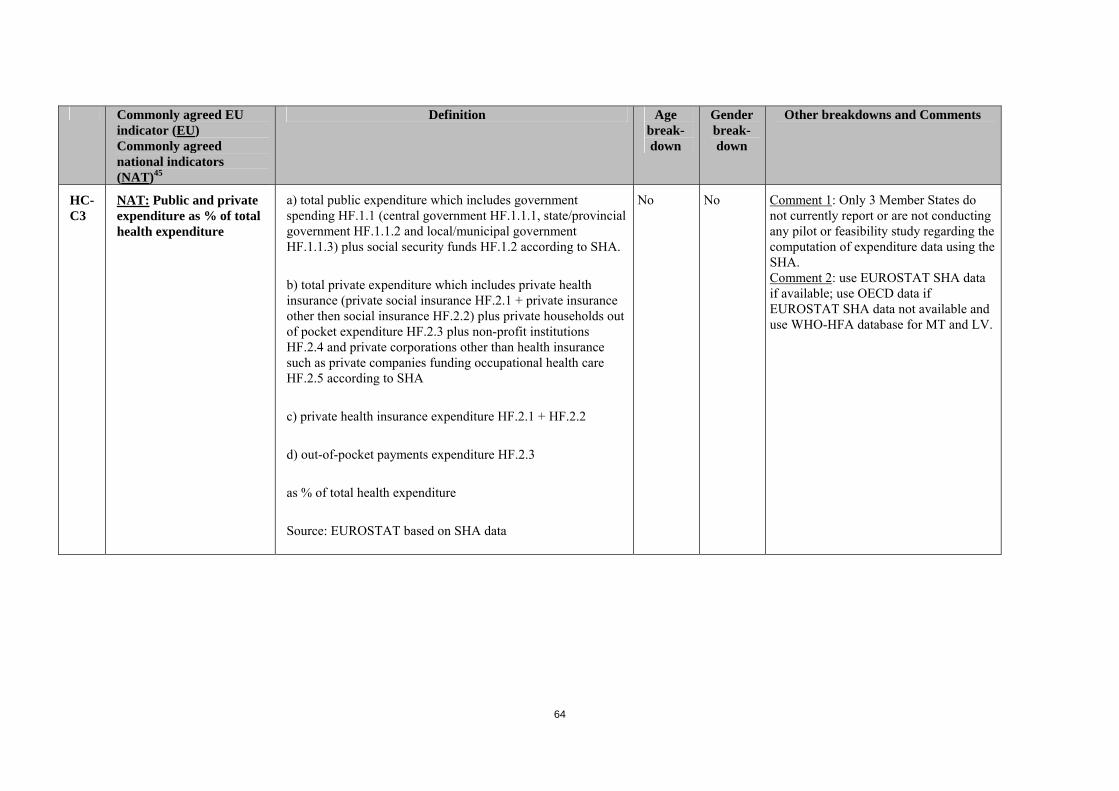
64
Commonly agreed EU indicator (EU) Commonly agreed national indicators (NAT)45
Definition Age break-down
Gender break-down
Other breakdowns and Comments
HC-C3
NAT: Public and private expenditure as % of total health expenditure
a) total public expenditure which includes government spending HF.1.1 (central government HF.1.1.1, state/provincial government HF.1.1.2 and local/municipal government HF.1.1.3) plus social security funds HF.1.2 according to SHA.
b) total private expenditure which includes private health insurance (private social insurance HF.2.1 + private insurance other then social insurance HF.2.2) plus private households out of pocket expenditure HF.2.3 plus non-profit institutions HF.2.4 and private corporations other than health insurance such as private companies funding occupational health care HF.2.5 according to SHA
c) private health insurance expenditure HF.2.1 + HF.2.2
d) out-of-pocket payments expenditure HF.2.3
as % of total health expenditure
Source: EUROSTAT based on SHA data
No No Comment 1: Only 3 Member States do not currently report or are not conducting any pilot or feasibility study regarding the computation of expenditure data using the SHA. Comment 2: use EUROSTAT SHA data if available; use OECD data if EUROSTAT SHA data not available and use WHO-HFA database for MT and LV.

65
Commonly agreed EU indicator (EU) Commonly agreed national indicators (NAT)45
Definition Age break-down
Gender break-down
Other breakdowns and Comments
HC-C4
NAT: Total expenditure on main types of activities or functions of care
This means analysing the proportion of total current health care expenditure that is allocated to the following activities or functions of care.
a) services of curative (HC.1) + b) services of rehabilitative care (HC.2) (together) c) ancillary services to health care (HC.4) d) medical goods dispensed to outpatients (HC.5) e) prevention and public health (HC.6)
as % of total current health expenditure
This analysis is also to look at pharmaceutical expenditure in more detail by looking at expenditure on
e) pharmaceuticals and other medical non-durables (HC.5.1)
as % of total current health expenditure and as % of GDP
Source: EUROSTAT based on SHA
No No Comment 1: Only 3 Member States do not currently report or are not conducting any pilot or feasibility study regarding the computation of expenditure data using the SHA. Comment 2: use EUROSTAT SHA data if available; use OECD data if EUROSTAT SHA data not available and use WHO-HFA database for MT and LV.


![[]Stage-1 [ ] Stage-2 [ ]Re-Certificationmutucertification.com/wp-content/uploads/2017/01/... · SPSI : Serikat Pekerja Seluruh Indonesia (Indonesia Labor Unions) SCCS : Supply chain](https://img.pdfslide.us/doc/110x75/5d1e230388c99335368ca795/stage-1-stage-2-re-certificat-spsi-serikat-pekerja-seluruh-indonesia.jpg)