Embed Size (px)
Citation preview
1
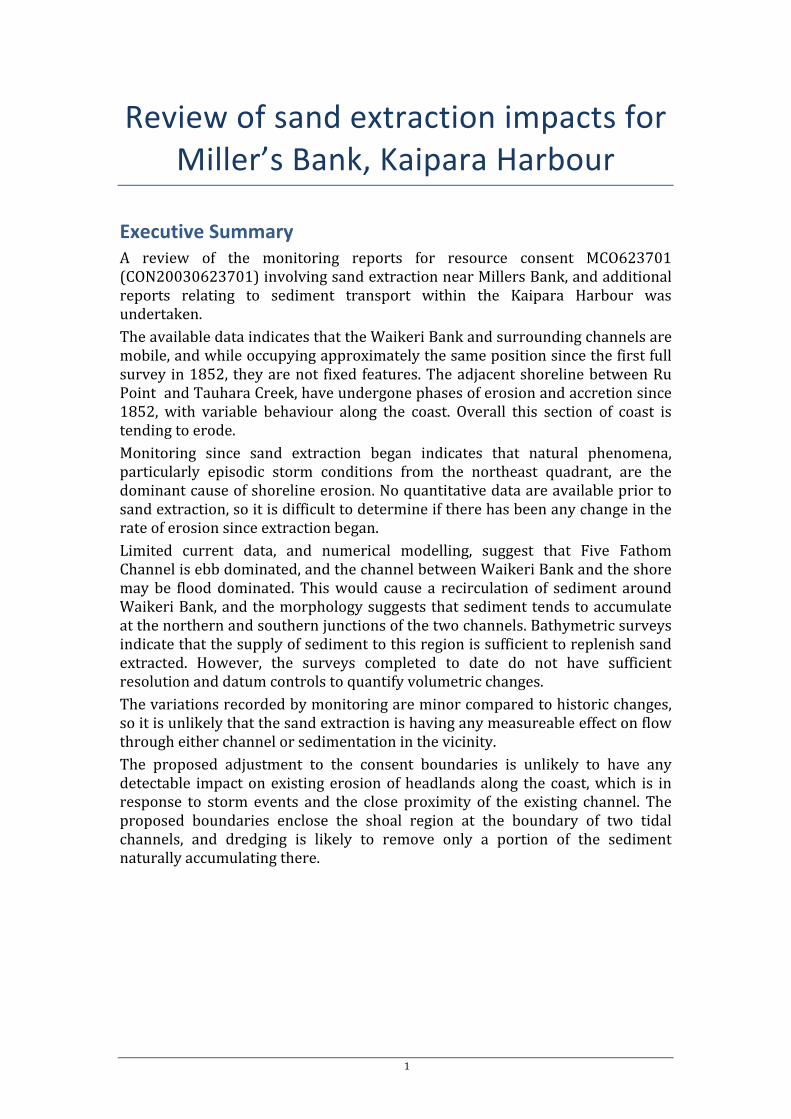
Review of sand extraction impacts for Miller’s Bank, Kaipara Harbour
Executive Summary A review of the monitoring reports for resource consent MCO623701 (CON20030623701) involving sand extraction near Millers Bank, and additional reports relating to sediment transport within the Kaipara Harbour was undertaken. The available data indicates that the Waikeri Bank and surrounding channels are mobile, and while occupying approximately the same position since the first full survey in 1852, they are not fixed features. The adjacent shoreline between Ru Point and Tauhara Creek, have undergone phases of erosion and accretion since 1852, with variable behaviour along the coast. Overall this section of coast is tending to erode. Monitoring since sand extraction began indicates that natural phenomena, particularly episodic storm conditions from the northeast quadrant, are the dominant cause of shoreline erosion. No quantitative data are available prior to sand extraction, so it is difficult to determine if there has been any change in the rate of erosion since extraction began. Limited current data, and numerical modelling, suggest that Five Fathom Channel is ebb dominated, and the channel between Waikeri Bank and the shore may be flood dominated. This would cause a recirculation of sediment around Waikeri Bank, and the morphology suggests that sediment tends to accumulate at the northern and southern junctions of the two channels. Bathymetric surveys indicate that the supply of sediment to this region is sufficient to replenish sand extracted. However, the surveys completed to date do not have sufficient resolution and datum controls to quantify volumetric changes. The variations recorded by monitoring are minor compared to historic changes, so it is unlikely that the sand extraction is having any measureable effect on flow through either channel or sedimentation in the vicinity. The proposed adjustment to the consent boundaries is unlikely to have any detectable impact on existing erosion of headlands along the coast, which is in response to storm events and the close proximity of the existing channel. The proposed boundaries enclose the shoal region at the boundary of two tidal channels, and dredging is likely to remove only a portion of the sediment naturally accumulating there.
2
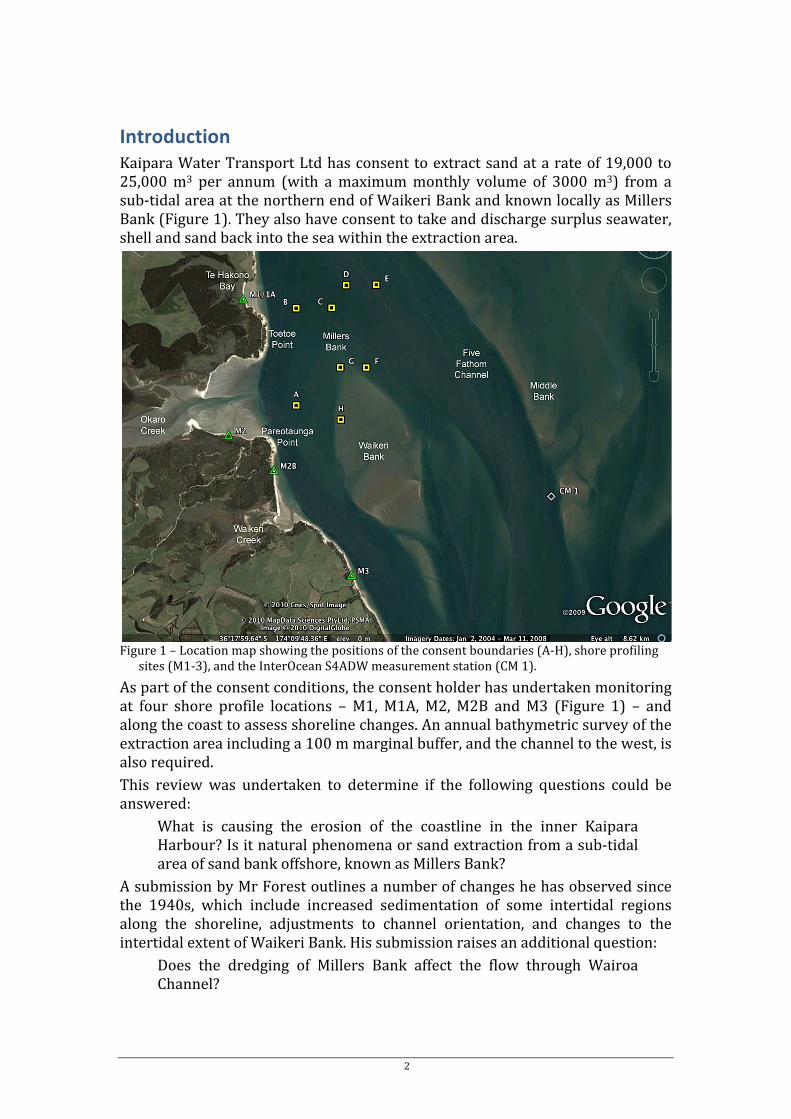
Introduction Kaipara Water Transport Ltd has consent to extract sand at a rate of 19,000 to 25,000 m3 per annum (with a maximum monthly volume of 3000 m3) from a sub-‐tidal area at the northern end of Waikeri Bank and known locally as Millers Bank (Figure 1). They also have consent to take and discharge surplus seawater, shell and sand back into the sea within the extraction area.
Figure 1 – Location map showing the positions of the consent boundaries (A-‐H), shore profiling
sites (M1-‐3), and the InterOcean S4ADW measurement station (CM 1). As part of the consent conditions, the consent holder has undertaken monitoring at four shore profile locations – M1, M1A, M2, M2B and M3 (Figure 1) – and along the coast to assess shoreline changes. An annual bathymetric survey of the extraction area including a 100 m marginal buffer, and the channel to the west, is also required. This review was undertaken to determine if the following questions could be answered:
What is causing the erosion of the coastline in the inner Kaipara Harbour? Is it natural phenomena or sand extraction from a sub-‐tidal area of sand bank offshore, known as Millers Bank?
A submission by Mr Forest outlines a number of changes he has observed since the 1940s, which include increased sedimentation of some intertidal regions along the shoreline, adjustments to channel orientation, and changes to the intertidal extent of Waikeri Bank. His submission raises an additional question:
Does the dredging of Millers Bank affect the flow through Wairoa Channel?
3
Finally, it has been suggested that the boundaries of the consent region be moved northwest towards Ru Point and further awat from Miller’s Bank. This raises the specific question:
Would the revised boundaries contribute to the existing erosion affecting headlands, particularly Toetoe Pt?
Additional information derived from the Kaipara Sand Study undertaken by NIWA, and subsequent investigations was also reviewed in order to address these questions.
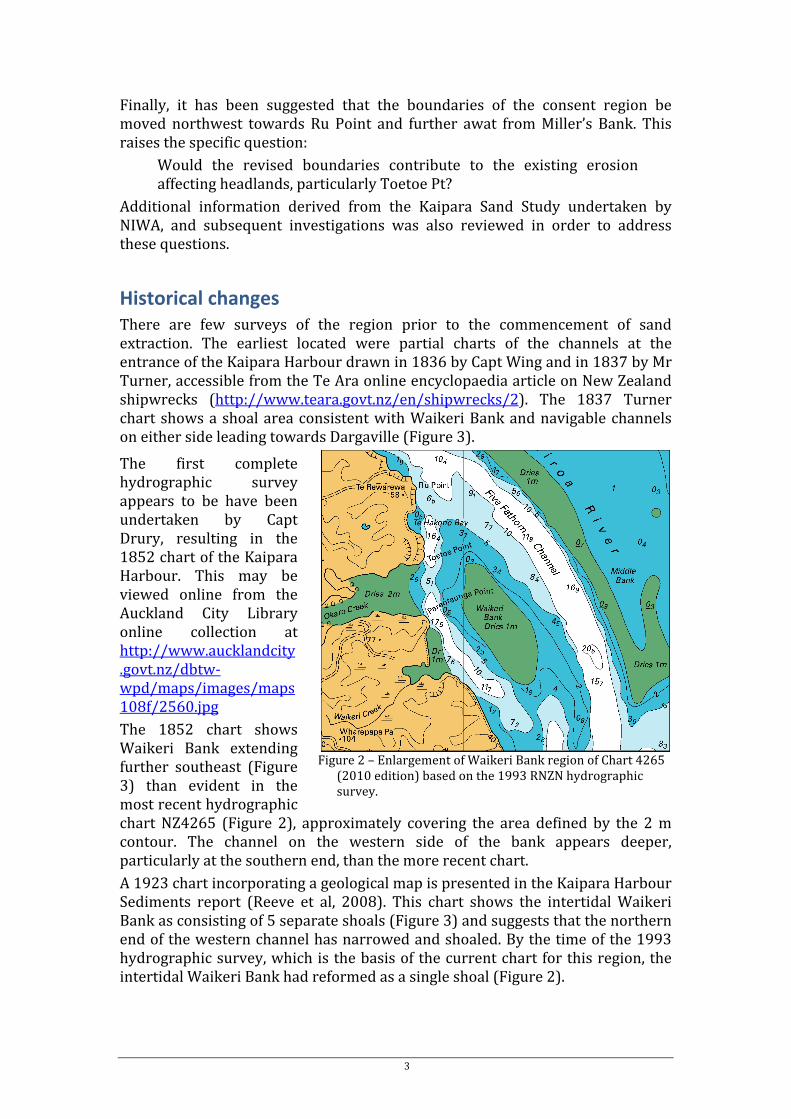
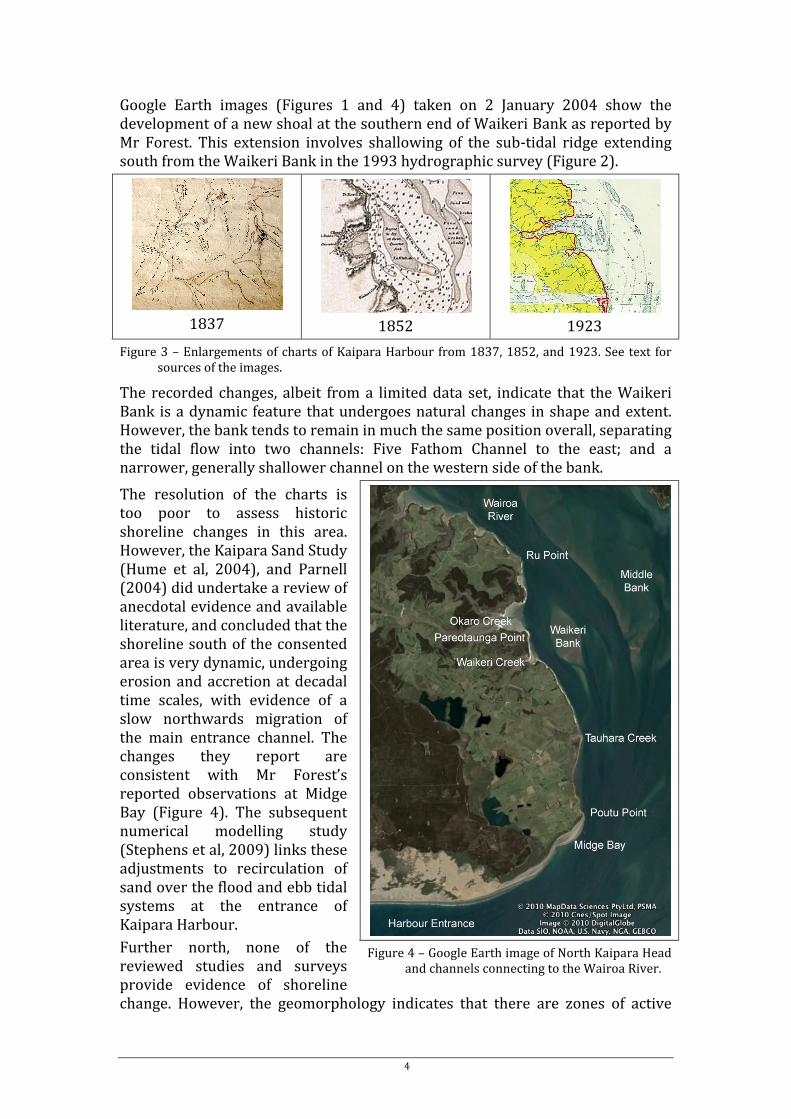
Historical changes There are few surveys of the region prior to the commencement of sand extraction. The earliest located were partial charts of the channels at the entrance of the Kaipara Harbour drawn in 1836 by Capt Wing and in 1837 by Mr Turner, accessible from the Te Ara online encyclopaedia article on New Zealand shipwrecks (http://www.teara.govt.nz/en/shipwrecks/2). The 1837 Turner chart shows a shoal area consistent with Waikeri Bank and navigable channels on either side leading towards Dargaville (Figure 3). The first complete hydrographic survey appears to be have been undertaken by Capt Drury, resulting in the 1852 chart of the Kaipara Harbour. This may be viewed online from the Auckland City Library online collection at http://www.aucklandcity.govt.nz/dbtw-‐wpd/maps/images/maps108f/2560.jpg The 1852 chart shows Waikeri Bank extending further southeast (Figure 3) than evident in the most recent hydrographic chart NZ4265 (Figure 2), approximately covering the area defined by the 2 m contour. The channel on the western side of the bank appears deeper, particularly at the southern end, than the more recent chart. A 1923 chart incorporating a geological map is presented in the Kaipara Harbour Sediments report (Reeve et al, 2008). This chart shows the intertidal Waikeri Bank as consisting of 5 separate shoals (Figure 3) and suggests that the northern end of the western channel has narrowed and shoaled. By the time of the 1993 hydrographic survey, which is the basis of the current chart for this region, the intertidal Waikeri Bank had reformed as a single shoal (Figure 2).
Figure 2 – Enlargement of Waikeri Bank region of Chart 4265
(2010 edition) based on the 1993 RNZN hydrographic survey.
4
Google Earth images (Figures 1 and 4) taken on 2 January 2004 show the development of a new shoal at the southern end of Waikeri Bank as reported by Mr Forest. This extension involves shallowing of the sub-‐tidal ridge extending south from the Waikeri Bank in the 1993 hydrographic survey (Figure 2).
1837
1852
1923
Figure 3 – Enlargements of charts of Kaipara Harbour from 1837, 1852, and 1923. See text for sources of the images.
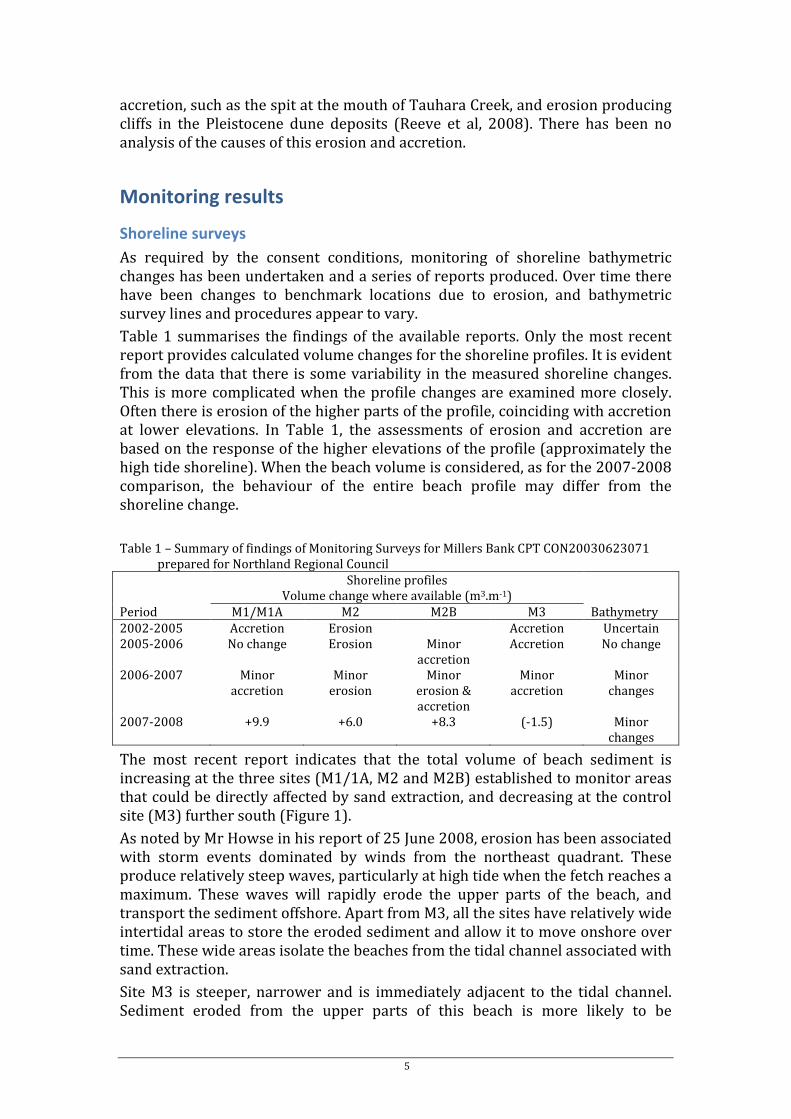
The recorded changes, albeit from a limited data set, indicate that the Waikeri Bank is a dynamic feature that undergoes natural changes in shape and extent. However, the bank tends to remain in much the same position overall, separating the tidal flow into two channels: Five Fathom Channel to the east; and a narrower, generally shallower channel on the western side of the bank. The resolution of the charts is too poor to assess historic shoreline changes in this area. However, the Kaipara Sand Study (Hume et al, 2004), and Parnell (2004) did undertake a review of anecdotal evidence and available literature, and concluded that the shoreline south of the consented area is very dynamic, undergoing erosion and accretion at decadal time scales, with evidence of a slow northwards migration of the main entrance channel. The changes they report are consistent with Mr Forest’s reported observations at Midge Bay (Figure 4). The subsequent numerical modelling study (Stephens et al, 2009) links these adjustments to recirculation of sand over the flood and ebb tidal systems at the entrance of Kaipara Harbour. Further north, none of the reviewed studies and surveys provide evidence of shoreline change. However, the geomorphology indicates that there are zones of active
Figure 4 – Google Earth image of North Kaipara Head
and channels connecting to the Wairoa River.
5
accretion, such as the spit at the mouth of Tauhara Creek, and erosion producing cliffs in the Pleistocene dune deposits (Reeve et al, 2008). There has been no analysis of the causes of this erosion and accretion.
Monitoring results
Shoreline surveys As required by the consent conditions, monitoring of shoreline bathymetric changes has been undertaken and a series of reports produced. Over time there have been changes to benchmark locations due to erosion, and bathymetric survey lines and procedures appear to vary. Table 1 summarises the findings of the available reports. Only the most recent report provides calculated volume changes for the shoreline profiles. It is evident from the data that there is some variability in the measured shoreline changes. This is more complicated when the profile changes are examined more closely. Often there is erosion of the higher parts of the profile, coinciding with accretion at lower elevations. In Table 1, the assessments of erosion and accretion are based on the response of the higher elevations of the profile (approximately the high tide shoreline). When the beach volume is considered, as for the 2007-‐2008 comparison, the behaviour of the entire beach profile may differ from the shoreline change. Table 1 – Summary of findings of Monitoring Surveys for Millers Bank CPT CON20030623071
prepared for Northland Regional Council Shoreline profiles
Volume change where available (m3.m-‐1)
Period M1/M1A M2 M2B M3 Bathymetry 2002-‐2005 Accretion Erosion Accretion Uncertain 2005-‐2006 No change Erosion Minor
accretion Accretion No change
2006-‐2007 Minor accretion
Minor erosion
Minor erosion & accretion
Minor accretion
Minor changes
2007-‐2008 +9.9 +6.0 +8.3 (-‐1.5) Minor changes
The most recent report indicates that the total volume of beach sediment is increasing at the three sites (M1/1A, M2 and M2B) established to monitor areas that could be directly affected by sand extraction, and decreasing at the control site (M3) further south (Figure 1). As noted by Mr Howse in his report of 25 June 2008, erosion has been associated with storm events dominated by winds from the northeast quadrant. These produce relatively steep waves, particularly at high tide when the fetch reaches a maximum. These waves will rapidly erode the upper parts of the beach, and transport the sediment offshore. Apart from M3, all the sites have relatively wide intertidal areas to store the eroded sediment and allow it to move onshore over time. These wide areas isolate the beaches from the tidal channel associated with sand extraction. Site M3 is steeper, narrower and is immediately adjacent to the tidal channel. Sediment eroded from the upper parts of this beach is more likely to be
6
transported away by tidal currents. It may be supplied by sediment from further towards the harbour entrance, provided it bypasses the accreting spit at Tauhara Creek. The reports also include photographs of the sites. These support the beach profile data, but also indicate that rainfall runoff is contributing to erosion of the steeper parts of the shoreline between M1 and M3. The shoreline position surveys were discontinued due to the risk of injury to the surveying staff. The data collected indicate that the steep Pleistocene sand dune deposits are relatively unstable, and prone to collapse. From the photos provided, this collapse appears to be due to a combination of high pore water pressure, and removal of material from the base by wave action. The observed pattern of erosion and accretion is consistent with natural phenomena, particularly episodic storm events, and does not indicate any significant influence from the offshore sand extraction.
Bathymetric changes The 25 June 2008 report prepared by Mr Howse, provides the best summary of the bathymetric data obtained by the monitoring. This report also provides a summary of the actual volumes of sand extracted, and shows that the volumes being extracted were around 0.013-‐0.016 M m3.y-‐1, which is less than the maximum consented volumes. It is difficult to identify any changes associated with the dredging for several reasons: • Expected morphological changes are too small to detect. The estimated area of
the consent region is approximately 1.75 km2. Assuming that the volume extracted is spread evenly over the entire region, then the expected depth change for the volumes extracted is around 10 mm. The numerical modelling study (Stephens et al, 2009) predicts sediment transport rates of up to 20 m3.m-‐1 for site CM-‐1 at the south-‐eastern end of Waikeri Bank (Figure 1). Even if the rates in the consent area are an order of magnitude smaller, the tidal movement of sediment is likely to rapidly redistribute sediment following dredging.
• Mobile bedforms will obscure any impacts of dredging. Sidescan surveys within the Kaipara Harbour tidal channels reveal the presence of mobile bedforms (megaripples and sand waves) consistent with a mobile bed. The Kaipara Sand Study report did not show the extent of this coverage, so it is uncertain whether these are present in the sand extraction area. However, if present, the movement of these features will introduce a variation in depths at any location that will exceed the expected change due to sand extraction. With single beam echo sounder records it will be difficult to distinguish between the troughs of bedforms and dredge scour marks.
• Low-resolution surveys. The surveys undertaken appear to have not followed the same tracks, and have a poor resolution (tracks are too far apart). This means that artefacts resulting from the data analysis, which can obscure and confound the actual changes, will affect the interpolated bathymetry. Mr Howse addressed this point in his report.
7
If bathymetric surveys are going to continue in the future, the track spacing should be greatly reduced. This may be more feasibly achieved with a multibeam sonar system, which will increase the resolution of the measurements without an significant increase in track density and length. However, as noted above, the vertical change averaged over the whole area is probably too small to measure. Therefore, repeated sidescan surveys may be more useful to determine the changes to bedform distributions and seabed cover.
Sediment budget The Kaipara Sand Study and subsequent reports do not consider the sediment budget for the Millers Bank extraction site. Table 2 summarises the data available. There are three main sources of sediment for Kaipara Harbour: sediment entering the harbour from offshore, resulting from longshore and onshore sediment transport; from the Kaipara Harbour river catchments; and erosion around the harbour shoreline, particularly of the Pleistocene sand dune deposits. The estimates of longshore transport vary from 0.175 to 5 Mm3.y-‐1, and this sediment is thought to largely recirculate between the flood and ebb tidal delta systems, before an unknown portion travels further north along the coast. There are difficulties with assessing the volume as it is recognised there are decadal scale fluctuations in the rate. Schofield (1975) argued that onshore sediment transport from the shelf was the main source of sediment for the Kaipara sand deposits, even though the rate is small. Table 2 – Components of a sediment budget for the Millers Bank sand extraction site.
Inputs Dredging CON20030623701 Source
Volume 106 m3.y-‐1
Study
Volume 106 m3.y-‐1
Years
Longshore ~5 Kirk (1992) 0.017 1 and 2 ~1 Parnell (1995) 0.019 3 and 4 0.175 Hicks & Hume (1996) 0.021 5 and 6 0.5 Hume et al (2004) 0.023 7 and 8 Onshore 0.07 Schofield (1975) 0.025 9 onwards River inputs 0.279 Hume et al (2004) - Wairoa R. 0.229 Hume et al (2004) Cliff erosion Unknown
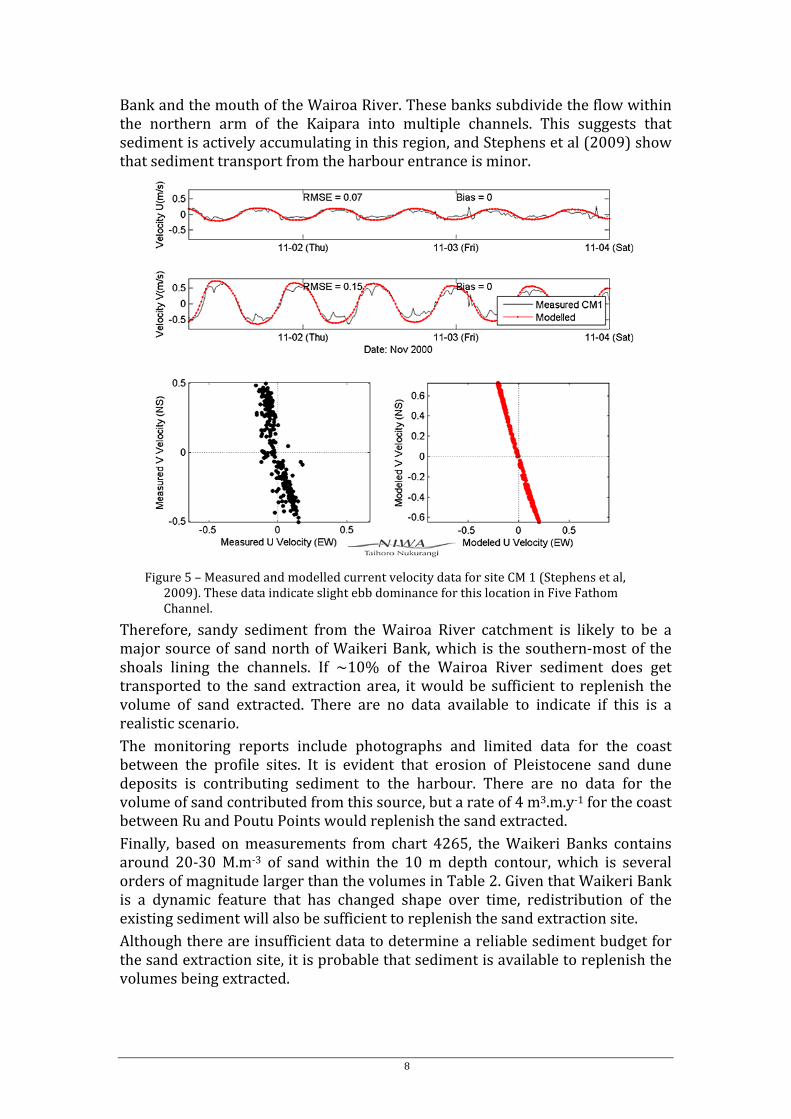
From the numerical modelling undertaken by Stephens et al (2009), some of the sand transported around the flood tidal delta reaches the Waikeri Bank, but it is difficult to assess the volume involved. A short time series of current measurements is available for the Five Fathom Channel at site CM 1 (Figure 5). These data indicate that there is a slight asymmetry in the tidal flows, leading to a minor ebb dominance and, hence, a residual transport towards the south-‐southeast. It is likely that this is balanced by slight flood dominance in the channel to the west of Waikeri Bank. Overall, the numerical modelling suggests that Waikeri Bank is at the boundary of major tidal recirculation of sediment associated with the Kaipara flood delta. The Kaipara Sand Study estimated that the Wairoa River supplies 229,000 m3.y-‐1 of sandy sediment (Table 2) to the upper reaches of Five Fathom Channel. The sediment transport modelling study did not examine the dispersion of this sediment, and it is not known if it reaches Waikeri Bank. However, examination of the hydrographic chart 4265, shows extensive sand banks between Waikeri
8
Bank and the mouth of the Wairoa River. These banks subdivide the flow within the northern arm of the Kaipara into multiple channels. This suggests that sediment is actively accumulating in this region, and Stephens et al (2009) show that sediment transport from the harbour entrance is minor.
Figure 5 – Measured and modelled current velocity data for site CM 1 (Stephens et al,
2009). These data indicate slight ebb dominance for this location in Five Fathom Channel.
Therefore, sandy sediment from the Wairoa River catchment is likely to be a major source of sand north of Waikeri Bank, which is the southern-‐most of the shoals lining the channels. If ~10% of the Wairoa River sediment does get transported to the sand extraction area, it would be sufficient to replenish the volume of sand extracted. There are no data available to indicate if this is a realistic scenario. The monitoring reports include photographs and limited data for the coast between the profile sites. It is evident that erosion of Pleistocene sand dune deposits is contributing sediment to the harbour. There are no data for the volume of sand contributed from this source, but a rate of 4 m3.m.y-‐1 for the coast between Ru and Poutu Points would replenish the sand extracted. Finally, based on measurements from chart 4265, the Waikeri Banks contains around 20-‐30 M.m-‐3 of sand within the 10 m depth contour, which is several orders of magnitude larger than the volumes in Table 2. Given that Waikeri Bank is a dynamic feature that has changed shape over time, redistribution of the existing sediment will also be sufficient to replenish the sand extraction site. Although there are insufficient data to determine a reliable sediment budget for the sand extraction site, it is probable that sediment is available to replenish the volumes being extracted.
9
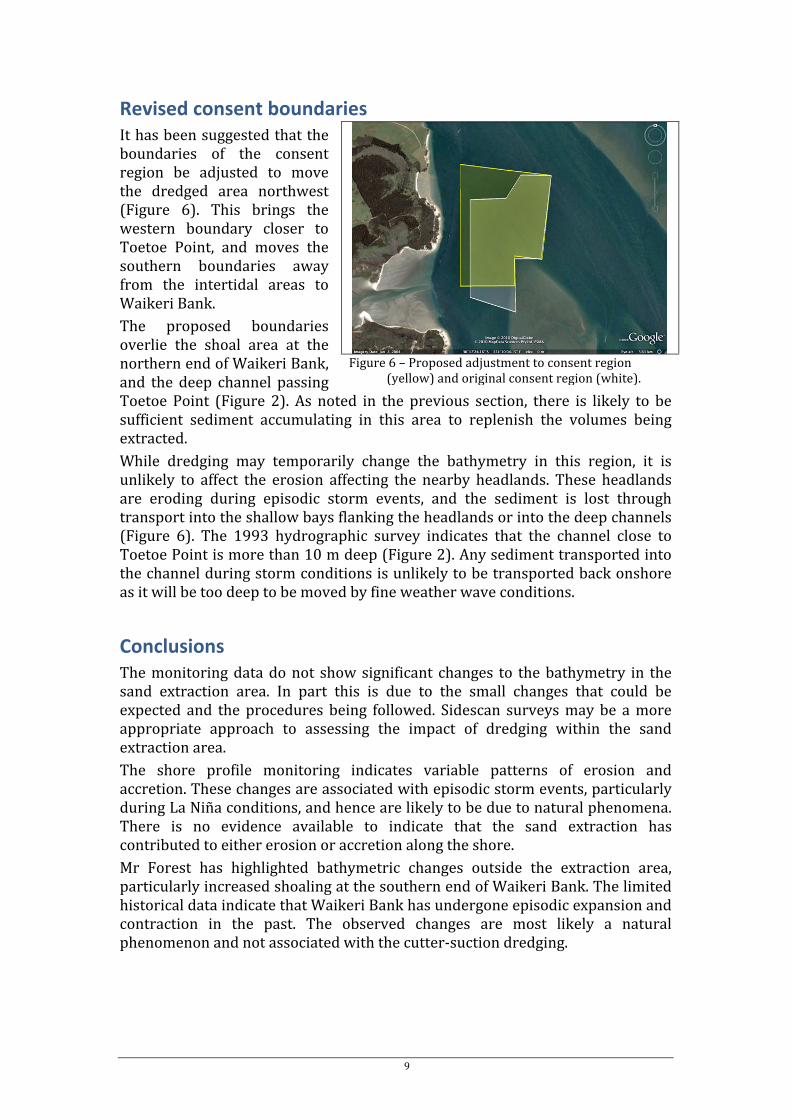
Revised consent boundaries It has been suggested that the boundaries of the consent region be adjusted to move the dredged area northwest (Figure 6). This brings the western boundary closer to Toetoe Point, and moves the southern boundaries away from the intertidal areas to Waikeri Bank. The proposed boundaries overlie the shoal area at the northern end of Waikeri Bank, and the deep channel passing Toetoe Point (Figure 2). As noted in the previous section, there is likely to be sufficient sediment accumulating in this area to replenish the volumes being extracted. While dredging may temporarily change the bathymetry in this region, it is unlikely to affect the erosion affecting the nearby headlands. These headlands are eroding during episodic storm events, and the sediment is lost through transport into the shallow bays flanking the headlands or into the deep channels (Figure 6). The 1993 hydrographic survey indicates that the channel close to Toetoe Point is more than 10 m deep (Figure 2). Any sediment transported into the channel during storm conditions is unlikely to be transported back onshore as it will be too deep to be moved by fine weather wave conditions.
Conclusions The monitoring data do not show significant changes to the bathymetry in the sand extraction area. In part this is due to the small changes that could be expected and the procedures being followed. Sidescan surveys may be a more appropriate approach to assessing the impact of dredging within the sand extraction area. The shore profile monitoring indicates variable patterns of erosion and accretion. These changes are associated with episodic storm events, particularly during La Niña conditions, and hence are likely to be due to natural phenomena. There is no evidence available to indicate that the sand extraction has contributed to either erosion or accretion along the shore. Mr Forest has highlighted bathymetric changes outside the extraction area, particularly increased shoaling at the southern end of Waikeri Bank. The limited historical data indicate that Waikeri Bank has undergone episodic expansion and contraction in the past. The observed changes are most likely a natural phenomenon and not associated with the cutter-‐suction dredging.
Figure 6 – Proposed adjustment to consent region
(yellow) and original consent region (white).
10
References Hume, T; Green, M; Nichol, S; and Parnell, K (2004). Kaipara sand study final report: Sand
movement, storage and extraction in the Kaipara tidal inlet. NIWA Client Report HAM2002-‐064. 53 p.
Parnell KE (2004). Integrating indigenous history, historical records and geomorphic evidence of coastal change: Kaipara Harbour, New Zealand. In: Coast to Coast '04 Conference Proceedings: Australia's National Coastal Conference (CD).
Reeve, G; Swales, A; and Reed, J (2008). Kaipara Harbour sediments: information review. NIWA Client Report HAM2008-‐184. 36 p.
Schofield, JC (1975). Sea-‐level fluctuations cause periodic, post-‐glacial progradation, South Kaipara Barrier, North Island, New Zealand. New Zealand Journal of Geology and Geophysics 18(2): 295-‐316.
Stephens, S; Reeve, G; and Hume, T (2009). Modelling sand transport and deposition in the Kaipara tidal inlet. NIWA Client Report HAM2009-‐087. 79 p.