Embed Size (px)
Citation preview
Title Page
Reviewing the Testing Protocol for Density Cores Collected from CTDOT during the 2012 and 2013 Construction Seasons
Scott Zinke, James Mahoney
Report Number: CT-2281-F-15-8
Final Report
September 27, 2016
Research Project: SPR-2281
Connecticut Advanced Pavement Laboratory Connecticut Transportation Institute
School of Engineering University of Connecticut
Submitted to:
Connecticut Department of Transportation Bureau of Policy and Planning
Roadway Information Systems Unit Research Section
Michael Connors Assistant Director of Policy and Planning

ii
Disclaimer
This report [article, paper or publication] does not constitute a standard, specification or regulation. The contents of this report reflect the views of the authors who are responsible for the facts and the accuracy of the data presented herein. The contents do not necessarily reflect the views of the Connecticut Department of Transportation or the Federal Highway Administration.

iii
Acknowledgments
This report was prepared by the University of Connecticut, in cooperation with the Connecticut Department of Transportation and the United States Department of Transportation, Federal Highway Administration. The opinions, findings and conclusions expressed in the publication are those of the authors and not necessarily those of the Connecticut Department of Transportation or the Federal Highway Administration. This publication is based upon publicly supported research and is copyrighted. It may be reproduced in part or in full, but it is requested that there be customary crediting of the source.
iv
Standard Conversions
SI* (MODERN METRIC) CONVERSION FACTORS APPROXIMATE CONVERSIONS TO SI UNITS
Symbol When You Know Multiply By To Find Symbol
LENGTH in inches 25.4 millimeters mm ft feet 0.305 meters m yd yards 0.914 meters m mi miles 1.61 kilometers km
AREA in
2square inches 645.2 square millimeters mm
2
ft2
square feet 0.093 square meters m2
yd2
square yard 0.836 square meters m2
ac acres 0.405 hectares ha mi
2square miles 2.59 square kilometers km
2
VOLUME fl oz fluid ounces 29.57 milliliters mL
gal gallons 3.785 liters L ft
3 cubic feet 0.028 cubic meters m
3
yd3
cubic yards 0.765 cubic meters m3
NOTE: volumes greater than 1000 L shall be shown in m3
MASS oz ounces 28.35 grams g
lb pounds 0.454 kilograms kgT short tons (2000 lb) 0.907 megagrams (or "metric ton") Mg (or "t")
TEMPERATURE (exact degrees) oF Fahrenheit 5 (F-32)/9 Celsius
oC
or (F-32)/1.8
ILLUMINATION fc foot-candles 10.76 lux lx fl foot-Lamberts 3.426 candela/m
2 cd/m
2
FORCE and PRESSURE or STRESS lbf poundforce 4.45 newtons N lbf/in
2poundforce per square inch 6.89 kilopascals kPa
APPROXIMATE CONVERSIONS FROM SI UNITS
Symbol When You Know Multiply By To Find Symbol
LENGTHmm millimeters 0.039 inches in m meters 3.28 feet ft m meters 1.09 yards yd
km kilometers 0.621 miles mi
AREA mm
2 square millimeters 0.0016 square inches in
2
m2 square meters 10.764 square feet ft
2
m2 square meters 1.195 square yards yd
2
ha hectares 2.47 acres ac km
2 square kilometers 0.386 square miles mi
2
VOLUME mL milliliters 0.034 fluid ounces fl oz
L liters 0.264 gallons gal
m3
cubic meters 35.314 cubic feet ft3
m3
cubic meters 1.307 cubic yards yd3
MASS g grams 0.035 ounces ozkg kilograms 2.202 pounds lbMg (or "t") megagrams (or "metric ton") 1.103 short tons (2000 lb) T
TEMPERATURE (exact degrees) oC Celsius 1.8C+32 Fahrenheit
oF
ILLUMINATION lx lux 0.0929 foot-candles fc cd/m
2candela/m
20.2919 foot-Lamberts fl
FORCE and PRESSURE or STRESS N newtons 0.225 poundforce lbf
kPa kilopascals 0.145 poundforce per square inch lbf/in2
*SI is the symbol for th International System of Units. Appropriate rounding should be made to comply with Section 4 of ASTM E380. e
(Revised March 2003)
v
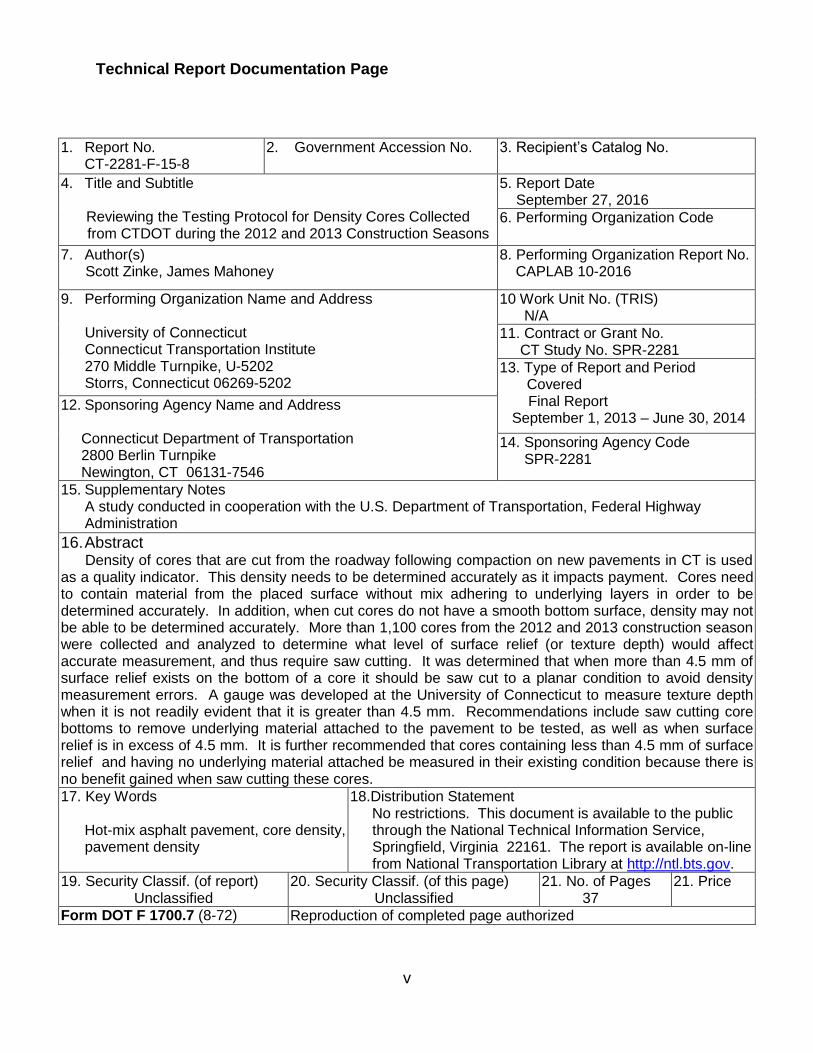
Technical Report Documentation Page
1. Report No. CT-2281-F-15-8
2. Government Accession No.
3. Recipient’s Catalog No.
4. Title and Subtitle
Reviewing the Testing Protocol for Density Cores Collected from CTDOT during the 2012 and 2013 Construction Seasons
5. Report Date September 27, 2016
6. Performing Organization Code
7. Author(s) Scott Zinke, James Mahoney
8. Performing Organization Report No. CAPLAB 10-2016
9. Performing Organization Name and Address
University of Connecticut Connecticut Transportation Institute 270 Middle Turnpike, U-5202 Storrs, Connecticut 06269-5202
10 Work Unit No. (TRIS) N/A
11. Contract or Grant No. CT Study No. SPR-2281
13. Type of Report and Period Covered Final Report September 1, 2013 – June 30, 2014
12. Sponsoring Agency Name and Address Connecticut Department of Transportation 2800 Berlin Turnpike Newington, CT 06131-7546
14. Sponsoring Agency Code SPR-2281
15. Supplementary Notes A study conducted in cooperation with the U.S. Department of Transportation, Federal Highway
Administration
16. Abstract Density of cores that are cut from the roadway following compaction on new pavements in CT is used as a quality indicator. This density needs to be determined accurately as it impacts payment. Cores need to contain material from the placed surface without mix adhering to underlying layers in order to be determined accurately. In addition, when cut cores do not have a smooth bottom surface, density may not be able to be determined accurately. More than 1,100 cores from the 2012 and 2013 construction season were collected and analyzed to determine what level of surface relief (or texture depth) would affect accurate measurement, and thus require saw cutting. It was determined that when more than 4.5 mm of surface relief exists on the bottom of a core it should be saw cut to a planar condition to avoid density measurement errors. A gauge was developed at the University of Connecticut to measure texture depth when it is not readily evident that it is greater than 4.5 mm. Recommendations include saw cutting core bottoms to remove underlying material attached to the pavement to be tested, as well as when surface relief is in excess of 4.5 mm. It is further recommended that cores containing less than 4.5 mm of surface relief and having no underlying material attached be measured in their existing condition because there is no benefit gained when saw cutting these cores.
17. Key Words Hot-mix asphalt pavement, core density,
pavement density
18.Distribution Statement No restrictions. This document is available to the public
through the National Technical Information Service, Springfield, Virginia 22161. The report is available on-line from National Transportation Library at http://ntl.bts.gov.
19. Security Classif. (of report) Unclassified
20. Security Classif. (of this page) Unclassified
21. No. of Pages 37
21. Price
Form DOT F 1700.7 (8-72) Reproduction of completed page authorized
vi
Table of Contents
Title Page ......................................................................................................................... i
Disclaimer ........................................................................................................................ii
Acknowledgments ........................................................................................................... iii
Standard Conversions .....................................................................................................iv
Technical Report Documentation Page ........................................................................... v
Table of Contents ............................................................................................................vi
List of Tables .................................................................................................................. vii
List of Figures ................................................................................................................. vii
Introduction and Background Summary .......................................................................... 1
Problem Statement.......................................................................................................... 2
Objectives ....................................................................................................................... 3
Work Plan ........................................................................................................................ 3
Review of Regional Specifications .................................................................................. 4
Collection and Processing of Acceptance Cores from CTDOT ....................................... 7
Determination of Surface Relief Measurement .............................................................. 10
Results of Saw Cutting and Resultant Density .............................................................. 14
Determination of Cores to be Saw Cut .......................................................................... 20
Conclusions ................................................................................................................... 27
Recommendations ........................................................................................................ 28
References .................................................................................................................... 29
vii
List of Tables
Table 1. Categorized Core Conditions .......................................................................... 14
Table 2. Change in Density After Saw Cuts .................................................................. 15
Table 3. Student’s t-test after 1st and 2nd Saw Cut ....................................................... 15
Table 4. Student’s t-test Condition A Cores vs. Condition B Cores .............................. 17
Table 5. AASHTO T-331 Precision Comparison of Bulk Values After Saw Cuts .......... 18
Table 6. Student’s t-test 1-Cut Cores and 2-Cut Cores ................................................ 18
Table 7. Mat and Joint Core Analyses Results ............................................................. 20
List of Figures
Figure 1. Core with Partial Underlying Layer Attached ................................................... 9
Figure 2. Different Levels of Unclean Delamination on Cores ...................................... 10
Figure 3. Contour Duplication Gauge ........................................................................... 11
Figure 4. Core Contour Relief Plan .............................................................................. 12
Figure 5. Core Surface Texture Depth Gauge .............................................................. 22
Figure 6. Ball Bearing Placed in Deepest Crevice of Core ........................................... 23
Figure 7. Texture Gauge Glass Plate Lowered onto Core via Slide ............................. 24
Figure 8. Texture Gauge Glass Plate in Contact With Core ......................................... 25
Figure 9. Thin Gauge Metal Used to Determine Glass Plate Contact Point ................. 26
Introduction and Background Summary
The achievement of proper density during placement of Hot-Mix Asphalt (HMA) is one
of the most important aspects of constructing a pavement that will provide a long
service life. In recent years, the Connecticut Department of Transportation (CTDOT)
has modified their construction specifications to measure the in-place density of HMA
pavements at the time of construction by cutting cores and measuring the density of the
cores as a basis for payment. Previously, in-place density was measured by CTDOT
primarily through the use of nuclear density gauges.
During the process of cutting the cores, the cores for the layer being tested may
separate cleanly from the layers below. In other cases, the pavement may have to be
cut (cored) well into the underlying layers and broken off in order to remove it from the
core hole. In these cases the materials from the underlying layers must be removed
before the wearing surface can be tested for density. The use of a chisel to remove the
unwanted layers often produces a smooth surface on the bottom side of the core to be
tested. In other cases however, the unwanted layer does not separate cleanly, which
leaves a very uneven surface on the bottom of the core. This can result from either the
wearing surface breaking unevenly or a portion of the underlying paving course
remaining on the bottom side of the core.
Some have expressed concern about the potential impact to core integrity when using a
hammer and chisel to separate the layers of the cores. An alternative method for
removing the unwanted layers is to use a diamond saw to cut between the layers. From
previous experimentation conducted by the CAP Lab, the use of a diamond saw to
remove the unwanted material will result in a clean separation of layers leaving only the
material intended to be measured.
CTDOT uses a vacuum sealing device (as described by AASHTO T331 [1]) for the
standard method of testing cores for density. This method uses a soft plastic bag and a
vacuum to seal the plastic bag to the core. This method is desirable as it is the most
reproducible when compared to the alternative practice of density measurement
(AASHTO T166 [2]) where the core is submerged in water and then its saturated

2
surface dry weight is determined. Experience has proven some difficulty with AASHTO
T166 for cores with higher air void contents as the length of time taken to dry the
specimen to saturated surface dry will allow the water to drain out of the pore spaces,
and therefore alter the results. However, there can also be issues with using the
vacuum sealing method. Given that the test method assumption is that the surfaces of
the cores are relatively smooth, when the chiseling method produces an uneven
surface, the density measured can be impacted. It is stated in the AASHTO designation
[1] “Specimen ends or planar edges may require sawing if the bag does not conform to
the specimen in a uniform manner.”
Problem Statement
The separation of the unwanted layers from the cores being tested is necessary to
accurately measure the density of the layer being tested. In some cases, this
separation leaves a very irregular surface during extraction or while removing
underlying material with a chisel. The intention of this research was to determine the
effect of surface relief on cores that do not have a relatively smooth surface when
separated. This research was also intended to produce a recommendation as to the
maximum amount of relief that will not have a significant impact on the accuracy of the
measured density.
In anticipation of this research, the CAP Lab collected approximately 700 cores from
CTDOT during the 2012 construction season. These cores were collected on random
days during the construction season and included mat and joint cores from both HMA
and Warm Mix Asphalt (WMA) projects. CTDOT forwarded the density testing results
for all of these cores to the research team. Several of the cores collected in 2012 were
collected at the end of the season and may or may not have been tested by CTDOT.
3
Objectives
The objectives of the research were to determine the effects of surface relief on the
bottom side of a core after splitting the unwanted layers from the core, producing a
methodology for measuring the relief on the bottom side of the core, as well as
developing a recommendation on the maximum amount of relief that can be allowed to
remain on the core without affecting the resultant measured density. In addition, this
research sought to examine the effect of taking thin slices (each slice approximately the
width of a diamond saw blade) from the bottom of cut cores by measuring density
before and after each cut.
Work Plan
The work items associated with this research were:
Performing a survey of the handling of cut cores within Departments of
Transportation in the northeast region. The specific information sought was
whether they have smoothness requirements for the bottom of cores and how
they remove unwanted material from cores prior to density measurements.
Collection from CTDOT of cores used for acceptance. The research team
requested cores from the CTDOT testing facility to use for analysis of surface
irregularity, underlying material and density measurements. The cores were
picked up by CAP Lab personnel on random days throughout the 2012 and
2013 construction seasons.
The collected cores were sorted into surface mat and paving joint cores, and
these cores were analyzed in an effort to determine if either of those groups
was more prone to having irregular surfaces and therefore in need of being
handled differently.
All of the cores were examined to see if there appeared to be underlying
material still attached when they were received from CTDOT. The number and
percentage of cores with underlying material on them was recorded
4
The cores were categorized as having separated cleanly (i.e. having a thorough
separation of material at the interface of the wearing surface and the underlying
material) or not.
Finally, the research team investigated a methodology for quantifying the level
of relief or surface irregularity on the bottom of those cores that did not separate
cleanly. Once this methodology was developed, the research team determined
the maximum allowable amount of surface relief on the bottom of cores before
saw cutting becomes necessary for density measurement purposes. This was
followed by cutting cores with the most uneven surfaces to remove the “highest”
peaks by shaving approximately one saw blade width from the core. Then, the
Corelok® (vacuum seal) procedure, which conforms to the standards in the
vacuum seal procedure [1] discussed previously, was used to determine how
much this changed the bulk specific gravity of the cores. Finally, the amount of
the reduced surface relief remaining was measured. This was indicative of the
threshold amount of relief present at the bottom of the core that will not affect
density.
Review of Regional Specifications
Rhode Island Department of Transportation (RIDOT)
RIDOT supplemental specification [3] indicates that roads not designated as with “Pay
Adjustments” will be measured using either a nuclear density gauge or in-place cores.
For the roads that are designated as with “Pay Adjustments” compaction levels are to
be measured using in-place cores. The specification further states that any cores that
are not taken under the direction of the engineer and witnessed by the engineer, will not
be used for acceptance. The cores are to be extracted following rolling and prior to
opening the section to traffic. The engineer takes immediate possession of the cores
upon extraction and retains them for a minimum of four weeks after the results are
reported to the contractor. Cores are cut to the full depth of the course being placed.
There is no statement indicating the protocol that should be followed if a core separates
5
unevenly or if the core has underlying material from a previously placed layer attached
to it.
Massachusetts Department of Transportation (MassDOT)
MassDOT supplemental specifications [4] indicate that the acceptable range of in-place
density of asphalt pavements is 95% ± 2.5% of the maximum theoretical density as
determined via AASHTO T209 [5]. The engineer is to obtain all of the core samples
with the assistance of the contractor, be present to direct the sample extraction and to
take immediate possession of the samples. The specification further states that the
contractor shall have acceptable coring and core retrieval equipment for the coring
operation and that the cores shall be protected from damage. According to the
supplement, the cored specimens shall have their Gmb determined via AASHTO T 166
[2], AASHTO T 275 [6] and AASHTO T 269 [7]. There are also requirements for
determining the random locations of the acceptance cores. There is no language
regarding the handling of the cores with respect to uneven separation or the presence
of underlying material or specifically how to handle those situations.
New Hampshire Department of Transportation (NHDOT)
NHDOT [8] requires in-place air voids to be determined based on cores in accordance
with AASHTO T269 [7]. The specification requires full depth cores containing all new
pavement layers to be collected by the contractor in the presence of the Engineer. The
specification further states the complete sample (unseparated) shall be transferred to
the NHDOT testing lab location. There is no language regarding the method of
separation of the pavement layers, removal of underlying material or a procedure for
uneven surface.
Vermont Agency of Transportation (VAOT)
VAOT [9] requires acceptance testing of asphalt pavements via core density as
determined by AASHTO T 166 [2]. The specification states that acceptance testing is
conducted by agency personnel but that the cores are to be obtained and provided by
the contractor. The cores are to be obtained in the presence of the Engineer or the
Engineers designee. The specification further states that cores must be submitted to
6
the engineer in a suitable container. If the cores are not delivered in a container that is
suitable then they are to be rejected. Agency personnel are to process the cores in
accordance with the stated method within 10 days and report those results to both the
Engineer and the contractor. It is stated that all cores will be saw cut. The contractor
shall mark the cores for saw cutting in the presence or the Engineer or the designee for
verification of cut locations.
VAOT also specifies that cores will be used to evaluate the degree of compaction at the
longitudinal joint. There is no language regarding saw cutting the joint compaction
specimens and there is a statement indicating that joint cores need not be subject to the
provisions of the previous specification subsections, which require saw cutting of
acceptance cores. There are, however, requirements as to the transverse location of
the core with respect to the visible joint line. The location of the core on a longitudinal
butt joint is centered over the visible joint line on the surface. The transverse location of
the core on a tapered joint is offset from the visible joint line about 50% of the taper
width.
Maine Department of Transportation (MaineDOT)
MaineDOT [10] requires that compaction acceptance be conducted via core samples in
accordance with AASHTO T-166 [2]. The contractor is to obtain the cores at the
specified locations no later than the end of the day following the day that the pavement
was placed. The contractor is to turn the core samples over to the department
immediately. The cut cores are placed in a container that is provided by MaineDOT. At
the time of sampling, the contractor and representative from MaineDOT will mutually
decide if the core specimen is damaged and if necessary, obtain a new specimen. Also
at the time of core extraction, the contractor and MaineDOT will mutually decide if saw
cutting is necessary and will mark the core at the location where sawing is necessary. It
is further stated that the saw cutting may be performed by the contractor in the
presence of a MaineDOT representative or by the department in a MaineDOT facility.
The specification states that saw cutting is not to disturb the layer being tested and that
saw cutting is intended to remove underlying layers of pavement, gravel or RAP.
7
New York State Department of Transportation (NYSDOT)
NYSDOT [11] requires that the engineer will select coring locations for each project sub
lot. The locations are to be determined after the rolling/compaction process has been
completed. The cores are to be obtained no more than 1 day following placement of the
material. The specification recommends cooling the pavement if necessary so that the
cores are not damaged during the coring process. It is then stated that If the core
sample does not de-bond during coring, do not intentionally separate the pavement core
from the underlying material. The Regional Materials Laboratory will separate the
pavement core layer required for testing from the underlying material by sawing, if
necessary.
New Jersey Department of Transportation (NJDOT)
NJDOT [12] requires that core samples be cut at random locations determined by the
Resident Engineer at least 12 hours after the mat was paved. The specification states
that during coring, the full depth of the course shall be recovered for air void
determination. It further states that if thickness testing is also required, the core should
be drilled through the full depth of the pavement. The department will then test the full
depth cores for whatever thickness measurements are required as well as surface
course air voids. There is no mention of the method to remove underlying layers.
Collection and Processing of Acceptance Cores from CTDOT
CAP Lab personnel traveled to the CTDOT central testing facility on several occasions
during the 2012 and 2013 construction seasons to collect cores that may have been
used for acceptance purposes. In an effort to collect cores in an unbiased manner, the
days when CAP Lab personnel collected cores were chosen at random. The purpose
was to obtain a snapshot of several random days involving multiple construction or
paving projects and multiple paving contractors.
A total of 717 cores were collected from CTDOT during the 2012 construction season.
This included a combination of both joint and mat cores. An inventory database of the
8
cores was developed in order to designate cores that separated cleanly and those that
did not. The database was developed with FileMaker® Pro. The data entry fields
included the following:
Project #
Lot #
Producer/facility
Mix Type
Gmm (from CTDOT acceptance data)
Gmb (from CTDOT acceptance data)
Placement Date
Core ID
Mat or Joint Core
Clean or Unclean Separation
Initial Core Thickness as determined by ASTM D 3549 [13]
Final Core Thickness (if core was saw cut)
Underlying Material Present (yes/no)
Initial Image of the Bottom of the Core
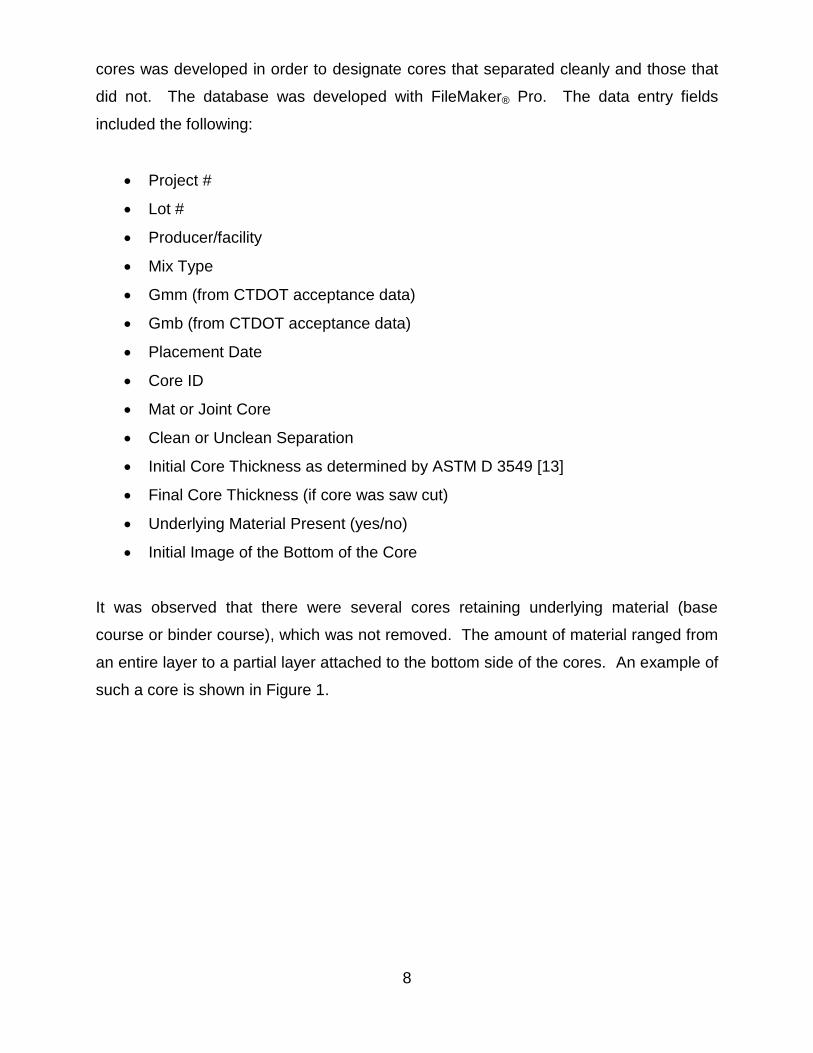
It was observed that there were several cores retaining underlying material (base
course or binder course), which was not removed. The amount of material ranged from
an entire layer to a partial layer attached to the bottom side of the cores. An example of
such a core is shown in Figure 1.
9
Figure 1. Core with Partial Underlying Layer Attached
At this point CAP Lab personnel along with CTDOT acceptance testing personnel spent
time experimenting with underlying layer identification methods. The group also spent
time experimenting with different methods of separating those identified layers including
chisel method and the saw cutting method. During this process inventoried cores were
damaged through experimentation and could not be used for any sort of surface texture
analysis. It was then decided that this investigation would be extended to involve the
collection of cores from the 2013 construction season as well.
CAP Lab personnel with assistance from CTDOT acceptance testing personnel
collected an additional 426 cores on random days over the course of the 2013
construction season. All of the necessary testing data and information was provided by
CTDOT with the 2013 cores, as well. Random checks were made to verify the accuracy
of the initial reported bulk densities from which there were no discrepancies. A
negligible number of the cores collected during the 2013 season contained any
observable underlying material. In addition, there were 190 (of the 426) cores collected
from the 2013 season that did not separate cleanly. It should be noted that the
research team was calling a separation unclean if there was any sign of irregular
10
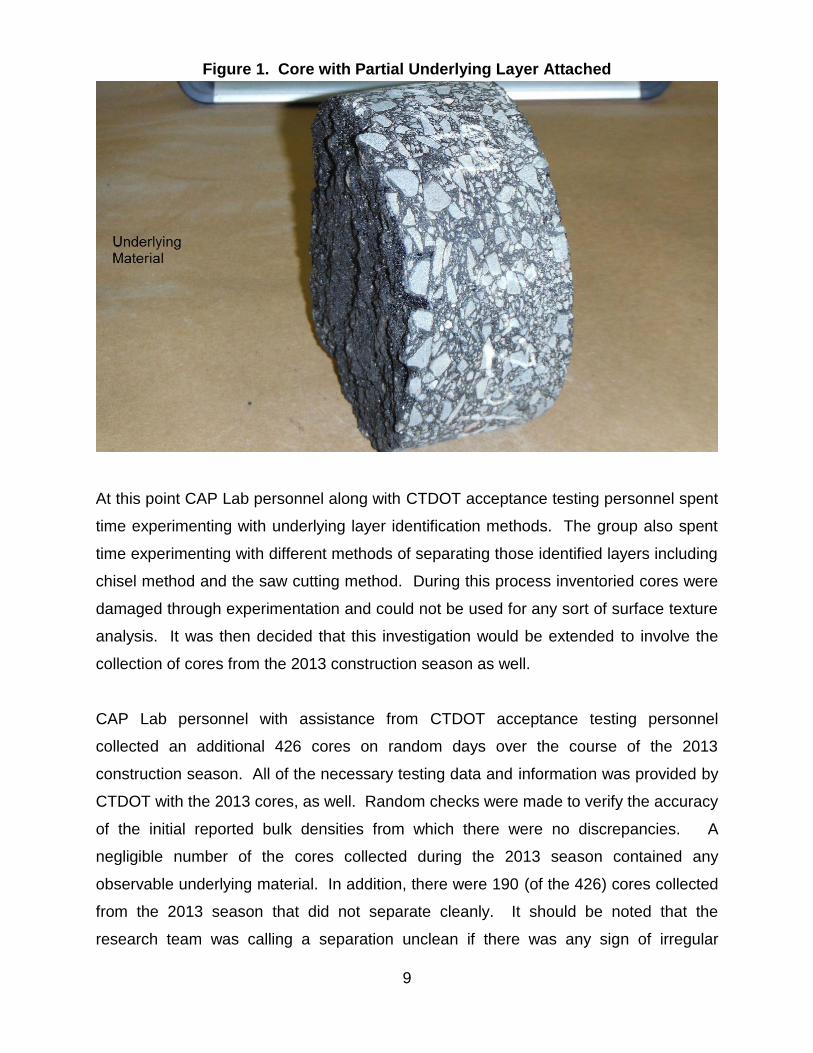
surface relief, noticed through simple observation. This means that there are (were)
varying degrees of unclean separation of the pavement layers as it was unknown at that
point in time what an acceptable amount of surface relief was. Figure 2 provides
examples of two different levels of unclean separation, as they were termed for
purposes of this research.
Figure 2. Different Levels of Unclean Separation on Cores
These 190 cores in addition to the cores that were remaining from the 2012 collection
became the pool of samples, which were selected from at random for measurement of
surface relief and density.
Determination of Surface Relief Measurement
Several attempts at measuring surface relief were made. The first was the highest and
lowest point on the irregular surface from the face/top of the core, measured with digital
micrometers. Given the varying amount of relief between the highest and lowest point
of a given core, (especially on cores with higher levels of surface texture) this method
was quickly abandoned.
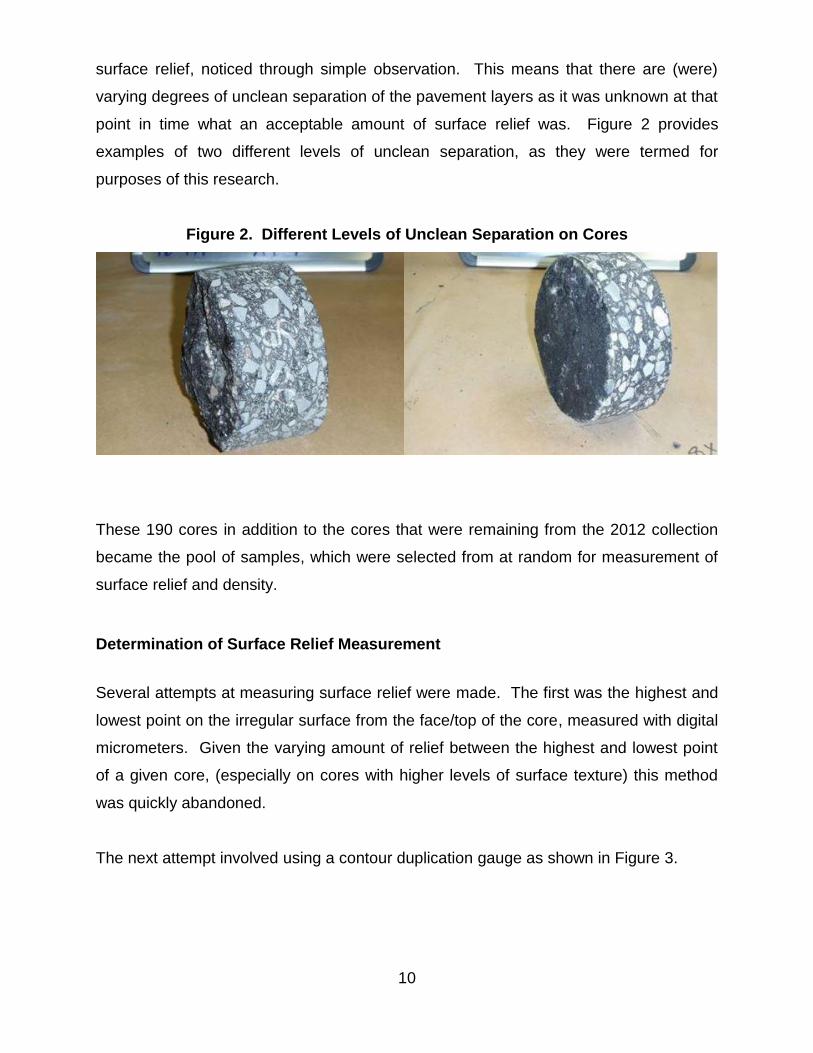
The next attempt involved using a contour duplication gauge as shown in Figure 3.
11
Figure 3. Contour Duplication Gauge
This method involved pressing the gauge down evenly to match the contour of the
irregular surface plane for three locations on the core bottom surface. The locations of
lines for measurement were selected by first using a diameter that crossed the highest
peak on the surface. The other two lines of measurement were then selected to be at
60° and then 120° from the first measurement line as shown in Figure 4.
12
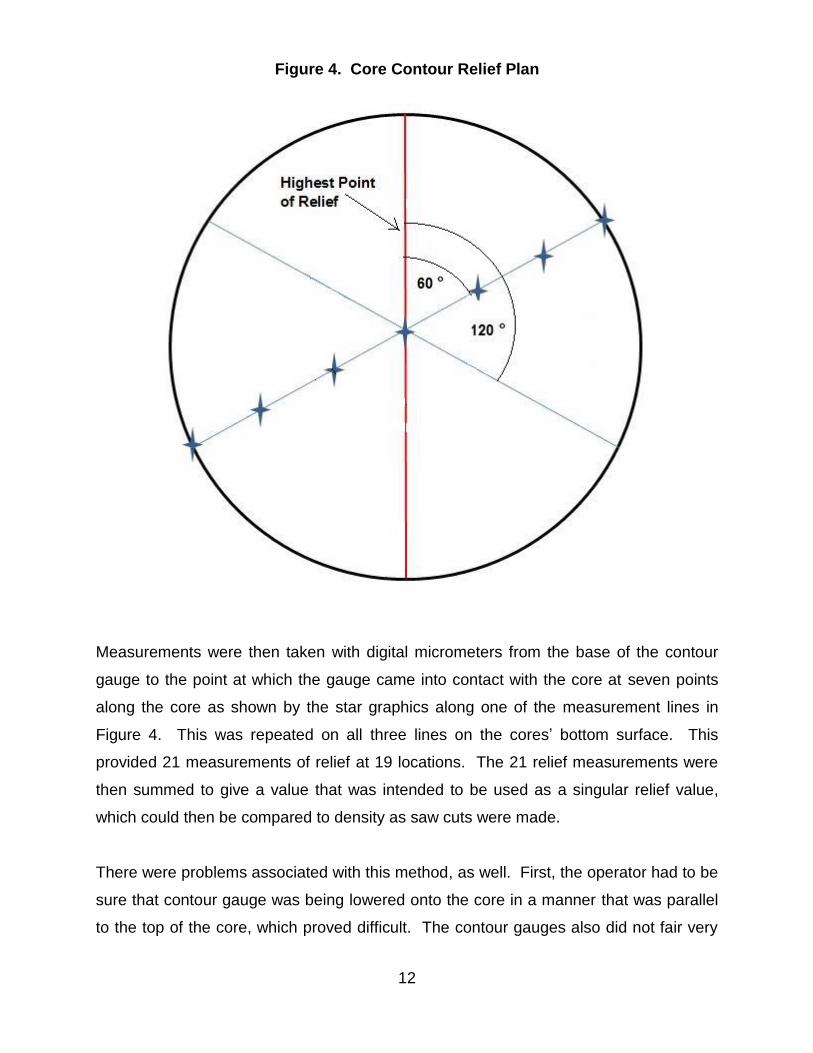
Figure 4. Core Contour Relief Plan
Measurements were then taken with digital micrometers from the base of the contour
gauge to the point at which the gauge came into contact with the core at seven points
along the core as shown by the star graphics along one of the measurement lines in
Figure 4. This was repeated on all three lines on the cores’ bottom surface. This
provided 21 measurements of relief at 19 locations. The 21 relief measurements were
then summed to give a value that was intended to be used as a singular relief value,
which could then be compared to density as saw cuts were made.
There were problems associated with this method, as well. First, the operator had to be
sure that contour gauge was being lowered onto the core in a manner that was parallel
to the top of the core, which proved difficult. The contour gauges also did not fair very
13
well with all of the measurements that were made resulting in damage to the gauge
itself. These measurements took an unreasonable amount of time to obtain. Finally it
was found that this method was not repeatable or consistent as the amount of relief on
the core was quite variable, and measurement on three lines may not have been
enough to enumerate the relief.
The research team then took the approach of measuring the core density after a saw
cut was made and comparing that density to the initial density. After this, a second saw
cut was made, which, for the majority of the cores, left no more relief on the core. Each
time a saw cut was made the width of the cut was as close as possible to the width of
the blade on the saw. That width is 4.5 mm. The intention behind this approach was to
gain insight as to what effect sawing off irregular surfaces would have on density. If
sawing off one blade width on the core surface had little or no impact on density then
perhaps saw cutting of certain cores would not be necessary for obtaining accurate
density readings.
Eighty cores with irregular surfaces, but containing no underlying material, were
selected for this analysis. This included both mat and joint cores of varying initial
density from 24 projects. The data from 72 of these cores was used for the analysis as
there were eight values that were determined to be statistical outliers as tested via the
Modified Thomson Tau method. In addition to those 72 cores, a group of 23 cores,
which were deemed to have no measurable surface relief, were selected for
comparative analysis. The data from 21 of these cores was used for the analysis as
there were two values that were determined to be statistical outliers as tested via the
Modified Thompson Tau method.
In an attempt to avoid confusion among the groups of cores which underwent
comparison, the following categories of conditions were established:
14
Condition A – No noticeable surface relief. Core surface was considered to be
smooth.
Condition B – Core surface was considered smooth after one saw cut, which
was the width of the saw blade. Core initially had 4.5 mm or less of surface
relief depth.
Condition C – Core surface was considered smooth after two cuts, each cut
being the width of the saw blade. Core initially had more than 4.5 mm of
surface relief depth.
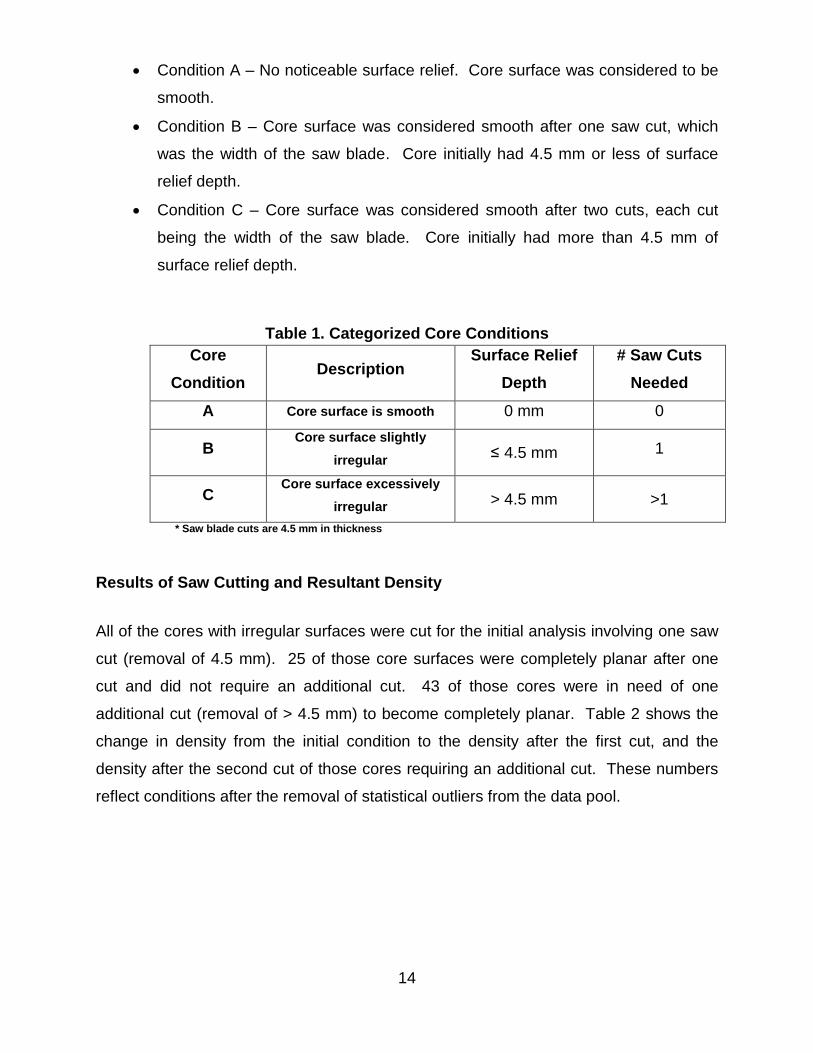
Table 1. Categorized Core Conditions
Core
Condition Description
Surface Relief
Depth
# Saw Cuts
Needed
A Core surface is smooth 0 mm 0
B Core surface slightly
irregular ≤ 4.5 mm 1
C Core surface excessively
irregular > 4.5 mm >1
* Saw blade cuts are 4.5 mm in thickness
Results of Saw Cutting and Resultant Density
All of the cores with irregular surfaces were cut for the initial analysis involving one saw
cut (removal of 4.5 mm). 25 of those core surfaces were completely planar after one
cut and did not require an additional cut. 43 of those cores were in need of one
additional cut (removal of > 4.5 mm) to become completely planar. Table 2 shows the
change in density from the initial condition to the density after the first cut, and the
density after the second cut of those cores requiring an additional cut. These numbers
reflect conditions after the removal of statistical outliers from the data pool.
15
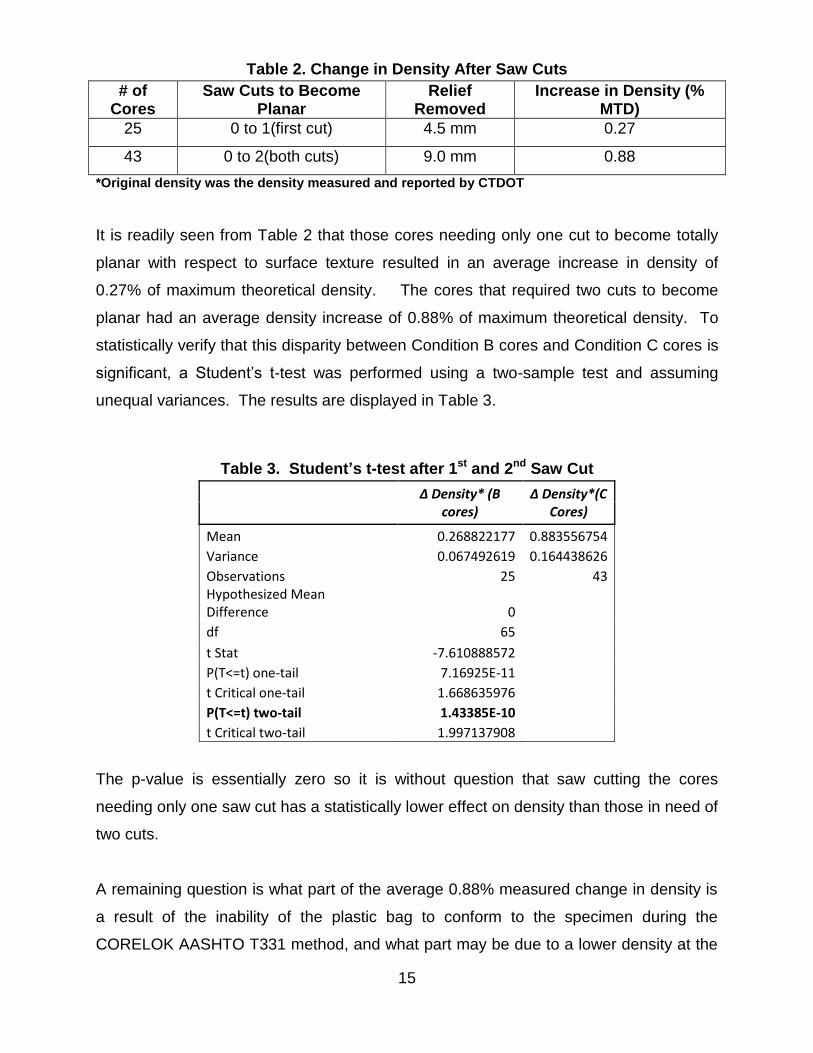
Table 2. Change in Density After Saw Cuts
# of Cores
Saw Cuts to Become Planar
Relief Removed
Increase in Density (% MTD)
25 0 to 1(first cut) 4.5 mm 0.27
43 0 to 2(both cuts) 9.0 mm 0.88
*Original density was the density measured and reported by CTDOT
It is readily seen from Table 2 that those cores needing only one cut to become totally
planar with respect to surface texture resulted in an average increase in density of
0.27% of maximum theoretical density. The cores that required two cuts to become
planar had an average density increase of 0.88% of maximum theoretical density. To
statistically verify that this disparity between Condition B cores and Condition C cores is
significant, a Student’s t-test was performed using a two-sample test and assuming
unequal variances. The results are displayed in Table 3.
Table 3. Student’s t-test after 1st and 2nd Saw Cut
Δ Density* (B cores)
Δ Density*(C Cores)
Mean 0.268822177 0.883556754
Variance 0.067492619 0.164438626
Observations 25 43 Hypothesized Mean Difference 0
df 65
t Stat -7.610888572
P(T<=t) one-tail 7.16925E-11
t Critical one-tail 1.668635976
P(T<=t) two-tail 1.43385E-10
t Critical two-tail 1.997137908
The p-value is essentially zero so it is without question that saw cutting the cores
needing only one saw cut has a statistically lower effect on density than those in need of
two cuts.
A remaining question is what part of the average 0.88% measured change in density is
a result of the inability of the plastic bag to conform to the specimen during the
CORELOK AASHTO T331 method, and what part may be due to a lower density at the
16
bottom 9 mm of a pavement layer as a result of construction compaction, compared to
the upper portion of the core.
If there is no error with the AASHTO T331 test, and all of the average 0.88% change is
due to lower density at the bottom of the pavement layer, then the question arises: Why
would the average density change (0.61%) from 4.5 mm to 9 mm from the bottom of the
core, which is more than twice as much as the change in density of 0.27% from 0 to 4.5
mm (the lowest section) of the “A” cores?
It appears then that the results found are a combination of the two conditions. Based
upon the evaluation of the designated “A” cores, the average change in density due to
distance from bottom of core might be assumed at 0.27% per 4.5 mm, or alternatively a
0.06% increase per mm from the bottom. With that assumption made, the change in
density for the bottom 9mm should be approximately 0.54%, (0.06% X 9). The actual
measured average change of 0.88% minus the theorized 0.54% due to assumed
change in density equals 0.34%, which is the additional average density change found
for the “C” cores. This additional 0.34% average density change could be attributed to
error during the AASHTO T331 Test, (when a rough core surface is in excess of 4.5
mm).
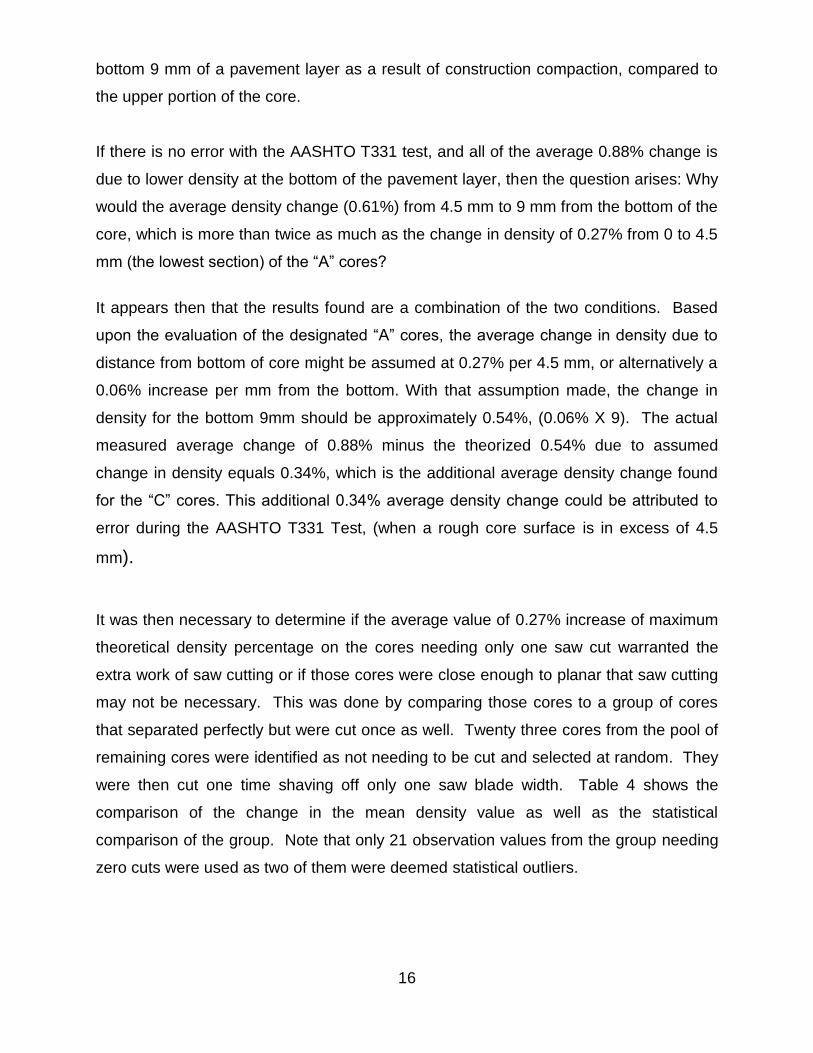
It was then necessary to determine if the average value of 0.27% increase of maximum
theoretical density percentage on the cores needing only one saw cut warranted the
extra work of saw cutting or if those cores were close enough to planar that saw cutting
may not be necessary. This was done by comparing those cores to a group of cores
that separated perfectly but were cut once as well. Twenty three cores from the pool of
remaining cores were identified as not needing to be cut and selected at random. They
were then cut one time shaving off only one saw blade width. Table 4 shows the
comparison of the change in the mean density value as well as the statistical
comparison of the group. Note that only 21 observation values from the group needing
zero cuts were used as two of them were deemed statistical outliers.
17
Table 4. Student’s t-test Condition A Cores vs. Condition B Cores
Δ Density* (A cores)
Δ Density* (B cores)
Mean 0.281673684 0.268822177
Variance 0.062966529 0.067492619
Observations 21 25 Hypothesized Mean Difference 0
df 43
t Stat 0.170250585
P(T<=t) one-tail 0.432805799
t Critical one-tail 1.681070703
P(T<=t) two-tail 0.865611597
t Critical two-tail 2.016692199
With a t-statistic well under the critical value and a p-value of 0.87, it is clear that this
analysis points towards a statistical similarity between these two groups of cores. This
lends credence towards the notion that the cores needing only one saw cut to become
completely planar may not need to be cut at all as they behave statistically the same as
cores that don’t need to be cut. That is, Condition B cores are statistically the same as
Condition A cores and there is no benefit gained from saw cutting. It can also be seen
that cutting the bottom layer off of a core that is planar starts to increase density
(although not statistically significant). This is likely due to the removal of a blade width
of material over the complete cross section of the core. This should be expected with
the removal of that amount of material from the bottom of the core.
An argument could be made that the dissimilar distribution of air voids among the two
different sets of cores from Table 4 could bring the statistical values in this analysis into
question. Because of this possibility, the research team made the decision to compare
the average difference in bulk specific gravity after both the first cut and the second cut
of the cores to the single-operator precision acceptable range of two results as defined
in AASHTO T-331 [1]. These are values that AASHTO states to be the acceptable limit
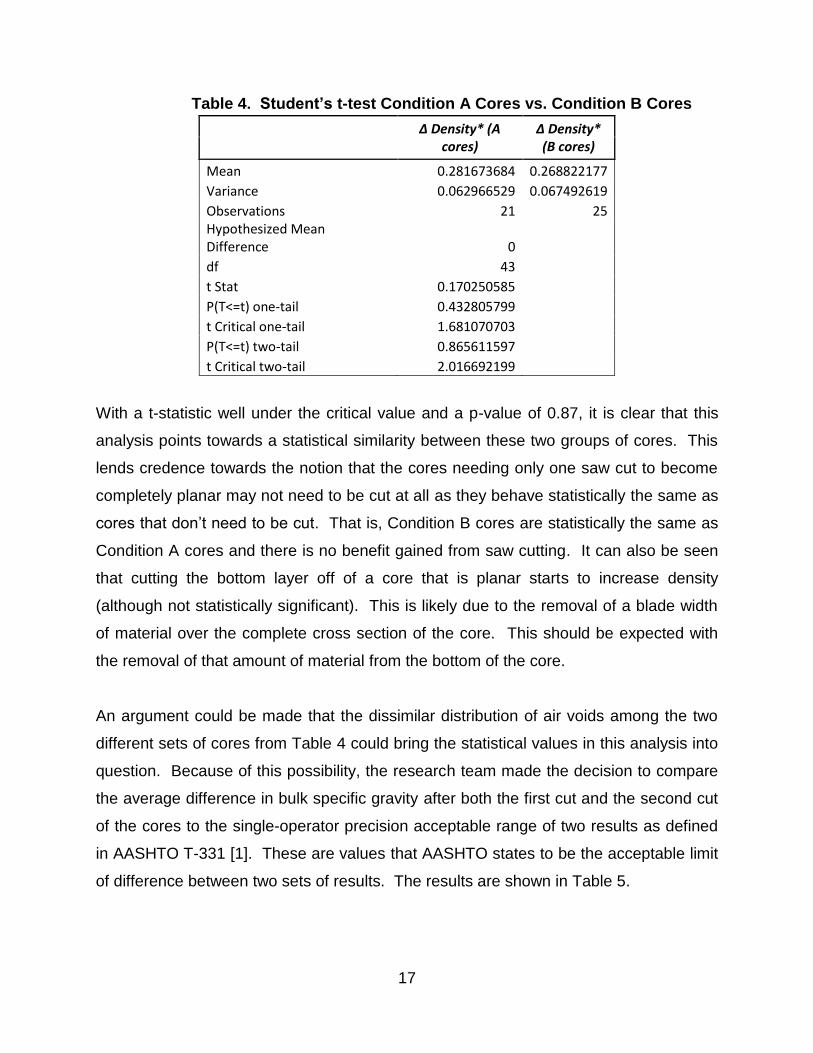
of difference between two sets of results. The results are shown in Table 5.
18
Table 5. AASHTO T-331 Precision Comparison of Bulk Values After Saw Cuts
1st Cut ΔGmb
(Cores B)
2nd Cut ΔGmb
(Cores C)
AASHTO 1 Operator Precision Limit
0.004 0.014 0.035
Although both groups fall within the acceptable precision limits of the test, it is clear that
the group of cores needing two cuts (the C cores) comes much closer to approaching
the acceptable limit than the group which was only cut once. Finally, a statistical
comparison of the change in Gmb among those two groups was conducted. The results
of that comparison are shown in Table 6.
Table 6. Student’s t-test 1-Cut Cores and 2-Cut Cores
Δ Gmb* (B cores) Δ Gmb*(C Cores)
Mean 0.004308048 0.014159563
Variance 1.73335E-05 4.22313E-05
Observations 25 43 Hypothesized Mean Difference 0
df 65
t Stat -7.610888572
P(T<=t) one-tail 7.16925E-11
t Critical one-tail 1.668635976
P(T<=t) two-tail 1.43385E-10
t Critical two-tail 1.997137908
Given the low p-value in Table 5 it cannot be concluded that the difference in the
averages of these two groups of data is due simply to chance. They are statistically
different even though they are within the AASHTO precision limits shown in Table 5.
There was also the increase of more than 0.88% density on the Condition C cores
shown in Tables 2 and 3. There is a discrepancy among the analyses shown in Tables
3, 5 and 6. The statistical comparisons shown in Tables 3 and 6 indicate these groups
of cores are different while the AASHTO precision statement shown in Table 5 indicates
that the changes in density among the two groups are the same. It is the opinion of the
research team that because they are statistically different that they be treated that way.

19
Given the analyses shown in Tables 2 through 6, it is the opinion of the research team
that cores needing to be cut a second time to become completely planar (Condition C
cores) are subject to a significantly increased possibility of accuracy error when being
tested via AASHTO T-331 relative to those cores that separate cleanly (Condition A)
and those only needing one cut (Condition B) to become planar.
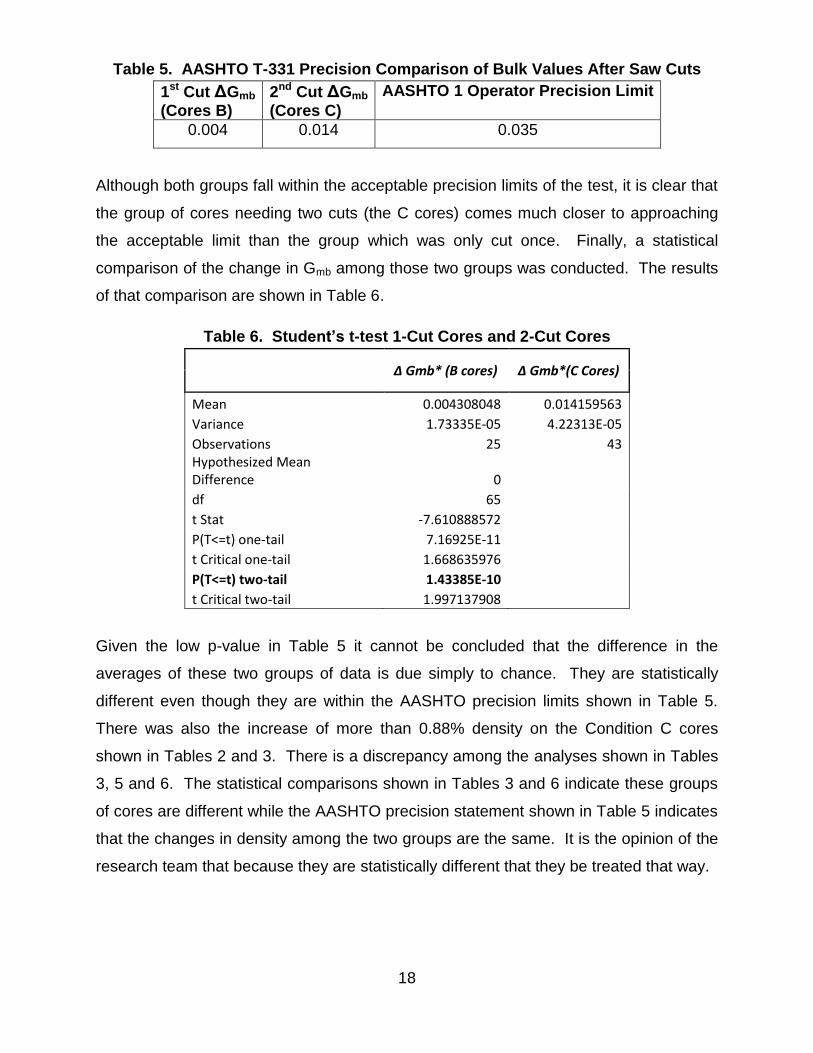
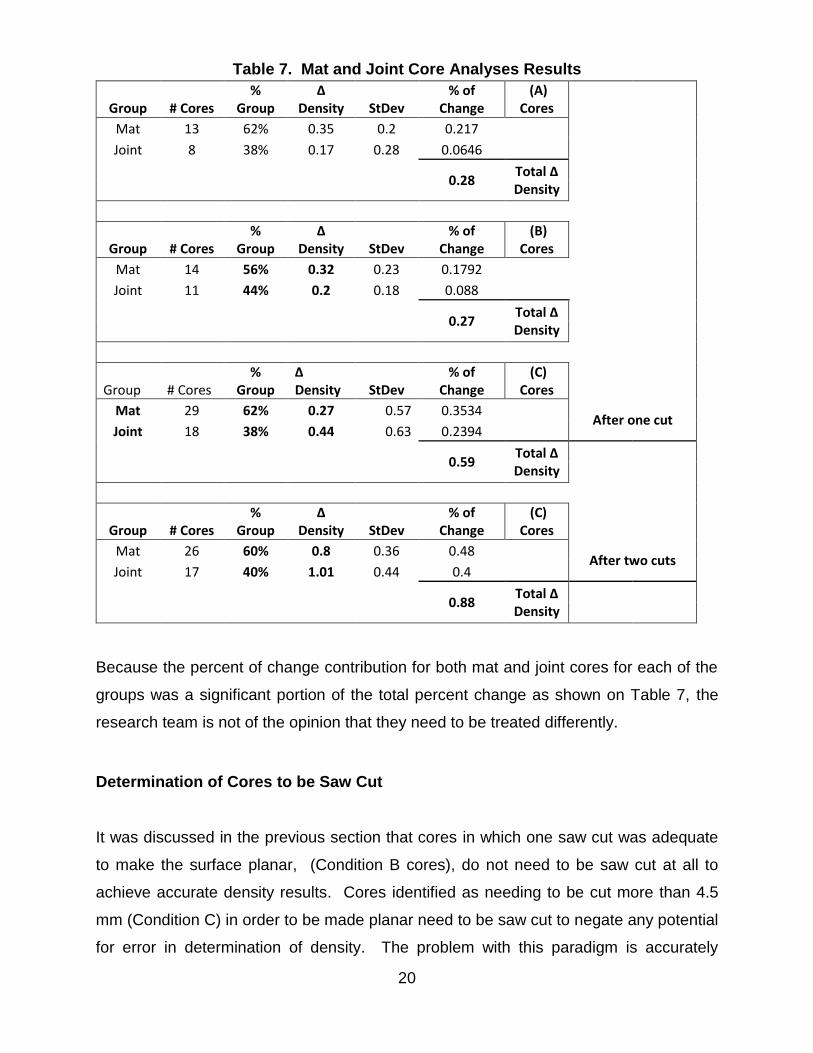
In an effort to examine whether or not mat cores should be treated differently than joint
cores, similar analyses were conducted separating each group (A, B and C) into those
respective categories. The results of those analyses are summarized in Table 7.
20
Table 7. Mat and Joint Core Analyses Results
Group # Cores %
Group Δ
Density StDev % of
Change (A)
Cores
Mat 13 62% 0.35 0.2 0.217
Joint 8 38% 0.17 0.28 0.0646
0.28 Total Δ Density
Group # Cores %
Group Δ
Density StDev % of
Change (B)
Cores
Mat 14 56% 0.32 0.23 0.1792
Joint 11 44% 0.2 0.18 0.088
0.27 Total Δ Density
Group # Cores %
Group Δ Density StDev
% of Change
(C) Cores
Mat 29 62% 0.27 0.57 0.3534 After one cut
Joint 18 38% 0.44 0.63 0.2394
0.59 Total Δ Density
Group # Cores %
Group Δ
Density StDev % of
Change (C)
Cores
Mat 26 60% 0.8 0.36 0.48 After two cuts
Joint 17 40% 1.01 0.44 0.4
0.88 Total Δ Density
Because the percent of change contribution for both mat and joint cores for each of the
groups was a significant portion of the total percent change as shown on Table 7, the
research team is not of the opinion that they need to be treated differently.
Determination of Cores to be Saw Cut
It was discussed in the previous section that cores in which one saw cut was adequate
to make the surface planar, (Condition B cores), do not need to be saw cut at all to
achieve accurate density results. Cores identified as needing to be cut more than 4.5
mm (Condition C) in order to be made planar need to be saw cut to negate any potential
for error in determination of density. The problem with this paradigm is accurately
21
determining which cores need to be saw cut and which ones do not, and making this
determination in an expedient manner (which are the Condition B vs. C cores). The
diamond saw blade that was used for this study was 4.5 mm in thickness. 4.5 mm of
surface irregularity then is the threshold for determining which cores need to be saw cut.
It should be readily evident to the practitioner that cleanly separated cores will not have
4.5 mm of surface irregularity and as such, do not need to be cut. Other cores may be
clearly broken to the point where it is obvious that more than one saw blade width would
be necessary to bring the core to a planar texture. For some cores, however, it is not
readily apparent what amount of surface irregularity exists. It may not be possible to
make that determination through visual examination alone.
The CAP Lab in cooperation with UCONN Technical Services Department developed a
simple surface texture depth gauge to determine whether a core will need to be cut
based on the 4.5 mm blade width, which was used for this research. The core surface
texture depth gauge is shown in Figure 5.
22
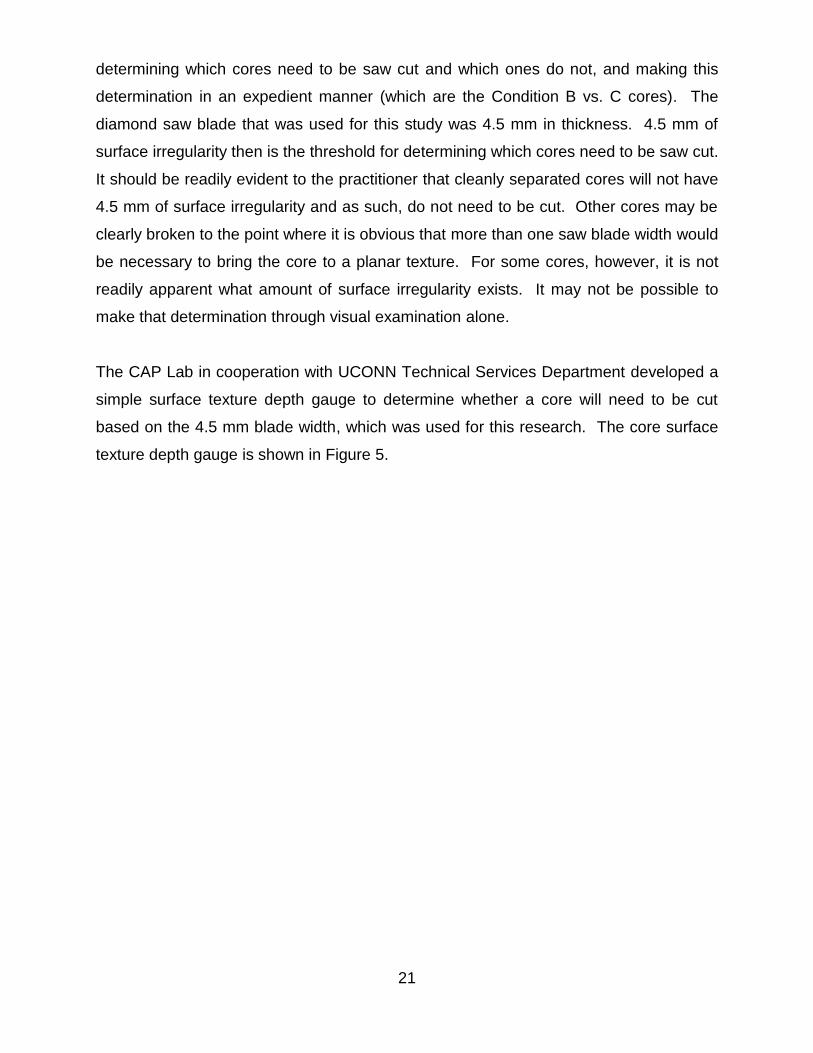
Figure 5. Core Surface Texture Depth Gauge
The gauge is constructed from a combination of stainless steel, glass and a nylon slide.
To operate the gauge a core must be located face down on the center of the base plate
as is seen in Figure 5. A 4.5 mm ball bearing is then placed in the deepest crevice of
the surface as shown in Figure 6.
23
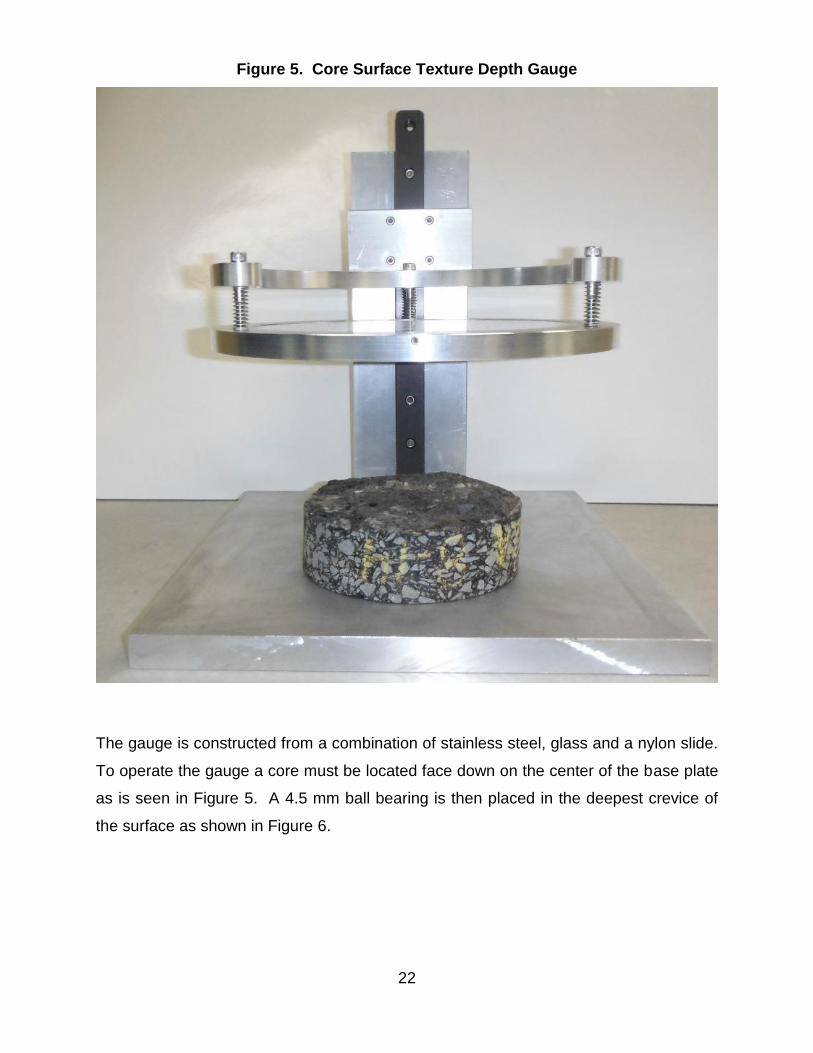
Figure 6. Ball Bearing Placed in Deepest Crevice of Core
The glass plate is then lowered down the slide until it comes into contact with either the
core or the ball bearing as shown in Figure 7 and Figure 8.
24
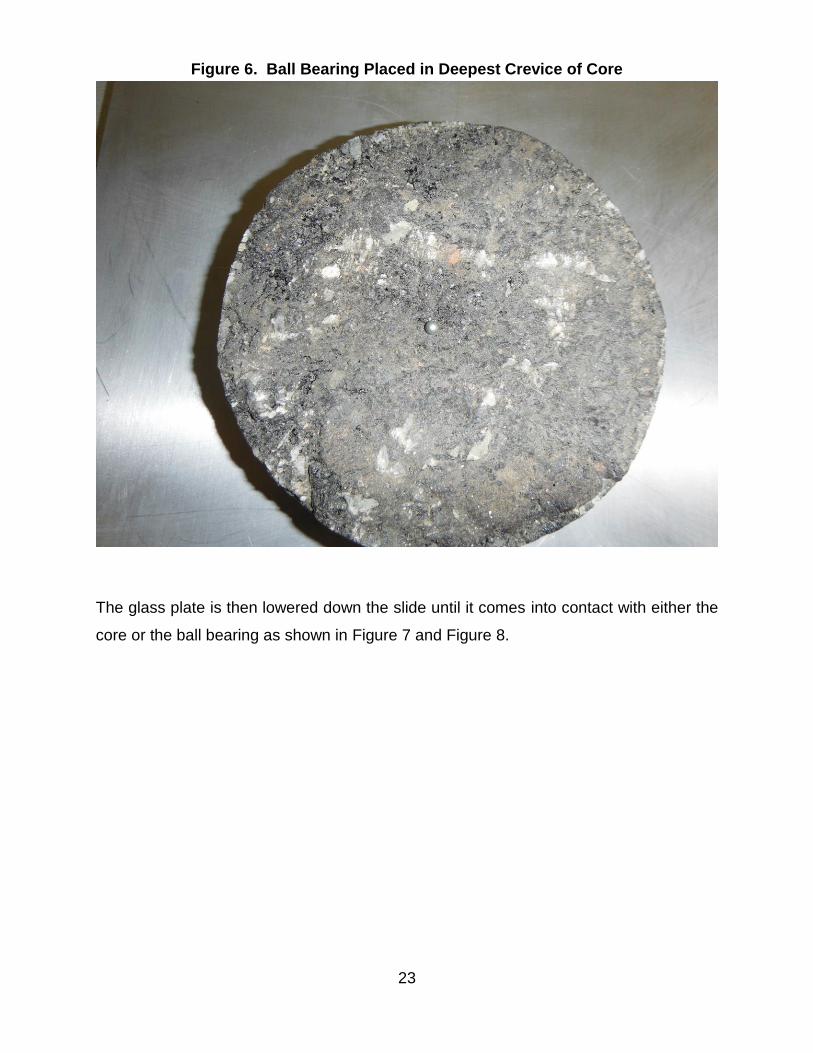
Figure 7. Texture Gauge Glass Plate Lowered onto Core via Slide
UCONN has available drawings and sketches of the gauge. There are springs that
expand underneath the frame to the glass plate that allow for a small amount of vertical
movement. It may be desired that the neck of the gauge be fitted with a pivoting head
to accommodate cores that are not parallel from top to bottom.
25
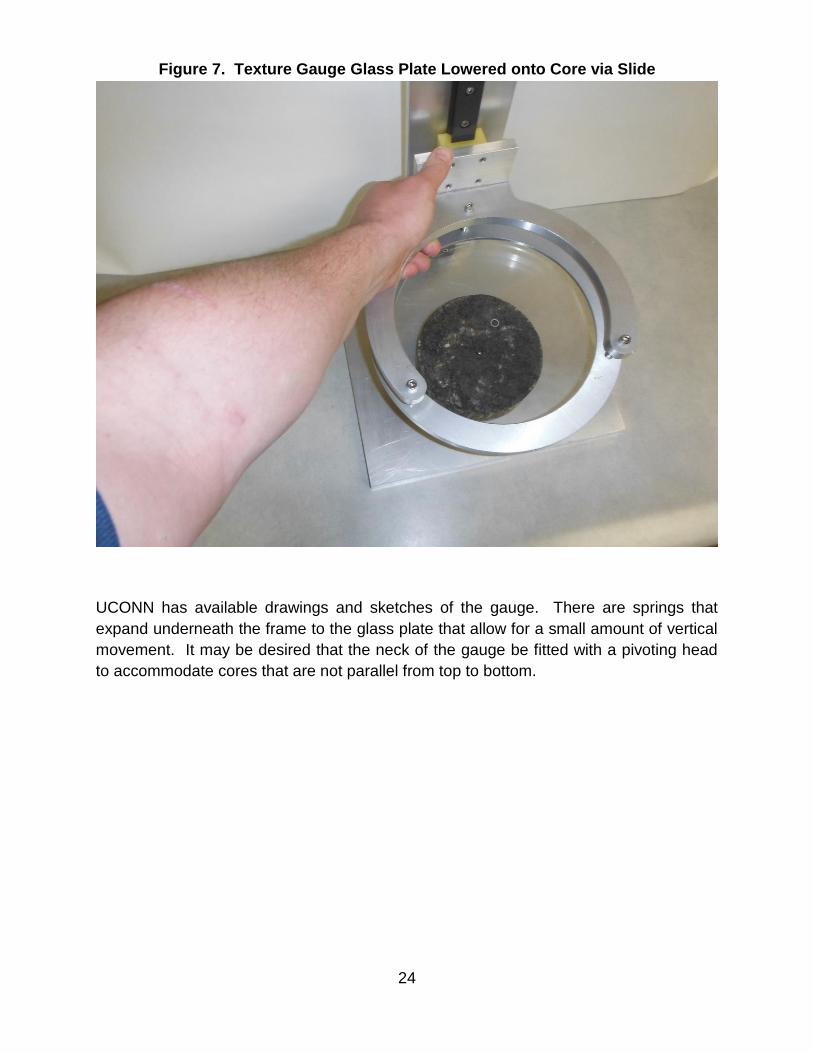
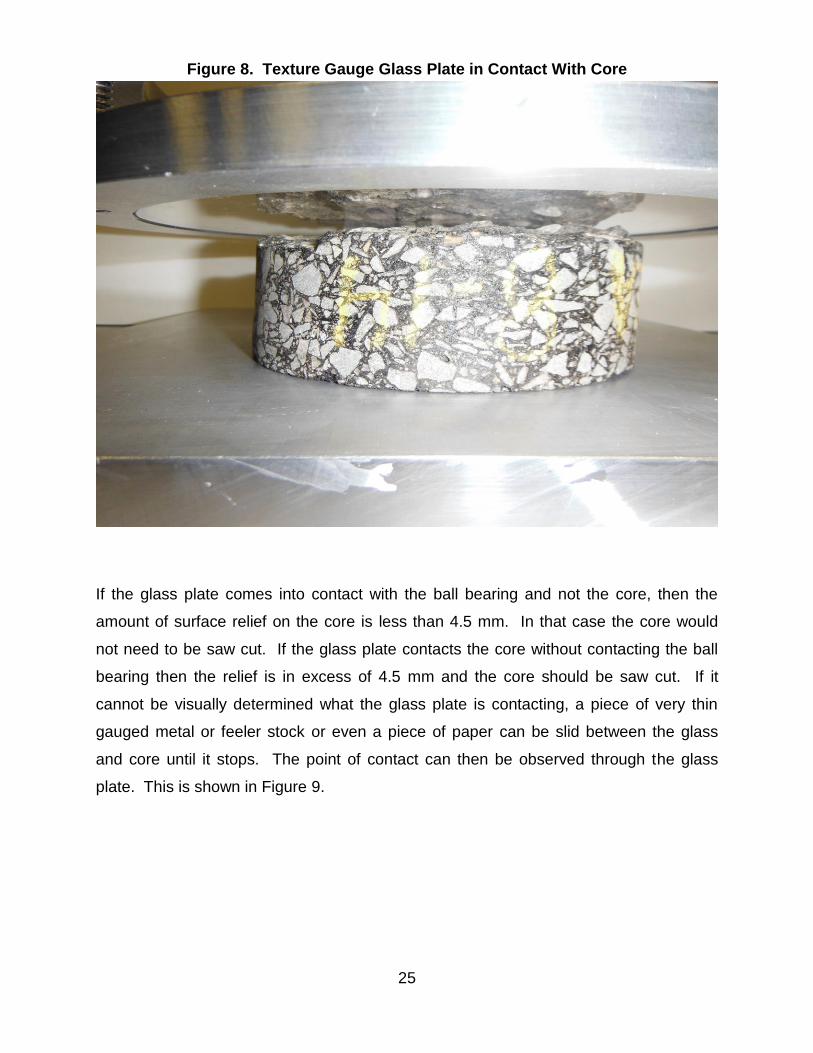
Figure 8. Texture Gauge Glass Plate in Contact With Core
If the glass plate comes into contact with the ball bearing and not the core, then the
amount of surface relief on the core is less than 4.5 mm. In that case the core would
not need to be saw cut. If the glass plate contacts the core without contacting the ball
bearing then the relief is in excess of 4.5 mm and the core should be saw cut. If it
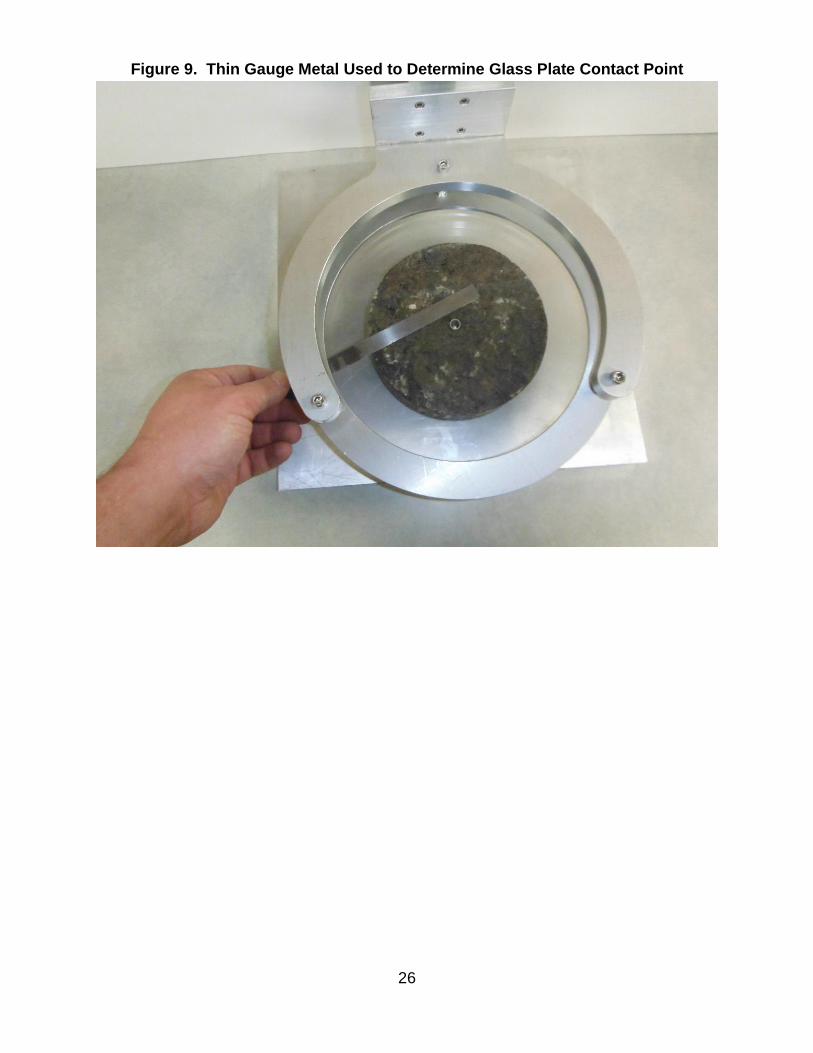
cannot be visually determined what the glass plate is contacting, a piece of very thin
gauged metal or feeler stock or even a piece of paper can be slid between the glass
and core until it stops. The point of contact can then be observed through the glass
plate. This is shown in Figure 9.
26
Figure 9. Thin Gauge Metal Used to Determine Glass Plate Contact Point
27
Conclusions
Surface irregularity of cores can cause errors in density determination when tested in
accordance with AASHTO T-331 [1]. The surface irregularity has the potential to
prevent the plastic bag from coming into complete contact with the core, which may
result in measurement errors. These errors have the potential to impact results as
cores are cut and density is measured. It was determined that cores with surface
irregularity in excess of one diamond saw blade width of 4.5 mm (Condition C) can have
statistically significant errors in density accuracy per the analysis shown in Table 6.
These errors in density measurement accuracy may be in combination with a higher
void level on the bottom of the core. Surfaces that would only need to be cut one saw
blade width or less to become completely planar (Condition B) were shown to exhibit a
statistically insignificant change in density after a saw cut. It is difficult to quantify the
surface irregularity of a core. Practitioners will quickly recognize cores that separated
cleanly during the extraction process as not needing to be saw cut (Condition A) prior to
determining density. They will also quickly recognize when cores contain underlying
material or separated uncleanly to the point where it would take multiple sawblade width
cuts to make the core surface completely planar (Condition C). Not all cores falling
within the limits of this spectrum will be determinable visually. The CAP Lab in
conjunction with the UCONN Technical Services Department developed a core surface
texture depth gauge, which may serve as an accurate and reproducible method of
making this determination where visual analysis will not suffice. The design of the core
surface texture depth gauge is well documented and information needed for
reproduction of the gauge is available through the CAP Lab.
28
Recommendations
Based upon the information gathered over the course of this study the research team
makes the following recommendations:
Proper and careful core cutting through the desired layer and extraction should
be emphasized to contractors
There is no reason to consider handling joint cores differently from mat cores
because the density changes after various saw cuts produced statistically
similar results
Cores that contain underlying material attached to the bottom from underlying
pavement layers should be saw cut at the interface to remove underlying
material
If less than 4.5 mm needs to be removed (Condition A and B as defined by this
report) to make the core completely planar then the core does not need to be
saw cut
Cores that did not separate cleanly and clearly would need to have more than
4.5 mm removed (Condition C) to become planar should be saw cut
Cores that cannot be easily determined to be in need of saw cutting should be
analyzed with the core surface texture depth gauge developed at UCONN
4.5 mm ball bearings should be used to make the determination with the core
surface texture depth gauge because that is the width of the saw blade used to
make the cuts associated with this research
CTDOT may wish to consider a process change that would require all
acceptance cores that did not separate cleanly to be saw cut. This would
alleviate the steps needed to determine whether a cut is necessary (i.e., steps
defined above)
29
References
1. Standard Method of Test for Bulk Specific Gravity (Gmb) and Density of
Compacted Hot Mix Asphalt (HMA) Using Automatic Vacuum Sealing Method.
American Association of State Highway and Transportation Officials (AASHTO)
Designation T 331-13. AASHTO Standard Specifications. Part 2B. 2014
2. Standard Method of test for Bulk Specific Gravity (Gmb) of Compacted Hot Mix
Asphalt (HMA) Using Saturated Surface Dry Specimens. American Association
of State Highway and Transportation Officials (AASHTO) Designation T 166-13.
AASHTO Standard Specifications. Part 2A. 2014
3. Compilation of Approved Specifications. Supplement No. 15. Standard
Specification for Road and Bridge Construction. Section 401.03.6. Rhode Island
Department of Transportation. 4/28/2015.
4. Composition and Compaction Acceptance Tests. Supplemental Specifications to
the Standard Specifications for Highways and Bridges. Subsection M3.11.09.
6/15/2012.
5. Standard Method of Test for Theoretical Maximum Specific Gravity (Gmm) and
Density of Hot Mix Asphalt (HMA). American Association of State Highway and
Transportation Officials (AASHTO) Designation T 209-12. AASHTO Standard
Specifications. Part 2A. 2014
6. Standard Method of Test for Bulk Specific Gravity (Gmb) of Compacted Hot Mix
Asphalt (HMA) Using Paraffin-Coated Specimens. American Association of
State Highway and Transportation Officials (AASHTO) Designation T 275-07.
AASHTO Standard Specifications. Part 2B. 2014
7. Standard Method of Test for Percent Air Voids in Compacted Dense and Open
Asphalt Mixtures. American Association of State Highway and Transportation
Officials (AASHTO) Designation T 269-14. AASHTO Standard Specifications.
Part 2B. 2014
8. Section 401. Division 400 – Pavements. 2010 Standard Specifications for Road
and Bridge Construction. New Hampshire Department of Transportation. 2010.
9. Section 406.14-406.15. Surface Courses and Pavements. Division 400.
Standard Specifications for the Construction Book. Vermont Agency of
Transportation. 2011.
10. Hot Mix Asphalt Pavements. Section 401. Division 400 – Pavements. Standard
Specifications. Maine Department of Transportation. 2014.
30
11. Pavement Density Samples. Section 402-3.08. Construction and Materials.
Standard Specifications. New York State Department of Transportation. 2015.
12. Hot Mix Asphalt (HMA) Courses. Section 401. Division – 400 Pavements.
Standard Specifications for Road and Bridge Construction. New Jersey
Department of Transportation. 2007.
13. Standard Test Method for Thickness or Height of Compacted Bituminous Paving
Mixture Specimens. American Society of Testing and Materials. ASTM
Designation 3549. Construction, Section 4. Annual Book of ASTM Standards.
2014.