Embed Size (px)
DESCRIPTION
Read it for the final exam.
Citation preview
Review Guide - Final Exam – Summer 2012
Dr. David Tandberg
Finalized at 23:57, 6/16
The following are examples of the types of questions that may appear on the final exam. Learning the answers to these questions will certainly help students perform well on the exam. However, students should not assume that if they have mastered the material below that they are fully prepared for the exam. A serious study of the Powerpoint presentations, lecture notes, textbook chapters, and especially the terms and vocabulary used throughout will be necessary in order for students to perform their best on the exam.Section Division: Weinan, Shuang, Xinhao 1. In Educational Research, define and understand:
a. Empiricism and rationalism Empiricism: The idea that knowledge comes from experience (p. 13)Rationalism: The philosophical idea that reason is the primary source of knowledge (p. 13)
b. Inductive and deductive methods of inquiry Inductive reasoning: The process of drawing a conclusion that is “probably” true. (p. 14) Deductive reasoning: The process of drawing a conclusion that is necessarily true if the premises are true (p. 13)
c. Principle of Evidence The philosophical idea that empirical research provides evidence, not proof. (p. 21)
d. Paradigms (Research Paradigm): A perspective held by a community of researchers that is based on a set of shared assumptions, concepts, values, and practices (p. 31)
e. Major elements of Quantitative, Qualitative & Mixed Method Research
(Table 2.1) (p. 34)2. Quantitative Research Terms – Define and provide examples of the following terms
a. Quantitative variable Variable that varies in degree or amount (p. 39)
e.g. ageb. Categorical variable
1
Variable that varies by type or kind (p. 39) e.g. genderc. Extraneous variable
A variable that may compete with the independent variable in explaining the outcome (p. 41)for example, the students in the new teaching approach perfomed better may because they had better vocabularies, were older, or were better readers rather than the teaching approach.
d. Confounding variableAn extraneous variable that was not controlled for and is the reason a particular “confounded” result is observed (p. 42)for examples, in the above example, vocabularies, age, or reading levels can be confounding variable if it is not controlled for.
e. What is difference between confounding & extraneous variable(Summarized by Weinan): confounding variable is a certain type of extraneous variable which was not controlled for and is the reason a particular “confounded” result is observed.
f. Independent variableA variable that is presumed to cause a change in another variable (p. 40)e.g. teaching method in the above example.
g. Dependent variableA variable that is presumed to be influenced by one or more independent variables. (p. 40)e.g. students’ performance in the above example.
3. What are the 3 necessary conditions for causation and provide example?
Condition 1: Variable A and variable B must be related (the relationship condition)e. g. when studying whether gender is the cause of difference in math performance difference between males and females, first of all a relationship between and gender and math performance should be observed.Condition 2: Proper time order must be established (the temporal antecedence condition)
2
e. g. In the above example, we can also assume that gender occurs before math performance as measured in the research study if we assume that gender is a measure of one’s biological sex. Thus condition 2 is met.Condition 3: The relationship between variable A and variable B must not be due to some confounding extraneous or “third” variable (the lack of alternative explanation condition)e.g. in the above example, there are many alternative explanations for an observed relationship between gender and math performance. Perhaps males and females are socialized differently regarding mathematics. Or perhaps females are just as good as math as males except that they tend to have higher math anxiety than males, which lower their math performance. Socialization and math anxiety represent uncontrolled third variables that are confounded (entangled) with the independent variable gender.(p. 350)4. What is the importance of the literature review for quantitative and qualitative research studies?
Quantitative:
The general purpose of the literature review is to gain an understanding of the current state of knowledge about your selected research topic. Specifically, a review of the literature- will tell you whether the problem you have identified has already been researched. If it has, you should either revise the problem in light of the results of other studies or look for another problem, unless you think there is a need to replicate the study.- will assist you in forming your research questions.- might give you ideas as to how to proceed with and design the study so that you can obtain an answer to your research question(s).- can point out methodological problems specific to the research question(s) you are studying. (Are special groups or special pieces of equipment needed to conduct the research? If so, the literature can give clues as to where to find the equipment or how to identify the particular groups of participants needed.)- can identify appropriate data-collection instruments. (p. 64)Qualitative:
- The literature review can be used to stimulate theoretical sensitivity toward concepts and relationships that prior literature has repeatedly identified and that therefore appear to be meaningful and significant. (Because of their apparent significance, you might want to bring these concepts into the situation you are studying to identify the role they might play. For example,
3
if the concept of isolation is repeatedly identified in the literature as being significantly related to creative achievement and you are studying creative achievement in underprivileged children, you might want to look for evidence of how isolation relates to creative achievement in your study)- The literature can stimulate questions. (The literature can assist you in deriving an initial list of pertinent questions to ask or behaviors to observe.)- Finally, the literature can provide some information about the situations and populations that you need to study so that you can uncover phenomena that are important to the development of your theory. (For example, in a study of creativity, the literature might indicate that you should look at individuals who are experiencing various emotional states because this might represent an important variable in the development of your theory of creativity.)In sum, the current position among qualitative researchers seems to be that a literature review can be of value but the researcher must make sure that it does not constrain and stifle the discovery of new constructs, relationships, and theories. (p. 65-66)5. What is the research “funnel” for the development of a research idea?
Research Topic -> Research Problem -> Research Purpose -> Research Questions (ch. 3)6. What are the difference(s) between the focus/purpose of a research problem between quantitative and qualitative research?
In a qualitative study, the purpose statement should express the language, purpose, and methodology of the qualitative paradigm. In a quantitative study, the purpose statement should identify the intent of the study and the type of relationship (causal, descriptive, predictive) to be studied. (p. 82)7. What is sampling and why would we want to use sampling?
Definition:
The process of drawing a sample from a population (p. 216). Why would be want to use sampling?
Researchers can make statements about the population based on their study of the sample. That way researchers can save time and money since a sample is usually much smaller in size than a population. (p. 216)8. Define and provide examples:
a. simple random sampling
4
A sample drawn by a procedure in which every member of the population has an equal chance of being selected. (p. 219)For example randomly select a sample from the population by using a random number generator.b. systematic samplingA sample obtained by determining the sampling interval, selecting a
random starting point between 1 and k, and then selecting every kth element. (p. 223)
For example there are 50 teachers in your middle school and we have a list of these 50 middle school teachers numbered from 1 through 50. You have decided that you want to select five teachers to be on a PTA committee. We can select a systematic sample from our list of 50 teachers by following the three steps given in the definition of systematic sampling. First, determine the sampling interval (symbolized by the letter k). To obtain k, you need the population size and the desired sample size. Then just divide the population size by the desired sample size. In this case,... (p. 223)
c. stratified random sampling – proportional, disproportional
stratified random sampling:
Dividing the population into mutually exclusive groups and then selecting a random samples from each group. (p. 225)
e.g. divide a population into males and females and take a random sample of males and a random sample of females.
Proportional Stratified Sampling:
Type of stratified sampling in which the sample proportions are made to be the same as the population proportions on the stratification variable. (p. 226)
e. g. in the above example, the proportion of males and females in the sample are made to be the same as the proportions of males and females in the population.
Disproportional Stratified Sampling:
A type of stratified sampling in which the sample proportions are made to be different from the population proportions on the stratified variable. (p. 227)
e. g. opposite to previous example.d. cluster random sampling – one-stage, two-stage
Cluster random sampling:
5
Type of sampling in which clusters are randomly selected (p. 228)e.g. a school is a cluster. randomly select schoolsOne-Stage Cluster Sampling:
A set of randomly selected clusters in which all the elements in the selected clusters are included in the sample. (p. 228)
e.g. take a random sample of 10 schools from all the school in a cityTwo-Stage Cluster Sampling:
A set of clusters is randomly selected. and then a random sample of elements is drawn from each of the clusters selected in stage one. (p. 229)
e.g. at stage one, 25 classrooms (clusters) could be randomly sampled from the list of clusters. At stage two, 10 students could be randomly selected from each of the 25 classrooms. That outcome would be a two-stage cluster random sample of 250 students.
e. types of non-random sampling
Convenience Sampling:
People who are available, volunteer, or can be easily recruited are included in the sample. (p. 230)
e.g. study conducted with undergrads enrolled in introductory psychology or educational psychology classes
Quota Sampling:
The researcher determines the appropriate sample sizes or quotas for the groups identified as important and takes convenience samples from those groups. (p. 230)
Purposive Sampling:
The researcher specifies the characteristics of the population of interest and locates individuals with those characteristics. (p. 231)
e.g. a researcher might be interested in adult females over the age of 65 who are enrolled in a continuing education program.
Snowball Sampling:
Each research participants is asked to identify other potential research participants. (p. 231)
e.g. study conducted with females who had once been school superintendents.
6
9. What is random selection?
Randomly selecting a group of people from a population. (p. 232)10. What is random assignment and how does this differ from random selection
Definition: Randomly assigning a set of people to different groups. (p. 232)Differences (summarized by Weinan, refer to p. 232):1) purposerandom selection: to allow you to make generalization from a sample to a population. random assignment: to produce comparison groups that are similar on “all possible factors” at the beginning of the experiment. 2) usagerandom assignment: is only used in experimental researchrandom selection: may be used in any kind of research11. How do you determine sample size when random sampling is used? (ch9,29)
1) As a rule of thumb, we recommend using the whole population when the population numbers 100 or less2) You may want to examine the research literature that is most similar to the research you hope to conduct and see how many research participants were sued in those studies3) Refer to the table of recommended sample size (Figure 9.4)4) Additional points
a) Usually a researcher must randomly select a large percentage of the population when the population is small. However, as the population becomes larger and larger, the percentage of the population needed becomes smaller and smaller
b) The more homogeneous a population, the smaller the sample size can be.
c) The more categories or breakdowns you want to exmaine in your data analysis, the larger the sample size needed.(p. 233)12. What are the major characteristics of experimental research?
7
An experiment is defined as the development of an environment in which the researcher, typically called the experimenter, objectively observes “phenomena which are made to occur in strictly controlled situations in which one or more variables are varied and the others are kept constant”. It has the following characteristics:1) We must attempt to make impartial and unbiased observations2) Phenomena which are made to occur: We present a set of stimulus conditions - the independent variable - and then observe the effect of this independent variable presentation on the dependent variable.3) The observations are made in “controlled situations”, which means that we must eliminate the influence of confounding extraneous variables. Controlling for variables confounded with the independent variable is necessary to achieve internal validity. 4) “one or more variables are varied and the others are kept constant”, which means we deliberately vary (i.e., “manipulate”) the independent variable(s) along a defined range and attempt to make sure that all other variables do not vary.(p. 284)13. What are the three ways to manipulate of independent variable?
Presence or absence technique:
Manipulating the independent variable by presenting one group the treatment condition and withholding it from the other group. (p. 286)Amount technique:
Manipulating the independent variable by giving the various comparison groups different amounts of the independent variable. (p. 287)Type technique:
Manipulating the independent variable by varying the type of condition presented to the different comparison groups. (p. 287)14. How can a researcher control confounding variables?
Control for confounding extraneous variables and the differential influence that they do not vary across the comparison groups. That is, your goal is to equate your groups on all extraneous variables. Then, any difference observed on the dependent variable will be attributable to the independent variable. Control generally refers to achieving constancy. Some of the general techniques for achieving constancy of effect of potentially confounding variables including: (p. 288, summarized)Random assignment
8
A procedure that makes assignments to conditions on the basis of chance and in this way maximizes the probability that the comparison groups will be equated on all extraneous variables. (p. 288)Matching
Equating the comparison groups on one or more variables that are correlated with the dependent variable. (p. 290)Holding the Extraneous Variable Constant
Holding the extraneous variable constant across the comparison groups. (p. 292)Building the Extraneous Variable Into the Research Design
Extraneous variable can be controlled by being built into the research design. When this is done, the extraneous variable becomes another independent variable. (p. 292)Analysis of Covariance
A control method that can be used to statistically equate groups that differ on a pretest or some other variable; also called ANCOVA. (p. 293)Counterbalancing
Administering all experimental conditions to all participants or set of participants, but in different orders. (p. 293)15. What are three weak experimental research designs and why are they considered weak designs?
One-Group Posttest-Only Design
Administering a posttest to a single group of participants after they have been given an experimental treatment condition (p. 297)One-Group Pretest-Posttest Design
Administering a posttest to a single group of participants after they have been pretested and given an experimental treatment condition. (p. 298)Posttest-Only Design with Nonequivalent Groups
Comparing posttest performance of a group of participants who have been given an experimental treatment condition with that of a group that has not been given the experimental treatment condition. (p. 299)Why are they considered weak designs?
The above three designs are considered weak because they do not provide a way of isolating the effect of the independent variable from the influence of potentially confounding variable. A strong experimental research design is
9
one in which the influence of confounding extraneous variables has been controlled. (p. 300-301)16. What are 4 strong experimental research designs and why are they considered strong designs?
Pretest-Posttest Control-Group Design
A research design that administers a posttest to two randomly assigned groups of participants after both have been pretested and on of the groups has been administered the experimental treatment condition. (p. 303)Posttest-Only Control-Group Design
Administering a posttest to two randomly assigned groups of participants after one group has been administered the experimental treatment condition. (p. 304)Factorial Designs
A design in which two or more independent variables, at least one of which is manipulated, are simultaneously studied to determine their independent and interactive effects on the dependent variable. (p. 306)Repeated-Measures Designs
A design in which all participants participate in all experimental conditions. (p. 310)Why are they considered strong designs?
They are considered strong designs because in them the influence of confounding extraneous variables has been controlled.17. What is internal validity?
Internal validity indicates the accuracy of inference that two variables are causally related. There are two types of causal relationships:
● Causal description: IV-> DV● Causal explanation - check for mediator and moderator variables
18. Describe the 9 threats to internal validity in experimental research designs and examples of each?
1. Ambiguous temporal precedence: it’s the inability to specify which variable is the cause and which is the effect.This often exists in non-experimental researches. For example: if we measure the degree of relationship that existed between the frequency of criminal behavior and frequency of incarceration, we would probably find that these two variables were correlated. However, we cannot suggest the causal direction would be from criminal behavior to incarceration, because many individuals
10
learn techniques for engaging in criminal behavior from association with other individuals while incarcerated. In this case, it’s difficult to identify which variable is the cause and which is the effect because it is difficult to identify which variable came first.2. History: it often happens in one-group pretest-posttest researches and it refers to the specific extraneous history events, other than any planned treatment event, that occur between the first and second measurement of the dependent variable.For example: in examining an peer-based spelling tutor program,the teacher’s monitoring of the program could have an effect on students’ learning performance. If the monitoring does have an effect, it represents a history variable and functions as a rival explanation for the cause of the students’ enhanced performance. Such history events represent threats to the internal validity of this study because it represent plausible rival explanations for the outcome of the study. 3. Maturation: Participants naturally change over time; these physical or mental maturational changes, not treatment, may explain any changes in participants during the experiment. Examples includes: age, learning (improved learning skills), boredom, hunger, or fatigue. 4. Testing: any change in scores obtained on the second administration of a test as a result of having previously taken the test. For example, students participated in a pre-spelling test can get more familiar with the test and perform better in the post test. Note, including control groups that also experienced any testing effect would have controlled for this potential threat to internal validity. 5. Instrumentation: it refers to any change that occurs in the measuring instrument of the dependent variable. There are two primary ways in which an instrumentation threat may occur:
a. when the measurement instrument that is used during pretesting is different from that used during posttesting. This type of instrumentation effects represent threats to the internal validity of any study.
b. when the data is collected through observation(e.g., gained observation skills). This type of biases can be minimized by having various observers to check on one another to ensure the accuracy of the data. Typically, the data collected by the various observers must coincide before they are considered reliable. 6. Regression artifact: refers to the tendency of very high scores to become lower and very low scores to become higher on posttesting of other or the original measure.
11
For example: Participants sometimes perform very well or very poorly on a measure because of chance factors (e.g., luck, not sleeping well). These chance factors are not likely to be present in a second testing, so their scores will not be so extreme — the scores “regress to the mean.” These regression effects, not the effect of treatment, may account for changes in participants’ performance over time.7. Differential Selection (Selection for short): selecting participants for the various treatment groups that have different characteristics (e.g., age, anxiety level, attitudes towards research, gender, home environment, etc.).For example: select control and treatment groups by classes. Students in different classes may have different motivation levels.8. Additive and interactive effects: refers to the fact that the threats to internal validity can combine to produce an additive or multiplicative bias. The bias resulting from combination of two or more basic threats can include:
○ Selection-history effect.○ Selection-maturation effect.○ Selection-attrition.○ Selection-testing.○ Selection-instrumentation.○ Selection-regression artifact.
For example: two groups with selection bias would react to a history event (such as a joke during the treatment) differently. The different reaction may cause different effect in the responses which are not caused by the treatment.
9. Differential Attrition: refers to the bias that occurs when people who do not complete the outcome measures are different in the various comparison groups. Note that the loss of research participants from the research study does not, in and of itself, produce a bias. The bias results because the loss, when using a multigroup design, may produce differences between the comparison groups that cannot be attributed to the experimental treatment condition.For example: a research wants to test a new learning system to teach math skills, so that two groups of students were in the control and treatment groups. Another known fact for this research is that the older students performs better in math after one week’s observation. Thus, the two groups are carefully controlled to have nearly equal number of older students and young students. However, when conducting the post test, you find out that half of the young kids in the treatment group were not shown up, and the results showed that the new learning system is superior than the old. In this case, we still cannot conclude that the new learning system is much better than the
12
old one because of the existence of the bias from the differential attrition.Note: The threats to the internal validity of a research study are greatest in a one-group pretest-posttest design. A multi-group design (the most basic: two-group design) would be a design have a control group.
19. What are the three necessary conditions for causality?
Same as Question 3: evidence needed: 1. That IV and DV are related.2. That changes in IV precede changes in DV.3. That relationship between IV and DV not due to confounding extraneous variable (“ third variable”).
20. What is external validity?
External validity is the extent to which the study results can be generalized to and across populations of persons, settings, times, outcomes, and treatment variations. Types of external validity include:
○ Population validity: generalizing from sample to target population and across its subpopulations
○ Ecological validity: generalizing across settings○ Temporal validity: generalizing across time○ Treatment variation validity: generalizing across variation in
treatments○ Outcome validity: generalizing across different but related DVs
Note: Besides internal and external validity, there is another validity called construct validity. Construct validity refers to the extent to which higher order construct is accurately represented in study. In other words, it is the extent to which what was to be measured was actually measured.
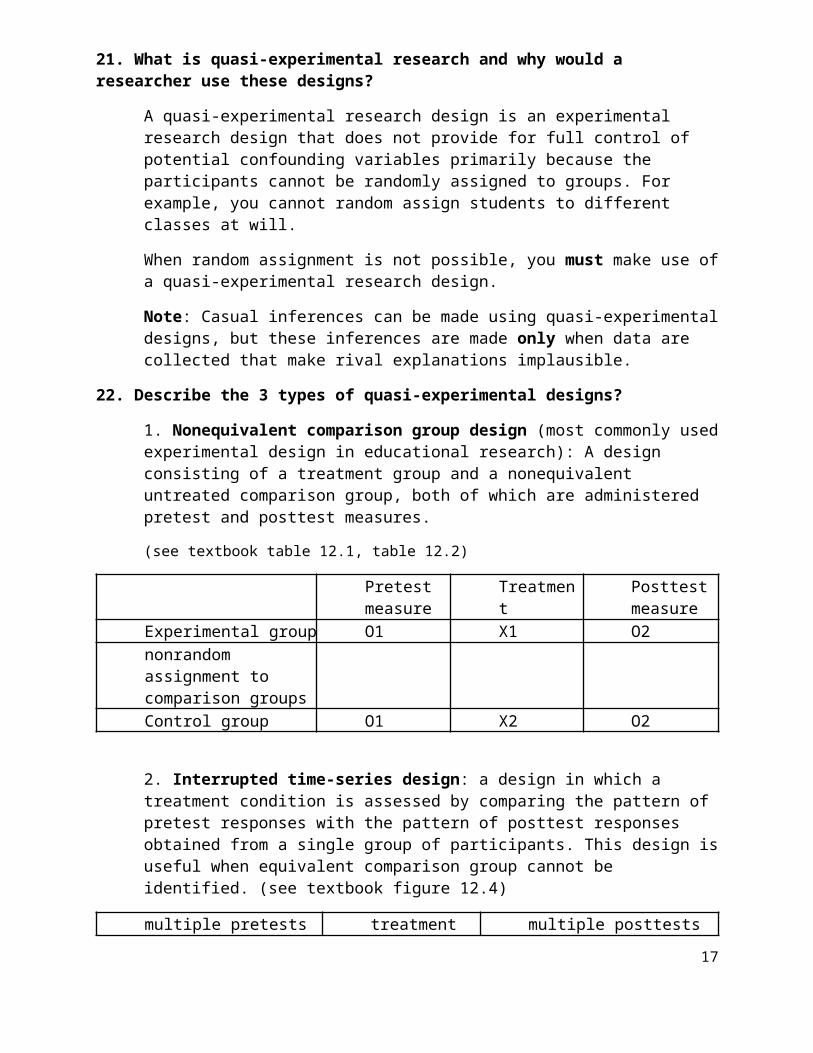
21. What is quasi-experimental research and why would a researcher use these designs?
A quasi-experimental research design is an experimental research design that does not provide for full control of potential confounding variables primarily because the participants cannot be randomly assigned to groups. For example, you cannot random assign students to different classes at will.When random assignment is not possible, you must make use of a quasi-experimental research design.Note: Casual inferences can be made using quasi-experimental designs, but these inferences are made only when data are collected that make rival explanations implausible.
13
22. Describe the 3 types of quasi-experimental designs?
1. Nonequivalent comparison group design (most commonly used experimental design in educational research): A design consisting of a treatment group and a nonequivalent untreated comparison group, both of which are administered pretest and posttest measures. (see textbook table 12.1, table 12.2)
Pretest measure
Treatment Posttest measure
Experimental group O1 X1 O2nonrandom assignment to comparison groupsControl group O1 X2 O2 2. Interrupted time-series design: a design in which a treatment condition is assessed by comparing the pattern of pretest responses with the pattern of posttest responses obtained from a single group of participants. This design is useful when equivalent comparison group cannot be identified. (see textbook figure 12.4)multiple pretests treatment multiple posttestsO1 O2 O3 O4 O5 X1 O6 O7 O8 O9 O10
3. Regression-discontinuity design: a design that assesses the effect of a special treatment condition by looking for a discontinuity in regression lines between individuals who score lower and higher than some predetermined cutoff score. The regression discontinuity design is an exlent design that can be used when researchers want to investigate the efficacy of some program or treatment but cannot randomly assign participants to comparison groups.(see textbook figure 12.7)
23. How does quasi-experimental research differ from experimental research?
A experimental design requires a situation where the researchers “objectively” observes phenomena made to occur in a strictly controlled environment, where one or more variable are varied and others are kept constant in order to determine cause and effect. A quasi-experimental research design is an experimental research design that does not provide for full control of potential confounding variables and the participants are not randomly assigned to groups.
14
24. What are the potential biases that may exist in nonequivalent comparison group designs?
○ Selection bias: group difference(however, the pretest allows exploration of the possible size and direction of the bias on any variables measured at pretesting)
○ Selection-maturation: one group of participants becomes more experenced, tired, or bored than the other group
○ Selection-Instrumentation: the nature of dependent variable or the way it is measured varies across the nonequivalent groups
○ Selection-regression: e.g., the experimental group is with high reading scores, the control group is with low reading scores
○ Selection-history: it may exist if an event occurring between the pretest and posttest affects one group more than the other group
Note: —○ Just because a threat or bias is possible doesn’t mean it is
plausible.○ Researchers should attempt to list confounding variables and
measure them at pretest so that can statistically control for them.
○ —Matching also sometimes used in combination with design.○ To determine which threats are plausible you need to look at the
pattern of results.
25. What is the difference between experimental and non-experimental research?
Non-experimental research is systematic empirical inquiry in which the scientist does not have direct control of independent variables because their manifestations have already occurred or because they are inherently not manipulable. Inferences about relations among variables are made, without direct intervention, from concomitant variation of independent and dependent variables. There is no random assignment to groups either.
26. What is causal-comparative research design?
It’s a form of non-experimental research in which the primary independent variable of interest is a categorical variable.
27. What is correlational research design?
It’s a form of non-experimental research in which the primary independent variable of interest is a quantitative variable.
15
28. What are three techniques for controlling for threats in non-experimental research?
1. Matching: ¡dentify “matching variable" (gender, income, intelligence) and equate groups on it.Problem: can’t think of all extraneous variables needing to be used in matching.
2. Holding the extraneous variable constant: —identify extraneous variable and conduct study with people from single level.—Example: hold gender constant by researching only women if gender might be a confounding variable.—Problem: adversely affects generalizability.
3. Statistical control: —Computer program examines relationship between IV and DV at each level of variable control for.—Partial correlation - correlation between two quantitative variables after controlling for extraneous variable.—Analysis of covariance - relationship between categorical IV and quantitative DV after controlling extraneous variable.
29. What are some methods for graphically display descriptive statistics?
○ Bar graphs○ histograms○ line graphs○ scatterplots
30. What are measures of central tendency?
A measure of central tendency is the single numerical value taht is considered the most typical of the values of a quantitative variable. The three most commonly used measures of central tendency: the mode, the median, and the mean
31. Define and give examples of mode, median and mean.
○ Mode: the most frequently occurring number○ Media: the middle point in a set of numbers that has been
arranged in order of magnitude (ascending or descending)○ Mean: the arithmetic average
Note: the media is always in between the mode and the mean32. Understand negatively skewed, positively skewed, & normal distributions.
○ Negatively skewed: skewed to the left○ Positively skewed: skewed to the right
16
○ The normal distribution, or normal curve, is a uni-modal, symmetric, bell-shaped distribution that is the theoretical model used to describe many physical, psychological, and educational variables.
33. Define range, variance, standard deviation.
1. Range: the difference between the highest and lowest numbers.2. Variance: a measure of the average deviation from the mean in squared units3. Standard deviation: an approximate indicator of how far the numbers tend to vary from the mean. The SD will be larger when the data are spread out (heterogeneous) and smaller when the data are not very spread out (homogeneous).
34. What are characteristics of a normal, bell curve?
If the data fully follow a normal distribution: 1. 68.26% of the cases fall within 1 standard deviation. 2. 95% of the cases fall within 1.96 standard deviation. 3. 95.44% of the cases fall within 2 standard deviation. 4. 99.77% of the cases fall within 3 standard deviation.
“68, 95, 99.7 percent rule” for approximating the area within 1, 2, and 3 standard deviations.
35. What is inferential statistics?Statistics that go beyond the immediate data and infer the characteristics of populations based on samples. (p.452)Use of the laws of probability to make inferences and draw statistical conclusions about populations based on sample data.(p.481)
36. Define and provide example of parameter, statistic and understand symbols for mean, variance, standard deviation.Parameter: a numerical characteristic of a population; mean
variance standard deviation
Statistic: a numerical characteristic of a sample; mean variance SD2 standard deviation SD
17
37. What are two types of estimation and provide example.Point Estimation eg. a exact numberInterval Estimation eg. a range of distribution
38. What is hypothesis testing and what are the 4 steps in hypothesis testing?The branch of inferential statistics that is concerned with how well the sample data support a null hypothesis and when the null hypothesis can be rejected. (p.489)The 4 steps are (p.497):1. State the null and alternative hypotheses;2. Set the significance level before the research study. ( ) ;3. Obtain the probability value using a computer program such as SPSS; 4. Compare the probability value to the significance level and make the statistical decision.
39. Define and provide examples –a. null hypothesis : a statement about a population parameter (eg.
there is NO relationship between GPA and Starting Salary)b. alternative hypothesis: the statement that the population parameter
is some value other than the value stated by the null hypothesis (eg. there IS relationship between GPA and Starting Salary)
40. Understand the process for rejecting the null hypothesis.To obtain the and compared with the . If , then we reject the null. (p is probability value while is the significance level)
41. What are the 2 decision-making rules in hypothesis testing?R1: If the probability value is less than or equal to the significance level, then the researcher rejects the null hypothesis and tentatively accepts the alternative hypothesis. The researcher also concludes that the observed relationship is statistically significant(i.e., the observed difference between the groups is not just due to chance fluctuations).
18
R2: If the probability value is greater than the significance level, then the researcher cannot reject the null hypothesis. The researcher can only claim to fail to reject the null and conclude that the relationship is not statistically significant (i.e., any observed difference between the groups is probably nothing but a reflection of chance fluctuation).
42. What is Type I and Type II error in hypothesis testing?T1: Reject the true null (false positive)T2: Accept the false null (false negative)
43. What test is used to determine if the difference between 2 group means are statistically significant?t-test (p.503)
44. What is qualitative research and how does it differ from quantitative research?Research that relies primarily on the collection of qualitative data. Quantitative research relies primarily on the collection of quantitative data. Main difference: Quan: Based on numerical data; Turn to manipulate IV’s; Testing hypothesis; More deductive; Statistical report.Qua: Based on empirical data; Study the world as it naturally occurs; More inductive; Narrative report.
45. What is meant by the terms emic & etic?Emic: the insiders’ perspectiveEtic: an external, social scientific view of reality
46. What is “validity” in qualitative research?Descriptive Validity: the factual accuracy of an account as reported by the researcher (p.265);Interpretive Validity: accurately portraying the meaning given by the participants to what is being studied (p.265);
19
Theoretical Validity: the degree to which a theoretical explanations fits the data (p.267);Internal Validity: the degree to which a researcher is justified in finding the potential causal relationships among factors (p.268); External Validity: the degree to which the research findings can be generalized to other people, settings, times, treatments, and outcomes. A qualitative research is usually weak in external validity (p.270)
47. What methods can be used to validate qualitative research results?There are quite many, as Researcher-as-detective;Ruling out alternative explanations;Extended fieldwork;Low-inference descriptors;Triangulation;Data, Methods, Investigator, and Theory triangulation;Participant feedback;Peer review;External audit;Negative-case sampling;Reflexivity;Pattern matching.
48. What is mixed method research design and what are some of its purposes?The research in which quantitative and qualitative methods, techniques, or other paradigm characteristics are mixed in one overall study design. The purposes are to study both qualitative and quantitative data, to complement the strengths of the other two, to bring the researcher a broader view to the study, etc.
20
49. What are the strengths and weaknesses of quantitative research designs?Strengths: Follows the confirmatory scientific method; Applies statistically testable hypothesis; Tests causal relationships (when experimental and well-designed quasi-experimental methods used); Generalize research results to larger population and settings better (better external validity). Weaknesses: Research design is very important to gain good results; Sometimes it is not easy to control extraneous and confounding variables; Random assignments are not always available; etc.
50. What are the strengths and weaknesses of qualitative research designs?Strengths: Good for predictive and exploratory research; Approach to find hypothesis and generate hypothesis to test; Not sensitive to data sampling; No bother with statistics and fits small scale deductive approach; etc. Weaknesses: Not good to gain causal relationships; Not good to be generalized (sensitive to external validity); etc.
21


