Embed Size (px)
Citation preview
Review: What is the difference between velocity
and speed? Answer this question in TAG.
DO NOW
Find Homework and announcements on our class wiki:http://machs215.wikispaces.com/
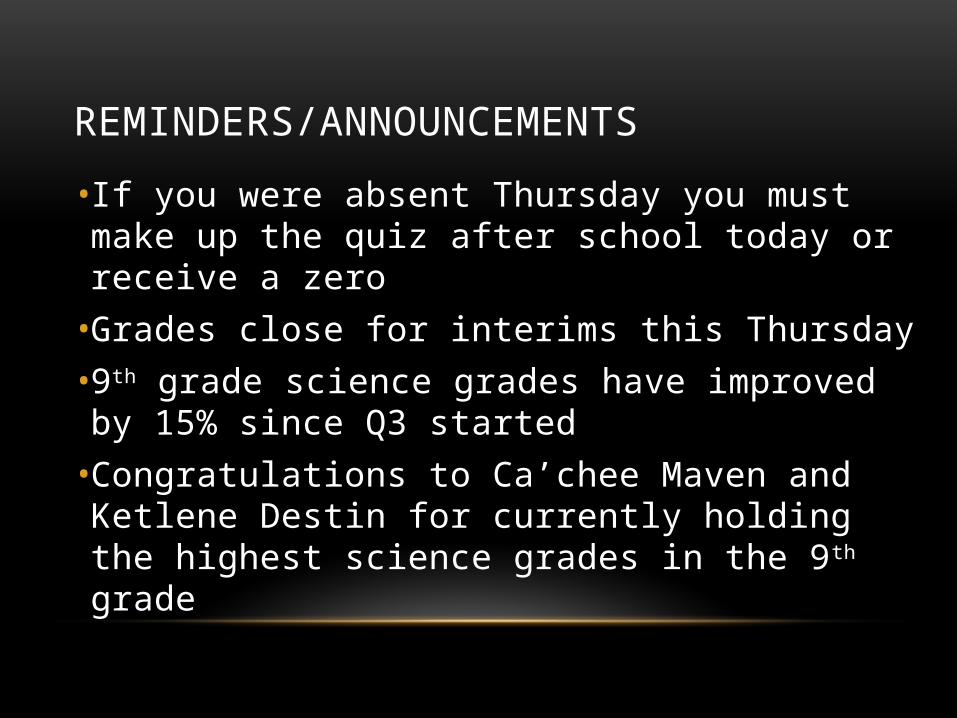
REMINDERS/ANNOUNCEMENTS
• If you were absent Thursday you must make up the quiz after school today or receive a zero
• Grades close for interims this Thursday• 9th grade science grades have improved by
15% since Q3 started• Congratulations to Ca’chee Maven and
Ketlene Destin for currently holding the highest science grades in the 9th grade

AGENDA
• Do now• Lab intro• Lab• Closing
Find Homework and announcements on our class wiki:http://machs215.wikispaces.com/
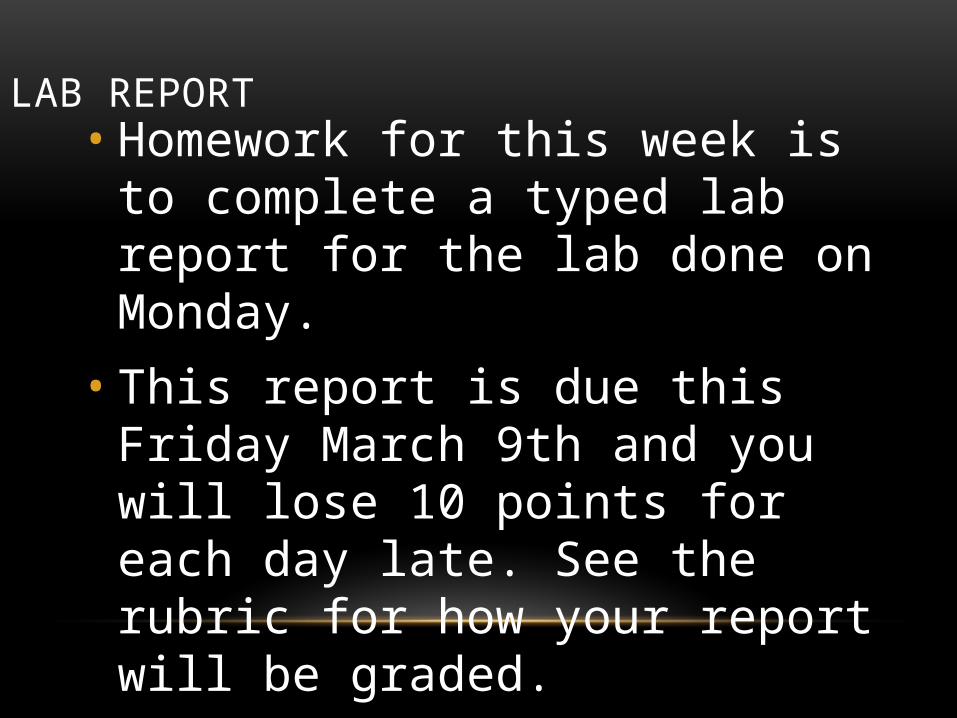
LAB REPORT• Homework for this week is to complete a
typed lab report for the lab done on Monday.
• This report is due this Friday March 9th and you will lose 10 points for each day late. See the rubric for how your report will be graded.
• Emailed projects/Flash Drives will NOT be accepted. Use the computer lab to print out your work.
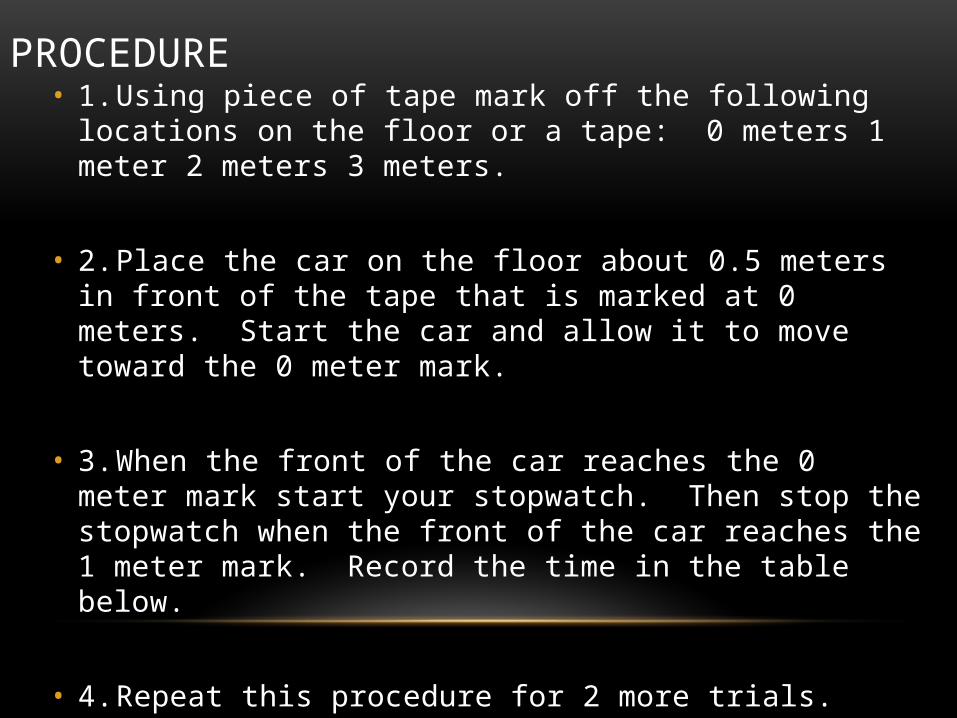
PROCEDURE• 1. Using piece of tape mark off the following locations on
the floor or a tape: 0 meters 1 meter 2 meters 3 meters.
• 2. Place the car on the floor about 0.5 meters in front of the tape that is marked at 0 meters. Start the car and allow it to move toward the 0 meter mark.
• 3. When the front of the car reaches the 0 meter mark start your stopwatch. Then stop the stopwatch when the front of the car reaches the 1 meter mark. Record the time in the table below.
• 4. Repeat this procedure for 2 more trials.
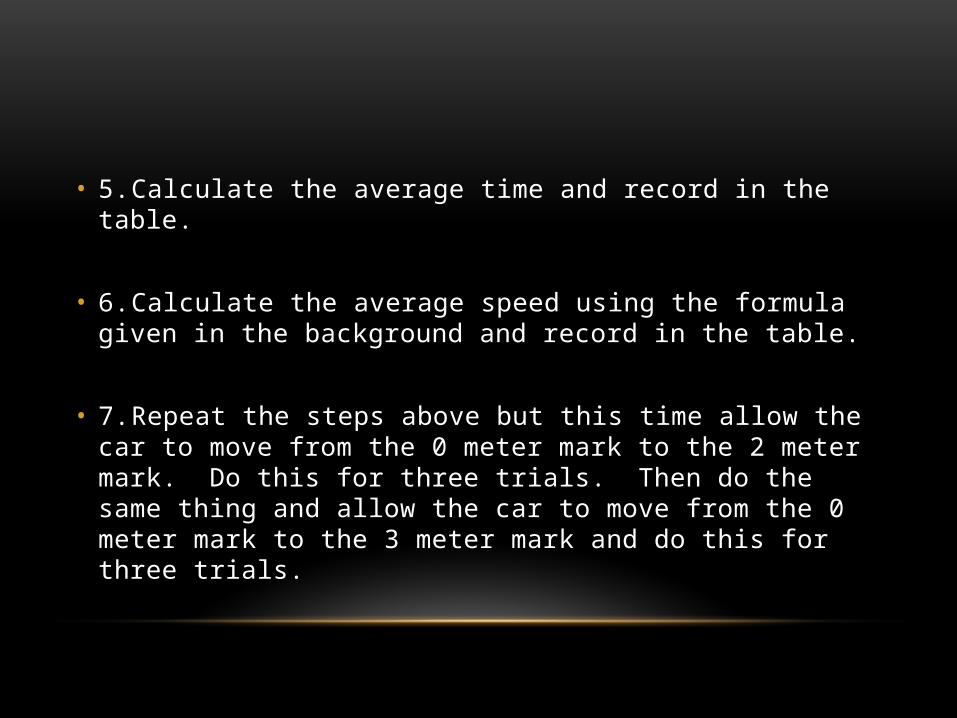
• 5. Calculate the average time and record in the table.
• 6. Calculate the average speed using the formula given in the background and record in the table.
• 7. Repeat the steps above but this time allow the car to move from the 0 meter mark to the 2 meter mark. Do this for three trials. Then do the same thing and allow the car to move from the 0 meter mark to the 3 meter mark and do this for three trials.
LAB EXPECTATIONS
• Stay on task• Follow directions• Respect each other- make sure
everyone is included• YOU HAVE ONLY TODAY TO DO
THIS LAB
CLOSING
• Write a summary (3-5 sentences) of what you completed during the lab today• Turn in progress reports signed
Find Homework and announcements on our class wiki:http://machs215.wikispaces.com/
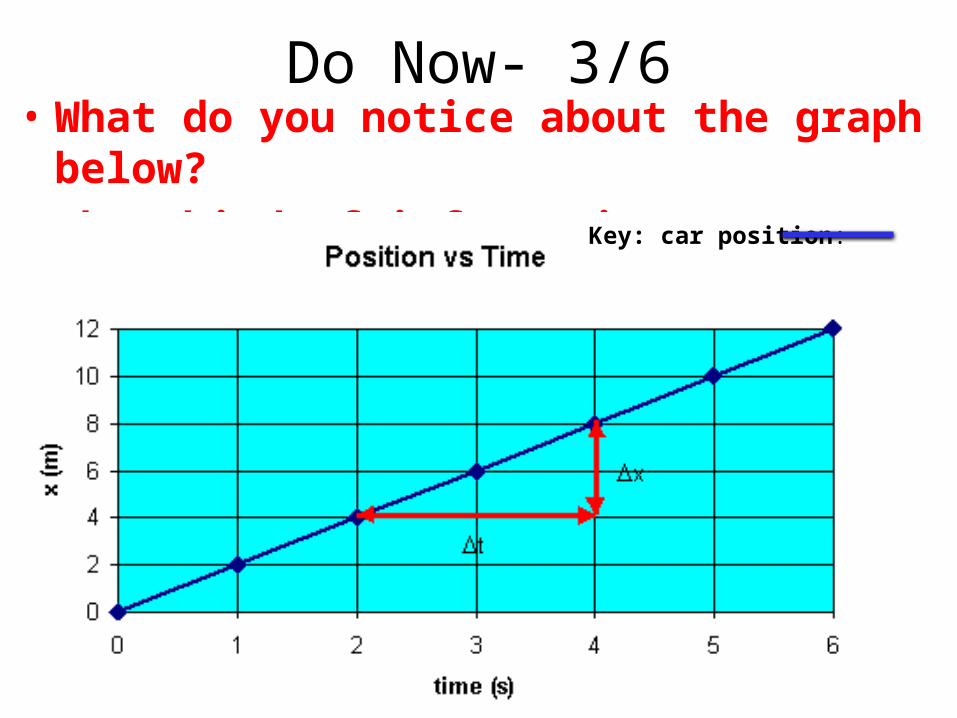
Do Now- 3/6• What do you notice about the graph below?• What kind of information can you get from it?
Key: car position:
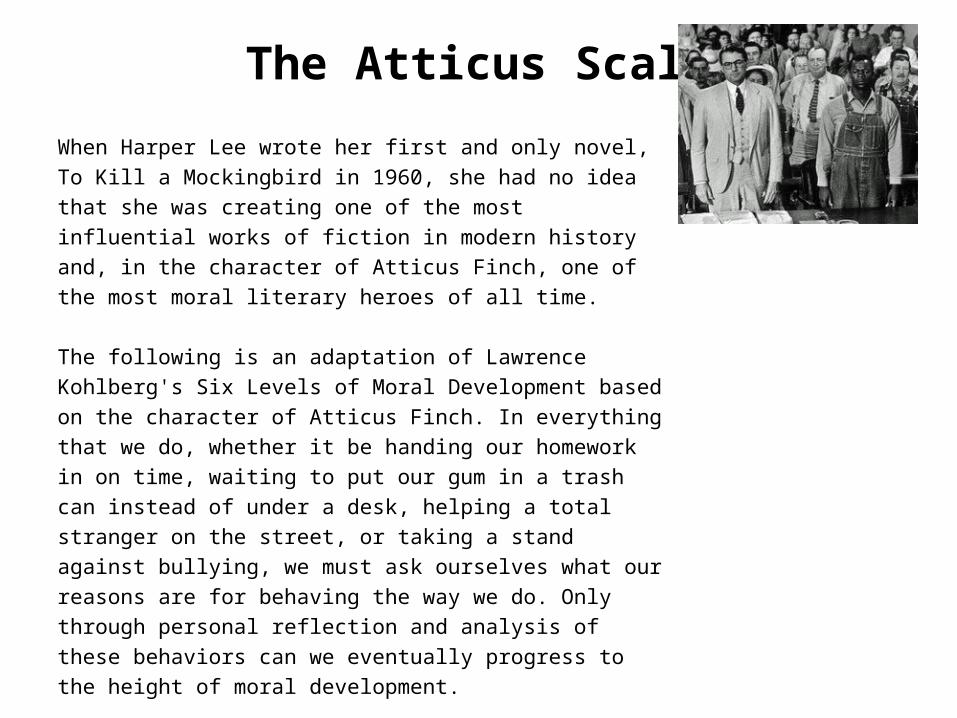
The Atticus Scale
When Harper Lee wrote her first and only novel, To Kill a Mockingbird in 1960, she had no idea that she was creating one of the most influential works of fiction in modern history and, in the character of Atticus Finch, one of the most moral literary heroes of all time.
The following is an adaptation of Lawrence Kohlberg's Six Levels of Moral Development based on the character of Atticus Finch. In everything that we do, whether it be handing our homework in on time, waiting to put our gum in a trash can instead of under a desk, helping a total stranger on the street, or taking a stand against bullying, we must ask ourselves what our reasons are for behaving the way we do. Only through personal reflection and analysis of these behaviors can we eventually progress to the height of moral development.
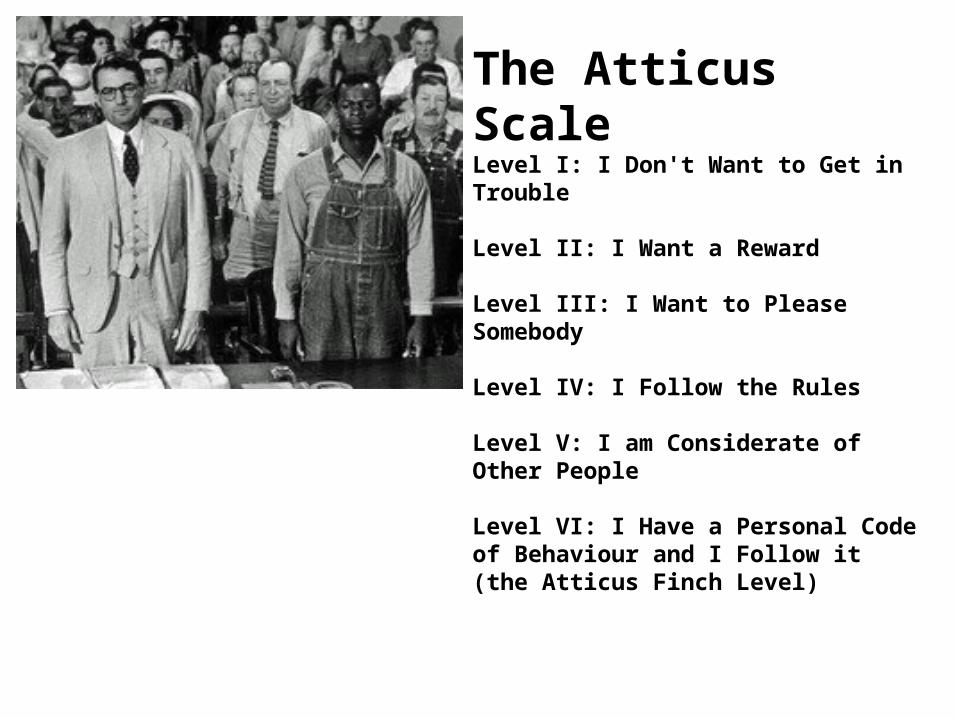
The Atticus ScaleLevel I: I Don't Want to Get in Trouble
Level II: I Want a Reward
Level III: I Want to Please Somebody
Level IV: I Follow the Rules
Level V: I am Considerate of Other People
Level VI: I Have a Personal Code of Behaviour and I Follow it (the Atticus Finch Level)
agenda
• Do now (2 min)• Reminders/Shoutouts (1 min)• Notes (8 min)• Whole class practice (15 min)• Independent Practice (5 min)• Closing (2 min)
Reminders:
• Typed lab report due Friday• Study LG 4.2 on quizlet• All things used in class found on machs215.wikispaces.com
Shout outs:• -The 9th Grade as a whole has increased their average science
grade by 15% in just 3 weeks.
• -Cach’ee Maven has the highest overall science grade in the 9th grade
• - Dhamear Thomas has brought his science grade up by 50% in just 3 weeks
• - Kate Watkins has brought her science grade up by 57% in just 3 weeks
• - Dominic Pagliario has brought his science grade up by 134% in just 3 weeks (Wow!!)
LG 4.1 DISTANCE AND DISPLACEMENT:NEW RESULTS
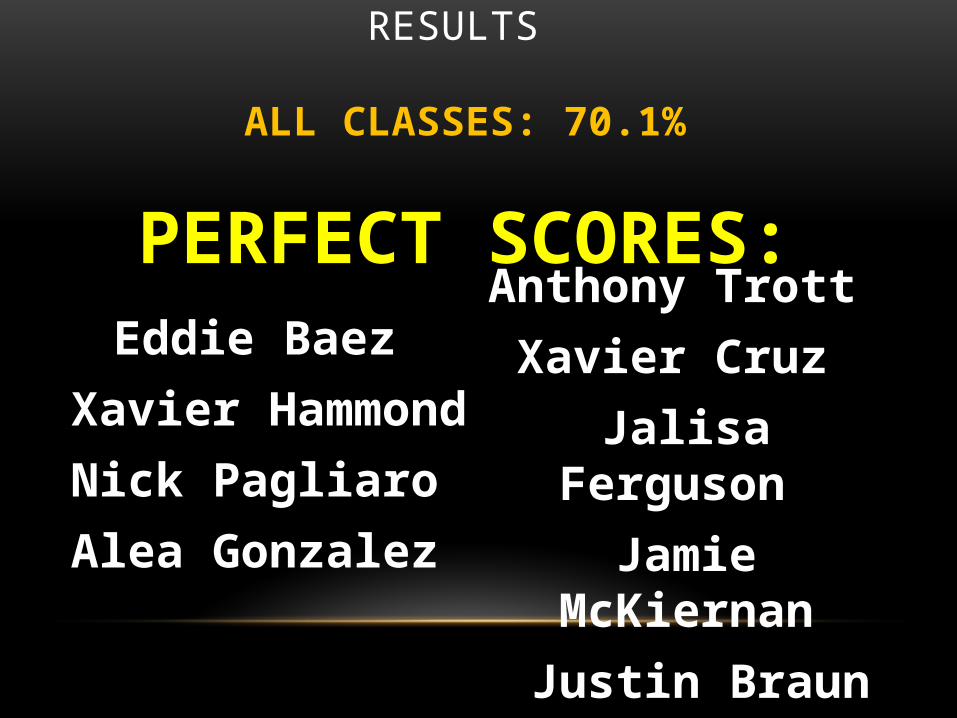
ALL CLASSES: 70.1%
PERFECT SCORES:
Eddie Baez
Xavier Hammond
Nick Pagliaro
Alea Gonzalez
Anthony Trott
Xavier Cruz
Jalisa Ferguson
Jamie McKiernan
Justin Braun
ALL CLASSES: 70.1%
• Per 2: 70.1% highest score: Salena Washington 92% mastery
ALL CLASSES: 70.1%
• Per 3: 68.9%• highest score: Eddie Baez Xavier
Hammond Nick Pagliaro 100% mastery
ALL CLASSES: 70.1%
• Per 4: 72.3%• highest score: Alea Gonzalez
Anthony Trott 100% mastery
ALL CLASSES: 70.1%
• Per 5: 73%• highest score: Xavier Cruz Jalisa
Ferguson Jamie McKiernan 100% mastery
ALL CLASSES: 70.1%
• Per 6: 66.2%
• highest score: Justin Braun 100% mastery
Topic: Distance-Time Graphs
SPEEDa SCALAR quantity which refers to “how fast an object is moving”
VELOCITYa VECTOR which refers to “the rate at which an object changes its position”
Distance-Time GRAPH
A graph that shows how position
depends on time
The slope of a distance-time graph represents the velocity.
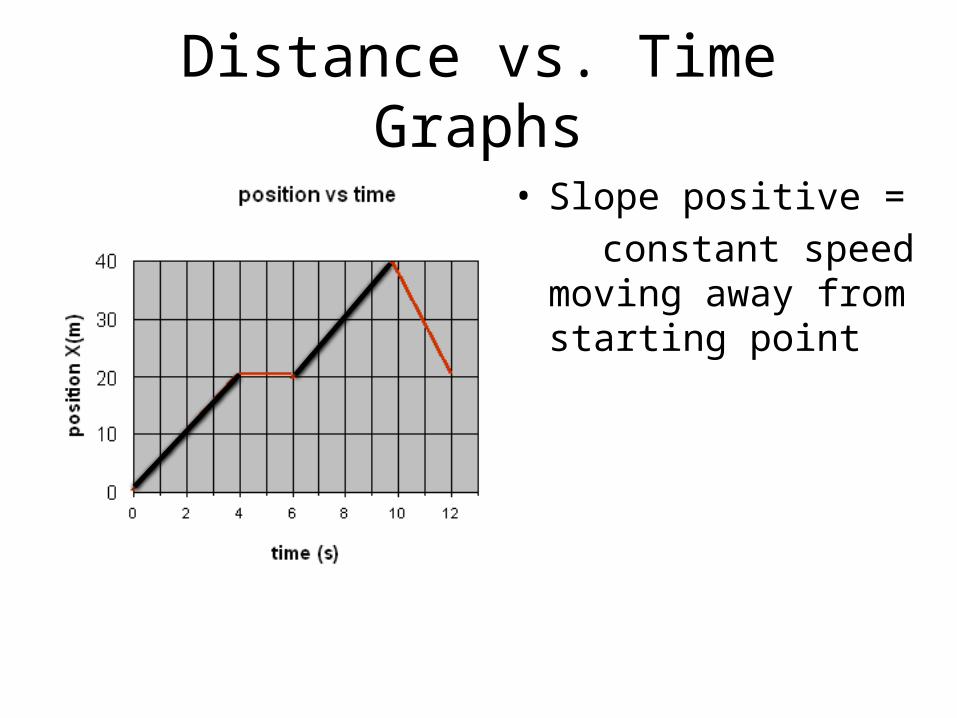
Distance vs. Time Graphs
• Slope positive = constant speed moving
away from starting point
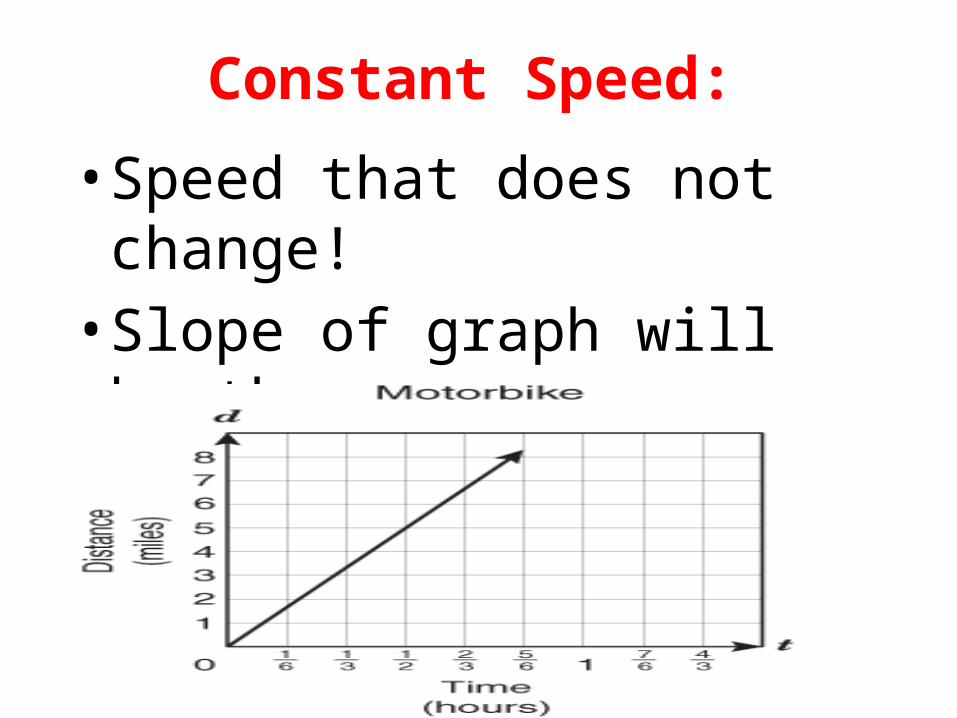
Constant Speed:
• Speed that does not change!• Slope of graph will be the same
throughout.
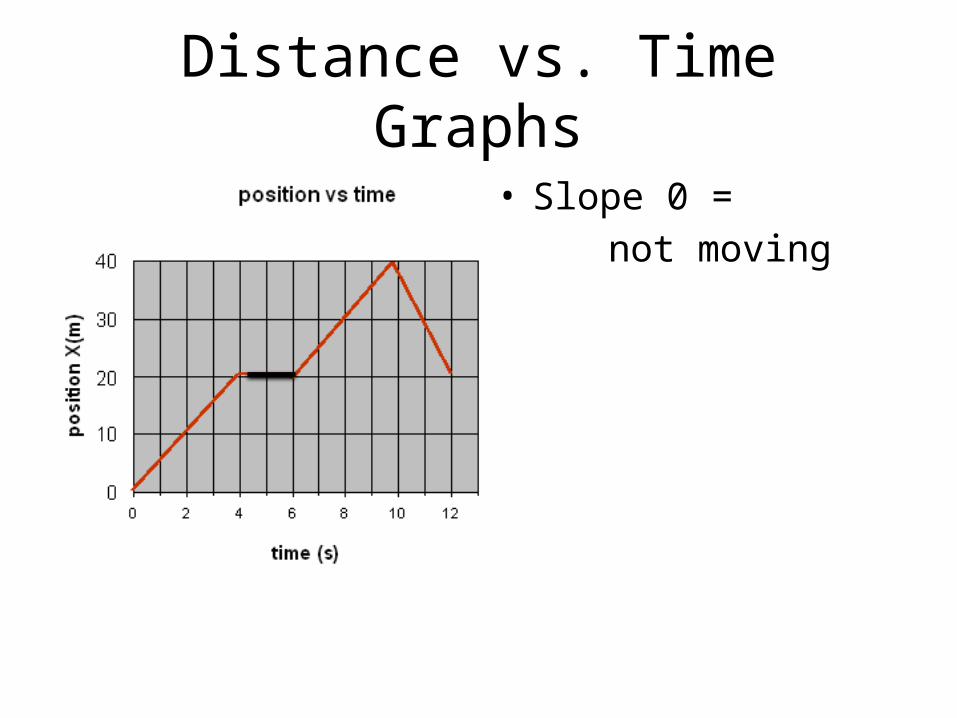
Distance vs. Time Graphs
• Slope 0 = not moving
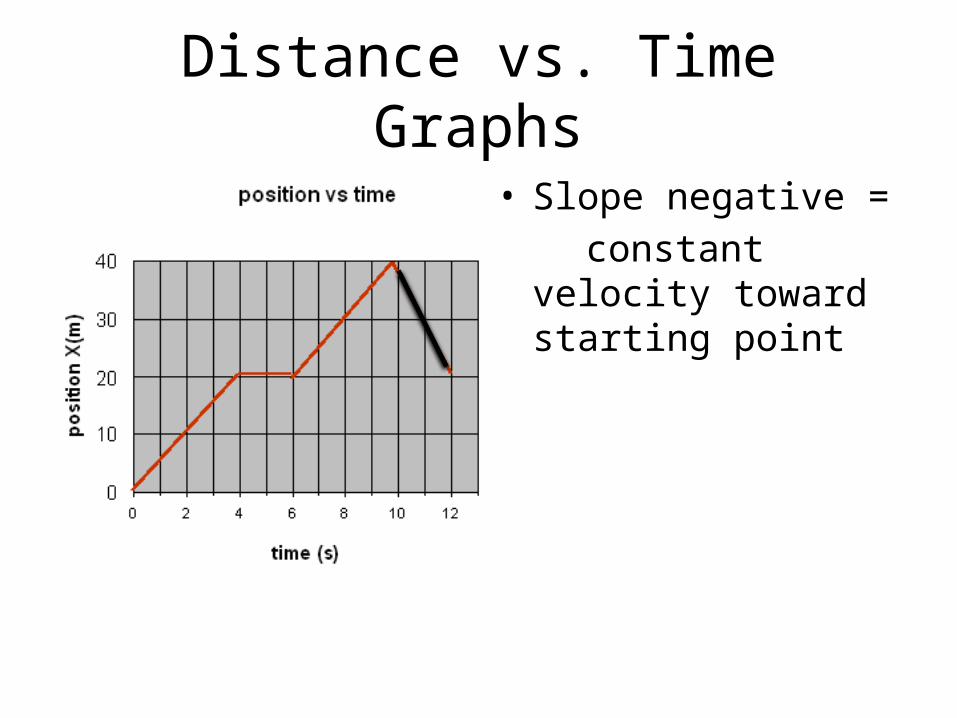
Distance vs. Time Graphs
• Slope negative = constant velocity
toward starting point
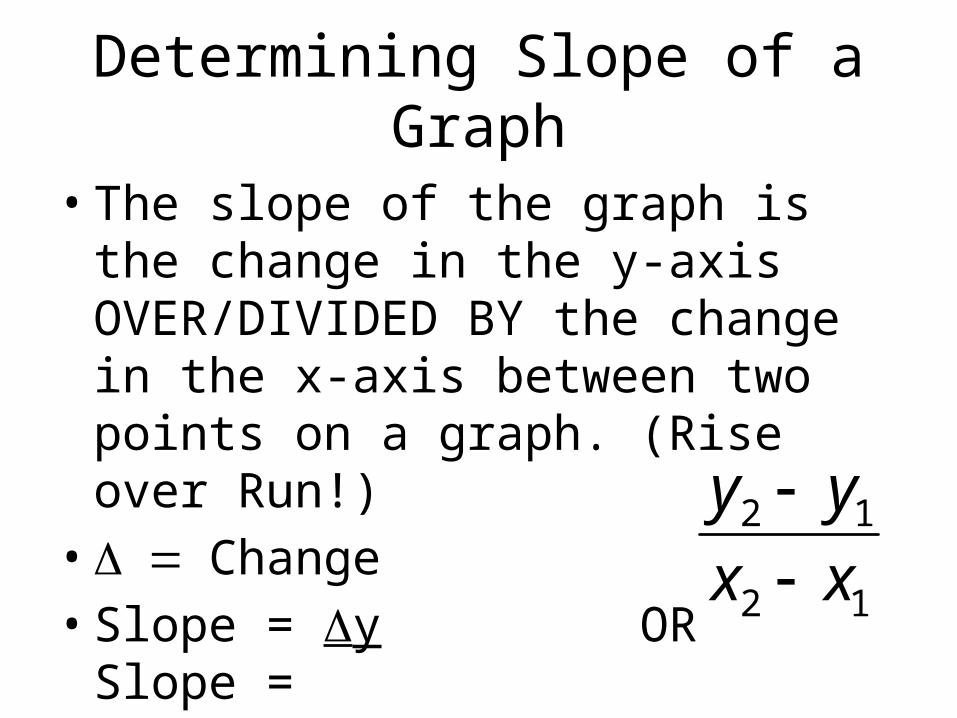
Determining Slope of a Graph
• The slope of the graph is the change in the y-axis OVER/DIVIDED BY the change in the x-axis between two points on a graph. (Rise over Run!)
• = D Change• Slope = Dy OR Slope = Dx
12
12
xx
yy

2 minutes at your table library voices
• Fold cornell notes over• Quiz each other
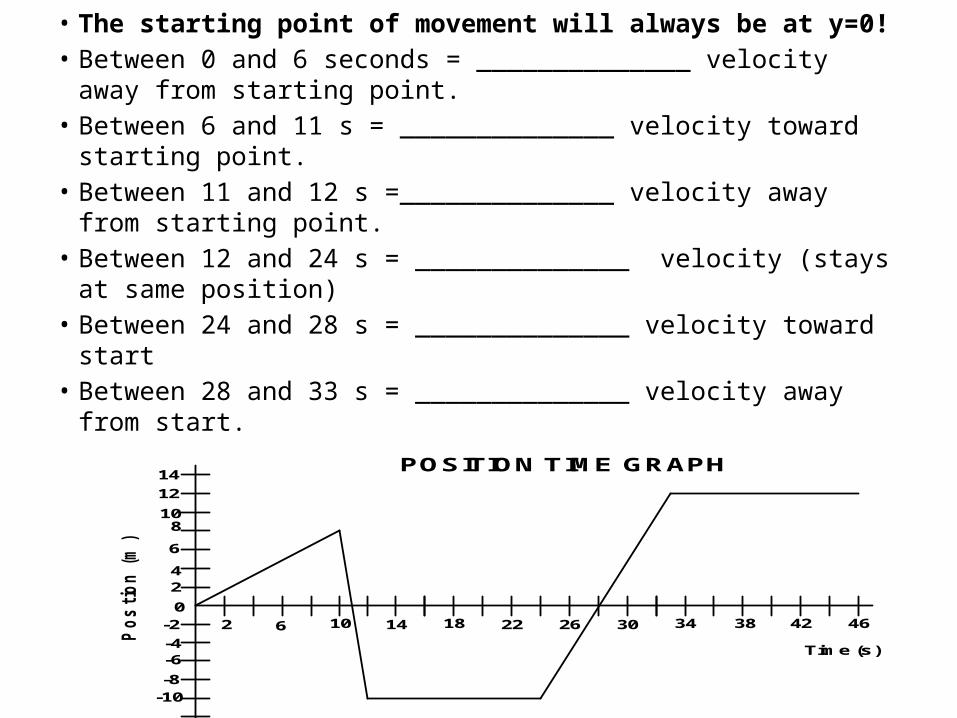
• The starting point of movement will always be at y=0! • Between 0 and 6 seconds = ______________ velocity away from
starting point.• Between 6 and 11 s = ______________ velocity toward starting
point.• Between 11 and 12 s =______________ velocity away from
starting point.• Between 12 and 24 s = ______________ velocity (stays at same
position)• Between 24 and 28 s = ______________ velocity toward start• Between 28 and 33 s = ______________ velocity away from
start. POSITION TIME GRAPH
Time (s)
Pos
tio
n (m
)
2
2 4
-2 0
6 -4
6
8 10
12
14
-6
-8 -10
10 14 18 22 26 30 34 38 42 46
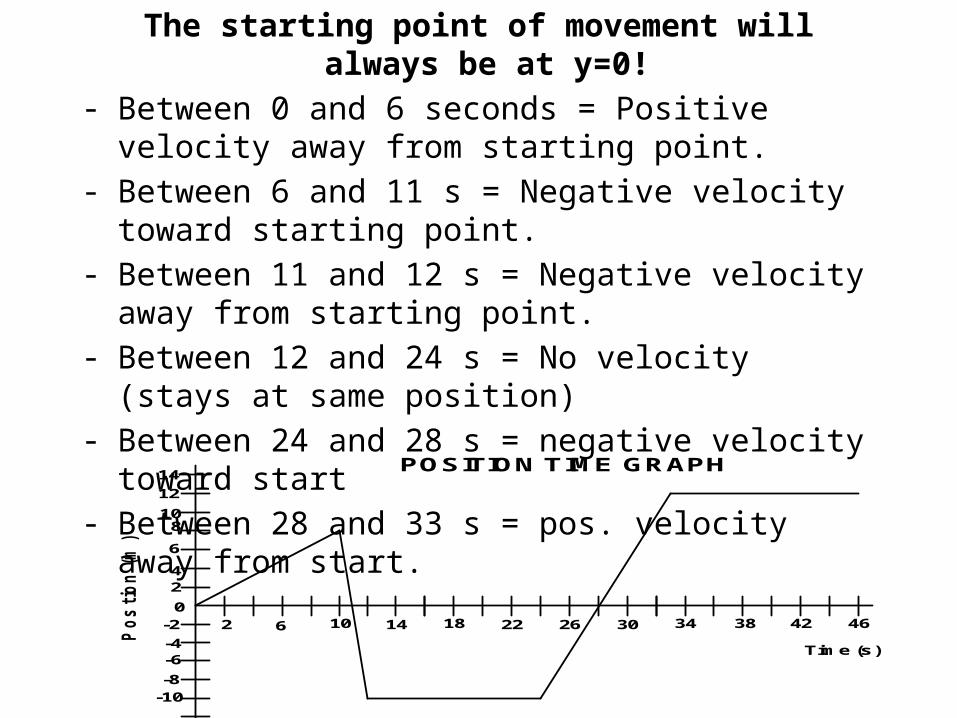
The starting point of movement will always be at y=0! - Between 0 and 6 seconds = Positive velocity away from
starting point.- Between 6 and 11 s = Negative velocity toward starting
point.- Between 11 and 12 s = Negative velocity away from
starting point.- Between 12 and 24 s = No velocity (stays at same position)- Between 24 and 28 s = negative velocity toward start- Between 28 and 33 s = pos. velocity away from start.
POSITION TIME GRAPH
Time (s)
Pos
tio
n (m
)
2
2 4
-2 0
6 -4
6
8 10
12
14
-6
-8 -10
10 14 18 22 26 30 34 38 42 46
1 2 3 4 5 6Time (hr)
Dis
tanc
e (k
m)
0 1
0 2
0 3
0 4
0 5
0 6
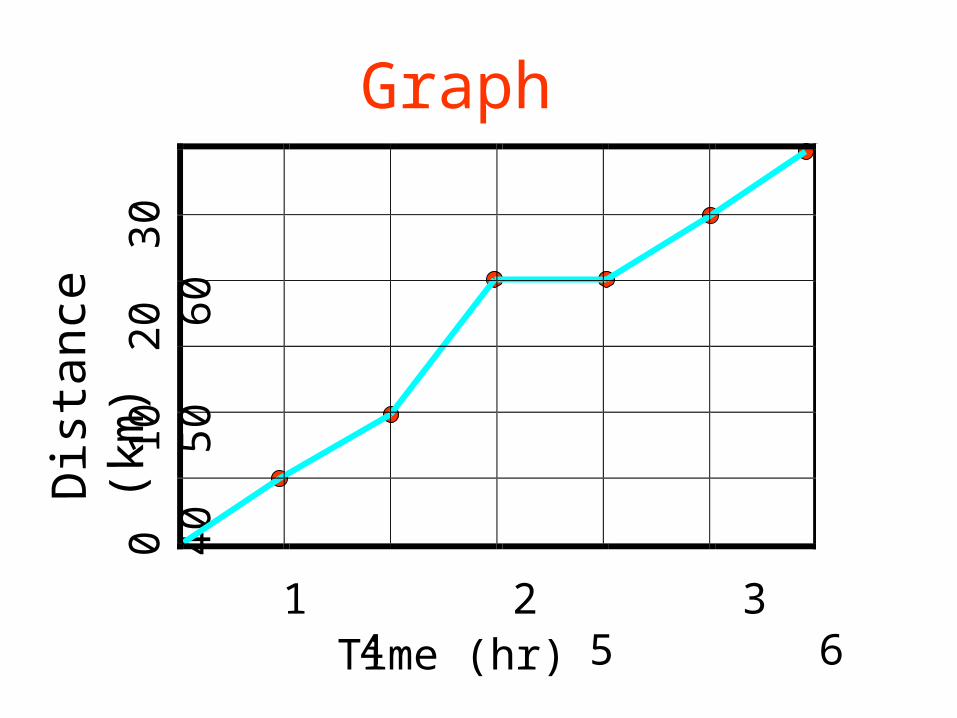
0Graph
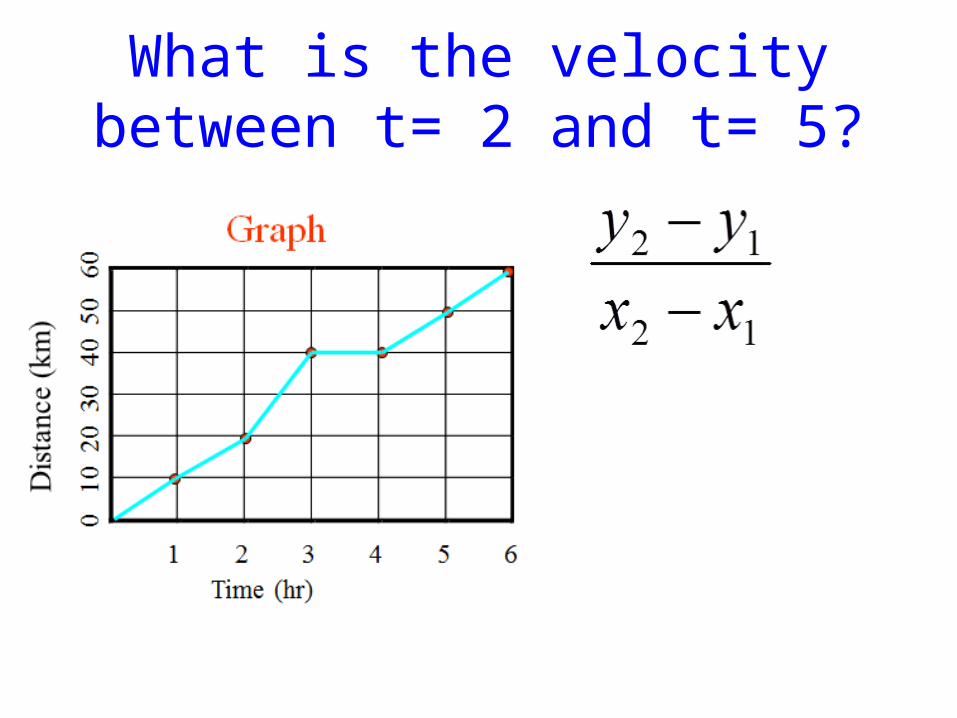
What is the velocity between t= 2 and t= 5?
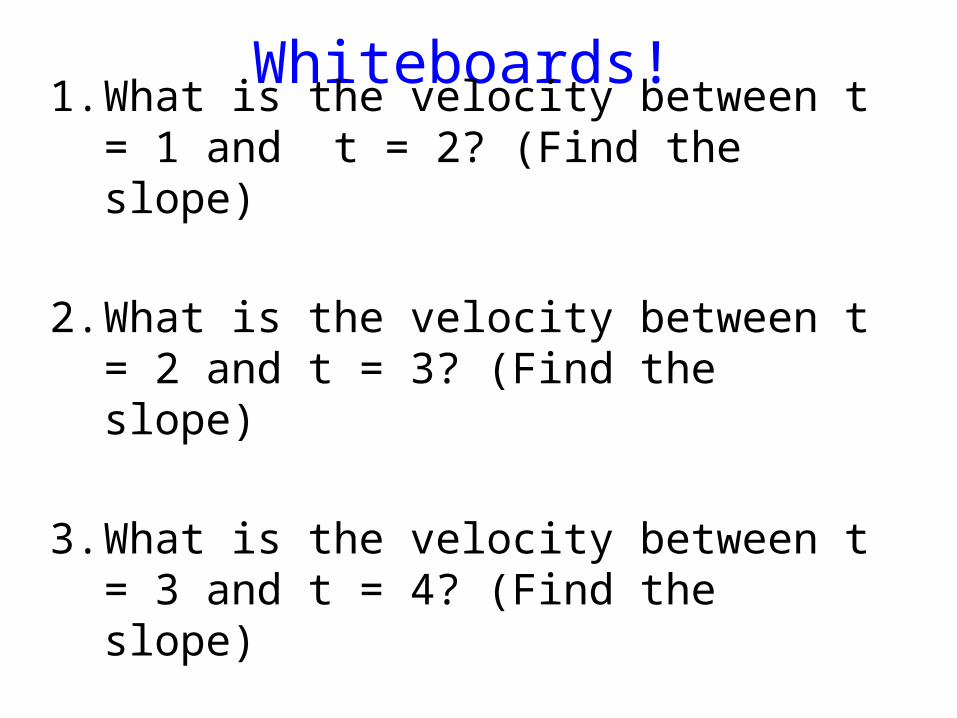
Whiteboards!1. What is the velocity between t = 1 and t =
2? (Find the slope)
2. What is the velocity between t = 2 and t = 3? (Find the slope)
3. What is the velocity between t = 3 and t = 4? (Find the slope)
4. What is the total displacement traveled in this graph?
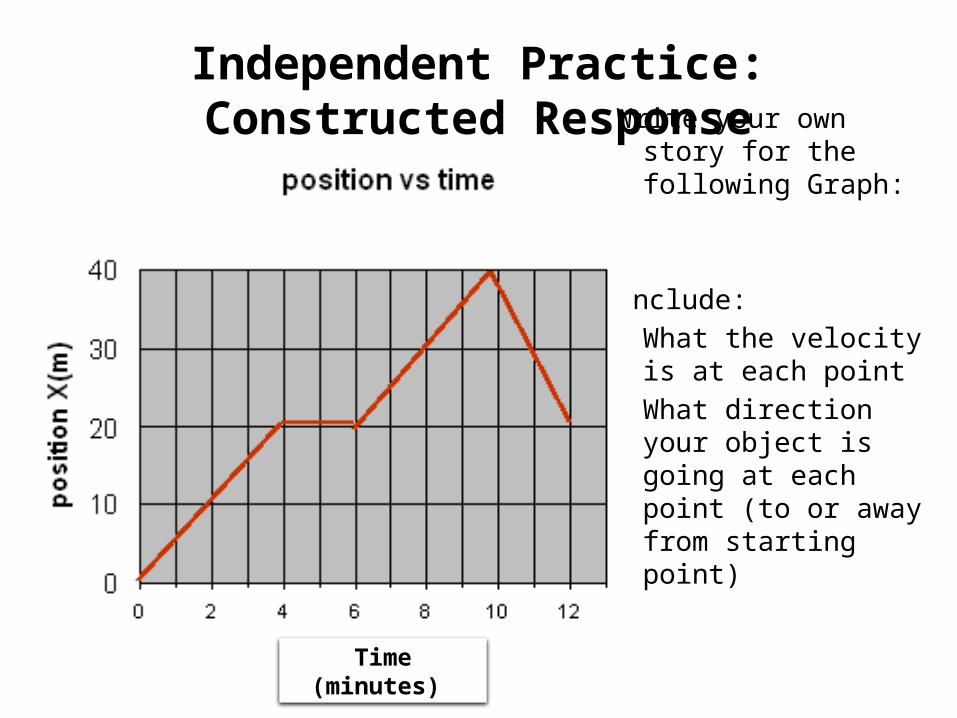
Independent Practice: Constructed Response Write your own story
for the following Graph:
Include:- What the velocity is
at each point- What direction your
object is going at each point (to or away from starting point)
Time (minutes)
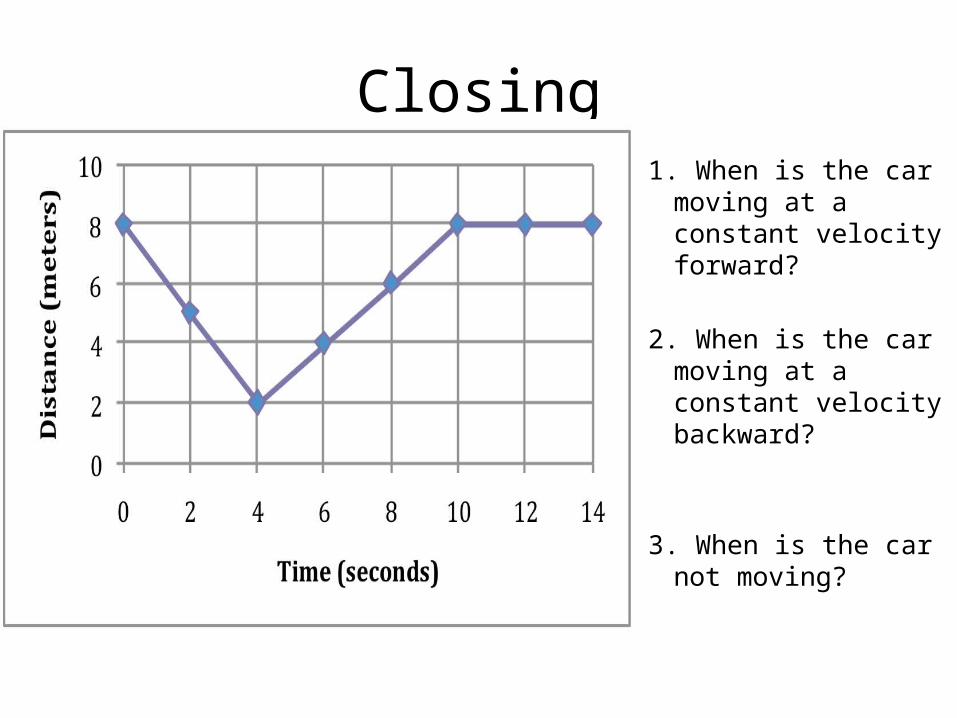
Closing1. When is the car
moving at a constant velocity forward?
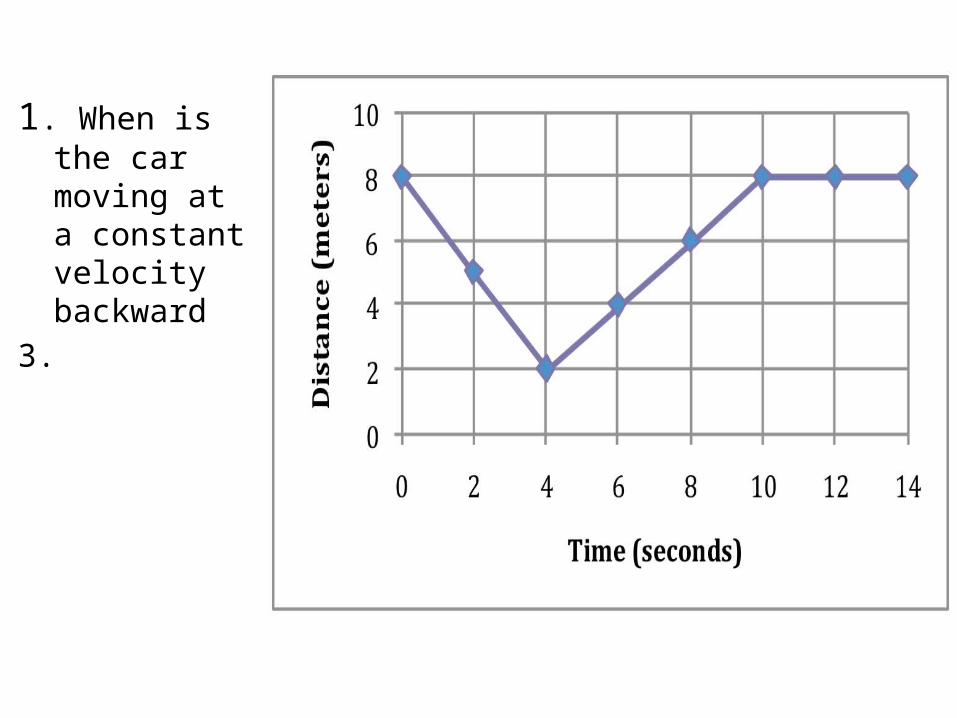
2. When is the car moving at a constant velocity backward?
3. When is the car not moving?

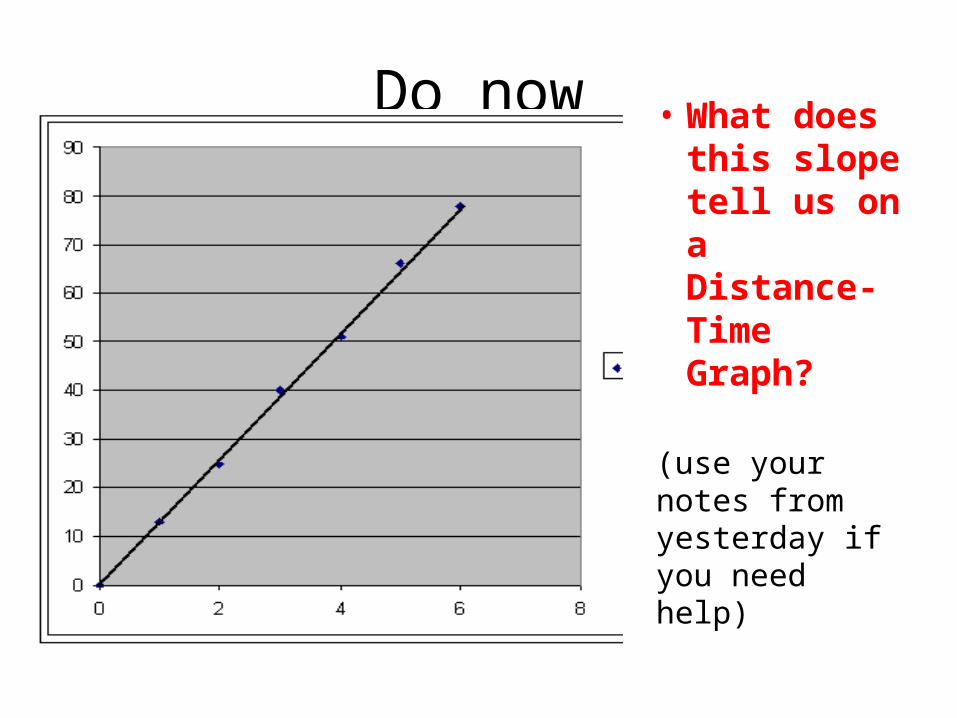
Do now • What does this slope tell us on a Distance-Time Graph?
(use your notes from yesterday if you need help)
Reminders
• Typed lab report due Friday- one per student, not one per group
• Grades close for Interims tomorrow• Date for science fair display will be changed. I
need to get word about getting the boards so do not make yours yet.
agenda
• Do now• Quick review• Practice- D-T graphs in
groups• Independent Practice• Closing
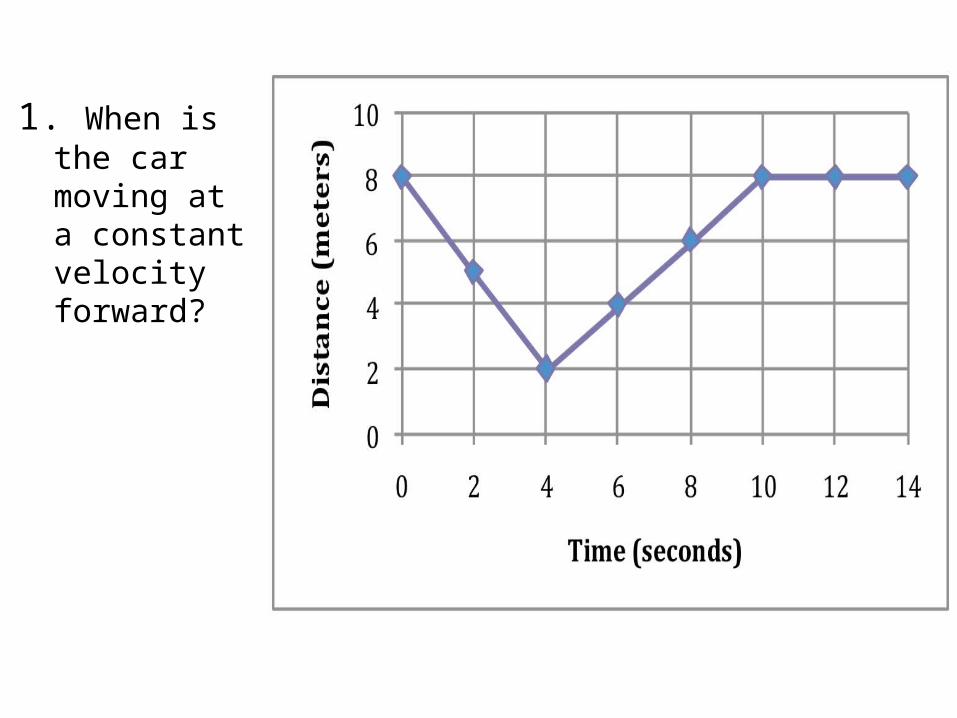
1. When is the car moving at a constant velocity forward?
1. When is the car moving at a constant velocity backward
3.
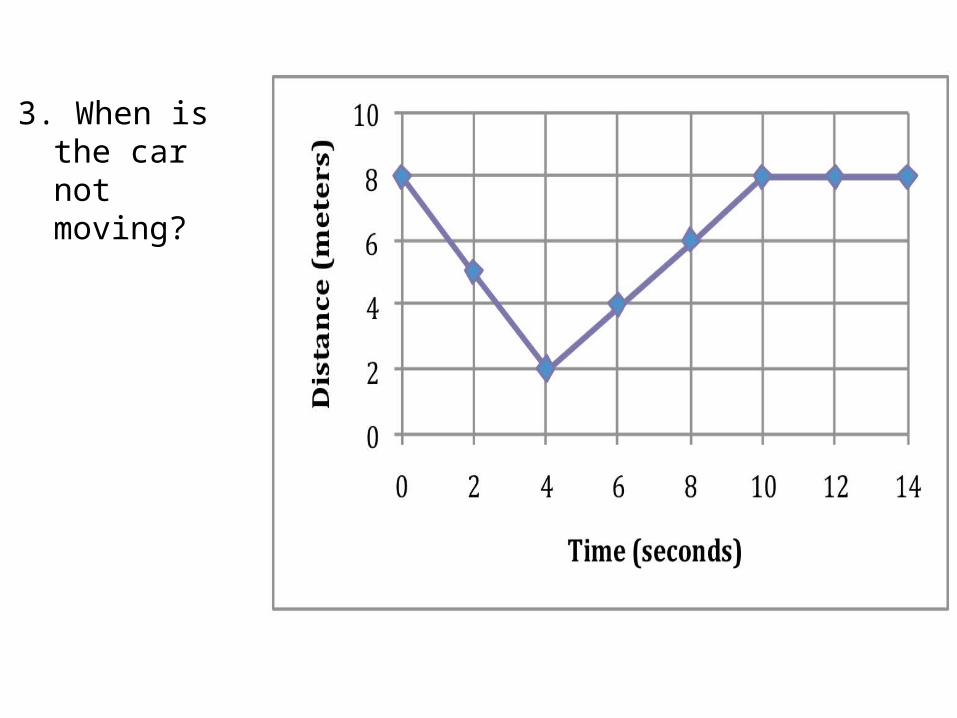
3. When is the car not moving?
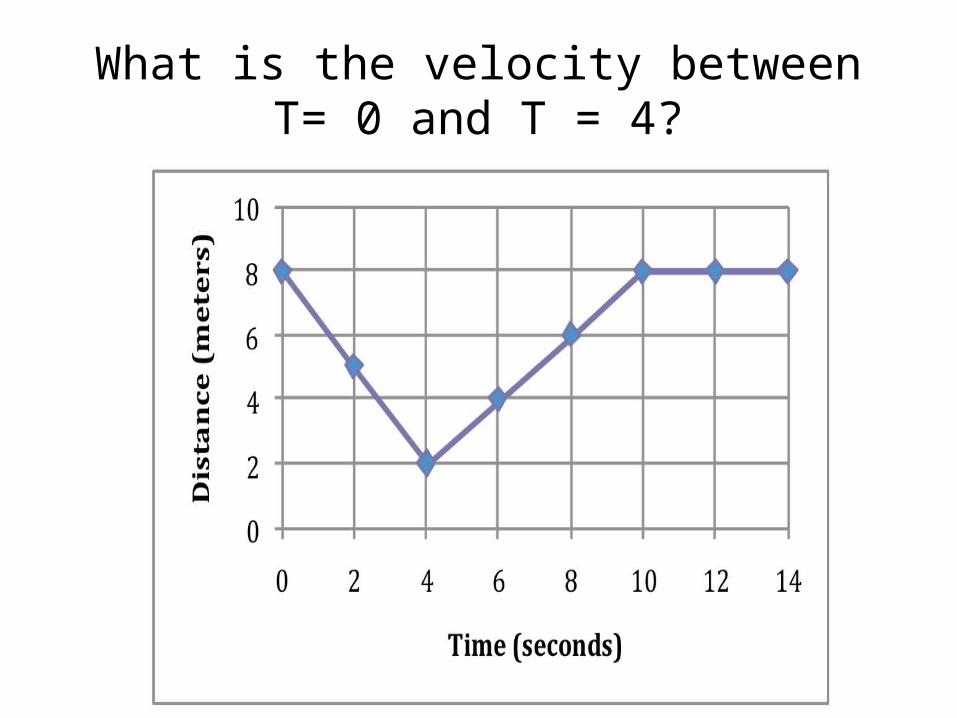
What is the velocity between T= 0 and T = 4?
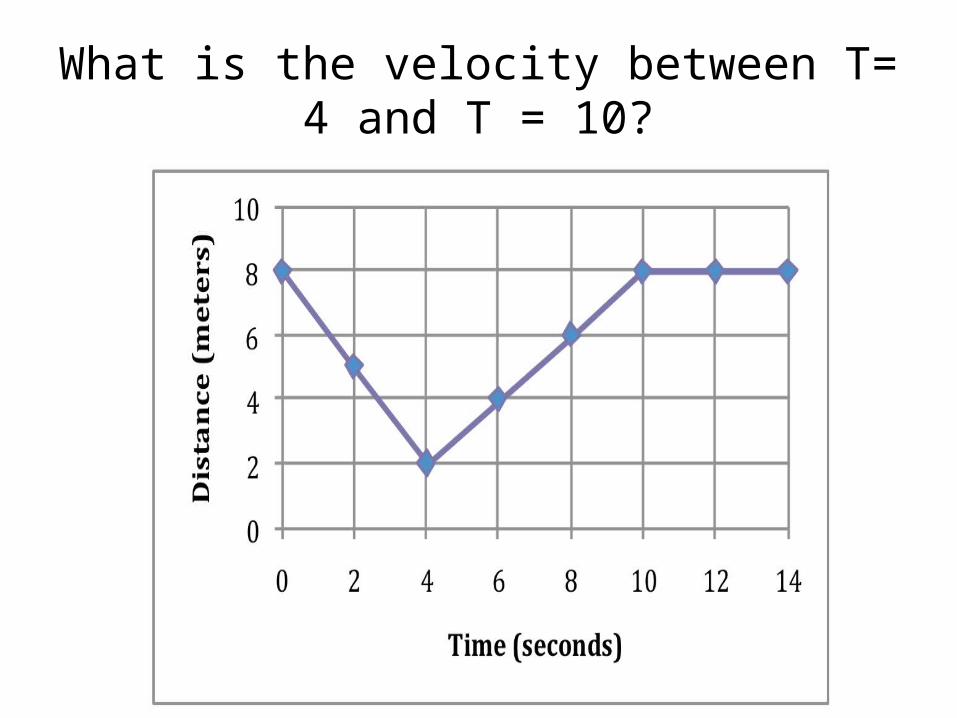
What is the velocity between T= 4 and T = 10?
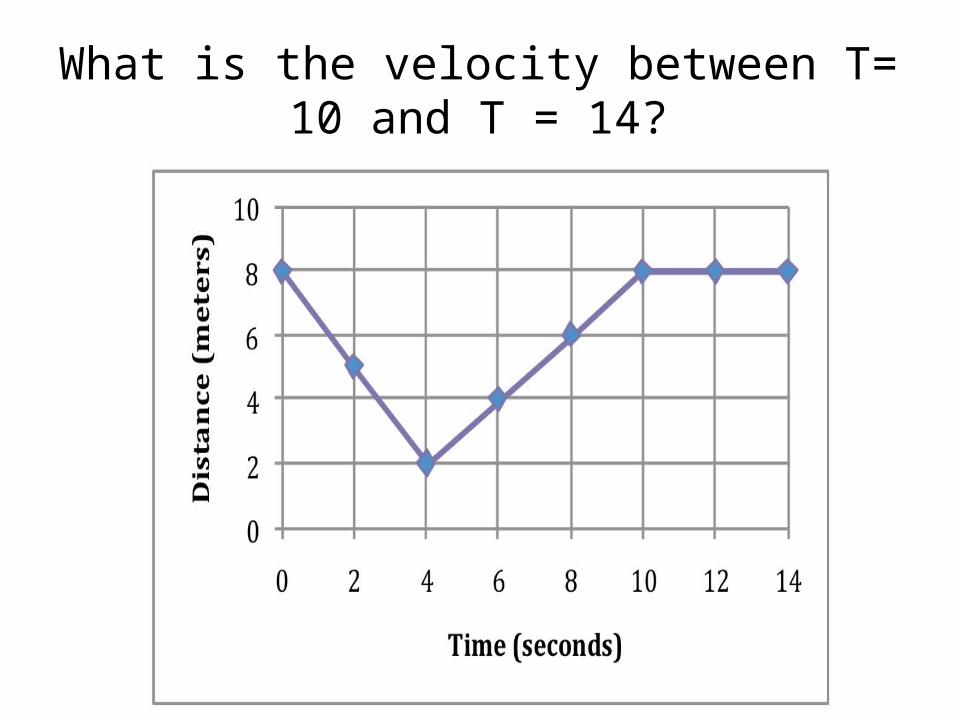
What is the velocity between T= 10 and T = 14?
Practice

Independent Practice• SILENT DURING IP OR RECEIVE A DETENTION
• WHEN DONE, ASK FOR THE KEY
No closing today

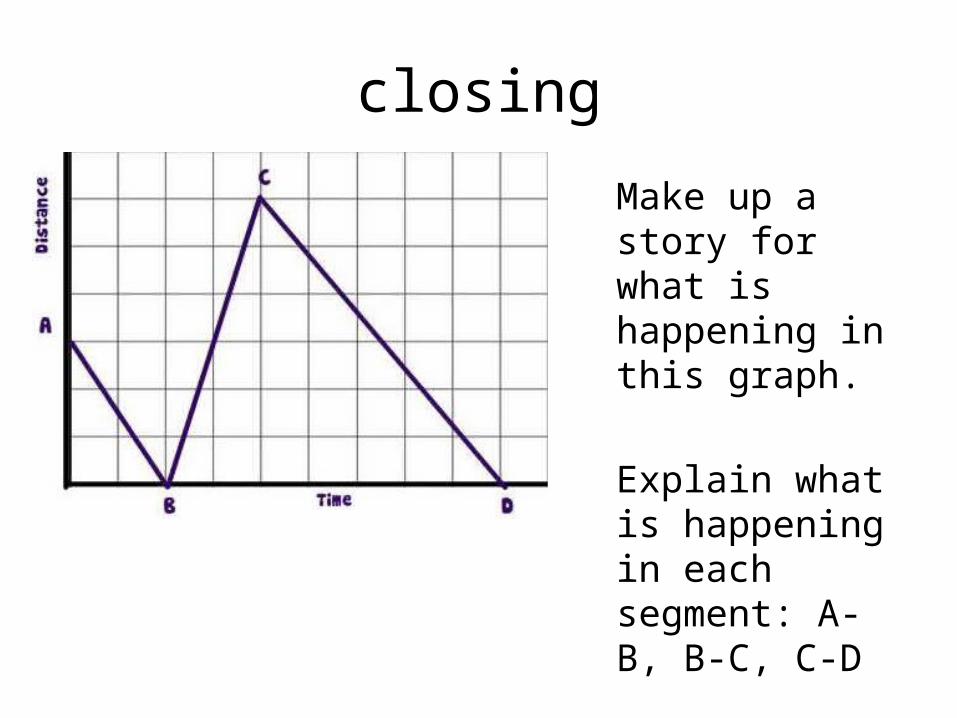
closing
Make up a story for what is happening in this graph.
Explain what is happening in each segment: A-B, B-C, C-D
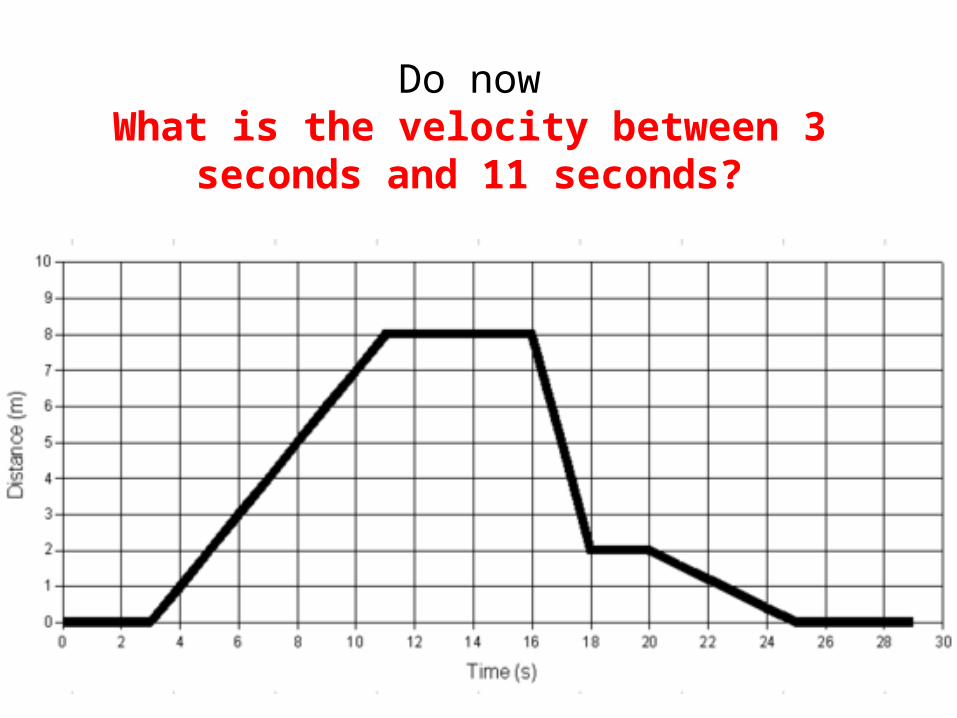
Do nowWhat is the velocity between 3 seconds and
11 seconds?
Agenda
• Do now• White board review• Interpreting distance time graphs activity• Independent Practice• Closing
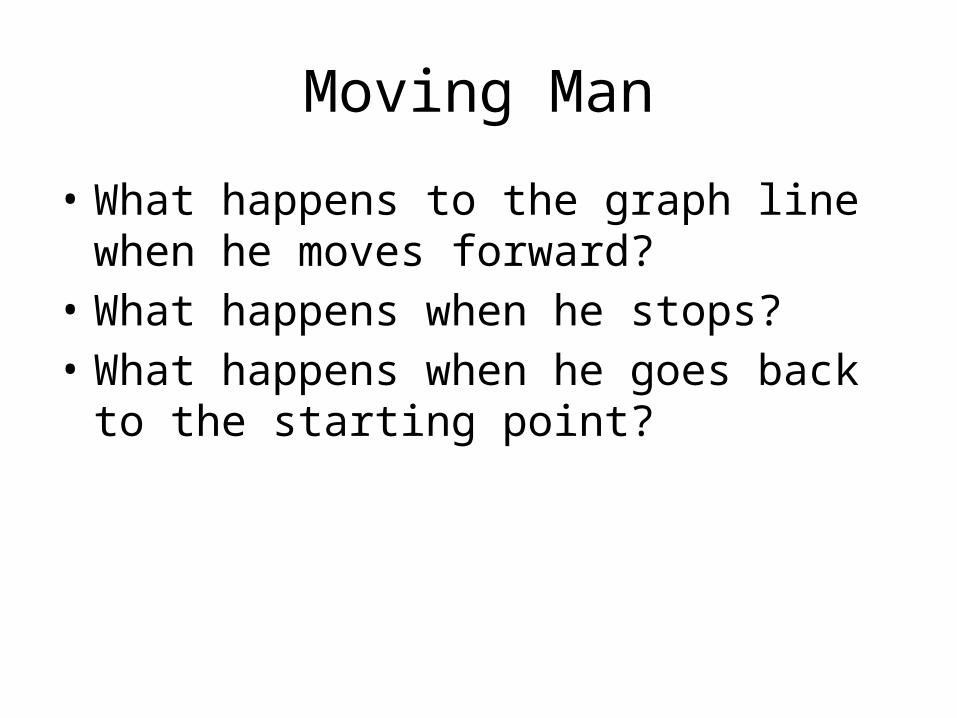
Moving Man
• What happens to the graph line when he moves forward?
• What happens when he stops?• What happens when he goes back to the
starting point?
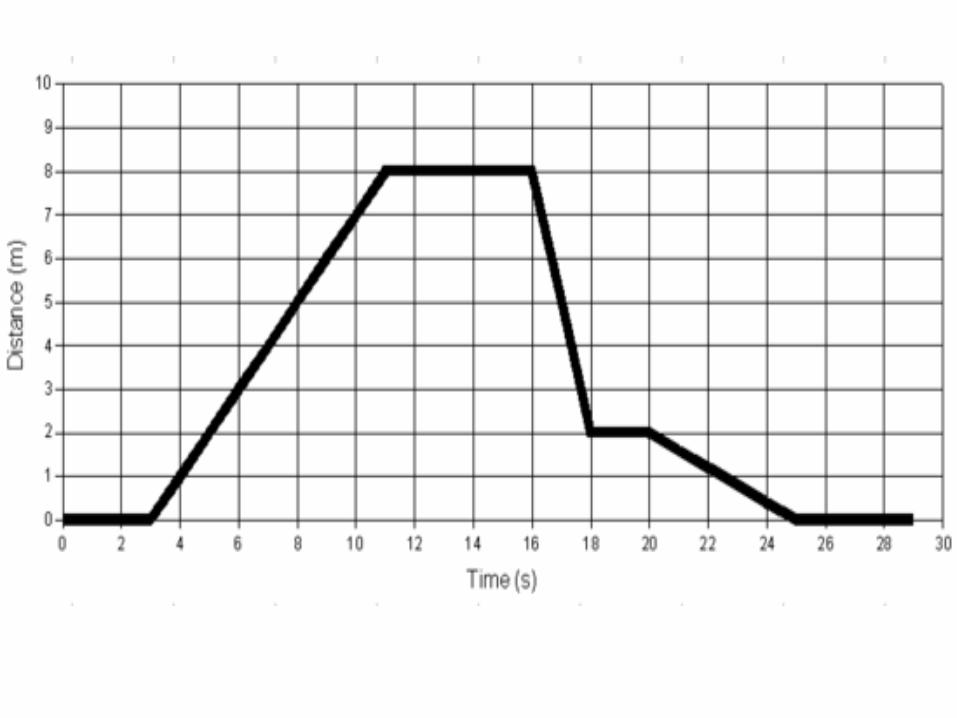
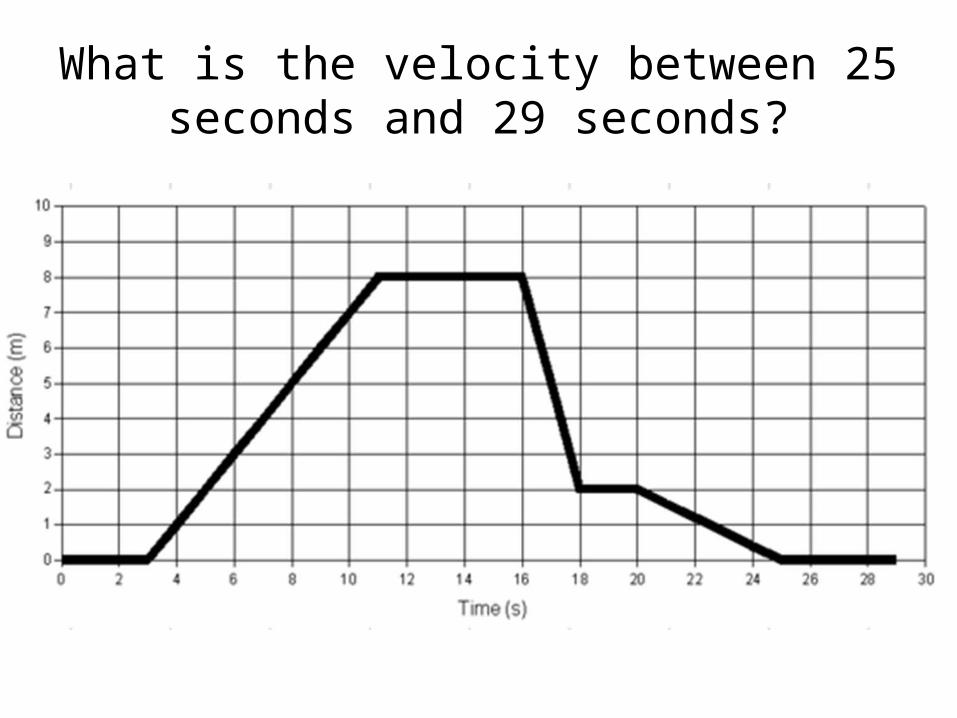
What is the velocity between 25 seconds and 29 seconds?

What is the velocity between 16 seconds and 18 seconds?

What is the velocity between 20 seconds and 25 seconds?
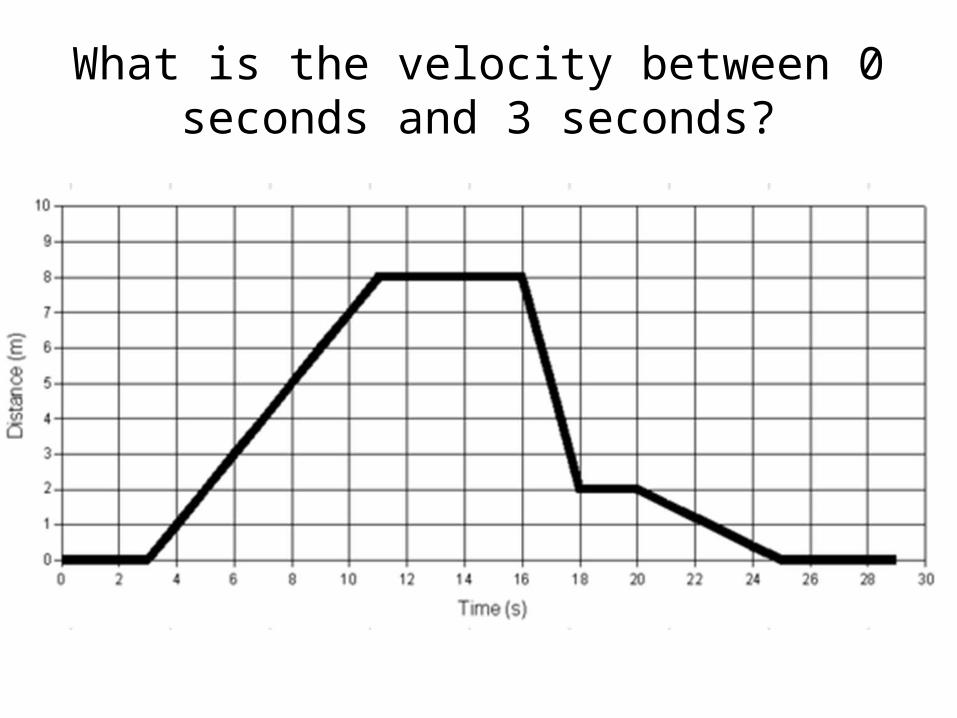
What is the velocity between 0 seconds and 3 seconds?
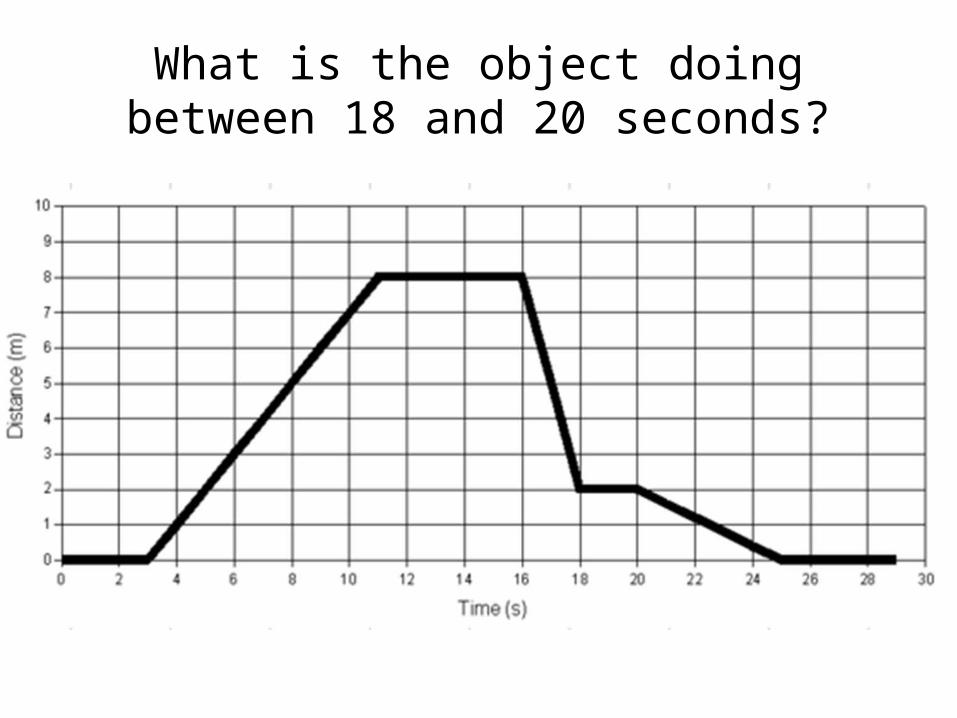
What is the object doing between 18 and 20 seconds?
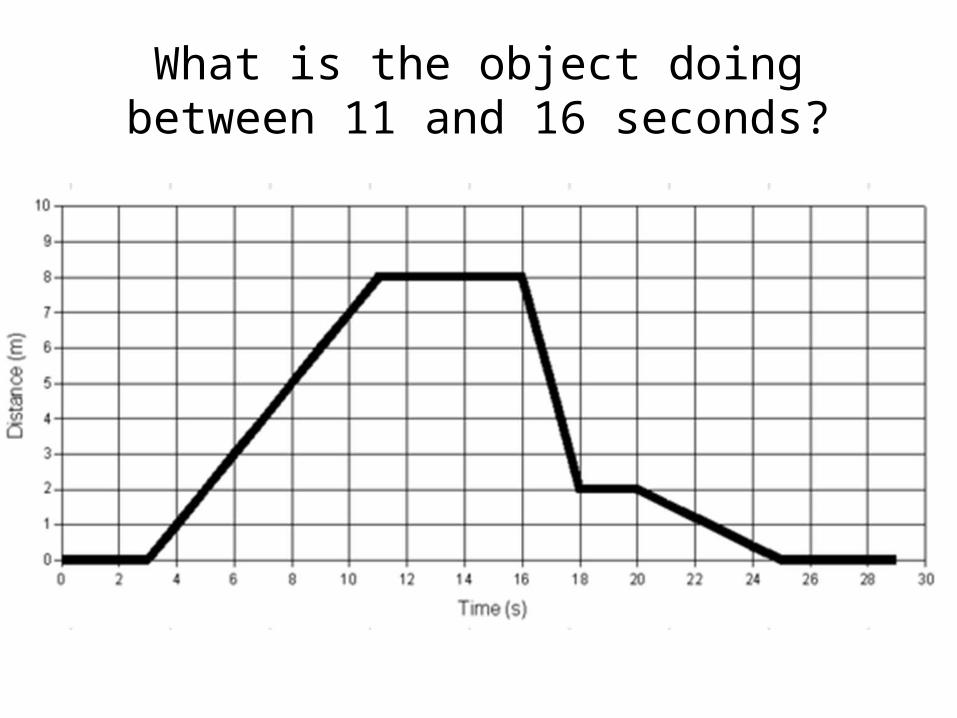
What is the object doing between 11 and 16 seconds?
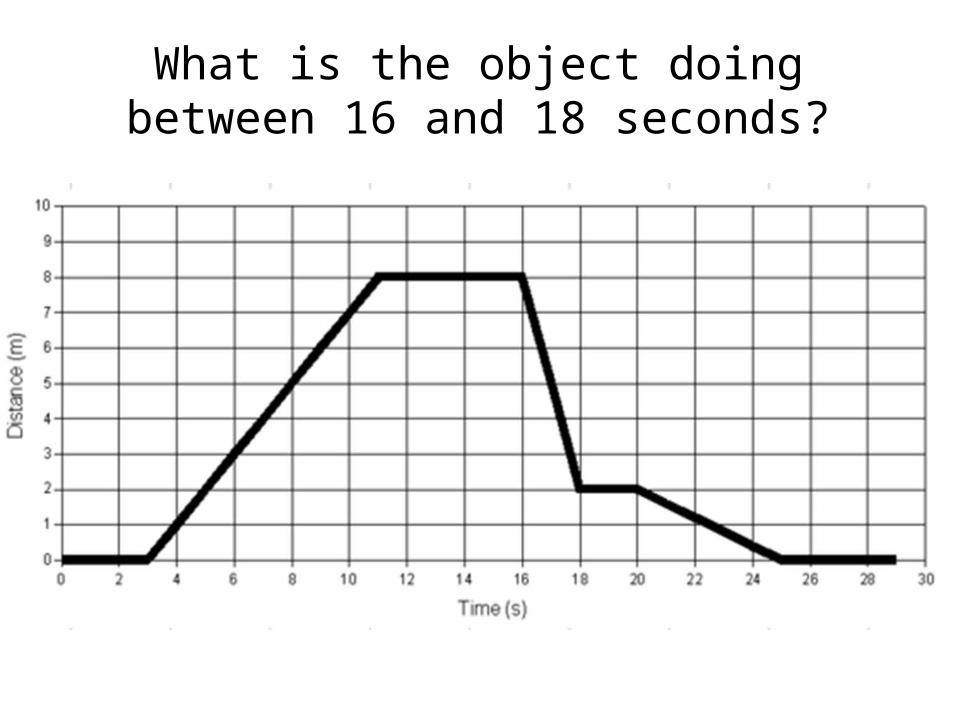
What is the object doing between 16 and 18 seconds?
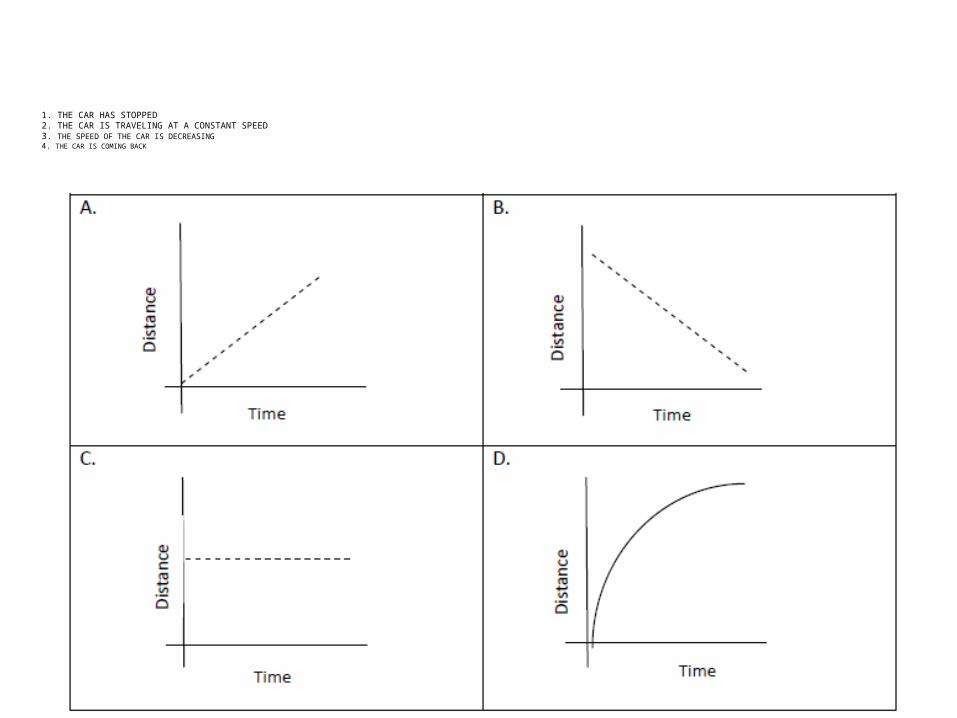
1. THE CAR HAS STOPPED2. THE CAR IS TRAVELING AT A CONSTANT SPEED3. THE SPEED OF THE CAR IS DECREASING4. THE CAR IS COMING BACK
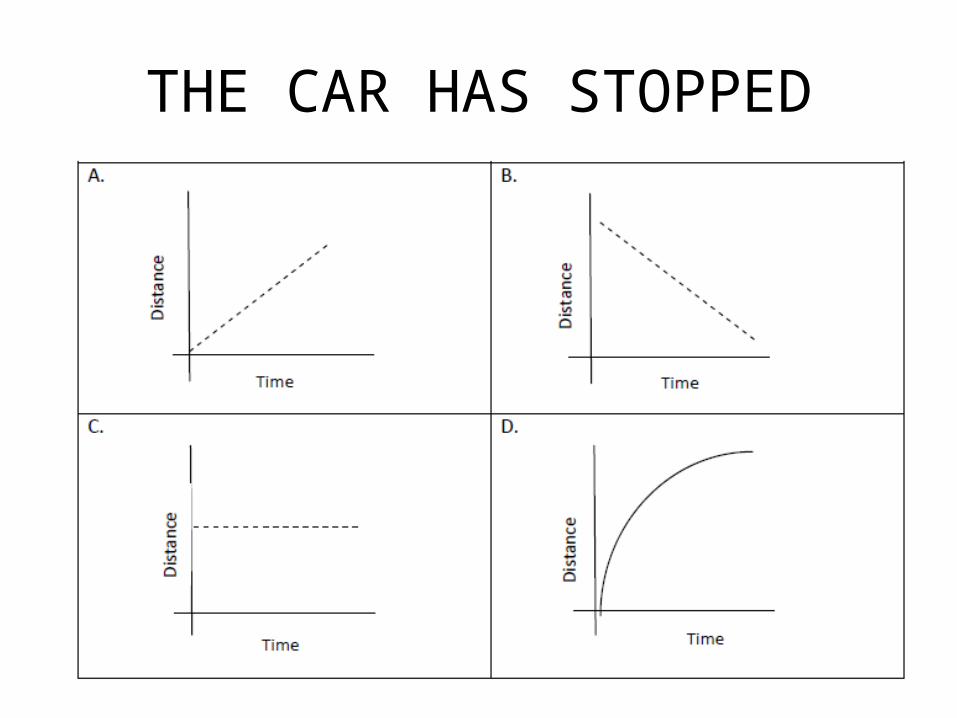
THE CAR HAS STOPPED
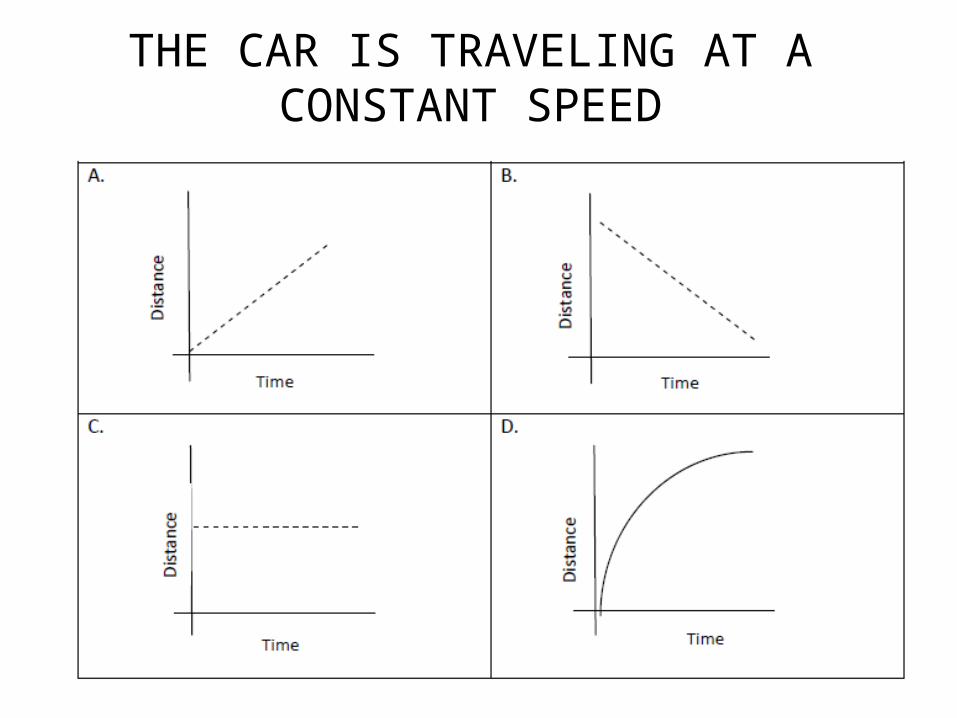
THE CAR IS TRAVELING AT A CONSTANT SPEED
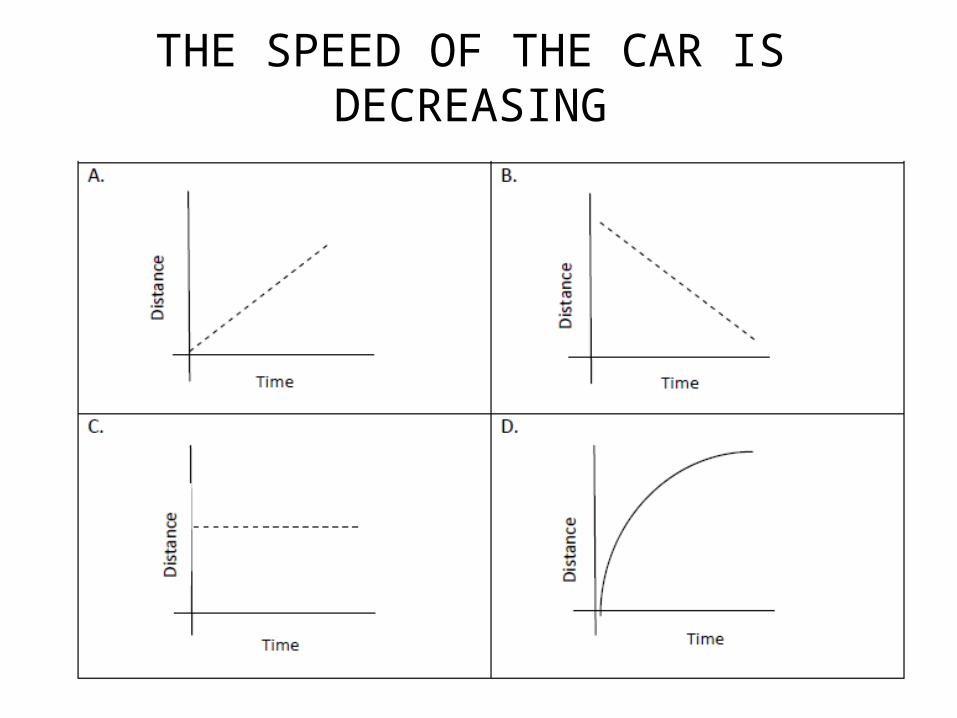
THE SPEED OF THE CAR IS DECREASING
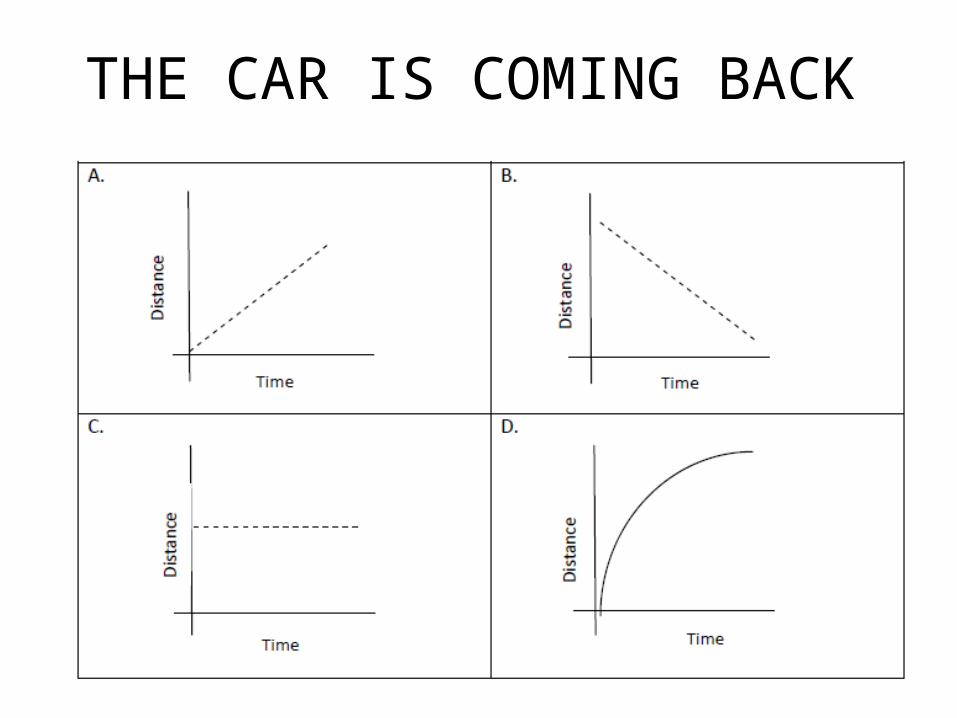
THE CAR IS COMING BACK
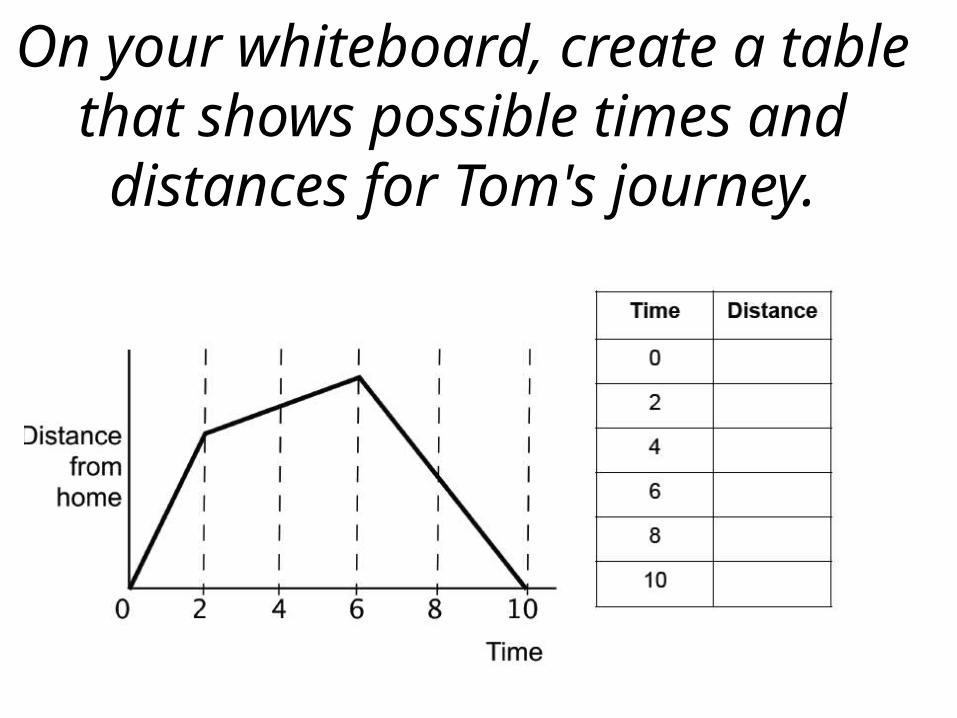
On your whiteboard, create a table that shows possible times and
distances for Tom's journey.
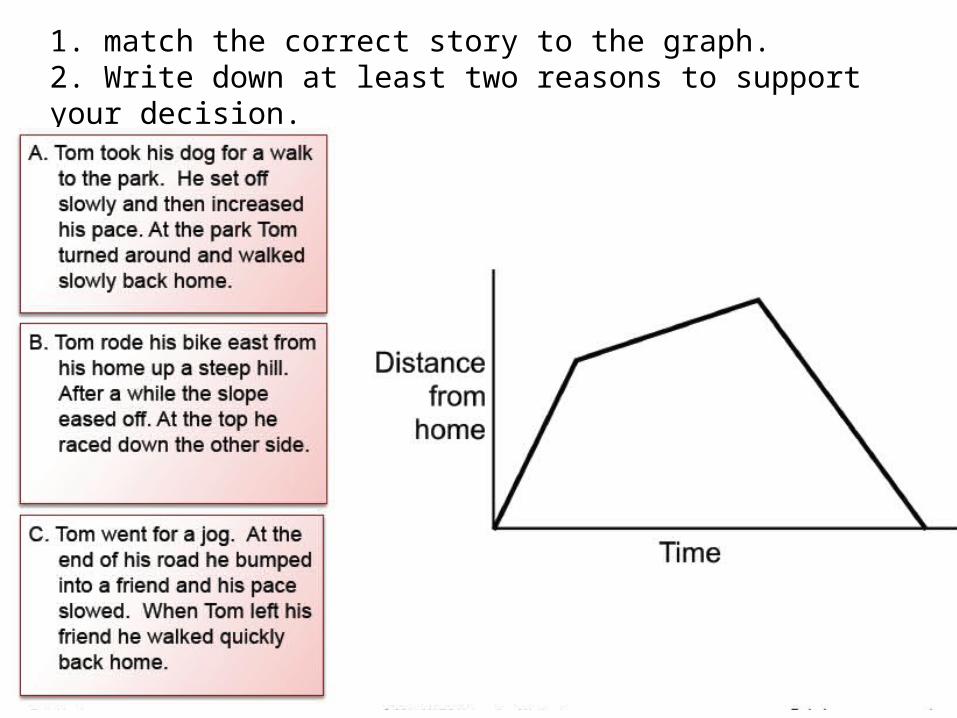
1. match the correct story to the graph. 2. Write down at least two reasons to support your decision.
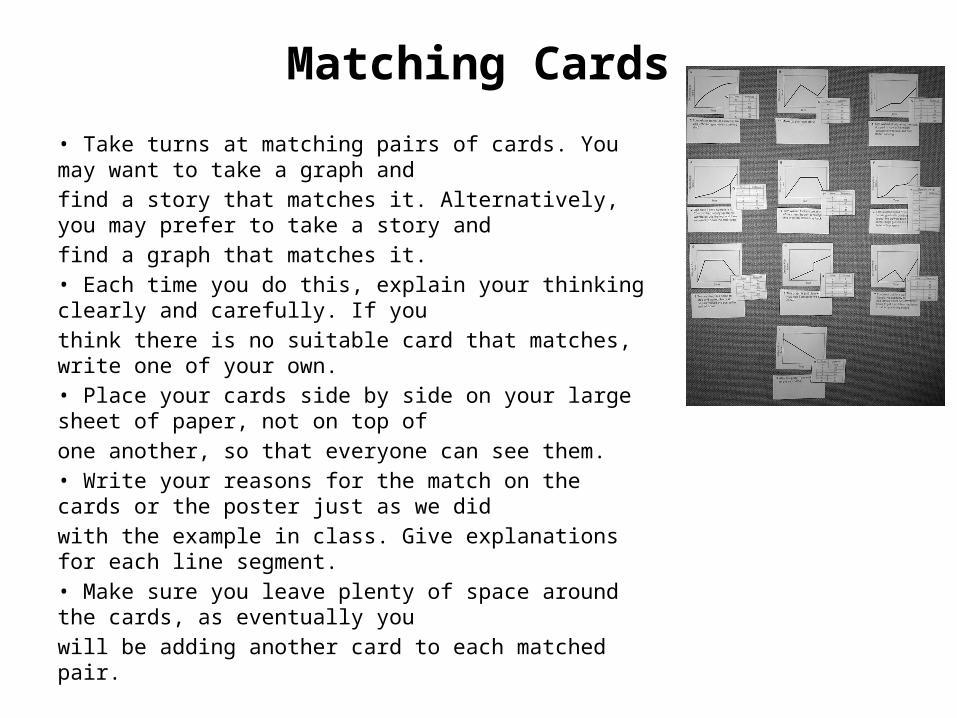
Matching Cards
• Take turns at matching pairs of cards. You may want to take a graph andfind a story that matches it. Alternatively, you may prefer to take a story andfind a graph that matches it.• Each time you do this, explain your thinking clearly and carefully. If youthink there is no suitable card that matches, write one of your own.• Place your cards side by side on your large sheet of paper, not on top ofone another, so that everyone can see them.• Write your reasons for the match on the cards or the poster just as we didwith the example in class. Give explanations for each line segment.• Make sure you leave plenty of space around the cards, as eventually youwill be adding another card to each matched pair.
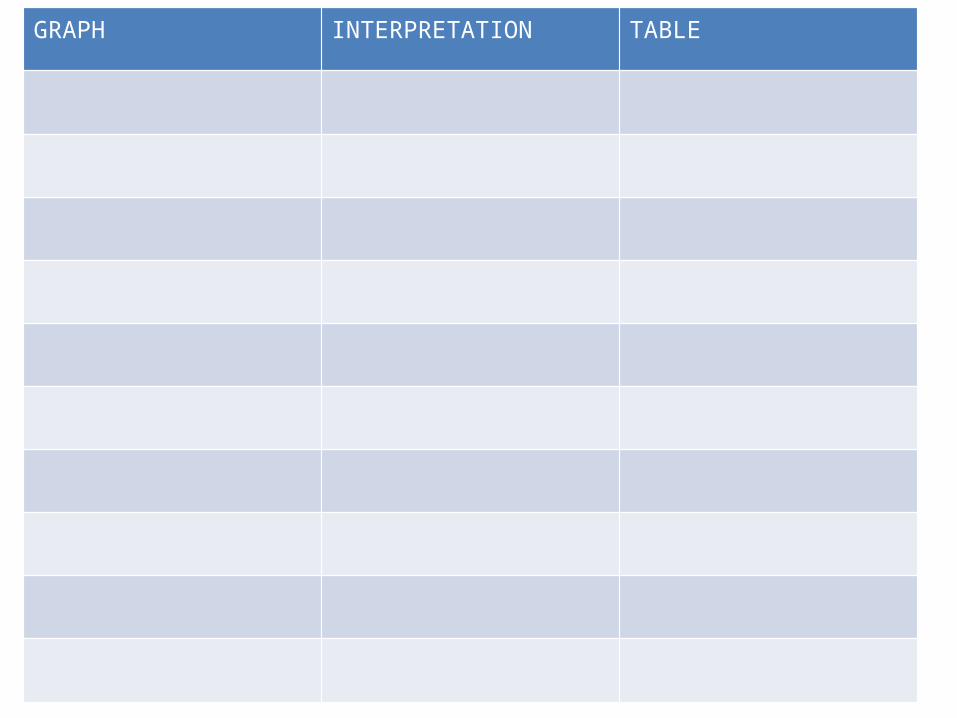
GRAPH INTERPRETATION TABLE

Closing


![Recording Studio - SLQ Wiki [SLQ Wiki]](https://img.pdfslide.us/doc/110x75/61b067815b3f904d2d012f5b/recording-studio-slq-wiki-slq-wiki.jpg)