Embed Size (px)
Citation preview
Review of Zambia’s Petroleum Product Import Parity Pricing Formula
Final Version of Report
to
Indeni Petroleum Refinery Company Ltd.
Zambia
January 2006
Downstream Oil Advisors Ltd.
(near) Vancouver, Canada e-mail : [email protected]

Review of Zambia’s
Petroleum Product Import Parity Pricing Formula
Table of Contents Page Chapter I Introduction 1 Chapter II The principles behind the recommended IPP Formula 4 Chapter III FOB elements of the Formula 5 Chapter IV IPP Formula elements from FOB to CIF Dar es Salaam 8 Chapter V Dar transit costs 10 Chapter VI Cost elements from Dar to Ex-Ndola terminal values 13 Chapter VII Adjustments to Ex-Ndola terminal values 16
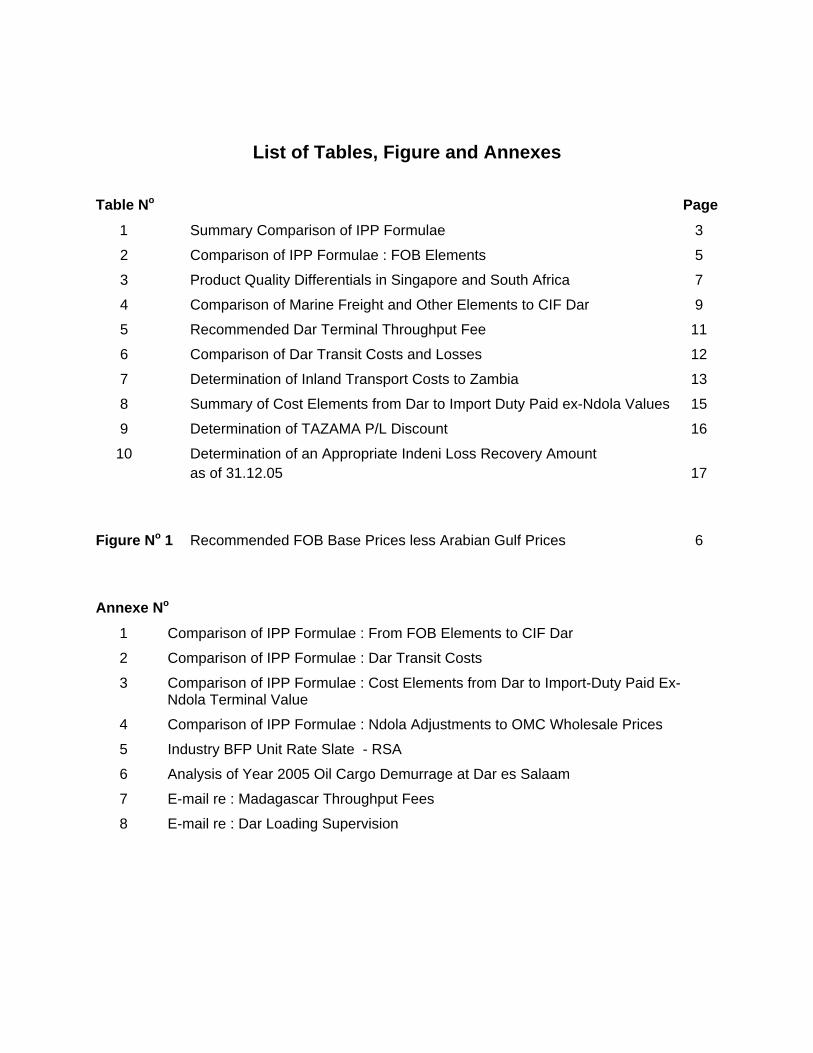
List of Tables, Figure and Annexes
Table No Page
1 Summary Comparison of IPP Formulae 3
2 Comparison of IPP Formulae : FOB Elements 5
3 Product Quality Differentials in Singapore and South Africa 7
4 Comparison of Marine Freight and Other Elements to CIF Dar 9
5 Recommended Dar Terminal Throughput Fee 11
6 Comparison of Dar Transit Costs and Losses 12
7 Determination of Inland Transport Costs to Zambia 13
8 Summary of Cost Elements from Dar to Import Duty Paid ex-Ndola Values 15
9 Determination of TAZAMA P/L Discount 16
10 Determination of an Appropriate Indeni Loss Recovery Amount as of 31.12.05 17 Figure No 1 Recommended FOB Base Prices less Arabian Gulf Prices 6 Annexe No
1 Comparison of IPP Formulae : From FOB Elements to CIF Dar
2 Comparison of IPP Formulae : Dar Transit Costs
3 Comparison of IPP Formulae : Cost Elements from Dar to Import-Duty Paid Ex-Ndola Terminal Value
4 Comparison of IPP Formulae : Ndola Adjustments to OMC Wholesale Prices
5 Industry BFP Unit Rate Slate - RSA
6 Analysis of Year 2005 Oil Cargo Demurrage at Dar es Salaam
7 E-mail re : Madagascar Throughput Fees
8 E-mail re : Dar Loading Supervision
Downstream Oil Advisors Ltd. 1 16/05/2007 (near) Vancouver, Canada e-mail : [email protected]
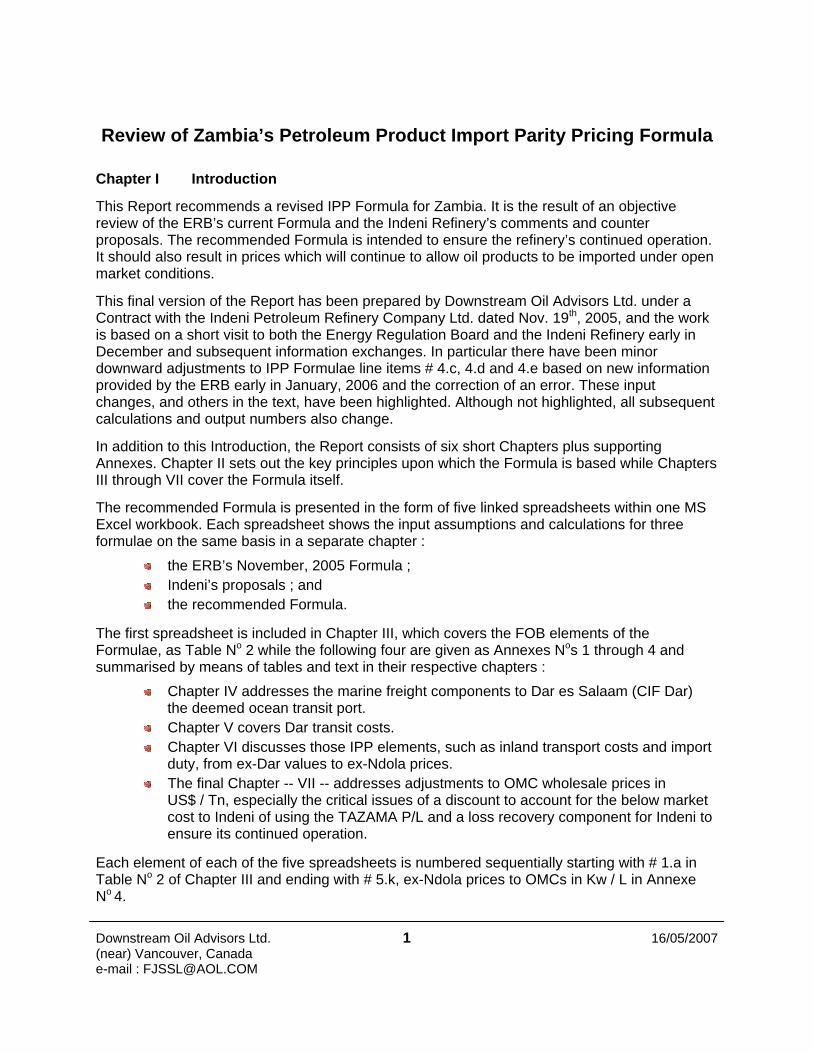
Review of Zambia’s Petroleum Product Import Parity Pricing Formula Chapter I Introduction
This Report recommends a revised IPP Formula for Zambia. It is the result of an objective review of the ERB’s current Formula and the Indeni Refinery’s comments and counter proposals. The recommended Formula is intended to ensure the refinery’s continued operation. It should also result in prices which will continue to allow oil products to be imported under open market conditions.
This final version of the Report has been prepared by Downstream Oil Advisors Ltd. under a Contract with the Indeni Petroleum Refinery Company Ltd. dated Nov. 19th, 2005, and the work is based on a short visit to both the Energy Regulation Board and the Indeni Refinery early in December and subsequent information exchanges. In particular there have been minor downward adjustments to IPP Formulae line items # 4.c, 4.d and 4.e based on new information provided by the ERB early in January, 2006 and the correction of an error. These input changes, and others in the text, have been highlighted. Although not highlighted, all subsequent calculations and output numbers also change.
In addition to this Introduction, the Report consists of six short Chapters plus supporting Annexes. Chapter II sets out the key principles upon which the Formula is based while Chapters III through VII cover the Formula itself.
The recommended Formula is presented in the form of five linked spreadsheets within one MS Excel workbook. Each spreadsheet shows the input assumptions and calculations for three formulae on the same basis in a separate chapter :
the ERB’s November, 2005 Formula ; Indeni’s proposals ; and the recommended Formula.
The first spreadsheet is included in Chapter III, which covers the FOB elements of the Formulae, as Table No 2 while the following four are given as Annexes Nos 1 through 4 and summarised by means of tables and text in their respective chapters :
Chapter IV addresses the marine freight components to Dar es Salaam (CIF Dar) the deemed ocean transit port.
Chapter V covers Dar transit costs. Chapter VI discusses those IPP elements, such as inland transport costs and import
duty, from ex-Dar values to ex-Ndola prices. The final Chapter -- VII -- addresses adjustments to OMC wholesale prices in
US$ / Tn, especially the critical issues of a discount to account for the below market cost to Indeni of using the TAZAMA P/L and a loss recovery component for Indeni to ensure its continued operation.
Each element of each of the five spreadsheets is numbered sequentially starting with # 1.a in Table No 2 of Chapter III and ending with # 5.k, ex-Ndola prices to OMCs in Kw / L in Annexe No 4.

Downstream Oil Advisors Ltd. 2 16/05/2007 (near) Vancouver, Canada e-mail : [email protected]
The same approach is used in Chapters III through VII which set out each component in the IPP build-up in the order in which it occurs in the delivery chain. Typically, the ERB’s position is given, then Indeni’s followed by the Consultant’s recommendation. Supporting rationale is generally given for all three positions. The ERB’s views are taken primarily from their Adjusted Import Parity Approach for November, 2005 and a letter from the ERB to Indeni dated July 11th, 2005. Indeni’s positions are taken from two documents : an un-dated, but recent, Presentation on Import Parity Pricing and a set of tables which compare their understanding of the ERB’s views with their own based on the IPP Formula for September, 2005. The order in which the components are addressed differs slightly from that of the current ERB Formula but each is cross-referenced to the ERB Line reference as used in their IPP approach for November. 1 Key findings & recommendations Overall the recommended Formula results in essentially the same IPP values as proposed by Indeni although there are numerous differences throughout. Table No 1, which summarises the three Formulae, shows that the ex-Ndola prices to OMCs, including taxes, are between 600 Kw / L and 865 Kw / L, or between 15 % and 20 %, higher than the ERB’s November, 2005 Formula. The two most important reasons for the significantly higher recommended IPPs relative to the ERB’s Formula are the proposed change in FOB reference prices away from simply the Arabian Gulf and sharp upward revisions to inland transport costs from Dar to Ndola by road and rail. Together, these account for between 65 % (gasoil) and 75 % (gasoline) of the difference (before excise duties and road levies) between the present ERB Formula and the recommended one. Also, because of the change in FOB locations, marine freight is much higher. Other differences are noted throughout the text. The Consultant is persuaded the above two modifications are justified. The RSA uses this FOB approach to determine their reference prices and the increased inland transport costs, (which surprised the Consultant), are due to several factors :
increased fuel costs for lorries and rail locomotives ; a decline in the US$ relative to other currencies over the past several years ; greater commercial pressures with demand for transport exceeding supply.
Immediate (effective the first or second week of January, 2006 as is normal ERB practice) implementation of the recommended IPP Formula should have only a minor impact on retail prices. Replacing only October FOB reference prices with November 2005 ones would result in gasoline pump prices which are lower by Kw 1,100 / L. However, because of seasonal increases in FOB middle distillate values, gasoil prices would increase by Kw 307 / L or 8 % and
1 These line references differ from those in the ERB’s July 11th letter.

Downstream Oil Advisors Ltd. 3 16/05/2007 (near) Vancouver, Canada e-mail : [email protected]
kerosene prices by Kw 230 / L or 7 %. January prices will be based on December, 2005 averages so it is uncertain what the final impact will be.

Downstream Oil Advisors Ltd. 4 16/05/2007 (near) Vancouver, Canada e-mail : [email protected]
ERB Indeni Recommended Recommended less ERB
FOB reference value in US$ / TnGasoline 532 577 571 39Gasoil 511 511 539 29Kerosene 562 562 594 32
Wholesale price to OMCs before taxes in US$ / TnGasoline 794 1001 959 165Gasoil 768 923 913 146Kerosene 822 983 973 150
Ex Ndola price to OMCs including taxes in Kw / LGasoline 4,175 5,259 5,041 866Gasoil 3,671 4,416 4,367 697Kerosene 3,292 3,934 3,894 602
Recommended Dec FOB less Nov
actualsGasoline -1,106Gasoil + 311Kerosene + 235
Sources : Annexes Nos 1 & 4 and ERB's November worksheet
Memo : Recommended Formula changing only the base FOB reference prices to November averages instead of October
Table No 1
Summary Comparison of IPP Formulaein US$ / Tn
Downstream Oil Advisors Ltd. 5 16/05/2007 (near) Vancouver, Canada e-mail : [email protected]
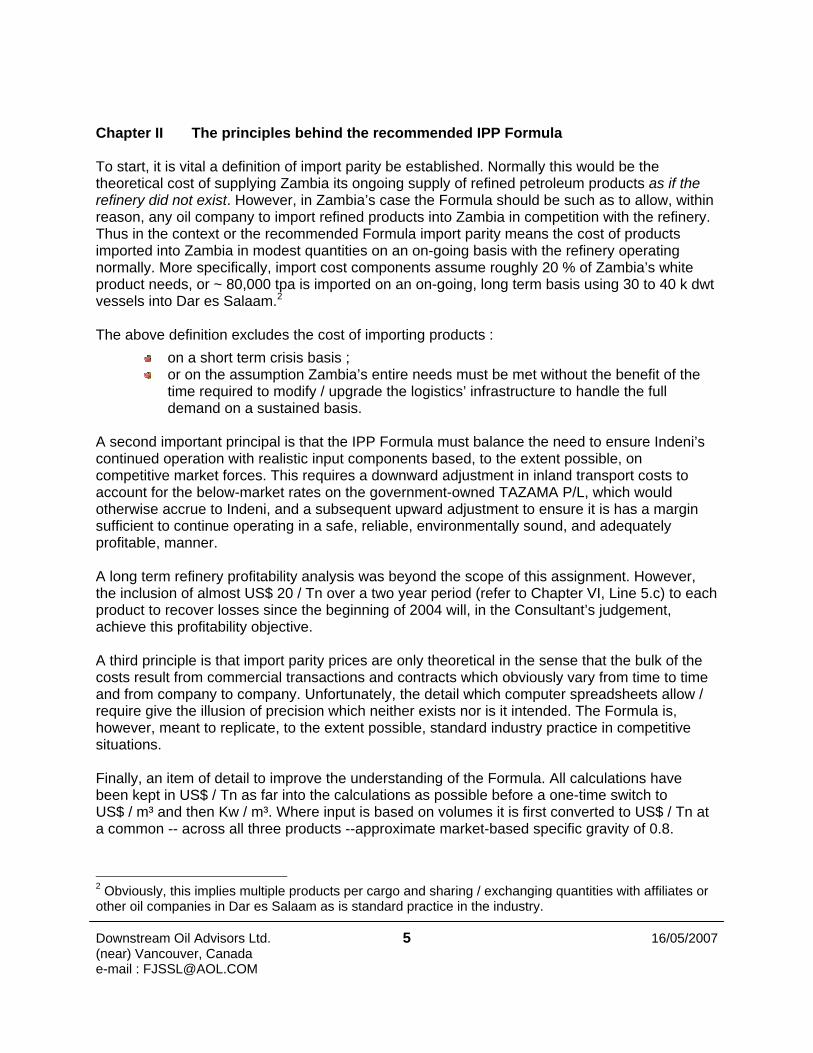
Chapter II The principles behind the recommended IPP Formula To start, it is vital a definition of import parity be established. Normally this would be the theoretical cost of supplying Zambia its ongoing supply of refined petroleum products as if the refinery did not exist. However, in Zambia’s case the Formula should be such as to allow, within reason, any oil company to import refined products into Zambia in competition with the refinery. Thus in the context or the recommended Formula import parity means the cost of products imported into Zambia in modest quantities on an on-going basis with the refinery operating normally. More specifically, import cost components assume roughly 20 % of Zambia’s white product needs, or ~ 80,000 tpa is imported on an on-going, long term basis using 30 to 40 k dwt vessels into Dar es Salaam.2 The above definition excludes the cost of importing products :
on a short term crisis basis ; or on the assumption Zambia’s entire needs must be met without the benefit of the
time required to modify / upgrade the logistics’ infrastructure to handle the full demand on a sustained basis.
A second important principal is that the IPP Formula must balance the need to ensure Indeni’s continued operation with realistic input components based, to the extent possible, on competitive market forces. This requires a downward adjustment in inland transport costs to account for the below-market rates on the government-owned TAZAMA P/L, which would otherwise accrue to Indeni, and a subsequent upward adjustment to ensure it is has a margin sufficient to continue operating in a safe, reliable, environmentally sound, and adequately profitable, manner. A long term refinery profitability analysis was beyond the scope of this assignment. However, the inclusion of almost US$ 20 / Tn over a two year period (refer to Chapter VI, Line 5.c) to each product to recover losses since the beginning of 2004 will, in the Consultant’s judgement, achieve this profitability objective. A third principle is that import parity prices are only theoretical in the sense that the bulk of the costs result from commercial transactions and contracts which obviously vary from time to time and from company to company. Unfortunately, the detail which computer spreadsheets allow / require give the illusion of precision which neither exists nor is it intended. The Formula is, however, meant to replicate, to the extent possible, standard industry practice in competitive situations. Finally, an item of detail to improve the understanding of the Formula. All calculations have been kept in US$ / Tn as far into the calculations as possible before a one-time switch to US$ / m³ and then Kw / m³. Where input is based on volumes it is first converted to US$ / Tn at a common -- across all three products --approximate market-based specific gravity of 0.8.
2 Obviously, this implies multiple products per cargo and sharing / exchanging quantities with affiliates or other oil companies in Dar es Salaam as is standard practice in the industry.
Downstream Oil Advisors Ltd. 6 16/05/2007 (near) Vancouver, Canada e-mail : [email protected]
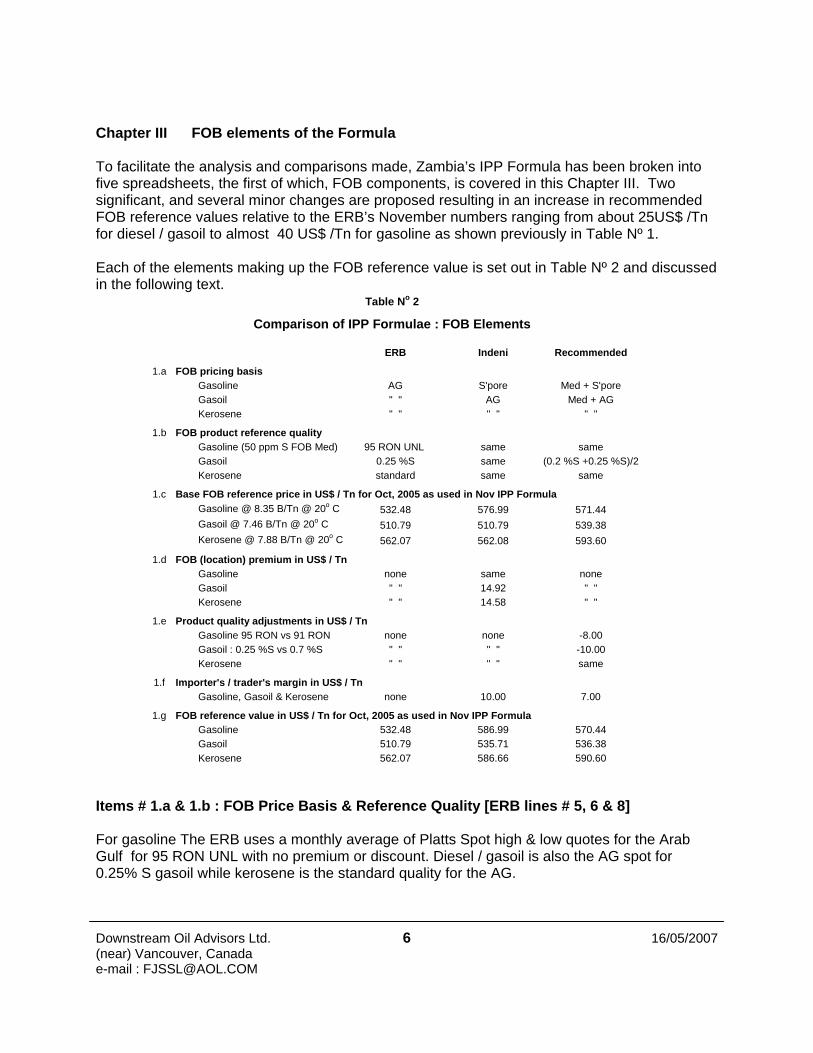
ERB Indeni Recommended
1.a FOB pricing basisGasoline AG S'pore Med + S'poreGasoil " " AG Med + AGKerosene " " " " " "
1.b FOB product reference qualityGasoline (50 ppm S FOB Med) 95 RON UNL same sameGasoil 0.25 %S same (0.2 %S +0.25 %S)/2Kerosene standard same same
1.c Base FOB reference price in US$ / Tn for Oct, 2005 as used in Nov IPP FormulaGasoline @ 8.35 B/Tn @ 20o C 532.48 576.99 571.44Gasoil @ 7.46 B/Tn @ 20o C 510.79 510.79 539.38Kerosene @ 7.88 B/Tn @ 20o C 562.07 562.08 593.60
1.d FOB (location) premium in US$ / TnGasoline none same noneGasoil " " 14.92 " "Kerosene " " 14.58 " "
1.e Product quality adjustments in US$ / TnGasoline 95 RON vs 91 RON none none -8.00Gasoil : 0.25 %S vs 0.7 %S " " " " -10.00Kerosene " " " " same
1.f Importer's / trader's margin in US$ / TnGasoline, Gasoil & Kerosene none 10.00 7.00
1.g FOB reference value in US$ / Tn for Oct, 2005 as used in Nov IPP FormulaGasoline 532.48 586.99 570.44Gasoil 510.79 535.71 536.38Kerosene 562.07 586.66 590.60
Comparison of IPP Formulae : FOB Elements
Table No 2
Chapter III FOB elements of the Formula To facilitate the analysis and comparisons made, Zambia’s IPP Formula has been broken into five spreadsheets, the first of which, FOB components, is covered in this Chapter III. Two significant, and several minor changes are proposed resulting in an increase in recommended FOB reference values relative to the ERB’s November numbers ranging from about 25US$ /Tn for diesel / gasoil to almost 40 US$ /Tn for gasoline as shown previously in Table Nº 1. Each of the elements making up the FOB reference value is set out in Table Nº 2 and discussed in the following text. Items # 1.a & 1.b : FOB Price Basis & Reference Quality [ERB lines # 5, 6 & 8] For gasoline The ERB uses a monthly average of Platts Spot high & low quotes for the Arab Gulf for 95 RON UNL with no premium or discount. Diesel / gasoil is also the AG spot for 0.25% S gasoil while kerosene is the standard quality for the AG.
Downstream Oil Advisors Ltd. 7 16/05/2007 (near) Vancouver, Canada e-mail : [email protected]
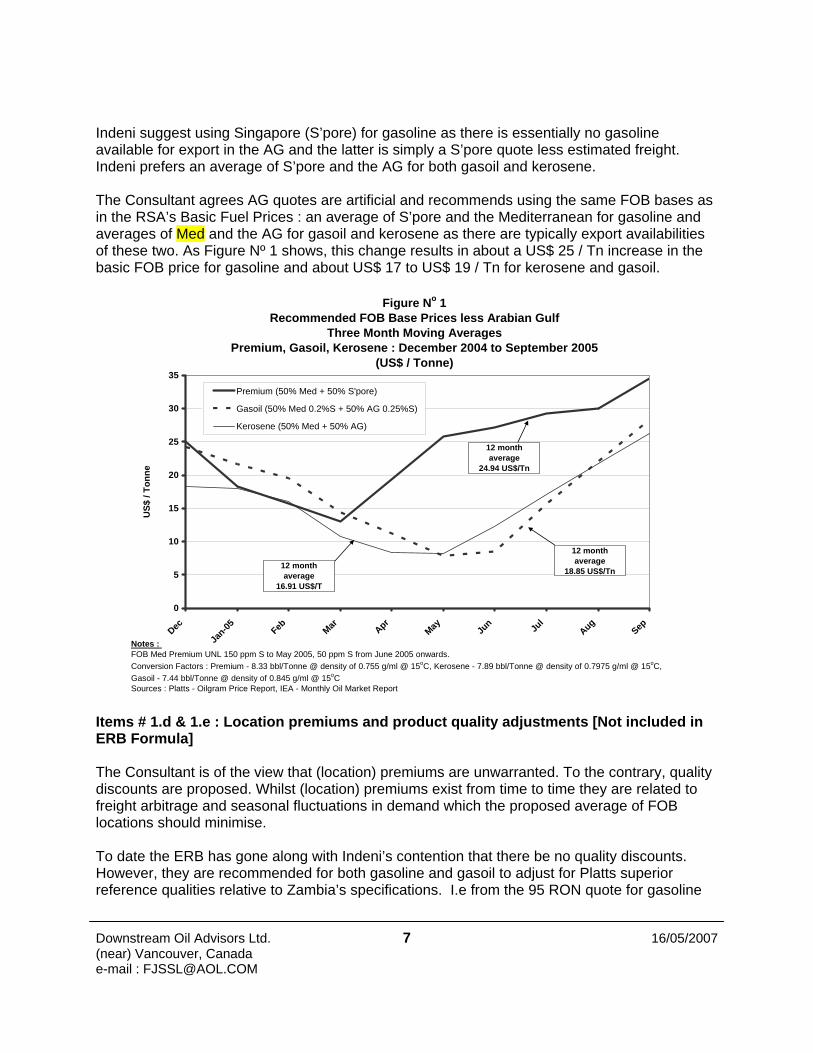
Figure No 1Recommended FOB Base Prices less Arabian Gulf
Three Month Moving AveragesPremium, Gasoil, Kerosene : December 2004 to September 2005
(US$ / Tonne)
0
5
10
15
20
25
30
35
Dec
Jan-05 Feb Mar Apr
May Jun Ju
lAug
Sep
US$
/ To
nne
Premium (50% Med + 50% S'pore)
Gasoil (50% Med 0.2%S + 50% AG 0.25%S)
Kerosene (50% Med + 50% AG)
Notes : FOB Med Premium UNL 150 ppm S to May 2005, 50 ppm S from June 2005 onwards.Conversion Factors : Premium - 8.33 bbl/Tonne @ density of 0.755 g/ml @ 15oC, Kerosene - 7.89 bbl/Tonne @ density of 0.7975 g/ml @ 15oC,Gasoil - 7.44 bbl/Tonne @ density of 0.845 g/ml @ 15oCSources : Platts - Oilgram Price Report, IEA - Monthly Oil Market Report
12 month average
24.94 US$/Tn
12 month average
18.85 US$/Tn12 month average
16.91 US$/T
Indeni suggest using Singapore (S’pore) for gasoline as there is essentially no gasoline available for export in the AG and the latter is simply a S’pore quote less estimated freight. Indeni prefers an average of S’pore and the AG for both gasoil and kerosene. The Consultant agrees AG quotes are artificial and recommends using the same FOB bases as in the RSA’s Basic Fuel Prices : an average of S’pore and the Mediterranean for gasoline and averages of Med and the AG for gasoil and kerosene as there are typically export availabilities of these two. As Figure Nº 1 shows, this change results in about a US$ 25 / Tn increase in the basic FOB price for gasoline and about US$ 17 to US$ 19 / Tn for kerosene and gasoil. Items # 1.d & 1.e : Location premiums and product quality adjustments [Not included in ERB Formula] The Consultant is of the view that (location) premiums are unwarranted. To the contrary, quality discounts are proposed. Whilst (location) premiums exist from time to time they are related to freight arbitrage and seasonal fluctuations in demand which the proposed average of FOB locations should minimise. To date the ERB has gone along with Indeni’s contention that there be no quality discounts. However, they are recommended for both gasoline and gasoil to adjust for Platts superior reference qualities relative to Zambia’s specifications. I.e from the 95 RON quote for gasoline
Downstream Oil Advisors Ltd. 8 16/05/2007 (near) Vancouver, Canada e-mail : [email protected]
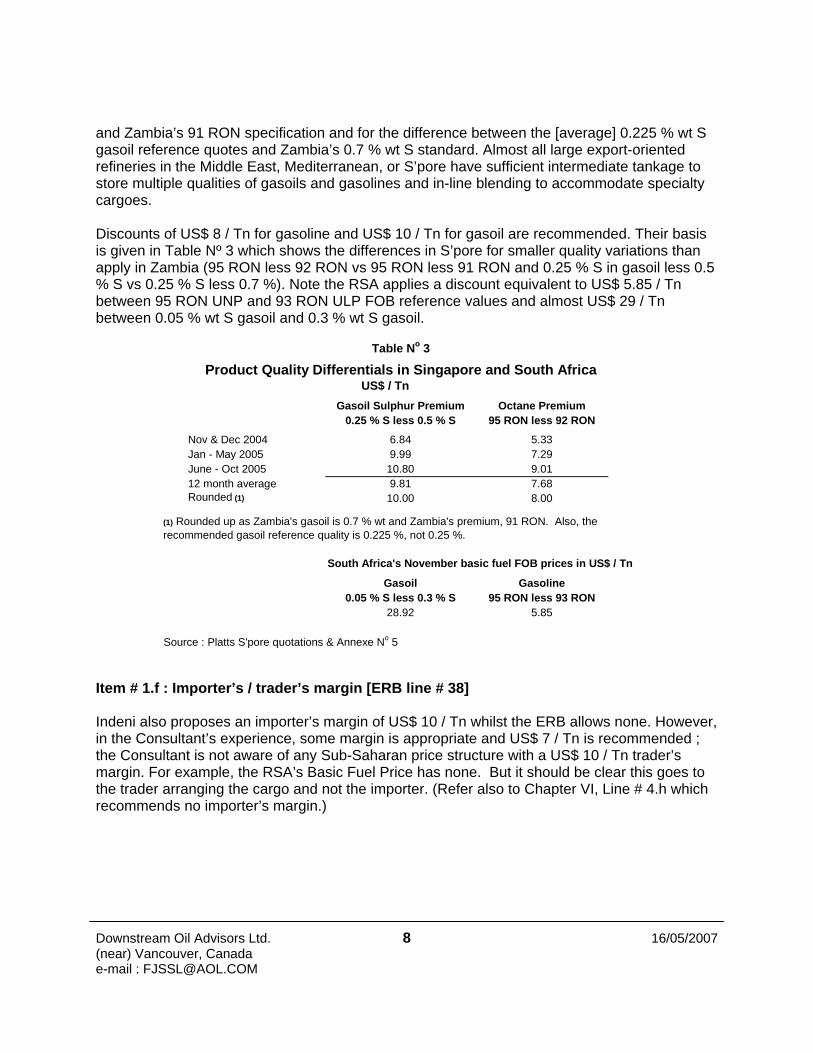
Gasoil Sulphur Premium Octane Premium0.25 % S less 0.5 % S 95 RON less 92 RON
Nov & Dec 2004 6.84 5.33Jan - May 2005 9.99 7.29June - Oct 2005 10.80 9.0112 month average 9.81 7.68Rounded (1) 10.00 8.00
South Africa's November basic fuel FOB prices in US$ / Tn
Gasoil Gasoline0.05 % S less 0.3 % S 95 RON less 93 RON
28.92 5.85
Source : Platts S'pore quotations & Annexe No 5
Table No 3
Product Quality Differentials in Singapore and South AfricaUS$ / Tn
(1) Rounded up as Zambia's gasoil is 0.7 % wt and Zambia's premium, 91 RON. Also, the recommended gasoil reference quality is 0.225 %, not 0.25 %.
and Zambia’s 91 RON specification and for the difference between the [average] 0.225 % wt S gasoil reference quotes and Zambia’s 0.7 % wt S standard. Almost all large export-oriented refineries in the Middle East, Mediterranean, or S’pore have sufficient intermediate tankage to store multiple qualities of gasoils and gasolines and in-line blending to accommodate specialty cargoes. Discounts of US$ 8 / Tn for gasoline and US$ 10 / Tn for gasoil are recommended. Their basis is given in Table Nº 3 which shows the differences in S’pore for smaller quality variations than apply in Zambia (95 RON less 92 RON vs 95 RON less 91 RON and 0.25 % S in gasoil less 0.5 % S vs 0.25 % S less 0.7 %). Note the RSA applies a discount equivalent to US$ 5.85 / Tn between 95 RON UNP and 93 RON ULP FOB reference values and almost US$ 29 / Tn between 0.05 % wt S gasoil and 0.3 % wt S gasoil. Item # 1.f : Importer’s / trader’s margin [ERB line # 38] Indeni also proposes an importer’s margin of US$ 10 / Tn whilst the ERB allows none. However, in the Consultant’s experience, some margin is appropriate and US$ 7 / Tn is recommended ; the Consultant is not aware of any Sub-Saharan price structure with a US$ 10 / Tn trader’s margin. For example, the RSA’s Basic Fuel Price has none. But it should be clear this goes to the trader arranging the cargo and not the importer. (Refer also to Chapter VI, Line # 4.h which recommends no importer’s margin.)
Downstream Oil Advisors Ltd. 9 16/05/2007 (near) Vancouver, Canada e-mail : [email protected]
Chapter IV IPP Formula elements from FOB to CIF Dar es Salaam This Chapter covers the several elements in the IPP Formula to move from FOB reference values to CIF Dar prices. These are set out in spreadsheet #2 given as Annexe No 1. Direct marine freight accounts for approximately 75 % of these costs in US$ / Tn ; letter of credit costs, insurance, handling charges and demurrage make up the balance in all three Formulae. Items # 2.a through 2.f : Freight [ERB lines # 10 through 12] No change is suggested for the basic Worldscale reference freight from the source ports to Dar es Salaam. However, the ERB is not comfortable with Indeni applying the monthly spot freight rate adjustments from Platts Clean Tankerwire for routes which are not quoted, such as S’pore to Dar es Salaam. The Consultant has no such concern. Items # 2.h & 2.i : Insurance, ocean losses and letter of credit costs [ERB lines # 14 & 15] Both Indeni and the Consultant accept the ERB’s percentage rates for ocean losses and insurance applied to C&F Dar values. Likewise for T.H.A. wharfage fees @ 1.25 % of C&F and handling charges of US$ 0.85 / Tn. A letter of credit charge, at 0.3 % of C&F Dar values is, however, recommended, as a minor replacement for the importers margin. (Refer to Chapter V, item # 4.h and ERB Line Reference # 38.) In the Consultant’s experience LC charges are not included in the 0.15 % ocean loss. The rate is based on information provided by Barclay’s & Standard Chartered banks in Lusaka. One advised rates in the range of 0.5 % to 2.0 % par quarter from which reductions could be negotiated depending on the amount of business given to the bank and the “quality” of the importer. The second offered rates between 0.75 % and 1.0 % per quarter. To achieve a LC rate of 0.3 % a Zambian importer would have to apply the LC facility across at least two cargoes (into Tanzania, the DRC or Zambia) per quarter ; but this is reasonable. Item # 2.k : Demurrage [ERB line # 17] The ERB uses 3.5 days demurrage at Dar and has been reluctant to accept Indeni’s request for 6.7 days until it has been able to independently verify the data source. Following discussions with TAZAMA P/L, the Consultant is, however, persuaded there is serious congestion at Dar. Based on an analysis of Sturrock Shipping Data for Dar from January through April 2005, given in Annex No 6 and which excludes vegetable oil cargoes, 6.5 demurrage days is recommended.
Downstream Oil Advisors Ltd. 10 16/05/2007 (near) Vancouver, Canada e-mail : [email protected]
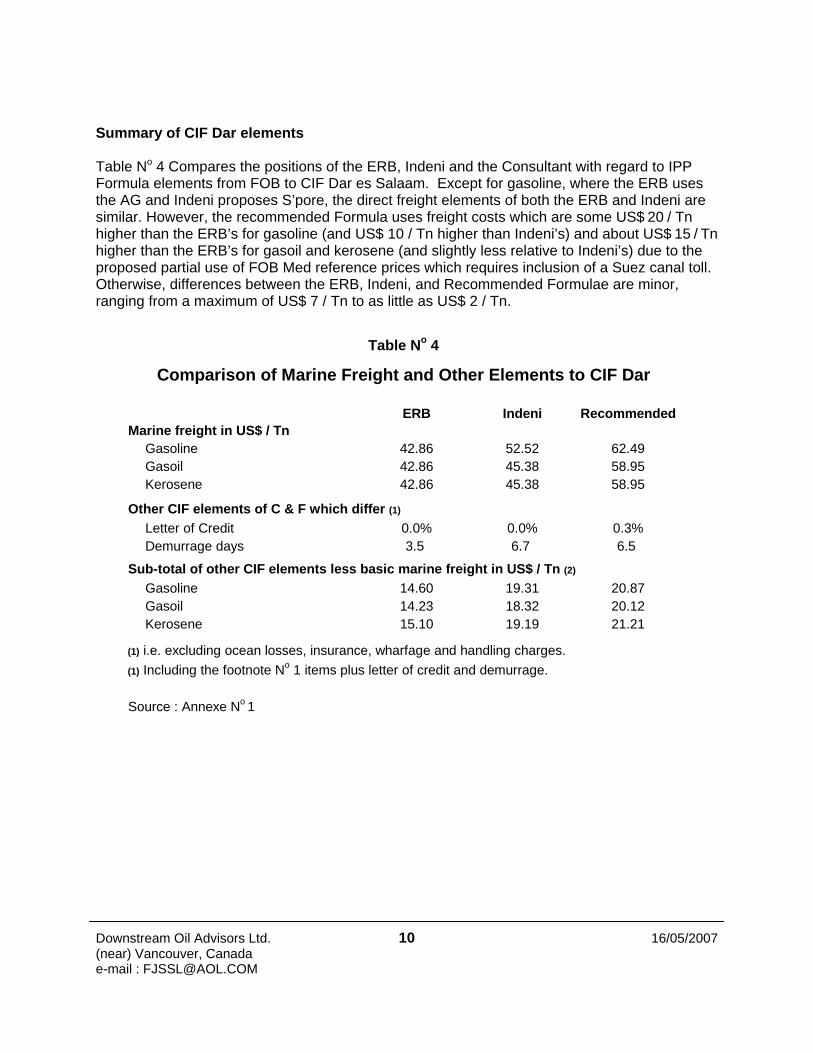
ERB Indeni RecommendedMarine freight in US$ / Tn
Gasoline 42.86 52.52 62.49Gasoil 42.86 45.38 58.95Kerosene 42.86 45.38 58.95
Other CIF elements of C & F which differ (1)
Letter of Credit 0.0% 0.0% 0.3%Demurrage days 3.5 6.7 6.5
Sub-total of other CIF elements less basic marine freight in US$ / Tn (2)
Gasoline 14.60 19.31 20.87Gasoil 14.23 18.32 20.12Kerosene 15.10 19.19 21.21
(1) i.e. excluding ocean losses, insurance, wharfage and handling charges.(1) Including the footnote No 1 items plus letter of credit and demurrage.
Source : Annexe No 1
Table No 4
Comparison of Marine Freight and Other Elements to CIF Dar
Summary of CIF Dar elements Table No 4 Compares the positions of the ERB, Indeni and the Consultant with regard to IPP Formula elements from FOB to CIF Dar es Salaam. Except for gasoline, where the ERB uses the AG and Indeni proposes S’pore, the direct freight elements of both the ERB and Indeni are similar. However, the recommended Formula uses freight costs which are some US$ 20 / Tn higher than the ERB’s for gasoline (and US$ 10 / Tn higher than Indeni’s) and about US$ 15 / Tn higher than the ERB’s for gasoil and kerosene (and slightly less relative to Indeni’s) due to the proposed partial use of FOB Med reference prices which requires inclusion of a Suez canal toll. Otherwise, differences between the ERB, Indeni, and Recommended Formulae are minor, ranging from a maximum of US$ 7 / Tn to as little as US$ 2 / Tn.
Downstream Oil Advisors Ltd. 11 16/05/2007 (near) Vancouver, Canada e-mail : [email protected]
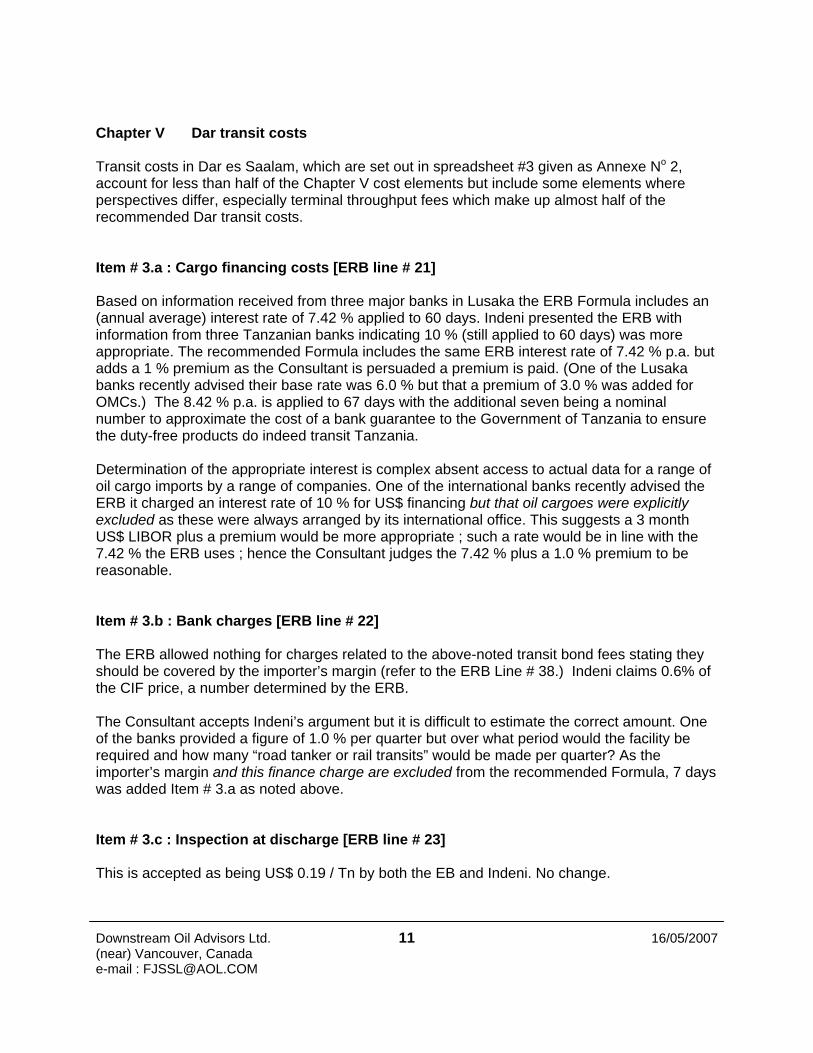
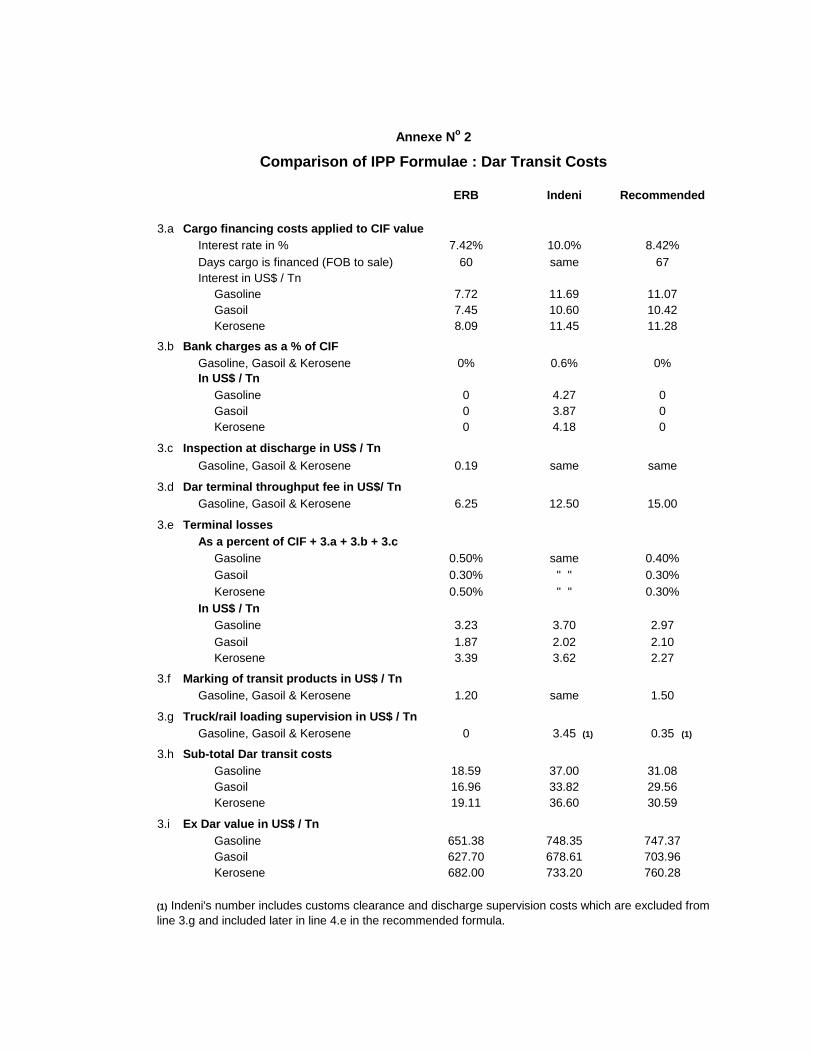
Chapter V Dar transit costs Transit costs in Dar es Saalam, which are set out in spreadsheet #3 given as Annexe No 2, account for less than half of the Chapter V cost elements but include some elements where perspectives differ, especially terminal throughput fees which make up almost half of the recommended Dar transit costs. Item # 3.a : Cargo financing costs [ERB line # 21] Based on information received from three major banks in Lusaka the ERB Formula includes an (annual average) interest rate of 7.42 % applied to 60 days. Indeni presented the ERB with information from three Tanzanian banks indicating 10 % (still applied to 60 days) was more appropriate. The recommended Formula includes the same ERB interest rate of 7.42 % p.a. but adds a 1 % premium as the Consultant is persuaded a premium is paid. (One of the Lusaka banks recently advised their base rate was 6.0 % but that a premium of 3.0 % was added for OMCs.) The 8.42 % p.a. is applied to 67 days with the additional seven being a nominal number to approximate the cost of a bank guarantee to the Government of Tanzania to ensure the duty-free products do indeed transit Tanzania. Determination of the appropriate interest is complex absent access to actual data for a range of oil cargo imports by a range of companies. One of the international banks recently advised the ERB it charged an interest rate of 10 % for US$ financing but that oil cargoes were explicitly excluded as these were always arranged by its international office. This suggests a 3 month US$ LIBOR plus a premium would be more appropriate ; such a rate would be in line with the 7.42 % the ERB uses ; hence the Consultant judges the 7.42 % plus a 1.0 % premium to be reasonable. Item # 3.b : Bank charges [ERB line # 22] The ERB allowed nothing for charges related to the above-noted transit bond fees stating they should be covered by the importer’s margin (refer to the ERB Line # 38.) Indeni claims 0.6% of the CIF price, a number determined by the ERB. The Consultant accepts Indeni’s argument but it is difficult to estimate the correct amount. One of the banks provided a figure of 1.0 % per quarter but over what period would the facility be required and how many “road tanker or rail transits” would be made per quarter? As the importer’s margin and this finance charge are excluded from the recommended Formula, 7 days was added Item # 3.a as noted above. Item # 3.c : Inspection at discharge [ERB line # 23] This is accepted as being US$ 0.19 / Tn by both the EB and Indeni. No change.
Downstream Oil Advisors Ltd. 12 16/05/2007 (near) Vancouver, Canada e-mail : [email protected]
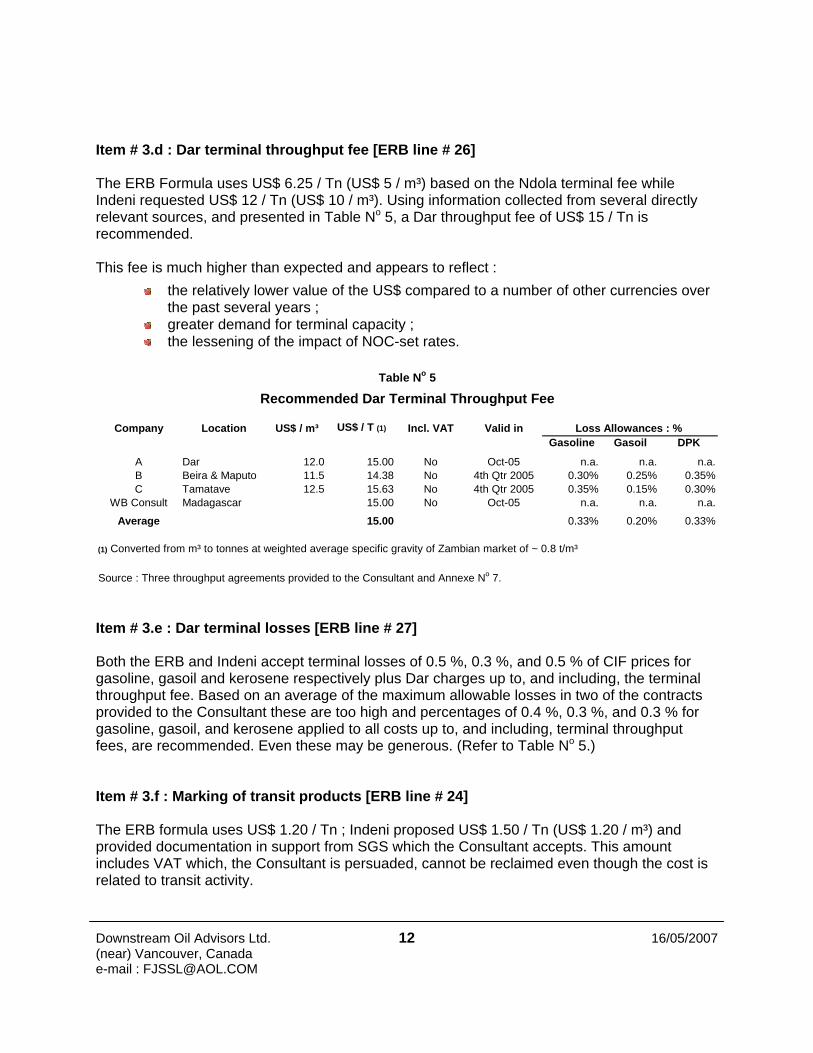
Company Location US$ / m³ US$ / T (1) Incl. VAT Valid inGasoline Gasoil DPK
A Dar 12.0 15.00 No Oct-05 n.a. n.a. n.a.B Beira & Maputo 11.5 14.38 No 4th Qtr 2005 0.30% 0.25% 0.35%C Tamatave 12.5 15.63 No 4th Qtr 2005 0.35% 0.15% 0.30%
WB Consult Madagascar 15.00 No Oct-05 n.a. n.a. n.a.
Average 15.00 0.33% 0.20% 0.33%
(1) Converted from m³ to tonnes at weighted average specific gravity of Zambian market of ~ 0.8 t/m³
Source : Three throughput agreements provided to the Consultant and Annexe No 7.
Loss Allowances : %
Recommended Dar Terminal Throughput FeeTable No 5
Item # 3.d : Dar terminal throughput fee [ERB line # 26] The ERB Formula uses US$ 6.25 / Tn (US$ 5 / m³) based on the Ndola terminal fee while Indeni requested US$ 12 / Tn (US$ 10 / m³). Using information collected from several directly relevant sources, and presented in Table No 5, a Dar throughput fee of US$ 15 / Tn is recommended. This fee is much higher than expected and appears to reflect :
the relatively lower value of the US$ compared to a number of other currencies over the past several years ;
greater demand for terminal capacity ; the lessening of the impact of NOC-set rates.
Item # 3.e : Dar terminal losses [ERB line # 27] Both the ERB and Indeni accept terminal losses of 0.5 %, 0.3 %, and 0.5 % of CIF prices for gasoline, gasoil and kerosene respectively plus Dar charges up to, and including, the terminal throughput fee. Based on an average of the maximum allowable losses in two of the contracts provided to the Consultant these are too high and percentages of 0.4 %, 0.3 %, and 0.3 % for gasoline, gasoil, and kerosene applied to all costs up to, and including, terminal throughput fees, are recommended. Even these may be generous. (Refer to Table No 5.) Item # 3.f : Marking of transit products [ERB line # 24] The ERB formula uses US$ 1.20 / Tn ; Indeni proposed US$ 1.50 / Tn (US$ 1.20 / m³) and provided documentation in support from SGS which the Consultant accepts. This amount includes VAT which, the Consultant is persuaded, cannot be reclaimed even though the cost is related to transit activity.
Downstream Oil Advisors Ltd. 13 16/05/2007 (near) Vancouver, Canada e-mail : [email protected]
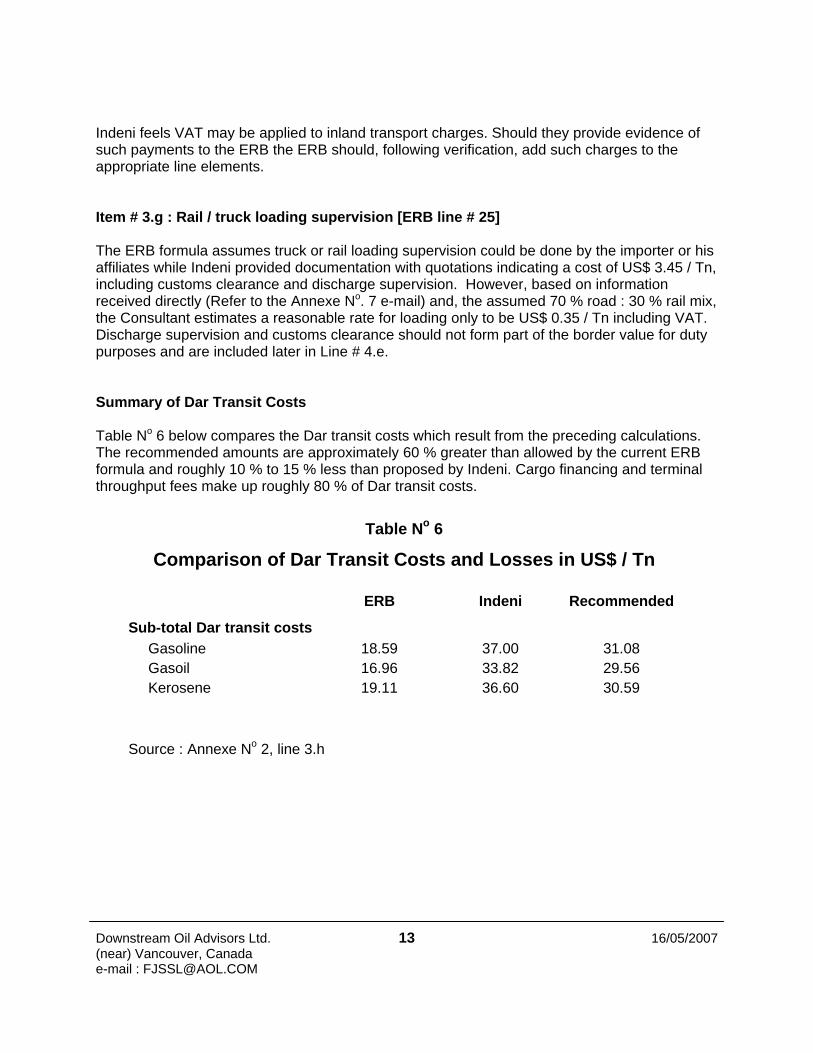
ERB Indeni Recommended
Sub-total Dar transit costsGasoline 18.59 37.00 31.08Gasoil 16.96 33.82 29.56Kerosene 19.11 36.60 30.59
Source : Annexe No 2, line 3.h
Table No 6
Comparison of Dar Transit Costs and Losses in US$ / Tn
Indeni feels VAT may be applied to inland transport charges. Should they provide evidence of such payments to the ERB the ERB should, following verification, add such charges to the appropriate line elements. Item # 3.g : Rail / truck loading supervision [ERB line # 25] The ERB formula assumes truck or rail loading supervision could be done by the importer or his affiliates while Indeni provided documentation with quotations indicating a cost of US$ 3.45 / Tn, including customs clearance and discharge supervision. However, based on information received directly (Refer to the Annexe No. 7 e-mail) and, the assumed 70 % road : 30 % rail mix, the Consultant estimates a reasonable rate for loading only to be US$ 0.35 / Tn including VAT. Discharge supervision and customs clearance should not form part of the border value for duty purposes and are included later in Line # 4.e. Summary of Dar Transit Costs Table No 6 below compares the Dar transit costs which result from the preceding calculations. The recommended amounts are approximately 60 % greater than allowed by the current ERB formula and roughly 10 % to 15 % less than proposed by Indeni. Cargo financing and terminal throughput fees make up roughly 80 % of Dar transit costs.
Downstream Oil Advisors Ltd. 14 16/05/2007 (near) Vancouver, Canada e-mail : [email protected]
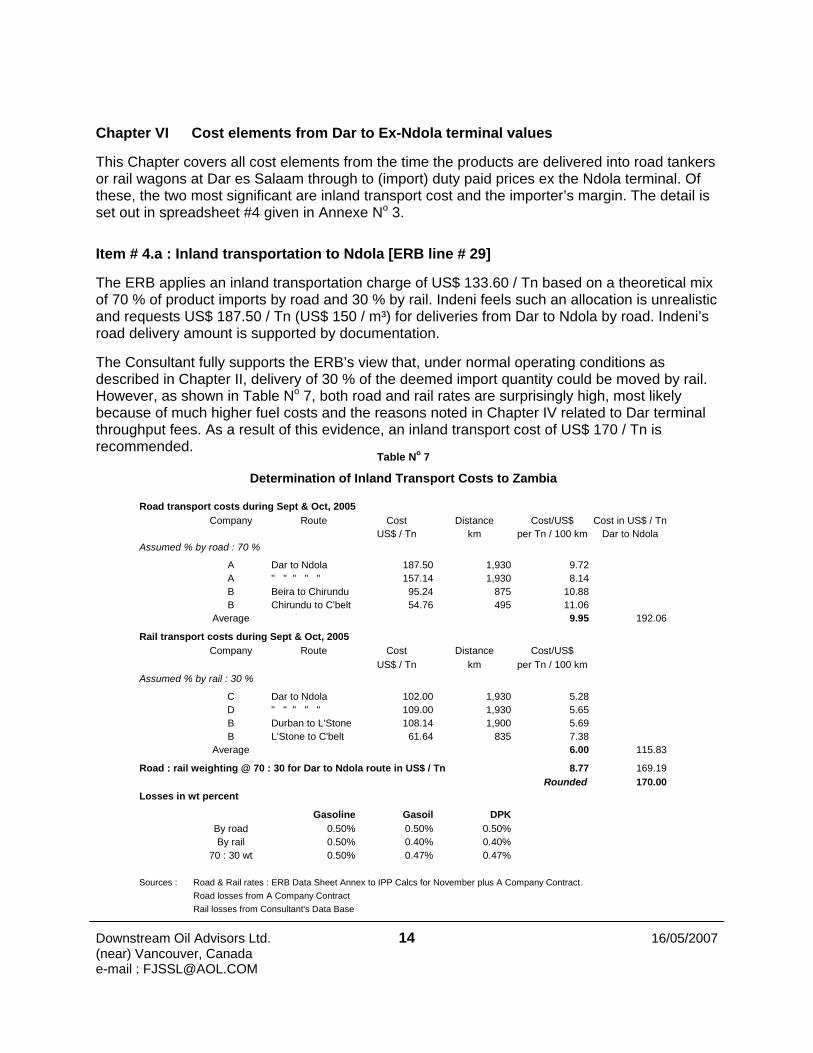
Road transport costs during Sept & Oct, 2005Company Route Cost Distance Cost/US$ Cost in US$ / Tn
US$ / Tn km per Tn / 100 km Dar to NdolaAssumed % by road : 70 %
A Dar to Ndola 187.50 1,930 9.72A " " " " " 157.14 1,930 8.14B Beira to Chirundu 95.24 875 10.88B Chirundu to C'belt 54.76 495 11.06
Average 9.95 192.06
Rail transport costs during Sept & Oct, 2005Company Route Cost Distance Cost/US$
US$ / Tn km per Tn / 100 kmAssumed % by rail : 30 %
C Dar to Ndola 102.00 1,930 5.28D " " " " " 109.00 1,930 5.65B Durban to L'Stone 108.14 1,900 5.69B L'Stone to C'belt 61.64 835 7.38
Average 6.00 115.83
Road : rail weighting @ 70 : 30 for Dar to Ndola route in US$ / Tn 8.77 169.19Rounded 170.00
Losses in wt percent
Gasoline Gasoil DPKBy road 0.50% 0.50% 0.50%By rail 0.50% 0.40% 0.40%
70 : 30 wt 0.50% 0.47% 0.47%
Sources : Road & Rail rates : ERB Data Sheet Annex to IPP Calcs for November plus A Company Contract.Road losses from A Company ContractRail losses from Consultant's Data Base
Table No 7
Determination of Inland Transport Costs to Zambia
Chapter VI Cost elements from Dar to Ex-Ndola terminal values This Chapter covers all cost elements from the time the products are delivered into road tankers or rail wagons at Dar es Salaam through to (import) duty paid prices ex the Ndola terminal. Of these, the two most significant are inland transport cost and the importer’s margin. The detail is set out in spreadsheet #4 given in Annexe No 3. Item # 4.a : Inland transportation to Ndola [ERB line # 29] The ERB applies an inland transportation charge of US$ 133.60 / Tn based on a theoretical mix of 70 % of product imports by road and 30 % by rail. Indeni feels such an allocation is unrealistic and requests US$ 187.50 / Tn (US$ 150 / m³) for deliveries from Dar to Ndola by road. Indeni’s road delivery amount is supported by documentation. The Consultant fully supports the ERB’s view that, under normal operating conditions as described in Chapter II, delivery of 30 % of the deemed import quantity could be moved by rail. However, as shown in Table No 7, both road and rail rates are surprisingly high, most likely because of much higher fuel costs and the reasons noted in Chapter IV related to Dar terminal throughput fees. As a result of this evidence, an inland transport cost of US$ 170 / Tn is recommended.
Downstream Oil Advisors Ltd. 15 16/05/2007 (near) Vancouver, Canada e-mail : [email protected]
Item # 4.b : Inland transport losses to Ndola [ERB line # 30] The ERB applies 0.5 %, 0.3 %, and 0.3 % to ex-Dar costs for gasoline, gasoil and kerosene respectively, to obtain transport losses in US$ / Tn. Indeni proposes 0.8 %, 0.3 %, and 0.5 %. Based on the information presented in Table No 7, losses of 0.5 % are recommended for all three products. These percentages should be applied to the ex-Dar values. Item # 4.c : Import duty @ 5 % of border value [ERB line # 33 & # 34] There is no debate about the rate of duty, only the base border value to which the duty should be applied. The ERB excludes finance charges, marking costs, and losses while Indeni claims it should be the (before duty) delivered price to Ndola less 50 % of the transport cost (as the Zambian / Tanzanian border is approximately half way between Dar and Ndola). While the Zambia Revenue Authority intends that the full border value of the imported goods be the dutiable base it is not practical to include ancillary charges not on the (ex-Dar) Bill of Lading. Thus it is recommended finance charges, inland transport losses, customs clearance, and loading supervision and product marking be excluded. Item # 4.e : Customs clearance and discharge supervision [no ERB line] The ERB feels these should be part of the importer’s role and accounted for in the importer’s margin. Indeni includes them in Chapter V, Item # 3.g. Based on information provided to the Consultant by Indeni and the 70 : 30 road : rail allocation an amount of US$ 1.55 / Tn is recommended for all three product. Item # 4.f : Ndola terminal throughput fee [ERB line # 64] The ERB applies a US$ 6.25 / Tn (US$ 5.0 / m³) fee being a Kwacha rate converted at an out-dated exchange rate. Indeni asks for a higher rate and proposes it be the same as the Dar terminal fee. However, this is unreasonable as the Dar rate is market-based whilst the Ndola rate is not; the terminal is in receivership and does not belong to Indeni. A rate of US$ 7 / Tn is recommended ; at this level the operating costs of the terminal ought to be covered. Once ownership of the terminal is settled a revised rate can be included. Item # 4.g : Ndola terminal losses [ERB line # 35] The current formula uses the same percentages as for Dar terminal losses and Indeni accepts these. For reasons explained under Dar losses in Chapter V, Line Item # 3.e, it is recommended Ndola rates be reduced slightly to those of Dar.
Downstream Oil Advisors Ltd. 16 16/05/2007 (near) Vancouver, Canada e-mail : [email protected]
ERB Indeni Recommended
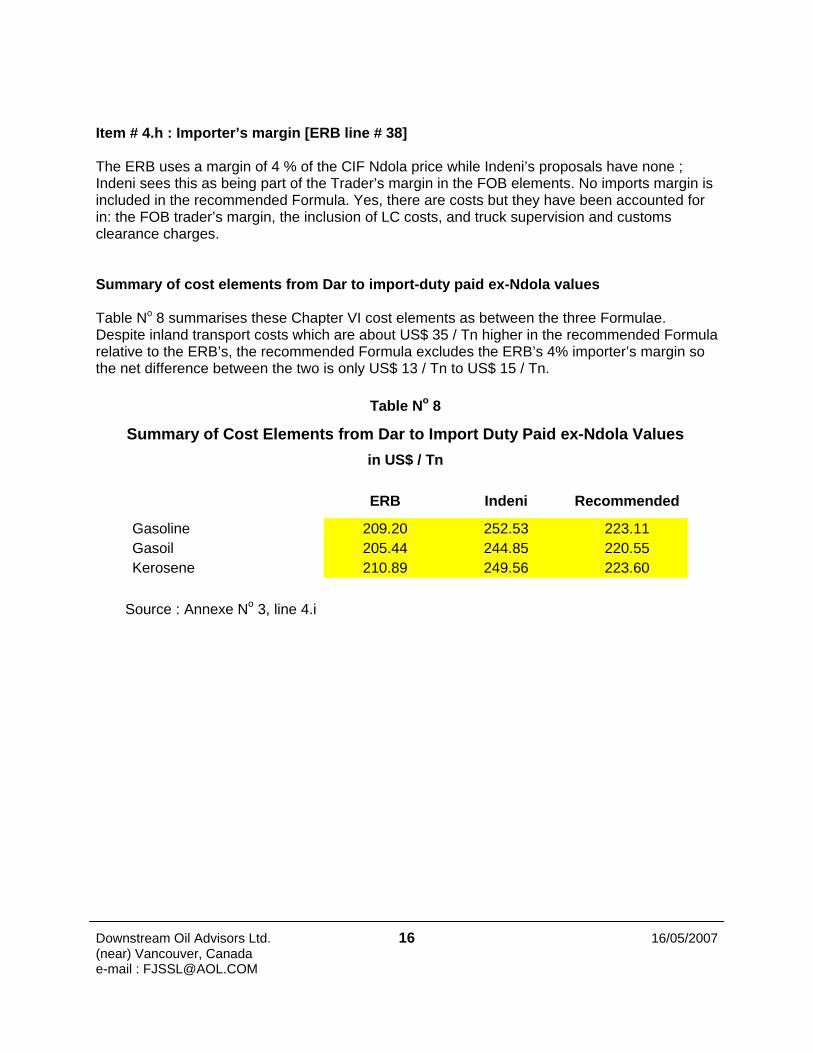
Gasoline 209.20 252.53 223.11Gasoil 205.44 244.85 220.55Kerosene 210.89 249.56 223.60
Source : Annexe No 3, line 4.i
Table No 8
Summary of Cost Elements from Dar to Import Duty Paid ex-Ndola Valuesin US$ / Tn
Item # 4.h : Importer’s margin [ERB line # 38] The ERB uses a margin of 4 % of the CIF Ndola price while Indeni’s proposals have none ; Indeni sees this as being part of the Trader’s margin in the FOB elements. No imports margin is included in the recommended Formula. Yes, there are costs but they have been accounted for in: the FOB trader’s margin, the inclusion of LC costs, and truck supervision and customs clearance charges. Summary of cost elements from Dar to import-duty paid ex-Ndola values Table No 8 summarises these Chapter VI cost elements as between the three Formulae. Despite inland transport costs which are about US$ 35 / Tn higher in the recommended Formula relative to the ERB’s, the recommended Formula excludes the ERB’s 4% importer’s margin so the net difference between the two is only US$ 13 / Tn to US$ 15 / Tn.

Downstream Oil Advisors Ltd. 17 16/05/2007 (near) Vancouver, Canada e-mail : [email protected]
US$ / Tn US$ / Tn / 100 km
Estimated commercial rate on TAZAMA P/L Kenya P/L Co. sets rates relative to rail rates Mombassa to Nairobi 6.90Mocambique P/L charge under "normal" throughput conditions 5.70Petrozim P/L rate under "normal" conditions 4.00Petronet (RSA) rates competitively set ; high volumes 3.10Average of above four 4.93
Assume a 25 % discount for TAZAMA's single feedstock service 3.69Rounded equals 3.70
Current rate 32.50Rate per 100 km over 1,710 km 1.90
Adjustment to account for non-commercial TAZAMA P/L rate 30.77 1.80Rounded equals 30.75
Source : Consultant's database
Table No 9Determination of TAZAMA P/L Discount
Chapter VII Adjustments to Ex-Ndola terminal values This final Chapter -- VII -- addresses adjustments to OMC wholesale prices in US$ / Tn, especially the critical issues of a discount to account for the below market cost to Indeni of using the TAZAMA P/L and a loss recovery component for Indeni to ensure its continued operation. It is based upon the fifth and final Formula spreadsheet given as Annexe No 4. Item # 5.b : TAZAMA P/L discount [ERB line # 42] The ERB applies a nominal 10 % discount to the Indeni price to OMCs before taxes to account for the fact that the TAZAMA P/L belongs to government, not Indeni. Thus all Zambians, not just Indeni, should benefit from its relatively low tariff. Indeni does not accept this and has no discount. The Consultant agrees with the ERB and proposes a means for calculating this discount on a fixed, rather than a percentage, basis. The approach, summarised below in Table No 9, recognises that the TAZAMA P/L tariff is low relative to other pipelines in Sub-Saharan Africa. The average of tariffs on four other SSA P/Ls is almost US$ 5 / Tn / 100 km. Allowing a nominal 25 % discount, to account for the more straightforward operation of a single feedstock P/L compared with multi-product lines, results in a theoretical “market-based” tariff of US$ 3.70 / Tn / 100 km. With a length of 1,710 km the present US$ 32.50 / Tn TAZAMA tariff equals US$ 1.90 / Tn / 100 km. The difference between these last two rates per 100 km equals the recommended discount of negative US$ 1.80 / Tn / 100 km or minus US$ 30.75 / Tn over the full P/L distance.
Downstream Oil Advisors Ltd. 18 16/05/2007 (near) Vancouver, Canada e-mail : [email protected]
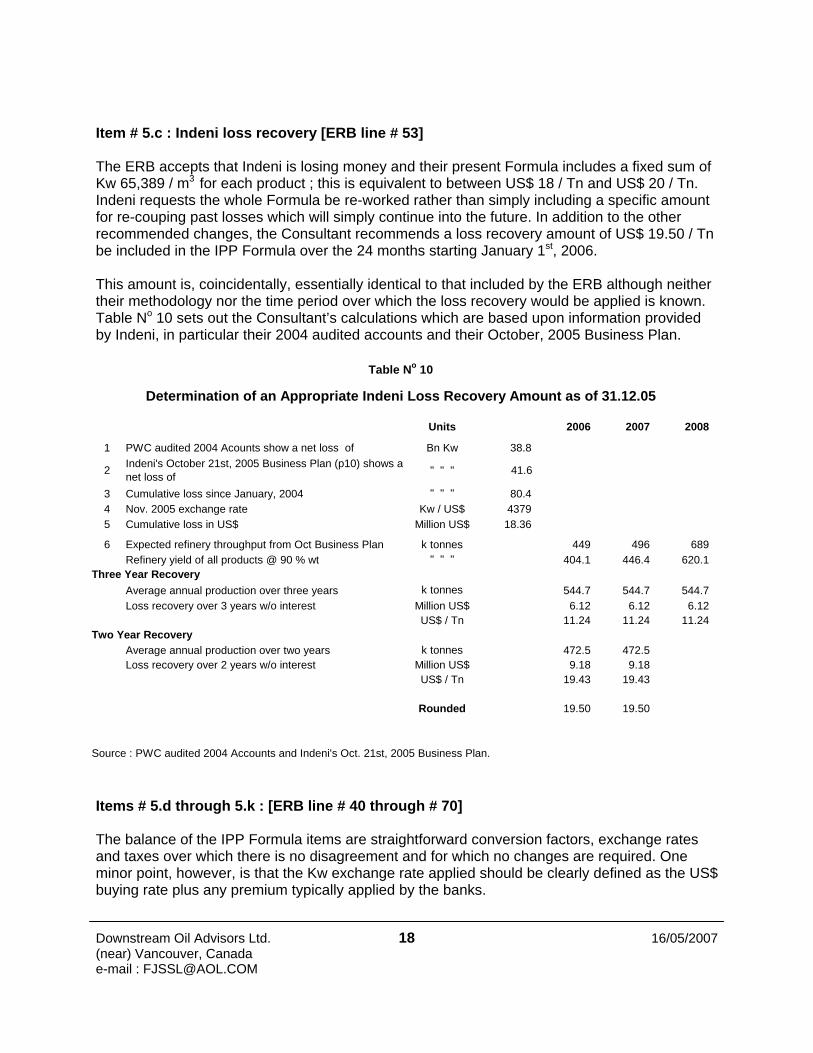
Units 2006 2007 2008
1 PWC audited 2004 Acounts show a net loss of Bn Kw 38.8
2 Indeni's October 21st, 2005 Business Plan (p10) shows a net loss of " " " 41.6
3 Cumulative loss since January, 2004 " " " 80.44 Nov. 2005 exchange rate Kw / US$ 43795 Cumulative loss in US$ Million US$ 18.36
6 Expected refinery throughput from Oct Business Plan k tonnes 449 496 689Refinery yield of all products @ 90 % wt " " " 404.1 446.4 620.1
Three Year RecoveryAverage annual production over three years k tonnes 544.7 544.7 544.7Loss recovery over 3 years w/o interest Million US$ 6.12 6.12 6.12
US$ / Tn 11.24 11.24 11.24Two Year Recovery
Average annual production over two years k tonnes 472.5 472.5Loss recovery over 2 years w/o interest Million US$ 9.18 9.18
US$ / Tn 19.43 19.43
Rounded 19.50 19.50
Source : PWC audited 2004 Accounts and Indeni's Oct. 21st, 2005 Business Plan.
Table No 10
Determination of an Appropriate Indeni Loss Recovery Amount as of 31.12.05
Item # 5.c : Indeni loss recovery [ERB line # 53] The ERB accepts that Indeni is losing money and their present Formula includes a fixed sum of Kw 65,389 / m3 for each product ; this is equivalent to between US$ 18 / Tn and US$ 20 / Tn. Indeni requests the whole Formula be re-worked rather than simply including a specific amount for re-couping past losses which will simply continue into the future. In addition to the other recommended changes, the Consultant recommends a loss recovery amount of US$ 19.50 / Tn be included in the IPP Formula over the 24 months starting January 1st, 2006. This amount is, coincidentally, essentially identical to that included by the ERB although neither their methodology nor the time period over which the loss recovery would be applied is known. Table No 10 sets out the Consultant’s calculations which are based upon information provided by Indeni, in particular their 2004 audited accounts and their October, 2005 Business Plan. Items # 5.d through 5.k : [ERB line # 40 through # 70] The balance of the IPP Formula items are straightforward conversion factors, exchange rates and taxes over which there is no disagreement and for which no changes are required. One minor point, however, is that the Kw exchange rate applied should be clearly defined as the US$ buying rate plus any premium typically applied by the banks.
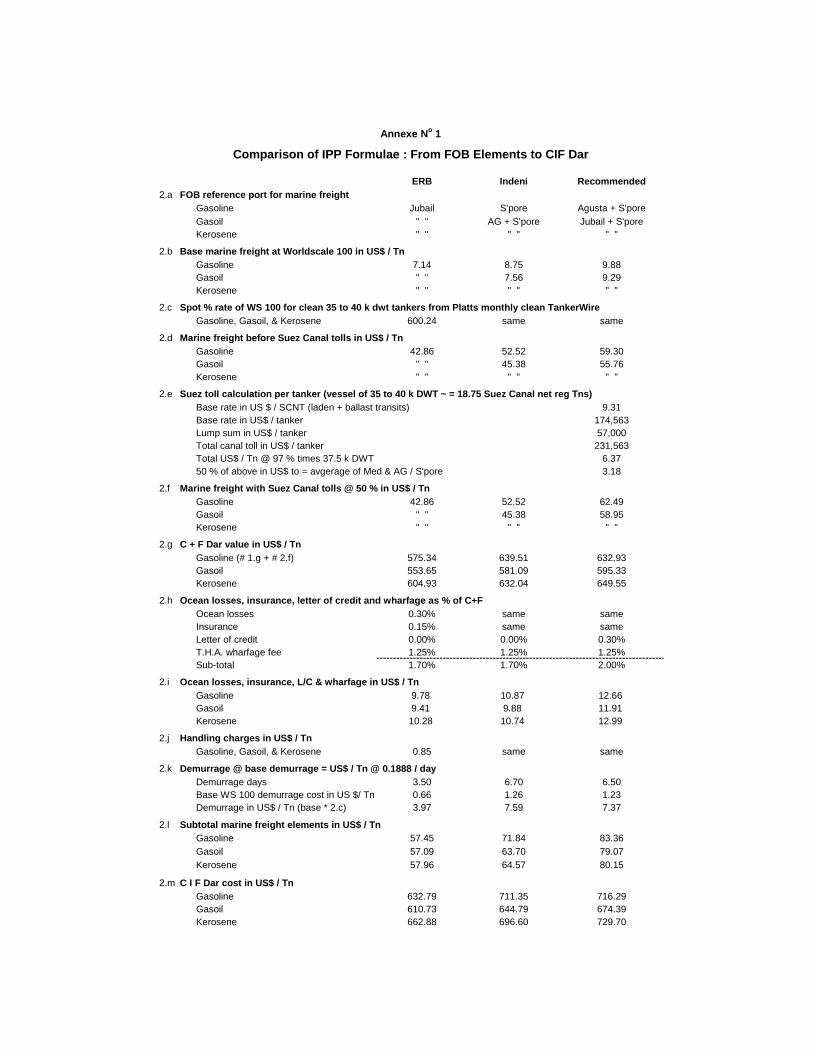
ERB Indeni Recommended2.a FOB reference port for marine freight
Gasoline Jubail S'pore Agusta + S'poreGasoil " " AG + S'pore Jubail + S'poreKerosene " " " " " "
2.b Base marine freight at Worldscale 100 in US$ / TnGasoline 7.14 8.75 9.88Gasoil " " 7.56 9.29Kerosene " " " " " "
2.c Spot % rate of WS 100 for clean 35 to 40 k dwt tankers from Platts monthly clean TankerWireGasoline, Gasoil, & Kerosene 600.24 same same
2.d Marine freight before Suez Canal tolls in US$ / TnGasoline 42.86 52.52 59.30Gasoil " " 45.38 55.76Kerosene " " " " " "
2.e Suez toll calculation per tanker (vessel of 35 to 40 k DWT ~ = 18.75 Suez Canal net reg Tns)Base rate in US $ / SCNT (laden + ballast transits) 9.31Base rate in US$ / tanker 174,563Lump sum in US$ / tanker 57,000Total canal toll in US$ / tanker 231,563Total US$ / Tn @ 97 % times 37.5 k DWT 6.3750 % of above in US$ to = avgerage of Med & AG / S'pore 3.18
2.f Marine freight with Suez Canal tolls @ 50 % in US$ / TnGasoline 42.86 52.52 62.49Gasoil " " 45.38 58.95Kerosene " " " " " "
2.g C + F Dar value in US$ / TnGasoline (# 1.g + # 2.f) 575.34 639.51 632.93Gasoil 553.65 581.09 595.33Kerosene 604.93 632.04 649.55
2.h Ocean losses, insurance, letter of credit and wharfage as % of C+FOcean losses 0.30% same sameInsurance 0.15% same sameLetter of credit 0.00% 0.00% 0.30%T.H.A. wharfage fee 1.25% 1.25% 1.25%Sub-total 1.70% 1.70% 2.00%
2.i Ocean losses, insurance, L/C & wharfage in US$ / TnGasoline 9.78 10.87 12.66Gasoil 9.41 9.88 11.91Kerosene 10.28 10.74 12.99
2.j Handling charges in US$ / TnGasoline, Gasoil, & Kerosene 0.85 same same
2.k Demurrage @ base demurrage = US$ / Tn @ 0.1888 / day Demurrage days 3.50 6.70 6.50Base WS 100 demurrage cost in US $/ Tn 0.66 1.26 1.23Demurrage in US$ / Tn (base * 2.c) 3.97 7.59 7.37
2.l Subtotal marine freight elements in US$ / TnGasoline 57.45 71.84 83.36Gasoil 57.09 63.70 79.07Kerosene 57.96 64.57 80.15
2.m C I F Dar cost in US$ / TnGasoline 632.79 711.35 716.29Gasoil 610.73 644.79 674.39Kerosene 662.88 696.60 729.70
Annexe No 1
Comparison of IPP Formulae : From FOB Elements to CIF Dar
ERB Indeni Recommended
3.a Cargo financing costs applied to CIF valueInterest rate in % 7.42% 10.0% 8.42%Days cargo is financed (FOB to sale) 60 same 67Interest in US$ / Tn
Gasoline 7.72 11.69 11.07Gasoil 7.45 10.60 10.42Kerosene 8.09 11.45 11.28
3.b Bank charges as a % of CIFGasoline, Gasoil & Kerosene 0% 0.6% 0%In US$ / Tn
Gasoline 0 4.27 0Gasoil 0 3.87 0Kerosene 0 4.18 0
3.c Inspection at discharge in US$ / TnGasoline, Gasoil & Kerosene 0.19 same same
3.d Dar terminal throughput fee in US$/ TnGasoline, Gasoil & Kerosene 6.25 12.50 15.00
3.e Terminal lossesAs a percent of CIF + 3.a + 3.b + 3.c
Gasoline 0.50% same 0.40%Gasoil 0.30% " " 0.30%Kerosene 0.50% " " 0.30%
In US$ / TnGasoline 3.23 3.70 2.97Gasoil 1.87 2.02 2.10Kerosene 3.39 3.62 2.27
3.f Marking of transit products in US$ / TnGasoline, Gasoil & Kerosene 1.20 same 1.50
3.g Truck/rail loading supervision in US$ / TnGasoline, Gasoil & Kerosene 0 3.45 0.35
3.h Sub-total Dar transit costsGasoline 18.59 37.00 31.08Gasoil 16.96 33.82 29.56Kerosene 19.11 36.60 30.59
3.i Ex Dar value in US$ / TnGasoline 651.38 748.35 747.37Gasoil 627.70 678.61 703.96Kerosene 682.00 733.20 760.28
Annexe No 2
Comparison of IPP Formulae : Dar Transit Costs
(1) Indeni's number includes customs clearance and discharge supervision costs which are excluded from line 3.g and included later in line 4.e in the recommended formula.
(1) (1)
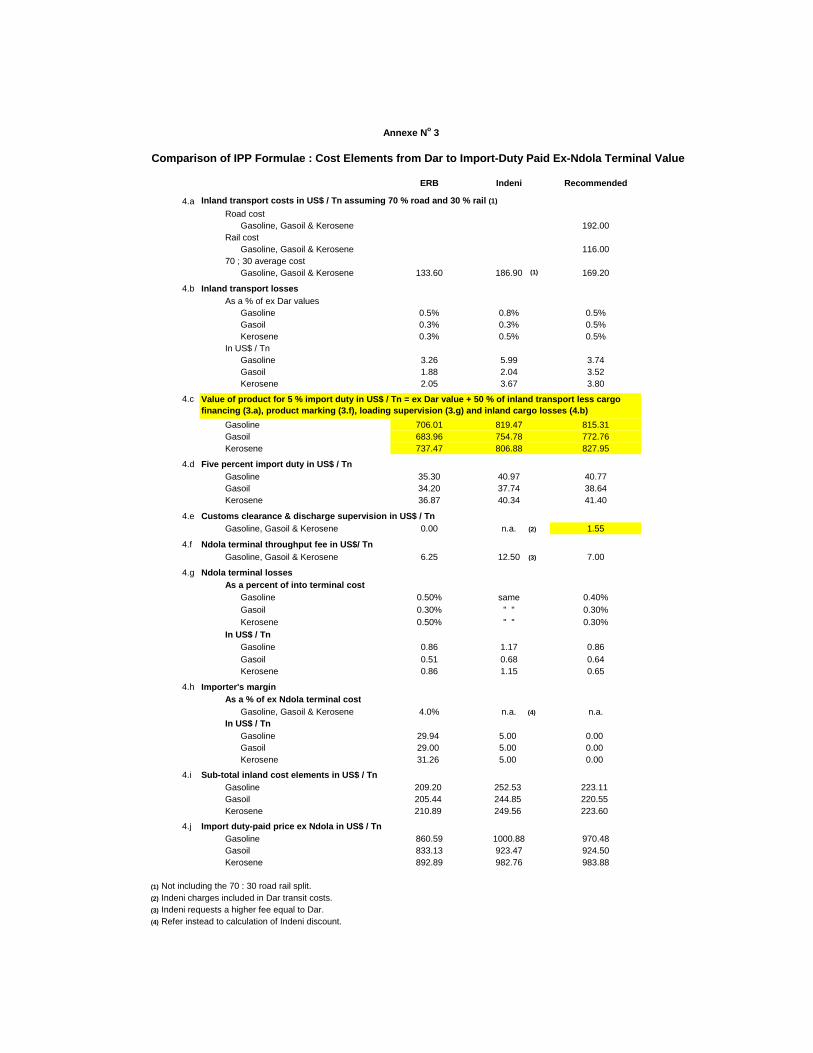
ERB Indeni Recommended
4.a Inland transport costs in US$ / Tn assuming 70 % road and 30 % rail (1)
Road costGasoline, Gasoil & Kerosene 192.00
Rail costGasoline, Gasoil & Kerosene 116.00
70 ; 30 average costGasoline, Gasoil & Kerosene 133.60 186.90 169.20
4.b Inland transport lossesAs a % of ex Dar values
Gasoline 0.5% 0.8% 0.5%Gasoil 0.3% 0.3% 0.5%Kerosene 0.3% 0.5% 0.5%
In US$ / TnGasoline 3.26 5.99 3.74Gasoil 1.88 2.04 3.52Kerosene 2.05 3.67 3.80
4.c
Gasoline 706.01 819.47 815.31Gasoil 683.96 754.78 772.76Kerosene 737.47 806.88 827.95
4.d Five percent import duty in US$ / TnGasoline 35.30 40.97 40.77Gasoil 34.20 37.74 38.64Kerosene 36.87 40.34 41.40
4.e Customs clearance & discharge supervision in US$ / TnGasoline, Gasoil & Kerosene 0.00 n.a. 1.55
4.f Ndola terminal throughput fee in US$/ TnGasoline, Gasoil & Kerosene 6.25 12.50 7.00
4.g Ndola terminal lossesAs a percent of into terminal cost
Gasoline 0.50% same 0.40%Gasoil 0.30% " " 0.30%Kerosene 0.50% " " 0.30%
In US$ / TnGasoline 0.86 1.17 0.86Gasoil 0.51 0.68 0.64Kerosene 0.86 1.15 0.65
4.h Importer's marginAs a % of ex Ndola terminal cost
Gasoline, Gasoil & Kerosene 4.0% n.a. n.a.In US$ / Tn
Gasoline 29.94 5.00 0.00Gasoil 29.00 5.00 0.00Kerosene 31.26 5.00 0.00
4.i Sub-total inland cost elements in US$ / TnGasoline 209.20 252.53 223.11Gasoil 205.44 244.85 220.55Kerosene 210.89 249.56 223.60
4.j Import duty-paid price ex Ndola in US$ / TnGasoline 860.59 1000.88 970.48Gasoil 833.13 923.47 924.50Kerosene 892.89 982.76 983.88
(1) Not including the 70 : 30 road rail split.(2) Indeni charges included in Dar transit costs.(3) Indeni requests a higher fee equal to Dar.(4) Refer instead to calculation of Indeni discount.
Annexe No 3
Comparison of IPP Formulae : Cost Elements from Dar to Import-Duty Paid Ex-Ndola Terminal Value
Value of product for 5 % import duty in US$ / Tn = ex Dar value + 50 % of inland transport less cargo financing (3.a), product marking (3.f), loading supervision (3.g) and inland cargo losses (4.b)
(1)
(2)
(4)
(3)
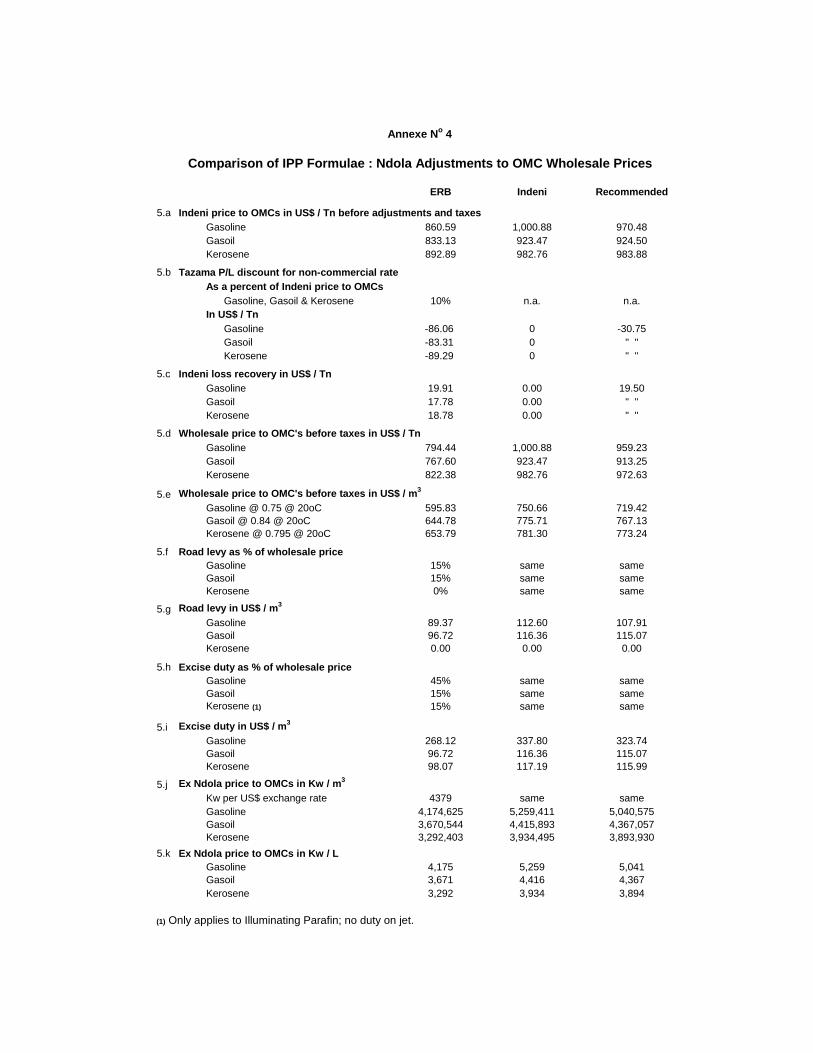
ERB Indeni Recommended
5.a Indeni price to OMCs in US$ / Tn before adjustments and taxesGasoline 860.59 1,000.88 970.48Gasoil 833.13 923.47 924.50Kerosene 892.89 982.76 983.88
5.b Tazama P/L discount for non-commercial rateAs a percent of Indeni price to OMCs
Gasoline, Gasoil & Kerosene 10% n.a. n.a.In US$ / Tn
Gasoline -86.06 0 -30.75Gasoil -83.31 0 " "Kerosene -89.29 0 " "
5.c Indeni loss recovery in US$ / TnGasoline 19.91 0.00 19.50Gasoil 17.78 0.00 " "Kerosene 18.78 0.00 " "
5.d Wholesale price to OMC's before taxes in US$ / TnGasoline 794.44 1,000.88 959.23Gasoil 767.60 923.47 913.25Kerosene 822.38 982.76 972.63
5.e Wholesale price to OMC's before taxes in US$ / m3
Gasoline @ 0.75 @ 20oC 595.83 750.66 719.42Gasoil @ 0.84 @ 20oC 644.78 775.71 767.13Kerosene @ 0.795 @ 20oC 653.79 781.30 773.24
5.f Road levy as % of wholesale priceGasoline 15% same sameGasoil 15% same sameKerosene 0% same same
5.g Road levy in US$ / m3
Gasoline 89.37 112.60 107.91Gasoil 96.72 116.36 115.07Kerosene 0.00 0.00 0.00
5.h Excise duty as % of wholesale priceGasoline 45% same sameGasoil 15% same sameKerosene (1) 15% same same
5.i Excise duty in US$ / m3
Gasoline 268.12 337.80 323.74Gasoil 96.72 116.36 115.07Kerosene 98.07 117.19 115.99
5.j Ex Ndola price to OMCs in Kw / m3
Kw per US$ exchange rate 4379 same sameGasoline 4,174,625 5,259,411 5,040,575Gasoil 3,670,544 4,415,893 4,367,057Kerosene 3,292,403 3,934,495 3,893,930
5.k Ex Ndola price to OMCs in Kw / LGasoline 4,175 5,259 5,041Gasoil 3,671 4,416 4,367Kerosene 3,292 3,934 3,894
(1) Only applies to Illuminating Parafin; no duty on jet.
Annexe No 4
Comparison of IPP Formulae : Ndola Adjustments to OMC Wholesale Prices
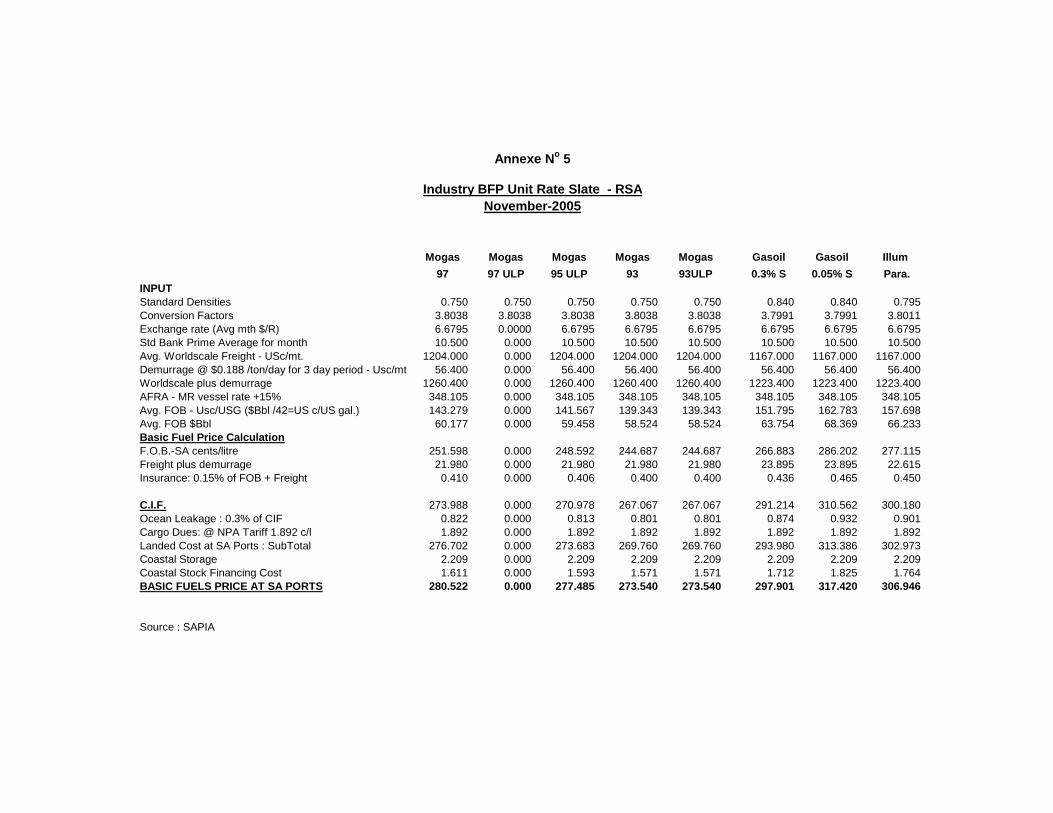
Mogas Mogas Mogas Mogas Mogas Gasoil Gasoil Illum97 97 ULP 95 ULP 93 93ULP 0.3% S 0.05% S Para.
INPUTStandard Densities 0.750 0.750 0.750 0.750 0.750 0.840 0.840 0.795Conversion Factors 3.8038 3.8038 3.8038 3.8038 3.8038 3.7991 3.7991 3.8011Exchange rate (Avg mth $/R) 6.6795 0.0000 6.6795 6.6795 6.6795 6.6795 6.6795 6.6795Std Bank Prime Average for month 10.500 0.000 10.500 10.500 10.500 10.500 10.500 10.500Avg. Worldscale Freight - USc/mt. 1204.000 0.000 1204.000 1204.000 1204.000 1167.000 1167.000 1167.000Demurrage @ $0.188 /ton/day for 3 day period - Usc/mt 56.400 0.000 56.400 56.400 56.400 56.400 56.400 56.400Worldscale plus demurrage 1260.400 0.000 1260.400 1260.400 1260.400 1223.400 1223.400 1223.400AFRA - MR vessel rate +15% 348.105 0.000 348.105 348.105 348.105 348.105 348.105 348.105Avg. FOB - Usc/USG ($Bbl /42=US c/US gal.) 143.279 0.000 141.567 139.343 139.343 151.795 162.783 157.698Avg. FOB $Bbl 60.177 0.000 59.458 58.524 58.524 63.754 68.369 66.233Basic Fuel Price CalculationF.O.B.-SA cents/litre 251.598 0.000 248.592 244.687 244.687 266.883 286.202 277.115Freight plus demurrage 21.980 0.000 21.980 21.980 21.980 23.895 23.895 22.615Insurance: 0.15% of FOB + Freight 0.410 0.000 0.406 0.400 0.400 0.436 0.465 0.450
C.I.F. 273.988 0.000 270.978 267.067 267.067 291.214 310.562 300.180Ocean Leakage : 0.3% of CIF 0.822 0.000 0.813 0.801 0.801 0.874 0.932 0.901Cargo Dues: @ NPA Tariff 1.892 c/l 1.892 0.000 1.892 1.892 1.892 1.892 1.892 1.892Landed Cost at SA Ports : SubTotal 276.702 0.000 273.683 269.760 269.760 293.980 313.386 302.973Coastal Storage 2.209 0.000 2.209 2.209 2.209 2.209 2.209 2.209Coastal Stock Financing Cost 1.611 0.000 1.593 1.571 1.571 1.712 1.825 1.764BASIC FUELS PRICE AT SA PORTS 280.522 0.000 277.485 273.540 273.540 297.901 317.420 306.946
Source : SAPIA
Annexe No 5
November-2005Industry BFP Unit Rate Slate - RSA
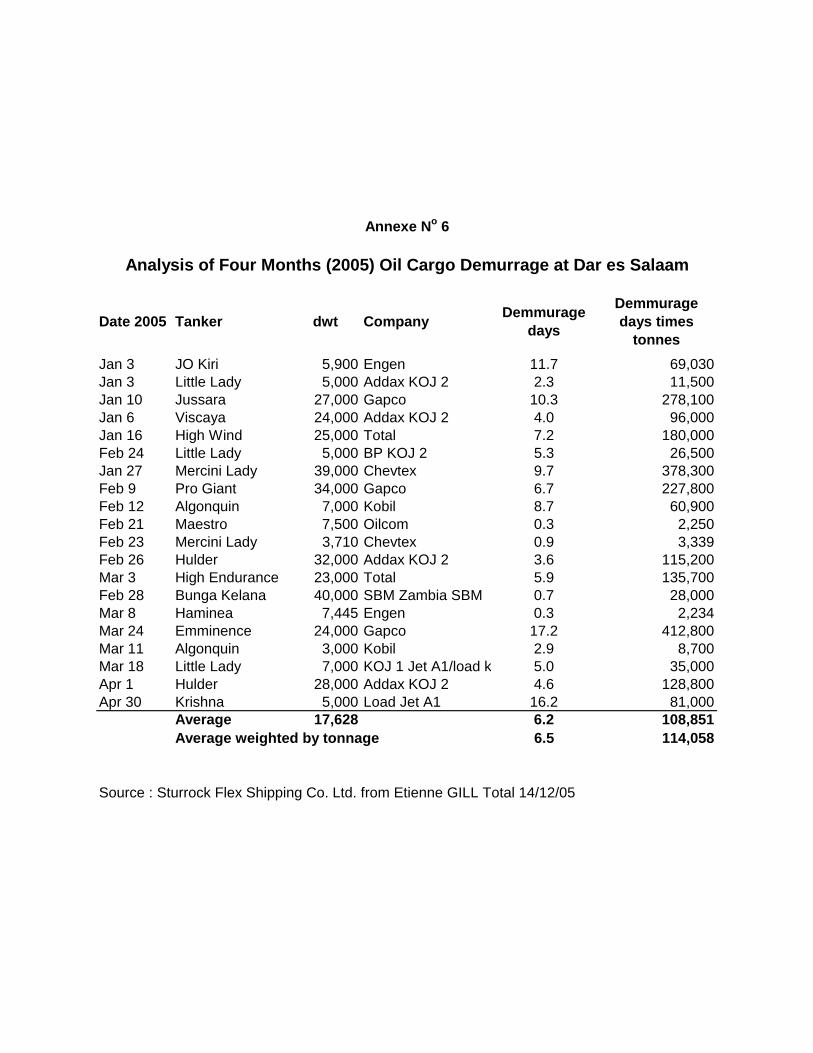
Date 2005 Tanker dwt Company Demmurage days
Demmurage days times
tonnesJan 3 JO Kiri 5,900 Engen 11.7 69,030Jan 3 Little Lady 5,000 Addax KOJ 2 2.3 11,500Jan 10 Jussara 27,000 Gapco 10.3 278,100Jan 6 Viscaya 24,000 Addax KOJ 2 4.0 96,000Jan 16 High Wind 25,000 Total 7.2 180,000Feb 24 Little Lady 5,000 BP KOJ 2 5.3 26,500Jan 27 Mercini Lady 39,000 Chevtex 9.7 378,300Feb 9 Pro Giant 34,000 Gapco 6.7 227,800Feb 12 Algonquin 7,000 Kobil 8.7 60,900Feb 21 Maestro 7,500 Oilcom 0.3 2,250Feb 23 Mercini Lady 3,710 Chevtex 0.9 3,339Feb 26 Hulder 32,000 Addax KOJ 2 3.6 115,200Mar 3 High Endurance 23,000 Total 5.9 135,700Feb 28 Bunga Kelana 40,000 SBM Zambia SBM 0.7 28,000Mar 8 Haminea 7,445 Engen 0.3 2,234Mar 24 Emminence 24,000 Gapco 17.2 412,800Mar 11 Algonquin 3,000 Kobil 2.9 8,700Mar 18 Little Lady 7,000 KOJ 1 Jet A1/load k 5.0 35,000Apr 1 Hulder 28,000 Addax KOJ 2 4.6 128,800Apr 30 Krishna 5,000 Load Jet A1 16.2 81,000
Average 17,628 6.2 108,851Average weighted by tonnage 6.5 114,058
Source : Sturrock Flex Shipping Co. Ltd. from Etienne GILL Total 14/12/05
Analysis of Four Months (2005) Oil Cargo Demurrage at Dar es Salaam
Annexe No 6
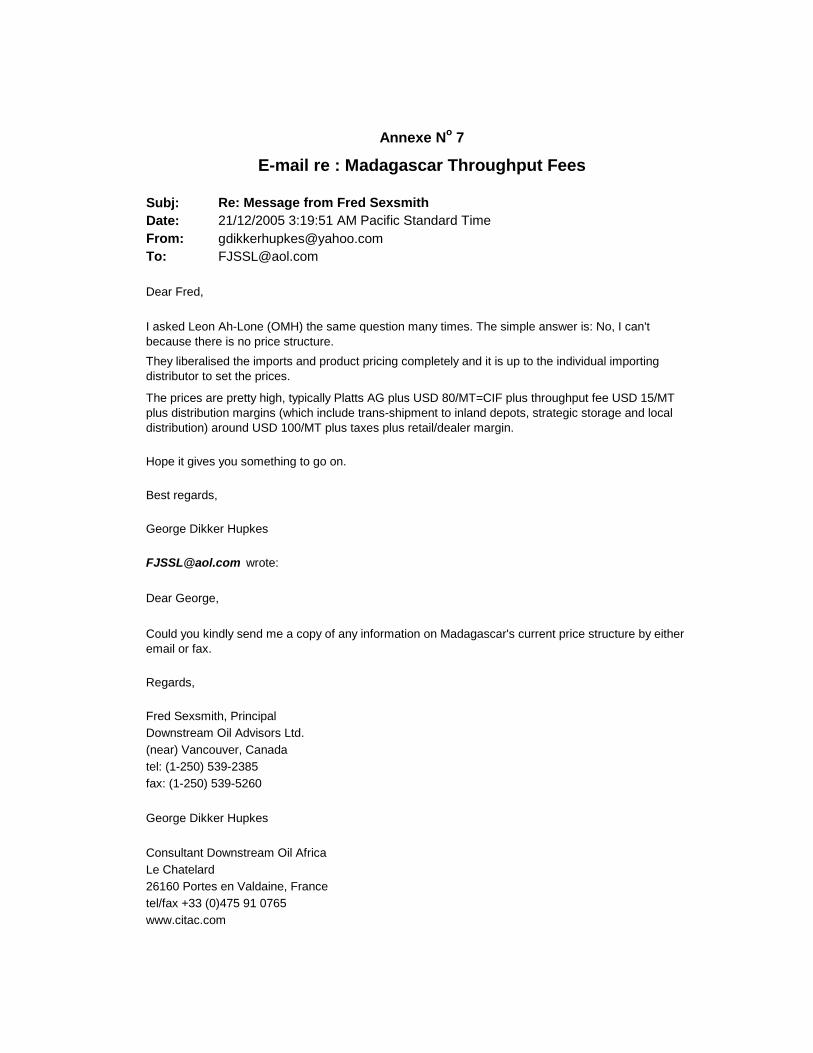
Subj:Date:From: [email protected]: [email protected]
Dear Fred,
Hope it gives you something to go on.
Best regards,
George Dikker Hupkes
[email protected] wrote:
Dear George,
Regards,
Fred Sexsmith, PrincipalDownstream Oil Advisors Ltd.(near) Vancouver, Canadatel: (1-250) 539-2385fax: (1-250) 539-5260
George Dikker Hupkes
Consultant Downstream Oil AfricaLe Chatelard26160 Portes en Valdaine, Francetel/fax +33 (0)475 91 0765www.citac.com
Re: Message from Fred Sexsmith21/12/2005 3:19:51 AM Pacific Standard Time
Annexe No 7
E-mail re : Madagascar Throughput Fees
I asked Leon Ah-Lone (OMH) the same question many times. The simple answer is: No, I can't because there is no price structure.They liberalised the imports and product pricing completely and it is up to the individual importing distributor to set the prices.
The prices are pretty high, typically Platts AG plus USD 80/MT=CIF plus throughput fee USD 15/MT plus distribution margins (which include trans-shipment to inland depots, strategic storage and local distribution) around USD 100/MT plus taxes plus retail/dealer margin.
Could you kindly send me a copy of any information on Madagascar's current price structure by either email or fax.
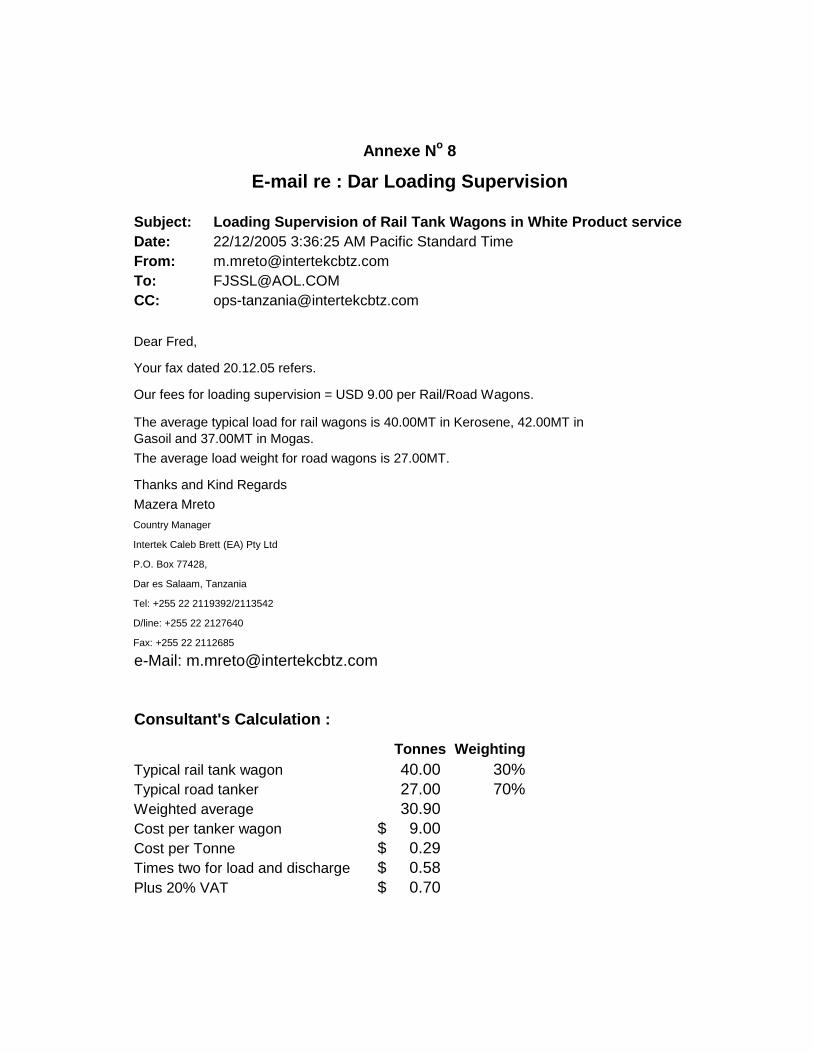
Subject: Loading Supervision of Rail Tank Wagons in White Product serviceDate: 22/12/2005 3:36:25 AM Pacific Standard TimeFrom: [email protected]: [email protected]: [email protected]
Dear Fred,
Your fax dated 20.12.05 refers.
Our fees for loading supervision = USD 9.00 per Rail/Road Wagons.
The average load weight for road wagons is 27.00MT.
Thanks and Kind RegardsMazera MretoCountry Manager
Intertek Caleb Brett (EA) Pty Ltd
P.O. Box 77428,
Dar es Salaam, Tanzania
Tel: +255 22 2119392/2113542
D/line: +255 22 2127640
Fax: +255 22 2112685
e-Mail: [email protected]
Consultant's Calculation :
Tonnes WeightingTypical rail tank wagon 40.00 30%Typical road tanker 27.00 70%Weighted average 30.90 Cost per tanker wagon 9.00$ Cost per Tonne 0.29$ Times two for load and discharge 0.58$ Plus 20% VAT 0.70$
The average typical load for rail wagons is 40.00MT in Kerosene, 42.00MT in Gasoil and 37.00MT in Mogas.
Annexe No 8
E-mail re : Dar Loading Supervision