Embed Size (px)
Citation preview
Review of Virginia’s Corporate Income Tax System
JOINT LEGISLATIVE AUDIT AND REVIEW COMMISSION
RepoRt to the GoveRnoR and the GeneRal assembly of viRGinia
novembeR 2010
house document no. 3commonwealth of viRGiniaRichmond
House Joint Resolution 681 (2009) directed JLARC staff to perform a comprehensive review of the State’s corpo-rate income tax (CIT) sys-tem.
JLARC staff found that Vir-ginia’s CIT is largely con-sistent with the corporate income tax systems in other states. Further, the CIT does not appear to be a major de-traction from economic devel-opment efforts, particularly in light of the State’s favor-able business environment.
Still, several targeted changes could be made to the State’s CIT system to improve its alignment with principles of sound tax policy and address concerns raised by tax professionals and cor-porate representatives. In particular, the State could consider adopting market-based sourcing for sales of services and intangible goods while taxing out-of-state pro-viders of such items to the full extent permissible under federal law.
While major restructuring initiatives could be consid-ered, most carry significant risks that may outweigh po-tential benefits and would likely disrupt the stability of Virginia’s CIT system. Imple-menting extensive changes may also be a disproportion-ate response to the narrowly focused concerns described in this report.
ChairSenator Charles J. Colgan
Vice-ChairDelegate John M. O’Bannon III
Delegate David B. AlboDelegate M. Kirkland CoxDelegate H. Morgan GriffithSenator R. Edward HouckSenator Janet D. HowellDelegate Johnny S. JoannouDelegate Harvey B. MorganSenator Thomas K. Norment, Jr.Delegate Robert D. Orrock, Sr.Delegate Clarence E. PhillipsDelegate Lacey E. PutneySenator Walter A. Stosch
Walter J. Kucharski, Auditor of Public Accounts
DirectorGlen S. Tittermary
copyright 2011, commonwealth of virginia.
JLARC Staff for This ReportHal Greer, Deputy DirectorNathalie Molliet-Ribet, Project LeaderEllen MillerMassey Whorley
Members of the Joint Legislative Audit andReview CommissionIn Brief
This report is available on the JLARC website athttp://jlarc.virginia.gov
The HChaiJointGeneRichm Dear
the Jincomincomattribbusin
are in
Depaof Virdurin
GST/
Honorable Cr t Legislativeeral Assembmond, Virgi
r Senator Co House Jo
Joint Legislme tax systeme tax strubute incomness activity
Staff findncluded in t
On behalartment of Trginia’s Weng this stud
/nmr
Charles J. C
e Audit andbly Buildinginia 23219
olgan:
oint Resolutlative Auditem. Specificucture to th
me to Virgiy in the Com
dings were this report.
lf of the CoTaxation, anldon Cooper
dy.
Colgan
d Review Cog
tion 681 of t and Reviecally, staff what of othenia for cer
mmonwealth
presented t
ommission nd Drs. Terr Center for
January 21
mmission
the 2009 Gew Commiswere directeer states, ertain corpoh during the
to the Comm
staff, I wourry Rephannr Public Ser
Sincerely,
Glen S. TitDirector
1, 2011
General Assssion to stued to compaevaluate thorations, ane past 20 ye
mission on
uld like to n and Bill Srvice for the
ttermary
sembly direudy Virginiaare the State methodol
nd analyze ears.
November
thank the Shobe at their invaluab
ected staff oa’s corporatte’s corporatlogy used t patterns o
8, 2010, an
staff at thhe Universitle assistanc
of te te to of
nd
he ty ce

TTaabbllee ooff CCoonntteennttss
JLARC Report Summary i
1 Corporate Operations and Tax Revenue Are Important to Virginia’s Economy
1
Corporate Income Taxes Are Significant Revenue Stream for Virginia 2
Virginia Corporate Activity Grew in Past Two Decades, but Share of Total Business Activity Declined 8
Virginia Appears to Actively Compete for Corporate Activity WithPopulous as Well as Eastern States 16
2 Virginia and Most Other States Impose Corporate Income Tax Only on Certain C Corporations
17
Most States Have a Corporate Income Tax 17
Virginia and Most States Apply Corporate Income Tax Only to C Corporations 19
Virginia and Most States Exempt Certain C Corporations Fromthe Corporate Income Tax 20
Virginia Uses More Conservative Standard Than Many States to Determine Which C Corporations Are Taxed 23
3 Virginia and Other States Determine Taxable Income Similarly, but New Trends Are Emerging
31
Virginia and Most States Use Federal Taxable Income as Starting Point for Calculation 31
Virginia and Many States Allow Separate Reporting, but Trend Is Toward Mandatory Group Filing 35
Most States Have Adopted More Stringent Mechanisms Than Virginia to Mitigate Aggressive Tax Planning 38
4 Virginia and Most States Calculate Tax Liability Similarly, but Apportionment Methods Are Changing
43
Virginia’s Six Percent Corporate Income Tax Rate Is One of Lowest in Country 43
Like Most States, Virginia Determines How Much Income to TaxThrough Apportionment and Allocation 44
Unlike Virginia, 19 States Impose Minimum Taxes on All Corporations 53
5 Virginia and Most States Offer Corporate Income Tax Credits, but Virginia’s Are More Limited
55
Virginia Offers Numerous Tax Credits Designed to Encourage Certain Behaviors 55
Virginia’s Economic Development Tax Credits Are More Limited Than Competitors 61
6 Virginia Corporate Income Tax System Does Not Appear to Diminish Economic Development
65
Virginia’s Corporate Income Tax Appears to Have Only Marginal Effect on Economic Development 65
Virginia Offers Highly Favorable Business Environment 70
7 Targeted Changes Could Be Made to Improve Virginia’s Corporate Income Tax System
77
Tax Policy Principles Can Be Used to Evaluate Options 78
Option: Adopt Factor Presence Nexus Standard 79
Option: Require Affiliated Corporations to File As a Group 82
Option: Eliminate Either the Consolidated or Combined Filing Format 84
Option: Alter or Expand Implementation of Single Sales Factor Methodology 85
Option: Adopt Market-Based Sourcing for Sales of Intangible Goods and Services 87
Option: Increase Value of Certain Economic Development Credits 94
Option: Offer Capital Investments and R&D Tax Credits 95
Option: Make Credits Refundable 98
Option: Eliminate Underutilized Credits 100
Option: Increase Oversight of Credits 102
Best Option Appears to Be Adopting Market-Based Sourcing While Discontinuing Extension of PL 86-272 104
8 Major Tax Restructuring Could Disrupt System Reliability
105
Option: Consider Exempting Small Corporations From Filing and Paying Income Taxes 105
Option: Consider Eliminating Virginia’s Corporate Income Tax 109
Option: Consider Taxing Pass-Through Entities Under Virginia’s Corporate Income Tax System 114
Option: Consider Basing Virginia’s Corporate Tax on a Measureof Sales Rather Than Income 121
Option: Consider Imposing a Minimum Tax on All Corporations 123
Option: Consider Fully Conforming to Internal Revenue Code 125
Option: Consider Adopting Mandatory Unitary Combined Reporting 126
Option: Consider Replacing Tax Credits With Grants 129
Areas for Potential Further Review 131
Appendixes
A Study Mandate 135
B Research Activities and Methods 137
C Comparison of Virginia’s Corporate Income Tax System With Other States’ Systems 145
D Activity Taxes Are Based on Measures of Sales and Apply to Most Businesses 159
E Agency Responses 161

JLARC Report Summary i
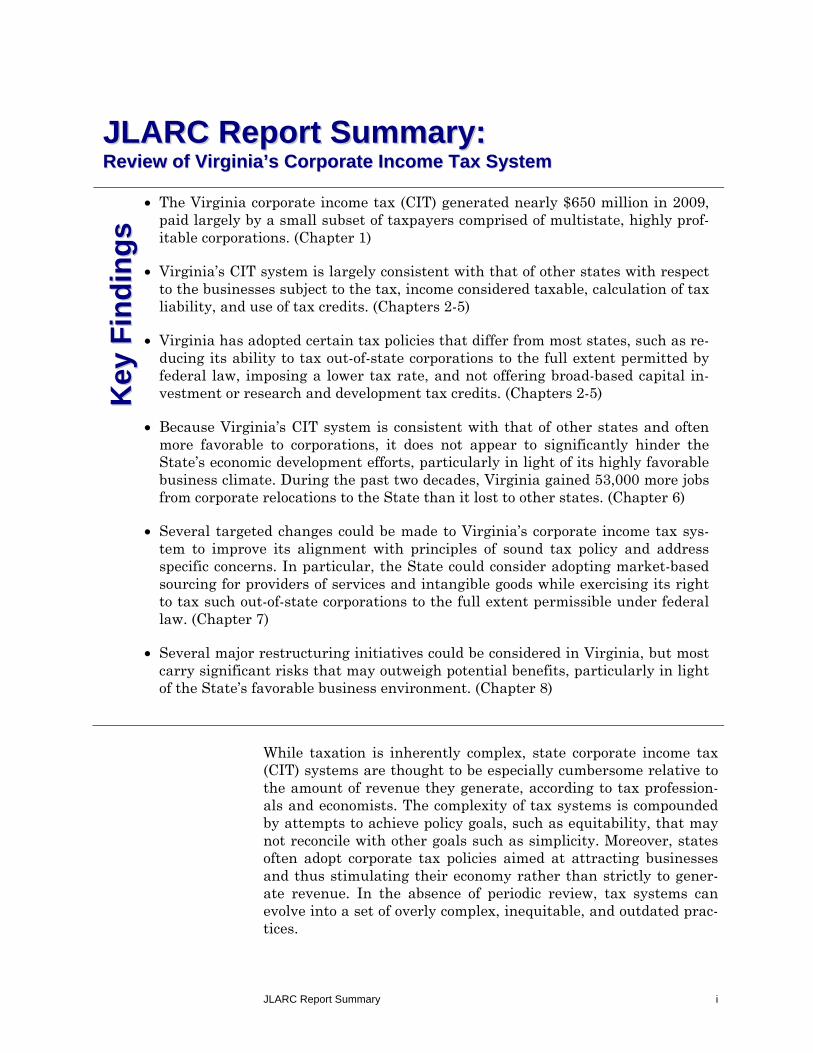
While taxation is inherently complex, state corporate income tax (CIT) systems are thought to be especially cumbersome relative to the amount of revenue they generate, according to tax profession-als and economists. The complexity of tax systems is compounded by attempts to achieve policy goals, such as equitability, that may not reconcile with other goals such as simplicity. Moreover, states often adopt corporate tax policies aimed at attracting businesses and thus stimulating their economy rather than strictly to gener-ate revenue. In the absence of periodic review, tax systems can evolve into a set of overly complex, inequitable, and outdated prac-tices.
JJLLAARRCC RReeppoorrtt SSuummmmaarryy:: RReevviieeww ooff VViirrggiinniiaa’’ss CCoorrppoorraattee IInnccoommee TTaaxx SSyysstteemm
The Virginia corporate income tax (CIT) generated nearly $650 million in 2009,paid largely by a small subset of taxpayers comprised of multistate, highly prof-itable corporations. (Chapter 1)
Virginia’s CIT system is largely consistent with that of other states with respectto the businesses subject to the tax, income considered taxable, calculation of taxliability, and use of tax credits. (Chapters 2-5)
Virginia has adopted certain tax policies that differ from most states, such as re-ducing its ability to tax out-of-state corporations to the full extent permitted byfederal law, imposing a lower tax rate, and not offering broad-based capital in-vestment or research and development tax credits. (Chapters 2-5)
Because Virginia’s CIT system is consistent with that of other states and oftenmore favorable to corporations, it does not appear to significantly hinder theState’s economic development efforts, particularly in light of its highly favorablebusiness climate. During the past two decades, Virginia gained 53,000 more jobsfrom corporate relocations to the State than it lost to other states. (Chapter 6)
Several targeted changes could be made to Virginia’s corporate income tax sys-tem to improve its alignment with principles of sound tax policy and addressspecific concerns. In particular, the State could consider adopting market-basedsourcing for providers of services and intangible goods while exercising its rightto tax such out-of-state corporations to the full extent permissible under federallaw. (Chapter 7)
Several major restructuring initiatives could be considered in Virginia, but mostcarry significant risks that may outweigh potential benefits, particularly in lightof the State’s favorable business environment. (Chapter 8)
KKee y
y FF
ii nndd
ii nngg
ss
JLARC Report Summary ii
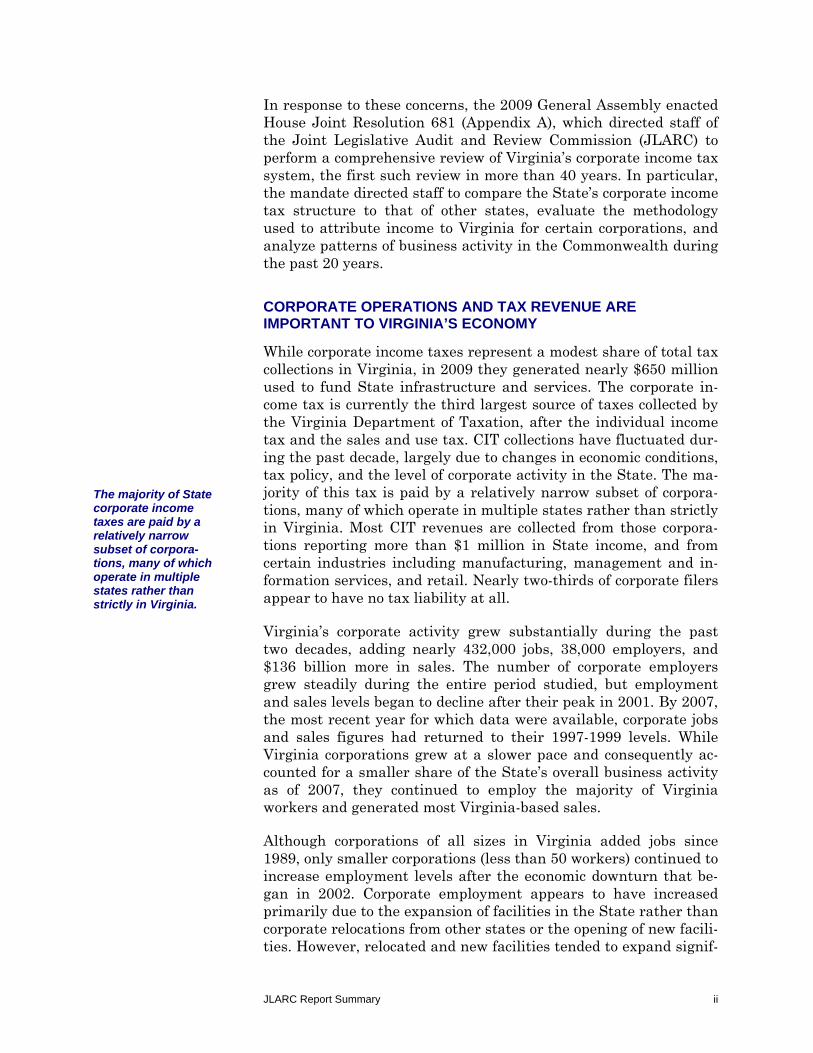
In response to these concerns, the 2009 General Assembly enacted House Joint Resolution 681 (Appendix A), which directed staff of the Joint Legislative Audit and Review Commission (JLARC) to perform a comprehensive review of Virginia’s corporate income tax system, the first such review in more than 40 years. In particular, the mandate directed staff to compare the State’s corporate income tax structure to that of other states, evaluate the methodology used to attribute income to Virginia for certain corporations, and analyze patterns of business activity in the Commonwealth during the past 20 years.
CORPORATE OPERATIONS AND TAX REVENUE ARE IMPORTANT TO VIRGINIA’S ECONOMY
While corporate income taxes represent a modest share of total tax collections in Virginia, in 2009 they generated nearly $650 million used to fund State infrastructure and services. The corporate in-come tax is currently the third largest source of taxes collected by the Virginia Department of Taxation, after the individual income tax and the sales and use tax. CIT collections have fluctuated dur-ing the past decade, largely due to changes in economic conditions, tax policy, and the level of corporate activity in the State. The ma-jority of this tax is paid by a relatively narrow subset of corpora-tions, many of which operate in multiple states rather than strictly in Virginia. Most CIT revenues are collected from those corpora-tions reporting more than $1 million in State income, and from certain industries including manufacturing, management and in-formation services, and retail. Nearly two-thirds of corporate filers appear to have no tax liability at all.
Virginia’s corporate activity grew substantially during the past two decades, adding nearly 432,000 jobs, 38,000 employers, and $136 billion more in sales. The number of corporate employers grew steadily during the entire period studied, but employment and sales levels began to decline after their peak in 2001. By 2007, the most recent year for which data were available, corporate jobs and sales figures had returned to their 1997-1999 levels. While Virginia corporations grew at a slower pace and consequently ac-counted for a smaller share of the State’s overall business activity as of 2007, they continued to employ the majority of Virginia workers and generated most Virginia-based sales.
Although corporations of all sizes in Virginia added jobs since 1989, only smaller corporations (less than 50 workers) continued to increase employment levels after the economic downturn that be-gan in 2002. Corporate employment appears to have increased primarily due to the expansion of facilities in the State rather than corporate relocations from other states or the opening of new facili-ties. However, relocated and new facilities tended to expand signif-
The majority of State corporate income taxes are paid by a relatively narrow subset of corpora-tions, many of which operate in multiple states rather than strictly in Virginia.
JLARC Report Summary iii
icantly after they began operating in Virginia. Employment pat-terns also varied substantially by industry: job growth was largely in the service and retail sectors, while substantial losses occurred in the manufacturing and mining industries. Moreover, the vast majority of job gains occurred in Northern Virginia and Hampton Roads, while the southern and western portions of the State lost jobs.
Based on an analysis of corporate relocations to and from Virginia during the past two decades, it appears that Virginia actively com-petes for corporate investment mostly with large states on the Eastern Seaboard, as well as Texas, California, and Illinois. Many of these states share similar economic and demographic character-istics with Virginia. Although these states represent the Com-monwealth’s primary domestic competitors for economic develop-ment, Virginia faces an unknown, and potentially sizeable, level of international competition.
VIRGINIA AND MOST OTHER STATES IMPOSE CORPORATE INCOME TAXES ONLY ON CERTAIN CORPORATIONS
Like most other states, Virginia taxes corporations based on their income. Four other states tax business activity based on a measure of sales rather than income, and three states do not tax corporate activity at all but rely instead on other taxes. Most states, includ-ing Virginia, require only C corporations to pay the corporate in-come tax whereas other types of businesses, such as limited liabil-ity companies and partnerships, are generally taxed through the individual income tax system. Additionally, Virginia and many states exempt certain C corporations such as banks, insurance companies, and public service corporations from their CIT but sub-ject them to other forms of taxation instead.
Unlike most states, Virginia has chosen not to tax out-of-state cor-porations to the full extent allowed by federal law. While federal restrictions prevent states from imposing income taxes on corpora-tions whose only activity in the state involves the solicitation of sales of tangible goods, Virginia has opted to extend these protec-tions to providers of services and intangible goods. Further, State policies preclude corporations from having an income tax liability if they have no physical presence in Virginia. In contrast, many states tax providers of services and intangible goods based on their economic activity in the state, whether or not they are physically present in their state.
C Corporation
A C corporation is an incorporated legal entity named after Subchapter C of Chap-ter 1 of the Internal Revenue Code. Busi-nesses that issue mul-tiple classes of stock must form as C corpo-rations.
Unlike most states, Virginia has chosen not to tax out-of-state corporations to the full extent allowed by federal law.
JLARC Report Summary iv
VIRGINIA AND OTHER STATES DETERMINE TAXABLE INCOME SIMILARLY, BUT NEW TRENDS ARE EMERGING
Like most other states, Virginia relies heavily on the federal tax structure by requiring corporations to use their federal taxable in-come as the starting point in calculating their State taxable in-come. However, Virginia and most states have chosen not to con-form to certain federal rules because they are either not relevant to state tax systems, costly to implement, or in conflict with state policy goals. The most common adjustments pertain to the treat-ment of certain income sources and expenses as well as deprecia-tion and losses. The number and magnitude of these adjustments can significantly impact how much corporate income is taxable in a state.
Virginia and many states currently allow affiliated corporations to elect whether to file separately or as a group. In Virginia, such corporations can select one of three formats, including two group filing formats, which can have a significant impact on their tax li-ability. However, an increasing number of states have either con-sidered or acted upon requiring affiliated corporations to file as a single group. According to the research literature, group returns better reflect business income and activity in a given state, and can mitigate the negative impact of aggressive tax planning on tax revenues.
Because aggressive tax planning strategies can be used to unduly reduce the amount of income taxable in a given state, Virginia and most other states have implemented mechanisms designed to elim-inate interstate activities that do not fulfill a valid business pur-pose. Like most of its competitors, Virginia requires corporations to add back certain sources of income transferred between related parties. Unlike the majority of states that impose a CIT, Virginia and most of its competitors do not use a more comprehensive mechanism called mandatory unitary combined reporting.
VIRGINIA AND MOST STATES CALCULATE TAX LIABILITY SIMILARLY, BUT APPORTIONMENT METHODS ARE CHANGING
Virginia taxes corporations at a stable and relatively low flat rate of six percent. In fact, Florida is the only one of the State’s ten ma-jor competitors that has a lower corporate tax rate (5.5 percent). Each state’s CIT rate is applied only to the portion of a corpora-tion’s income attributable to that state. Because uniform guide-lines have been developed, Virginia and most other states use similar apportionment and allocation processes to attribute corpo-rate income to their state. In particular, most states require corpo-rations to apportion income based on their proportion of property, payroll, and sales in the state.
JLARC Report Summary v
While property, payroll, and sales were historically given equal weight in calculating how much income corporations should at-tribute to a state, Virginia and most other states have been placing increasing weight on their share of corporate sales. In fact, a num-ber of states now require that corporations apportion income based only on their sales (a practice known as single sales factor appor-tionment). Virginia and several states have adopted the single sales factor methodology only for certain industries, such as manu-facturing. However, Virginia is one of few states that give taxpay-ers the option to use this method only if it results in a lower tax li-ability. Although this methodology is often adopted to retain or add jobs, Virginia appears to be the only state that imposes penal-ties on corporations that choose to use single sales factor appor-tionment but subsequently reduce employment levels.
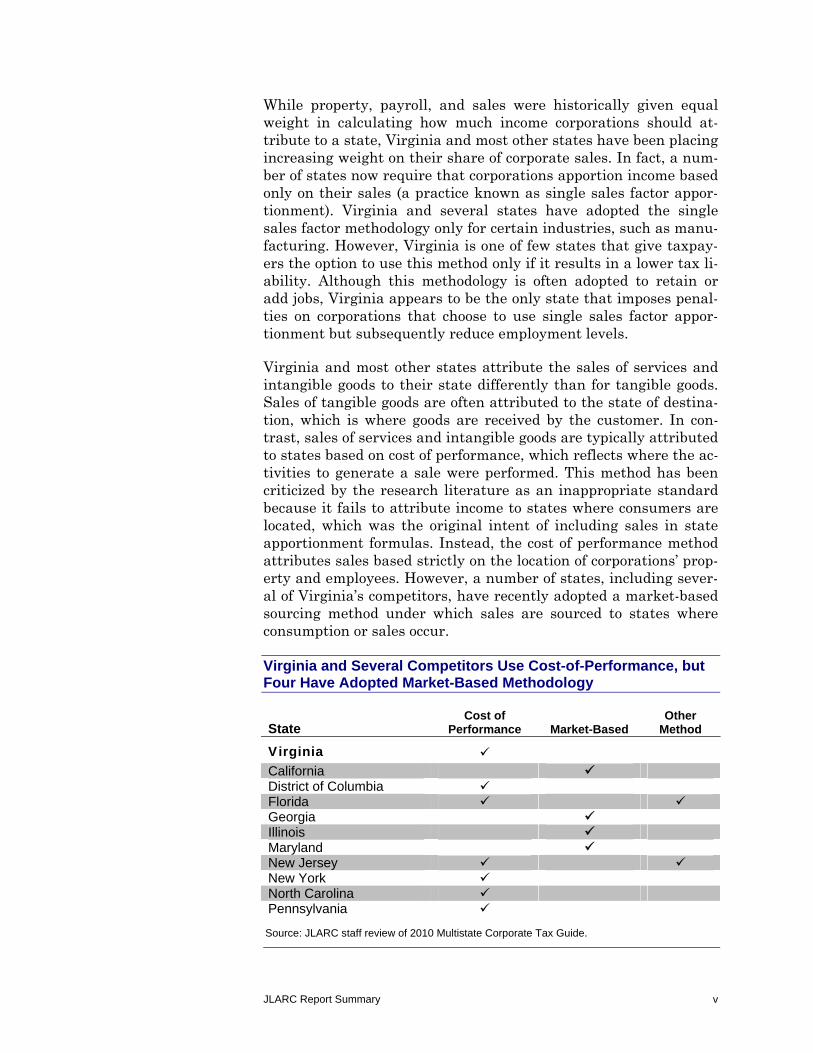
Virginia and most other states attribute the sales of services and intangible goods to their state differently than for tangible goods. Sales of tangible goods are often attributed to the state of destina-tion, which is where goods are received by the customer. In con-trast, sales of services and intangible goods are typically attributed to states based on cost of performance, which reflects where the ac-tivities to generate a sale were performed. This method has been criticized by the research literature as an inappropriate standard because it fails to attribute income to states where consumers are located, which was the original intent of including sales in state apportionment formulas. Instead, the cost of performance method attributes sales based strictly on the location of corporations’ prop-erty and employees. However, a number of states, including sever-al of Virginia’s competitors, have recently adopted a market-based sourcing method under which sales are sourced to states where consumption or sales occur.
Virginia and Several Competitors Use Cost-of-Performance, but Four Have Adopted Market-Based Methodology
State Cost of
Performance Market-Based Other
Method
Virginia
California District of Columbia Florida Georgia Illinois Maryland New Jersey New York North Carolina Pennsylvania
Source: JLARC staff review of 2010 Multistate Corporate Tax Guide.
JLARC Report Summary vi
VIRGINIA AND MOST STATES OFFER CORPORATE TAX CREDITS, BUT VIRGINIA’S APPEAR MORE LIMITED
Like most other states, Virginia currently offers numerous CIT credits to incentivize desirable behaviors, but the credits tend to be narrowly targeted and several may not be accomplishing their in-tended purpose. More than 20 tax credits are available for job cre-ation, certain types of capital investments, and other activities ranging from providing low-income housing to preserving land. In 2006, corporations claimed credits totaling $58.6 million, of which the majority ($48.0 million) was awarded for job creation. Most Virginia tax credits can be used over the course of several years but can seldom be refunded or transferred to other taxpayers, while nearly half of the credits include provisions allowing them to expire. Of the 22 tax credits available in 2006, six were granted to fewer than four businesses and six were not claimed at all.
In addition to encouraging desirable outcomes, tax credits can also be used as a tool to compete against other states for new corporate investments. However, Virginia’s tax credits tend to be less gener-ous than those provided by competitors. Virginia’s Major Business Facility Job Tax Credit provides $1,000 per job created, whereas competitor states offer between $750 and $12,500 per job. Moreo-ver, Virginia is one of only four states that offer neither a broad-based capital investment nor a research and development tax cred-it. Like Virginia, most other states allow tax credits to carry over as opposed to being refundable or transferrable.
VIRGINIA CORPORATE INCOME TAX SYSTEM DOES NOT APPEAR TO HINDER ECONOMIC DEVELOPMENT
In light of its favorable business climate, Virginia’s corporate in-come tax system does not appear to be a major detraction from the State’s economic development efforts. In general, state CIT struc-tures have been found to have only a marginal effect on business decisions, and Virginia’s system does not appear to treat corpora-tions less favorably than other states in most respects. Although corporations consider a state’s overall tax environment when mak-ing business decisions, state corporate income taxes represent only a subset of corporations’ overall tax burden, approximately five percent on average. Moreover, corporations weigh many other fac-tors, such as labor costs, that are equally and in some cases more important than corporate income taxes. Still, a state’s CIT system can sway a company’s decisions if it is markedly different from other states or is perceived to treat certain industries or corpora-tions inequitably. Tax structures can help differentiate otherwise comparable states and can promote economic development so long as other necessary factors are already in place.
JLARC Report Summary vii
In addition to its competitive CIT structure, Virginia has been named the “best state for business” by CNBC and Forbes several times over the last decade. This title is a reflection of Virginia’s well-educated labor force, favorable transportation infrastructure, and low tax burden. Moreover, an analysis of job migration in and out of Virginia over the last two decades suggests that the State has successfully competed against many of its top competitors. During that period, 53,000 more jobs were gained from corporate relocations to Virginia than lost to other states, 86 percent of which originated from the State’s top competitors. Still, Virginia’s economic development grants, which are used to compete with oth-er states and may be more cost effective than tax incentives, are not as large as those offered by competitors and are not consistent-ly aligned with the industries targeted by Virginia.
TARGETED CHANGES COULD BE MADE TO IMPROVE VIRGINIA’S CORPORATE INCOME TAX SYSTEM
Because Virginia’s CIT system is largely consistent with other states and is generally well regarded by corporations, it does not appear to require a major redesign. However, several targeted changes could be made to improve the system’s alignment with key principles of sound tax policy – simplicity, equitability, reliability, and economic favorability – and to address specific concerns raised by Virginia tax professionals and corporate representatives. While these options could all improve aspects of Virginia’s corporate tax system, they present some disadvantages that must be weighed against potential benefits. In particular, Virginia could consider making the following changes:
Adopting market-based sourcing while taxing out-of-state providers of services and intangible goods to the full extent permissible by law. Replacing Virginia’s cost of performance method with market-based sourcing could im-prove the equitability of Virginia’s CIT system by ensuring that providers of services and intangible goods are taxed in a similar manner as providers of tangible goods. This approach would also reduce the likelihood that Virginia-based provid-ers of services and intangible goods might apportion more than 100 percent of their income on a national basis.
However, adopting market-based sourcing could negatively impact State revenue unless Virginia begins taxing out-of-state providers of services and intangible goods to the full ex-tent allowed by federal law. This would expand Virginia’s tax base and lessen reliance for tax revenue on multistate corpo-rations with a large physical presence in Virginia. Based on an analysis of State and federal tax data, Virginia could col-lect up to $248.7 million more per year from out-of-state cor-
Public Law 86-272
Public Law 86-272 was adopted to prohibit states from imposing income taxes on corpo-rations whose sole activity in a state in-cludes soliciting sales of tangible property. Virginia has opted to extend this protection to providers of services and intangible goods.
JLARC Report Summary viii
porations once this option is fully phased-in, assuming the same corporate profits as in 2006 and full taxpayer compli-ance (data limitations reduce the precision of this estimate.) This option may be the most beneficial for Virginia to pursue, as potential advantages appear to outweigh disadvantages.
Adopting a factor presence nexus standard. Factor presence creates a concrete threshold for the level of physical presence and/or sales above which corporations are taxable in a state (known as nexus). This option could make it easier for the State and corporations to determine which businesses are subject to Virginia’s CIT. Because corporations that fall below the prescribed threshold would no longer be required to file or pay income taxes in Virginia, this option could re-duce the administrative and compliance burden, but would also likely reduce State revenue.
Limiting the filing formats available to affiliated groups of corporations. Virginia could require affiliated corporations with nexus in the State to file a group return ra-ther than giving them the option to file either a separate, combined, or consolidated return. This option could enhance the reliability of the State CIT system by more appropriately reflecting the tax liability of affiliated corporations partici-pating in similar business activities, and improve simplicity by reducing the number of returns filed. The State could also consider eliminating one of its two group filing formats, a practice that does not appear to have a valid policy purpose but may create an opportunity for corporations to select the format that minimizes their tax liability. While eliminating the combined filing format could result in a modest reduction in State revenue, eliminating the consolidated filing format could significantly increase the tax liability of certain corpo-rations such as manufacturers.
Altering the single sales factor methodology. To hold manufacturing companies accountable for minimizing job losses in the State while offering a tax incentive to do so, Virginia could prorate penalties based on the decrease in employment relative to the baseline rather than imposing a penalty on the entire tax benefit of using the single sales fac-tor methodology for even a small decline in employment. Vir-ginia could also simplify the tax system and increase reve-nues by requiring manufacturing corporations to use this methodology rather than leaving it optional. However, this action could increase the tax liability of many manufacturers, especially those that have a small presence in Virginia. Ex-tending this methodology to all industries could also be more equitable and easier from an administration and compliance
JLARC Report Summary ix
standpoint, but would likely reduce State revenues signifi-cantly if it is made optional.
Improving the structure and effectiveness of corpo-rate tax credits. Increasing the value of existing credits or offering new credits for specific activities could encourage greater investment in Virginia. Tax credits could also be per-ceived as more appealing if they were refundable. Still, cer-tain credits appear to be ineffective based on their limited utilization and could be eliminated. To make tax credits more effective and useful, a periodic report on their performance could be issued, and sunset provisions could be applied.
MAJOR TAX RESTRUCTURING COULD DISRUPT RELIABILITY
Several major restructuring initiatives could be considered in Vir-ginia, but most carry significant risks that may outweigh potential benefits, particularly in light of the State’s favorable business en-vironment. Further, extensive changes may be a disproportionate response to the targeted concerns raised by Virginia tax profes-sionals and corporate representatives. The impact of major re-structuring could be difficult to accurately predict for the State and businesses alike. Widespread changes could also disrupt the cer-tainty and stability of Virginia’s corporate income tax policies, which have been cited as positive features. Still, the State should continue to examine the need for restructuring in light of the dy-namic nature of businesses and the economy. Major changes that could be considered include:
Exempting small corporations from income taxes. This option could simplify the tax system and have a positive yet modest impact on economic growth among smaller corpora-tions, which tend to bear a heavy tax compliance burden but contribute a small share of CIT collections. However, this practice could lead to inequities with larger corporations and non-corporate small businesses, reduce State revenues, and create uncertainty about future tax liability.
Eliminating the corporate income tax. This option could provide an incentive for corporations to remain or locate in the State, simplify the tax system, and positively affect Vir-ginia’s employment and Gross State Product (GSP) assuming favorable, yet less realistic, conditions. However, dynamic modeling results indicate that the magnitude of these poten-tial gains appears insufficient to offset losses in CIT revenue, even under the most favorable scenario. While employment and GSP could increase by approximately 0.25 percent after five years, Virginia could recoup approximately nine percent of foregone corporate income taxes through increases in other revenue sources, such as the individual income tax. Further,
JLARC Report Summary x
Virginia employment and GSP could decline if less favorable but more realistic conditions are assumed. Exempting corpo-rations from income taxes could have mixed effects on equi-tability, as it would not benefit business entities taxed under the individual income tax system, but would result in corpo-rate income being taxed only once.
Taxing pass-through entities through the corporate rather than individual income tax. This option could im-prove equitability toward corporations, which are very simi-lar to pass-through entities but tend to be taxed less favora-bly. However, this major change could have negative economic consequences for the State if pass-through entities avoid doing business in Virginia or choose to relocate to other states with a more advantageous tax structure, and for those businesses that experience increases in their tax liability.
Taxing corporations based on a measure of sales ra-ther than income. This structure could lead to a more sta-ble stream of tax collections than the corporate income tax, which is volatile. However, this option could greatly increase the CIT system’s complexity, unless it replaces multiple tax systems. Still, limited experience is available to fully under-stand the potential ramifications of this option and the few states using this practice have experienced mixed results.
Imposing a minimum tax. While this option could increase State revenue, it would violate a key purpose of income taxa-tion, which is to impose a tax based on the ability to pay. This practice could also add complexity as corporations would have to calculate their tax liability on two different bases.
Fully conforming to federal tax rules. This option could greatly enhance the simplicity of the corporate income tax system for corporations and the State alike, but would likely be accompanied by significant and unknown revenue losses.
Adopting mandatory unitary combined reporting. This mechanism appears to be very effective for negating the ef-fects of certain aggressive tax planning strategies that Vir-ginia’s tax system currently does not address. However, there is great uncertainty about the potential fiscal impact of this option, which could be positive or negative. Adopting this mechanism could also be perceived as detrimental to the State’s business environment, and could be difficult to im-plement for both the State and corporations.
Replacing tax credits with grant programs. Administer-ing incentives outside of the tax system could reduce admin-istrative and compliance burdens. Unlike tax credits, the benefits of discretionary grants are evaluated before they are awarded, which could improve the effectiveness of incentives.
Pass-Through Entities
S corporations, limited liability companies, and partnerships are collec-tively referred to as pass-through entities because they pass business income through to their owners rather than being taxed directly as entities.
Chapter 1: Corporate Operations and Tax Revenue Are Important to Virginia’s Economy 1
While taxation is inherently complex, state corporate income tax (CIT) systems are thought to be especially cumbersome relative to the amount of revenue they generate, according to tax profession-als and economists. The complexity of these tax systems is com-pounded by attempts to achieve policy goals, such as equitability, that may not reconcile with other goals such as simplicity. Moreo-ver, states often adopt tax practices aimed at attracting businesses and thus stimulating their economy rather than strictly to gener-ate revenue. In the absence of periodic review, tax systems can evolve into a set of overly complex, inequitable, and outdated prac-tices.
In response to these concerns, the 2009 General Assembly enacted House Joint Resolution 681 (HJR 681, Appendix A), which directed staff of the Joint Legislative Audit and Review Commission (JLARC) to perform a comprehensive review of Virginia’s corporate income tax system, the first such review in more than 40 years. In particular, the mandate directs staff to compare the State’s corpo-rate income tax structure to that of other states, evaluate the methodology used to attribute income to Virginia for certain corpo-rations, and analyze patterns of business activity in the Common-wealth during the past 20 years.
JLARC staff reviewed the Code of Virginia and Virginia Adminis-trative Code, and Virginia Department of Taxation guidance doc-uments to determine which businesses pay Virginia’s CIT and
Ch
apte
r
11
CCoorrppoorraattee OOppeerraattiioonnss aanndd TTaaxx RReevveennuuee AArree IImmppoorrttaanntt ttoo VViirrggiinniiaa’’ss EEccoonnoommyy
Despite fluctuations over time, Virginia’s corporate income tax has raised more than$600 million of revenue in each of the last five years. While more than 70,000 corpo-rations file a State income tax return each year, tax revenues appear to be primarilygenerated by a subset of all filers comprised largely of multistate, highly profitablecorporations representing a few industries. Corporate income tax collections arefundamentally driven by the level of corporate activity taking place in the State.Virginia corporations have experienced significant growth over the last two decadesdespite several economic downturns, but they have nonetheless represented a de-clining share of the State’s economic activity relative to other types of businesses. Ananalysis of business activity suggests that corporate growth can be primarily at-tributed to the expansion of existing businesses, especially in certain industries andregions. In attempting to increase corporate activity, Virginia appears to activelycompete against larger states located primarily along the Eastern Seaboard.
II nn SS
uumm
mmaa r
r yy
Chapter 1: Corporate Operations and Tax Revenue Are Important to Virginia’s Economy 2
what forms of income are taxable, how tax liability is calculated, and what tax credits are available in the Commonwealth. To ob-tain comparable information about other states, staff also reviewed the 2010 Multistate Corporate Tax Guide, state tax department websites, and the research literature. Key issues and potential op-tions were identified through site visits to several Virginia corpo-rations, a survey of businesses, structured interviews with public and private tax professionals, and a review of the research litera-ture. CIT return data were analyzed to substantiate issues and evaluate potential options. Appendix B contains more detail about the research activities and methods used in conducting this study.
CORPORATE INCOME TAXES ARE SIGNIFICANT REVENUE STREAM FOR VIRGINIA
While the corporate income tax represents a modest share of total tax collections in Virginia, it generates a substantial amount of annual revenues used to fund State government. The vast majority of the tax has consistently been paid by a relatively small number of Virginia corporations. The amount collected each year tends to fluctuate based on economic conditions, the numerous changes in tax rules enacted at the State and federal levels, and the amount of corporate activity taking place in Virginia.
Corporations Represent a Minority of Virginia Businesses
While a subset of businesses elect to organize as C corporations, the majority are structured as pass-through entities (PTEs) or sole proprietorships in Virginia. C corporations (named after Sub-chapter C of Chapter 1 of the Internal Revenue Code) are the only type of business that can issue multiple classes of stock and that are subject to the State corporate income tax. S corporations, lim-ited liability companies, and partnerships are collectively referred to as pass-through entities because they pass business income through to their owners rather than being taxed directly as enti-ties. Sole proprietorships are businesses owned and operated by one person. Unlike C corporations, PTEs and sole proprietorships are primarily taxed through the Virginia individual income tax system. In tax year 2007, more than twice as many Virginia in-come tax returns were filed by PTEs (172,000) as by C corporations (71,000). According to the Internal Revenue Service, more than 535,000 Virginia sole proprietors filed federal individual income tax returns in 2007.
Corporations Are Taxed to Help Finance State Services
The fundamental purpose of all taxes is to raise revenue to finance public programs and services. Nearly all states impose an income
In 2007, more than twice as many Vir-ginia income tax re-turns were filed by PTEs as by C corpo-rations.
Chapter 1: Corporate Operations and Tax Revenue Are Important to Virginia’s Economy 3
tax on corporations because they benefit from many of these pro-grams and services. For example, corporations use state-maintained roads to transport goods, hire employees who have been educated and trained in state-funded facilities, and rely on state courts to resolve legal matters. In addition, taxes imposed upon corporations are a means to tax income earned within a state’s borders but distributed to non-resident shareholders, most of whom are not subject to that state’s individual income tax.
Corporate Income Tax Receipts Are Modest but Important Component of State Revenue
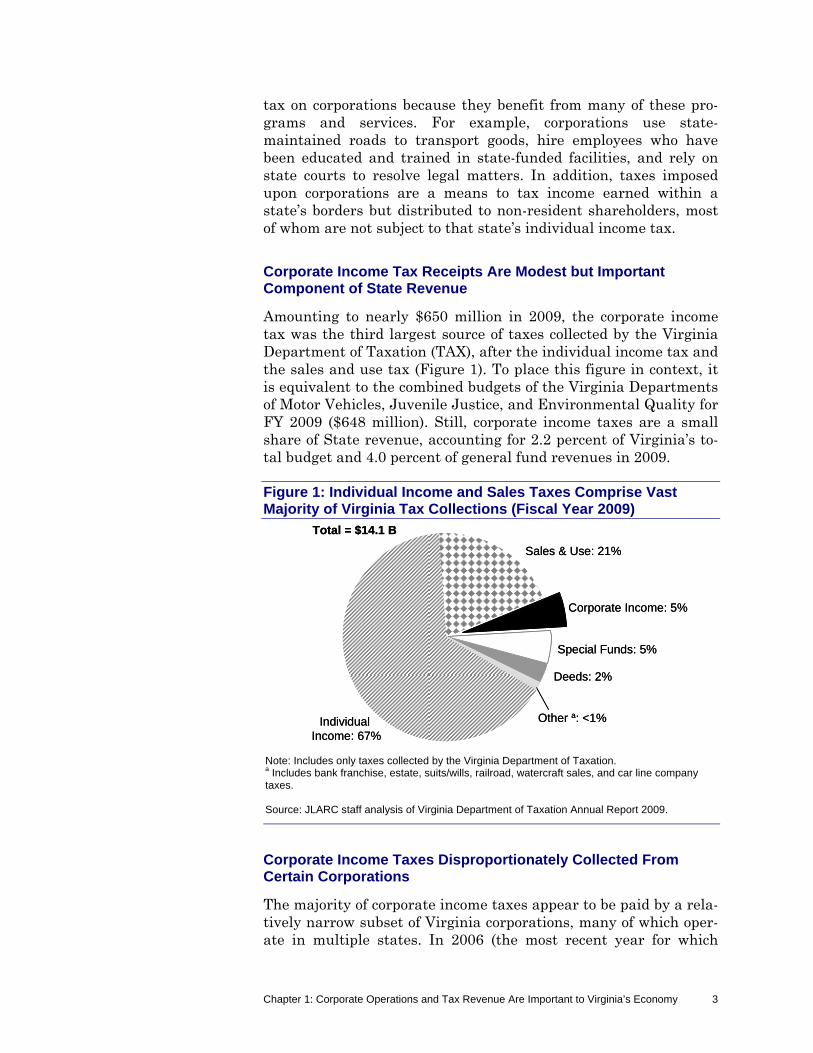
Amounting to nearly $650 million in 2009, the corporate income tax was the third largest source of taxes collected by the Virginia Department of Taxation (TAX), after the individual income tax and the sales and use tax (Figure 1). To place this figure in context, it is equivalent to the combined budgets of the Virginia Departments of Motor Vehicles, Juvenile Justice, and Environmental Quality for FY 2009 ($648 million). Still, corporate income taxes are a small share of State revenue, accounting for 2.2 percent of Virginia’s to-tal budget and 4.0 percent of general fund revenues in 2009.
Figure 1: Individual Income and Sales Taxes Comprise Vast Majority of Virginia Tax Collections (Fiscal Year 2009)
Note: Includes only taxes collected by the Virginia Department of Taxation. a Includes bank franchise, estate, suits/wills, railroad, watercraft sales, and car line company taxes. Source: JLARC staff analysis of Virginia Department of Taxation Annual Report 2009.
Corporate Income Taxes Disproportionately Collected From Certain Corporations
The majority of corporate income taxes appear to be paid by a rela-tively narrow subset of Virginia corporations, many of which oper-ate in multiple states. In 2006 (the most recent year for which
Individual Income: 67%
Sales & Use: 21%
Corporate Income: 5%
Special Funds: 5%
Deeds: 2%
Other a: <1%
Total = $14.1 B
Individual Income: 67%
Sales & Use: 21%
Corporate Income: 5%
Special Funds: 5%
Deeds: 2%
Other a: <1%
Total = $14.1 B
Chapter 1: Corporate Operations and Tax Revenue Are Important to Virginia’s Economy 4
complete information was available), only one-third of corporations that filed a Virginia income tax return earned income in multiple states, but these companies accounted for 87 percent of all corpo-rate income taxes collected, while the remaining 13 percent was collected from corporations doing business only in Virginia. While Virginia-only corporations are more numerous, they also tend to be smaller and earn less income, thereby incurring a lower tax liabil-ity.
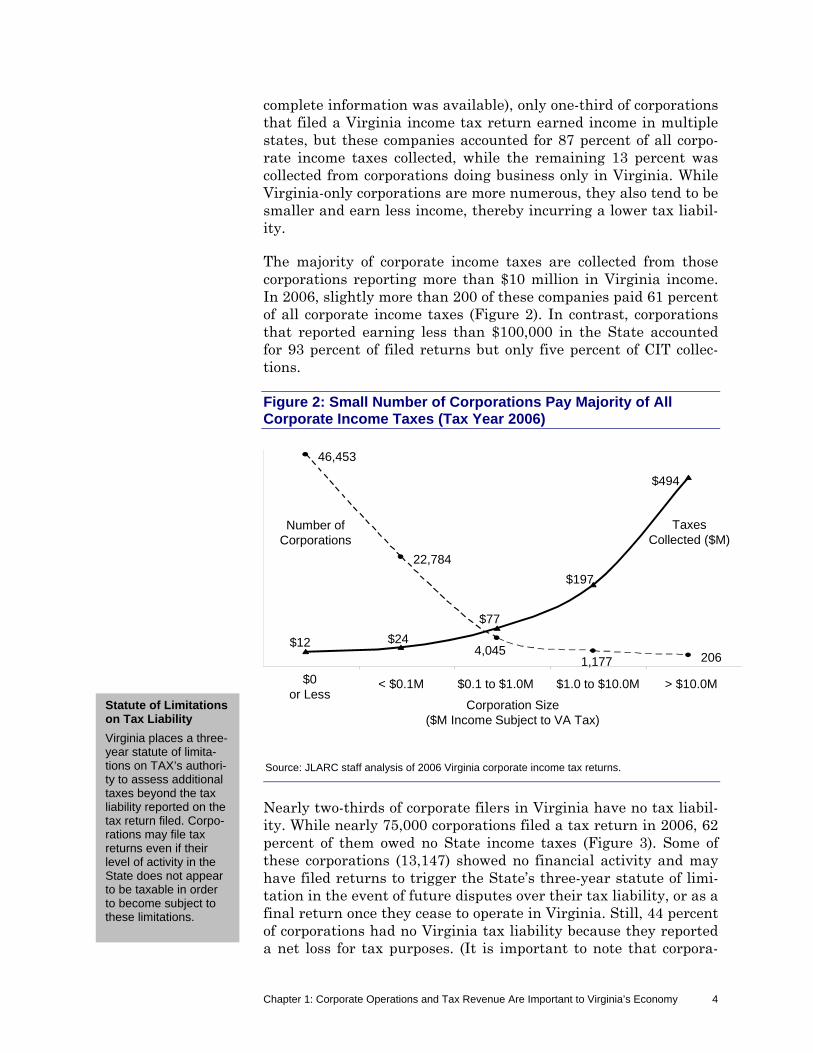
The majority of corporate income taxes are collected from those corporations reporting more than $10 million in Virginia income. In 2006, slightly more than 200 of these companies paid 61 percent of all corporate income taxes (Figure 2). In contrast, corporations that reported earning less than $100,000 in the State accounted for 93 percent of filed returns but only five percent of CIT collec-tions.
Figure 2: Small Number of Corporations Pay Majority of All Corporate Income Taxes (Tax Year 2006)
$0 or Less
< $0.1M $0.1 to $1.0M $1.0 to $10.0M > $10.0M
Number of Corporations
Taxes Collected ($M)
$12 $24
$77
$197
$494
46,453
22,784
4,0451,177 206
Corporation Size($M Income Subject to VA Tax)
Source: JLARC staff analysis of 2006 Virginia corporate income tax returns.
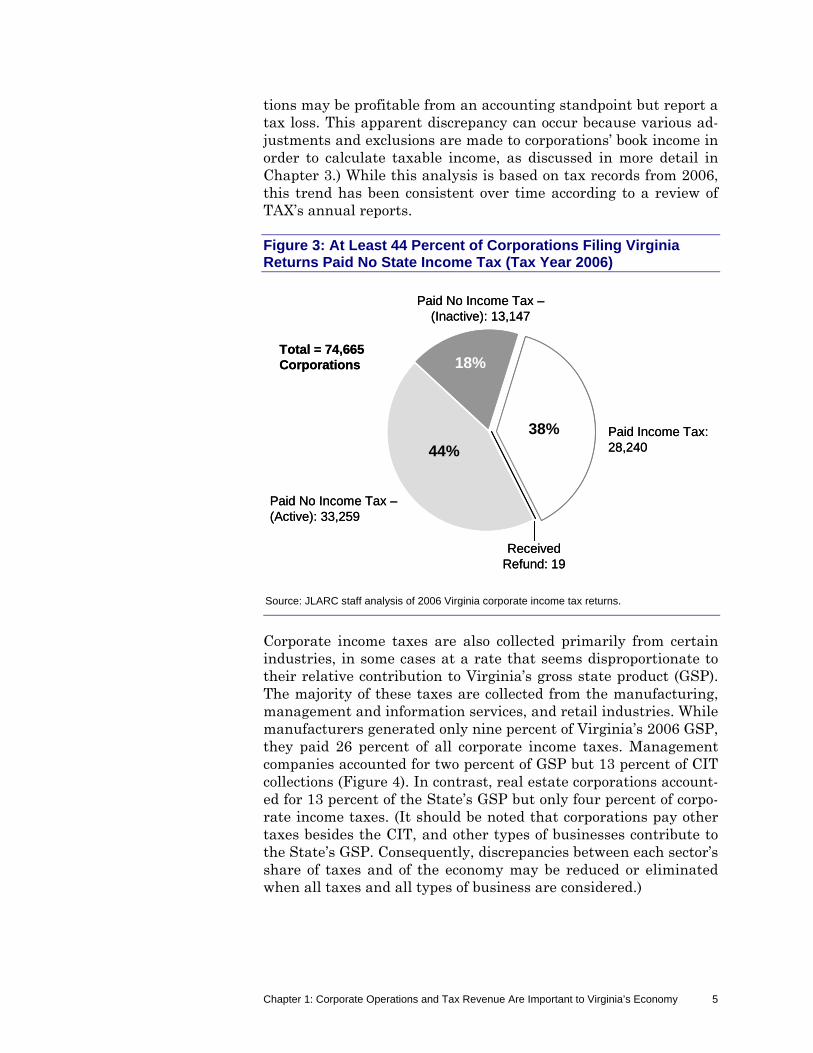
Nearly two-thirds of corporate filers in Virginia have no tax liabil-ity. While nearly 75,000 corporations filed a tax return in 2006, 62 percent of them owed no State income taxes (Figure 3). Some of these corporations (13,147) showed no financial activity and may have filed returns to trigger the State’s three-year statute of limi-tation in the event of future disputes over their tax liability, or as a final return once they cease to operate in Virginia. Still, 44 percent of corporations had no Virginia tax liability because they reported a net loss for tax purposes. (It is important to note that corpora-
Statute of Limitations on Tax Liability
Virginia places a three-year statute of limita-tions on TAX’s authori-ty to assess additional taxes beyond the tax liability reported on the tax return filed. Corpo-rations may file tax returns even if their level of activity in the State does not appear to be taxable in order to become subject to these limitations.
Chapter 1: Corporate Operations and Tax Revenue Are Important to Virginia’s Economy 5
tions may be profitable from an accounting standpoint but report a tax loss. This apparent discrepancy can occur because various ad-justments and exclusions are made to corporations’ book income in order to calculate taxable income, as discussed in more detail in Chapter 3.) While this analysis is based on tax records from 2006, this trend has been consistent over time according to a review of TAX’s annual reports.
Figure 3: At Least 44 Percent of Corporations Filing Virginia Returns Paid No State Income Tax (Tax Year 2006)
Source: JLARC staff analysis of 2006 Virginia corporate income tax returns.
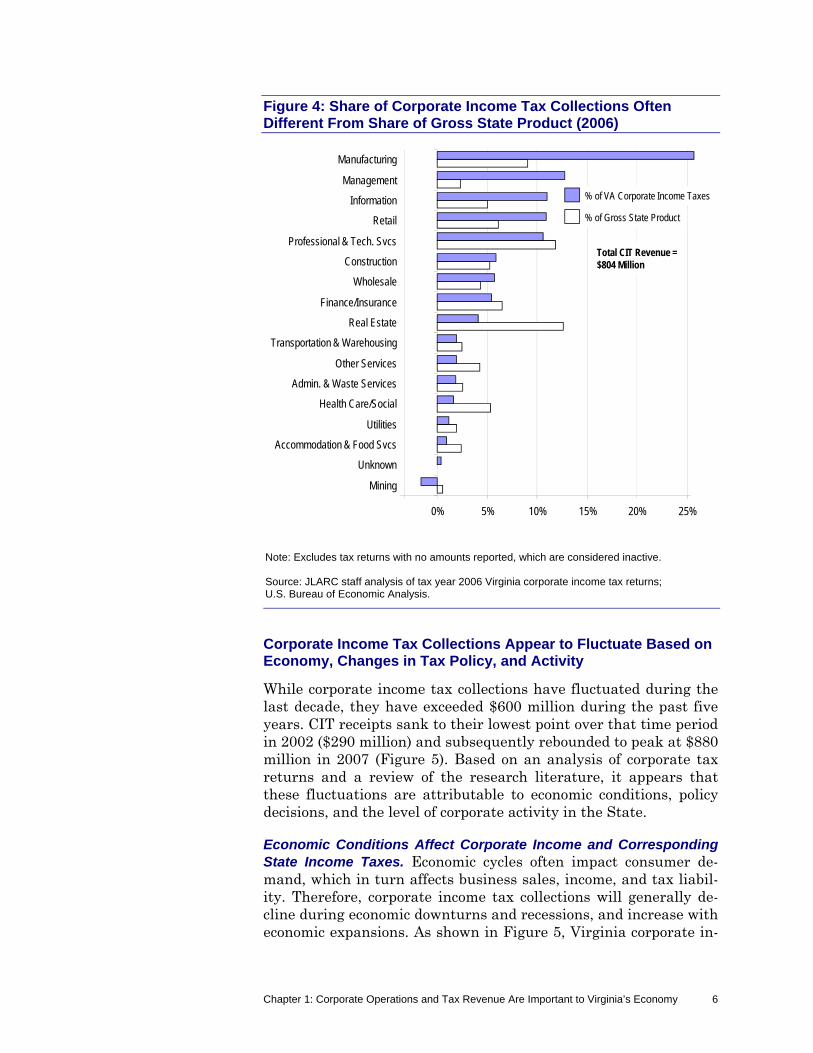
Corporate income taxes are also collected primarily from certain industries, in some cases at a rate that seems disproportionate to their relative contribution to Virginia’s gross state product (GSP). The majority of these taxes are collected from the manufacturing, management and information services, and retail industries. While manufacturers generated only nine percent of Virginia’s 2006 GSP, they paid 26 percent of all corporate income taxes. Management companies accounted for two percent of GSP but 13 percent of CIT collections (Figure 4). In contrast, real estate corporations account-ed for 13 percent of the State’s GSP but only four percent of corpo-rate income taxes. (It should be noted that corporations pay other taxes besides the CIT, and other types of businesses contribute to the State’s GSP. Consequently, discrepancies between each sector’s share of taxes and of the economy may be reduced or eliminated when all taxes and all types of business are considered.)
Paid No Income Tax –(Inactive): 13,147
Paid Income Tax: 28,240
Paid No Income Tax –(Active): 33,259
Received Refund: 19
Total = 74,665 Corporations
38%
18%
44%
Paid No Income Tax –(Inactive): 13,147
Paid Income Tax: 28,240
Paid No Income Tax –(Active): 33,259
Received Refund: 19
Total = 74,665 Corporations
38%
18%
44%
Chapter 1: Corporate Operations and Tax Revenue Are Important to Virginia’s Economy 6
Figure 4: Share of Corporate Income Tax Collections Often Different From Share of Gross State Product (2006)
0% 5% 10% 15% 20% 25%
Mining
Unknown
Accommodation & Food Svcs
Utilities
Health Care/Social
Admin. & Waste Services
Other Services
Transportation & Warehousing
Real Estate
Finance/Insurance
Wholesale
Construction
Professional & Tech. Svcs
Retail
Information
Management
Manufacturing
% of VA Corporate Income Taxes
% of Gross State Product
Total CIT Revenue = $804 Million
Note: Excludes tax returns with no amounts reported, which are considered inactive. Source: JLARC staff analysis of tax year 2006 Virginia corporate income tax returns; U.S. Bureau of Economic Analysis.
Corporate Income Tax Collections Appear to Fluctuate Based on Economy, Changes in Tax Policy, and Activity
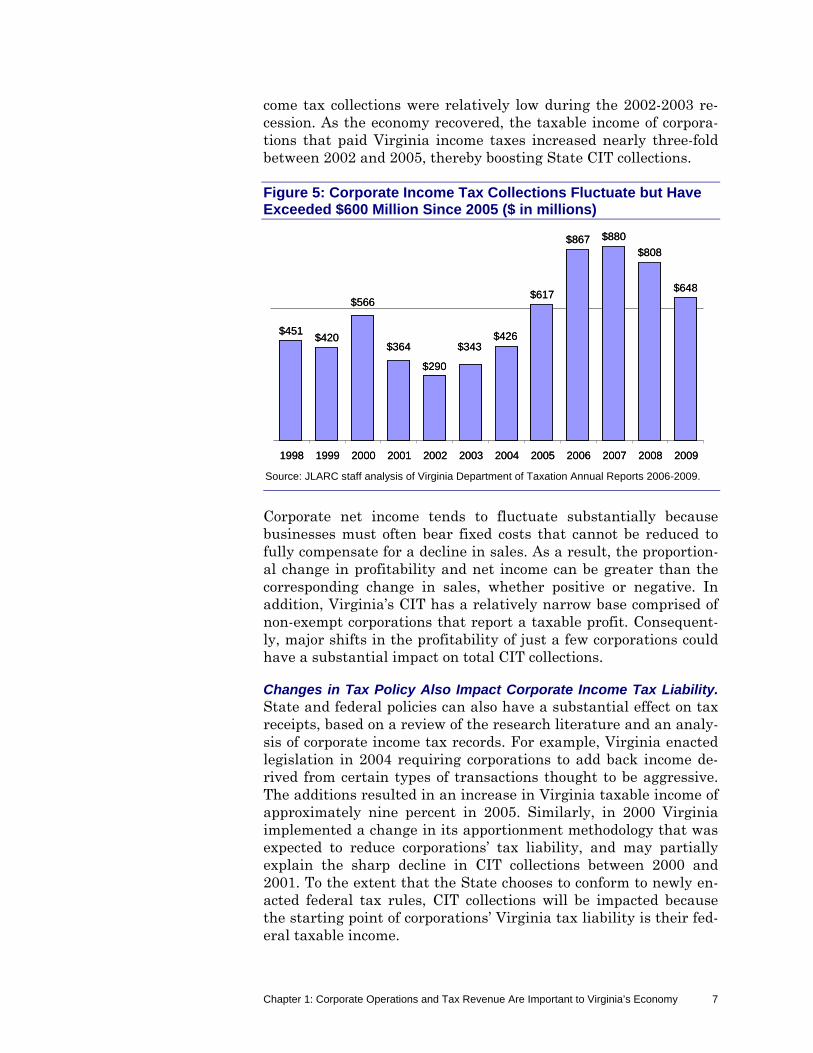
While corporate income tax collections have fluctuated during the last decade, they have exceeded $600 million during the past five years. CIT receipts sank to their lowest point over that time period in 2002 ($290 million) and subsequently rebounded to peak at $880 million in 2007 (Figure 5). Based on an analysis of corporate tax returns and a review of the research literature, it appears that these fluctuations are attributable to economic conditions, policy decisions, and the level of corporate activity in the State.
Economic Conditions Affect Corporate Income and Corresponding State Income Taxes. Economic cycles often impact consumer de-mand, which in turn affects business sales, income, and tax liabil-ity. Therefore, corporate income tax collections will generally de-cline during economic downturns and recessions, and increase with economic expansions. As shown in Figure 5, Virginia corporate in-
Chapter 1: Corporate Operations and Tax Revenue Are Important to Virginia’s Economy 7
come tax collections were relatively low during the 2002-2003 re-cession. As the economy recovered, the taxable income of corpora-tions that paid Virginia income taxes increased nearly three-fold between 2002 and 2005, thereby boosting State CIT collections.
Figure 5: Corporate Income Tax Collections Fluctuate but Have Exceeded $600 Million Since 2005 ($ in millions)
Source: JLARC staff analysis of Virginia Department of Taxation Annual Reports 2006-2009.
Corporate net income tends to fluctuate substantially because businesses must often bear fixed costs that cannot be reduced to fully compensate for a decline in sales. As a result, the proportion-al change in profitability and net income can be greater than the corresponding change in sales, whether positive or negative. In addition, Virginia’s CIT has a relatively narrow base comprised of non-exempt corporations that report a taxable profit. Consequent-ly, major shifts in the profitability of just a few corporations could have a substantial impact on total CIT collections.
Changes in Tax Policy Also Impact Corporate Income Tax Liability. State and federal policies can also have a substantial effect on tax receipts, based on a review of the research literature and an analy-sis of corporate income tax records. For example, Virginia enacted legislation in 2004 requiring corporations to add back income de-rived from certain types of transactions thought to be aggressive. The additions resulted in an increase in Virginia taxable income of approximately nine percent in 2005. Similarly, in 2000 Virginia implemented a change in its apportionment methodology that was expected to reduce corporations’ tax liability, and may partially explain the sharp decline in CIT collections between 2000 and 2001. To the extent that the State chooses to conform to newly en-acted federal tax rules, CIT collections will be impacted because the starting point of corporations’ Virginia tax liability is their fed-eral taxable income.
$451$420
$566
$364
$290
$343$426
$617
$867 $880
$808
$648
1998 1999 2000 2001 2002 2003 2004 2005 2006 2007 2008 2009
$451$420
$566
$364
$290
$343$426
$617
$867 $880
$808
$648
1998 1999 2000 2001 2002 2003 2004 2005 2006 2007 2008 2009
Chapter 1: Corporate Operations and Tax Revenue Are Important to Virginia’s Economy 8
Level of Corporate Activity in Virginia Determines Magnitude of Taxable Income. The level of corporate activity taking place in Vir-ginia is a key driver of the income they earn in the State, and therefore their income tax liability. For example, the number of corporate taxpayers decreased by two percent between 2002 and 2005. Moreover, the share of their nationwide activity taking place in Virginia also appears to also have declined from 5.3 percent in 2002 to 4.2 percent in 2006, as characterized by the proportion of income attributed to the State.
VIRGINIA CORPORATE ACTIVITY GREW IN PAST TWO DECADES, BUT SHARE OF TOTAL BUSINESS ACTIVITY DECLINED
By most measures, Virginia’s corporate business activity grew sub-stantially from 1989 to its peak in 2001-2002, but that growth was partially offset by subsequent losses in jobs and sales through 2007, the most recent year for which complete information is available. (In the context of this discussion, Virginia business ac-tivity is measured by the number jobs held, the number of employ-ers doing business, and the amount of sales of products and ser-vices generated in the State. Due to data limitations, the corporations discussed in this chapter refer to both C corporations, which are subject to Virginia’s CIT, and S corporations, whose in-come is taxed through the State’s individual income tax system).
While corporations of all sizes grew during the 1990s, only smaller corporations (less than 50 employees) continued to grow after 2003. The growth of corporate activity in Virginia over the last 20 years was fueled by the expansion of existing facilities rather than their relocation from other states. Moreover, job growth in Virginia was not distributed equally among Virginia’s industries and re-gions. (As noted, data available to JLARC staff spanned a 19-year period from 1989 to 2007. For simplicity, the data are discussed as representing a 20-year or two-decade period. Given the recession-ary period that has occurred since 2007, indicators of business ac-tivity may be different as of 2010.)
Corporate Activity Rose Steadily in 1990s and Peaked in 2001
Virginia corporations’ business activity appears to have peaked in 2001, at which point the number of Virginia-based jobs and sales began to decline sharply. By 2007, employment and sales figures in Virginia had returned to their 1997-1999 levels. Unlike corpo-rate jobs and sales, the number of corporate employers in Virginia continued to grow throughout the entire period. While Virginia corporations experienced growth patterns similar to that of other businesses during the past two decades, corporate growth occurred
Chapter 1: Corporate Operations and Tax Revenue Are Important to Virginia’s Economy 9
at a slower pace and consequently accounted for a smaller share of the State’s overall business activity as of 2007.
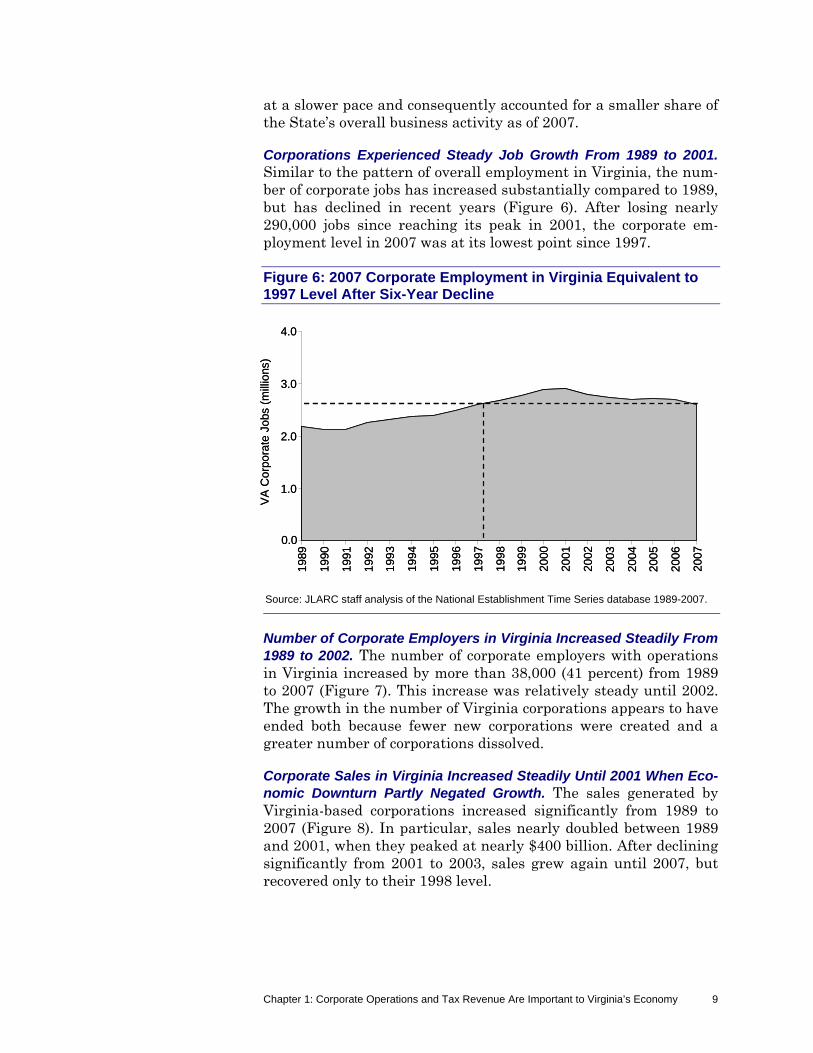
Corporations Experienced Steady Job Growth From 1989 to 2001. Similar to the pattern of overall employment in Virginia, the num-ber of corporate jobs has increased substantially compared to 1989, but has declined in recent years (Figure 6). After losing nearly 290,000 jobs since reaching its peak in 2001, the corporate em-ployment level in 2007 was at its lowest point since 1997.
Figure 6: 2007 Corporate Employment in Virginia Equivalent to 1997 Level After Six-Year Decline
Source: JLARC staff analysis of the National Establishment Time Series database 1989-2007.
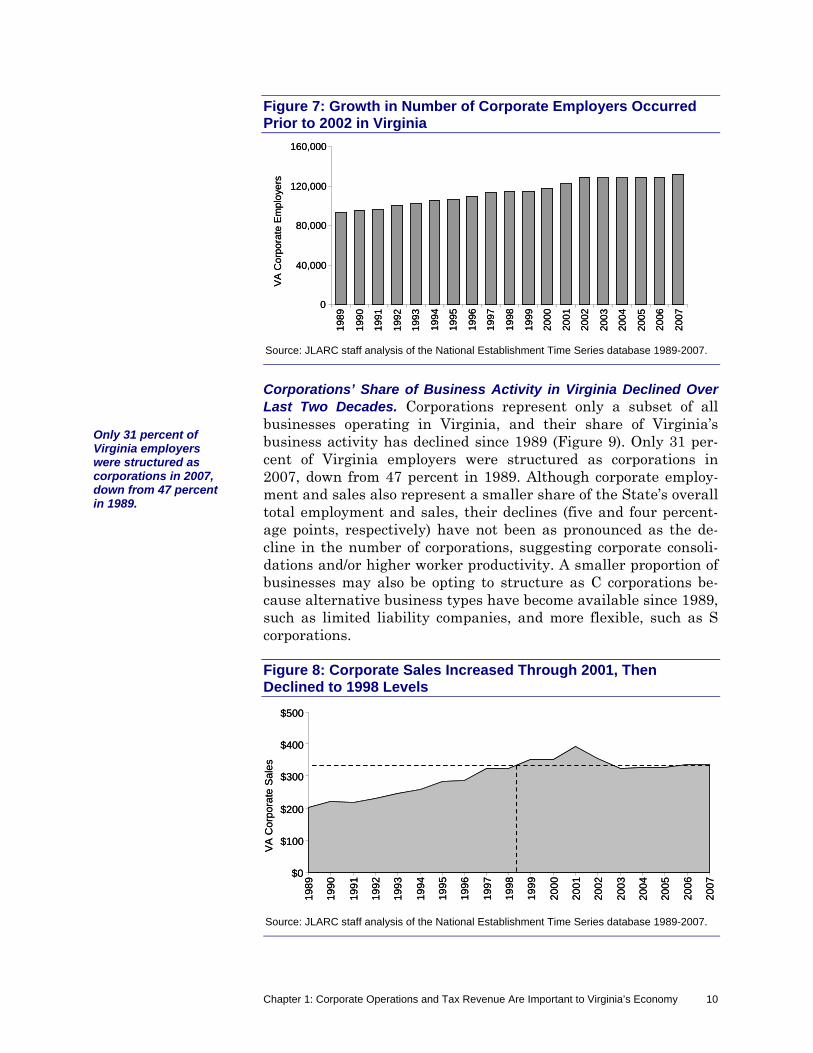
Number of Corporate Employers in Virginia Increased Steadily From 1989 to 2002. The number of corporate employers with operations in Virginia increased by more than 38,000 (41 percent) from 1989 to 2007 (Figure 7). This increase was relatively steady until 2002. The growth in the number of Virginia corporations appears to have ended both because fewer new corporations were created and a greater number of corporations dissolved.
Corporate Sales in Virginia Increased Steadily Until 2001 When Eco-nomic Downturn Partly Negated Growth. The sales generated by Virginia-based corporations increased significantly from 1989 to 2007 (Figure 8). In particular, sales nearly doubled between 1989 and 2001, when they peaked at nearly $400 billion. After declining significantly from 2001 to 2003, sales grew again until 2007, but recovered only to their 1998 level.
VA
Cor
pora
te J
obs
(mill
ions
)
1.0
2.0
3.0
4.0
198
9
199
0
199
1
199
2
199
3
1994
1995
1996
1997
1998
1999
2000
2001
2002
200
3
200
4
200
5
200
6
2007
0.0
VA
Cor
pora
te J
obs
(mill
ions
)
1.0
2.0
3.0
4.0
198
9
199
0
199
1
199
2
199
3
1994
1995
1996
1997
1998
1999
2000
2001
2002
200
3
200
4
200
5
200
6
2007
0.0
Chapter 1: Corporate Operations and Tax Revenue Are Important to Virginia’s Economy 10
Figure 7: Growth in Number of Corporate Employers Occurred Prior to 2002 in Virginia
Source: JLARC staff analysis of the National Establishment Time Series database 1989-2007.
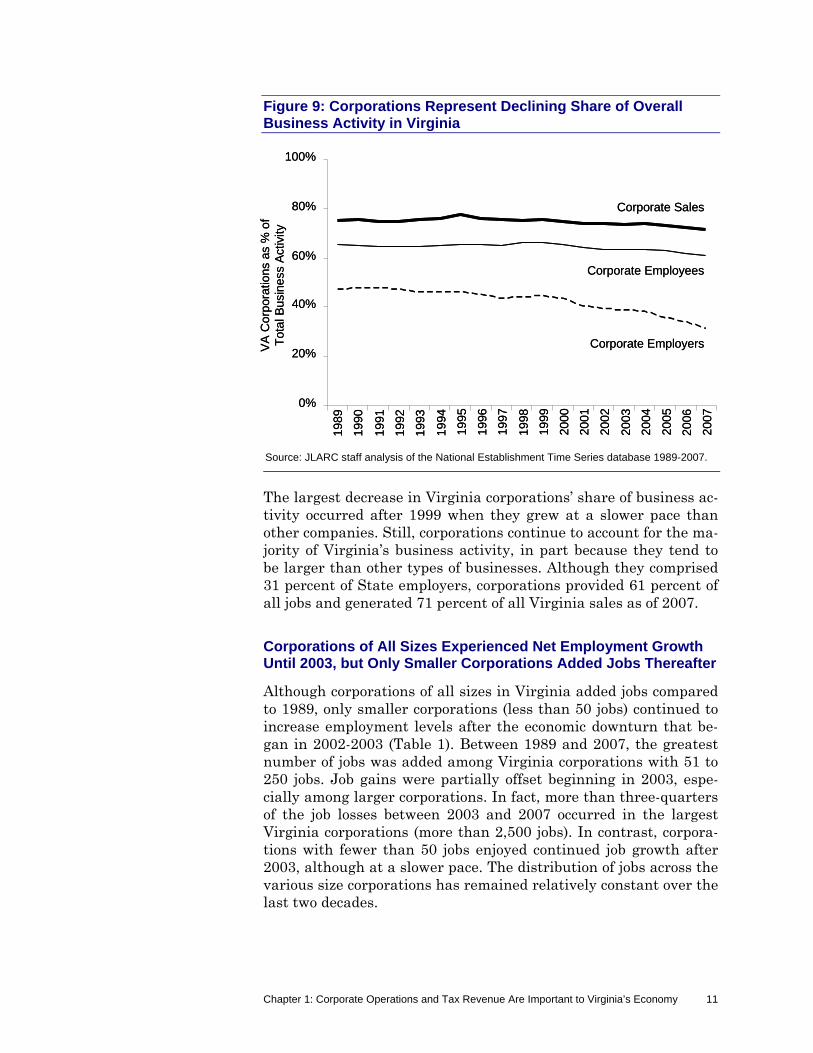
Corporations’ Share of Business Activity in Virginia Declined Over Last Two Decades. Corporations represent only a subset of all businesses operating in Virginia, and their share of Virginia’s business activity has declined since 1989 (Figure 9). Only 31 per-cent of Virginia employers were structured as corporations in 2007, down from 47 percent in 1989. Although corporate employ-ment and sales also represent a smaller share of the State’s overall total employment and sales, their declines (five and four percent-age points, respectively) have not been as pronounced as the de-cline in the number of corporations, suggesting corporate consoli-dations and/or higher worker productivity. A smaller proportion of businesses may also be opting to structure as C corporations be-cause alternative business types have become available since 1989, such as limited liability companies, and more flexible, such as S corporations.
Figure 8: Corporate Sales Increased Through 2001, Then Declined to 1998 Levels
Source: JLARC staff analysis of the National Establishment Time Series database 1989-2007.
$0
$100
$200
$300
$400
$500
198
9
199
0
199
1
199
2
199
3
199
4
199
5
199
6
199
7
199
8
199
9
200
0
200
1
200
2
200
3
200
4
200
5
200
6
200
7
VA
Cor
por
ate
Sal
es
$0
$100
$200
$300
$400
$500
198
9
199
0
199
1
199
2
199
3
199
4
199
5
199
6
199
7
199
8
199
9
200
0
200
1
200
2
200
3
200
4
200
5
200
6
200
7
VA
Cor
por
ate
Sal
es
0
40,000
80,000
120,000
160,000
19
89
19
90
19
91
19
92
19
93
19
94
19
95
19
96
19
97
19
98
19
99
20
00
20
01
20
02
20
03
20
04
20
05
20
06
20
07
VA
Co
rpo
rate
Em
plo
yers
0
40,000
80,000
120,000
160,000
19
89
19
90
19
91
19
92
19
93
19
94
19
95
19
96
19
97
19
98
19
99
20
00
20
01
20
02
20
03
20
04
20
05
20
06
20
07
VA
Co
rpo
rate
Em
plo
yers
Only 31 percent of Virginia employers were structured as corporations in 2007, down from 47 percent in 1989.
Chapter 1: Corporate Operations and Tax Revenue Are Important to Virginia’s Economy 11
Figure 9: Corporations Represent Declining Share of Overall Business Activity in Virginia
Source: JLARC staff analysis of the National Establishment Time Series database 1989-2007.
The largest decrease in Virginia corporations’ share of business ac-tivity occurred after 1999 when they grew at a slower pace than other companies. Still, corporations continue to account for the ma-jority of Virginia’s business activity, in part because they tend to be larger than other types of businesses. Although they comprised 31 percent of State employers, corporations provided 61 percent of all jobs and generated 71 percent of all Virginia sales as of 2007.
Corporations of All Sizes Experienced Net Employment Growth Until 2003, but Only Smaller Corporations Added Jobs Thereafter
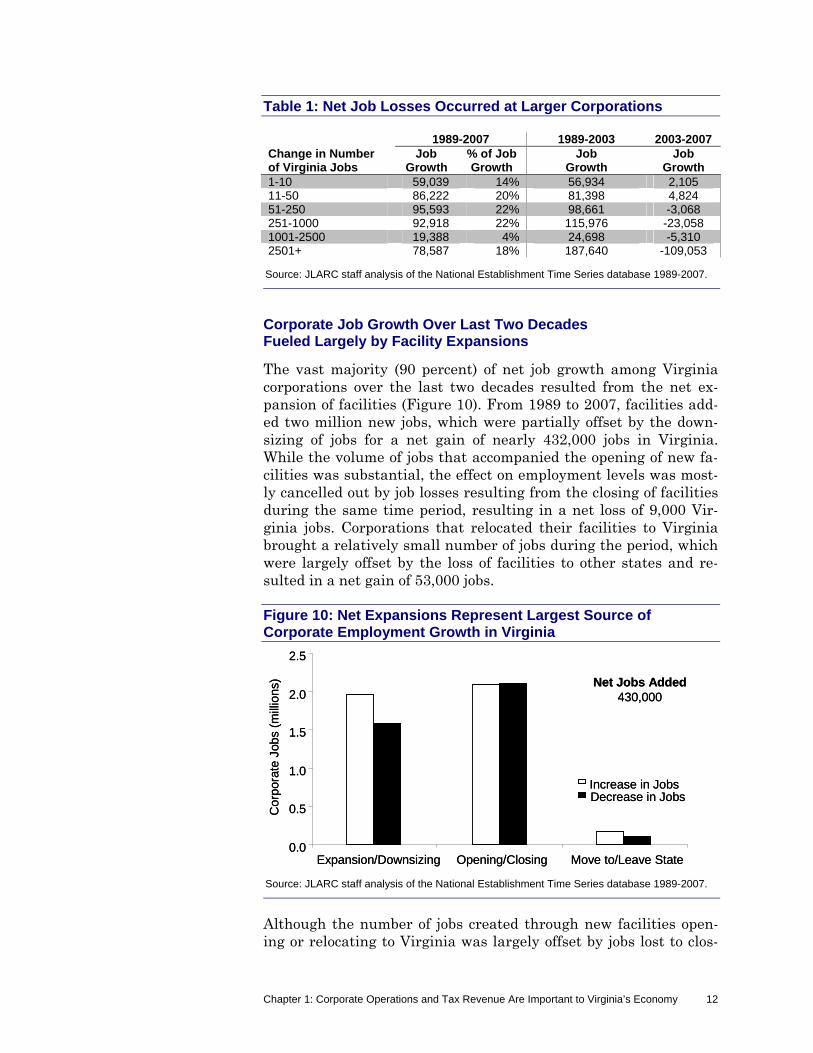
Although corporations of all sizes in Virginia added jobs compared to 1989, only smaller corporations (less than 50 jobs) continued to increase employment levels after the economic downturn that be-gan in 2002-2003 (Table 1). Between 1989 and 2007, the greatest number of jobs was added among Virginia corporations with 51 to 250 jobs. Job gains were partially offset beginning in 2003, espe-cially among larger corporations. In fact, more than three-quarters of the job losses between 2003 and 2007 occurred in the largest Virginia corporations (more than 2,500 jobs). In contrast, corpora-tions with fewer than 50 jobs enjoyed continued job growth after 2003, although at a slower pace. The distribution of jobs across the various size corporations has remained relatively constant over the last two decades.
0%
20%
40%
60%
80%
100%
Corporate Sales
Corporate Employees
Corporate Employers19
89
1990
1991
1992
1993
1994
1995
1996
1997
1998
1999
2000
2001
2002
2003
2004
2005
2006
2007
VA
Cor
pora
tions
as
% o
f T
otal
Bus
ines
s A
ctiv
ity
0%
20%
40%
60%
80%
100%
Corporate Sales
Corporate Employees
Corporate Employers19
89
1990
1991
1992
1993
1994
1995
1996
1997
1998
1999
2000
2001
2002
2003
2004
2005
2006
2007
VA
Cor
pora
tions
as
% o
f T
otal
Bus
ines
s A
ctiv
ity
Chapter 1: Corporate Operations and Tax Revenue Are Important to Virginia’s Economy 12
Table 1: Net Job Losses Occurred at Larger Corporations
1989-2007 1989-2003 2003-2007Change in Number of Virginia Jobs
Job % of Job Growth Growth
Job Growth
Job Growth
1-10 59,039 14% 56,934 2,105 11-50 86,222 20% 81,398 4,824 51-250 95,593 22% 98,661 -3,068 251-1000 92,918 22% 115,976 -23,058 1001-2500 19,388 4% 24,698 -5,310 2501+ 78,587 18% 187,640 -109,053
Source: JLARC staff analysis of the National Establishment Time Series database 1989-2007.
Corporate Job Growth Over Last Two Decades Fueled Largely by Facility Expansions
The vast majority (90 percent) of net job growth among Virginia corporations over the last two decades resulted from the net ex-pansion of facilities (Figure 10). From 1989 to 2007, facilities add-ed two million new jobs, which were partially offset by the down-sizing of jobs for a net gain of nearly 432,000 jobs in Virginia. While the volume of jobs that accompanied the opening of new fa-cilities was substantial, the effect on employment levels was most-ly cancelled out by job losses resulting from the closing of facilities during the same time period, resulting in a net loss of 9,000 Vir-ginia jobs. Corporations that relocated their facilities to Virginia brought a relatively small number of jobs during the period, which were largely offset by the loss of facilities to other states and re-sulted in a net gain of 53,000 jobs.
Figure 10: Net Expansions Represent Largest Source of Corporate Employment Growth in Virginia
Source: JLARC staff analysis of the National Establishment Time Series database 1989-2007.
Although the number of jobs created through new facilities open-ing or relocating to Virginia was largely offset by jobs lost to clos-
0.0
0.5
1.0
1.5
2.0
2.5
Expansion/Downsizing Opening/Closing Move to/Leave State
Cor
pora
te J
obs
(mill
ions
)
Increase in JobsDecrease in Jobs
Net Jobs Added430,000
0.0
0.5
1.0
1.5
2.0
2.5
Expansion/Downsizing Opening/Closing Move to/Leave State
Cor
pora
te J
obs
(mill
ions
)
Increase in JobsDecrease in Jobs
Net Jobs Added430,000
Chapter 1: Corporate Operations and Tax Revenue Are Important to Virginia’s Economy 13
ings or relocations out of the State, these new facilities appear to contribute employment levels beyond the jobs initially created. Fa-cilities that opened in or relocated to Virginia after 1989 accounted for 78 percent of all jobs gained through expansions. In aggregate, corporations that opened new facilities in Virginia expanded by more than 260,000 jobs after operations began, averaging 1.42 jobs per new facility. Moreover, corporations that relocated a facility to Virginia added an average of 6.55 jobs per facility after setting up operations in the State. In contrast, facilities that were in Virginia prior to 1989 averaged a net expansion of only 0.80 jobs per facili-ty.
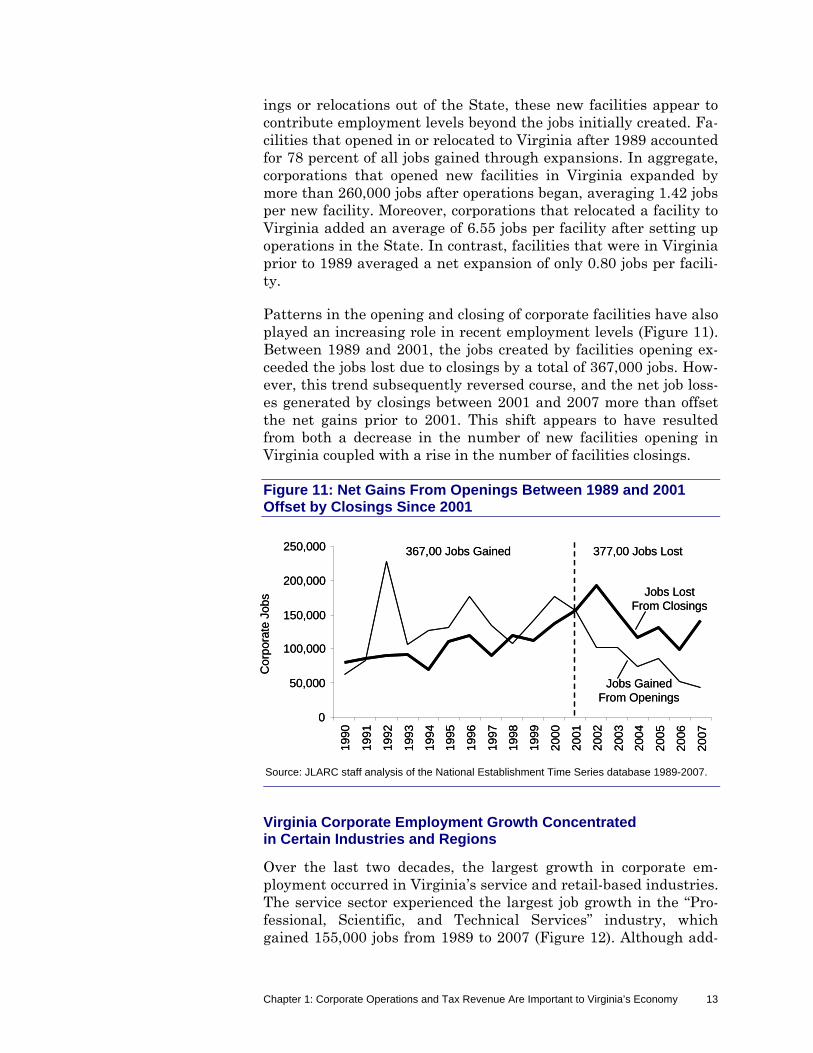
Patterns in the opening and closing of corporate facilities have also played an increasing role in recent employment levels (Figure 11). Between 1989 and 2001, the jobs created by facilities opening ex-ceeded the jobs lost due to closings by a total of 367,000 jobs. How-ever, this trend subsequently reversed course, and the net job loss-es generated by closings between 2001 and 2007 more than offset the net gains prior to 2001. This shift appears to have resulted from both a decrease in the number of new facilities opening in Virginia coupled with a rise in the number of facilities closings.
Figure 11: Net Gains From Openings Between 1989 and 2001 Offset by Closings Since 2001
Source: JLARC staff analysis of the National Establishment Time Series database 1989-2007.
Virginia Corporate Employment Growth Concentrated in Certain Industries and Regions
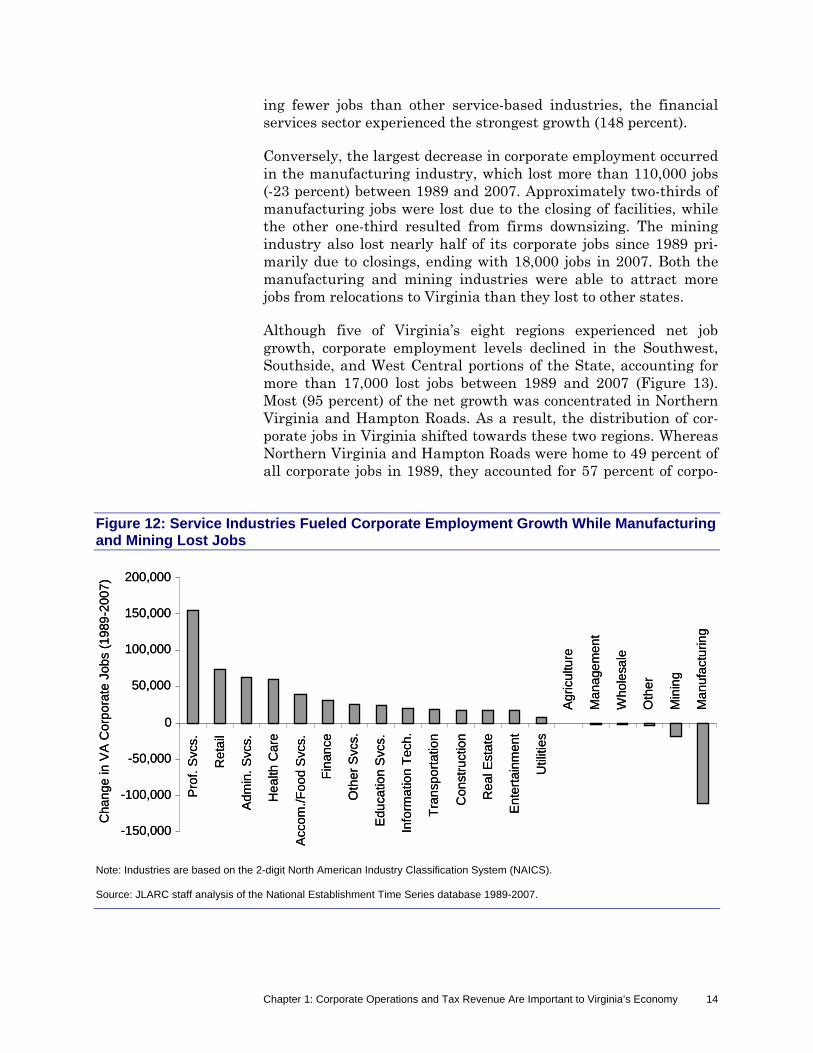
Over the last two decades, the largest growth in corporate em-ployment occurred in Virginia’s service and retail-based industries. The service sector experienced the largest job growth in the “Pro-fessional, Scientific, and Technical Services” industry, which gained 155,000 jobs from 1989 to 2007 (Figure 12). Although add-
0
50,000
100,000
150,000
200,000
250,000
Jobs Lost From Closings
Jobs Gained From Openings
1990
1991
1992
199
3
1994
1995
1996
1997
1998
1999
200
0
2001
2002
200
3
2004
200
5
200
6
200
7
367,00 Jobs Gained 377,00 Jobs Lost
Co
rpor
ate
Job
s
0
50,000
100,000
150,000
200,000
250,000
Jobs Lost From Closings
Jobs Gained From Openings
1990
1991
1992
199
3
1994
1995
1996
1997
1998
1999
200
0
2001
2002
200
3
2004
200
5
200
6
200
7
367,00 Jobs Gained 377,00 Jobs Lost
Co
rpor
ate
Job
s
Chapter 1: Corporate Operations and Tax Revenue Are Important to Virginia’s Economy 14
ing fewer jobs than other service-based industries, the financial services sector experienced the strongest growth (148 percent).
Conversely, the largest decrease in corporate employment occurred in the manufacturing industry, which lost more than 110,000 jobs (-23 percent) between 1989 and 2007. Approximately two-thirds of manufacturing jobs were lost due to the closing of facilities, while the other one-third resulted from firms downsizing. The mining industry also lost nearly half of its corporate jobs since 1989 pri-marily due to closings, ending with 18,000 jobs in 2007. Both the manufacturing and mining industries were able to attract more jobs from relocations to Virginia than they lost to other states.
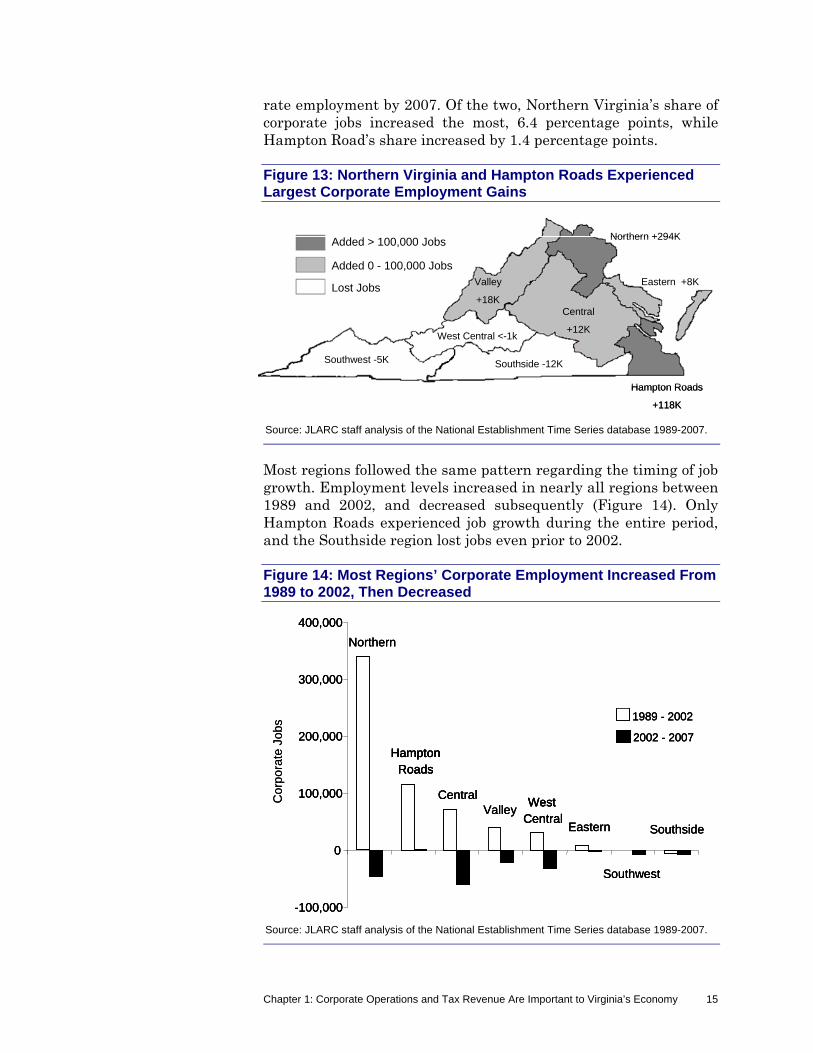
Although five of Virginia’s eight regions experienced net job growth, corporate employment levels declined in the Southwest, Southside, and West Central portions of the State, accounting for more than 17,000 lost jobs between 1989 and 2007 (Figure 13). Most (95 percent) of the net growth was concentrated in Northern Virginia and Hampton Roads. As a result, the distribution of cor-porate jobs in Virginia shifted towards these two regions. Whereas Northern Virginia and Hampton Roads were home to 49 percent of all corporate jobs in 1989, they accounted for 57 percent of corpo-
Figure 12: Service Industries Fueled Corporate Employment Growth While Manufacturing and Mining Lost Jobs
Note: Industries are based on the 2-digit North American Industry Classification System (NAICS). Source: JLARC staff analysis of the National Establishment Time Series database 1989-2007.
-150,000
-100,000
-50,000
0
50,000
100,000
150,000
200,000
Pro
f. S
vcs.
Re
tail
Adm
in.
Svc
s.
Hea
lth C
are
Acc
om./
Foo
d S
vcs.
Fin
ance
Oth
er
Svc
s.
Edu
catio
n S
vcs.
Info
rmat
ion
Tec
h.
Tra
nspo
rtat
ion
Con
stru
ctio
n
Rea
l Est
ate
En
tert
ain
me
nt
Util
ities
Agr
icul
ture
Man
age
men
t
Who
lesa
le
Oth
er
Min
ing
Ma
nufa
ctu
ring
Cha
nge
in V
A C
orp
ora
te J
obs
(198
9-2
007
)
Chapter 1: Corporate Operations and Tax Revenue Are Important to Virginia’s Economy 15
rate employment by 2007. Of the two, Northern Virginia’s share of corporate jobs increased the most, 6.4 percentage points, while Hampton Road’s share increased by 1.4 percentage points.
Figure 13: Northern Virginia and Hampton Roads Experienced Largest Corporate Employment Gains
Source: JLARC staff analysis of the National Establishment Time Series database 1989-2007.
Most regions followed the same pattern regarding the timing of job growth. Employment levels increased in nearly all regions between 1989 and 2002, and decreased subsequently (Figure 14). Only Hampton Roads experienced job growth during the entire period, and the Southside region lost jobs even prior to 2002.
Figure 14: Most Regions’ Corporate Employment Increased From 1989 to 2002, Then Decreased
Source: JLARC staff analysis of the National Establishment Time Series database 1989-2007.
-100,000
0
100,000
200,000
300,000
400,000
Central
Eastern
HamptonRoads
Northern
Southside
Southwest
ValleyWest
Central
1989 - 2002
2002 - 2007
Co
rpo
rate
Job
s
-100,000
0
100,000
200,000
300,000
400,000
Central
Eastern
HamptonRoads
Northern
Southside
Southwest
ValleyWest
Central
1989 - 2002
2002 - 2007
-100,000
0
100,000
200,000
300,000
400,000
Central
Eastern
HamptonRoads
HamptonRoads
Northern
Southside
Southwest
ValleyWest
CentralWest
Central
1989 - 2002
2002 - 2007
Co
rpo
rate
Job
s
Added > 100,000 Jobs
Added 0 - 100,000 Jobs
Lost Jobs
Central
+12K
Eastern +8K
Hampton Roads
+118K
Northern +294K
Southside -12KSouthwest -5K
Valley
+18K
West Central <-1k
Added > 100,000 Jobs
Added 0 - 100,000 Jobs
Lost Jobs
Central
+12K
Eastern +8K
Hampton Roads
+118K
Northern +294K
Southside -12KSouthwest -5K
Valley
+18K
West Central <-1k
Chapter 1: Corporate Operations and Tax Revenue Are Important to Virginia’s Economy 16
VIRGINIA APPEARS TO ACTIVELY COMPETE FOR CORPORATE ACTIVITY WITH POPULOUS AS WELL AS EASTERN STATES
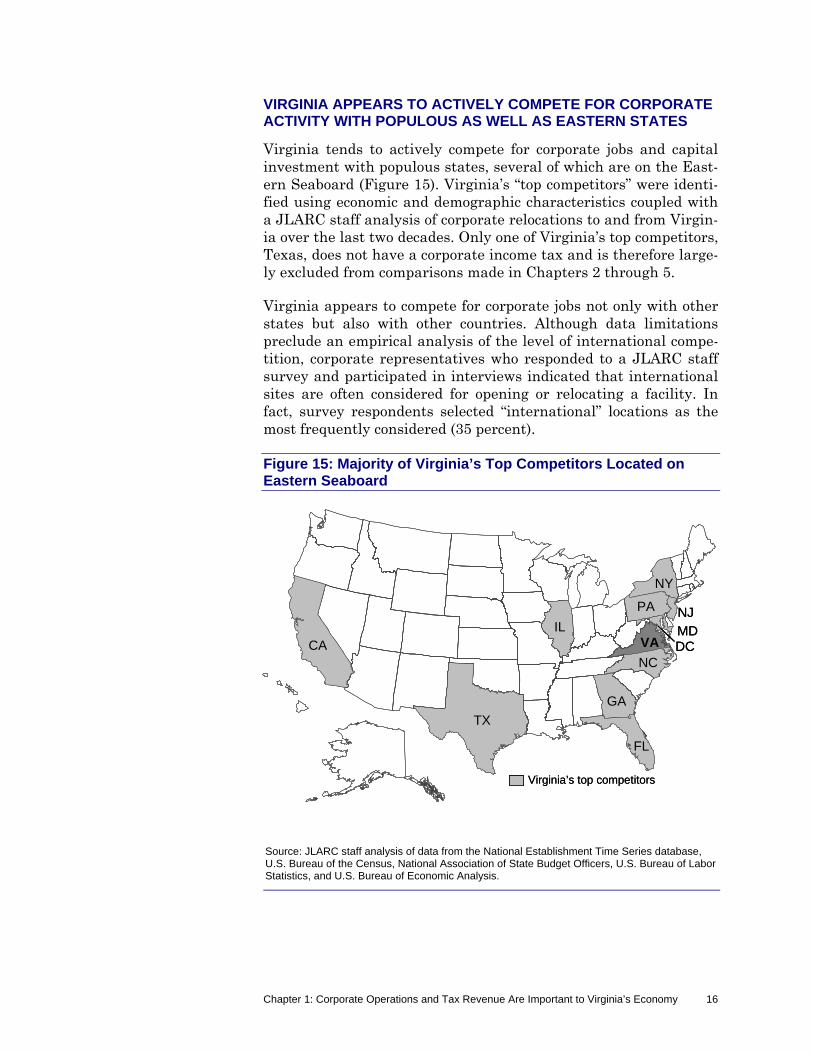
Virginia tends to actively compete for corporate jobs and capital investment with populous states, several of which are on the East-ern Seaboard (Figure 15). Virginia’s “top competitors” were identi-fied using economic and demographic characteristics coupled with a JLARC staff analysis of corporate relocations to and from Virgin-ia over the last two decades. Only one of Virginia’s top competitors, Texas, does not have a corporate income tax and is therefore large-ly excluded from comparisons made in Chapters 2 through 5.
Virginia appears to compete for corporate jobs not only with other states but also with other countries. Although data limitations preclude an empirical analysis of the level of international compe-tition, corporate representatives who responded to a JLARC staff survey and participated in interviews indicated that international sites are often considered for opening or relocating a facility. In fact, survey respondents selected “international” locations as the most frequently considered (35 percent).
Figure 15: Majority of Virginia’s Top Competitors Located on Eastern Seaboard
Source: JLARC staff analysis of data from the National Establishment Time Series database, U.S. Bureau of the Census, National Association of State Budget Officers, U.S. Bureau of Labor Statistics, and U.S. Bureau of Economic Analysis.
TX
CAIL
FL
VA
PA
NC
NJ
NY
MD
Virginia’s top competitors
GA
DC
TX
CAIL
FL
VA
PA
NC
NJ
NY
MD
Virginia’s top competitors
GA
DC
Chapter 2: Virginia and Most Other States Impose Corporate Income Tax Only on Certain C Corporations
17
States generally use similar structures to tax corporations in an attempt to achieve administrative simplicity and adhere to federal restrictions. For example, most states’ corporate income tax (CIT) structures conform to the federal corporate income tax system, and as a result, states have been able to rely on many federal rules and regulations rather than adopting their own. In particular, most states impose this tax only on corporations since the federal corpo-rate tax system excludes businesses not structured as corpora-tions. Federal restrictions on certain industries have resulted in many states exempting corporations such as banks and insurance companies. State taxing systems are restricted from interfering with interstate commerce, and laws and other guidelines have been issued by the U.S. Congress and Supreme Court which en-sure that state taxing structures remain within certain legal bounds.
MOST STATES HAVE A CORPORATE INCOME TAX
All but a few states tax corporations based on their income (Figure 16). Four states impose taxes that are based on a measure of sales or gross receipts, and are generally applied to a broader set of businesses than just corporations. Three states do not tax corpo-rate activity at all.
Ch
apte
r
22
VViirrggiinniiaa aanndd MMoosstt OOtthheerr SSttaatteess IImmppoossee CCoorrppoorraattee IInnccoommee TTaaxx OOnnllyy oonn CCeerrttaaiinn CC CCoorrppoorraattiioonnss
Like most other states, Virginia’s tax on corporations is based on income and im-posed only on C corporations, with exemptions for banks, insurers, and public ser-vice corporations. While federal restrictions prevent states from taxing corpora-tions that have a limited in-state presence, states can opt to set higher thresholdsthan the federal standards and require a greater degree of presence. Unlike moststates, Virginia has adopted a higher threshold than the federal standard anddoes not impose its tax on corporations without a physical presence in the State.In contrast, other states have chosen to impose their tax on corporations without aphysical presence as long as they have a sufficient level of economic activity in thestate.
II nn SS
uumm
mmaa r
r yy
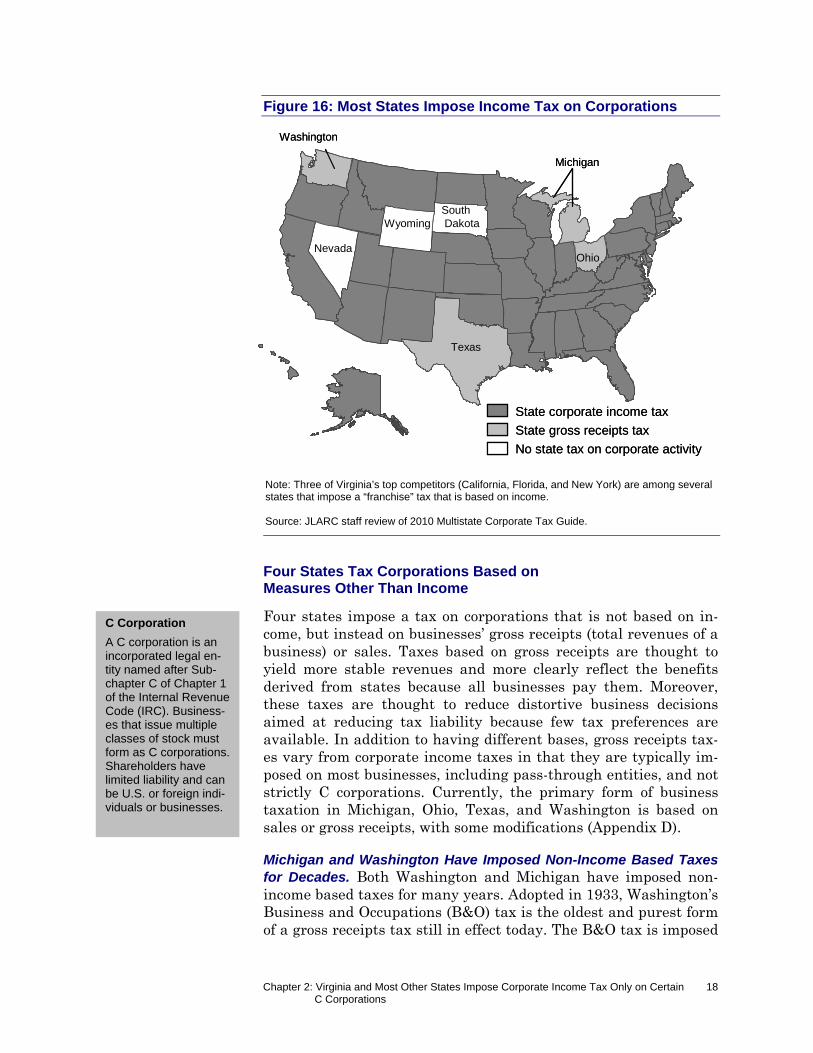
Chapter 2: Virginia and Most Other States Impose Corporate Income Tax Only on Certain C Corporations
18
Figure 16: Most States Impose Income Tax on Corporations
Note: Three of Virginia’s top competitors (California, Florida, and New York) are among several states that impose a “franchise” tax that is based on income. Source: JLARC staff review of 2010 Multistate Corporate Tax Guide.
Four States Tax Corporations Based on Measures Other Than Income
Four states impose a tax on corporations that is not based on in-come, but instead on businesses’ gross receipts (total revenues of a business) or sales. Taxes based on gross receipts are thought to yield more stable revenues and more clearly reflect the benefits derived from states because all businesses pay them. Moreover, these taxes are thought to reduce distortive business decisions aimed at reducing tax liability because few tax preferences are available. In addition to having different bases, gross receipts tax-es vary from corporate income taxes in that they are typically im-posed on most businesses, including pass-through entities, and not strictly C corporations. Currently, the primary form of business taxation in Michigan, Ohio, Texas, and Washington is based on sales or gross receipts, with some modifications (Appendix D).
Michigan and Washington Have Imposed Non-Income Based Taxes for Decades. Both Washington and Michigan have imposed non-income based taxes for many years. Adopted in 1933, Washington’s Business and Occupations (B&O) tax is the oldest and purest form of a gross receipts tax still in effect today. The B&O tax is imposed
C Corporation
A C corporation is an incorporated legal en-tity named after Sub-chapter C of Chapter 1 of the Internal Revenue Code (IRC). Business-es that issue multiple classes of stock must form as C corporations. Shareholders have limited liability and can be U.S. or foreign indi-viduals or businesses.
Washington
Texas
Michigan
SouthDakotaWyoming
No state tax on corporate activity
State corporate income tax
State gross receipts tax
NevadaOhio
Washington
Texas
Michigan
SouthDakotaWyoming
No state tax on corporate activity
State corporate income tax
State gross receipts tax
NevadaOhio
Chapter 2: Virginia and Most Other States Impose Corporate Income Tax Only on Certain C Corporations
19
on a seller’s gross receipts that are attributed to business activity conducted in Washington and does not allow for deductions.
While Michigan adopted a gross receipts tax in 2008, it had previ-ously imposed a value-added tax since 1976. Implemented as part of broader tax restructuring, the value-added tax was levied on all business entities, and replaced seven other business taxes, includ-ing a corporate income tax. This structure was replaced in 2008 with the Michigan Business Tax, which has two bases: corporate income and modified gross receipts.
Ohio and Texas Recently Adopted Gross Receipts Taxes as Part of Broad Tax Restructuring. Like Michigan, Ohio and Texas adopted gross receipts taxes as part of a broad business tax restructuring initiative. In 2005, Ohio adopted the Commercial Activity Tax (CAT) and began phasing out its corporate franchise and personal property taxes. Ohio sought tax changes because the revenue gen-erated by the franchise tax had decreased over time, and property taxes (including personal property and machinery and equipment) placed a significant burden on businesses, particularly manufac-turers. Similarly, Texas adopted a margins tax to replace its corpo-rate franchise and property taxes in 2006. One major goal of tax restructuring was to reduce the state’s reliance on property taxes for school funding.
Three States Do Not Tax Corporations
Nevada, South Dakota, and Wyoming do not impose taxes on the activity of businesses, including corporations. In fact, these states also do not levy individual income taxes. While these states do not tax corporate activity on measures such as income or sales, they do impose property and sales taxes, which corporations operating in these states likely pay. In addition, they collect significant reve-nues from other sources such as gambling (Nevada), tourism (South Dakota and Wyoming), and mineral extraction (Wyoming).
VIRGINIA AND MOST STATES APPLY CORPORATE INCOME TAX ONLY TO C CORPORATIONS
Virginia, like most states, imposes its corporate income tax on C corporations but excludes other business structures such as S cor-porations, limited liability companies, partnerships, and sole pro-prietorships. Because the income of these businesses typically passes through to their owners, they are often referred to as pass-through entities (PTEs) particularly for federal and state income tax purposes. While income earned by PTEs is primarily taxed through the individual tax system, some PTEs are owned by C corporations and income passed through to them is taxed through Virginia’s corporate tax system. PTEs can also file a form with the
Pass-Through Entities
S Corporation: similar structure and liability protections as C corpo-ration, but can only issue one class of stock and limited to 100 shareholders who must be U.S. residents. S corporations are named after Subchap-ter S of Chapter 1 of the IRC. Limited Liability Com-pany: Unincorporated association of one or more members. Own-ers have limited liabil-ity. Partnership: Unincor-porated business entity of two or more part-ners. Partners are lia-ble for all obligations of the business, unless structured as a limited partnership. Sole Proprietorship
Unincorporated busi-ness entity owned and operated by one per-son. The owner is per-sonally liable for all obligations of the busi-ness, and income is taxed through the indi-vidual system.
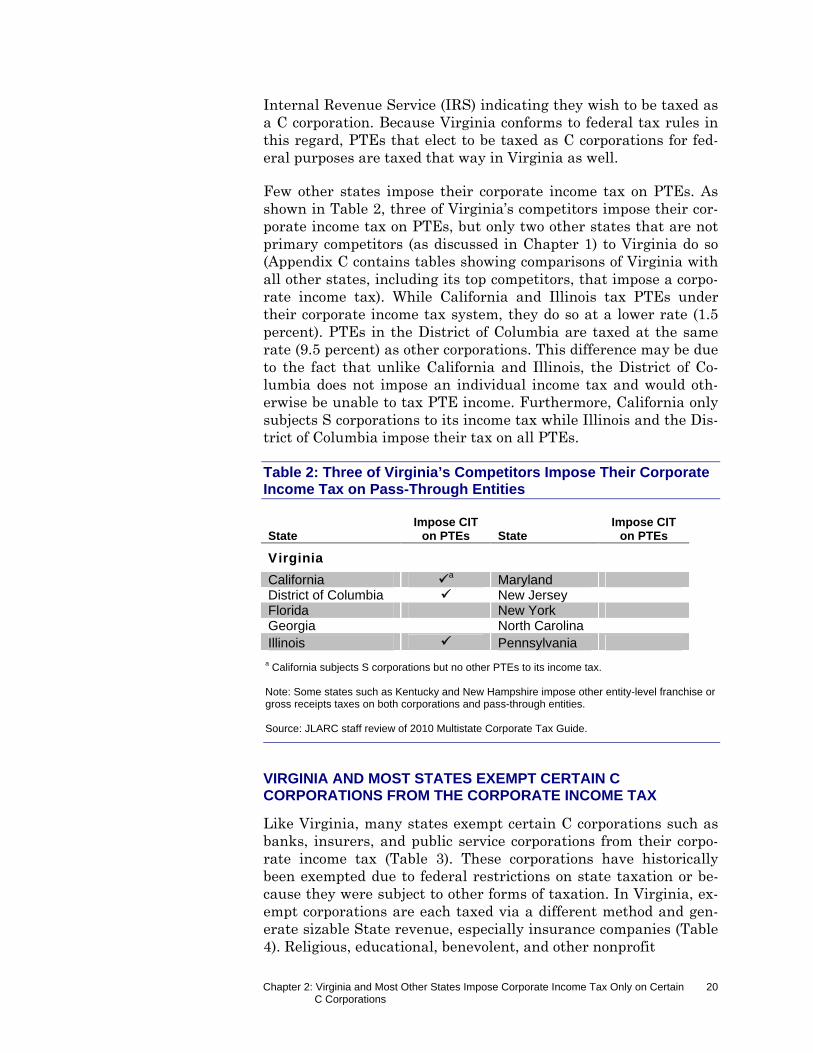
Chapter 2: Virginia and Most Other States Impose Corporate Income Tax Only on Certain C Corporations
20
Internal Revenue Service (IRS) indicating they wish to be taxed as a C corporation. Because Virginia conforms to federal tax rules in this regard, PTEs that elect to be taxed as C corporations for fed-eral purposes are taxed that way in Virginia as well.
Few other states impose their corporate income tax on PTEs. As shown in Table 2, three of Virginia’s competitors impose their cor-porate income tax on PTEs, but only two other states that are not primary competitors (as discussed in Chapter 1) to Virginia do so (Appendix C contains tables showing comparisons of Virginia with all other states, including its top competitors, that impose a corpo-rate income tax). While California and Illinois tax PTEs under their corporate income tax system, they do so at a lower rate (1.5 percent). PTEs in the District of Columbia are taxed at the same rate (9.5 percent) as other corporations. This difference may be due to the fact that unlike California and Illinois, the District of Co-lumbia does not impose an individual income tax and would oth-erwise be unable to tax PTE income. Furthermore, California only subjects S corporations to its income tax while Illinois and the Dis-trict of Columbia impose their tax on all PTEs.
Table 2: Three of Virginia’s Competitors Impose Their Corporate Income Tax on Pass-Through Entities
State Impose CIT
on PTEs State Impose CIT
on PTEs
Virginia
California a Maryland District of Columbia New Jersey Florida New York Georgia North Carolina Illinois Pennsylvania
a California subjects S corporations but no other PTEs to its income tax. Note: Some states such as Kentucky and New Hampshire impose other entity-level franchise or gross receipts taxes on both corporations and pass-through entities. Source: JLARC staff review of 2010 Multistate Corporate Tax Guide.
VIRGINIA AND MOST STATES EXEMPT CERTAIN C CORPORATIONS FROM THE CORPORATE INCOME TAX
Like Virginia, many states exempt certain C corporations such as banks, insurers, and public service corporations from their corpo-rate income tax (Table 3). These corporations have historically been exempted due to federal restrictions on state taxation or be-cause they were subject to other forms of taxation. In Virginia, ex-empt corporations are each taxed via a different method and gen-erate sizable State revenue, especially insurance companies (Table 4). Religious, educational, benevolent, and other nonprofit
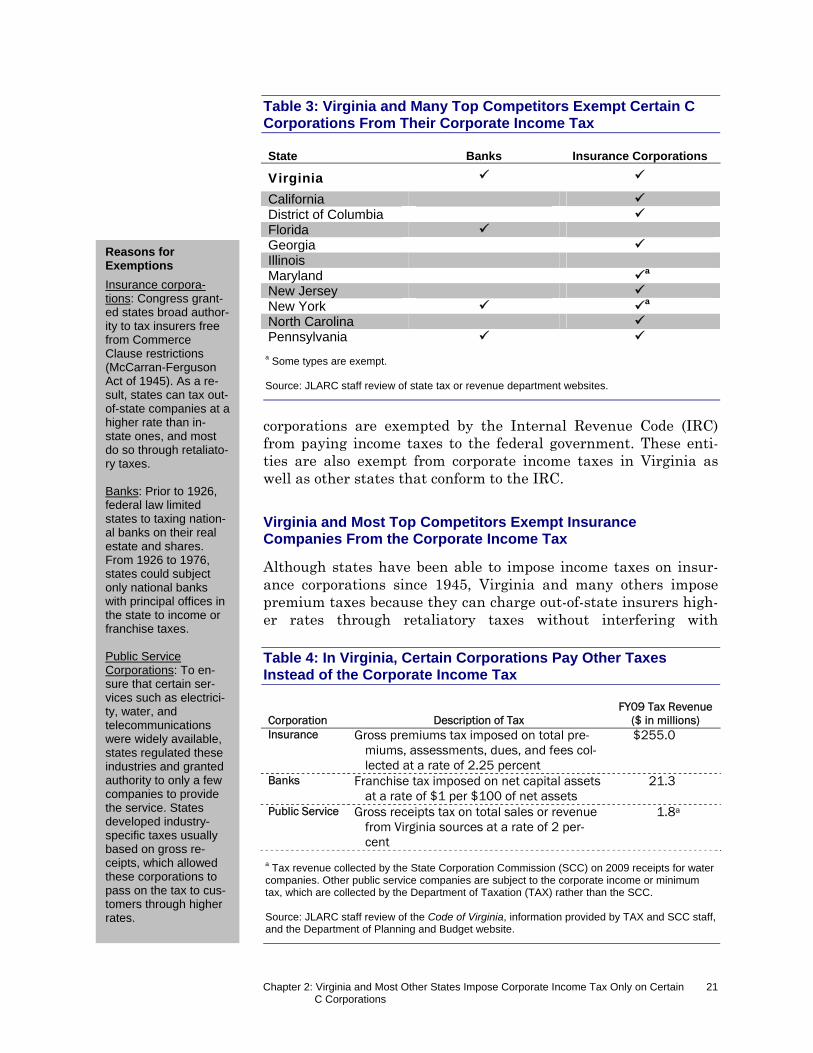
Chapter 2: Virginia and Most Other States Impose Corporate Income Tax Only on Certain C Corporations
21
Table 3: Virginia and Many Top Competitors Exempt Certain C Corporations From Their Corporate Income Tax
State Banks Insurance Corporations
Virginia
California District of Columbia Florida Georgia Illinois Maryland a
New Jersey New York a
North Carolina Pennsylvania
a Some types are exempt. Source: JLARC staff review of state tax or revenue department websites.
corporations are exempted by the Internal Revenue Code (IRC) from paying income taxes to the federal government. These enti-ties are also exempt from corporate income taxes in Virginia as well as other states that conform to the IRC.
Virginia and Most Top Competitors Exempt Insurance Companies From the Corporate Income Tax
Although states have been able to impose income taxes on insur-ance corporations since 1945, Virginia and many others impose premium taxes because they can charge out-of-state insurers high-er rates through retaliatory taxes without interfering with
Table 4: In Virginia, Certain Corporations Pay Other Taxes Instead of the Corporate Income Tax
Corporation Description of Tax FY09 Tax Revenue
($ in millions) Insurance Gross premiums tax imposed on total pre-
miums, assessments, dues, and fees col-lected at a rate of 2.25 percent
$255.0
Banks Franchise tax imposed on net capital assets at a rate of $1 per $100 of net assets
21.3
Public Service Gross receipts tax on total sales or revenue from Virginia sources at a rate of 2 per-cent
1.8a
a Tax revenue collected by the State Corporation Commission (SCC) on 2009 receipts for water companies. Other public service companies are subject to the corporate income or minimum tax, which are collected by the Department of Taxation (TAX) rather than the SCC. Source: JLARC staff review of the Code of Virginia, information provided by TAX and SCC staff, and the Department of Planning and Budget website.
Reasons for Exemptions
Insurance corpora-tions: Congress grant-ed states broad author-ity to tax insurers free from Commerce Clause restrictions (McCarran-Ferguson Act of 1945). As a re-sult, states can tax out-of-state companies at a higher rate than in-state ones, and most do so through retaliato-ry taxes. Banks: Prior to 1926, federal law limited states to taxing nation-al banks on their real estate and shares. From 1926 to 1976, states could subject only national banks with principal offices in the state to income or franchise taxes. Public Service Corporations: To en-sure that certain ser-vices such as electrici-ty, water, and telecommunications were widely available, states regulated these industries and granted authority to only a few companies to provide the service. States developed industry-specific taxes usually based on gross re-ceipts, which allowed these corporations to pass on the tax to cus-tomers through higher rates.
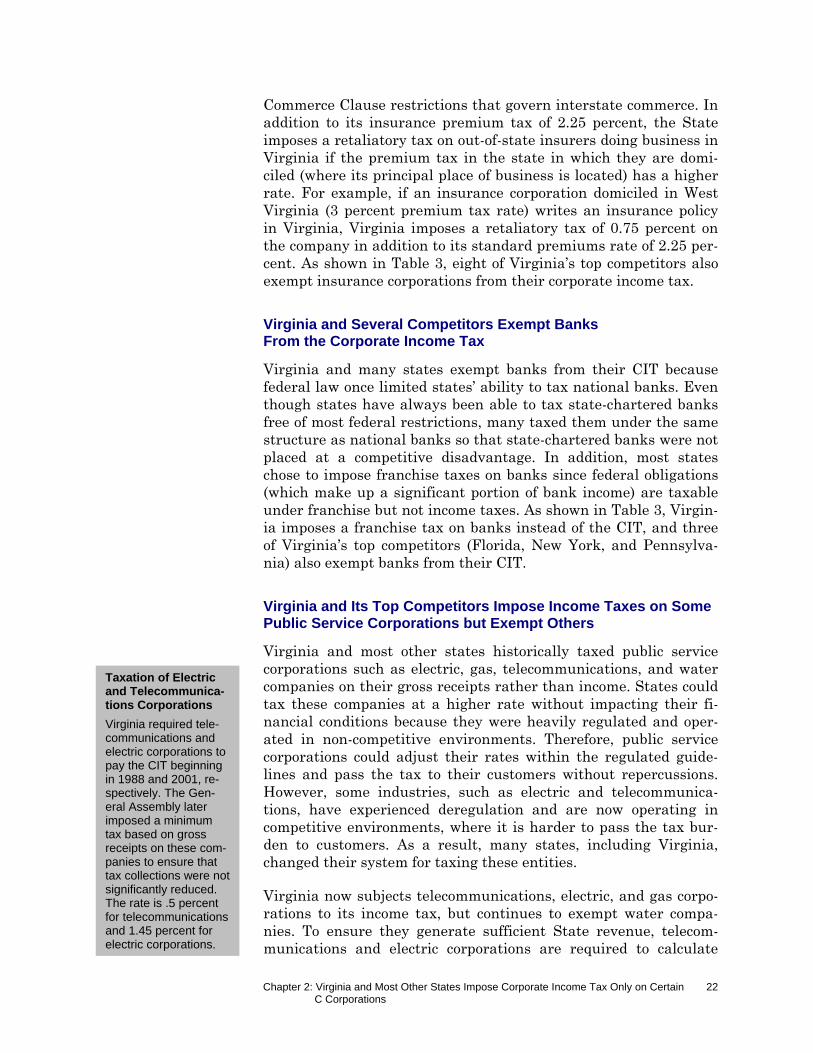
Chapter 2: Virginia and Most Other States Impose Corporate Income Tax Only on Certain C Corporations
22
Commerce Clause restrictions that govern interstate commerce. In addition to its insurance premium tax of 2.25 percent, the State imposes a retaliatory tax on out-of-state insurers doing business in Virginia if the premium tax in the state in which they are domi-ciled (where its principal place of business is located) has a higher rate. For example, if an insurance corporation domiciled in West Virginia (3 percent premium tax rate) writes an insurance policy in Virginia, Virginia imposes a retaliatory tax of 0.75 percent on the company in addition to its standard premiums rate of 2.25 per-cent. As shown in Table 3, eight of Virginia’s top competitors also exempt insurance corporations from their corporate income tax.
Virginia and Several Competitors Exempt Banks From the Corporate Income Tax
Virginia and many states exempt banks from their CIT because federal law once limited states’ ability to tax national banks. Even though states have always been able to tax state-chartered banks free of most federal restrictions, many taxed them under the same structure as national banks so that state-chartered banks were not placed at a competitive disadvantage. In addition, most states chose to impose franchise taxes on banks since federal obligations (which make up a significant portion of bank income) are taxable under franchise but not income taxes. As shown in Table 3, Virgin-ia imposes a franchise tax on banks instead of the CIT, and three of Virginia’s top competitors (Florida, New York, and Pennsylva-nia) also exempt banks from their CIT.
Virginia and Its Top Competitors Impose Income Taxes on Some Public Service Corporations but Exempt Others
Virginia and most other states historically taxed public service corporations such as electric, gas, telecommunications, and water companies on their gross receipts rather than income. States could tax these companies at a higher rate without impacting their fi-nancial conditions because they were heavily regulated and oper-ated in non-competitive environments. Therefore, public service corporations could adjust their rates within the regulated guide-lines and pass the tax to their customers without repercussions. However, some industries, such as electric and telecommunica-tions, have experienced deregulation and are now operating in competitive environments, where it is harder to pass the tax bur-den to customers. As a result, many states, including Virginia, changed their system for taxing these entities.
Virginia now subjects telecommunications, electric, and gas corpo-rations to its income tax, but continues to exempt water compa-nies. To ensure they generate sufficient State revenue, telecom-munications and electric corporations are required to calculate
Taxation of Electric and Telecommunica-tions Corporations
Virginia required tele-communications and electric corporations to pay the CIT beginning in 1988 and 2001, re-spectively. The Gen-eral Assembly later imposed a minimum tax based on gross receipts on these com-panies to ensure that tax collections were not significantly reduced. The rate is .5 percent for telecommunications and 1.45 percent for electric corporations.
Chapter 2: Virginia and Most Other States Impose Corporate Income Tax Only on Certain C Corporations
23
their tax liability based not only on income but also on gross re-ceipts and pay the higher of the two amounts. Most of Virginia’s top ten competitors also tax at least some public service corpora-tions under their corporate income tax system. For example, state corporate income taxes are applied to all public service corpora-tions in Illinois and electric and gas companies in New York. In contrast, North Carolina appears to exempt most telecommunica-tions, electric power, water, and sewer corporations from its corpo-rate tax and imposes a tax based on gross receipts instead.
VIRGINIA USES MORE CONSERVATIVE STANDARD THAN MANY STATES TO DETERMINE WHICH C CORPORATIONS ARE TAXED
Corporations must have a certain level of presence in a state to be subject to its corporate income tax because of restrictions that are designed to protect interstate commerce. In addition to these federal restrictions, states may impose further limits on which corporations to tax. For example, Virginia policies dictate that only corporations with a physical presence in the State can be taxed. While most states historically had similar requirements, many are now asserting taxing authority over providers of intangible goods and services strictly on the basis of economic activity.
States Can Only Impose Corporate Income Tax on Corporations That Have Nexus
While states have broad authority to tax companies incorporated in their state, they face restrictions regarding the taxation of com-panies incorporated in other states. Out-of-state corporations must have a minimum level of presence in the state, or nexus, to be sub-ject to its tax. Limits to state taxing jurisdiction over out-of-state corporations are established in the U.S. Constitution and federal law.
Ability to Assert Nexus Is Limited by the U.S. Constitution. Two clauses of the U.S. Constitution are central in restricting states’ abilities to impose income taxes on foreign corporations. The Commerce Clause gives Congress the power to regulate interstate commerce, and the U.S. Supreme Court has consistently interpret-ed it to mean that states cannot impose taxes that interfere with interstate commerce. In addition, the Due Process Clause of the 14th Amendment has been interpreted by the Court to limit the power of a state to tax individuals or businesses without “due pro-cess of law,” or some minimum connection. In short, the Court has interpreted both clauses to mean that an out-of-state corporation must have a sufficient level of presence in a state before it can be taxed.
In-State Corporation
An in-state corporation is one that is incorpo-rated in that state (sometimes referred to as domestic corpora-tions). Out-of-State Corporation
An out-of-state corpo-ration is one that is not incorporated in that state (sometimes re-ferred to as foreign corporations).
Chapter 2: Virginia and Most Other States Impose Corporate Income Tax Only on Certain C Corporations
24
Several U.S. Supreme Court rulings have been significant in estab-lishing states’ jurisdiction to impose income taxes on out-of-state corporations within the boundaries set by the Due Process and Commerce Clauses. In 1959, the Court issued a ruling in North-western States Portland Cement Company v. Minnesota that creat-ed standards to which states should adhere so as not to conflict with the Commerce or Due Process clauses. The primary question in this case was whether Minnesota’s tax violated the Commerce Clause, and the Court held that it did not and further explained that such a tax would not as long as there was a (1) connection be-tween the taxpayer and the taxing state, (2) lack of discrimination in the state’s taxing scheme, and (3) fairly apportioned tax. The Court also ruled that Minnesota’s corporate income tax did not vio-late the Due Process Clause because the tax was levied on the por-tion of Northwestern’s income arising from activities in the state, which indicated a minimum connection.
In addition to developing a three-pronged test, the Northwestern ruling had other significant impacts. First, this ruling upheld a state income tax on a corporation whose activity in the taxing state entailed primarily the mere solicitation of sales. Prior to this rul-ing, few states subjected these corporations to their income tax. Second, it confirmed that the maintenance of a sales office in a state constituted sufficient nexus for corporate income tax purpos-es. However, the Court did not indicate whether it would have reached the same conclusion if Northwestern was not physically present in Minnesota. This omission was of chief concern to the business community and led Congress to enact legislation which provided a safe harbor for corporations selling tangible goods and engaged solely in the solicitation of sales, as discussed in more de-tail in the following section.
In 1977, the U.S. Supreme Court issued another significant ruling with Complete Auto Transit, Inc. v. Brady in which it found that a state income tax imposed on out-of-state corporations would not conflict with the Commerce Clause if it met four criteria. This rul-ing is significant because its four-pronged test reaffirms the three-prong standard set in the Northwestern case, has not yet been overruled by the Court or Congress, and is still applicable today. Specifically, the test requires that a state’s tax system be
applied to an activity that has a substantial nexus with the state,
fairly apportioned to activities carried on by the taxpayer in the state,
non-discriminating against interstate commerce, and
fairly related to services provided by the state.
Chapter 2: Virginia and Most Other States Impose Corporate Income Tax Only on Certain C Corporations
25
Ability to Impose Nexus Also Limited by Federal Law. In 1959, soon after the Court’s Northwestern ruling, the U.S. Congress enacted Public Law (PL) 86-272, which greatly restricted states’ abilities to impose income taxes on certain out-of-state corporations engaging in interstate commerce. Specifically, this law prohibits states from imposing income taxes on out-of-state corporations whose only con-tact with the taxing state is solicitation of sales of tangible person-al property.
One significant implication of this law is that it establishes that certain corporations must have a physical presence in a state in order to be subject to its income tax. While the law does not specif-ically state that a physical presence is required, its language and legislative history indicate that soliciting sales or orders in the state without the presence of a sales office is not sufficient to es-tablish nexus. Moreover, according to the Virginia Administrative Code (23VAC10-120-90), Virginia interprets PL 86-272 as
federal law [that] prohibits any state from imposing a net in-come tax on a foreign corporation having no place of business within the state, whose sole activity within the state is solicita-tion of orders…
Although PL 86-272 does not specifically indicate which activities constitute solicitation of orders, it was later interpreted in a U.S. Supreme Court ruling in Wisconsin Department of Revenue v. Wil-liam Wrigley, Jr., Co. (1992). The Court ruled that activities con-stituting solicitation of orders include (1) activities directly related to obtaining the order and (2) activities that are ancillary or that serve no other business purpose apart from their connection to the order. In its ruling, the Court also made a de minimis exception so that activities beyond solicitation of orders may still be protected if they are irregular or infrequent in nature.
Although PL 86-272 has had far-reaching implications for states’ abilities to tax out-of-state corporations and is still in effect today, it is not without limitations. The law’s protection is limited only to activities involving “sales of tangible personal property” and is si-lent on the application of the physical presence and solicitation tests to sales of services and other intangible goods. Moreover, the law only applies to income taxes and not to those based on measures other than income, such as franchise and gross receipt taxes.
Unlike Most States, Virginia Further Limits Taxing Authority by Requiring Physical Presence for All Corporations
Unlike most states, Virginia has opted to implement policies that reduce its taxing jurisdiction further than it is limited under fed-
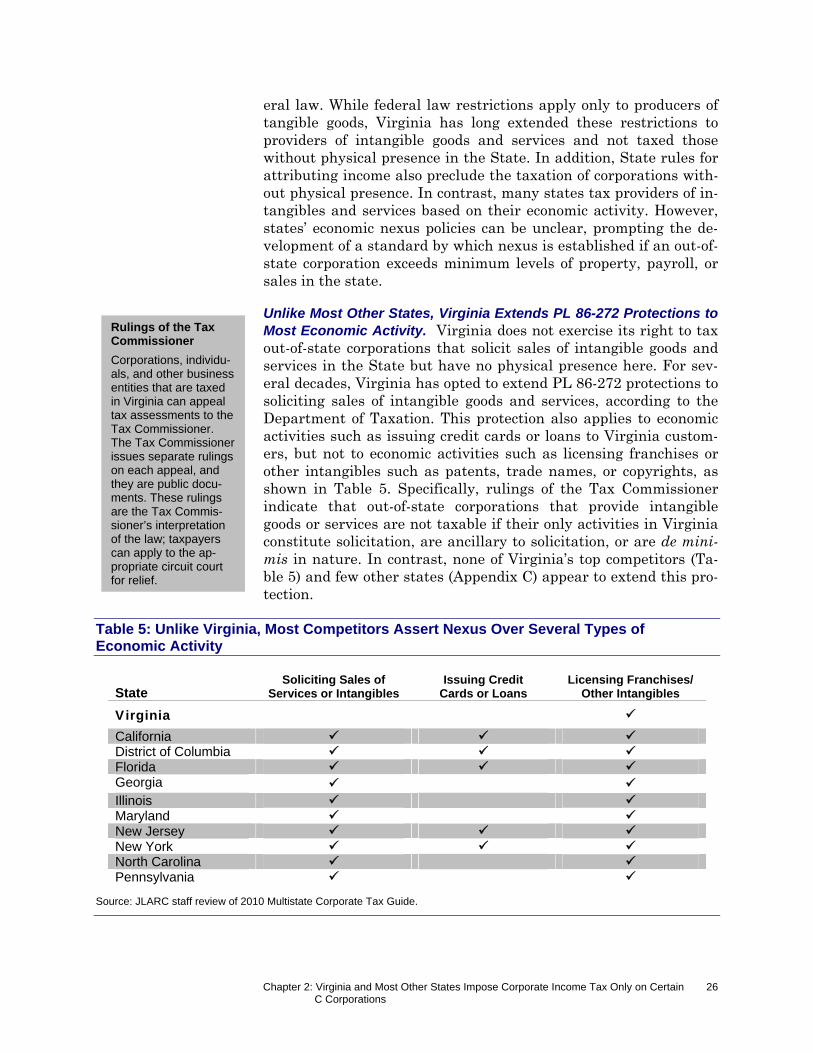
Chapter 2: Virginia and Most Other States Impose Corporate Income Tax Only on Certain C Corporations
26
eral law. While federal law restrictions apply only to producers of tangible goods, Virginia has long extended these restrictions to providers of intangible goods and services and not taxed those without physical presence in the State. In addition, State rules for attributing income also preclude the taxation of corporations with-out physical presence. In contrast, many states tax providers of in-tangibles and services based on their economic activity. However, states’ economic nexus policies can be unclear, prompting the de-velopment of a standard by which nexus is established if an out-of-state corporation exceeds minimum levels of property, payroll, or sales in the state.
Unlike Most Other States, Virginia Extends PL 86-272 Protections to Most Economic Activity. Virginia does not exercise its right to tax out-of-state corporations that solicit sales of intangible goods and services in the State but have no physical presence here. For sev-eral decades, Virginia has opted to extend PL 86-272 protections to soliciting sales of intangible goods and services, according to the Department of Taxation. This protection also applies to economic activities such as issuing credit cards or loans to Virginia custom-ers, but not to economic activities such as licensing franchises or other intangibles such as patents, trade names, or copyrights, as shown in Table 5. Specifically, rulings of the Tax Commissioner indicate that out-of-state corporations that provide intangible goods or services are not taxable if their only activities in Virginia constitute solicitation, are ancillary to solicitation, or are de mini-mis in nature. In contrast, none of Virginia’s top competitors (Ta-ble 5) and few other states (Appendix C) appear to extend this pro-tection.
Table 5: Unlike Virginia, Most Competitors Assert Nexus Over Several Types of Economic Activity
State Soliciting Sales of
Services or Intangibles Issuing Credit
Cards or Loans Licensing Franchises/
Other Intangibles
Virginia
California District of Columbia Florida Georgia Illinois Maryland New Jersey New York North Carolina Pennsylvania
Source: JLARC staff review of 2010 Multistate Corporate Tax Guide.
Rulings of the Tax Commissioner
Corporations, individu-als, and other business entities that are taxed in Virginia can appeal tax assessments to the Tax Commissioner. The Tax Commissioner issues separate rulings on each appeal, and they are public docu-ments. These rulings are the Tax Commis-sioner’s interpretation of the law; taxpayers can apply to the ap-propriate circuit court for relief.
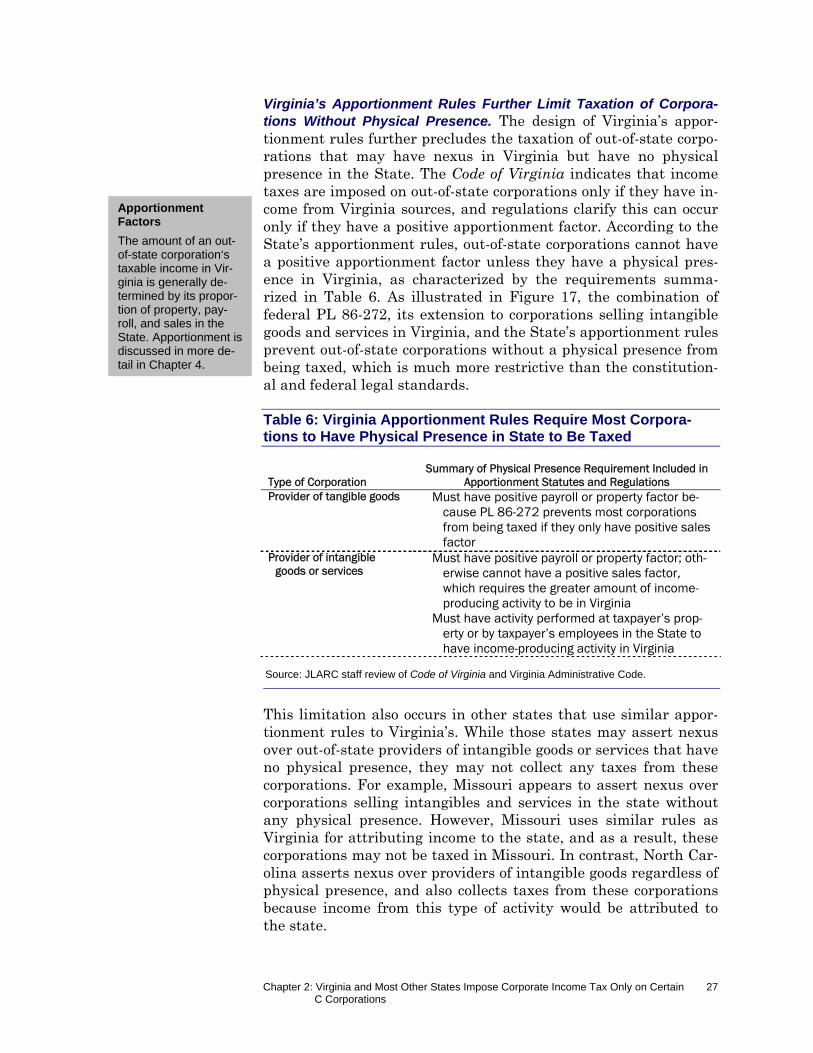
Chapter 2: Virginia and Most Other States Impose Corporate Income Tax Only on Certain C Corporations
27
Virginia’s Apportionment Rules Further Limit Taxation of Corpora-tions Without Physical Presence. The design of Virginia’s appor-tionment rules further precludes the taxation of out-of-state corpo-rations that may have nexus in Virginia but have no physical presence in the State. The Code of Virginia indicates that income taxes are imposed on out-of-state corporations only if they have in-come from Virginia sources, and regulations clarify this can occur only if they have a positive apportionment factor. According to the State’s apportionment rules, out-of-state corporations cannot have a positive apportionment factor unless they have a physical pres-ence in Virginia, as characterized by the requirements summa-rized in Table 6. As illustrated in Figure 17, the combination of federal PL 86-272, its extension to corporations selling intangible goods and services in Virginia, and the State’s apportionment rules prevent out-of-state corporations without a physical presence from being taxed, which is much more restrictive than the constitution-al and federal legal standards.
Table 6: Virginia Apportionment Rules Require Most Corpora-tions to Have Physical Presence in State to Be Taxed
Type of Corporation Summary of Physical Presence Requirement Included in
Apportionment Statutes and Regulations Provider of tangible goods Must have positive payroll or property factor be-
cause PL 86-272 prevents most corporations from being taxed if they only have positive sales factor
Provider of intangible goods or services
Must have positive payroll or property factor; oth-erwise cannot have a positive sales factor, which requires the greater amount of income-producing activity to be in Virginia
Must have activity performed at taxpayer’s prop-erty or by taxpayer’s employees in the State to have income-producing activity in Virginia
Source: JLARC staff review of Code of Virginia and Virginia Administrative Code.
This limitation also occurs in other states that use similar appor-tionment rules to Virginia’s. While those states may assert nexus over out-of-state providers of intangible goods or services that have no physical presence, they may not collect any taxes from these corporations. For example, Missouri appears to assert nexus over corporations selling intangibles and services in the state without any physical presence. However, Missouri uses similar rules as Virginia for attributing income to the state, and as a result, these corporations may not be taxed in Missouri. In contrast, North Car-olina asserts nexus over providers of intangible goods regardless of physical presence, and also collects taxes from these corporations because income from this type of activity would be attributed to the state.
Apportionment Factors
The amount of an out-of-state corporation‘s taxable income in Vir-ginia is generally de-termined by its propor-tion of property, pay-roll, and sales in the State. Apportionment is discussed in more de-tail in Chapter 4.
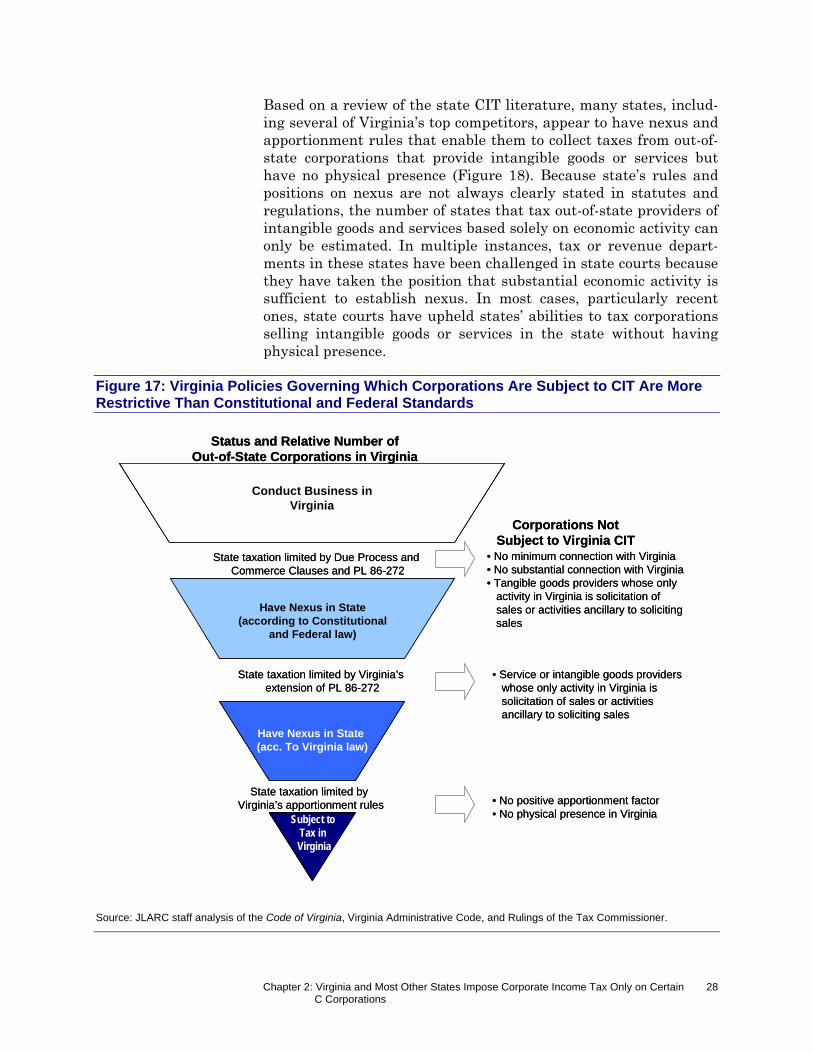
Chapter 2: Virginia and Most Other States Impose Corporate Income Tax Only on Certain C Corporations
28
Based on a review of the state CIT literature, many states, includ-ing several of Virginia’s top competitors, appear to have nexus and apportionment rules that enable them to collect taxes from out-of-state corporations that provide intangible goods or services but have no physical presence (Figure 18). Because state’s rules and positions on nexus are not always clearly stated in statutes and regulations, the number of states that tax out-of-state providers of intangible goods and services based solely on economic activity can only be estimated. In multiple instances, tax or revenue depart-ments in these states have been challenged in state courts because they have taken the position that substantial economic activity is sufficient to establish nexus. In most cases, particularly recent ones, state courts have upheld states’ abilities to tax corporations selling intangible goods or services in the state without having physical presence.
Figure 17: Virginia Policies Governing Which Corporations Are Subject to CIT Are More Restrictive Than Constitutional and Federal Standards
Source: JLARC staff analysis of the Code of Virginia, Virginia Administrative Code, and Rulings of the Tax Commissioner.
Conduct Business in Virginia
Have Nexus in State(according to Constitutional
and Federal law)
Have Nexus in State (acc. To Virginia law)
Subject to Tax in Virginia
Corporations Not Subject to Virginia CIT
State taxation limited by Due Process and Commerce Clauses and PL 86-272
• No minimum connection with Virginia• No substantial connection with Virginia• Tangible goods providers whose only
activity in Virginia is solicitation of sales or activities ancillary to solicitingsales
• Service or intangible goods providers whose only activity in Virginia is solicitation of sales or activitiesancillary to soliciting sales
• No positive apportionment factor• No physical presence in Virginia
State taxation limited by Virginia’s extension of PL 86-272
State taxation limited by Virginia’s apportionment rules
Status and Relative Number of Out-of-State Corporations in Virginia
Conduct Business in Virginia
Conduct Business in Virginia
Have Nexus in State(according to Constitutional
and Federal law)
Have Nexus in State (acc. To Virginia law)Have Nexus in State (acc. To Virginia law)
Subject to Tax in Virginia
Subject to Tax in Virginia
Corporations Not Subject to Virginia CIT
State taxation limited by Due Process and Commerce Clauses and PL 86-272
• No minimum connection with Virginia• No substantial connection with Virginia• Tangible goods providers whose only
activity in Virginia is solicitation of sales or activities ancillary to solicitingsales
• Service or intangible goods providers whose only activity in Virginia is solicitation of sales or activitiesancillary to soliciting sales
• No positive apportionment factor• No physical presence in Virginia
State taxation limited by Virginia’s extension of PL 86-272
State taxation limited by Virginia’s apportionment rules
Status and Relative Number of Out-of-State Corporations in Virginia
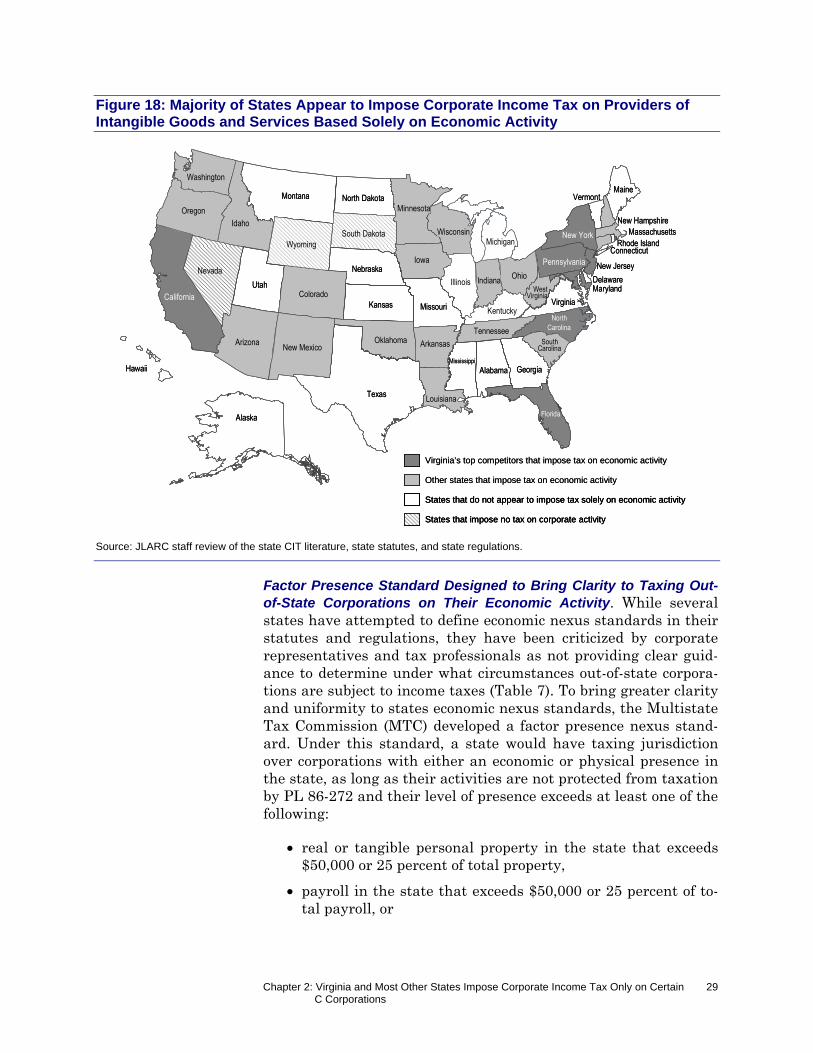
Chapter 2: Virginia and Most Other States Impose Corporate Income Tax Only on Certain C Corporations
29
Figure 18: Majority of States Appear to Impose Corporate Income Tax on Providers of Intangible Goods and Services Based Solely on Economic Activity
Alaska
Texas
Utah
Montana
California
Arizona
Idaho
Nevada
Oregon
Iowa
ColoradoKansas
Wyoming
New Mexico
Missouri
Minnesota
Nebraska
Oklahoma
South Dakota
Washington
Arkansas
North Dakota
Louisiana
Hawaii
IllinoisOhio
Florida
GeorgiaAlabama
Wisconsin
Virginia
Indiana
Michigan
Mississippi
Kentucky
Tennessee
Pennsylvania
NorthCarolina
SouthCarolina
WestVirginia
New Jersey
Maine
New York
Vermont
Maryland
New Hampshire
Connecticut
Delaware
MassachusettsRhode Island
States that do not appear to impose tax solely on economic activity
Other states that impose tax on economic activity
Virginia’s top competitors that impose tax on economic activity
States that impose no tax on corporate activity
Alaska
Texas
Utah
Montana
California
Arizona
Idaho
Nevada
Oregon
Iowa
ColoradoKansas
Wyoming
New Mexico
Missouri
Minnesota
Nebraska
Oklahoma
South Dakota
Washington
Arkansas
North Dakota
Louisiana
Hawaii
IllinoisOhio
Florida
GeorgiaAlabama
Wisconsin
Virginia
Indiana
Michigan
Mississippi
Kentucky
Tennessee
Pennsylvania
NorthCarolina
SouthCarolina
WestVirginia
New Jersey
Maine
New York
Vermont
Maryland
New Hampshire
Connecticut
Delaware
MassachusettsRhode Island
States that do not appear to impose tax solely on economic activityStates that do not appear to impose tax solely on economic activity
Other states that impose tax on economic activity
Virginia’s top competitors that impose tax on economic activity
States that impose no tax on corporate activityStates that impose no tax on corporate activity
Source: JLARC staff review of the state CIT literature, state statutes, and state regulations.
Factor Presence Standard Designed to Bring Clarity to Taxing Out-of-State Corporations on Their Economic Activity. While several states have attempted to define economic nexus standards in their statutes and regulations, they have been criticized by corporate representatives and tax professionals as not providing clear guid-ance to determine under what circumstances out-of-state corpora-tions are subject to income taxes (Table 7). To bring greater clarity and uniformity to states economic nexus standards, the Multistate Tax Commission (MTC) developed a factor presence nexus stand-ard. Under this standard, a state would have taxing jurisdiction over corporations with either an economic or physical presence in the state, as long as their activities are not protected from taxation by PL 86-272 and their level of presence exceeds at least one of the following:
real or tangible personal property in the state that exceeds $50,000 or 25 percent of total property,
payroll in the state that exceeds $50,000 or 25 percent of to-tal payroll, or
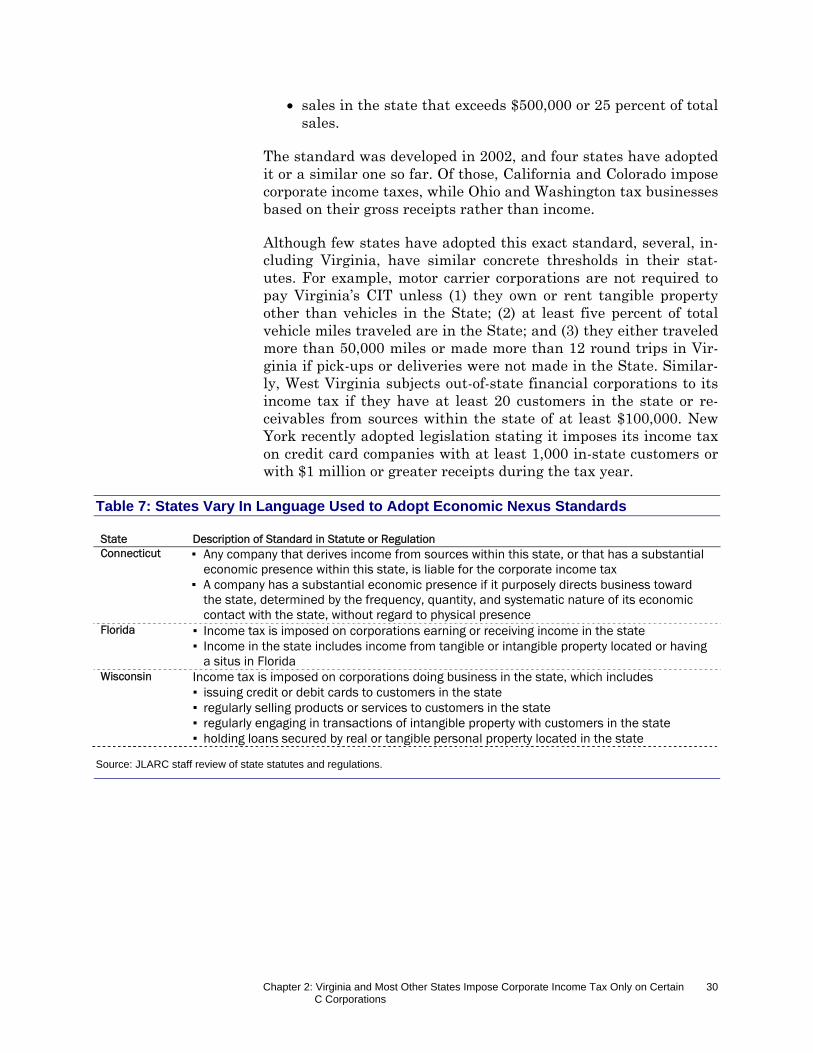
Chapter 2: Virginia and Most Other States Impose Corporate Income Tax Only on Certain C Corporations
30
sales in the state that exceeds $500,000 or 25 percent of total sales.
The standard was developed in 2002, and four states have adopted it or a similar one so far. Of those, California and Colorado impose corporate income taxes, while Ohio and Washington tax businesses based on their gross receipts rather than income.
Although few states have adopted this exact standard, several, in-cluding Virginia, have similar concrete thresholds in their stat-utes. For example, motor carrier corporations are not required to pay Virginia’s CIT unless (1) they own or rent tangible property other than vehicles in the State; (2) at least five percent of total vehicle miles traveled are in the State; and (3) they either traveled more than 50,000 miles or made more than 12 round trips in Vir-ginia if pick-ups or deliveries were not made in the State. Similar-ly, West Virginia subjects out-of-state financial corporations to its income tax if they have at least 20 customers in the state or re-ceivables from sources within the state of at least $100,000. New York recently adopted legislation stating it imposes its income tax on credit card companies with at least 1,000 in-state customers or with $1 million or greater receipts during the tax year.
Table 7: States Vary In Language Used to Adopt Economic Nexus Standards State Description of Standard in Statute or Regulation Connecticut ▪ Any company that derives income from sources within this state, or that has a substantial
economic presence within this state, is liable for the corporate income tax ▪ A company has a substantial economic presence if it purposely directs business toward
the state, determined by the frequency, quantity, and systematic nature of its economic contact with the state, without regard to physical presence
Florida ▪ Income tax is imposed on corporations earning or receiving income in the state ▪ Income in the state includes income from tangible or intangible property located or having
a situs in Florida Wisconsin Income tax is imposed on corporations doing business in the state, which includes
▪ issuing credit or debit cards to customers in the state ▪ regularly selling products or services to customers in the state ▪ regularly engaging in transactions of intangible property with customers in the state ▪ holding loans secured by real or tangible personal property located in the state
Source: JLARC staff review of state statutes and regulations.
Chapter 3: Virginia and Other States Determine Taxable Income Similarly, but New Trends Are Emerging
31
Corporations must follow state-specific rules to determine which income sources and which entities to include in their calculation of state taxable income. While most states base their calculation on federal rules and require similar adjustments, each state has im-plemented their rules in somewhat different ways. In addition, states often use different approaches for determining which busi-ness entities should be included in a parent corporation’s tax re-turn. It is in part due to these differences that multistate corpora-tions can sometimes adopt practices that are deemed overly aggressive by tax departments, such as shifting income to states that offer more advantageous rules.
VIRGINIA AND MOST STATES USE FEDERAL TAXABLE INCOME AS STARTING POINT FOR CALCULATION
Virginia and most other states rely heavily on the federal tax structure because they require corporations to use federal taxable income as the starting point in calculating their state taxable in-come. Building upon federally defined calculations and rules sim-plifies the state filing process and results in more consistent tax systems across states. However, most states have chosen not to comply with certain federal rules because they are either not rele-vant to state tax systems, costly to implement, or in conflict with state goals. The most common adjustments pertain to the treat-ment of certain income sources and expenses, as well as deprecia-tion and losses.
Ch
apte
r
33
VViirrggiinniiaa aanndd OOtthheerr SSttaatteess DDeetteerrmmiinnee TTaaxxaabbllee IInnccoommee SSiimmiillaarrllyy,, bbuutt NNeeww TTrreennddss AArree EEmmeerrggiinngg
While Virginia and most states require corporations to follow a similar approach forcalculating their state taxable income, several important differences exist while cer-tain new trends are emerging. To simplify the filing process, states have long basedtheir taxable income calculations on federal rules. However, Virginia and most otherstates depart from certain federal rules that are either inconsistent with state goalsor cause significant revenue losses. While many states are beginning to require affil-iated entities to file group returns, Virginia allows corporations to select their pre-ferred filing format, which they must use consistently for several years. Because ag-gressive tax planning strategies can be used to unduly reduce the amount of incometaxable in a given state, states have adopted several mechanisms to eliminate inter-state activities that do not fulfill a valid business purpose. Virginia requires corpora-tions to add back certain sources of income transferred between related parties, buthas not adopted the more comprehensive mandatory unitary combined reporting,which is increasingly being used in other states.
II nn SS
uumm
mmaa r
r yy
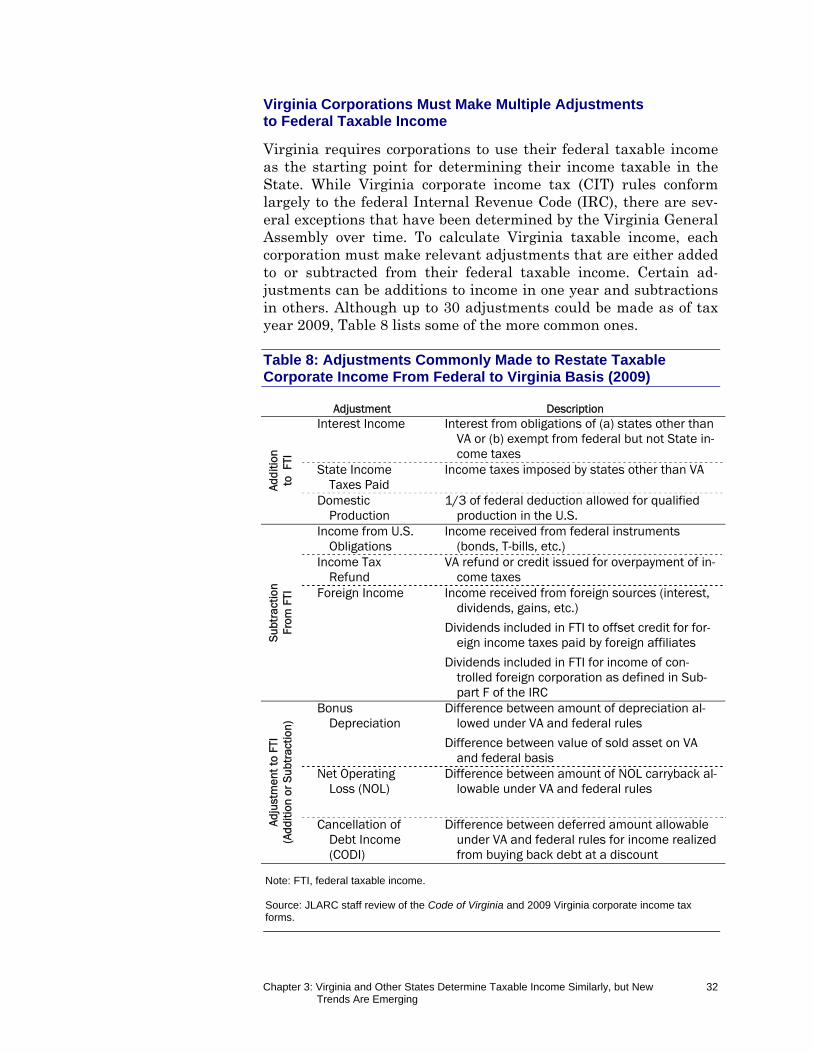
Chapter 3: Virginia and Other States Determine Taxable Income Similarly, but New Trends Are Emerging
32
Virginia Corporations Must Make Multiple Adjustments to Federal Taxable Income
Virginia requires corporations to use their federal taxable income as the starting point for determining their income taxable in the State. While Virginia corporate income tax (CIT) rules conform largely to the federal Internal Revenue Code (IRC), there are sev-eral exceptions that have been determined by the Virginia General Assembly over time. To calculate Virginia taxable income, each corporation must make relevant adjustments that are either added to or subtracted from their federal taxable income. Certain ad-justments can be additions to income in one year and subtractions in others. Although up to 30 adjustments could be made as of tax year 2009, Table 8 lists some of the more common ones.
Table 8: Adjustments Commonly Made to Restate Taxable Corporate Income From Federal to Virginia Basis (2009)
Adjustment Description
Addi
tion
to
FTI
Interest Income Interest from obligations of (a) states other than VA or (b) exempt from federal but not State in-come taxes
State Income Taxes Paid
Income taxes imposed by states other than VA
Domestic Production
1/3 of federal deduction allowed for qualified production in the U.S.
Subt
ract
ion
Fr
om F
TI
Income from U.S. Obligations
Income received from federal instruments (bonds, T-bills, etc.)
Income Tax Refund
VA refund or credit issued for overpayment of in-come taxes
Foreign Income Income received from foreign sources (interest, dividends, gains, etc.)
Dividends included in FTI to offset credit for for-eign income taxes paid by foreign affiliates
Dividends included in FTI for income of con-trolled foreign corporation as defined in Sub-part F of the IRC
Adju
stm
ent t
o FT
I (A
dditi
on o
r Su
btra
ctio
n)
Bonus Depreciation
Difference between amount of depreciation al-lowed under VA and federal rules
Difference between value of sold asset on VA and federal basis
Net Operating Loss (NOL)
Difference between amount of NOL carryback al-lowable under VA and federal rules
Cancellation of Debt Income (CODI)
Difference between deferred amount allowable under VA and federal rules for income realized from buying back debt at a discount
Note: FTI, federal taxable income. Source: JLARC staff review of the Code of Virginia and 2009 Virginia corporate income tax forms.
Chapter 3: Virginia and Other States Determine Taxable Income Similarly, but New Trends Are Emerging
33
Virginia additions are designed to either include certain types of income that were excluded for federal purposes or to disallow cer-tain expenses that would otherwise enable taxpayers to receive a tax benefit twice for the same expense. For example, Virginia does not exempt interest income earned on obligations issued by other states, but this income is exempt under federal rules. Accordingly, Virginia corporations must add this type of interest to their federal taxable income to calculate their income taxable in the State. Con-versely, subtractions serve to exempt certain types of income from State taxation. For example, Virginia taxpayers can subtract for-eign source income included in their federal taxable income.
Besides requiring expense and income adjustments, Virginia uses adjustments to deconform from certain IRC rules. The Virginia General Assembly has opted to deconform from the IRC in only four areas, primarily to mitigate their effect on State revenue ac-cording to staff of the Virginia Department of Taxation (TAX). Vir-ginia has not adopted the 2001 federal provision which allowed corporations to deduct “bonus” depreciation from federal taxable income. “Bonus” depreciation enables businesses to claim an im-mediate federal tax deduction of up to 50 percent of the cost of new equipment purchases, rather than following the standard account-ing approach of depreciating the full cost gradually over the useful life of the asset. Virginia corporations whose federal return in-cludes bonus depreciation must make an adjustment on their State return equal to the difference between the amount of bonus depre-ciation deducted at the federal level and the standard depreciation of the equipment. This adjustment will generally result in an addi-tion to federal taxable income in the first year, and subsequently a subtraction. While the federal provision accelerates the timing of depreciation expenditures and therefore lowers income tax collec-tions in the year when depreciable property is acquired, neither the federal nor Virginia’s adjustment ultimately has any effect on tax revenue over the long term.
Virginia also deconforms from IRC changes increasing the period during which net operating losses (NOLs) can be used. While there is no Virginia NOL available for carryback or carryover, federal NOL deductions affect corporations’ State income tax liability be-cause it is based upon federal taxable income. Prior to 2001, the IRC allowed a business experiencing an operating loss in the most recent tax year to file amended tax returns for the two prior years and deduct that loss against any profits earned in those two years. Any unused losses that remained after being carried back could be deducted against profits earned in any of the next 20 years. In sev-eral tax years since 2001, IRC changes allowed taxpayers to carry back net operating losses for five years for federal purposes. How-ever, Virginia deconformed and maintained its practice of allowing corporations to carry back NOLs for only two years.
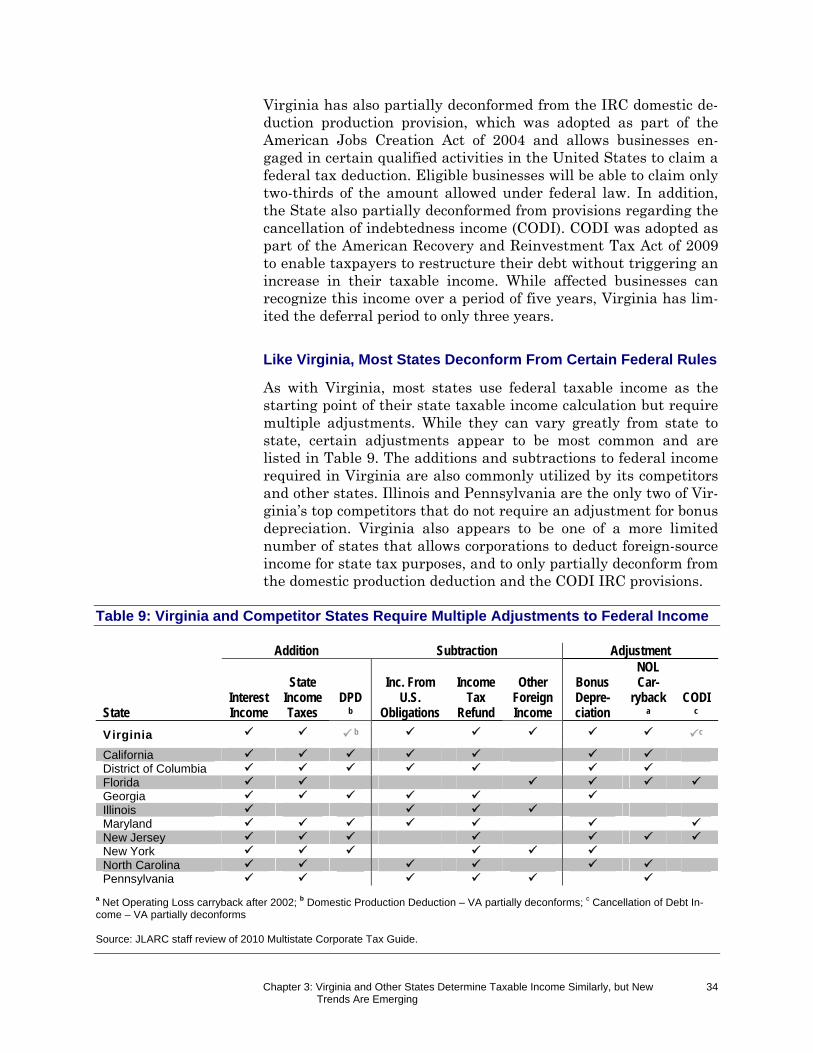
Chapter 3: Virginia and Other States Determine Taxable Income Similarly, but New Trends Are Emerging
34
Virginia has also partially deconformed from the IRC domestic de-duction production provision, which was adopted as part of the American Jobs Creation Act of 2004 and allows businesses en-gaged in certain qualified activities in the United States to claim a federal tax deduction. Eligible businesses will be able to claim only two-thirds of the amount allowed under federal law. In addition, the State also partially deconformed from provisions regarding the cancellation of indebtedness income (CODI). CODI was adopted as part of the American Recovery and Reinvestment Tax Act of 2009 to enable taxpayers to restructure their debt without triggering an increase in their taxable income. While affected businesses can recognize this income over a period of five years, Virginia has lim-ited the deferral period to only three years.
Like Virginia, Most States Deconform From Certain Federal Rules
As with Virginia, most states use federal taxable income as the starting point of their state taxable income calculation but require multiple adjustments. While they can vary greatly from state to state, certain adjustments appear to be most common and are listed in Table 9. The additions and subtractions to federal income required in Virginia are also commonly utilized by its competitors and other states. Illinois and Pennsylvania are the only two of Vir-ginia’s top competitors that do not require an adjustment for bonus depreciation. Virginia also appears to be one of a more limited number of states that allows corporations to deduct foreign-source income for state tax purposes, and to only partially deconform from the domestic production deduction and the CODI IRC provisions.
Table 9: Virginia and Competitor States Require Multiple Adjustments to Federal Income
Addition Subtraction Adjustment
State Interest Income
State Income Taxes
DPD b
Inc. From U.S.
Obligations
Income Tax
Refund
Other Foreign Income
Bonus Depre-ciation
NOL Car-
ryback a
CODIc
Virginia b c
California District of Columbia Florida Georgia Illinois Maryland New Jersey New York North Carolina Pennsylvania
a Net Operating Loss carryback after 2002; b Domestic Production Deduction – VA partially deconforms; c Cancellation of Debt In-come – VA partially deconforms Source: JLARC staff review of 2010 Multistate Corporate Tax Guide.
Chapter 3: Virginia and Other States Determine Taxable Income Similarly, but New Trends Are Emerging
35
VIRGINIA AND MANY STATES ALLOW SEPARATE REPORTING, BUT TREND IS TOWARD MANDATORY GROUP FILING
Historically, many states have allowed affiliated corporations to ei-ther file separate returns or choose a group filing format. However, many states are now requiring group returns because they tend to better reflect the group’s activity in the state than separate re-turns. In contrast, Virginia continues to allow affiliated groups to file separate returns or elect to file using one of two group formats.
Affiliated Corporations in Virginia Can Select Preferred Filing Format, but Must File on Same Basis Each Year
Corporations must file a return with TAX if they have registered with the State Corporation Commission for the privilege of doing business in Virginia or if they have earned income from Virginia sources, even if no State income tax is due. Self-contained corpora-tions file a separate return that reflects strictly their own business activity and tax liability. In contrast, corporations that have affili-ates may select one of three reporting formats: separate returns for each corporation, a consolidated return, or a combined return. The filing format they select can have a significant impact on corpora-tions’ tax liability, which is in part why they are not allowed to se-lect a different format from year to year.
Affiliated Corporations Can Choose From Three Filing Formats. Af-filiated groups of corporations can elect to file separate, consolidat-ed, or combined returns. A separate corporate income tax return shows the total income or loss of the filing corporation and the share of income or loss attributable to Virginia. The financial as-pects of any affiliate are ignored in the return.
Consolidated and combined returns are a single return for all eli-gible members of an affiliated group of corporations. In a consoli-dated return, calculations are performed at the aggregate level, in-cluding the total net income or losses, the share of the group’s income or loss attributable to Virginia, and apportionment factors. In a combined return, taxable income is apportioned to Virginia individually for each affiliated corporation. Each affiliate’s income or loss from Virginia sources is then combined and reported on a single return. To elect either a consolidated or combined return, all members of the affiliated group must have the same tax year end, must have nexus in Virginia, and would be subject to Virginia in-come tax if separate returns were filed.
Virginia’s group filing formats have changed over time to accom-modate different types of corporations. Originally, affiliated groups could only file a consolidated return if all corporations in the group used the same method to calculate their apportionment factor. Be-
Affiliated Corporations
Affiliated corporations are defined as two or more corporations sub-ject to Virginia income taxes where one cor-poration owns at least 80 percent of the vot-ing stock of the other, or at least 80 percent of the voting stock of two or more corpora-tions is owned by the same interests.
Chapter 3: Virginia and Other States Determine Taxable Income Similarly, but New Trends Are Emerging
36
cause different methods exist for certain industries, such as finan-cial corporations or construction companies, some affiliated groups were not eligible to file a consolidated return. Using a group filing format generally benefits affiliated groups of corporations in which some affiliates have losses because they can be used to offset prof-its of other affiliates, reducing the overall tax burden of the group. To address this issue, the General Assembly adopted legislation that created combined returns for affiliated corporations using dif-ferent apportionment methods but wishing to file as a group.
In 1990, affiliated corporations using different apportionment for-mulas were allowed to file consolidated returns. This change was implemented to address equity issues between affiliated groups that were able to fully offset losses in a consolidated return but not in a combined return. In addition, TAX staff indicated that apply-ing losses in a combined return is much more complex.
Permission to Change Filing Format Granted Only in Certain Cir-cumstances. Corporations must file on the same basis from one year to the next, unless they receive permission from TAX to change their reporting format. TAX only grants such requests if changes do not affect the corporation’s apportionment factors and do not distort the business conducted and income produced in Vir-ginia. Because apportionment factors are calculated individually for each affiliate in a combined return, they should be identical to separate returns. As a result, permission to change between these returns is usually granted.
In contrast, an aggregate apportionment factor is calculated across all affiliates in a consolidated return, which could yield a very dif-ferent tax liability from a combined or separate return. Conse-quently, TAX will only grant a request to change to or from a con-solidated return if (1) the group has filed on the same basis for at least the preceding 20 years, (2) there will be no decrease in tax li-ability computed under the proposed change as compared to the current filing method, and (3) the group agrees to compute its tax liability under both the current and proposed method and pay the greater of the two amounts for the first two years.
An Increasing Number of Other States Are Requiring Group Filing
While Virginia and many other states continue to allow separate reporting for affiliated groups, an increasing number have either considered or acted upon requiring affiliated corporations to file as a group (Figure 19). According to the state CIT literature, group returns better reflect the income and activity of the businesses, and can mitigate the impact of tax planning to reduce tax
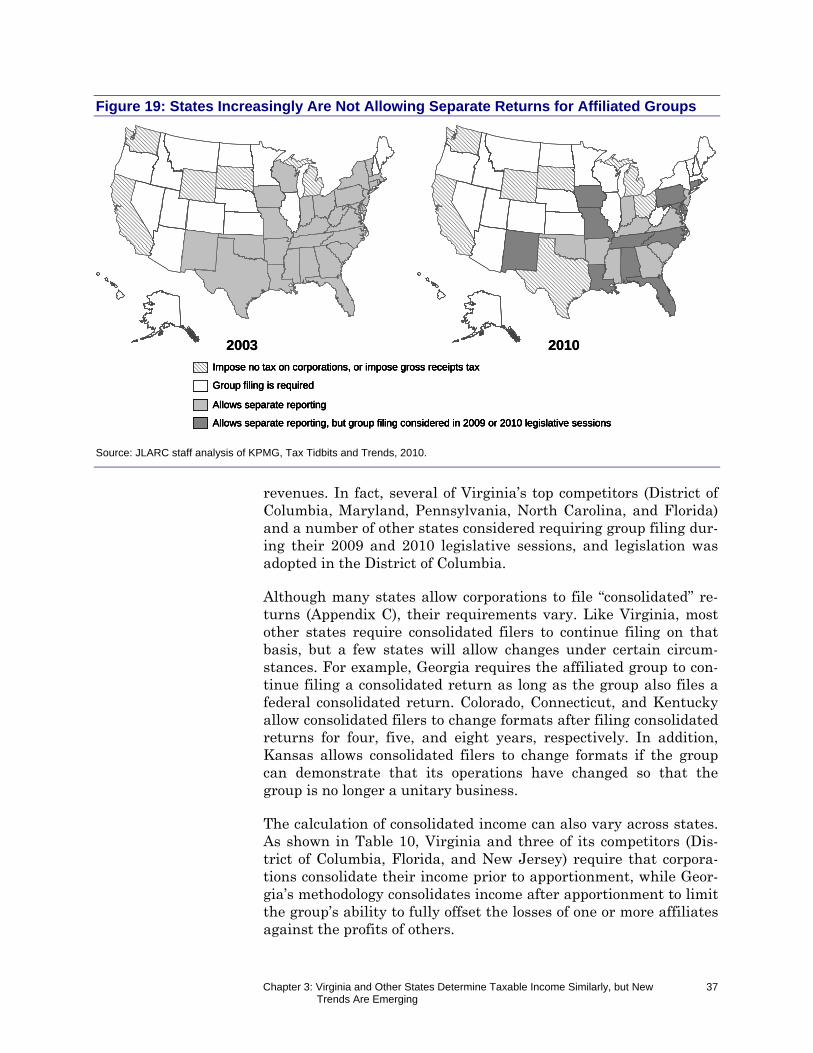
Chapter 3: Virginia and Other States Determine Taxable Income Similarly, but New Trends Are Emerging
37
Figure 19: States Increasingly Are Not Allowing Separate Returns for Affiliated Groups
Source: JLARC staff analysis of KPMG, Tax Tidbits and Trends, 2010.
revenues. In fact, several of Virginia’s top competitors (District of Columbia, Maryland, Pennsylvania, North Carolina, and Florida) and a number of other states considered requiring group filing dur-ing their 2009 and 2010 legislative sessions, and legislation was adopted in the District of Columbia.
Although many states allow corporations to file “consolidated” re-turns (Appendix C), their requirements vary. Like Virginia, most other states require consolidated filers to continue filing on that basis, but a few states will allow changes under certain circum-stances. For example, Georgia requires the affiliated group to con-tinue filing a consolidated return as long as the group also files a federal consolidated return. Colorado, Connecticut, and Kentucky allow consolidated filers to change formats after filing consolidated returns for four, five, and eight years, respectively. In addition, Kansas allows consolidated filers to change formats if the group can demonstrate that its operations have changed so that the group is no longer a unitary business.
The calculation of consolidated income can also vary across states. As shown in Table 10, Virginia and three of its competitors (Dis-trict of Columbia, Florida, and New Jersey) require that corpora-tions consolidate their income prior to apportionment, while Geor-gia’s methodology consolidates income after apportionment to limit the group’s ability to fully offset the losses of one or more affiliates against the profits of others.
Impose no tax on corporations, or impose gross receipts tax
Allows separate reporting
Allows separate reporting, but group filing considered in 2009 or 2010 legislative sessions
Group filing is required
2003 2010
Impose no tax on corporations, or impose gross receipts tax
Allows separate reporting
Allows separate reporting, but group filing considered in 2009 or 2010 legislative sessions
Group filing is required
Impose no tax on corporations, or impose gross receipts taxImpose no tax on corporations, or impose gross receipts tax
Allows separate reportingAllows separate reporting
Allows separate reporting, but group filing considered in 2009 or 2010 legislative sessionsAllows separate reporting, but group filing considered in 2009 or 2010 legislative sessions
Group filing is requiredGroup filing is required
2003 2010
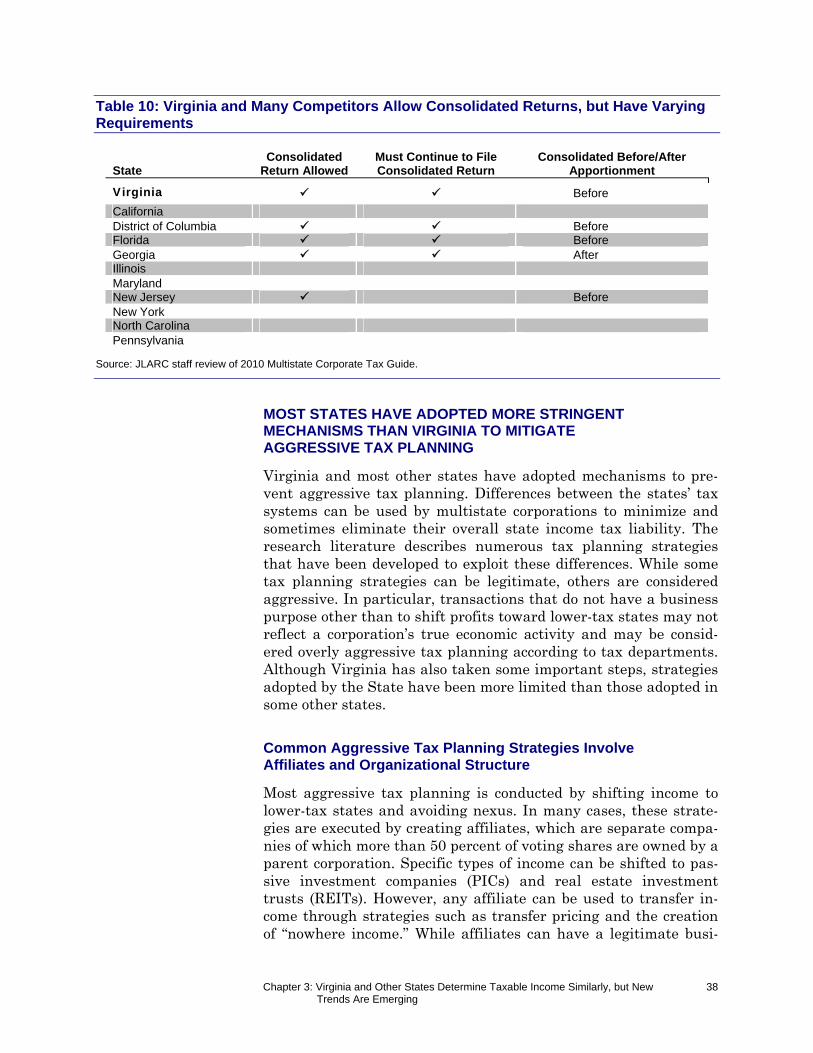
Chapter 3: Virginia and Other States Determine Taxable Income Similarly, but New Trends Are Emerging
38
Table 10: Virginia and Many Competitors Allow Consolidated Returns, but Have Varying Requirements
State Consolidated
Return Allowed Must Continue to FileConsolidated Return
Consolidated Before/After Apportionment
Virginia Before
California District of Columbia Before Florida Before Georgia After Illinois Maryland New Jersey Before New York North Carolina Pennsylvania
Source: JLARC staff review of 2010 Multistate Corporate Tax Guide.
MOST STATES HAVE ADOPTED MORE STRINGENT MECHANISMS THAN VIRGINIA TO MITIGATE AGGRESSIVE TAX PLANNING
Virginia and most other states have adopted mechanisms to pre-vent aggressive tax planning. Differences between the states’ tax systems can be used by multistate corporations to minimize and sometimes eliminate their overall state income tax liability. The research literature describes numerous tax planning strategies that have been developed to exploit these differences. While some tax planning strategies can be legitimate, others are considered aggressive. In particular, transactions that do not have a business purpose other than to shift profits toward lower-tax states may not reflect a corporation’s true economic activity and may be consid-ered overly aggressive tax planning according to tax departments. Although Virginia has also taken some important steps, strategies adopted by the State have been more limited than those adopted in some other states.
Common Aggressive Tax Planning Strategies Involve Affiliates and Organizational Structure
Most aggressive tax planning is conducted by shifting income to lower-tax states and avoiding nexus. In many cases, these strate-gies are executed by creating affiliates, which are separate compa-nies of which more than 50 percent of voting shares are owned by a parent corporation. Specific types of income can be shifted to pas-sive investment companies (PICs) and real estate investment trusts (REITs). However, any affiliate can be used to transfer in-come through strategies such as transfer pricing and the creation of “nowhere income.” While affiliates can have a legitimate busi-
Chapter 3: Virginia and Other States Determine Taxable Income Similarly, but New Trends Are Emerging
39
ness purpose, they may be an overly aggressive tax planning strat-egy if their sole or primary purpose is to minimize a corporation’s tax liability.
Passive Investment Companies. Corporations can transfer their ownership of trademarks or patents to PICs located in states that do not tax royalties or other types of intangible income, such as Delaware or Nevada. Parent corporations located in higher-tax states can reduce their taxable income by paying royalties to PICs for the use of a trademark or patent, therefore lowering their tax liability. PICs located in low- or no-tax states can also be used to hold income-producing assets outside of a corporate group, such that any income it generates is taxed at a lower rate, if at all. For example, Business Week reported that Apple Computer created a Nevada affiliate to manage its $8.7 billion portfolio in cash and other liquid assets.
Real Estate Investment Trusts. REITs are another type of affiliate that can be used to shift income. REITs are allowed to deduct divi-dend payments from their taxable income, and are in effect tax-exempt if they pay out all their profits in the form of dividends. To realize the tax benefits of REITs, corporations can create an affili-ate that qualifies as a REIT, sell their real estate assets to the af-filiate, then lease the real estate back from the REIT for a given price. These transactions reduce the parent corporations’ taxable income, and virtually exempt REIT income from taxes if it is dis-tributed as dividends. For example, the Wall Street Journal re-ported that Wal-Mart had transferred the ownership of its stores to a captive REIT and paid rent to this affiliate for the right to use the stores, realizing savings of approximately $350 million in state corporate income taxes between 1998 and 2001.
Transfer Pricing. Corporations can manipulate the amount of in-come shifted to affiliates by using a technique called “transfer pric-ing.” With this strategy, corporations first sell their products to af-filiates located in lower-tax states, which in turn sell the goods to final customers. Corporations can set the sales price of their prod-ucts to affiliates at an artificially low level in order to minimize their profits in the higher-tax state.
Nowhere Income. Some corporate income may not be subject to taxation in any state, and is called “nowhere income.” Corporations can avoid taxation on the portion of their income related to goods sold in states that do not impose a CIT or where they do not have nexus. Corporations can use affiliates and nexus avoidance to max-imize their nowhere income and minimize the proportion of their profits subject to state income taxes.
Passive Investment Companies (PICs) – PICs are set up to manage and collect income from intangible assets such as trade-marks, patents, stocks, and bonds. PICs are most often formed in Nevada and Delaware. Nevada has no state CIT, and Delaware exempts from its state CIT corporations whose income arises only from the owner-ship of intangible as-sets.
Real Estate Invest-ment Trusts (REITs) – REITs are set up to manage and collect income from real es-tate and related finan-cial instruments (such as mortgage loans). Under federal and state law, a REIT can deduct from its taxable income the dividends it pays to shareholders. Most REITs are owned by thousands of share-holders and serve their intended goal of being the real estate equiva-lent of stocks and bonds. However, they can act as aggressive tax planning when they are “captive,” or owned by a single corporation.
Chapter 3: Virginia and Other States Determine Taxable Income Similarly, but New Trends Are Emerging
40
Nexus Avoidance. Corporations can use affiliates to avoid nexus in a state. The parent corporation can limit its activities strictly to so-liciting sales (which, as discussed in Chapter 2, does not constitute nexus) and use an affiliate to carry out the activities that would create nexus in the state (such as having an office or employing personnel). As a result, states can tax the profits attributable to the affiliate, but not profits resulting from the parent corporation’s out-of-state assets and activities.
Virginia and Most Other States Have Used Multiple Mechanisms to Curb Aggressive Tax Planning
Most states, including Virginia, use at least one mechanism to prevent aggressive corporate tax planning (Appendix C). Some of the most common and effective mechanisms used to mitigate ag-gressive tax planning include the use of add-back provisions, throwback rules, and mandatory unitary combined reporting (MUCR). Requiring affiliates to file on a unitary basis is advanced in the research literature as the most effective means of limiting aggressive tax planning, but corporate staff interviewed and sur-veyed oppose this practice. Still, even MUCR cannot completely eliminate aggressive tax planning, and states are continuously faced with new strategies used by corporations to reduce their tax liability.
Add-Back Provisions for PICs and REITs. Many states, including Virginia, have attempted to address income-shifting practices spe-cifically related to PICs and REITs. In general, corporations in those states are required to add back to their federal taxable in-come any royalty payments made to PICs or interest payments made by REITs. This addition is designed to eliminate the impact of income-shifting activities between a parent corporation and its PIC or REIT affiliate. To avoid adding back, taxpayers must demonstrate that the transactions between their corporation and a related member had a valid business purpose other than the avoidance or reduction of the tax, and that the related payments between the parties were made at arm's length rates and terms. The Virginia General Assembly passed legislation requiring corpo-rations to add back royalties paid to PICs in 2004, and adopted an add-back provision for dividends paid by captive REITs in 2009. As of 2009, eight of Virginia’s top competitors had enacted add-back provisions (Table 11).
Throwback Rule. Many states, including four of Virginia’s competi-tors, have adopted a “throwback rule” to reduce the amount of cor-porate income that is not subject to tax in any state. The throw-back rule requires sales that are not taxable in any state to be “thrown back” to the state that originated the sale for income
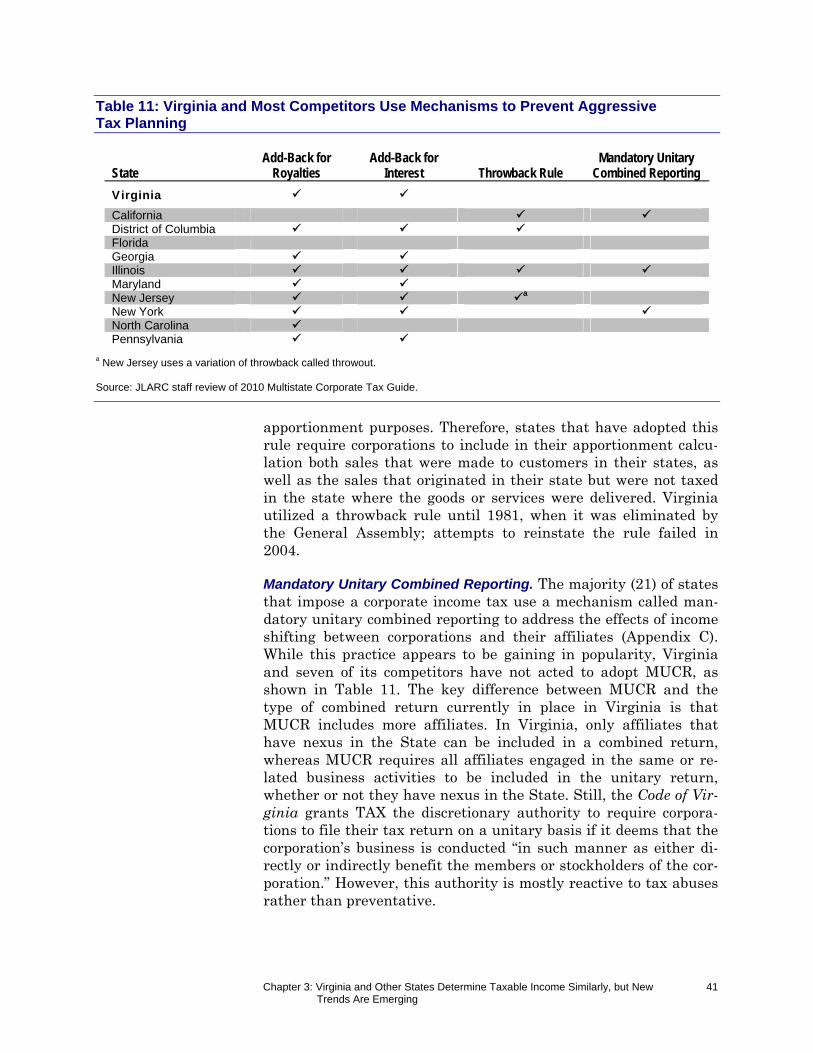
Chapter 3: Virginia and Other States Determine Taxable Income Similarly, but New Trends Are Emerging
41
Table 11: Virginia and Most Competitors Use Mechanisms to Prevent Aggressive Tax Planning
State Add-Back for
Royalties Add-Back for
Interest Throwback Rule Mandatory Unitary
Combined Reporting
Virginia
California District of Columbia Florida Georgia Illinois Maryland New Jersey a New York North Carolina Pennsylvania
a New Jersey uses a variation of throwback called throwout. Source: JLARC staff review of 2010 Multistate Corporate Tax Guide.
apportionment purposes. Therefore, states that have adopted this rule require corporations to include in their apportionment calcu-lation both sales that were made to customers in their states, as well as the sales that originated in their state but were not taxed in the state where the goods or services were delivered. Virginia utilized a throwback rule until 1981, when it was eliminated by the General Assembly; attempts to reinstate the rule failed in 2004.
Mandatory Unitary Combined Reporting. The majority (21) of states that impose a corporate income tax use a mechanism called man-datory unitary combined reporting to address the effects of income shifting between corporations and their affiliates (Appendix C). While this practice appears to be gaining in popularity, Virginia and seven of its competitors have not acted to adopt MUCR, as shown in Table 11. The key difference between MUCR and the type of combined return currently in place in Virginia is that MUCR includes more affiliates. In Virginia, only affiliates that have nexus in the State can be included in a combined return, whereas MUCR requires all affiliates engaged in the same or re-lated business activities to be included in the unitary return, whether or not they have nexus in the State. Still, the Code of Vir-ginia grants TAX the discretionary authority to require corpora-tions to file their tax return on a unitary basis if it deems that the corporation’s business is conducted “in such manner as either di-rectly or indirectly benefit the members or stockholders of the cor-poration.” However, this authority is mostly reactive to tax abuses rather than preventative.
Chapter 3: Virginia and Other States Determine Taxable Income Similarly, but New Trends Are Emerging
42
States that have adopted MUCR reporting require multistate cor-porations to file returns reflecting their share of the combined in-come of all affiliated members engaged in the same or related business activities, including those affiliates that do not have nex-us in the state. With MUCR, income shifting between affiliated members has no effect on the corporation’s total taxable income because the profits earned by one member are offset by the ex-penses incurred by the other. In contrast, states that use separate accounting require multistate corporations to include the profits of only those affiliated members that have nexus in the state.
MUCR has been touted in the research literature as the most com-prehensive and effective means of mitigating aggressive tax plan-ning because it addresses income shifting between affiliates. In contrast, add-back provisions target only PICs and REITs, and the throwback rule affects only income that is entirely untaxed and not income that is shifted to a lower-tax state.
Chapter 4: Virginia and Most States Calculate Tax Liability Similarly, but Apportionment Methods Are Changing
43
After corporations have calculated their taxable income, they must determine how much should be attributed to the states in which they do business. Once the amount attributed to each state is de-termined, the state’s tax rate is applied. Unlike other facets of state corporate income taxation, states are largely free to set the corporate tax rate or rate structure as long as the same rate is ap-plied to corporations that are both in- and out-of-state. As a result, corporate income tax (CIT) rates can and do vary significantly by state.
Because corporations operating in multiple states (multistate) can be subject to tax in several states, uniform guidelines were devel-oped to ensure corporations are required to attribute to each state only the proportion of their income that is linked to activities con-ducted within that state. Most states follow these guidelines and require multistate corporations to attribute income to their state through allocation or apportionment processes. Once the amount of income that is allocated and apportioned to the state is deter-mined, the state’s tax rate is applied. In several states, corpora-tions that have either zero or negative CIT liability may be re-quired to pay a minimum tax instead.
VIRGINIA’S SIX PERCENT CORPORATE INCOME TAX RATE IS ONE OF LOWEST IN COUNTRY
Virginia has a flat and stable CIT rate of six percent. This rate was established in 1972 when Virginia began conforming to the federal
Ch
apte
r
44
VViirrggiinniiaa aanndd MMoosstt SSttaatteess CCaallccuullaattee TTaaxx LLiiaabbiilliittyy SSiimmiillaarrllyy,, bbuutt AAppppoorrttiioonnmmeenntt MMeetthhooddss AArree CChhaannggiinngg
Like other states with a corporate income tax, Virginia requires corporations to cal-culate their tax liability through allocation and apportionment processes. After de-termining the amounts allocated and apportioned to each state, corporations applythe state’s tax rate to that amount. Virginia’s corporate tax rate is low (six percent)compared to that of most states, especially its top competitors. In addition, Virginiaand many other states require corporations to apportion income based on theiramounts of property, payroll, and sales in the State, but a number of states haveadopted policies requiring corporations to apportion their income based only onsales. Virginia recently adopted a single sales apportionment method, but only man-ufacturers will be able to use it. Finally, Virginia, unlike most states, only requirescorporations to allocate only dividends, but this policy may be beneficial because itallows the State to tax the income from most transactions.
II nn SS
uumm
mmaa r
r yy
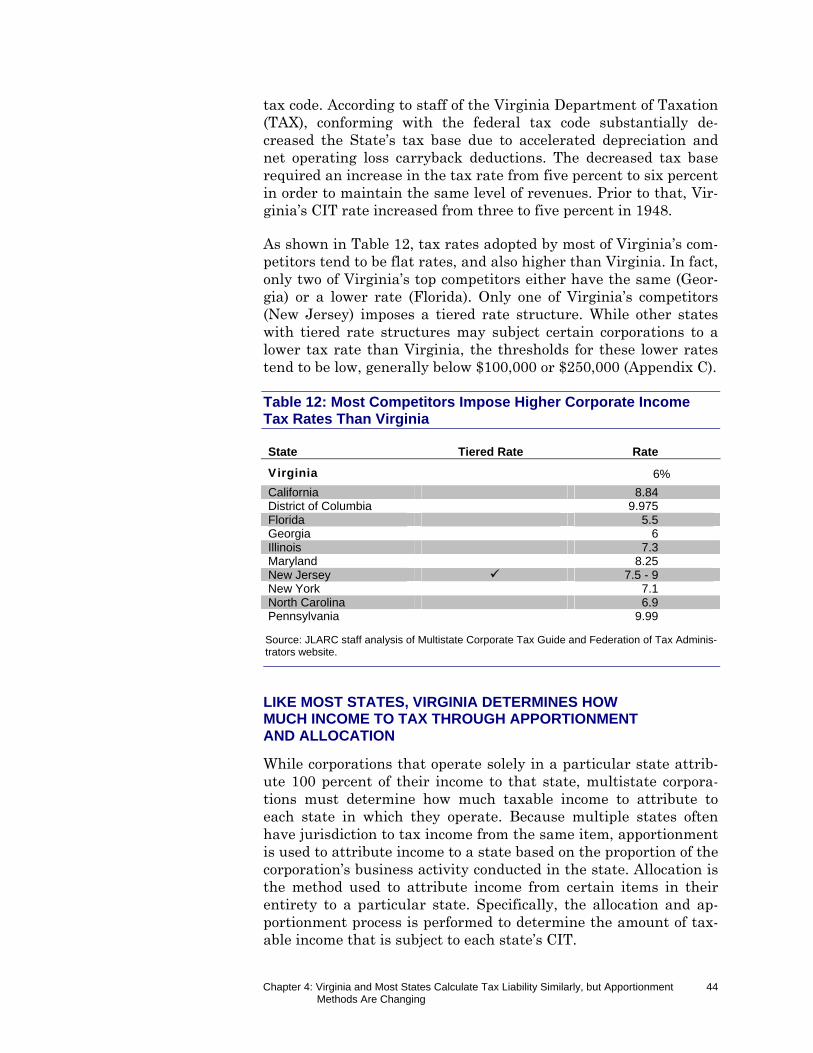
Chapter 4: Virginia and Most States Calculate Tax Liability Similarly, but Apportionment Methods Are Changing
44
tax code. According to staff of the Virginia Department of Taxation (TAX), conforming with the federal tax code substantially de-creased the State’s tax base due to accelerated depreciation and net operating loss carryback deductions. The decreased tax base required an increase in the tax rate from five percent to six percent in order to maintain the same level of revenues. Prior to that, Vir-ginia’s CIT rate increased from three to five percent in 1948.
As shown in Table 12, tax rates adopted by most of Virginia’s com-petitors tend to be flat rates, and also higher than Virginia. In fact, only two of Virginia’s top competitors either have the same (Geor-gia) or a lower rate (Florida). Only one of Virginia’s competitors (New Jersey) imposes a tiered rate structure. While other states with tiered rate structures may subject certain corporations to a lower tax rate than Virginia, the thresholds for these lower rates tend to be low, generally below $100,000 or $250,000 (Appendix C).
Table 12: Most Competitors Impose Higher Corporate Income Tax Rates Than Virginia
State Tiered Rate Rate
Virginia 6%
California 8.84 District of Columbia 9.975 Florida 5.5 Georgia 6 Illinois 7.3 Maryland 8.25 New Jersey 7.5 - 9 New York 7.1 North Carolina 6.9 Pennsylvania 9.99
Source: JLARC staff analysis of Multistate Corporate Tax Guide and Federation of Tax Adminis-trators website.
LIKE MOST STATES, VIRGINIA DETERMINES HOW MUCH INCOME TO TAX THROUGH APPORTIONMENT AND ALLOCATION
While corporations that operate solely in a particular state attrib-ute 100 percent of their income to that state, multistate corpora-tions must determine how much taxable income to attribute to each state in which they operate. Because multiple states often have jurisdiction to tax income from the same item, apportionment is used to attribute income to a state based on the proportion of the corporation’s business activity conducted in the state. Allocation is the method used to attribute income from certain items in their entirety to a particular state. Specifically, the allocation and ap-portionment process is performed to determine the amount of tax-able income that is subject to each state’s CIT.
Chapter 4: Virginia and Most States Calculate Tax Liability Similarly, but Apportionment Methods Are Changing
45
States typically follow similar methods for apportioning and allo-cating income because of model guidelines adopted under the Uni-form Division of Income for Tax Purposes Act (UDITPA). In 1957, a group of state tax professionals promulgated UDITPA to provide states with uniform rules for taxing multistate corporations. Al-though not all states have formally adopted UDITPA, many such as Virginia have adopted statutes and regulations that are similar.
Most Income Is Attributed to Virginia and Other States Based on Apportionment Formulas
Apportionment is the process by which multistate businesses di-vide their non-allocable taxable income among states where they have nexus. In Virginia and many states, multistate corporations are required to use similar formulas that are based on property, payroll, and sales. This standard formula was designed by UDITPA to attribute income to states where products are made (states where the corporation’s property and payroll are located) and where they are sold.
In Virginia, multistate corporations use a three-factor formula based on property, payroll, and sales to calculate how much of their taxable income is subject to taxation in the State. The prop-erty factor is the proportion of the average value of real and tangi-ble personal property which is used in Virginia during the tax year to the average value of real and tangible personal property which is used by the corporation everywhere. The payroll factor is the proportion of the total amount paid or accrued for compensation within Virginia during the taxable year to the total compensation paid or accrued by the corporation everywhere. The sales factor is the proportion of total sales in Virginia during the taxable year to the total sales of the corporation everywhere.
Seven of Virginia’s top competitors (Table 13) and most other states (Appendix C) also use a three-factor apportionment formula based on property, payroll, and sales. While the same factors are used, states may use different standards as to what types of prop-erty, payroll, and sales are included in each factor.
Virginia and Majority of States Beginning to Weight Sales More Heavily
Virginia and many other states typically weight sales more heavily than other factors in their apportionment formula. When the standard three-factor formula was developed, each factor was as-signed equal weight, or 33.3 percent. Most states now require mul-tistate corporations to double-weight their sales, while some are requiring corporations to apportion their income based only on
Property:
Real and tangible per-sonal property such as land, mineral rights, buildings, machinery, inventory, and other real or tangible per-sonal property in which the corporation has right of use or posses-sion regardless of whether it is owned, rented, or leased. Compensation:
Wages, salaries, com-missions, and any oth-er form of payment to employees for ser-vices, except for com-pensation paid to those whose services are connected with foreign source income. Com-pensation is consid-ered paid in Virginia if an employee’s service is performed (1) entire-ly in Virginia, (2) in multiple states but the service performed out-side of Virginia is inci-dental to the service in the State, or (3) in mul-tiple states but their base of operations, performance, or resi-dence is in Virginia. Sales:
All gross receipts of the corporation not allocat-ed, except the sale of intangible property, which is included on the net gain realized from the transaction. Sales are included if the gains they gener-ated are included in Virginia taxable income and are connected to the taxpayer’s trade or business within the United States.
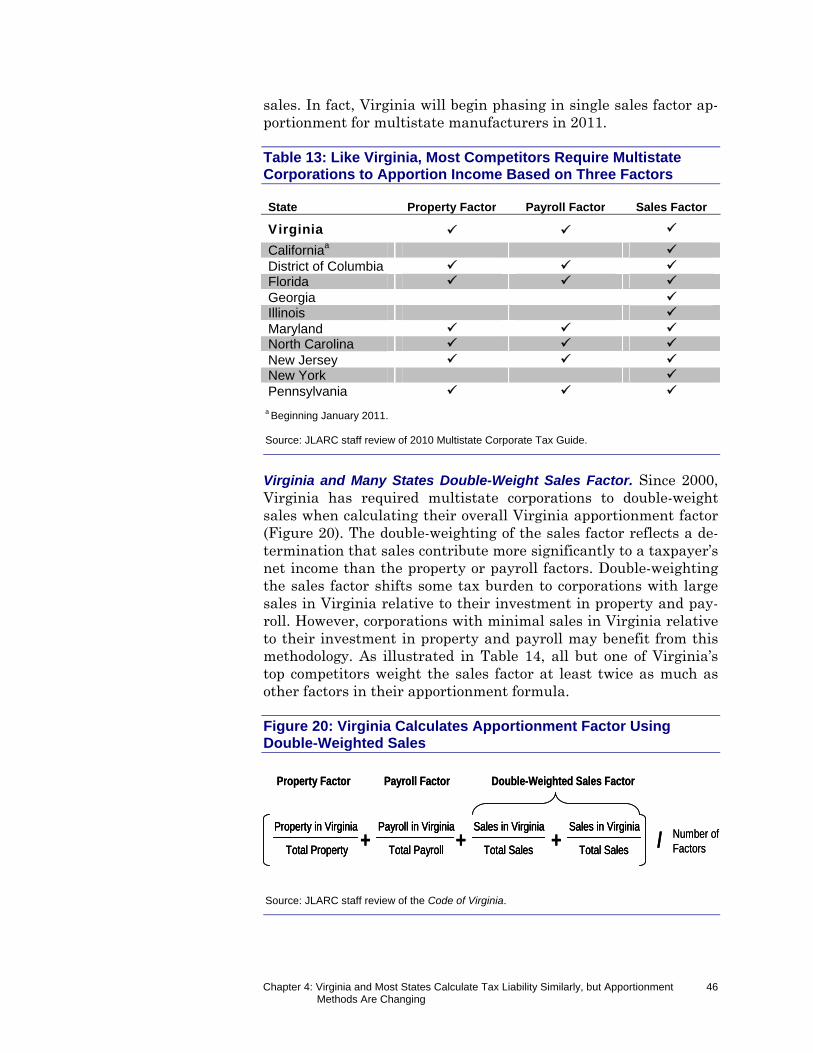
Chapter 4: Virginia and Most States Calculate Tax Liability Similarly, but Apportionment Methods Are Changing
46
sales. In fact, Virginia will begin phasing in single sales factor ap-portionment for multistate manufacturers in 2011.
Table 13: Like Virginia, Most Competitors Require Multistate Corporations to Apportion Income Based on Three Factors
State Property Factor Payroll Factor Sales Factor
Virginia
Californiaa District of Columbia Florida Georgia Illinois Maryland North Carolina New Jersey New York Pennsylvania
a Beginning January 2011. Source: JLARC staff review of 2010 Multistate Corporate Tax Guide.
Virginia and Many States Double-Weight Sales Factor. Since 2000, Virginia has required multistate corporations to double-weight sales when calculating their overall Virginia apportionment factor (Figure 20). The double-weighting of the sales factor reflects a de-termination that sales contribute more significantly to a taxpayer’s net income than the property or payroll factors. Double-weighting the sales factor shifts some tax burden to corporations with large sales in Virginia relative to their investment in property and pay-roll. However, corporations with minimal sales in Virginia relative to their investment in property and payroll may benefit from this methodology. As illustrated in Table 14, all but one of Virginia’s top competitors weight the sales factor at least twice as much as other factors in their apportionment formula.
Figure 20: Virginia Calculates Apportionment Factor Using Double-Weighted Sales
Sales in Virginia
Total Sales
Sales in Virginia
Total Sales
Payroll in Virginia
Total Payroll
Property in Virginia
Total Property + + + / Number of Factors
Double-Weighted Sales FactorPayroll FactorProperty Factor
Sales in Virginia
Total Sales
Sales in Virginia
Total Sales
Sales in Virginia
Total Sales
Sales in Virginia
Total Sales
Payroll in Virginia
Total Payroll
Payroll in Virginia
Total Payroll
Property in Virginia
Total Property
Property in Virginia
Total Property + + + / Number of Factors
Double-Weighted Sales FactorPayroll FactorProperty Factor
Source: JLARC staff review of the Code of Virginia.
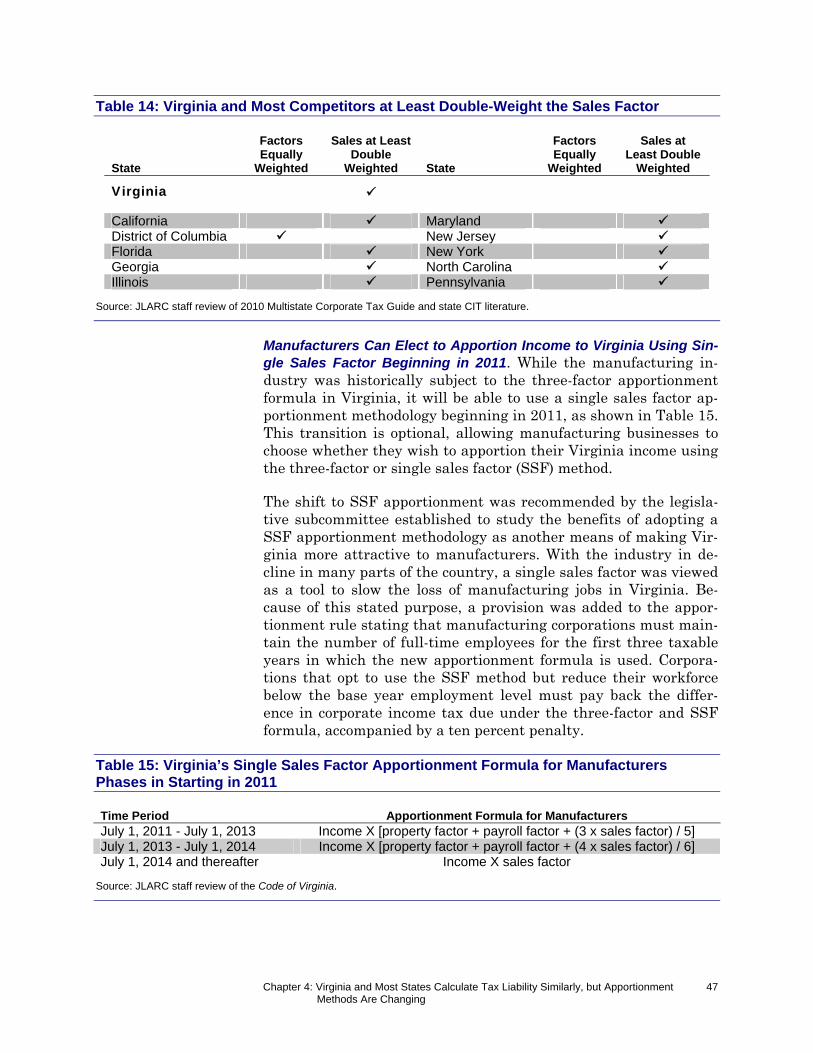
Chapter 4: Virginia and Most States Calculate Tax Liability Similarly, but Apportionment Methods Are Changing
47
Table 14: Virginia and Most Competitors at Least Double-Weight the Sales Factor
State
Factors Equally
Weighted
Sales at Least Double
Weighted State
Factors Equally
Weighted
Sales at Least Double
Weighted
Virginia
California Maryland District of Columbia New Jersey Florida New York Georgia North Carolina Illinois Pennsylvania
Source: JLARC staff review of 2010 Multistate Corporate Tax Guide and state CIT literature.
Manufacturers Can Elect to Apportion Income to Virginia Using Sin-gle Sales Factor Beginning in 2011. While the manufacturing in-dustry was historically subject to the three-factor apportionment formula in Virginia, it will be able to use a single sales factor ap-portionment methodology beginning in 2011, as shown in Table 15. This transition is optional, allowing manufacturing businesses to choose whether they wish to apportion their Virginia income using the three-factor or single sales factor (SSF) method.
The shift to SSF apportionment was recommended by the legisla-tive subcommittee established to study the benefits of adopting a SSF apportionment methodology as another means of making Vir-ginia more attractive to manufacturers. With the industry in de-cline in many parts of the country, a single sales factor was viewed as a tool to slow the loss of manufacturing jobs in Virginia. Be-cause of this stated purpose, a provision was added to the appor-tionment rule stating that manufacturing corporations must main-tain the number of full-time employees for the first three taxable years in which the new apportionment formula is used. Corpora-tions that opt to use the SSF method but reduce their workforce below the base year employment level must pay back the differ-ence in corporate income tax due under the three-factor and SSF formula, accompanied by a ten percent penalty.
Table 15: Virginia’s Single Sales Factor Apportionment Formula for Manufacturers Phases in Starting in 2011 Time Period Apportionment Formula for Manufacturers July 1, 2011 - July 1, 2013 Income X [property factor + payroll factor + (3 x sales factor) / 5] July 1, 2013 - July 1, 2014 Income X [property factor + payroll factor + (4 x sales factor) / 6] July 1, 2014 and thereafter Income X sales factor
Source: JLARC staff review of the Code of Virginia.
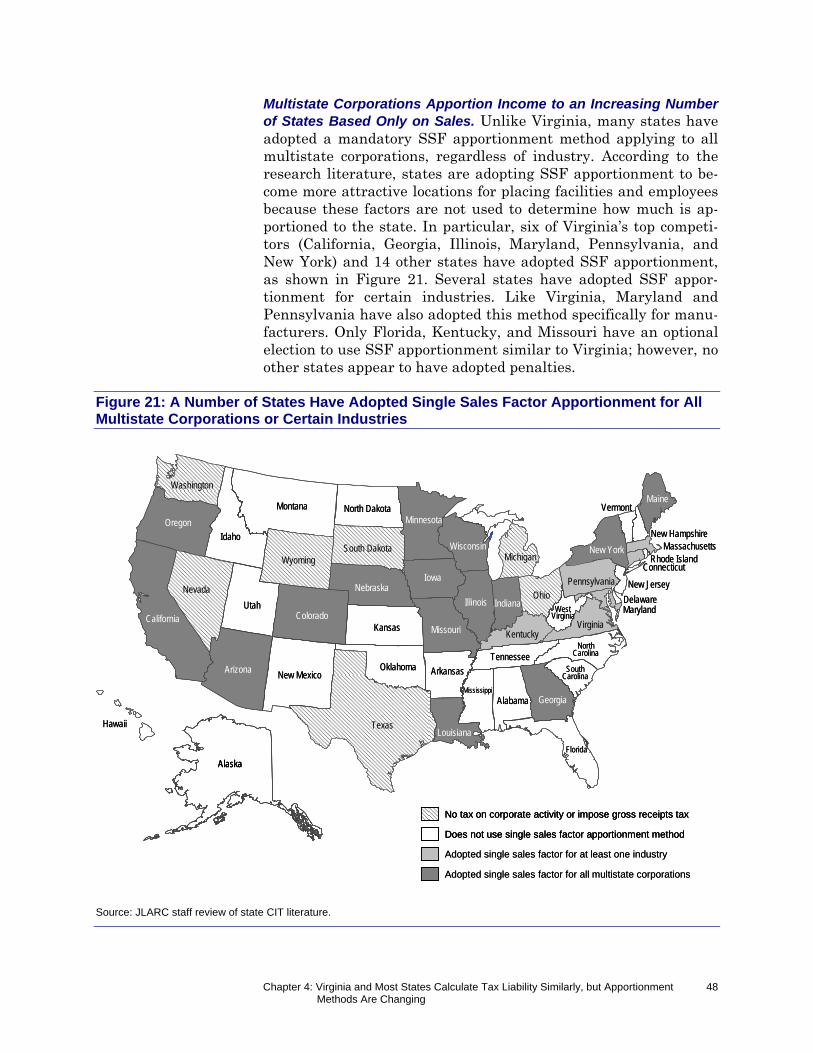
Chapter 4: Virginia and Most States Calculate Tax Liability Similarly, but Apportionment Methods Are Changing
48
Multistate Corporations Apportion Income to an Increasing Number of States Based Only on Sales. Unlike Virginia, many states have adopted a mandatory SSF apportionment method applying to all multistate corporations, regardless of industry. According to the research literature, states are adopting SSF apportionment to be-come more attractive locations for placing facilities and employees because these factors are not used to determine how much is ap-portioned to the state. In particular, six of Virginia’s top competi-tors (California, Georgia, Illinois, Maryland, Pennsylvania, and New York) and 14 other states have adopted SSF apportionment, as shown in Figure 21. Several states have adopted SSF appor-tionment for certain industries. Like Virginia, Maryland and Pennsylvania have also adopted this method specifically for manu-facturers. Only Florida, Kentucky, and Missouri have an optional election to use SSF apportionment similar to Virginia; however, no other states appear to have adopted penalties.
Figure 21: A Number of States Have Adopted Single Sales Factor Apportionment for All Multistate Corporations or Certain Industries
Source: JLARC staff review of state CIT literature.
Alaska
Texas
Utah
Montana
California
Arizona
Idaho
Nevada
Oregon
Iowa
ColoradoKansas
Wyoming
New Mexico
Missouri
Minnesota
Nebraska
Oklahoma
South Dakota
Washington
Arkansas
North Dakota
LouisianaHawaii
IllinoisOhio
Florida
GeorgiaAlabama
Wisconsin
Virginia
Indiana
Michigan
Mississippi
Kentucky
Tennessee
Pennsylvania
NorthCarolina
SouthCarolina
WestVirginia
New Jersey
Maine
New York
Vermont
Maryland
New Hampshire
Connecticut
Delaware
MassachusettsRhode Island
Does not use single sales factor apportionment method
Adopted single sales factor for at least one industry
Adopted single sales factor for all multistate corporations
No tax on corporate activity or impose gross receipts tax
AlaskaAlaska
Texas
Utah
Montana
California
Arizona
Idaho
Nevada
Oregon
Iowa
ColoradoKansas
Wyoming
New Mexico
Missouri
Minnesota
Nebraska
Oklahoma
South Dakota
Washington
Arkansas
North Dakota
LouisianaHawaii
IllinoisOhio
Florida
GeorgiaAlabama
Wisconsin
Virginia
Indiana
Michigan
Mississippi
Kentucky
Tennessee
Pennsylvania
NorthCarolina
SouthCarolina
WestVirginia
New Jersey
Maine
New York
Vermont
Maryland
New Hampshire
Connecticut
Delaware
MassachusettsRhode Island
Does not use single sales factor apportionment methodDoes not use single sales factor apportionment method
Adopted single sales factor for at least one industry
Adopted single sales factor for all multistate corporations
No tax on corporate activity or impose gross receipts taxNo tax on corporate activity or impose gross receipts tax
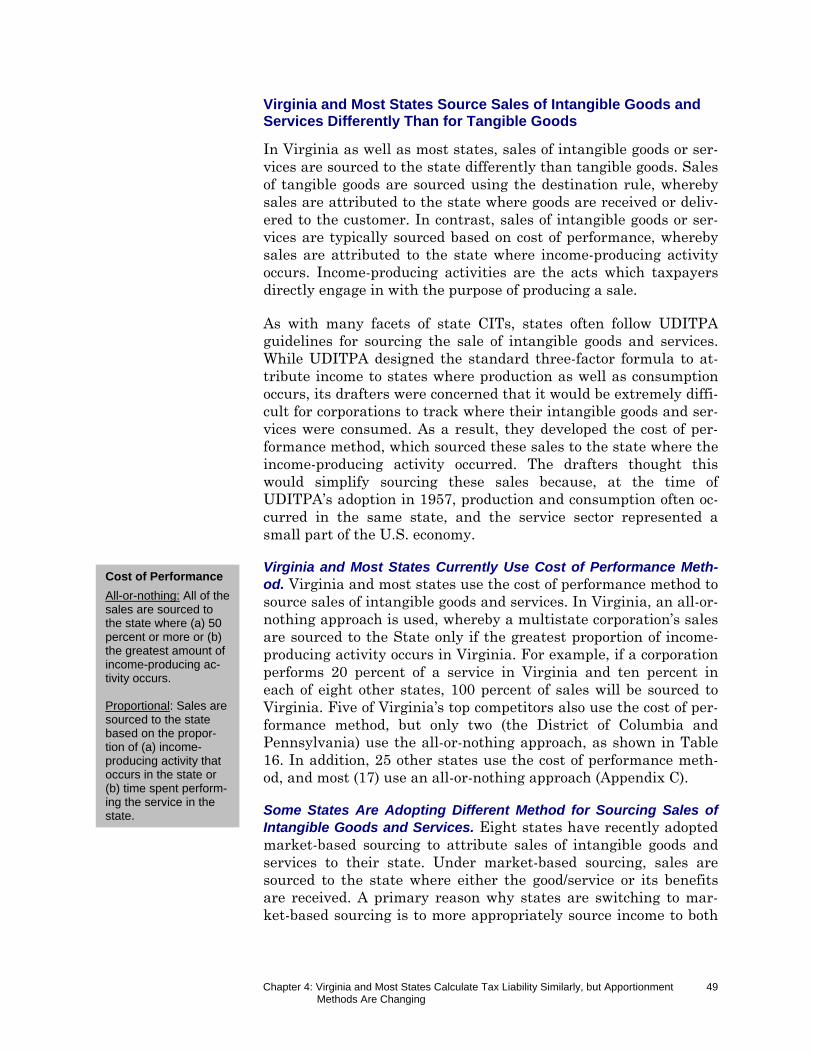
Chapter 4: Virginia and Most States Calculate Tax Liability Similarly, but Apportionment Methods Are Changing
49
Virginia and Most States Source Sales of Intangible Goods and Services Differently Than for Tangible Goods
In Virginia as well as most states, sales of intangible goods or ser-vices are sourced to the state differently than tangible goods. Sales of tangible goods are sourced using the destination rule, whereby sales are attributed to the state where goods are received or deliv-ered to the customer. In contrast, sales of intangible goods or ser-vices are typically sourced based on cost of performance, whereby sales are attributed to the state where income-producing activity occurs. Income-producing activities are the acts which taxpayers directly engage in with the purpose of producing a sale.
As with many facets of state CITs, states often follow UDITPA guidelines for sourcing the sale of intangible goods and services. While UDITPA designed the standard three-factor formula to at-tribute income to states where production as well as consumption occurs, its drafters were concerned that it would be extremely diffi-cult for corporations to track where their intangible goods and ser-vices were consumed. As a result, they developed the cost of per-formance method, which sourced these sales to the state where the income-producing activity occurred. The drafters thought this would simplify sourcing these sales because, at the time of UDITPA’s adoption in 1957, production and consumption often oc-curred in the same state, and the service sector represented a small part of the U.S. economy.
Virginia and Most States Currently Use Cost of Performance Meth-od. Virginia and most states use the cost of performance method to source sales of intangible goods and services. In Virginia, an all-or-nothing approach is used, whereby a multistate corporation’s sales are sourced to the State only if the greatest proportion of income-producing activity occurs in Virginia. For example, if a corporation performs 20 percent of a service in Virginia and ten percent in each of eight other states, 100 percent of sales will be sourced to Virginia. Five of Virginia’s top competitors also use the cost of per-formance method, but only two (the District of Columbia and Pennsylvania) use the all-or-nothing approach, as shown in Table 16. In addition, 25 other states use the cost of performance meth-od, and most (17) use an all-or-nothing approach (Appendix C).
Some States Are Adopting Different Method for Sourcing Sales of Intangible Goods and Services. Eight states have recently adopted market-based sourcing to attribute sales of intangible goods and services to their state. Under market-based sourcing, sales are sourced to the state where either the good/service or its benefits are received. A primary reason why states are switching to mar-ket-based sourcing is to more appropriately source income to both
Cost of Performance
All-or-nothing: All of the sales are sourced to the state where (a) 50 percent or more or (b) the greatest amount of income-producing ac-tivity occurs. Proportional: Sales are sourced to the state based on the propor-tion of (a) income-producing activity that occurs in the state or (b) time spent perform-ing the service in the state.

Chapter 4: Virginia and Most States Calculate Tax Liability Similarly, but Apportionment Methods Are Changing
50
Table 16: Virginia and Several Competitors Use Cost-of-Performance Sourcing, but Four Have Adopted Market-Based
Cost-of-Performance State All-or-Nothing Proportional Market-Based Other Method
Virginia
California District of Columbia Florida Georgia Illinois Maryland New Jersey New York North Carolina Pennsylvania
Source: JLARC staff review of 2010 Multistate Corporate Tax Guide.
production and consumption states, rather than source only to the production state. While two states have used this method for some time (Georgia and Minnesota), three of Virginia’s top competitors (California, Illinois, and Maryland) and five other states (see Ap-pendix C) have adopted market-based sourcing since 2004.
Although the literature consistently indicates that market-based sourcing is more appropriate than cost of performance sourcing, it may be difficult to determine where the benefit or consumption of intangible goods or services occurs. To reduce the uncertainty of market-based sourcing, some states have developed alternative criteria when the location of consumption cannot be determined (Table 17). For example, alternative criteria used in Illinois in-clude sourcing sales to the location of the customer’s office where the business activity occurred, or to the office where services are billed.
Virginia and Most States Use Special Formulas for Certain Industries
While most corporations in Virginia use the standard three-factor formula, certain industries use a special one-factor formula to ap-portion income to the State. Because the standard three-factor formula was primarily developed for manufacturers, Virginia and other states have adopted special formulas to more appropriately apportion income for certain industries. In particular, Virginia has adopted special industry formulas for motor carriers, financial cor-porations, construction corporations, and railway companies (Table 18). Any corporation may request permission from the Department of Taxation (TAX) to use an alternate method. However, these re-quests are rarely granted, according to TAX staff.
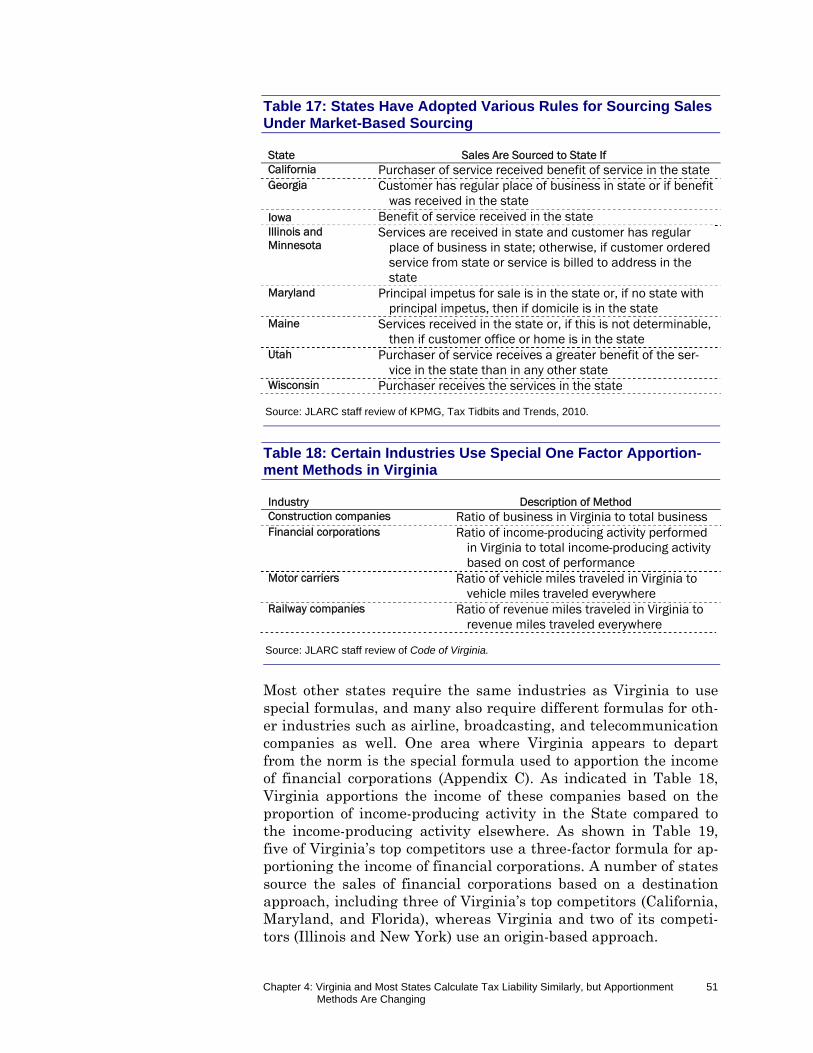
Chapter 4: Virginia and Most States Calculate Tax Liability Similarly, but Apportionment Methods Are Changing
51
Table 17: States Have Adopted Various Rules for Sourcing Sales Under Market-Based Sourcing
State Sales Are Sourced to State If California Purchaser of service received benefit of service in the state Georgia Customer has regular place of business in state or if benefit
was received in the state Iowa Benefit of service received in the state Illinois and Minnesota
Services are received in state and customer has regular place of business in state; otherwise, if customer ordered service from state or service is billed to address in the state
Maryland Principal impetus for sale is in the state or, if no state with principal impetus, then if domicile is in the state
Maine Services received in the state or, if this is not determinable, then if customer office or home is in the state
Utah Purchaser of service receives a greater benefit of the ser-vice in the state than in any other state
Wisconsin Purchaser receives the services in the state
Source: JLARC staff review of KPMG, Tax Tidbits and Trends, 2010.
Table 18: Certain Industries Use Special One Factor Apportion-ment Methods in Virginia
Industry Description of Method Construction companies Ratio of business in Virginia to total business Financial corporations Ratio of income-producing activity performed
in Virginia to total income-producing activity based on cost of performance
Motor carriers Ratio of vehicle miles traveled in Virginia to vehicle miles traveled everywhere
Railway companies Ratio of revenue miles traveled in Virginia to revenue miles traveled everywhere
Source: JLARC staff review of Code of Virginia.
Most other states require the same industries as Virginia to use special formulas, and many also require different formulas for oth-er industries such as airline, broadcasting, and telecommunication companies as well. One area where Virginia appears to depart from the norm is the special formula used to apportion the income of financial corporations (Appendix C). As indicated in Table 18, Virginia apportions the income of these companies based on the proportion of income-producing activity in the State compared to the income-producing activity elsewhere. As shown in Table 19, five of Virginia’s top competitors use a three-factor formula for ap-portioning the income of financial corporations. A number of states source the sales of financial corporations based on a destination approach, including three of Virginia’s top competitors (California, Maryland, and Florida), whereas Virginia and two of its competi-tors (Illinois and New York) use an origin-based approach.
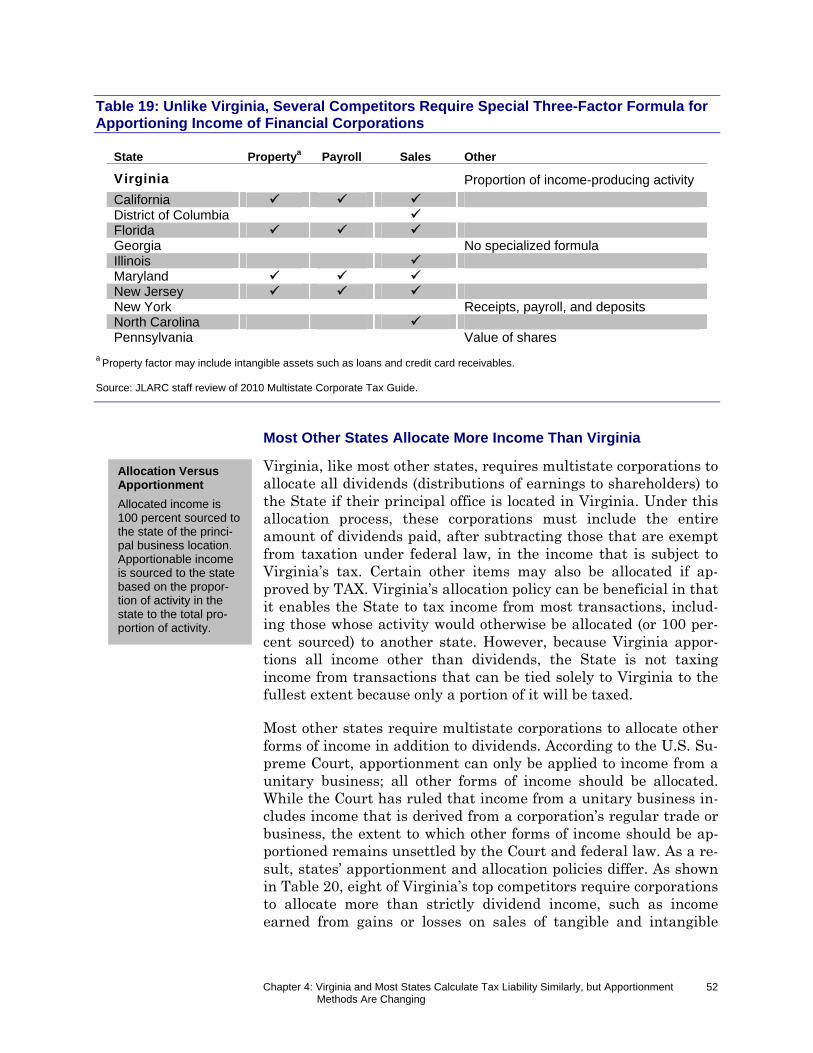
Chapter 4: Virginia and Most States Calculate Tax Liability Similarly, but Apportionment Methods Are Changing
52
Table 19: Unlike Virginia, Several Competitors Require Special Three-Factor Formula for Apportioning Income of Financial Corporations
State Propertya Payroll Sales Other
Virginia Proportion of income-producing activity
California District of Columbia Florida Georgia No specialized formula Illinois Maryland New Jersey New York Receipts, payroll, and deposits North Carolina Pennsylvania Value of shares
a Property factor may include intangible assets such as loans and credit card receivables. Source: JLARC staff review of 2010 Multistate Corporate Tax Guide.
Most Other States Allocate More Income Than Virginia
Virginia, like most other states, requires multistate corporations to allocate all dividends (distributions of earnings to shareholders) to the State if their principal office is located in Virginia. Under this allocation process, these corporations must include the entire amount of dividends paid, after subtracting those that are exempt from taxation under federal law, in the income that is subject to Virginia’s tax. Certain other items may also be allocated if ap-proved by TAX. Virginia’s allocation policy can be beneficial in that it enables the State to tax income from most transactions, includ-ing those whose activity would otherwise be allocated (or 100 per-cent sourced) to another state. However, because Virginia appor-tions all income other than dividends, the State is not taxing income from transactions that can be tied solely to Virginia to the fullest extent because only a portion of it will be taxed.
Most other states require multistate corporations to allocate other forms of income in addition to dividends. According to the U.S. Su-preme Court, apportionment can only be applied to income from a unitary business; all other forms of income should be allocated. While the Court has ruled that income from a unitary business in-cludes income that is derived from a corporation’s regular trade or business, the extent to which other forms of income should be ap-portioned remains unsettled by the Court and federal law. As a re-sult, states’ apportionment and allocation policies differ. As shown in Table 20, eight of Virginia’s top competitors require corporations to allocate more than strictly dividend income, such as income earned from gains or losses on sales of tangible and intangible
Allocation Versus Apportionment
Allocated income is 100 percent sourced to the state of the princi-pal business location. Apportionable income is sourced to the state based on the propor-tion of activity in the state to the total pro-portion of activity.
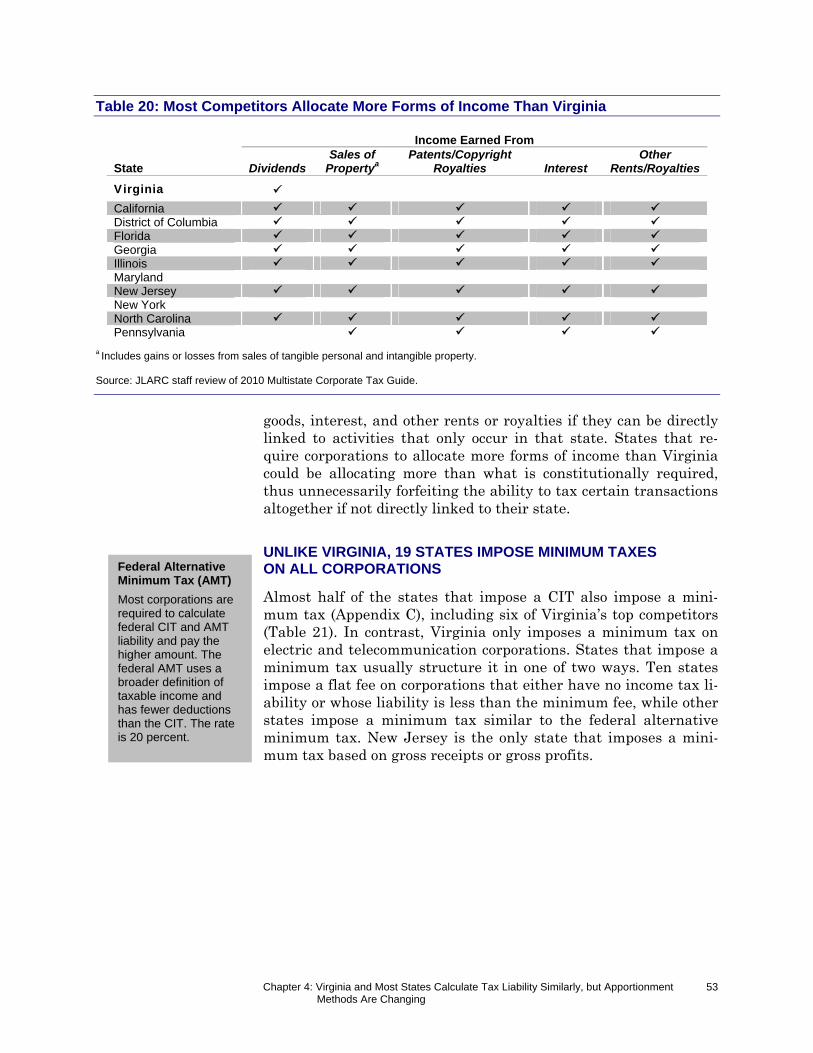
Chapter 4: Virginia and Most States Calculate Tax Liability Similarly, but Apportionment Methods Are Changing
53
Table 20: Most Competitors Allocate More Forms of Income Than Virginia
State
Income Earned From
Dividends Sales of
Propertya Patents/Copyright
Royalties Interest Other
Rents/Royalties
Virginia
California District of Columbia Florida Georgia Illinois Maryland New Jersey New York North Carolina Pennsylvania
a Includes gains or losses from sales of tangible personal and intangible property. Source: JLARC staff review of 2010 Multistate Corporate Tax Guide.
goods, interest, and other rents or royalties if they can be directly linked to activities that only occur in that state. States that re-quire corporations to allocate more forms of income than Virginia could be allocating more than what is constitutionally required, thus unnecessarily forfeiting the ability to tax certain transactions altogether if not directly linked to their state.
UNLIKE VIRGINIA, 19 STATES IMPOSE MINIMUM TAXES ON ALL CORPORATIONS
Almost half of the states that impose a CIT also impose a mini-mum tax (Appendix C), including six of Virginia’s top competitors (Table 21). In contrast, Virginia only imposes a minimum tax on electric and telecommunication corporations. States that impose a minimum tax usually structure it in one of two ways. Ten states impose a flat fee on corporations that either have no income tax li-ability or whose liability is less than the minimum fee, while other states impose a minimum tax similar to the federal alternative minimum tax. New Jersey is the only state that imposes a mini-mum tax based on gross receipts or gross profits.
Federal Alternative Minimum Tax (AMT)
Most corporations are required to calculate federal CIT and AMT liability and pay the higher amount. The federal AMT uses a broader definition of taxable income and has fewer deductions than the CIT. The rate is 20 percent.
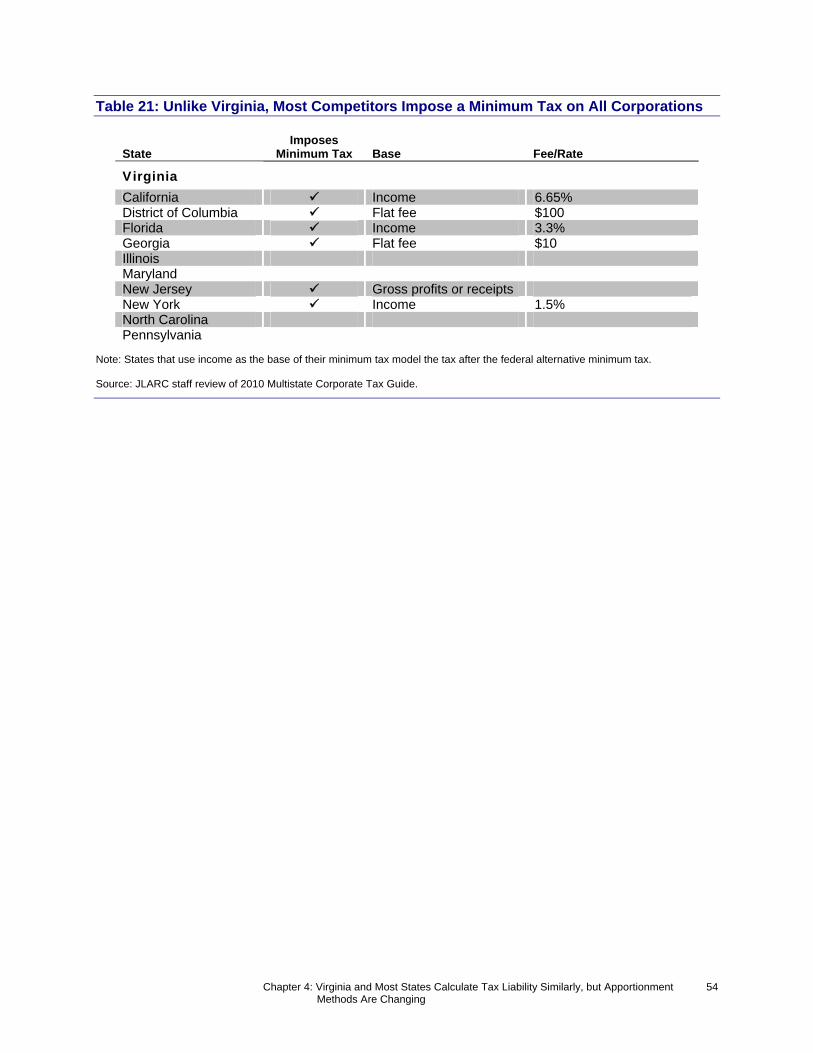
Chapter 4: Virginia and Most States Calculate Tax Liability Similarly, but Apportionment Methods Are Changing
54
Table 21: Unlike Virginia, Most Competitors Impose a Minimum Tax on All Corporations
State Imposes
Minimum Tax Base Fee/Rate
Virginia
California Income 6.65% District of Columbia Flat fee $100 Florida Income 3.3% Georgia Flat fee $10 Illinois Maryland New Jersey Gross profits or receipts New York Income 1.5% North Carolina Pennsylvania
Note: States that use income as the base of their minimum tax model the tax after the federal alternative minimum tax. Source: JLARC staff review of 2010 Multistate Corporate Tax Guide.
Chapter 5: Virginia and Most States Offer Corporate Tax Credits, but Virginia’s Are More Limited
55
Virginia and other states offer tax credits that mitigate corporate tax liability with the intent of encouraging certain behaviors through financial incentives. Rather than mandating certain activ-ities, credits serve to encourage activities that are viewed as social-ly and economically advantageous but inappropriate to be made compulsory. Virginia has credits for job creation and certain types of capital investments, as well as credits designed to promote envi-ronmental and social goals. In addition to encouraging desirable outcomes, tax credits can also be used as a tool to compete against other states for new corporate investments.
VIRGINIA OFFERS NUMEROUS TAX CREDITS DESIGNED TO ENCOURAGE CERTAIN BEHAVIORS
Virginia currently offers more than 20 corporate tax credits to businesses that have implemented a desired behavior, such as hir-ing additional employees or making capital investments. In 2006, corporations claimed tax credits totaling $58.6 million, of which $48.0 million was awarded to corporations that created new jobs (Table 22). An additional $6.5 million in credits was distributed for various types of capital investments made by corporations and $4.2 million was claimed for other activities. The Coalfield Employment Enhancement Credit represented more than half (53 percent) of all credits claimed in 2006, while the six largest credits represented 97 percent. Of the 22 tax credits available in 2006, six were grant-ed to fewer than four businesses and six were not claimed at all.
Ch
apte
r
55
VViirrggiinniiaa aanndd MMoosstt SSttaatteess OOffffeerr CCoorrppoorraattee IInnccoommee TTaaxx CCrreeddiittss,, bbuutt VViirrggiinniiaa’’ss AArree MMoorree LLiimmiitteedd
While Virginia offers more than 20 tax credits to corporations, they tend to be nar-rowly targeted and less generous than those provided by competitor states. Statescommonly use corporate tax credits to incentivize desirable behaviors such as jobcreation, capital investment, and other activities ranging from providing low-incomehousing to preserving land. Most Virginia credits can be used over the course of sev-eral years but can seldom be refunded or transferred, and nearly half of the creditsinclude provisions allowing them to expire. Virginia’s broad-based jobs creation taxcredit tends to be less valuable than similar programs offered in most other states.Moreover, Virginia is one of only four states that do not offer a broad-based capitalinvestment or research and development tax credit. Still, most states tend to struc-ture their credits similarly to Virginia by allowing them to carry over without beingrefundable or transferable. However, Virginia appears to be the only state that doesnot administer its enterprise zone program through the tax code.
II nn SS
uumm
mmaa r
r yy
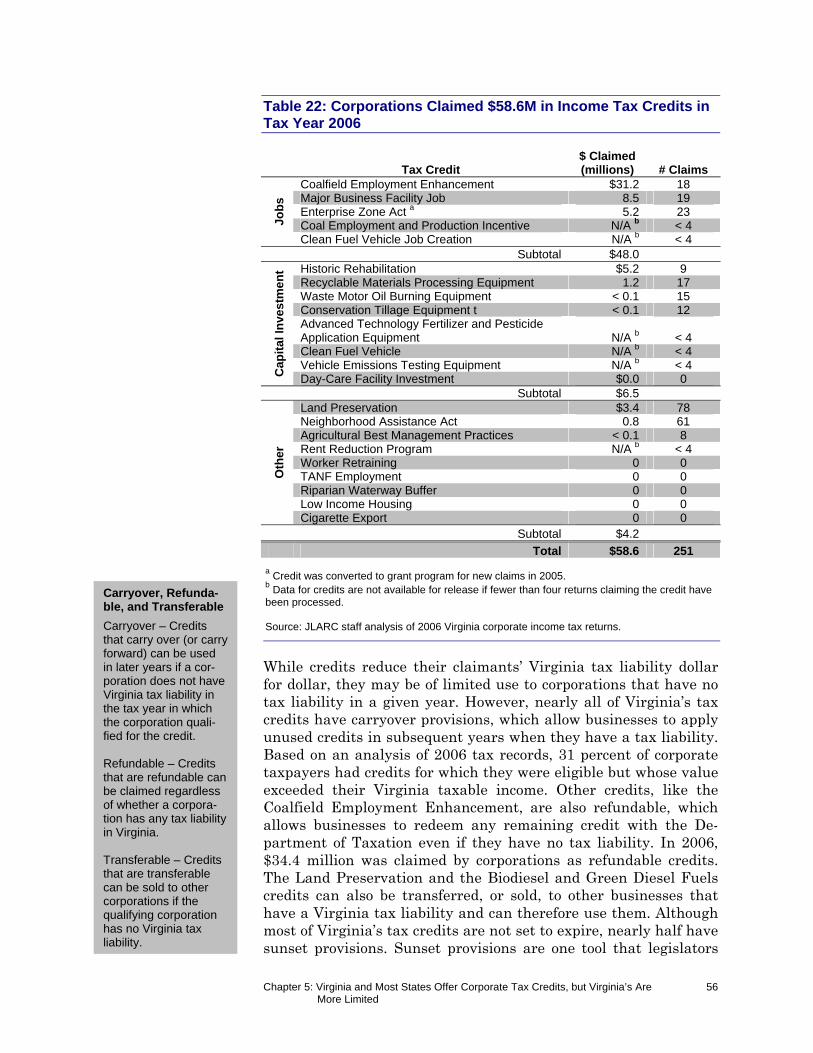
Chapter 5: Virginia and Most States Offer Corporate Tax Credits, but Virginia’s Are More Limited
56
Table 22: Corporations Claimed $58.6M in Income Tax Credits in Tax Year 2006
Tax Credit $ Claimed (millions) # Claims
Job
s
Coalfield Employment Enhancement $31.2 18 Major Business Facility Job 8.5 19 Enterprise Zone Act a 5.2 23 Coal Employment and Production Incentive N/A b < 4 Clean Fuel Vehicle Job Creation N/A b < 4
Subtotal $48.0
Cap
ital
Inve
stm
ent Historic Rehabilitation $5.2 9
Recyclable Materials Processing Equipment 1.2 17 Waste Motor Oil Burning Equipment < 0.1 15 Conservation Tillage Equipment t < 0.1 12 Advanced Technology Fertilizer and Pesticide Application Equipment N/A b < 4 Clean Fuel Vehicle N/A b < 4 Vehicle Emissions Testing Equipment N/A b < 4 Day-Care Facility Investment $0.0 0
Subtotal $6.5
Oth
er
Land Preservation $3.4 78 Neighborhood Assistance Act 0.8 61 Agricultural Best Management Practices < 0.1 8 Rent Reduction Program N/A b < 4 Worker Retraining 0 0 TANF Employment 0 0 Riparian Waterway Buffer 0 0 Low Income Housing 0 0 Cigarette Export 0 0
Subtotal $4.2
Total $58.6 251
a Credit was converted to grant program for new claims in 2005.
b Data for credits are not available for release if fewer than four returns claiming the credit have
been processed. Source: JLARC staff analysis of 2006 Virginia corporate income tax returns.
While credits reduce their claimants’ Virginia tax liability dollar for dollar, they may be of limited use to corporations that have no tax liability in a given year. However, nearly all of Virginia’s tax credits have carryover provisions, which allow businesses to apply unused credits in subsequent years when they have a tax liability. Based on an analysis of 2006 tax records, 31 percent of corporate taxpayers had credits for which they were eligible but whose value exceeded their Virginia taxable income. Other credits, like the Coalfield Employment Enhancement, are also refundable, which allows businesses to redeem any remaining credit with the De-partment of Taxation even if they have no tax liability. In 2006, $34.4 million was claimed by corporations as refundable credits. The Land Preservation and the Biodiesel and Green Diesel Fuels credits can also be transferred, or sold, to other businesses that have a Virginia tax liability and can therefore use them. Although most of Virginia’s tax credits are not set to expire, nearly half have sunset provisions. Sunset provisions are one tool that legislators
Carryover, Refunda-ble, and Transferable
Carryover – Credits that carry over (or carry forward) can be used in later years if a cor-poration does not have Virginia tax liability in the tax year in which the corporation quali-fied for the credit. Refundable – Credits that are refundable can be claimed regardless of whether a corpora-tion has any tax liability in Virginia. Transferable – Credits that are transferable can be sold to other corporations if the qualifying corporation has no Virginia tax liability.
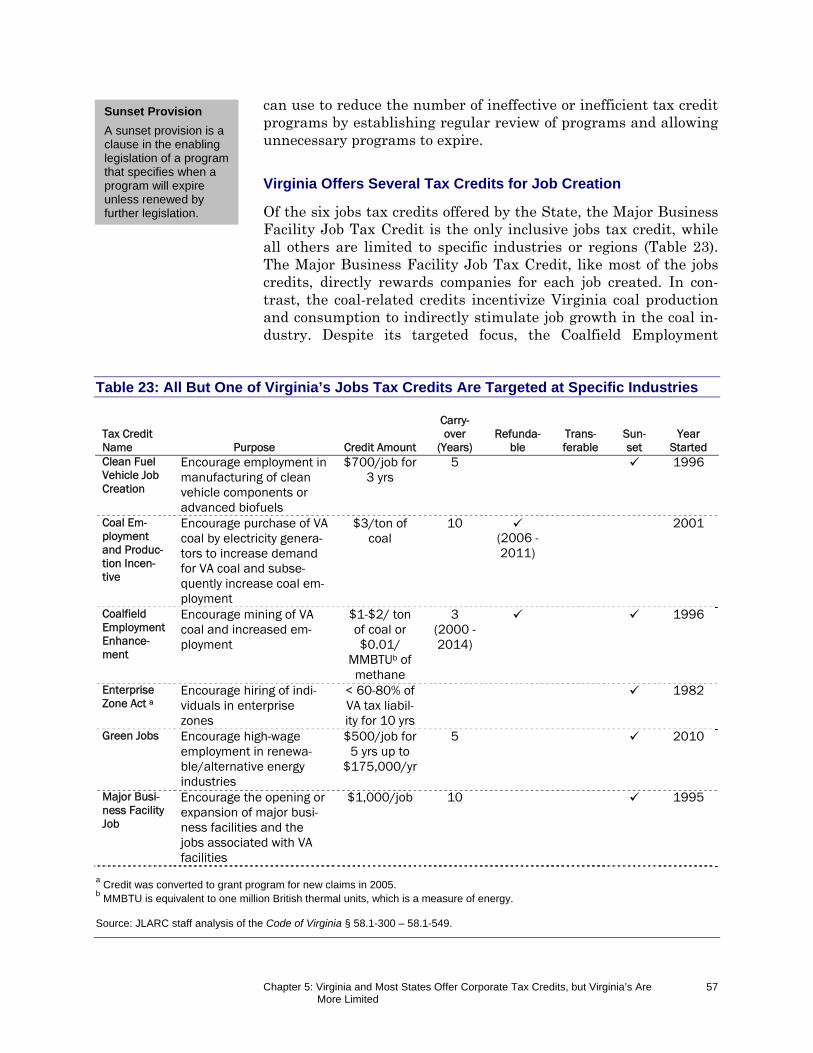
Chapter 5: Virginia and Most States Offer Corporate Tax Credits, but Virginia’s Are More Limited
57
can use to reduce the number of ineffective or inefficient tax credit programs by establishing regular review of programs and allowing unnecessary programs to expire.
Virginia Offers Several Tax Credits for Job Creation
Of the six jobs tax credits offered by the State, the Major Business Facility Job Tax Credit is the only inclusive jobs tax credit, while all others are limited to specific industries or regions (Table 23). The Major Business Facility Job Tax Credit, like most of the jobs credits, directly rewards companies for each job created. In con-trast, the coal-related credits incentivize Virginia coal production and consumption to indirectly stimulate job growth in the coal in-dustry. Despite its targeted focus, the Coalfield Employment
Table 23: All But One of Virginia’s Jobs Tax Credits Are Targeted at Specific Industries
Tax Credit Name Purpose Credit Amount
Carry-over
(Years) Refunda-
ble Trans-ferable
Sun-set
Year Started
Clean Fuel Vehicle Job Creation
Encourage employment in manufacturing of clean vehicle components or advanced biofuels
$700/job for 3 yrs
5 1996
Coal Em-ployment and Produc-tion Incen-tive
Encourage purchase of VA coal by electricity genera-tors to increase demand for VA coal and subse-quently increase coal em-ployment
$3/ton of coal
10 (2006 -2011)
2001
Coalfield Employment Enhance-ment
Encourage mining of VA coal and increased em-ployment
$1-$2/ ton of coal or $0.01/
MMBTUb of methane
3 (2000 - 2014)
1996
Enterprise Zone Act a
Encourage hiring of indi-viduals in enterprise zones
< 60-80% of VA tax liabil-ity for 10 yrs
1982
Green Jobs Encourage high-wage employment in renewa-ble/alternative energy industries
$500/job for 5 yrs up to
$175,000/yr
5 2010
Major Busi-ness Facility Job
Encourage the opening or expansion of major busi-ness facilities and the jobs associated with VA facilities
$1,000/job 10 1995
a Credit was converted to grant program for new claims in 2005.
b MMBTU is equivalent to one million British thermal units, which is a measure of energy.
Source: JLARC staff analysis of the Code of Virginia § 58.1-300 – 58.1-549.
Sunset Provision
A sunset provision is a clause in the enabling legislation of a program that specifies when a program will expire unless renewed by further legislation.
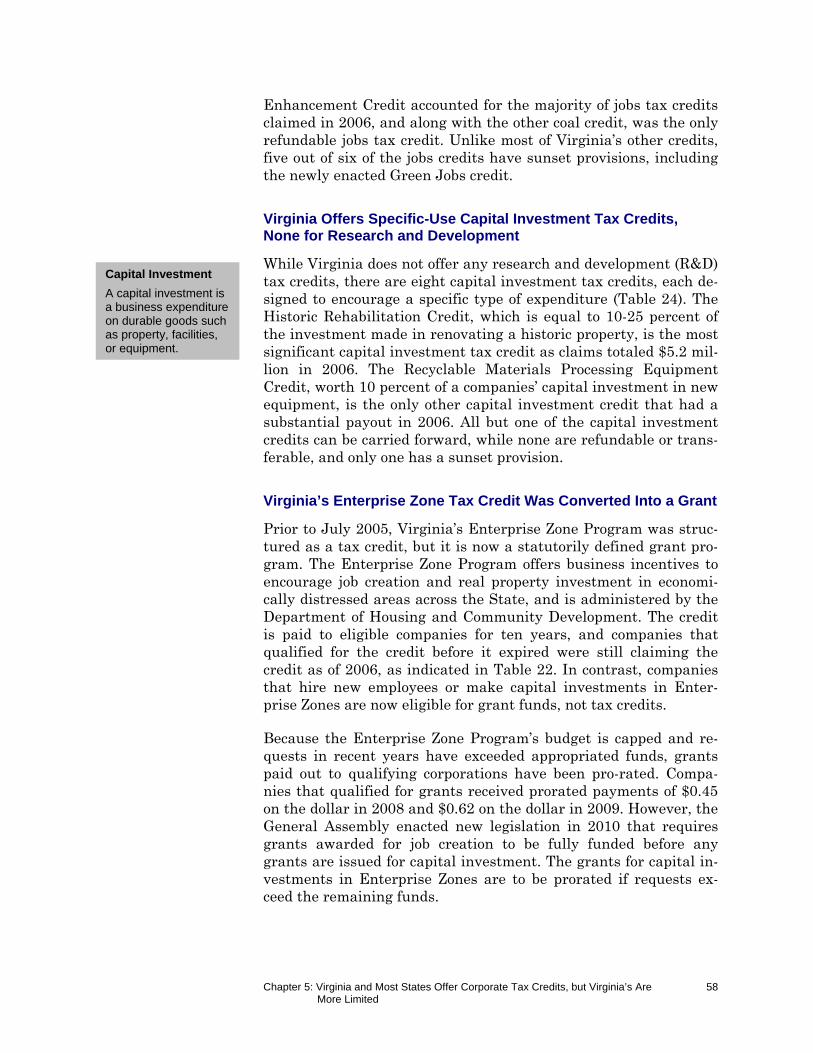
Chapter 5: Virginia and Most States Offer Corporate Tax Credits, but Virginia’s Are More Limited
58
Enhancement Credit accounted for the majority of jobs tax credits claimed in 2006, and along with the other coal credit, was the only refundable jobs tax credit. Unlike most of Virginia’s other credits, five out of six of the jobs credits have sunset provisions, including the newly enacted Green Jobs credit.
Virginia Offers Specific-Use Capital Investment Tax Credits, None for Research and Development
While Virginia does not offer any research and development (R&D) tax credits, there are eight capital investment tax credits, each de-signed to encourage a specific type of expenditure (Table 24). The Historic Rehabilitation Credit, which is equal to 10-25 percent of the investment made in renovating a historic property, is the most significant capital investment tax credit as claims totaled $5.2 mil-lion in 2006. The Recyclable Materials Processing Equipment Credit, worth 10 percent of a companies’ capital investment in new equipment, is the only other capital investment credit that had a substantial payout in 2006. All but one of the capital investment credits can be carried forward, while none are refundable or trans-ferable, and only one has a sunset provision.
Virginia’s Enterprise Zone Tax Credit Was Converted Into a Grant
Prior to July 2005, Virginia’s Enterprise Zone Program was struc-tured as a tax credit, but it is now a statutorily defined grant pro-gram. The Enterprise Zone Program offers business incentives to encourage job creation and real property investment in economi-cally distressed areas across the State, and is administered by the Department of Housing and Community Development. The credit is paid to eligible companies for ten years, and companies that qualified for the credit before it expired were still claiming the credit as of 2006, as indicated in Table 22. In contrast, companies that hire new employees or make capital investments in Enter-prise Zones are now eligible for grant funds, not tax credits.
Because the Enterprise Zone Program’s budget is capped and re-quests in recent years have exceeded appropriated funds, grants paid out to qualifying corporations have been pro-rated. Compa-nies that qualified for grants received prorated payments of $0.45 on the dollar in 2008 and $0.62 on the dollar in 2009. However, the General Assembly enacted new legislation in 2010 that requires grants awarded for job creation to be fully funded before any grants are issued for capital investment. The grants for capital in-vestments in Enterprise Zones are to be prorated if requests ex-ceed the remaining funds.
Capital Investment
A capital investment is a business expenditure on durable goods such as property, facilities, or equipment.
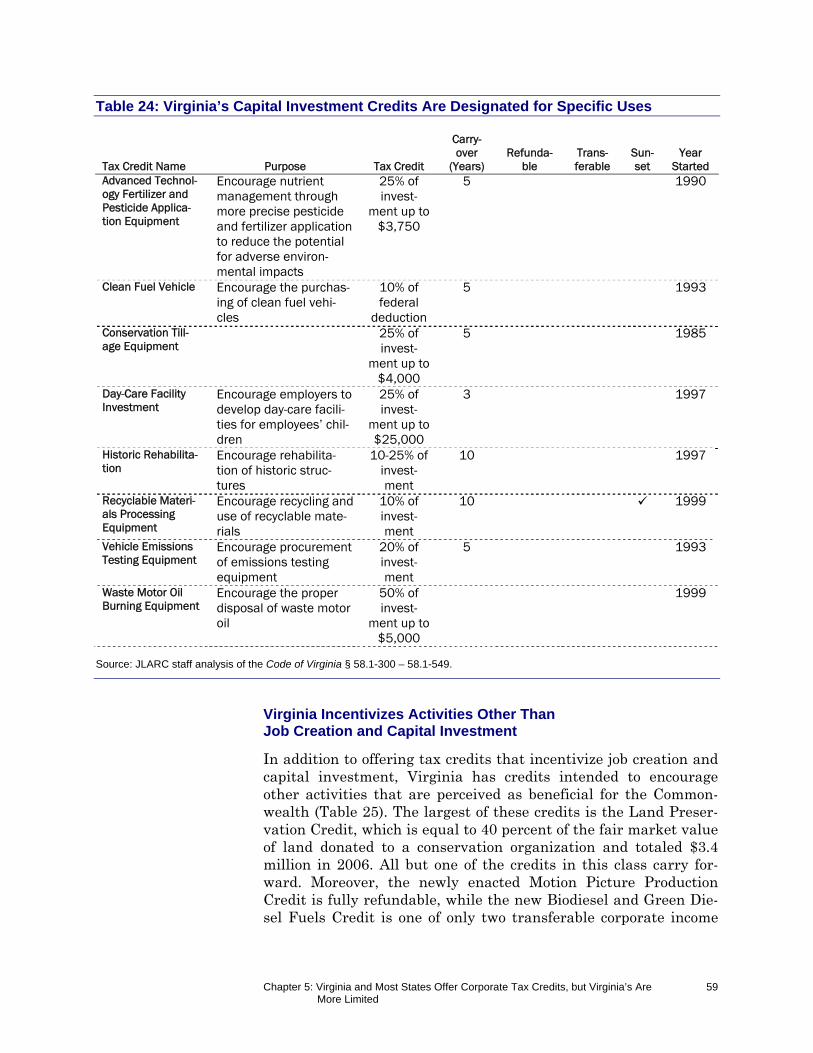
Chapter 5: Virginia and Most States Offer Corporate Tax Credits, but Virginia’s Are More Limited
59
Table 24: Virginia’s Capital Investment Credits Are Designated for Specific Uses
Tax Credit Name Purpose Tax Credit
Carry-over
(Years) Refunda-
ble Trans-ferable
Sun- set
Year Started
Advanced Technol-ogy Fertilizer and Pesticide Applica-tion Equipment
Encourage nutrient management through more precise pesticide and fertilizer application to reduce the potential for adverse environ-mental impacts
25% of invest-
ment up to $3,750
5 1990
Clean Fuel Vehicle Encourage the purchas-ing of clean fuel vehi-cles
10% of federal
deduction
5 1993
Conservation Till-age Equipment
25% of invest-
ment up to $4,000
5 1985
Day-Care Facility Investment
Encourage employers to develop day-care facili-ties for employees’ chil-dren
25% of invest-
ment up to $25,000
3 1997
Historic Rehabilita-tion
Encourage rehabilita-tion of historic struc-tures
10-25% of invest-ment
10 1997
Recyclable Materi-als Processing Equipment
Encourage recycling and use of recyclable mate-rials
10% of invest-ment
10 1999
Vehicle Emissions Testing Equipment
Encourage procurement of emissions testing equipment
20% of invest-ment
5 1993
Waste Motor Oil Burning Equipment
Encourage the proper disposal of waste motor oil
50% of invest-
ment up to $5,000
1999
Source: JLARC staff analysis of the Code of Virginia § 58.1-300 – 58.1-549.
Virginia Incentivizes Activities Other Than Job Creation and Capital Investment
In addition to offering tax credits that incentivize job creation and capital investment, Virginia has credits intended to encourage other activities that are perceived as beneficial for the Common-wealth (Table 25). The largest of these credits is the Land Preser-vation Credit, which is equal to 40 percent of the fair market value of land donated to a conservation organization and totaled $3.4 million in 2006. All but one of the credits in this class carry for-ward. Moreover, the newly enacted Motion Picture Production Credit is fully refundable, while the new Biodiesel and Green Die-sel Fuels Credit is one of only two transferable corporate income
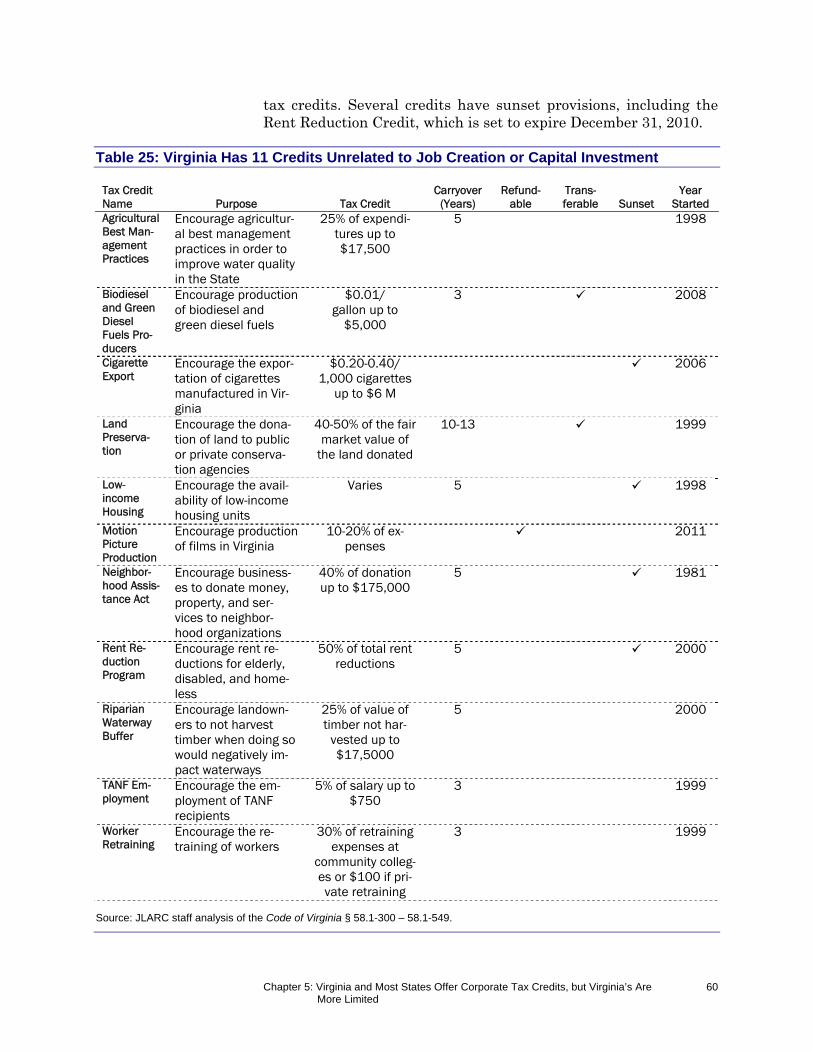
Chapter 5: Virginia and Most States Offer Corporate Tax Credits, but Virginia’s Are More Limited
60
tax credits. Several credits have sunset provisions, including the Rent Reduction Credit, which is set to expire December 31, 2010.
Table 25: Virginia Has 11 Credits Unrelated to Job Creation or Capital Investment
Tax Credit Name Purpose Tax Credit
Carryover (Years)
Refund-able
Trans-ferable Sunset
Year Started
Agricultural Best Man-agement Practices
Encourage agricultur-al best management practices in order to improve water quality in the State
25% of expendi-tures up to $17,500
5 1998
Biodiesel and Green Diesel Fuels Pro-ducers
Encourage production of biodiesel and green diesel fuels
$0.01/ gallon up to
$5,000
3 2008
Cigarette Export
Encourage the expor-tation of cigarettes manufactured in Vir-ginia
$0.20-0.40/ 1,000 cigarettes
up to $6 M
2006
Land Preserva-tion
Encourage the dona-tion of land to public or private conserva-tion agencies
40-50% of the fair market value of
the land donated
10-13 1999
Low-income Housing
Encourage the avail-ability of low-income housing units
Varies 5 1998
Motion Picture Production
Encourage production of films in Virginia
10-20% of ex-penses
2011
Neighbor-hood Assis-tance Act
Encourage business-es to donate money, property, and ser-vices to neighbor-hood organizations
40% of donation up to $175,000
5 1981
Rent Re-duction Program
Encourage rent re-ductions for elderly, disabled, and home-less
50% of total rent reductions
5 2000
Riparian Waterway Buffer
Encourage landown-ers to not harvest timber when doing so would negatively im-pact waterways
25% of value of timber not har-
vested up to $17,5000
5 2000
TANF Em-ployment
Encourage the em-ployment of TANF recipients
5% of salary up to $750
3 1999
Worker Retraining
Encourage the re-training of workers
30% of retraining expenses at
community colleg-es or $100 if pri-vate retraining
3 1999
Source: JLARC staff analysis of the Code of Virginia § 58.1-300 – 58.1-549.
Chapter 5: Virginia and Most States Offer Corporate Tax Credits, but Virginia’s Are More Limited
61
VIRGINIA’S ECONOMIC DEVELOPMENT TAX CREDITS ARE MORE LIMITED THAN COMPETITORS
While Virginia offers a broad-based tax credit to reward job crea-tion, it does not provide the types of R&D and capital investment tax credits available in most competitor states. Most competitor states have a jobs credit similar to Virginia’s Major Business Facil-ity Job Tax Credit (Table 26). However, Virginia’s jobs credit of $1,000 per job is generally smaller than the credits offered by many competitors. In addition, nearly all of Virginia’s competitors and states with a corporate income tax offer R&D and/or broad-based capital investment tax credits (see Appendix C for table in-cluding all states).
Table 26: Most Competitor States Have Jobs, Investment, R&D, and Enterprise Zone Tax Credits
State Job Tax Credit
Capital Investment Tax Credit
R&D Tax Credit
Enterprise Zone Program
Virginia
California District of Columbia
Florida Georgia Illinois Maryland North Carolina New Jersey New York Pennsylvania
Source: JLARC staff analysis of 2010 Multistate Corporate Tax Guide, States' Departments of Revenue and Taxation websites and tax forms.
Aside from certain industry/purpose specific programs, Virginia does not offer a capital investment tax credit to corporations and has no R&D credit of any kind. All of Virginia’s competitors have programs that are equivalent to Virginia’s Enterprise Zone pro-gram. To make their credits more usable, several states have in-troduced new refundable credits primarily designed to stimulate the economy.
Most Competitors Offer Larger Jobs Tax Credits Than Virginia
While Virginia and most of its competitors offer a broad-based job creation tax credit, the State’s Major Business Facility Job Tax Credit is one of the smallest at $1,000 per job (Table 27). Competi-tors provide credits ranging from $750 to $12,500 per job created. In several states, the size of the credit varies based on the average compensation and the location of the added jobs, as well as capital
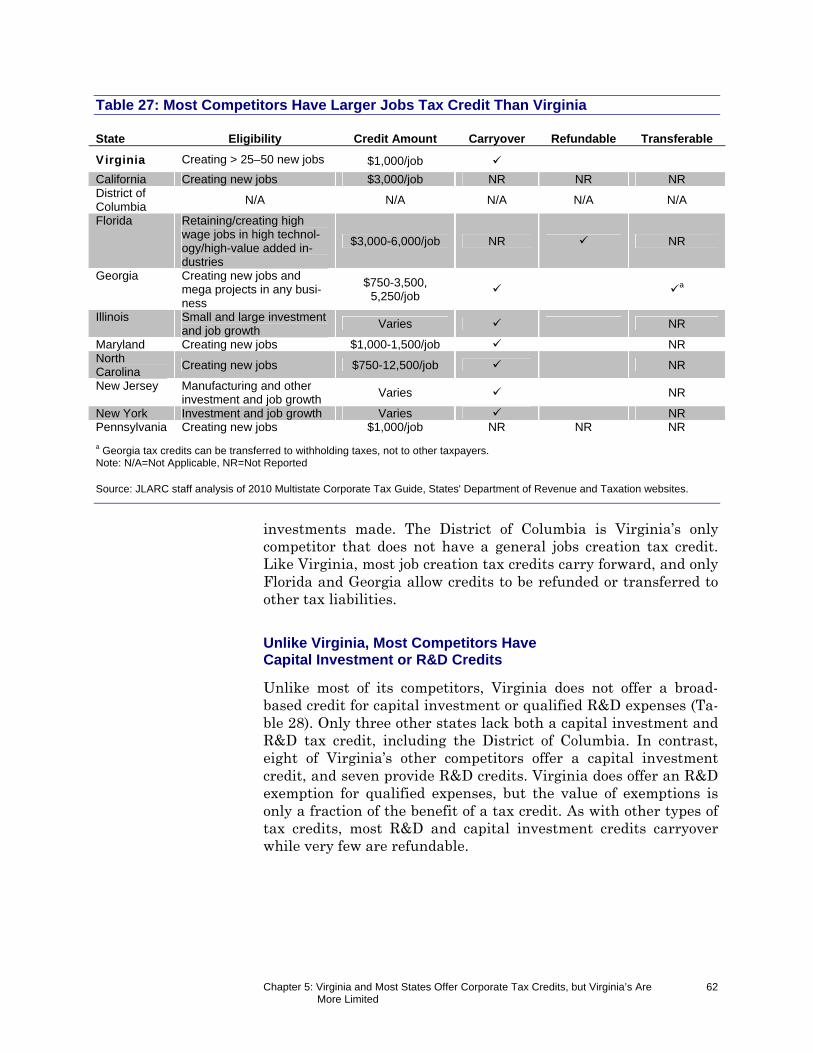
Chapter 5: Virginia and Most States Offer Corporate Tax Credits, but Virginia’s Are More Limited
62
Table 27: Most Competitors Have Larger Jobs Tax Credit Than Virginia State Eligibility Credit Amount Carryover Refundable Transferable
Virginia Creating > 25–50 new jobs $1,000/job
California Creating new jobs $3,000/job NR NR NR District of Columbia
N/A N/A N/A N/A N/A
Florida Retaining/creating high wage jobs in high technol-ogy/high-value added in-dustries
$3,000-6,000/job NR NR
Georgia Creating new jobs and mega projects in any busi-ness
$750-3,500, 5,250/job
a
Illinois Small and large investment and job growth
Varies NR
Maryland Creating new jobs $1,000-1,500/job NR North Carolina
Creating new jobs $750-12,500/job NR
New Jersey Manufacturing and other investment and job growth
Varies NR
New York Investment and job growth Varies NR Pennsylvania Creating new jobs $1,000/job NR NR NR
a Georgia tax credits can be transferred to withholding taxes, not to other taxpayers. Note: N/A=Not Applicable, NR=Not Reported Source: JLARC staff analysis of 2010 Multistate Corporate Tax Guide, States' Department of Revenue and Taxation websites.
investments made. The District of Columbia is Virginia’s only competitor that does not have a general jobs creation tax credit. Like Virginia, most job creation tax credits carry forward, and only Florida and Georgia allow credits to be refunded or transferred to other tax liabilities.
Unlike Virginia, Most Competitors Have Capital Investment or R&D Credits
Unlike most of its competitors, Virginia does not offer a broad-based credit for capital investment or qualified R&D expenses (Ta-ble 28). Only three other states lack both a capital investment and R&D tax credit, including the District of Columbia. In contrast, eight of Virginia’s other competitors offer a capital investment credit, and seven provide R&D credits. Virginia does offer an R&D exemption for qualified expenses, but the value of exemptions is only a fraction of the benefit of a tax credit. As with other types of tax credits, most R&D and capital investment credits carryover while very few are refundable.
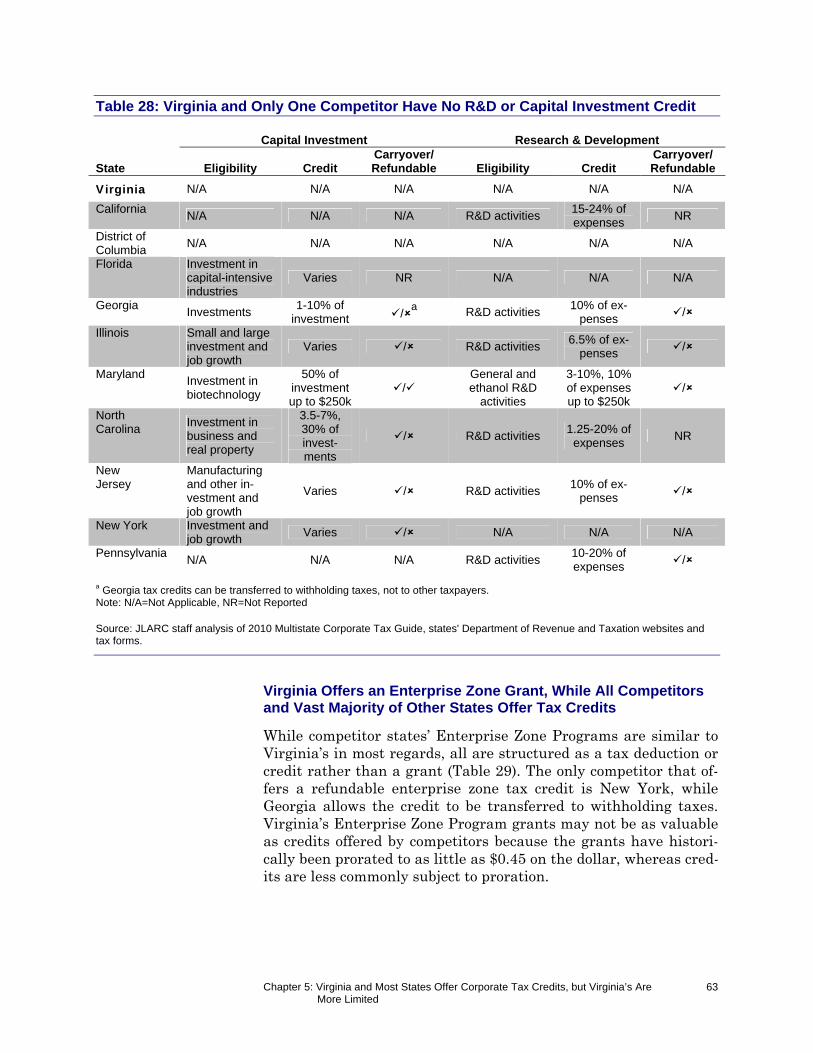
Chapter 5: Virginia and Most States Offer Corporate Tax Credits, but Virginia’s Are More Limited
63
Table 28: Virginia and Only One Competitor Have No R&D or Capital Investment Credit
Capital Investment Research & Development
State Eligibility Credit Carryover/ Refundable Eligibility Credit
Carryover/ Refundable
Virginia N/A N/A N/A N/A N/A N/A
California N/A N/A N/A R&D activities
15-24% of expenses
NR
District of Columbia
N/A N/A N/A N/A N/A N/A
Florida Investment in capital-intensive industries
Varies NR N/A N/A N/A
Georgia Investments
1-10% of investment /
a R&D activities
10% of ex-penses
/
Illinois Small and large investment and job growth
Varies / R&D activities 6.5% of ex-
penses /
Maryland Investment in biotechnology
50% of investment up to $250k
/ General and ethanol R&D
activities
3-10%, 10% of expenses up to $250k
/
North Carolina
Investment in business and real property
3.5-7%, 30% of invest-ments
/ R&D activities 1.25-20% of expenses
NR
New Jersey
Manufacturing and other in-vestment and job growth
Varies / R&D activities 10% of ex-
penses /
New York Investment and job growth
Varies / N/A N/A N/A
Pennsylvania N/A N/A N/A R&D activities
10-20% of expenses
/
a Georgia tax credits can be transferred to withholding taxes, not to other taxpayers. Note: N/A=Not Applicable, NR=Not Reported Source: JLARC staff analysis of 2010 Multistate Corporate Tax Guide, states' Department of Revenue and Taxation websites and tax forms.
Virginia Offers an Enterprise Zone Grant, While All Competitors and Vast Majority of Other States Offer Tax Credits
While competitor states’ Enterprise Zone Programs are similar to Virginia’s in most regards, all are structured as a tax deduction or credit rather than a grant (Table 29). The only competitor that of-fers a refundable enterprise zone tax credit is New York, while Georgia allows the credit to be transferred to withholding taxes. Virginia’s Enterprise Zone Program grants may not be as valuable as credits offered by competitors because the grants have histori-cally been prorated to as little as $0.45 on the dollar, whereas cred-its are less commonly subject to proration.
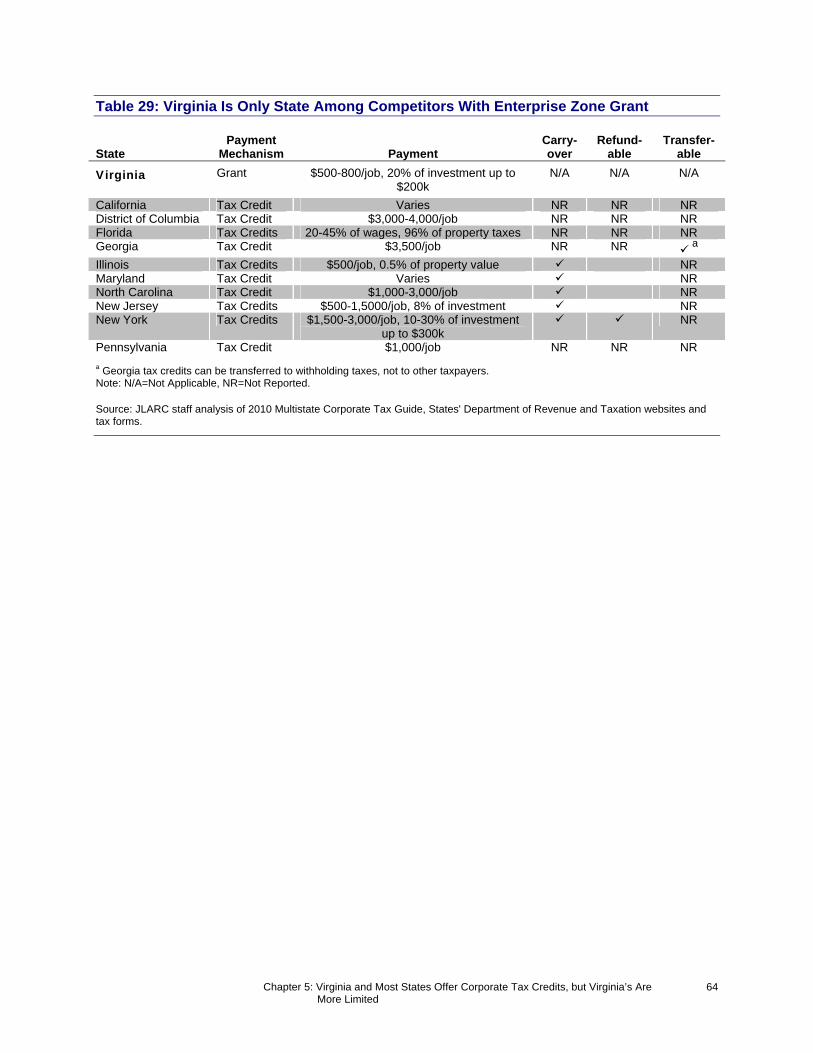
Chapter 5: Virginia and Most States Offer Corporate Tax Credits, but Virginia’s Are More Limited
64
Table 29: Virginia Is Only State Among Competitors With Enterprise Zone Grant
State Payment
Mechanism Payment Carry-over
Refund-able
Transfer-able
Virginia Grant $500-800/job, 20% of investment up to $200k
N/A N/A N/A
California Tax Credit Varies NR NR NR District of Columbia Tax Credit $3,000-4,000/job NR NR NR Florida Tax Credits 20-45% of wages, 96% of property taxes NR NR NR Georgia Tax Credit $3,500/job NR NR
a
Illinois Tax Credits $500/job, 0.5% of property value NR Maryland Tax Credit Varies NR North Carolina Tax Credit $1,000-3,000/job NR New Jersey Tax Credits $500-1,5000/job, 8% of investment NR New York Tax Credits $1,500-3,000/job, 10-30% of investment
up to $300k NR
Pennsylvania Tax Credit $1,000/job NR NR NR
a Georgia tax credits can be transferred to withholding taxes, not to other taxpayers. Note: N/A=Not Applicable, NR=Not Reported. Source: JLARC staff analysis of 2010 Multistate Corporate Tax Guide, States' Department of Revenue and Taxation websites and tax forms.
Chapter 6: Virginia Corporate Income Tax System Does Not Appear to Reduce 65 Economic Development
State corporate income tax systems often appear to be shaped not only by policy principles but also by interstate competition for eco-nomic development. In some cases, states may use tax incentives to compensate for deficiencies in their business climate or public infrastructure. By most accounts, Virginia offers both a favorable business and tax environment, and has not had to rely on generous tax incentives to sustain its economic growth.
VIRGINIA’S CORPORATE INCOME TAX APPEARS TO HAVE ONLY MARGINAL EFFECT ON ECONOMIC DEVELOPMENT
State CIT structures have been found to have only a marginal ef-fect on business decisions generally, and Virginia’s system in par-ticular appears to compare favorably to other states. The research literature indicates that changes in corporate taxation generally have a small effect on economic growth relative to the loss of tax revenue incurred. This limited effect is attributed to several fac-tors. Although corporations consider a state’s tax environment carefully when making business decisions, they weigh many other factors that are equally, and in some cases, more important. Fur-ther, state CITs represent only a subset of businesses’ overall tax burden, approximately five percent on average. Still, a state’s CIT
Ch
apte
r
66
VViirrggiinniiaa CCoorrppoorraattee IInnccoommee TTaaxx SSyysstteemm DDooeess NNoott AAppppeeaarr ttoo DDiimmiinniisshh EEccoonnoommiicc DDeevveellooppmmeenntt
In light of its favorable business climate, Virginia’s corporate income tax systemdoes not appear to diminish the State’s economic development efforts. Empiricalstudies suggest that state tax incentives generally have only a modest effect on eco-nomic development. In fact, corporations report that factors such as the availabilityof qualified labor and adequate transportation take precedence over their total taxburden, of which the corporate income tax (CIT) represents only five percent on av-erage. However, as corporations narrow down potential sites to those that possesscritical factors, the states’ CIT systems become increasingly important. Relative toits competitors, Virginia has a generally favorable corporate tax system and busi-ness environment. Virginia has been named the “best state for business” multipletimes over the last decade by CNBC and Forbes. This title is a reflection of Virgin-ia’s well-educated labor force, transportation infrastructure, and low total businesstax burden and is further demonstrated by the fact that Virginia gained more jobsfrom its top competitors than it lost over the last 20 years. Still, Virginia’s economicdevelopment grants could be used to further differentiate the State and may be morecost-effective than tax incentives, but they often are not as large as those offered bycompetitor states.
II nn SS
uumm
mmaa r
r yy
Chapter 6: Virginia Corporate Income Tax System Does Not Appear to Reduce 66 Economic Development
system can sway a company’s decisions if it is markedly different from other states or is perceived to treat certain industries or cor-porations inequitably. Tax structures can help differentiate other-wise comparable states and can promote economic development so long as other necessary factors are already in place. As discussed in preceding chapters, Virginia’s CIT system compares favorably to competitor states in most respects, and does not deviate signifi-cantly from other states’ practices.
Studies Have Found Positive but Limited Association Between Changes in Corporate Income Taxes and Economic Development
While states have long utilized their tax structure to attract new firms and promote the expansion of existing companies, the re-search literature suggests that tax policy may not be a cost-effective means of creating jobs and, ultimately, boosting state economies. By reducing taxes, states can lower the cost of doing business in their jurisdiction and enable companies to deliver on their fiduciary responsibility to maximize profits. Empirical stud-ies conducted during the past three decades have found that lower-ing taxes can have a positive effect on business activity, but the magnitude of these effects appears to be small relative to the amount of foregone taxes. Further, it is unclear whether tax cred-its successfully change business behavior.
Studies Find That Beneficial Impact of Tax Reductions on Economic Development Is Small Relative to Revenue Losses. Although re-search conducted over the past three decades has arrived at vary-ing conclusions, recent studies generally find that lower taxes can have a positive effect on states’ economic development. In particu-lar, one researcher examined this body of work and found that in most studies (70 percent) at least one type of tax had a statistically significant effect on measures of economic growth such as employ-ment, domestic and foreign investment, and firm locations.
However, it is important to note that only a subset of studies found this association to exist with the CIT specifically rather than other types of taxes. In fact, certain studies found that property or indi-vidual income taxes had a statistically significant effect on eco-nomic development, but identified no association with CITs. Fur-ther, much of the research has focused on capital-intensive industries such as manufacturing, which may not accurately re-flect the nature of the association between taxes and other sectors, such as the retail or service industry. Lastly, the econometric mod-els used in many studies reportedly have limitations, such as po-tentially inaccurate results due to the fact that taxes and measures of economic development affect one another. To correct for this issue, so-called “dynamic” models can be used to appropri-ately capture the interaction between tax and economic variables.
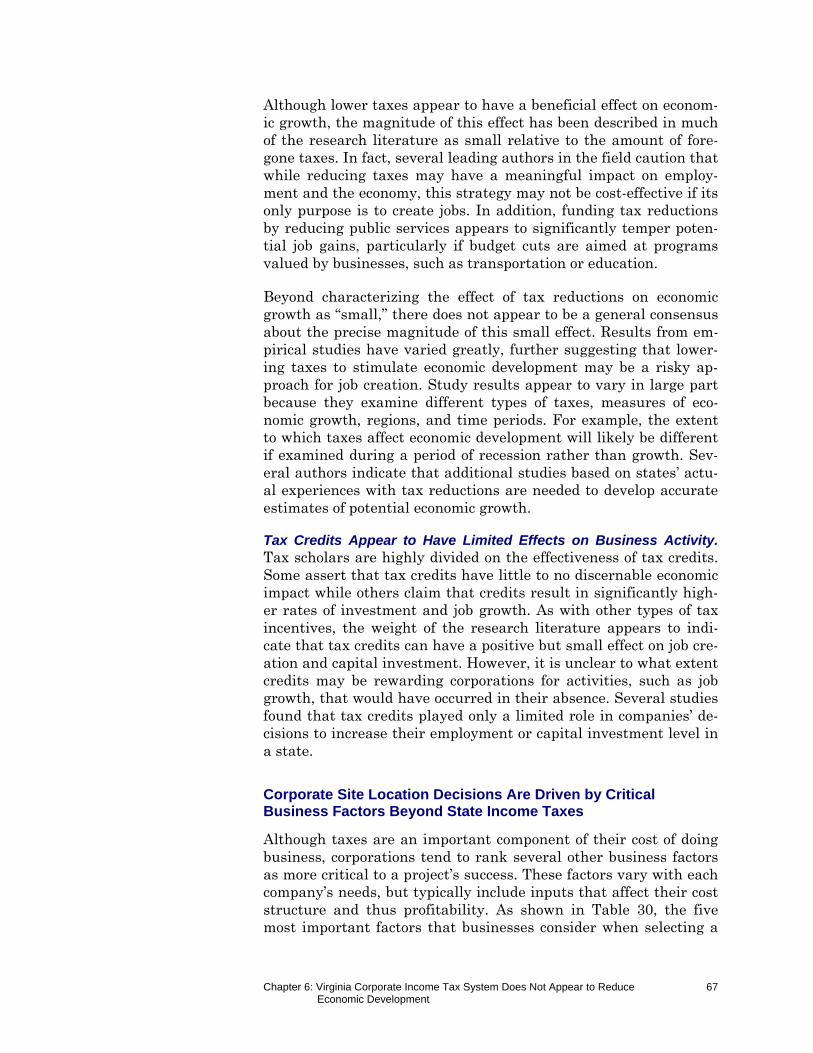
Chapter 6: Virginia Corporate Income Tax System Does Not Appear to Reduce 67 Economic Development
Although lower taxes appear to have a beneficial effect on econom-ic growth, the magnitude of this effect has been described in much of the research literature as small relative to the amount of fore-gone taxes. In fact, several leading authors in the field caution that while reducing taxes may have a meaningful impact on employ-ment and the economy, this strategy may not be cost-effective if its only purpose is to create jobs. In addition, funding tax reductions by reducing public services appears to significantly temper poten-tial job gains, particularly if budget cuts are aimed at programs valued by businesses, such as transportation or education.
Beyond characterizing the effect of tax reductions on economic growth as “small,” there does not appear to be a general consensus about the precise magnitude of this small effect. Results from em-pirical studies have varied greatly, further suggesting that lower-ing taxes to stimulate economic development may be a risky ap-proach for job creation. Study results appear to vary in large part because they examine different types of taxes, measures of eco-nomic growth, regions, and time periods. For example, the extent to which taxes affect economic development will likely be different if examined during a period of recession rather than growth. Sev-eral authors indicate that additional studies based on states’ actu-al experiences with tax reductions are needed to develop accurate estimates of potential economic growth.
Tax Credits Appear to Have Limited Effects on Business Activity. Tax scholars are highly divided on the effectiveness of tax credits. Some assert that tax credits have little to no discernable economic impact while others claim that credits result in significantly high-er rates of investment and job growth. As with other types of tax incentives, the weight of the research literature appears to indi-cate that tax credits can have a positive but small effect on job cre-ation and capital investment. However, it is unclear to what extent credits may be rewarding corporations for activities, such as job growth, that would have occurred in their absence. Several studies found that tax credits played only a limited role in companies’ de-cisions to increase their employment or capital investment level in a state.
Corporate Site Location Decisions Are Driven by Critical Business Factors Beyond State Income Taxes
Although taxes are an important component of their cost of doing business, corporations tend to rank several other business factors as more critical to a project’s success. These factors vary with each company’s needs, but typically include inputs that affect their cost structure and thus profitability. As shown in Table 30, the five most important factors that businesses consider when selecting a
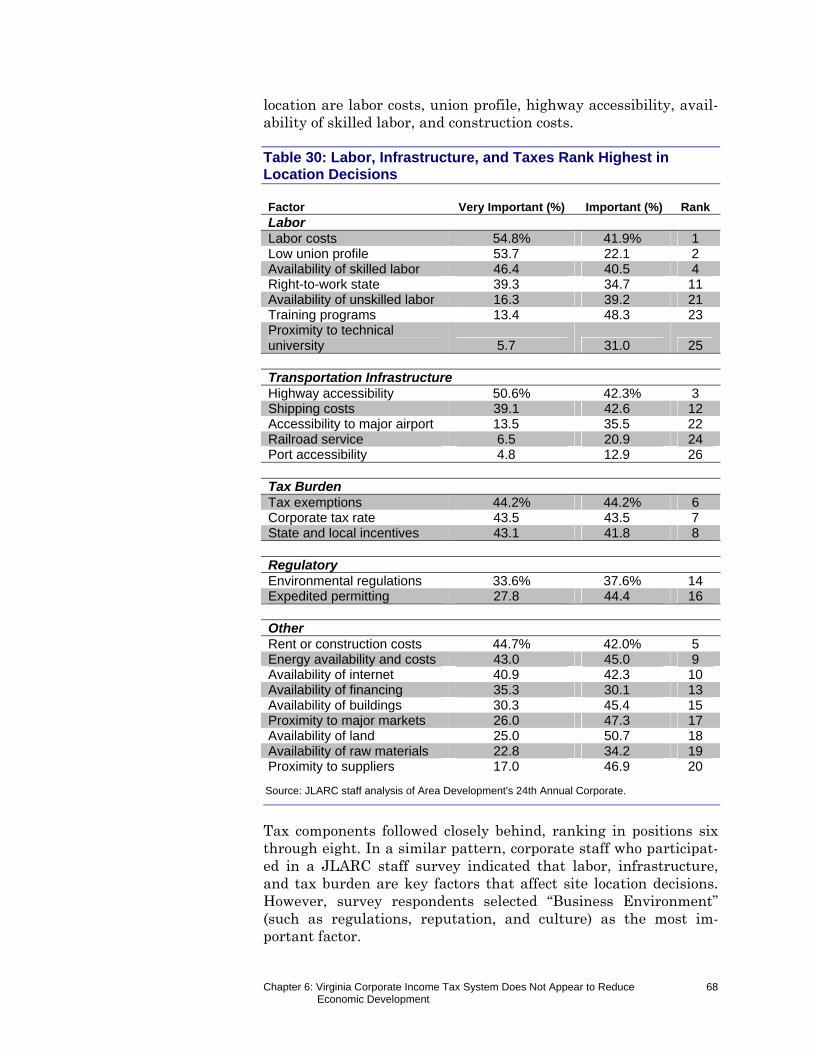
Chapter 6: Virginia Corporate Income Tax System Does Not Appear to Reduce 68 Economic Development
location are labor costs, union profile, highway accessibility, avail-ability of skilled labor, and construction costs.
Table 30: Labor, Infrastructure, and Taxes Rank Highest in Location Decisions
Factor Very Important (%) Important (%) RankLabor Labor costs 54.8% 41.9% 1 Low union profile 53.7 22.1 2 Availability of skilled labor 46.4 40.5 4 Right-to-work state 39.3 34.7 11 Availability of unskilled labor 16.3 39.2 21 Training programs 13.4 48.3 23 Proximity to technical university 5.7 31.0 25 Transportation Infrastructure Highway accessibility 50.6% 42.3% 3 Shipping costs 39.1 42.6 12 Accessibility to major airport 13.5 35.5 22 Railroad service 6.5 20.9 24 Port accessibility 4.8 12.9 26 Tax Burden Tax exemptions 44.2% 44.2% 6 Corporate tax rate 43.5 43.5 7 State and local incentives 43.1 41.8 8
Regulatory Environmental regulations 33.6% 37.6% 14 Expedited permitting 27.8 44.4 16 Other Rent or construction costs 44.7% 42.0% 5 Energy availability and costs 43.0 45.0 9 Availability of internet 40.9 42.3 10 Availability of financing 35.3 30.1 13 Availability of buildings 30.3 45.4 15 Proximity to major markets 26.0 47.3 17 Availability of land 25.0 50.7 18 Availability of raw materials 22.8 34.2 19 Proximity to suppliers 17.0 46.9 20
Source: JLARC staff analysis of Area Development's 24th Annual Corporate.
Tax components followed closely behind, ranking in positions six through eight. In a similar pattern, corporate staff who participat-ed in a JLARC staff survey indicated that labor, infrastructure, and tax burden are key factors that affect site location decisions. However, survey respondents selected “Business Environment” (such as regulations, reputation, and culture) as the most im-portant factor.
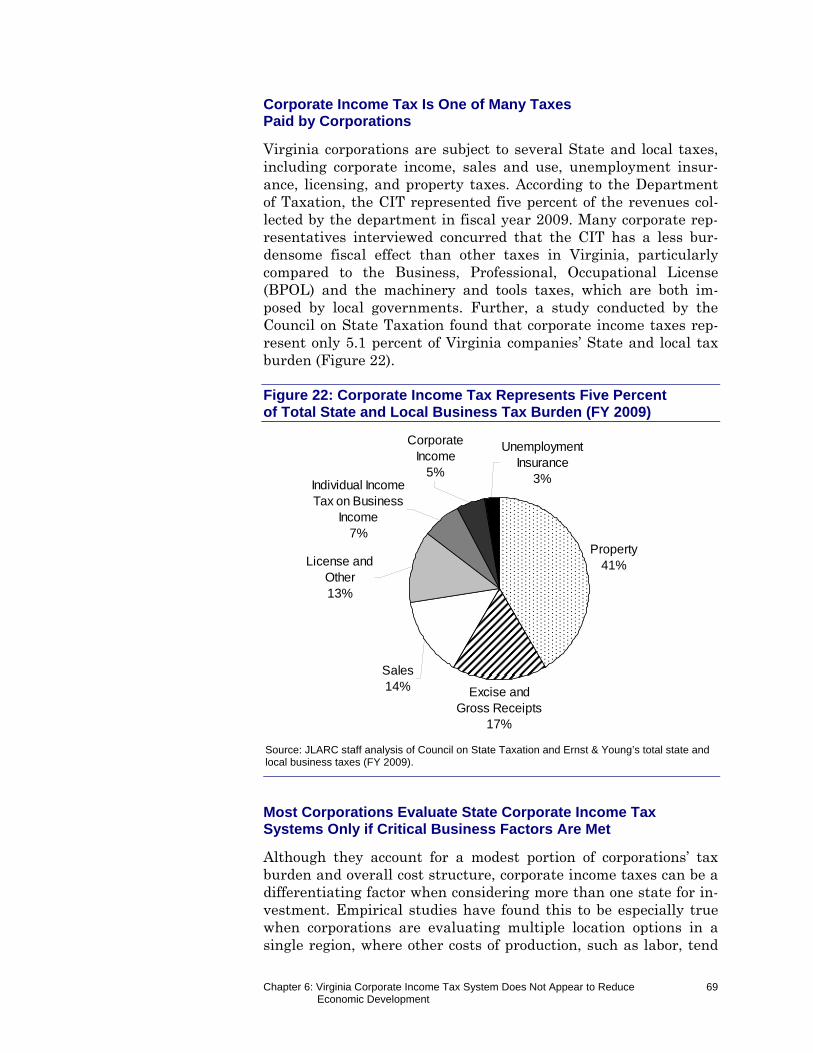
Chapter 6: Virginia Corporate Income Tax System Does Not Appear to Reduce 69 Economic Development
Corporate Income Tax Is One of Many Taxes Paid by Corporations
Virginia corporations are subject to several State and local taxes, including corporate income, sales and use, unemployment insur-ance, licensing, and property taxes. According to the Department of Taxation, the CIT represented five percent of the revenues col-lected by the department in fiscal year 2009. Many corporate rep-resentatives interviewed concurred that the CIT has a less bur-densome fiscal effect than other taxes in Virginia, particularly compared to the Business, Professional, Occupational License (BPOL) and the machinery and tools taxes, which are both im-posed by local governments. Further, a study conducted by the Council on State Taxation found that corporate income taxes rep-resent only 5.1 percent of Virginia companies’ State and local tax burden (Figure 22).
Figure 22: Corporate Income Tax Represents Five Percent of Total State and Local Business Tax Burden (FY 2009)
Source: JLARC staff analysis of Council on State Taxation and Ernst & Young’s total state and local business taxes (FY 2009).
Most Corporations Evaluate State Corporate Income Tax Systems Only if Critical Business Factors Are Met
Although they account for a modest portion of corporations’ tax burden and overall cost structure, corporate income taxes can be a differentiating factor when considering more than one state for in-vestment. Empirical studies have found this to be especially true when corporations are evaluating multiple location options in a single region, where other costs of production, such as labor, tend
Property41%
Excise and Gross Receipts
17%
Unemployment Insurance
3%Individual Income Tax on Business
Income7%
Corporate Income
5%
Sales14%
License and Other13%
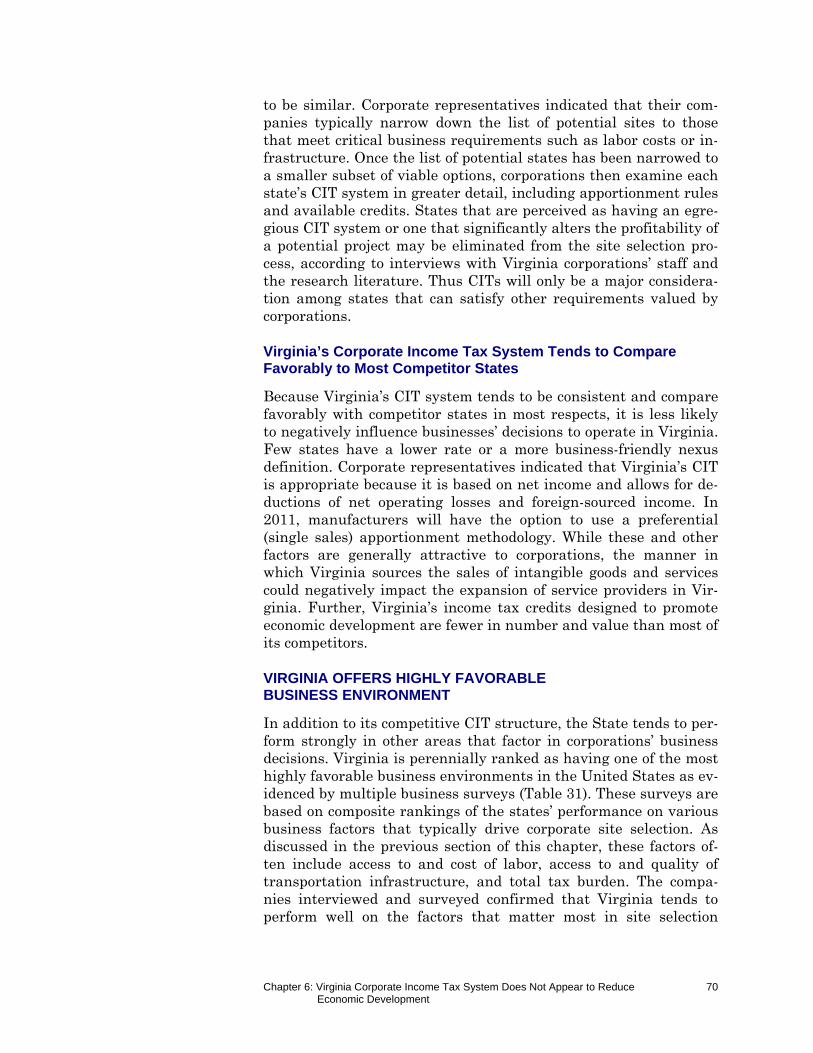
Chapter 6: Virginia Corporate Income Tax System Does Not Appear to Reduce 70 Economic Development
to be similar. Corporate representatives indicated that their com-panies typically narrow down the list of potential sites to those that meet critical business requirements such as labor costs or in-frastructure. Once the list of potential states has been narrowed to a smaller subset of viable options, corporations then examine each state’s CIT system in greater detail, including apportionment rules and available credits. States that are perceived as having an egre-gious CIT system or one that significantly alters the profitability of a potential project may be eliminated from the site selection pro-cess, according to interviews with Virginia corporations’ staff and the research literature. Thus CITs will only be a major considera-tion among states that can satisfy other requirements valued by corporations.
Virginia’s Corporate Income Tax System Tends to Compare Favorably to Most Competitor States
Because Virginia’s CIT system tends to be consistent and compare favorably with competitor states in most respects, it is less likely to negatively influence businesses’ decisions to operate in Virginia. Few states have a lower rate or a more business-friendly nexus definition. Corporate representatives indicated that Virginia’s CIT is appropriate because it is based on net income and allows for de-ductions of net operating losses and foreign-sourced income. In 2011, manufacturers will have the option to use a preferential (single sales) apportionment methodology. While these and other factors are generally attractive to corporations, the manner in which Virginia sources the sales of intangible goods and services could negatively impact the expansion of service providers in Vir-ginia. Further, Virginia’s income tax credits designed to promote economic development are fewer in number and value than most of its competitors.
VIRGINIA OFFERS HIGHLY FAVORABLE BUSINESS ENVIRONMENT
In addition to its competitive CIT structure, the State tends to per-form strongly in other areas that factor in corporations’ business decisions. Virginia is perennially ranked as having one of the most highly favorable business environments in the United States as ev-idenced by multiple business surveys (Table 31). These surveys are based on composite rankings of the states’ performance on various business factors that typically drive corporate site selection. As discussed in the previous section of this chapter, these factors of-ten include access to and cost of labor, access to and quality of transportation infrastructure, and total tax burden. The compa-nies interviewed and surveyed confirmed that Virginia tends to perform well on the factors that matter most in site selection
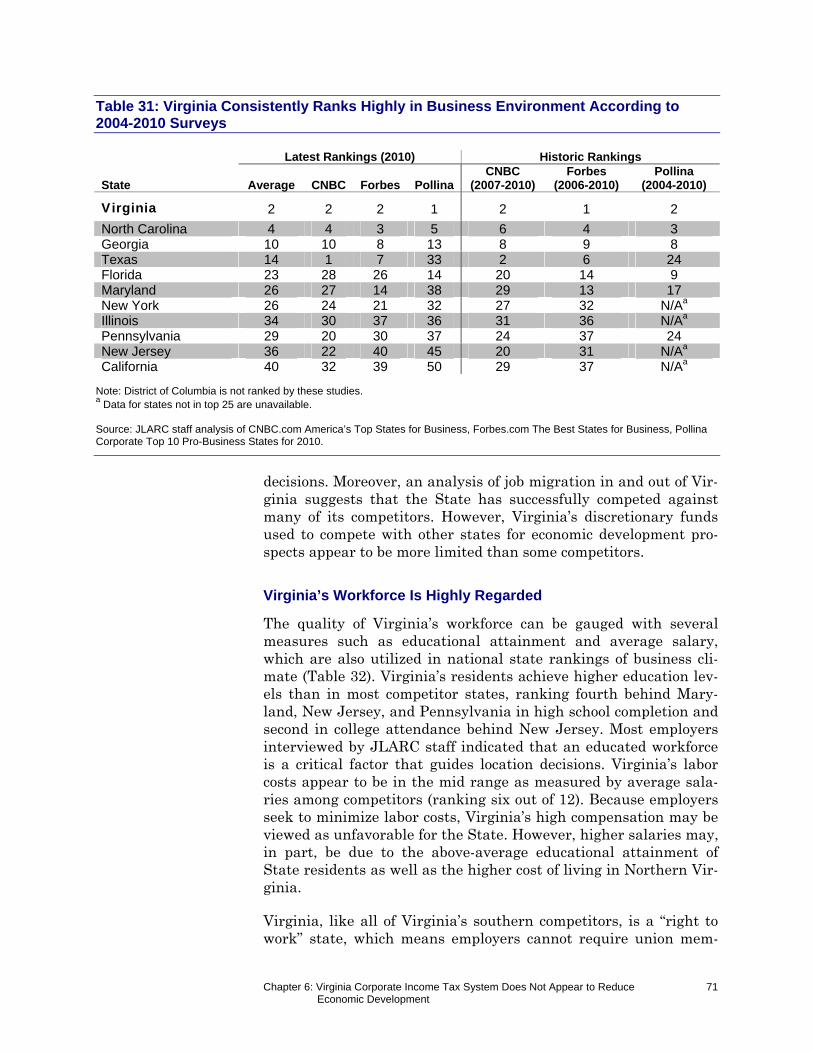
Chapter 6: Virginia Corporate Income Tax System Does Not Appear to Reduce 71 Economic Development
Table 31: Virginia Consistently Ranks Highly in Business Environment According to 2004-2010 Surveys
Latest Rankings (2010) Historic Rankings
State Average CNBC Forbes Pollina CNBC
(2007-2010) Forbes
(2006-2010) Pollina
(2004-2010)
Virginia 2 2 2 1 2 1 2
North Carolina 4 4 3 5 6 4 3 Georgia 10 10 8 13 8 9 8 Texas 14 1 7 33 2 6 24 Florida 23 28 26 14 20 14 9 Maryland 26 27 14 38 29 13 17 New York 26 24 21 32 27 32 N/Aa Illinois 34 30 37 36 31 36 N/Aa Pennsylvania 29 20 30 37 24 37 24 New Jersey 36 22 40 45 20 31 N/Aa California 40 32 39 50 29 37 N/Aa
Note: District of Columbia is not ranked by these studies. a Data for states not in top 25 are unavailable.
Source: JLARC staff analysis of CNBC.com America’s Top States for Business, Forbes.com The Best States for Business, Pollina Corporate Top 10 Pro-Business States for 2010.
decisions. Moreover, an analysis of job migration in and out of Vir-ginia suggests that the State has successfully competed against many of its competitors. However, Virginia’s discretionary funds used to compete with other states for economic development pro-spects appear to be more limited than some competitors.
Virginia’s Workforce Is Highly Regarded
The quality of Virginia’s workforce can be gauged with several measures such as educational attainment and average salary, which are also utilized in national state rankings of business cli-mate (Table 32). Virginia’s residents achieve higher education lev-els than in most competitor states, ranking fourth behind Mary-land, New Jersey, and Pennsylvania in high school completion and second in college attendance behind New Jersey. Most employers interviewed by JLARC staff indicated that an educated workforce is a critical factor that guides location decisions. Virginia’s labor costs appear to be in the mid range as measured by average sala-ries among competitors (ranking six out of 12). Because employers seek to minimize labor costs, Virginia’s high compensation may be viewed as unfavorable for the State. However, higher salaries may, in part, be due to the above-average educational attainment of State residents as well as the higher cost of living in Northern Vir-ginia.
Virginia, like all of Virginia’s southern competitors, is a “right to work” state, which means employers cannot require union mem-
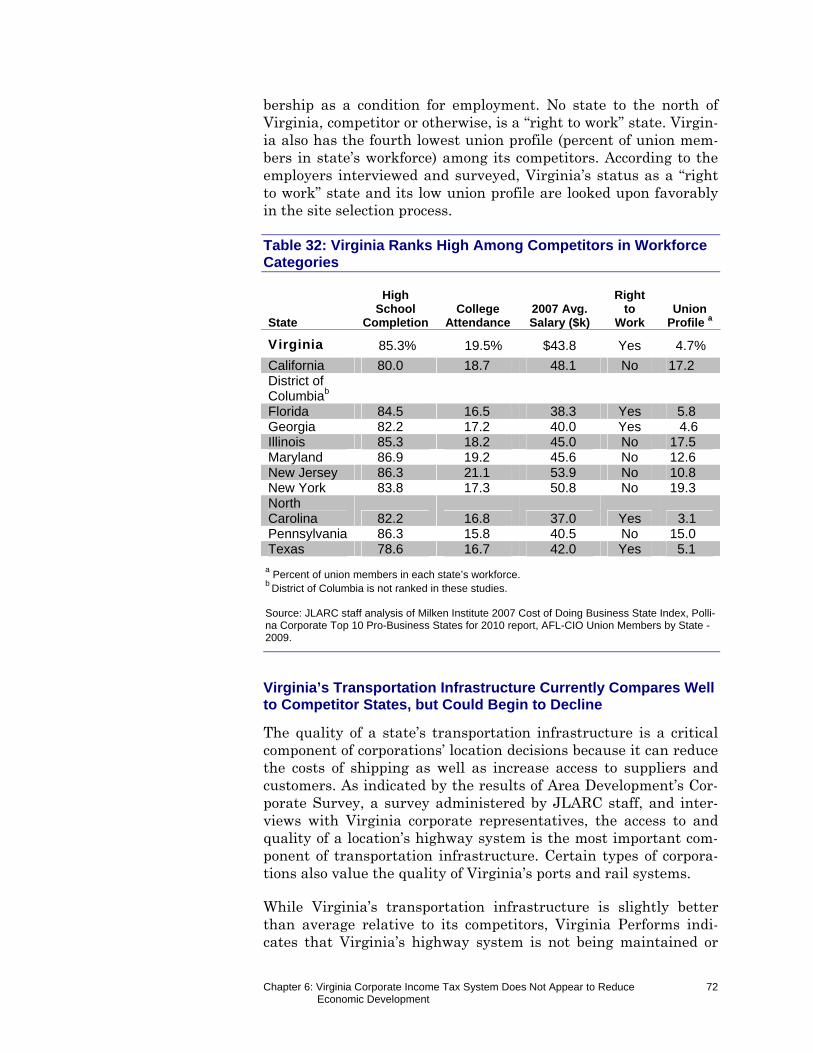
Chapter 6: Virginia Corporate Income Tax System Does Not Appear to Reduce 72 Economic Development
bership as a condition for employment. No state to the north of Virginia, competitor or otherwise, is a “right to work” state. Virgin-ia also has the fourth lowest union profile (percent of union mem-bers in state’s workforce) among its competitors. According to the employers interviewed and surveyed, Virginia’s status as a “right to work” state and its low union profile are looked upon favorably in the site selection process.
Table 32: Virginia Ranks High Among Competitors in Workforce Categories
State
High School
Completion College
Attendance 2007 Avg. Salary ($k)
Right to
Work Union
Profile a
Virginia 85.3% 19.5% $43.8 Yes 4.7%
California 80.0 18.7 48.1 No 17.2 District of Columbiab Florida 84.5 16.5 38.3 Yes 5.8 Georgia 82.2 17.2 40.0 Yes 4.6 Illinois 85.3 18.2 45.0 No 17.5 Maryland 86.9 19.2 45.6 No 12.6 New Jersey 86.3 21.1 53.9 No 10.8 New York 83.8 17.3 50.8 No 19.3 North Carolina 82.2 16.8 37.0 Yes 3.1 Pennsylvania 86.3 15.8 40.5 No 15.0 Texas 78.6 16.7 42.0 Yes 5.1
a Percent of union members in each state’s workforce.
b District of Columbia is not ranked in these studies. Source: JLARC staff analysis of Milken Institute 2007 Cost of Doing Business State Index, Polli-na Corporate Top 10 Pro-Business States for 2010 report, AFL-CIO Union Members by State -2009.
Virginia’s Transportation Infrastructure Currently Compares Well to Competitor States, but Could Begin to Decline
The quality of a state’s transportation infrastructure is a critical component of corporations’ location decisions because it can reduce the costs of shipping as well as increase access to suppliers and customers. As indicated by the results of Area Development’s Cor-porate Survey, a survey administered by JLARC staff, and inter-views with Virginia corporate representatives, the access to and quality of a location’s highway system is the most important com-ponent of transportation infrastructure. Certain types of corpora-tions also value the quality of Virginia’s ports and rail systems.
While Virginia’s transportation infrastructure is slightly better than average relative to its competitors, Virginia Performs indi-cates that Virginia’s highway system is not being maintained or
Chapter 6: Virginia Corporate Income Tax System Does Not Appear to Reduce 73 Economic Development
upgraded at a pace commensurate with increased demand. Cur-rently, all southern competitors, with the notable exception of Flor-ida, score better than Virginia on at least one of the national transportation infrastructure rankings (Table 33). Conversely, Virginia scores higher marks than northern competitors that, ac-cording to the Reason Foundation, suffer from higher levels of con-gestion, poorer road conditions, and more acute funding concerns. However, several corporate representatives interviewed by JLARC staff highlighted concerns with congestion and road conditions in Northern Virginia and the Hampton Roads region. These corpora-tions also expressed an understanding that State funds for high-ways are lower in part because of the 2007-2009 recession, but many also raised concerns that a systemic reduction in highway maintenance and road construction funds could negatively impact Virginia’s competitiveness in the future.
Table 33: Virginia’s Transportation Infrastructure Ranks Higher Than Most Competitors
State
CNBC2010
(Multimodala)
Reason Foundation 2008
(Highway) Georgia 2 9 Texas 1 13
Virginia 12 18
North Carolina 10 21 Illinois 12 40 Pennsylvania 16 38 Florida 21 39 California 16 48 New York 32 46 Maryland 43 43 New Jersey 47 45 District of Columbiab
a Includes highway, airports, rail, and ports
b District of Columbia is not ranked in these studies. Source: JLARC staff analysis of CNBC.com 2010 America’s Top States for Business, Reason Foundation 19th Annual Highway Report.
Virginia’s Total Business Tax Burden Is Lower Than Most Competitors
Virginia’s total business tax burden is the second lowest among its competitors and the fourth lowest in the country, as measured rel-ative to each state’s gross state product (GSP) in 2009. As seen in Table 34, North Carolina is the only competitor with a total effec-tive business tax rate (3.5 percent of GSP) lower than Virginia (3.6 percent). The Tax Foundation’s State Business Climate Index
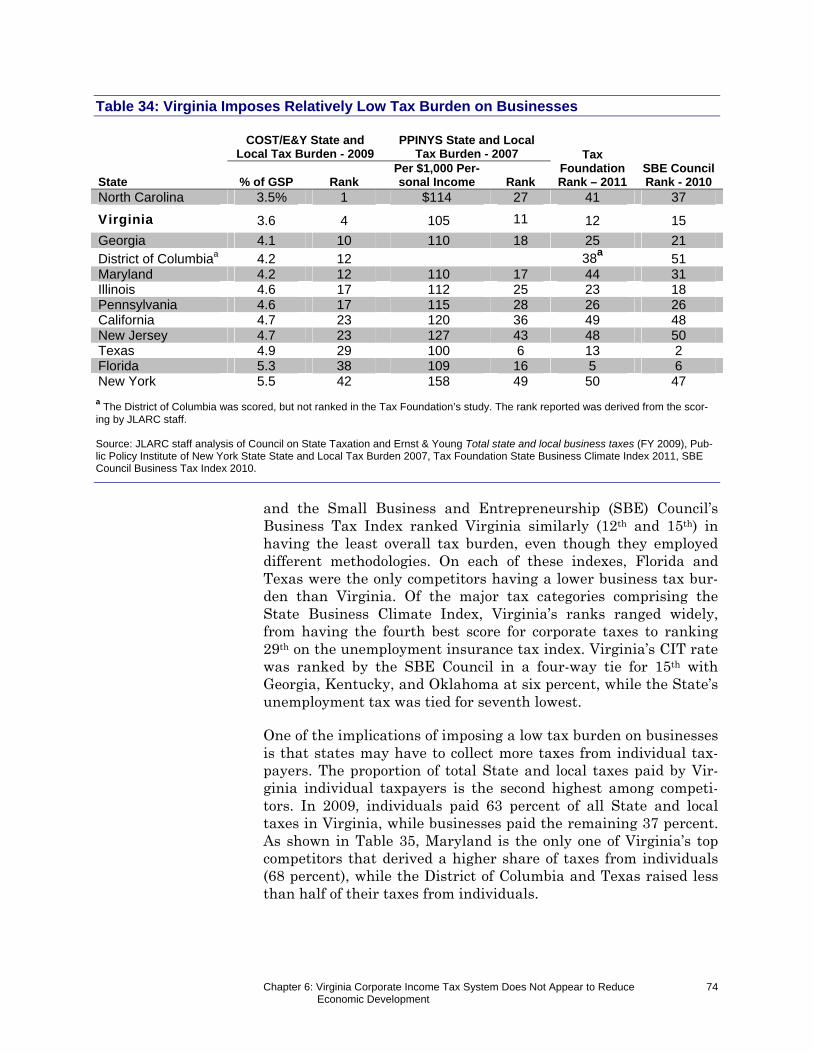
Chapter 6: Virginia Corporate Income Tax System Does Not Appear to Reduce 74 Economic Development
Table 34: Virginia Imposes Relatively Low Tax Burden on Businesses
COST/E&Y State and
Local Tax Burden - 2009 PPINYS State and Local
Tax Burden - 2007 Tax Foundation Rank – 2011
SBE Council Rank - 2010 State % of GSP Rank
Per $1,000 Per-sonal Income Rank
North Carolina 3.5% 1 $114 27 41 37
Virginia 3.6 4 105 11 12 15
Georgia 4.1 10 110 18 25 21 District of Columbiaa 4.2 12 38a 51 Maryland 4.2 12 110 17 44 31 Illinois 4.6 17 112 25 23 18 Pennsylvania 4.6 17 115 28 26 26 California 4.7 23 120 36 49 48 New Jersey 4.7 23 127 43 48 50 Texas 4.9 29 100 6 13 2 Florida 5.3 38 109 16 5 6 New York 5.5 42 158 49 50 47
a The District of Columbia was scored, but not ranked in the Tax Foundation’s study. The rank reported was derived from the scor-
ing by JLARC staff. Source: JLARC staff analysis of Council on State Taxation and Ernst & Young Total state and local business taxes (FY 2009), Pub-lic Policy Institute of New York State State and Local Tax Burden 2007, Tax Foundation State Business Climate Index 2011, SBE Council Business Tax Index 2010.
and the Small Business and Entrepreneurship (SBE) Council’s Business Tax Index ranked Virginia similarly (12th and 15th) in having the least overall tax burden, even though they employed different methodologies. On each of these indexes, Florida and Texas were the only competitors having a lower business tax bur-den than Virginia. Of the major tax categories comprising the State Business Climate Index, Virginia’s ranks ranged widely, from having the fourth best score for corporate taxes to ranking 29th on the unemployment insurance tax index. Virginia’s CIT rate was ranked by the SBE Council in a four-way tie for 15th with Georgia, Kentucky, and Oklahoma at six percent, while the State’s unemployment tax was tied for seventh lowest.
One of the implications of imposing a low tax burden on businesses is that states may have to collect more taxes from individual tax-payers. The proportion of total State and local taxes paid by Vir-ginia individual taxpayers is the second highest among competi-tors. In 2009, individuals paid 63 percent of all State and local taxes in Virginia, while businesses paid the remaining 37 percent. As shown in Table 35, Maryland is the only one of Virginia’s top competitors that derived a higher share of taxes from individuals (68 percent), while the District of Columbia and Texas raised less than half of their taxes from individuals.
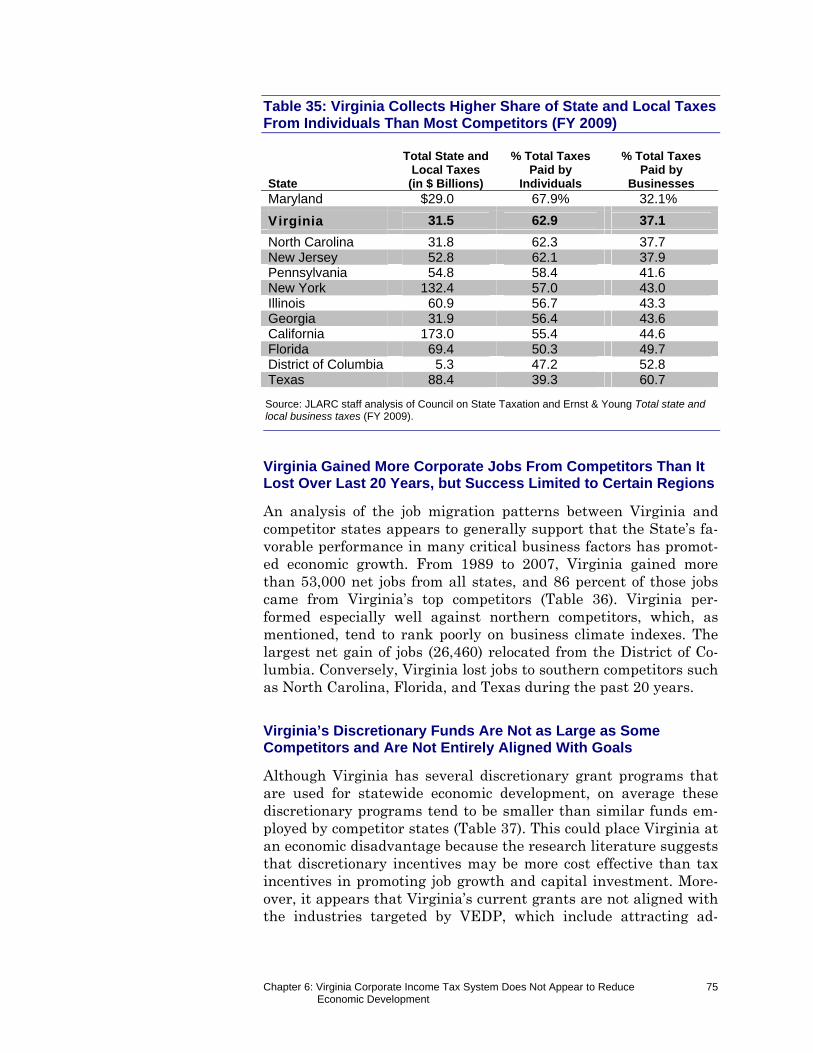
Chapter 6: Virginia Corporate Income Tax System Does Not Appear to Reduce 75 Economic Development
Table 35: Virginia Collects Higher Share of State and Local Taxes From Individuals Than Most Competitors (FY 2009)
State
Total State and Local Taxes
(in $ Billions)
% Total Taxes Paid by
Individuals
% Total Taxes Paid by
Businesses Maryland $29.0 67.9% 32.1%
Virginia 31.5 62.9 37.1
North Carolina 31.8 62.3 37.7 New Jersey 52.8 62.1 37.9 Pennsylvania 54.8 58.4 41.6 New York 132.4 57.0 43.0 Illinois 60.9 56.7 43.3 Georgia 31.9 56.4 43.6 California 173.0 55.4 44.6 Florida 69.4 50.3 49.7 District of Columbia 5.3 47.2 52.8 Texas 88.4 39.3 60.7
Source: JLARC staff analysis of Council on State Taxation and Ernst & Young Total state and local business taxes (FY 2009).
Virginia Gained More Corporate Jobs From Competitors Than It Lost Over Last 20 Years, but Success Limited to Certain Regions
An analysis of the job migration patterns between Virginia and competitor states appears to generally support that the State’s fa-vorable performance in many critical business factors has promot-ed economic growth. From 1989 to 2007, Virginia gained more than 53,000 net jobs from all states, and 86 percent of those jobs came from Virginia’s top competitors (Table 36). Virginia per-formed especially well against northern competitors, which, as mentioned, tend to rank poorly on business climate indexes. The largest net gain of jobs (26,460) relocated from the District of Co-lumbia. Conversely, Virginia lost jobs to southern competitors such as North Carolina, Florida, and Texas during the past 20 years.
Virginia’s Discretionary Funds Are Not as Large as Some Competitors and Are Not Entirely Aligned With Goals
Although Virginia has several discretionary grant programs that are used for statewide economic development, on average these discretionary programs tend to be smaller than similar funds em-ployed by competitor states (Table 37). This could place Virginia at an economic disadvantage because the research literature suggests that discretionary incentives may be more cost effective than tax incentives in promoting job growth and capital investment. More-over, it appears that Virginia’s current grants are not aligned with the industries targeted by VEDP, which include attracting ad-
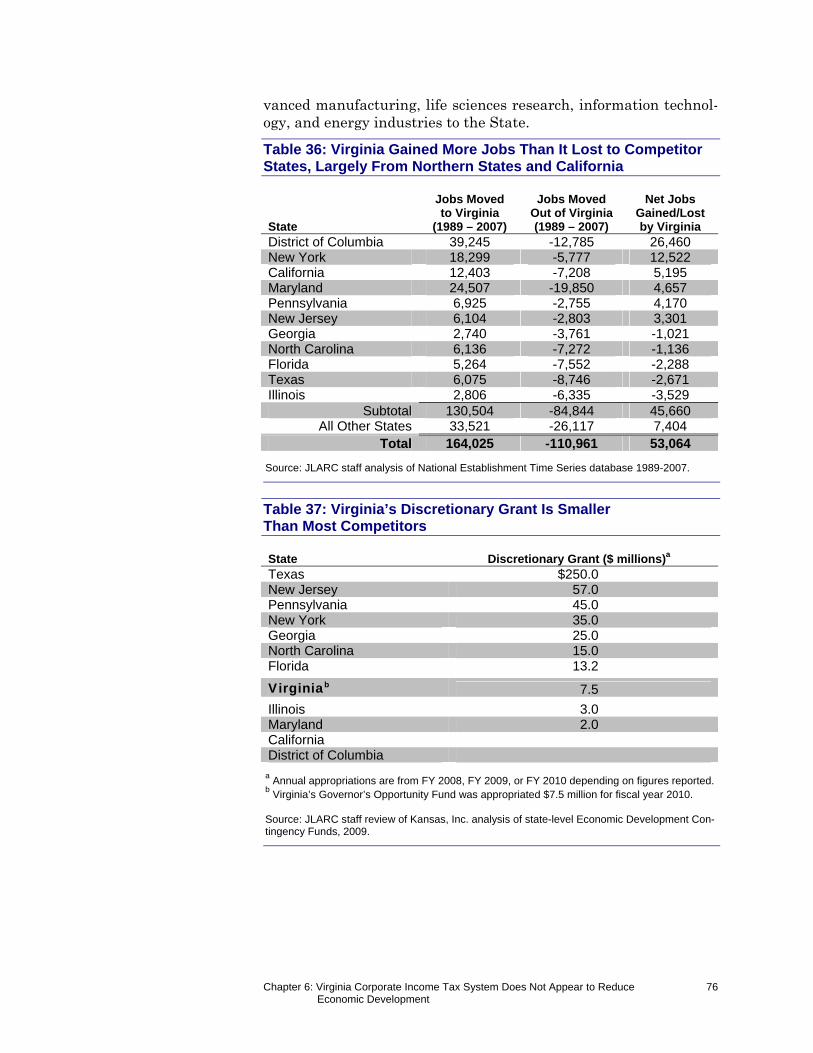
Chapter 6: Virginia Corporate Income Tax System Does Not Appear to Reduce 76 Economic Development
vanced manufacturing, life sciences research, information technol-ogy, and energy industries to the State.
Table 36: Virginia Gained More Jobs Than It Lost to Competitor States, Largely From Northern States and California
State
Jobs Moved to Virginia
(1989 – 2007)
Jobs Moved Out of Virginia (1989 – 2007)
Net Jobs Gained/Lost by Virginia
District of Columbia 39,245 -12,785 26,460 New York 18,299 -5,777 12,522 California 12,403 -7,208 5,195 Maryland 24,507 -19,850 4,657 Pennsylvania 6,925 -2,755 4,170 New Jersey 6,104 -2,803 3,301 Georgia 2,740 -3,761 -1,021 North Carolina 6,136 -7,272 -1,136 Florida 5,264 -7,552 -2,288 Texas 6,075 -8,746 -2,671 Illinois 2,806 -6,335 -3,529
Subtotal 130,504 -84,844 45,660 All Other States 33,521 -26,117 7,404
Total 164,025 -110,961 53,064
Source: JLARC staff analysis of National Establishment Time Series database 1989-2007.
Table 37: Virginia’s Discretionary Grant Is Smaller Than Most Competitors
State Discretionary Grant ($ millions)a
Texas $250.0 New Jersey 57.0 Pennsylvania 45.0 New York 35.0 Georgia 25.0 North Carolina 15.0 Florida 13.2
Virginiab 7.5
Illinois 3.0 Maryland 2.0 California District of Columbia
a Annual appropriations are from FY 2008, FY 2009, or FY 2010 depending on figures reported.
b Virginia’s Governor’s Opportunity Fund was appropriated $7.5 million for fiscal year 2010.
Source: JLARC staff review of Kansas, Inc. analysis of state-level Economic Development Con-tingency Funds, 2009.
Chapter 7: Targeted Changes Could Be Made to Improve Virginia’s Corporate Income Tax System
77
While the State’s corporate income tax (CIT) system could be im-proved in several areas, it does not appear to require a complete redesign. In fact, corporate representatives and business groups consistently indicated that Virginia’s system is no more complicat-ed than other states and in some cases is more favorable, with a low tax rate, generous nexus standard, and advantageous treat-ment of net operating losses and foreign income. However, corpora-tions expressed concerns over Virginia’s continued use of a “cost of performance” apportionment method for providers of services and intangible goods, and the limited scope and benefit of existing tax credits. It appears possible to address these and other concerns by adopting one or more of the targeted changes discussed in this chapter.
Although targeted changes may be easier to implement than major restructuring (Chapter 8), some trade-offs would likely be re-quired. Each option has potential advantages and disadvantages, which are discussed in light of four tax principles, including the potential impact (if one could be determined) on the State’s tax revenues.
Ch
apte
r
77
TTaarrggeetteedd CChhaannggeess CCoouulldd BBee MMaaddee ttoo IImmpprroovvee VViirrggiinniiaa’’ss CCoorrppoorraattee IInnccoommee TTaaxx SSyysstteemm
Although Virginia’s corporate income tax system is largely consistent with otherstates and is generally well regarded by corporations, several changes could be madeto improve its alignment with principles of sound tax policy. In particular, the Statecould adopt market-based apportionment so that sellers of intangible goods and ser-vices are taxed more equitably, and exercise its ability to tax out-of-state corpora-tions to the full extent permissible by federal law. In addition, the State could reviseits nexus standard and adopt concrete thresholds to determine which corporationsare taxable. Fewer filing formats could also be made available to affiliated corpora-tions. Moreover, the State could alter its apportionment methodology by changingthe design of its single sales factor method. Virginia could also expand or add certaintargeted tax credits and eliminate those that appear to be underutilized, whileadopting accountability mechanisms to improve credits’ effectiveness. While thesetargeted options could all improve aspects of the State’s corporate income tax sys-tem, they may impact State revenues and could present some disadvantages thatmust be weighed against potential benefits.
II nn SS
uumm
mmaa r
r yy
Chapter 7: Targeted Changes Could Be Made to Improve Virginia’s Corporate Income Tax System
78
TAX POLICY PRINCIPLES CAN BE USED TO EVALUATE OPTIONS
Several principles have been identified as integral components of a sound tax system, and are used to evaluate the potential ad-vantages and disadvantages of each option presented in this chap-ter. While the specific principles cited in the economics literature vary, they all reflect the same four basic concepts: tax systems should be simple to use and administer, equitable across taxpay-ers, reliable over time, and economically favorable for taxpayers and society as a whole. Because they epitomize the ideal tax sys-tem, these principles can also be used to evaluate the impact of proposed changes on the system. This approach is particularly helpful because the four principles are often at odds with one an-other, and it may not be feasible to fully achieve them all. For ex-ample, ensuring that a tax system is equitable generally requires differentiating between certain groups, which reduces simplicity. How best to balance these different considerations is a challenge faced by policymakers.
Simplicity
Greater simplicity in tax systems can result in lower costs for tax-payers and higher net revenues for governments. Tax structures that are simple make it easy for taxpayers to understand the rules and comply with them in a timely and accurate manner, which re-sults in lower costs of compliance among taxpayers and enforce-ment expenditures among tax agencies. A low cost of compliance may also act as an incentive for taxpayers to avoid intentional er-rors and to file their tax return, therefore increasing tax revenues for governments. In addition, rules that are clear and simple ena-ble taxpayers to understand the tax consequences of their actions, which can help avoid unforeseen changes in tax liability and re-duce the volatility of tax receipts.
Equitability
The principle of equitability refers to fairness between groups of taxpayers. Taxpayers who are in similar circumstances should have a similar tax liability, a concept known as horizontal equity. What constitutes “similar circumstances” is subjective and may be based on a variety of taxpayer characteristics. For example, two corporations may be of similar size but belong to different indus-tries, and may therefore not be universally considered “similar.” In addition, taxpayers with a greater ability to pay should have a larger tax liability in order to achieve vertical equity. How much more taxpayers should owe as their ability to pay increases is a policy decision.
Chapter 7: Targeted Changes Could Be Made to Improve Virginia’s Corporate Income Tax System
79
Reliability
The reliability of tax systems is predicated upon three components: certainty, stability, and sufficiency. Certainty means that changes to a tax system are limited in frequency but also in magnitude so that the liability of taxpayers is predictable from year to year. Sim-ilarly, stability implies that revenues generated by the tax system do not fluctuate unduly and allow state budgets to be consistently balanced. Lastly, tax systems should be structured to raise suffi-cient revenues to meet budgetary needs because the primary pur-pose of taxation is to fund essential public services. What consti-tutes a “sufficient” amount is determined by a state’s priorities and policies, which shape spending on public services and how they are funded.
Economic Favorability
A state’s tax system should not impede economic growth or hinder its ability to develop its economy. While economic theory prescribes that taxes should not be used to shape behavior, all states design their tax systems to support economic growth and avoid harming the financial health of businesses. In addition, states have an in-centive to adopt tax systems that are at least as favorable as those of other states in order to be perceived as a competitive business location. States may enhance their competitiveness by changing their tax rate or the availability of preferences for certain busi-nesses, for example. Tax systems that depart substantially from the norm may distort business decisions, and states should strive to balance competitiveness and neutrality in order to minimize in-efficiencies.
OPTION: ADOPT FACTOR PRESENCE NEXUS STANDARD
Virginia could consider adopting a factor presence nexus standard to improve the reliability, simplicity, and equitability of Virginia‘s CIT system. Factor presence creates a bright-line test for corpora-tions to use when determining whether they have a sufficient con-nection with the state to be taxable. This connection can be estab-lished if the corporation either has a substantial physical presence in a state (as evidenced by a certain level of property or payroll) or conducts a sufficient amount of economic activity (as measured by sales). Adopting a nexus standard based on factor presence could improve multiple aspects of Virginia’s CIT, although it could also result in modest revenue losses to the State. Table 39 summarizes the potential advantages and disadvantages of adopting factor presence.
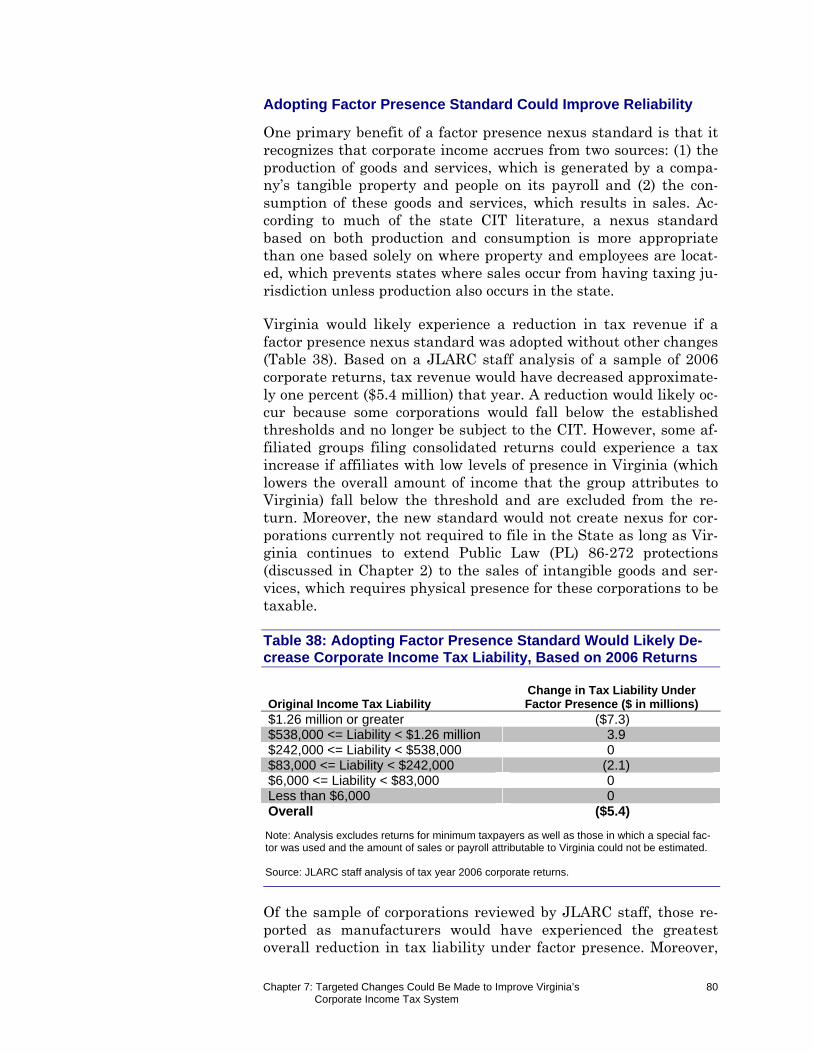
Chapter 7: Targeted Changes Could Be Made to Improve Virginia’s Corporate Income Tax System
80
Adopting Factor Presence Standard Could Improve Reliability
One primary benefit of a factor presence nexus standard is that it recognizes that corporate income accrues from two sources: (1) the production of goods and services, which is generated by a compa-ny’s tangible property and people on its payroll and (2) the con-sumption of these goods and services, which results in sales. Ac-cording to much of the state CIT literature, a nexus standard based on both production and consumption is more appropriate than one based solely on where property and employees are locat-ed, which prevents states where sales occur from having taxing ju-risdiction unless production also occurs in the state.
Virginia would likely experience a reduction in tax revenue if a factor presence nexus standard was adopted without other changes (Table 38). Based on a JLARC staff analysis of a sample of 2006 corporate returns, tax revenue would have decreased approximate-ly one percent ($5.4 million) that year. A reduction would likely oc-cur because some corporations would fall below the established thresholds and no longer be subject to the CIT. However, some af-filiated groups filing consolidated returns could experience a tax increase if affiliates with low levels of presence in Virginia (which lowers the overall amount of income that the group attributes to Virginia) fall below the threshold and are excluded from the re-turn. Moreover, the new standard would not create nexus for cor-porations currently not required to file in the State as long as Vir-ginia continues to extend Public Law (PL) 86-272 protections (discussed in Chapter 2) to the sales of intangible goods and ser-vices, which requires physical presence for these corporations to be taxable.
Table 38: Adopting Factor Presence Standard Would Likely De-crease Corporate Income Tax Liability, Based on 2006 Returns
Original Income Tax Liability Change in Tax Liability Under Factor Presence ($ in millions)
$1.26 million or greater ($7.3) $538,000 <= Liability < $1.26 million 3.9 $242,000 <= Liability < $538,000 0 $83,000 <= Liability < $242,000 (2.1) $6,000 <= Liability < $83,000 0 Less than $6,000 0 Overall ($5.4)
Note: Analysis excludes returns for minimum taxpayers as well as those in which a special fac-tor was used and the amount of sales or payroll attributable to Virginia could not be estimated. Source: JLARC staff analysis of tax year 2006 corporate returns.
Of the sample of corporations reviewed by JLARC staff, those re-ported as manufacturers would have experienced the greatest overall reduction in tax liability under factor presence. Moreover,
Chapter 7: Targeted Changes Could Be Made to Improve Virginia’s Corporate Income Tax System
81
tax revenue from the income of pass-through entities (PTEs) would also likely decline because PTEs are governed by similar nexus rules as corporations. JLARC staff estimated that taxes paid on PTE income earned by individual PTE owners would have been reduced by less than one percent ($10 million) in 2006.
However, a factor presence standard adopted by Virginia could be superseded if the federal Business Activity Tax and Simplification Act (BATSA) legislation is enacted. This federal legislation would essentially extend PL 86-272 protections to all activities, similar to Virginia’s current policy, conducted by corporations that had no physical presence, or only a minimal presence, in a state. While BATSA legislation has been before Congress for several years and has yet to be passed, corporate representatives interviewed by JLARC staff indicated that they would support its passage.
Adopting Factor Presence Standard Could Increase Simplicity
Another benefit of the factor presence standard is that it provides objective criteria for determining nexus. During interviews, corpo-rate staff expressed concern that absent a bright line, states might tax corporations with only a slight amount of activity in the state. However, they agreed that a factor presence standard would pre-vent states from overreaching their taxing authority because only those corporations with property, payroll, or sales over a minimum threshold could be taxed in the state. In addition, almost 40 per-cent of businesses that responded to a JLARC staff survey indicat-ed they supported adopting bright-line thresholds for the mini-mum levels of property, payroll, or sales needed to constitute nexus in Virginia. The State could obtain input from the business community to ensure that reasonable thresholds are adopted.
Furthermore, adopting a bright-line standard could provide clarity for businesses and potentially reduce the administrative burden of the Virginia Department of Taxation (TAX) if certain changes to Virginia’s CIT structure are made. According to TAX, taxpayers do not frequently request Commissioner rulings related to nexus, but adopting a bright-line threshold could clarify “nebulous” language. In particular, financial accounting standards require businesses to determine and report on uncertain tax positions, including wheth-er a business has nexus and should file a tax return in a state. Having a clearer nexus standard, such as a bright-line test, could significantly reduce the number of uncertain tax positions that companies cite related to having nexus in Virginia. Finally, while adopting a bright-line nexus standard would require TAX to prom-ulgate new regulations, it could use model statutes or those adopt-ed by other states as guidelines.
Financial Accounting Standards Board Interpretation Num-ber 48 (FIN 48)
FIN 48 directs busi-nesses on how to de-termine, evaluate, and disclose uncertain tax positions within their financial statements. The information report-ed under FIN 48 can assist authorities that examine tax returns by pointing out areas that may need further in-quiry. FIN 48 can also lead to the taxing au-thority clarifying certain positions for the busi-ness.
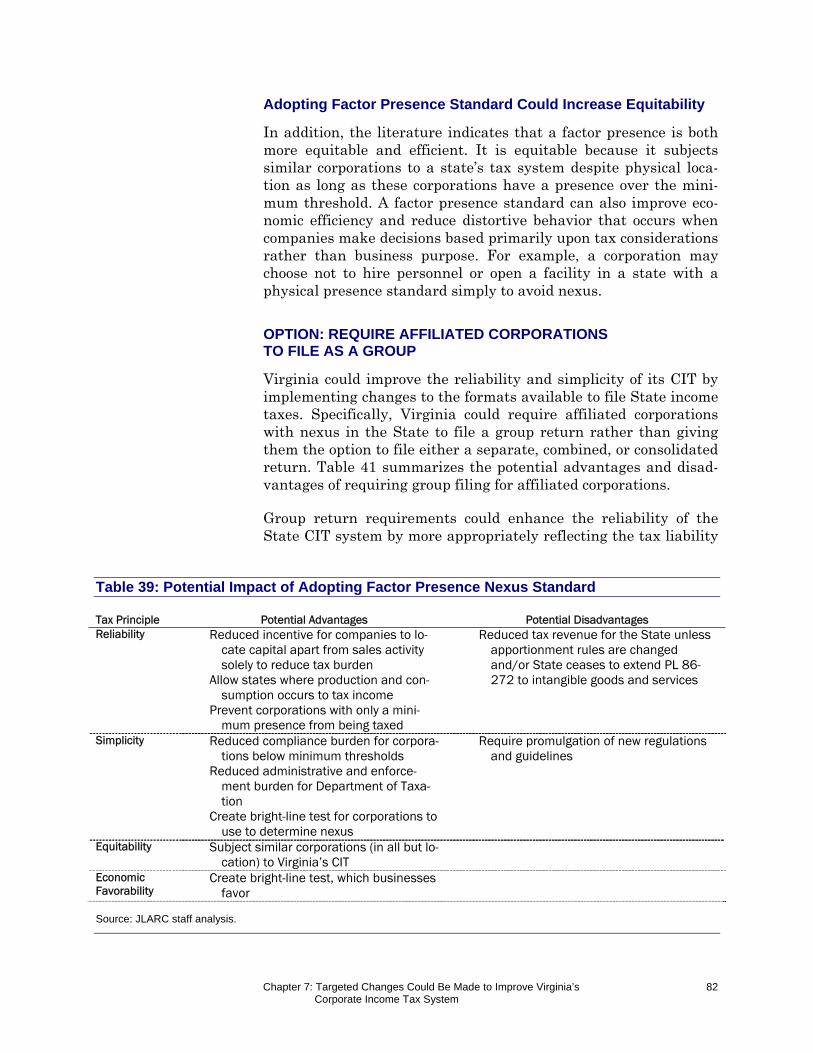
Chapter 7: Targeted Changes Could Be Made to Improve Virginia’s Corporate Income Tax System
82
Adopting Factor Presence Standard Could Increase Equitability
In addition, the literature indicates that a factor presence is both more equitable and efficient. It is equitable because it subjects similar corporations to a state’s tax system despite physical loca-tion as long as these corporations have a presence over the mini-mum threshold. A factor presence standard can also improve eco-nomic efficiency and reduce distortive behavior that occurs when companies make decisions based primarily upon tax considerations rather than business purpose. For example, a corporation may choose not to hire personnel or open a facility in a state with a physical presence standard simply to avoid nexus.
OPTION: REQUIRE AFFILIATED CORPORATIONS TO FILE AS A GROUP
Virginia could improve the reliability and simplicity of its CIT by implementing changes to the formats available to file State income taxes. Specifically, Virginia could require affiliated corporations with nexus in the State to file a group return rather than giving them the option to file either a separate, combined, or consolidated return. Table 41 summarizes the potential advantages and disad-vantages of requiring group filing for affiliated corporations.
Group return requirements could enhance the reliability of the State CIT system by more appropriately reflecting the tax liability
Table 39: Potential Impact of Adopting Factor Presence Nexus Standard Tax Principle Potential Advantages Potential Disadvantages Reliability Reduced incentive for companies to lo-
cate capital apart from sales activity solely to reduce tax burden
Allow states where production and con-sumption occurs to tax income
Prevent corporations with only a mini-mum presence from being taxed
Reduced tax revenue for the State unless apportionment rules are changed and/or State ceases to extend PL 86-272 to intangible goods and services
Simplicity Reduced compliance burden for corpora-tions below minimum thresholds
Reduced administrative and enforce-ment burden for Department of Taxa-tion
Create bright-line test for corporations to use to determine nexus
Require promulgation of new regulations and guidelines
Equitability Subject similar corporations (in all but lo-cation) to Virginia’s CIT
Economic Favorability
Create bright-line test, which businesses favor
Source: JLARC staff analysis.
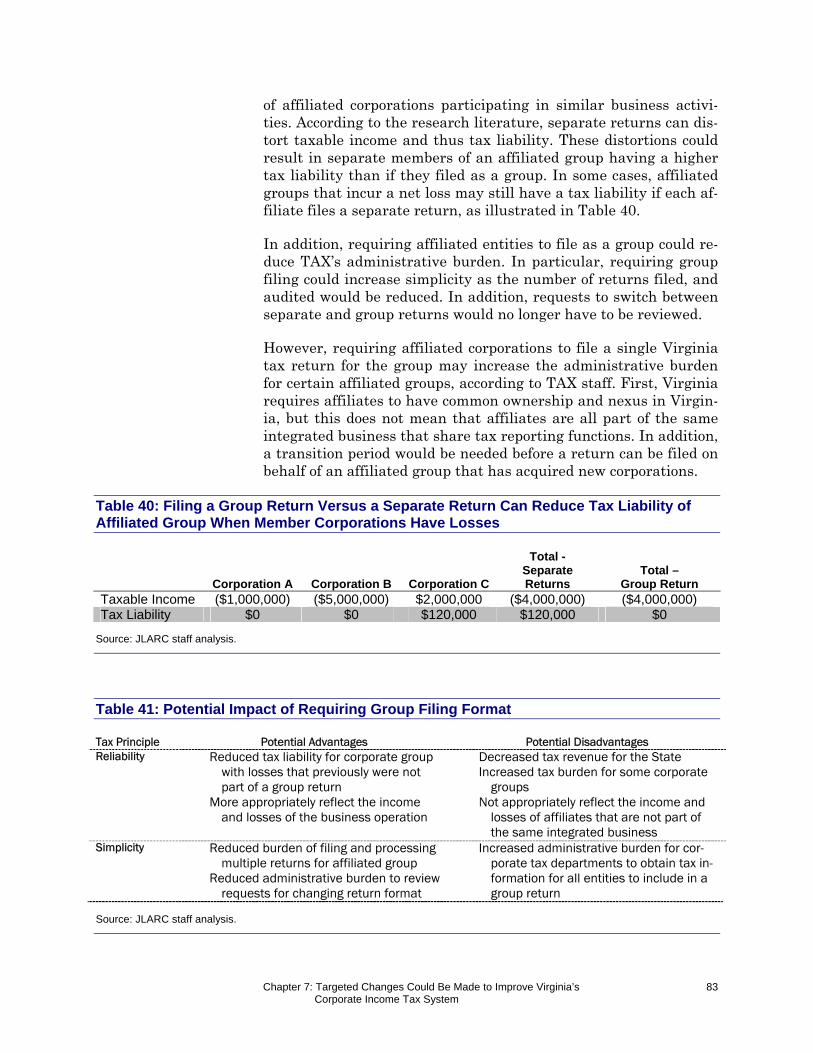
Chapter 7: Targeted Changes Could Be Made to Improve Virginia’s Corporate Income Tax System
83
of affiliated corporations participating in similar business activi-ties. According to the research literature, separate returns can dis-tort taxable income and thus tax liability. These distortions could result in separate members of an affiliated group having a higher tax liability than if they filed as a group. In some cases, affiliated groups that incur a net loss may still have a tax liability if each af-filiate files a separate return, as illustrated in Table 40.
In addition, requiring affiliated entities to file as a group could re-duce TAX’s administrative burden. In particular, requiring group filing could increase simplicity as the number of returns filed, and audited would be reduced. In addition, requests to switch between separate and group returns would no longer have to be reviewed.
However, requiring affiliated corporations to file a single Virginia tax return for the group may increase the administrative burden for certain affiliated groups, according to TAX staff. First, Virginia requires affiliates to have common ownership and nexus in Virgin-ia, but this does not mean that affiliates are all part of the same integrated business that share tax reporting functions. In addition, a transition period would be needed before a return can be filed on behalf of an affiliated group that has acquired new corporations.
Table 40: Filing a Group Return Versus a Separate Return Can Reduce Tax Liability of Affiliated Group When Member Corporations Have Losses
Corporation A Corporation B Corporation C
Total - Separate Returns
Total – Group Return
Taxable Income ($1,000,000) ($5,000,000) $2,000,000 ($4,000,000) ($4,000,000) Tax Liability $0 $0 $120,000 $120,000 $0
Source: JLARC staff analysis.
Table 41: Potential Impact of Requiring Group Filing Format Tax Principle Potential Advantages Potential Disadvantages Reliability Reduced tax liability for corporate group
with losses that previously were not part of a group return
More appropriately reflect the income and losses of the business operation
Decreased tax revenue for the State Increased tax burden for some corporate
groups Not appropriately reflect the income and
losses of affiliates that are not part of the same integrated business
Simplicity Reduced burden of filing and processing multiple returns for affiliated group
Reduced administrative burden to review requests for changing return format
Increased administrative burden for cor-porate tax departments to obtain tax in-formation for all entities to include in a group return
Source: JLARC staff analysis.
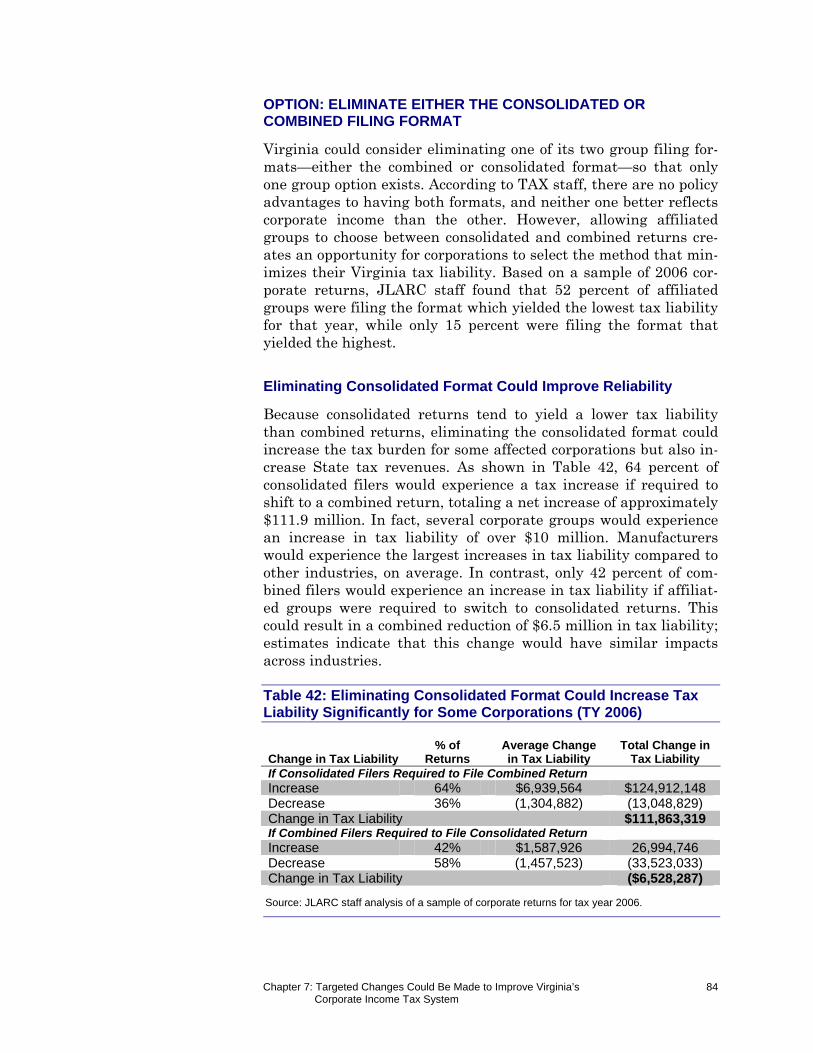
Chapter 7: Targeted Changes Could Be Made to Improve Virginia’s Corporate Income Tax System
84
OPTION: ELIMINATE EITHER THE CONSOLIDATED OR COMBINED FILING FORMAT
Virginia could consider eliminating one of its two group filing for-mats—either the combined or consolidated format—so that only one group option exists. According to TAX staff, there are no policy advantages to having both formats, and neither one better reflects corporate income than the other. However, allowing affiliated groups to choose between consolidated and combined returns cre-ates an opportunity for corporations to select the method that min-imizes their Virginia tax liability. Based on a sample of 2006 cor-porate returns, JLARC staff found that 52 percent of affiliated groups were filing the format which yielded the lowest tax liability for that year, while only 15 percent were filing the format that yielded the highest.
Eliminating Consolidated Format Could Improve Reliability
Because consolidated returns tend to yield a lower tax liability than combined returns, eliminating the consolidated format could increase the tax burden for some affected corporations but also in-crease State tax revenues. As shown in Table 42, 64 percent of consolidated filers would experience a tax increase if required to shift to a combined return, totaling a net increase of approximately $111.9 million. In fact, several corporate groups would experience an increase in tax liability of over $10 million. Manufacturers would experience the largest increases in tax liability compared to other industries, on average. In contrast, only 42 percent of com-bined filers would experience an increase in tax liability if affiliat-ed groups were required to switch to consolidated returns. This could result in a combined reduction of $6.5 million in tax liability; estimates indicate that this change would have similar impacts across industries.
Table 42: Eliminating Consolidated Format Could Increase Tax Liability Significantly for Some Corporations (TY 2006)
Change in Tax Liability % of
Returns Average Change in Tax Liability
Total Change in Tax Liability
If Consolidated Filers Required to File Combined Return Increase 64% $6,939,564 $124,912,148 Decrease 36% (1,304,882) (13,048,829) Change in Tax Liability $111,863,319 If Combined Filers Required to File Consolidated Return Increase 42% $1,587,926 26,994,746 Decrease 58% (1,457,523) (33,523,033) Change in Tax Liability ($6,528,287)
Source: JLARC staff analysis of a sample of corporate returns for tax year 2006.
Chapter 7: Targeted Changes Could Be Made to Improve Virginia’s Corporate Income Tax System
85
Eliminating Combined Format Could Improve Simplicity
While eliminating the combined format would likely reduce tax revenue, this change would increase the simplicity of Virginia’s CIT system. According to TAX staff, calculating net operating loss-es in a combined return is very complex, but this calculation is much simpler in a consolidated return. However, filing a consoli-dated return may be complex for groups in which affiliates use special apportionment formulas in addition to the standard three-factor formula. Moreover, manufacturers may not support allowing only consolidated returns because those wishing to use single sales factor apportionment would still have to calculate property and payroll factors to be included in a return if other affiliates use the standard three-factor formula.
OPTION: ALTER OR EXPAND IMPLEMENTATION OF SINGLE SALES FACTOR METHODOLOGY
Virginia could make several changes to the way taxable income is attributed to the State. For example, the single sales factor (SSF) methodology adopted in 2009 could be made a more effective eco-nomic development tool by changing its performance measures. Requiring corporations to use this methodology rather than mak-ing it optional could also simplify the tax system and increase rev-enues. However, this action could increase the tax liability of many manufacturers. Extending this methodology to all industries could also be more equitable and easier from an administration and compliance standpoint, but would likely reduce State revenues significantly.
The effectiveness of SSF apportionment as an economic develop-ment tool has been extensively debated in Virginia, and the State has made an informed decision to use this methodology. Therefore, the merits of this approach are not revisited in this section. Fur-ther, this methodology appears to be a new trend in state appor-tionment as shown in Chapter 4. By using methods consistent with other states, Virginia may reduce the potential for income shifting to states that use more favorable rules and also ensure that its CIT structure is not viewed as a detriment to corporations’ location de-cisions.
Altering SSF Methodology by Changing Penalty Calculation Could Improve Economic Favorability
Changing the calculation of penalties faced by manufacturers that use Virginia’s SSF methodology but are unable to maintain base-line employment levels could benefit the State economy by mitigat-ing job losses. As shown in Chapter 1, the manufacturing sector has experienced the greatest job losses during the past two dec-
Chapter 7: Targeted Changes Could Be Made to Improve Virginia’s Corporate Income Tax System
86
ades. While the recent adoption of an SSF methodology was in-tended to slow the decline of manufacturing employment in the State, representatives of Virginia’s manufacturing sector consist-ently indicated that requiring them to maintain or increase em-ployment levels is inconsistent with the declining nature of their industry.
As described in Chapter 4, corporations that opt to use the SSF method must maintain baseline employment and wage levels or face having to pay back the tax liability they would have incurred under the standard apportionment formula, in addition to a ten percent penalty. Most manufacturers interviewed reported being unlikely to use the optional SSF method because they could not predict future economic conditions and employment levels with enough certainty to warrant incurring a potential ten percent pen-alty. If it is not widely utilized, the SSF methodology is unlikely to have any material impact on manufacturing employment or to act as an incentive for manufacturers to locate in Virginia. Further, no other state appears to include performance measures or penalties in their SSF statute.
To hold manufacturing companies accountable for minimizing job losses in the State while offering a tax incentive to do so, Virginia could prorate the amount to be repaid based on the decrease in employment relative to the baseline. This concept is currently ap-plied in the State’s Coalfield Employment Enhancement tax credit, which is intended to stabilize the number of coal-related jobs. Ra-ther than availing this credit only to companies that maintain or increase employment levels, the amount of the credit is simply prorated based on each company’s employment factor, which is the ratio of jobs in the current year to jobs in the baseline year. This option would most likely have little if any fiscal impact because projected CIT revenues currently assume that all manufacturers will opt to use the SSF methodology if it reduces their tax liability in the short-term, regardless of the potential for penalties.
Making SSF Methodology Mandatory Could Increase Simplicity but Decrease Economic Favorability
Requiring the use of the SSF methodology could simplify the CIT system and mitigate revenue losses, but this action could also neg-atively affect many corporations and reduce its utility as an eco-nomic development tool. According to interviews with corporate representatives and TAX staff, the State’s SSF method was made optional so that corporations would not be negatively affected by the shift. In particular, TAX found that the mandatory use of SSF would benefit multistate corporations with a large Virginia pres-ence, while many manufacturers would face a higher State tax lia-bility.
Chapter 7: Targeted Changes Could Be Made to Improve Virginia’s Corporate Income Tax System
87
However, making the SSF methodology optional has further com-plicated the CIT system, which TAX must continue to review mul-tiple apportionment methodologies, and for manufacturing corpo-rations that must calculate their tax liability using two methods before determining which is more advantageous. In addition, mak-ing the SSF method mandatory could mitigate the reduction in tax revenue expected once SSF is in effect in 2011. Based on a JLARC staff analysis of 2006 tax returns, mandating the use of SSF meth-odology could reduce the State’s revenue loss in half ($33 million in 2006). As discussed in Chapter 4, few states give corporations the option to use SSF apportionment.
Expanding SSF Availability to All Corporations Could Improve Equitability and Simplicity, but Could Reduce State Revenues
Limiting the adoption of an SSF methodology to manufacturers was a means to help one of the State’s most struggling industries while limiting tax revenue decreases, according to TAX and corpo-rate representatives. Further, manufacturers appear to be paying a larger share of the State’s corporate income taxes than their eco-nomic activity would suggest, as discussed in Chapter 1.
This policy has raised equitability issues for other industries be-cause they cannot utilize a methodology that could reduce their CIT liability. As described in Chapter 4, most states that have adopted the SSF method have done so for all industries. Applying the same methodology for all industries could be simpler for the State and corporations alike, especially when they participate in manufacturing as well as other activities.
This option could have a significant negative effect on State reve-nues. Based on an analysis of a sample of 2006 tax returns, ex-tending the optional SSF methodology to all industries other than manufacturing would have reduced CIT collections by 13 percent annually ($76 million in 2006). In addition, because corporate ap-portionment methods also apply to PTEs, taxes collected through the individual income tax system would have also decreased by $8 million in 2006, based on an extrapolation of corporate returns. To limit the impact of this option on State revenue, it could be imple-mented solely for corporations, although this approach would cre-ate inequities.
OPTION: ADOPT MARKET-BASED SOURCING FOR SALES OF INTANGIBLE GOODS AND SERVICES
Adopting market-based sourcing in Virginia could improve multi-ple facets of the State’s CIT system, primarily equitability. This change could also improve the reliability of the CIT system, but the impact would be limited unless the State also ended its volun-
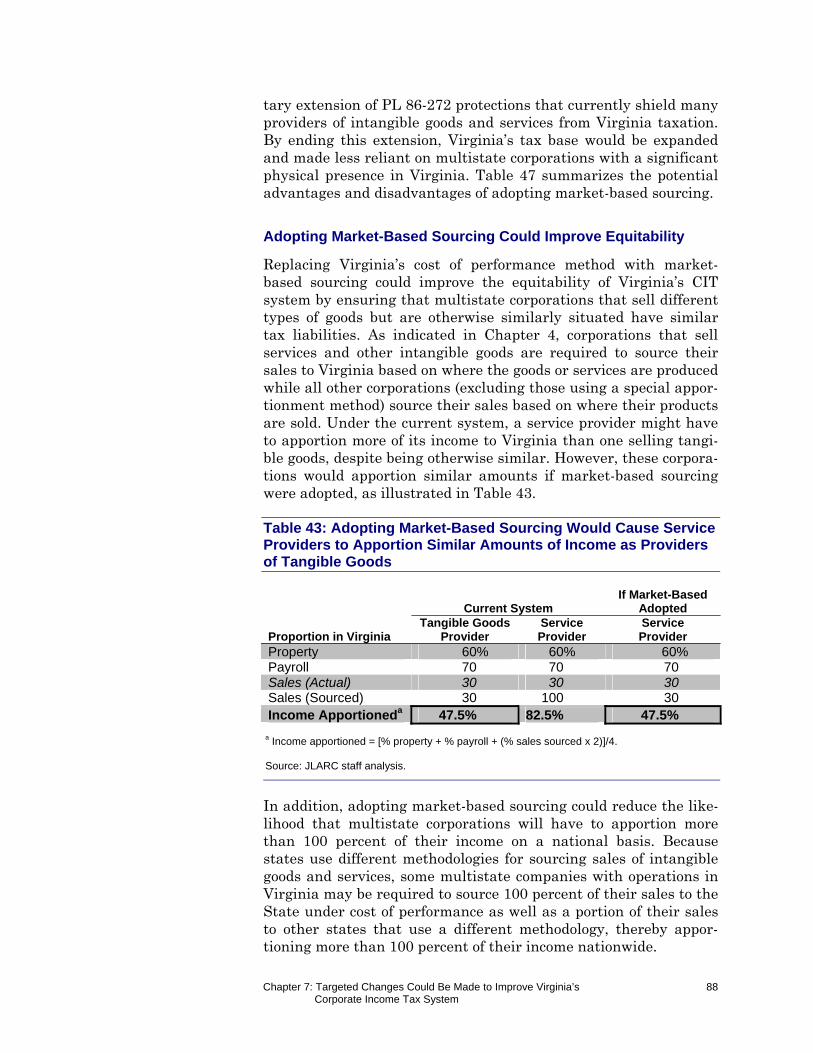
Chapter 7: Targeted Changes Could Be Made to Improve Virginia’s Corporate Income Tax System
88
tary extension of PL 86-272 protections that currently shield many providers of intangible goods and services from Virginia taxation. By ending this extension, Virginia’s tax base would be expanded and made less reliant on multistate corporations with a significant physical presence in Virginia. Table 47 summarizes the potential advantages and disadvantages of adopting market-based sourcing.
Adopting Market-Based Sourcing Could Improve Equitability
Replacing Virginia’s cost of performance method with market-based sourcing could improve the equitability of Virginia’s CIT system by ensuring that multistate corporations that sell different types of goods but are otherwise similarly situated have similar tax liabilities. As indicated in Chapter 4, corporations that sell services and other intangible goods are required to source their sales to Virginia based on where the goods or services are produced while all other corporations (excluding those using a special appor-tionment method) source their sales based on where their products are sold. Under the current system, a service provider might have to apportion more of its income to Virginia than one selling tangi-ble goods, despite being otherwise similar. However, these corpora-tions would apportion similar amounts if market-based sourcing were adopted, as illustrated in Table 43.
Table 43: Adopting Market-Based Sourcing Would Cause Service Providers to Apportion Similar Amounts of Income as Providers of Tangible Goods
Proportion in Virginia
Current System If Market-Based
Adopted Tangible Goods
Provider Service Provider
Service Provider
Property 60% 60% 60%Payroll 70 70 70Sales (Actual) 30 30 30Sales (Sourced) 30 100 30 Income Apportioneda 47.5% 82.5% 47.5%
a Income apportioned = [% property + % payroll + (% sales sourced x 2)]/4. Source: JLARC staff analysis.
In addition, adopting market-based sourcing could reduce the like-lihood that multistate corporations will have to apportion more than 100 percent of their income on a national basis. Because states use different methodologies for sourcing sales of intangible goods and services, some multistate companies with operations in Virginia may be required to source 100 percent of their sales to the State under cost of performance as well as a portion of their sales to other states that use a different methodology, thereby appor-tioning more than 100 percent of their income nationwide.
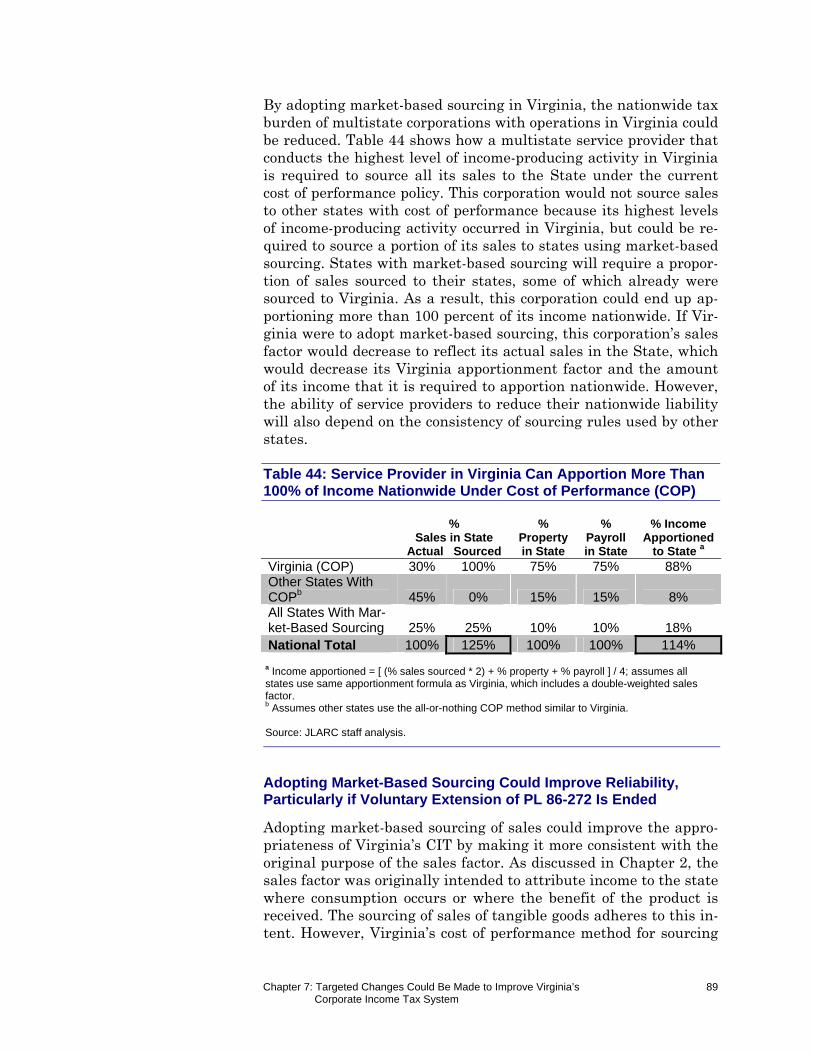
Chapter 7: Targeted Changes Could Be Made to Improve Virginia’s Corporate Income Tax System
89
By adopting market-based sourcing in Virginia, the nationwide tax burden of multistate corporations with operations in Virginia could be reduced. Table 44 shows how a multistate service provider that conducts the highest level of income-producing activity in Virginia is required to source all its sales to the State under the current cost of performance policy. This corporation would not source sales to other states with cost of performance because its highest levels of income-producing activity occurred in Virginia, but could be re-quired to source a portion of its sales to states using market-based sourcing. States with market-based sourcing will require a propor-tion of sales sourced to their states, some of which already were sourced to Virginia. As a result, this corporation could end up ap-portioning more than 100 percent of its income nationwide. If Vir-ginia were to adopt market-based sourcing, this corporation’s sales factor would decrease to reflect its actual sales in the State, which would decrease its Virginia apportionment factor and the amount of its income that it is required to apportion nationwide. However, the ability of service providers to reduce their nationwide liability will also depend on the consistency of sourcing rules used by other states.
Table 44: Service Provider in Virginia Can Apportion More Than 100% of Income Nationwide Under Cost of Performance (COP)
% Sales in State
Actual Sourced
% Property in State
% Payroll in State
% Income Apportioned
to State a Virginia (COP) 30% 100% 75% 75% 88% Other States With COPb 45% 0% 15% 15% 8% All States With Mar-ket-Based Sourcing 25% 25% 10% 10% 18% National Total 100% 125% 100% 100% 114%
a Income apportioned = [ (% sales sourced * 2) + % property + % payroll ] / 4; assumes all states use same apportionment formula as Virginia, which includes a double-weighted sales factor. b Assumes other states use the all-or-nothing COP method similar to Virginia. Source: JLARC staff analysis.
Adopting Market-Based Sourcing Could Improve Reliability, Particularly if Voluntary Extension of PL 86-272 Is Ended
Adopting market-based sourcing of sales could improve the appro-priateness of Virginia’s CIT by making it more consistent with the original purpose of the sales factor. As discussed in Chapter 2, the sales factor was originally intended to attribute income to the state where consumption occurs or where the benefit of the product is received. The sourcing of sales of tangible goods adheres to this in-tent. However, Virginia’s cost of performance method for sourcing
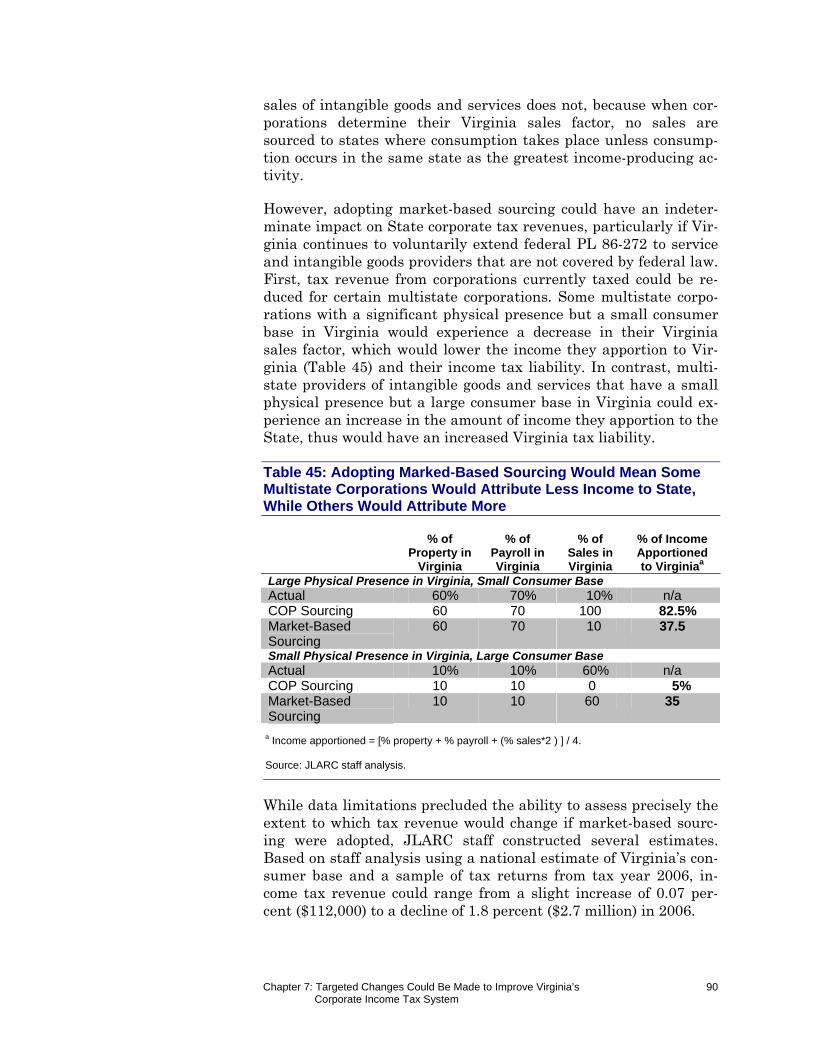
Chapter 7: Targeted Changes Could Be Made to Improve Virginia’s Corporate Income Tax System
90
sales of intangible goods and services does not, because when cor-porations determine their Virginia sales factor, no sales are sourced to states where consumption takes place unless consump-tion occurs in the same state as the greatest income-producing ac-tivity.
However, adopting market-based sourcing could have an indeter-minate impact on State corporate tax revenues, particularly if Vir-ginia continues to voluntarily extend federal PL 86-272 to service and intangible goods providers that are not covered by federal law. First, tax revenue from corporations currently taxed could be re-duced for certain multistate corporations. Some multistate corpo-rations with a significant physical presence but a small consumer base in Virginia would experience a decrease in their Virginia sales factor, which would lower the income they apportion to Vir-ginia (Table 45) and their income tax liability. In contrast, multi-state providers of intangible goods and services that have a small physical presence but a large consumer base in Virginia could ex-perience an increase in the amount of income they apportion to the State, thus would have an increased Virginia tax liability.
Table 45: Adopting Marked-Based Sourcing Would Mean Some Multistate Corporations Would Attribute Less Income to State, While Others Would Attribute More
% of Property in
Virginia
% of Payroll in Virginia
% of Sales in Virginia
% of Income Apportioned to Virginiaa
Large Physical Presence in Virginia, Small Consumer Base Actual 60% 70% 10% n/a COP Sourcing 60 70 100 82.5% Market-Based Sourcing
60 70 10 37.5
Small Physical Presence in Virginia, Large Consumer Base Actual 10% 10% 60% n/a COP Sourcing 10 10 0 5% Market-Based Sourcing
10 10 60 35
a Income apportioned = [% property + % payroll + (% sales*2 ) ] / 4. Source: JLARC staff analysis.
While data limitations precluded the ability to assess precisely the extent to which tax revenue would change if market-based sourc-ing were adopted, JLARC staff constructed several estimates. Based on staff analysis using a national estimate of Virginia’s con-sumer base and a sample of tax returns from tax year 2006, in-come tax revenue could range from a slight increase of 0.07 per-cent ($112,000) to a decline of 1.8 percent ($2.7 million) in 2006.
Chapter 7: Targeted Changes Could Be Made to Improve Virginia’s Corporate Income Tax System
91
Second, under current rules only a limited number of additional corporations could become subject to Virginia’s CIT. Corporations in this group would include those that license franchises or other intangibles but have no other physical presence in the State. These corporations currently have nexus in the State and would likely have a positive sales factor if market-based sourcing were adopted, which would mean they have income from Virginia sources and are subject to tax. However, no data is available to determine how large this group of corporations might be, or the tax revenue they would generate.
The number of corporations that have nexus and are subject to Virginia income tax could significantly increase if the State also ended its policy of extending PL 86-272 to the solicitation of intan-gible goods and services. Virginia is only required by federal law to uphold PL 86-272 protections for activities involving the sale of tangible personal property, and changing this policy would allow Virginia to tax out-of-state corporations to the full extent permis-sible by federal law. While the policy was adopted so that the same rules applied to all types of solicitation activities, it may create other types of inequities and distort business behavior. For exam-ple, the physical presence requirement of PL 86-272 discriminates against smaller businesses located in Virginia and favors larger out-of-state companies that have a greater ability to minimize their tax liability based on where they locate property and employ-ees. Moreover, the physical presence standards inherent in PL 86-272 may also create an incentive for corporations not to locate property or employees in Virginia solely to avoid paying income taxes in the State.
Over time, Virginia could collect up to $248.7 million more per year in corporate income taxes from out-of-state providers of ser-vices and intangible goods if market-based sourcing was in place and the State’s optional extension of PL 86-272 protections was discontinued, according to a JLARC staff analysis (Table 46). This estimate reflects the maximum amount of additional tax revenue that Virginia could collect annually once the new policy is fully phased-in, assuming the same level of corporate profits as in 2006 and full taxpayer compliance. However, it is unknown to what ex-tent taxpayers are likely to comply. While corporations that are positively impacted by the new policy will likely adopt it immedi-ately, corporations facing higher taxes may file appeals or law-suits, or refuse to pay. Full compliance may not be achieved for several years or at all, depending upon the timing and outcome of appeals and legal action. In addition, corporations may design and adopt new tax planning strategies to mitigate the negative fiscal impact of the proposed policy change. Lastly, due to data limita-tions, it was not possible to separate the amount of federal or Vir-ginia income generated by sales of tangible goods (which are pro-
Once the policy is fully phased-in, Vir-ginia could collect up to $248.7 million more per year in cor-porate income taxes from out-of-state providers of services and intangible goods if market-based sourcing was in place and the State’s op-tional extension of PL 86-272 protections was discontinued, assuming the same level of corporate profits as in 2006 and full taxpayer compli-ance.
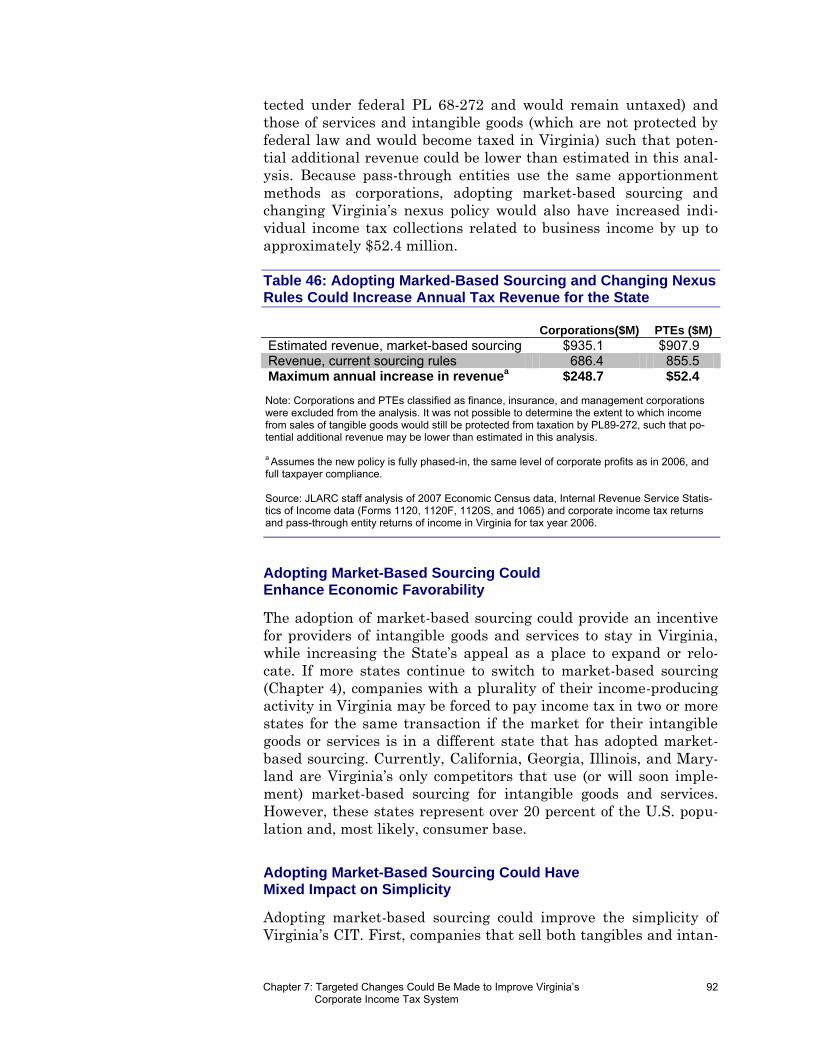
Chapter 7: Targeted Changes Could Be Made to Improve Virginia’s Corporate Income Tax System
92
tected under federal PL 68-272 and would remain untaxed) and
those of services and intangible goods (which are not protected by
federal law and would become taxed in Virginia) such that poten-
tial additional revenue could be lower than estimated in this anal-
ysis. Because pass-through entities use the same apportionment
methods as corporations, adopting market-based sourcing and
changing Virginia’s nexus policy would also have increased indi-
vidual income tax collections related to business income by up to
approximately $52.4 million.
Table 46: Adopting Marked-Based Sourcing and Changing Nexus Rules Could Increase Annual Tax Revenue for the State
Corporations($M) PTEs ($M)
Estimated revenue, market-based sourcing $935.1 $907.9 Revenue, current sourcing rules 686.4 855.5 Maximum annual increase in revenue
a $248.7 $52.4
Note: Corporations and PTEs classified as finance, insurance, and management corporations were excluded from the analysis. It was not possible to determine the extent to which income from sales of tangible goods would still be protected from taxation by PL89-272, such that po-tential additional revenue may be lower than estimated in this analysis. a Assumes the new policy is fully phased-in, the same level of corporate profits as in 2006, and full taxpayer compliance. Source: JLARC staff analysis of 2007 Economic Census data, Internal Revenue Service Statis-tics of Income data (Forms 1120, 1120F, 1120S, and 1065) and corporate income tax returns and pass-through entity returns of income in Virginia for tax year 2006.
Adopting Market-Based Sourcing Could Enhance Economic Favorability
The adoption of market-based sourcing could provide an incentive
for providers of intangible goods and services to stay in Virginia,
while increasing the State’s appeal as a place to expand or relo-
cate. If more states continue to switch to market-based sourcing
(Chapter 4), companies with a plurality of their income-producing
activity in Virginia may be forced to pay income tax in two or more
states for the same transaction if the market for their intangible
goods or services is in a different state that has adopted market-
based sourcing. Currently, California, Georgia, Illinois, and Mary-
land are Virginia’s only competitors that use (or will soon imple-
ment) market-based sourcing for intangible goods and services.
However, these states represent over 20 percent of the U.S. popu-
lation and, most likely, consumer base.
Adopting Market-Based Sourcing Could Have Mixed Impact on Simplicity
Adopting market-based sourcing could improve the simplicity of
Virginia’s CIT. First, companies that sell both tangibles and intan-
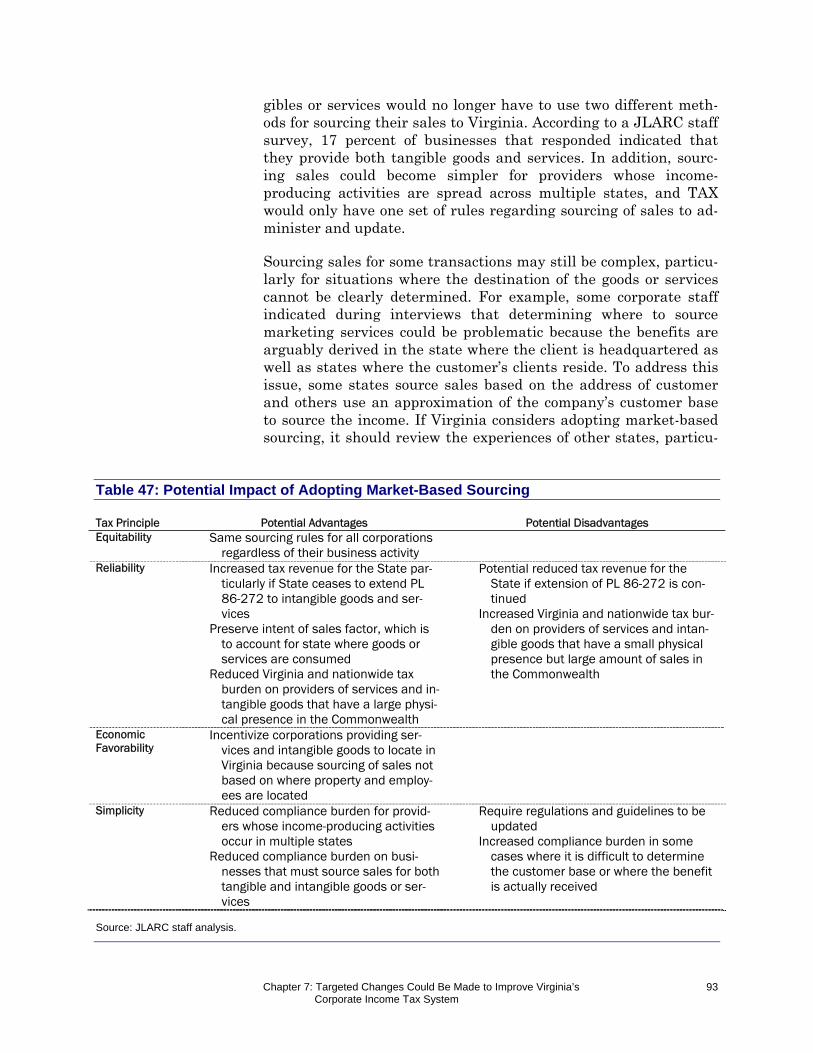
Chapter 7: Targeted Changes Could Be Made to Improve Virginia’s Corporate Income Tax System
93
gibles or services would no longer have to use two different meth-ods for sourcing their sales to Virginia. According to a JLARC staff survey, 17 percent of businesses that responded indicated that they provide both tangible goods and services. In addition, sourc-ing sales could become simpler for providers whose income-producing activities are spread across multiple states, and TAX would only have one set of rules regarding sourcing of sales to ad-minister and update.
Sourcing sales for some transactions may still be complex, particu-larly for situations where the destination of the goods or services cannot be clearly determined. For example, some corporate staff indicated during interviews that determining where to source marketing services could be problematic because the benefits are arguably derived in the state where the client is headquartered as well as states where the customer’s clients reside. To address this issue, some states source sales based on the address of customer and others use an approximation of the company’s customer base to source the income. If Virginia considers adopting market-based sourcing, it should review the experiences of other states, particu-
Table 47: Potential Impact of Adopting Market-Based Sourcing Tax Principle Potential Advantages Potential Disadvantages Equitability Same sourcing rules for all corporations
regardless of their business activity
Reliability Increased tax revenue for the State par-ticularly if State ceases to extend PL 86-272 to intangible goods and ser-vices
Preserve intent of sales factor, which is to account for state where goods or services are consumed
Reduced Virginia and nationwide tax burden on providers of services and in-tangible goods that have a large physi-cal presence in the Commonwealth
Potential reduced tax revenue for the State if extension of PL 86-272 is con-tinued
Increased Virginia and nationwide tax bur-den on providers of services and intan-gible goods that have a small physical presence but large amount of sales in the Commonwealth
Economic Favorability
Incentivize corporations providing ser-vices and intangible goods to locate in Virginia because sourcing of sales not based on where property and employ-ees are located
Simplicity Reduced compliance burden for provid-ers whose income-producing activities occur in multiple states
Reduced compliance burden on busi-nesses that must source sales for both tangible and intangible goods or ser-vices
Require regulations and guidelines to be updated
Increased compliance burden in some cases where it is difficult to determine the customer base or where the benefit is actually received
Source: JLARC staff analysis.
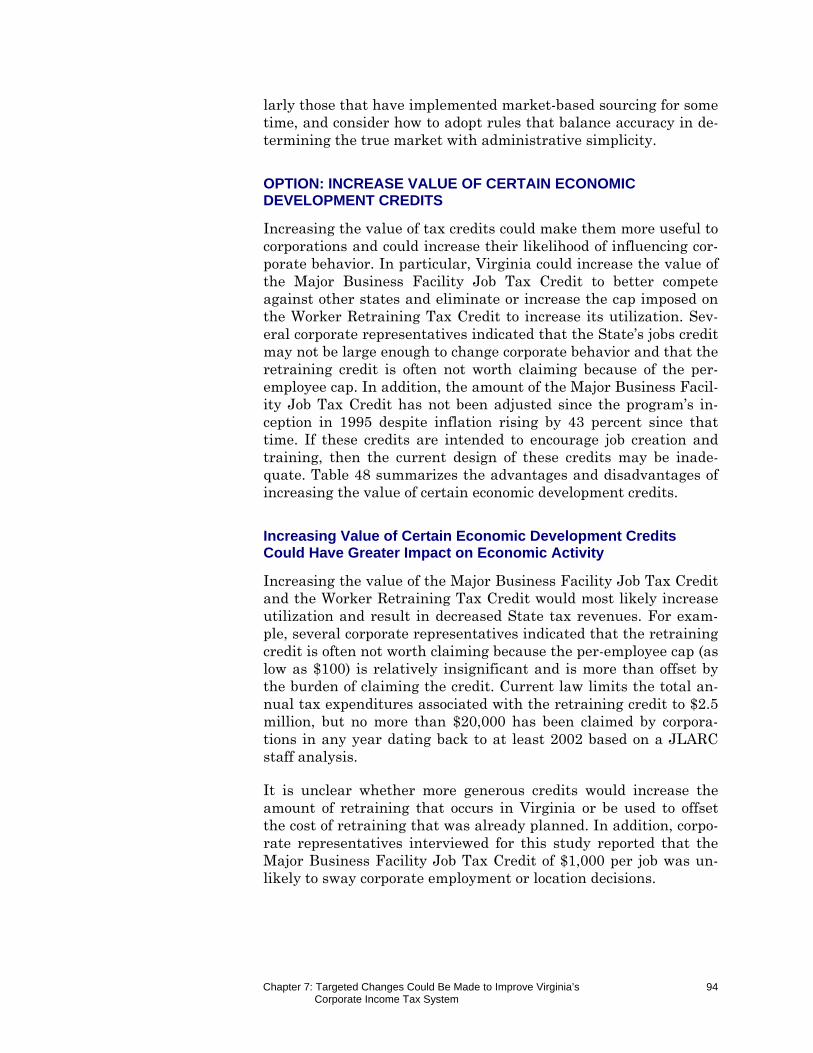
Chapter 7: Targeted Changes Could Be Made to Improve Virginia’s Corporate Income Tax System
94
larly those that have implemented market-based sourcing for some time, and consider how to adopt rules that balance accuracy in de-termining the true market with administrative simplicity.
OPTION: INCREASE VALUE OF CERTAIN ECONOMIC DEVELOPMENT CREDITS
Increasing the value of tax credits could make them more useful to corporations and could increase their likelihood of influencing cor-porate behavior. In particular, Virginia could increase the value of the Major Business Facility Job Tax Credit to better compete against other states and eliminate or increase the cap imposed on the Worker Retraining Tax Credit to increase its utilization. Sev-eral corporate representatives indicated that the State’s jobs credit may not be large enough to change corporate behavior and that the retraining credit is often not worth claiming because of the per-employee cap. In addition, the amount of the Major Business Facil-ity Job Tax Credit has not been adjusted since the program’s in-ception in 1995 despite inflation rising by 43 percent since that time. If these credits are intended to encourage job creation and training, then the current design of these credits may be inade-quate. Table 48 summarizes the advantages and disadvantages of increasing the value of certain economic development credits.
Increasing Value of Certain Economic Development Credits Could Have Greater Impact on Economic Activity
Increasing the value of the Major Business Facility Job Tax Credit and the Worker Retraining Tax Credit would most likely increase utilization and result in decreased State tax revenues. For exam-ple, several corporate representatives indicated that the retraining credit is often not worth claiming because the per-employee cap (as low as $100) is relatively insignificant and is more than offset by the burden of claiming the credit. Current law limits the total an-nual tax expenditures associated with the retraining credit to $2.5 million, but no more than $20,000 has been claimed by corpora-tions in any year dating back to at least 2002 based on a JLARC staff analysis.
It is unclear whether more generous credits would increase the amount of retraining that occurs in Virginia or be used to offset the cost of retraining that was already planned. In addition, corpo-rate representatives interviewed for this study reported that the Major Business Facility Job Tax Credit of $1,000 per job was un-likely to sway corporate employment or location decisions.
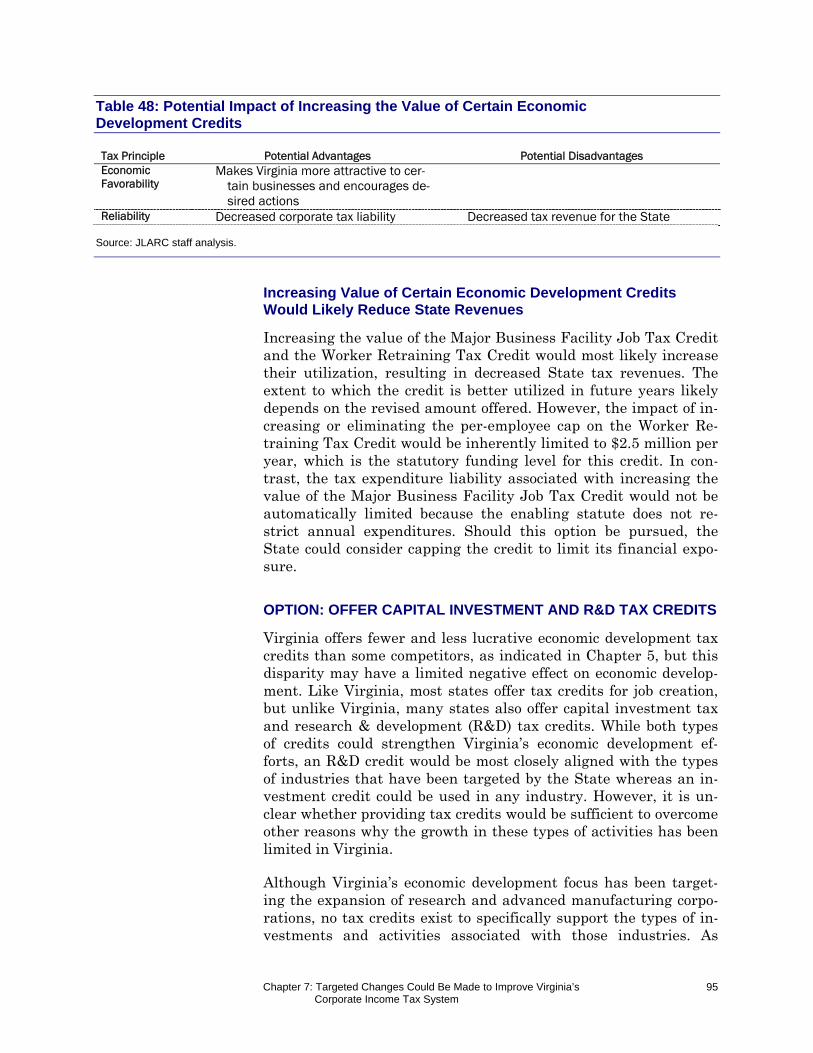
Chapter 7: Targeted Changes Could Be Made to Improve Virginia’s Corporate Income Tax System
95
Table 48: Potential Impact of Increasing the Value of Certain Economic Development Credits Tax Principle Potential Advantages Potential Disadvantages Economic Favorability
Makes Virginia more attractive to cer-tain businesses and encourages de-sired actions
Reliability Decreased corporate tax liability Decreased tax revenue for the State
Source: JLARC staff analysis.
Increasing Value of Certain Economic Development Credits Would Likely Reduce State Revenues
Increasing the value of the Major Business Facility Job Tax Credit and the Worker Retraining Tax Credit would most likely increase their utilization, resulting in decreased State tax revenues. The extent to which the credit is better utilized in future years likely depends on the revised amount offered. However, the impact of in-creasing or eliminating the per-employee cap on the Worker Re-training Tax Credit would be inherently limited to $2.5 million per year, which is the statutory funding level for this credit. In con-trast, the tax expenditure liability associated with increasing the value of the Major Business Facility Job Tax Credit would not be automatically limited because the enabling statute does not re-strict annual expenditures. Should this option be pursued, the State could consider capping the credit to limit its financial expo-sure.
OPTION: OFFER CAPITAL INVESTMENT AND R&D TAX CREDITS
Virginia offers fewer and less lucrative economic development tax credits than some competitors, as indicated in Chapter 5, but this disparity may have a limited negative effect on economic develop-ment. Like Virginia, most states offer tax credits for job creation, but unlike Virginia, many states also offer capital investment tax and research & development (R&D) tax credits. While both types of credits could strengthen Virginia’s economic development ef-forts, an R&D credit would be most closely aligned with the types of industries that have been targeted by the State whereas an in-vestment credit could be used in any industry. However, it is un-clear whether providing tax credits would be sufficient to overcome other reasons why the growth in these types of activities has been limited in Virginia.
Although Virginia’s economic development focus has been target-ing the expansion of research and advanced manufacturing corpo-rations, no tax credits exist to specifically support the types of in-vestments and activities associated with those industries. As
Chapter 7: Targeted Changes Could Be Made to Improve Virginia’s Corporate Income Tax System
96
discussed in Chapter 5, Washington, D.C., is the only jurisdiction among Virginia’s competitors that does not offer corporations a capital investment or an R&D tax credit. Virginia Economic Devel-opment Partnership (VEDP) staff indicated that Virginia has not performed as well as some of its competitors in attracting life sci-ence and other R&D intensive firms. Further, several corporate staff indicated during interviews that these types of tax credits would be very appealing to corporations wishing to locate or ex-pand in the State. Thus, offering a capital investment tax credit and/or R&D tax credit could better position Virginia to attract tar-get industries and successfully compete with competitor states.
While additional tax credits could increase the State’s appeal to certain industries, it is unclear whether they would result in addi-tional investments in Virginia. As described in Chapter 6, empiri-cal research has found mixed evidence of the effectiveness of tax credits in changing corporate behavior, and observed changes have generally been modest. In addition, VEDP reports that Virginia has intentionally shifted away from using tax credits to incentivize economic development because discretionary incentives are per-ceived to be more effective and attractive. VEDP staff also indicat-ed that Virginia’s lagging performance in attracting R&D intensive corporations is not wholly attributable to the lack of tax credits, but also to a lack of financing, inadequate collaboration between Virginia’s colleges and the private sector, and limited availability of appropriate research facilities.
Lastly, economic theory generally does not support using tax cred-its to spur economic development because they distort business de-cisions, which can result in economic inefficiencies. It is based on this premise that the Tax Foundation gives states a lower ranking if they heavily utilize tax credits. The Tax Foundation notes, “Lawmakers create [tax credits] under the banner of job creation and economic development, but the truth is that if a state needs to offer [tax credits], it is most likely covering for a bad business tax climate.” As described in Chapter 6, national rankings indicate that Virginia does not appear to have a “bad business tax climate” but rather one of the most favorable overall business climates in the country and may therefore not need to rely as heavily on tax credits. Table 49 summarizes the advantages and disadvantages of offering capital investment and R&D Credits.
Offering Capital Investment and R&D Credits Could Diminish Equitability
Targeting specific industries that tend to require substantial capi-tal investments and conduct R&D could result in greater inequi-ties between industries. Additionally, capital investment or R&D tax credits could disproportionately benefit larger corporations,
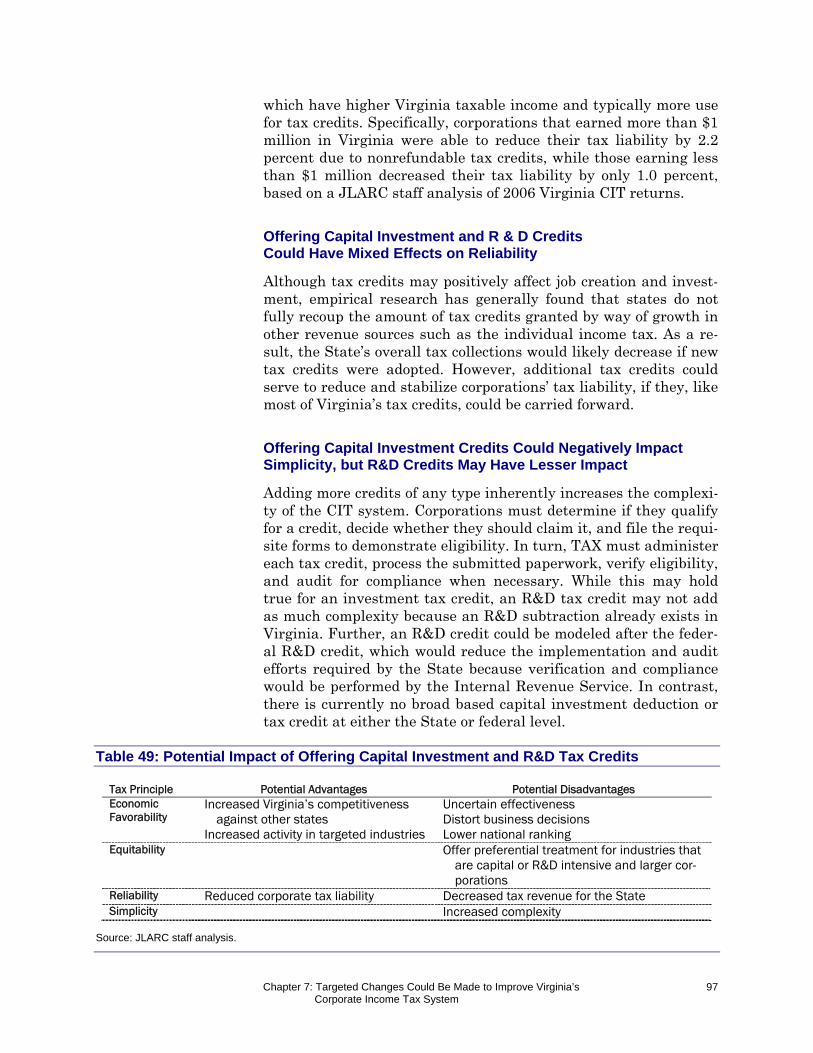
Chapter 7: Targeted Changes Could Be Made to Improve Virginia’s Corporate Income Tax System
97
which have higher Virginia taxable income and typically more use for tax credits. Specifically, corporations that earned more than $1 million in Virginia were able to reduce their tax liability by 2.2 percent due to nonrefundable tax credits, while those earning less than $1 million decreased their tax liability by only 1.0 percent, based on a JLARC staff analysis of 2006 Virginia CIT returns.
Offering Capital Investment and R & D Credits Could Have Mixed Effects on Reliability
Although tax credits may positively affect job creation and invest-ment, empirical research has generally found that states do not fully recoup the amount of tax credits granted by way of growth in other revenue sources such as the individual income tax. As a re-sult, the State’s overall tax collections would likely decrease if new tax credits were adopted. However, additional tax credits could serve to reduce and stabilize corporations’ tax liability, if they, like most of Virginia’s tax credits, could be carried forward.
Offering Capital Investment Credits Could Negatively Impact Simplicity, but R&D Credits May Have Lesser Impact
Adding more credits of any type inherently increases the complexi-ty of the CIT system. Corporations must determine if they qualify for a credit, decide whether they should claim it, and file the requi-site forms to demonstrate eligibility. In turn, TAX must administer each tax credit, process the submitted paperwork, verify eligibility, and audit for compliance when necessary. While this may hold true for an investment tax credit, an R&D tax credit may not add as much complexity because an R&D subtraction already exists in Virginia. Further, an R&D credit could be modeled after the feder-al R&D credit, which would reduce the implementation and audit efforts required by the State because verification and compliance would be performed by the Internal Revenue Service. In contrast, there is currently no broad based capital investment deduction or tax credit at either the State or federal level.
Table 49: Potential Impact of Offering Capital Investment and R&D Tax Credits
Tax Principle Potential Advantages Potential Disadvantages Economic Favorability
Increased Virginia’s competitiveness against other states
Increased activity in targeted industries
Uncertain effectiveness Distort business decisions Lower national ranking
Equitability Offer preferential treatment for industries that are capital or R&D intensive and larger cor-porations
Reliability Reduced corporate tax liability Decreased tax revenue for the State Simplicity Increased complexity
Source: JLARC staff analysis.
Chapter 7: Targeted Changes Could Be Made to Improve Virginia’s Corporate Income Tax System
98
OPTION: MAKE CREDITS REFUNDABLE
Making tax credits refundable could improve the equitability of the CIT system while benefiting Virginia’s economy, but this change would likely result in decreased tax revenues to the State. Virginia could make all tax credits refundable so that corporations can use them even when they have no tax liability. Allowing credits to be refundable would treat corporations more equitably and would likely be viewed favorably by the business community. However, refundable credits would increase the State’s current year tax ex-penditures and therefore reduce tax collections in the current year. These modifications could also further complicate the CIT tax sys-tem. Table 50 summarizes the advantages and disadvantages of making credits refundable.
Making Credits Refundable Could Increase Economic Favorability
Corporate and State economic development staff consistently indi-cated that refundable tax credits are more attractive to businesses that are considering increasing their presence in Virginia. Making credits refundable gives corporations greater certainty about the value and usability of the credits because they can be claimed in their entirety even if they exceed the taxpayer’s tax liability. In contrast, the value of nonrefundable credits in a given year is bound by the amount of tax liability owed by each corporation. Historically, nonrefundable tax credits have exceeded taxable in-come in one-third of corporate returns that included such credits. However, most of Virginia’s nonrefundable tax credits carry for-ward three to ten years and can therefore be recouped over time. Due to data limitations, it is unknown how often corporations are unable to use their tax credits during the carry-forward period.
Making Credits Refundable Could Increase Equitability
Corporations that perform the same actions encouraged by tax credits, such as hiring new workers, appear to benefit differently based on their taxable income and liability. For corporations with significant taxable income, credits represent a dollar-for-dollar de-crease in their tax liability, whereas corporations that have limited taxable income or experience losses receive less value from the credits than they are eligible to claim.
Specifically, nonrefundable tax credits appear to be less frequently usable by smaller corporations whose income tends to be more vol-atile than large companies. More than half of corporations that earned under $100,000 in Virginia were unable to claim the full amount of credits for which they were eligible in 2006, based on a JLARC staff analysis of tax returns. In contrast, only 11 percent of
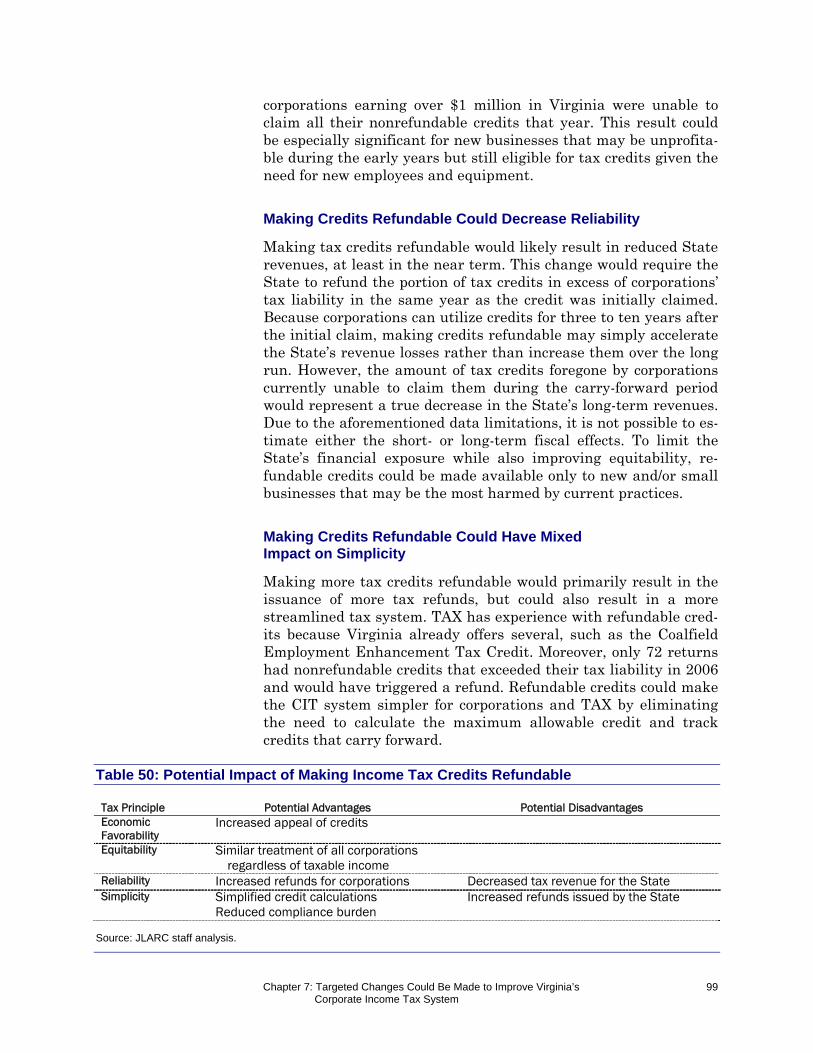
Chapter 7: Targeted Changes Could Be Made to Improve Virginia’s Corporate Income Tax System
99
corporations earning over $1 million in Virginia were unable to claim all their nonrefundable credits that year. This result could be especially significant for new businesses that may be unprofita-ble during the early years but still eligible for tax credits given the need for new employees and equipment.
Making Credits Refundable Could Decrease Reliability
Making tax credits refundable would likely result in reduced State revenues, at least in the near term. This change would require the State to refund the portion of tax credits in excess of corporations’ tax liability in the same year as the credit was initially claimed. Because corporations can utilize credits for three to ten years after the initial claim, making credits refundable may simply accelerate the State’s revenue losses rather than increase them over the long run. However, the amount of tax credits foregone by corporations currently unable to claim them during the carry-forward period would represent a true decrease in the State’s long-term revenues. Due to the aforementioned data limitations, it is not possible to es-timate either the short- or long-term fiscal effects. To limit the State’s financial exposure while also improving equitability, re-fundable credits could be made available only to new and/or small businesses that may be the most harmed by current practices.
Making Credits Refundable Could Have Mixed Impact on Simplicity
Making more tax credits refundable would primarily result in the issuance of more tax refunds, but could also result in a more streamlined tax system. TAX has experience with refundable cred-its because Virginia already offers several, such as the Coalfield Employment Enhancement Tax Credit. Moreover, only 72 returns had nonrefundable credits that exceeded their tax liability in 2006 and would have triggered a refund. Refundable credits could make the CIT system simpler for corporations and TAX by eliminating the need to calculate the maximum allowable credit and track credits that carry forward.
Table 50: Potential Impact of Making Income Tax Credits Refundable Tax Principle Potential Advantages Potential Disadvantages Economic Favorability
Increased appeal of credits
Equitability Similar treatment of all corporations regardless of taxable income
Reliability Increased refunds for corporations Decreased tax revenue for the State Simplicity Simplified credit calculations
Reduced compliance burden Increased refunds issued by the State
Source: JLARC staff analysis.
Chapter 7: Targeted Changes Could Be Made to Improve Virginia’s Corporate Income Tax System
100
OPTION: ELIMINATE UNDERUTILIZED CREDITS
More than one-half of Virginia’s income tax credits were claimed by fewer than four corporations in 2006. Eliminating these un-derutilized tax credits could improve the simplicity of Virginia’s CIT system by reducing the administrative responsibilities of TAX and the filing process for corporations. Moreover, this option would likely have minimal impact on reliability or the economy because their magnitude is unlikely to be influencing corporations’ deci-sions. Table 52 summarizes the advantages and disadvantages of eliminating underutilized tax credits.
Eliminating Underutilized Tax Credits Could Increase Simplicity
Reducing the number of credits that corporations can claim could simplify the CIT system for both the State and corporations. TAX’s administrative and compliance burden could be reduced as a result of having to process, review, and when necessary audit fewer cred-it claims. In practical terms, eliminating the underutilized tax credits could also shorten the CIT credit form (Schedule 500CR) from four pages to three.
The complete elimination of credits underutilized by all taxpayers (corporations and other businesses) could also substantially reduce the size and therefore complexity of the Virginia Tax Code. These simplifications could also benefit corporations, particularly those that are small and/or new to the State.
Eliminating Underutilized Credits Could Have Modest Effects on Reliability
Because underutilized tax credits represent a relatively small por-tion of the total amount of tax credits claimed, their elimination would likely have a modest positive effect on the tax revenues col-lected by the State. Still, foregoing these credits could represent a significant increase in the tax liability of certain corporations, es-pecially small ones. In order to ease the transition, underutilized credits that have been claimed could be phased out to afford these corporations time to plan for addressing the upcoming increase in tax liability.
Eliminating Underutilized Credits Could Have Mixed Impact on Economic Favorability
Most of the underutilized credits are claimed by few corporations and in modest amounts. Therefore, eliminating these credits would likely have minimal impact on corporate decisions to engage in these activities and, in turn, Virginia’s economy. As discussed in Chapter 5, six of Virginia’s 22 active tax credits were not claimed

Chapter 7: Targeted Changes Could Be Made to Improve Virginia’s Corporate Income Tax System
101
by any corporation in 2006, while another six credits were claimed by only a few (less than four). Of the 12 underutilized credits, one credit, the Coal Employment and Production Incentive Credit, was sufficiently valuable despite being claimed by only a few corpora-tions that it should not be considered for elimination on the grounds of underutilization. The total amount claimed across the remaining 11 underutilized credits was only $18,529 in 2006, which is consistent with amounts claimed in prior and subsequent years.
It may not be necessary to take action on four of these tax credits because they have sunset provisions (Table 51). In addition, cer-tain credits that are underutilized by C corporations appear to be more frequently claimed by pass-through entities (PTEs), such as the Advanced Technology Fertilizer and Pesticide Application Equipment Credit and the Low-Income Housing Credit, and could yield greater negative economic effects if eliminated entirely. Fur-ther, data were not available to determine the extent to which the-se credits are used by individual taxpayers. Therefore, the State could consider eliminating these two credits strictly from the CIT system and retaining them in the individual income tax system. However, making income credits only available for a subset of Vir-ginia taxpayers raises equitability concerns. Two of the underuti-lized credits would be relatively easy to repeal only for corpora-tions because they appear in the Code of Virginia under both the individual and corporate income tax sections, but new statutory language would be required for the other credits to avoid having credits only available to individuals appear in the corporate section of the income tax chapter.
Table 51: Several Underutilized Credits Could Be Eliminated
Credits Underutilized byCorporations
Credits Utilized by PTEs
Credits With Sunset Provision
Advanced Technology Fertilizer and Pesticide Application Equipment Credit a
Cigarette Export Tax Clean Fuel Vehicle Credit Clean Fuel Vehicle Job Creation Tax Credit Day-Care Facility Investment Credit Low Income Housing Credit Rent Reduction Program Credit Riparian Waterway Buffer Credit a TANF Employment Credit Vehicle Emissions Testing Equipment Credit Worker Retraining Credit
a CIT credit has separate enabling legislation from individual income tax credit. Source: JLARC staff analysis of tax year 2006 Virginia corporate returns and PTE returns of income.
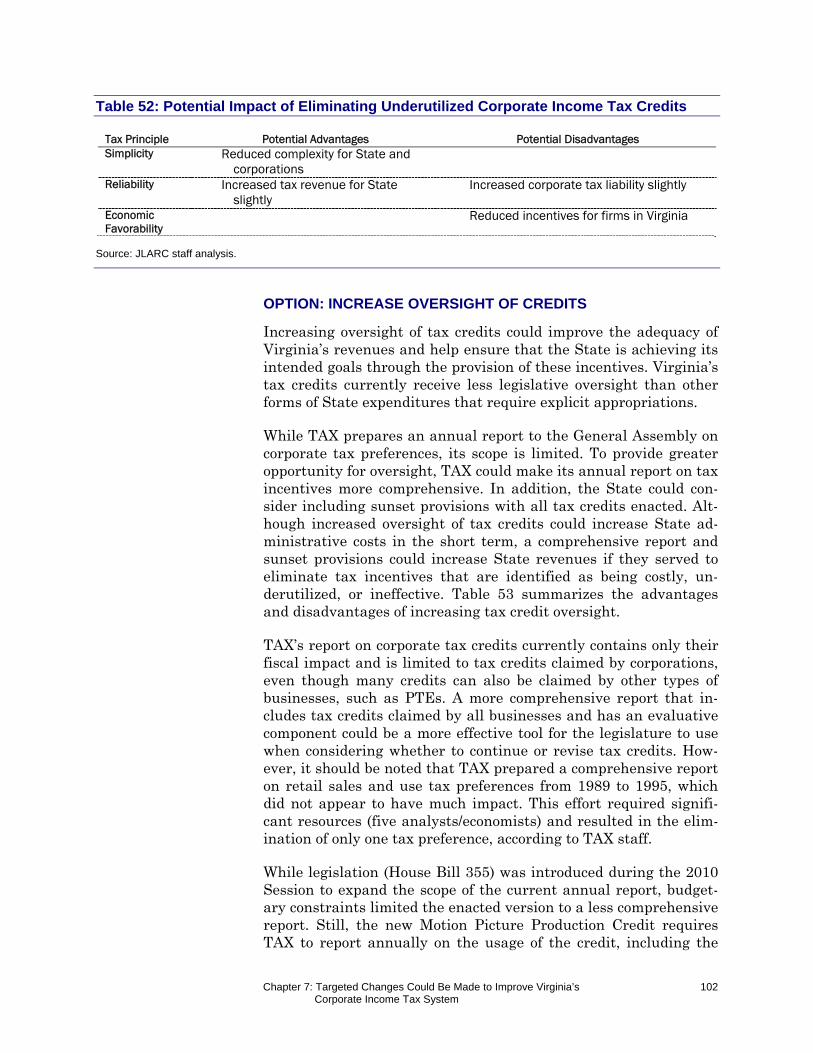
Chapter 7: Targeted Changes Could Be Made to Improve Virginia’s Corporate Income Tax System
102
Table 52: Potential Impact of Eliminating Underutilized Corporate Income Tax Credits
Tax Principle Potential Advantages Potential Disadvantages Simplicity Reduced complexity for State and
corporations
Reliability Increased tax revenue for State slightly
Increased corporate tax liability slightly
Economic Favorability
Reduced incentives for firms in Virginia
Source: JLARC staff analysis.
OPTION: INCREASE OVERSIGHT OF CREDITS
Increasing oversight of tax credits could improve the adequacy of Virginia’s revenues and help ensure that the State is achieving its intended goals through the provision of these incentives. Virginia’s tax credits currently receive less legislative oversight than other forms of State expenditures that require explicit appropriations.
While TAX prepares an annual report to the General Assembly on corporate tax preferences, its scope is limited. To provide greater opportunity for oversight, TAX could make its annual report on tax incentives more comprehensive. In addition, the State could con-sider including sunset provisions with all tax credits enacted. Alt-hough increased oversight of tax credits could increase State ad-ministrative costs in the short term, a comprehensive report and sunset provisions could increase State revenues if they served to eliminate tax incentives that are identified as being costly, un-derutilized, or ineffective. Table 53 summarizes the advantages and disadvantages of increasing tax credit oversight.
TAX’s report on corporate tax credits currently contains only their fiscal impact and is limited to tax credits claimed by corporations, even though many credits can also be claimed by other types of businesses, such as PTEs. A more comprehensive report that in-cludes tax credits claimed by all businesses and has an evaluative component could be a more effective tool for the legislature to use when considering whether to continue or revise tax credits. How-ever, it should be noted that TAX prepared a comprehensive report on retail sales and use tax preferences from 1989 to 1995, which did not appear to have much impact. This effort required signifi-cant resources (five analysts/economists) and resulted in the elim-ination of only one tax preference, according to TAX staff.
While legislation (House Bill 355) was introduced during the 2010 Session to expand the scope of the current annual report, budget-ary constraints limited the enacted version to a less comprehensive report. Still, the new Motion Picture Production Credit requires TAX to report annually on the usage of the credit, including the
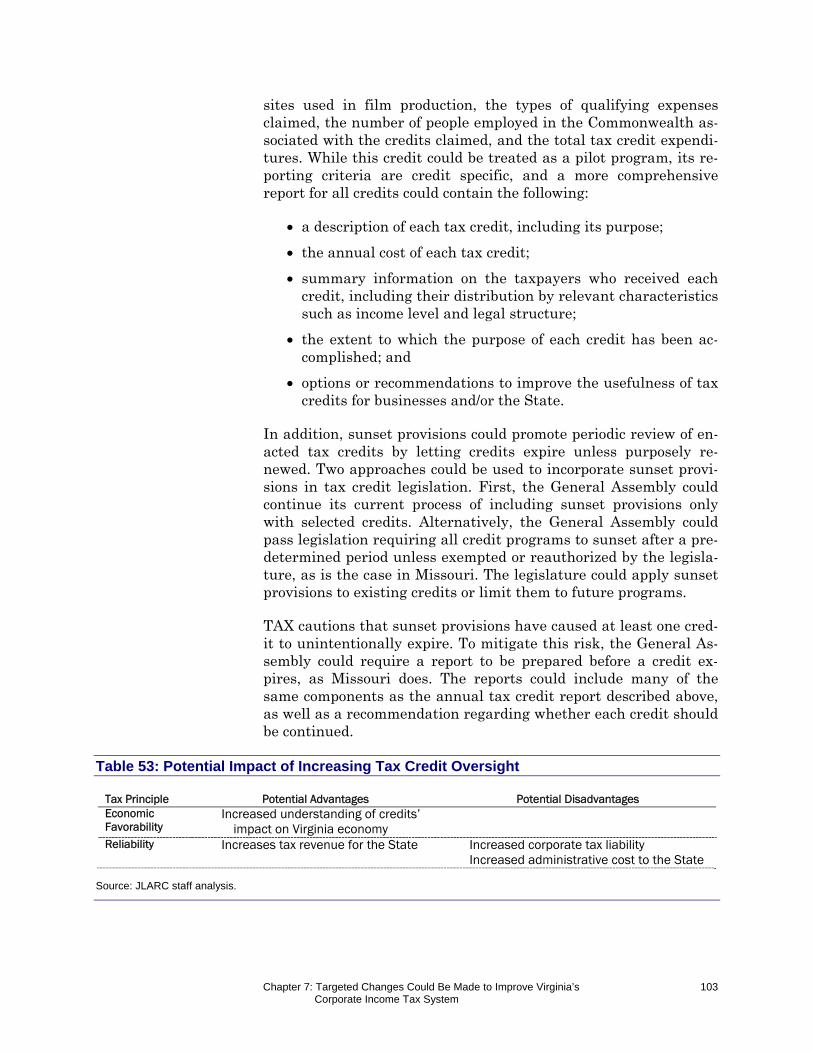
Chapter 7: Targeted Changes Could Be Made to Improve Virginia’s Corporate Income Tax System
103
sites used in film production, the types of qualifying expenses claimed, the number of people employed in the Commonwealth as-sociated with the credits claimed, and the total tax credit expendi-tures. While this credit could be treated as a pilot program, its re-porting criteria are credit specific, and a more comprehensive report for all credits could contain the following:
a description of each tax credit, including its purpose;
the annual cost of each tax credit;
summary information on the taxpayers who received each credit, including their distribution by relevant characteristics such as income level and legal structure;
the extent to which the purpose of each credit has been ac-complished; and
options or recommendations to improve the usefulness of tax credits for businesses and/or the State.
In addition, sunset provisions could promote periodic review of en-acted tax credits by letting credits expire unless purposely re-newed. Two approaches could be used to incorporate sunset provi-sions in tax credit legislation. First, the General Assembly could continue its current process of including sunset provisions only with selected credits. Alternatively, the General Assembly could pass legislation requiring all credit programs to sunset after a pre-determined period unless exempted or reauthorized by the legisla-ture, as is the case in Missouri. The legislature could apply sunset provisions to existing credits or limit them to future programs.
TAX cautions that sunset provisions have caused at least one cred-it to unintentionally expire. To mitigate this risk, the General As-sembly could require a report to be prepared before a credit ex-pires, as Missouri does. The reports could include many of the same components as the annual tax credit report described above, as well as a recommendation regarding whether each credit should be continued.
Table 53: Potential Impact of Increasing Tax Credit Oversight
Tax Principle Potential Advantages Potential Disadvantages Economic Favorability
Increased understanding of credits’ impact on Virginia economy
Reliability Increases tax revenue for the State Increased corporate tax liability Increased administrative cost to the State
Source: JLARC staff analysis.

Chapter 7: Targeted Changes Could Be Made to Improve Virginia’s Corporate Income Tax System
104
BEST OPTION APPEARS TO BE ADOPTING MARKET-BASED SOURCING WHILE DISCONTINUING EXTENSION OF PL 86-272
Of the targeted changes that are presented in this chapter, Virgin-ia may wish to give particular consideration to adopting market-based sourcing for intangible goods and services while discontinu-ing the State’s extension of PL 86-272 protections to providers not covered by federal law. This change could render the State’s CIT system more equitable by using a consistent methodology for sourcing the sales of all providers, whether they offer services or tangible goods. In addition, the tax burden placed upon Virginia-based service providers would likely decrease, but overall tax col-lections could increase as some out-of-state corporations with a substantial economic presence in the State would become subject to tax. Moreover, service providers would no longer face a disincen-tive to add employees or property in the State for fear it might cause them to have to source all their sales to Virginia.
Chapter 8: Major Tax Restructuring Could Disrupt System Reliability 105
Several states have adopted tax rules or systems that depart sig-nificantly from the traditional corporate income tax (CIT) struc-ture that Virginia currently uses. While these initiatives to re-structure tax systems aim to achieve the same tax policy goals articulated in Chapter 7, they may be a disproportionate response to the targeted concerns raised by Virginia tax professionals and corporate representatives. The impact of sweeping changes would likely be extensive but also difficult to accurately predict for the State and businesses alike. Further, widespread changes could disrupt the certainty and stability of Virginia’s CIT policies, which has been consistently cited as a beneficial feature. Still, the State should continue to examine the need to restructure its CIT system in light of the dynamic nature of businesses and the economy.
OPTION: CONSIDER EXEMPTING SMALL CORPORATIONS FROM FILING AND PAYING INCOME TAXES
The corporate tax base could be reduced by exempting smaller cor-porations that tend to bear a heavy tax compliance burden but do not contribute a large share of CIT collections. Exempting small corporations from having to pay Virginia’s CIT could improve the simplicity of the State’s tax system and have a beneficial yet mod-est impact on economic growth, but would result in revenue losses and create some inequities. As described in Chapter 1, the vast majority of Virginia CIT returns are filed by corporations with lit-tle or no income tax liability, most of which (74 percent) appear to be either small or inactive as measured by their Virginia taxable
Ch
apte
r
88
MMaajjoorr TTaaxx RReessttrruuccttuurriinngg CCoouulldd DDiissrruupptt SSyysstteemm RReelliiaabbiilliittyy
Several major restructuring initiatives could be considered in Virginia, but mostcarry risks that may outweigh potential benefits, particularly in light of the State’shighly favorable business environment. The population of businesses subject to Vir-ginia’s corporate income tax (CIT) could be changed by exempting some or all corpo-rations, or by extending it to include pass-through entities. Corporate activity couldalso be taxed on the basis of gross receipts rather than income, and a minimum taxcould be applied. The calculation of income taxable in Virginia could also more close-ly mirror federal rules, and the State could consider the use of mandatory unitarycombined reporting. Lastly, existing tax credits could be replaced by grants. TheState may wish to further explore the taxation of certain businesses exempt fromthe State CIT, such as banks and insurers, and the apportionment rules applicableto financial corporations. While these areas are important, a more in-depth reviewwould be needed prior to adopting any changes.
II nn SS
uumm
mmaa r
r yy
Chapter 8: Major Tax Restructuring Could Disrupt System Reliability 106
income. While these corporations submit most of the returns filed, they account for a small percentage of CIT revenue. Yet, the bur-den of tax compliance appears to be especially pronounced for small companies. While offering an exemption could boost econom-ic growth among small corporations, it would create some inequi-ties with larger corporations and non-corporate small businesses. Further, an exemption would likely reduce State revenues and create greater uncertainty about future tax liability.
To simplify the filing and compliance process while properly identi-fying small businesses, Virginia could establish an exemption threshold based on tax information reported on federal income tax returns, which all corporations must file, and require eligible cor-porations to file only their federal return with the State. This ap-proach would save corporations from having to perform any addi-tional calculation in order to demonstrate exempt status. Leveraging federal tax information would also limit the need for additional State compliance and audit efforts. In addition, requir-ing eligible corporations to submit their federal tax return would ensure that potential taxpayers remain visible to the State.
While the federal corporate income tax return contains a great deal of information, federal gross receipts may be an appropriate means of identifying “small” businesses. Unlike for gross receipts, taxable income is subject to numerous additions and subtractions that may skew the true size of a corporation. However, there ap-pears to be no consensus about the level below which businesses can be characterized as “small.” If this option is pursued, the State may wish to solicit input from the business community to establish a reasonable threshold. Table 54 summarizes the advantages and disadvantages of exempting small corporations from filing and paying Virginia’s CIT.
Exempting Small Businesses Could Improve Simplicity by Reducing Costs of Compliance
Interviews with corporate representatives and tax professionals indicate that the tax filing process can be disproportionately bur-densome for smaller businesses, which tend to lack in-house tax expertise. In fact, an IRS study found that more than 80 percent of small businesses rely on outside tax preparers. As a result, the cost of tax compliance is generally higher for small corporations than for their larger counterparts, on a per-employee basis. As an illustration, the U.S. Small Business Administration found that companies with fewer than 20 employees tend to incur federal tax compliance costs that are nearly 70 percent higher per employee than companies with more than 500 workers.
Chapter 8: Major Tax Restructuring Could Disrupt System Reliability 107
Although exempting small corporations from the CIT would also simplify tax administration, it appears that the fiscal impact would be limited. According to staff of the Department of Taxation (TAX), the tax returns of smaller corporations tend not to consume many of TAX’s resources because they are generally the easiest to process and the least likely to contain errors that would necessi-tate an audit. In addition, exempt businesses may still be required to file some documentation with the State, however limited. In its analysis of a 2010 bill that would have exempted businesses earn-ing less than $100,000, TAX reported no expected administrative cost savings. While certain upfront expenditures on information systems and training would likely be required, these changes could reportedly be absorbed as part of the routine tax update process.
Exempting Small Businesses Could Be Economically Favorable
Exempting small businesses from Virginia’s CIT could have an ef-fect on the profitability of a critical segment of Virginia’s business activity and, in turn, benefit the State economy. As shown in Chapter 1, corporations that employ fewer than 50 workers gener-ated one-third of Virginia’s job growth during the past two dec-ades, and they were the only employer segment to enjoy continued job growth after the 2002-2003 recession. However, as discussed in Chapter 6, the research literature has found only a modest rela-tionship between lower taxes and economic activity, relative to foregone taxes. Therefore, lowering taxes for small corporations would likely have a beneficial but small effect on their economic activity in the State.
This exemption could also act as an economic development tool to retain existing small corporations and attract new ones to the State. No other state that imposes a CIT appears to exempt busi-nesses based on their size. Only Ohio and Michigan, which both tax based on gross receipts, offer an exemption to businesses that generate less than an established level of gross receipts ($150,000 and $350,000, respectively). Still, establishing a threshold for ex-emption could also stifle economic growth if it creates a disincen-tive for small businesses to expand and risk incurring a CIT liabil-ity.
Exempting Small Businesses Could Hinder Reliability
Exempting small corporations from income taxation would result in lower revenues to the State and reduce certainty about future corporate tax liability. However, the exact magnitude of this reve-nue loss would depend upon the type and level of the exemption threshold implemented. While data are not available to estimate the fiscal impact of exempting small corporations based on their
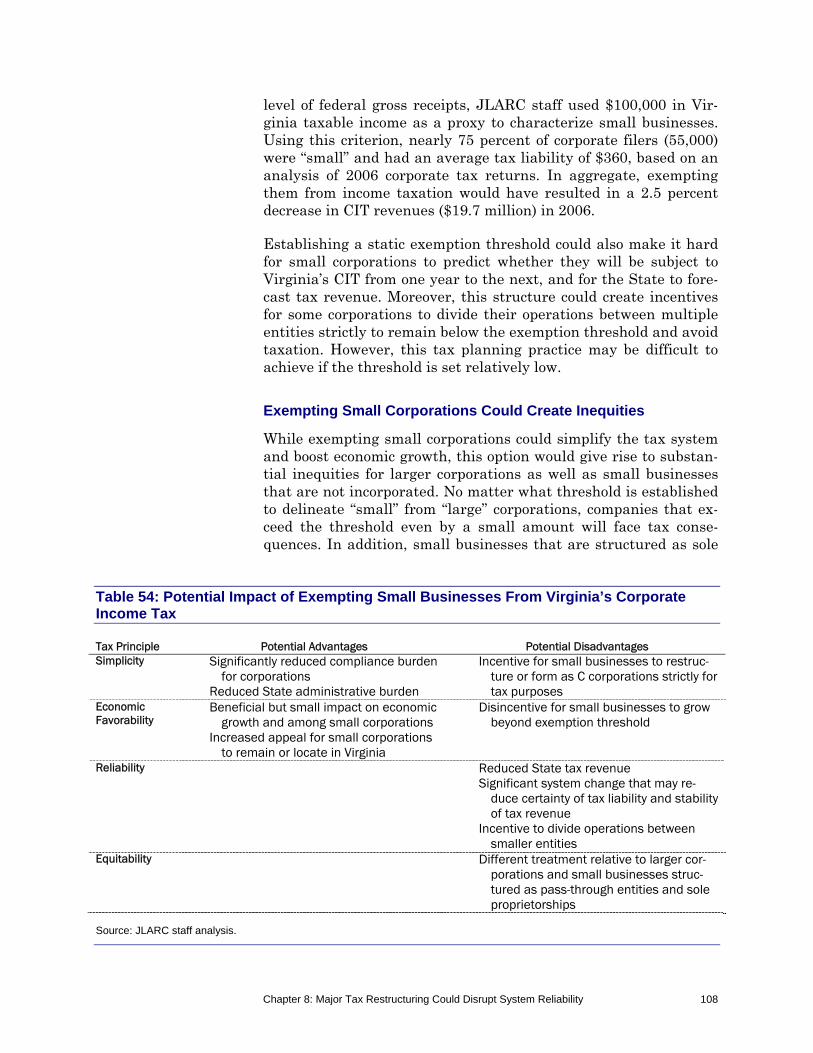
Chapter 8: Major Tax Restructuring Could Disrupt System Reliability 108
level of federal gross receipts, JLARC staff used $100,000 in Vir-ginia taxable income as a proxy to characterize small businesses. Using this criterion, nearly 75 percent of corporate filers (55,000) were “small” and had an average tax liability of $360, based on an analysis of 2006 corporate tax returns. In aggregate, exempting them from income taxation would have resulted in a 2.5 percent decrease in CIT revenues ($19.7 million) in 2006.
Establishing a static exemption threshold could also make it hard for small corporations to predict whether they will be subject to Virginia’s CIT from one year to the next, and for the State to fore-cast tax revenue. Moreover, this structure could create incentives for some corporations to divide their operations between multiple entities strictly to remain below the exemption threshold and avoid taxation. However, this tax planning practice may be difficult to achieve if the threshold is set relatively low.
Exempting Small Corporations Could Create Inequities
While exempting small corporations could simplify the tax system and boost economic growth, this option would give rise to substan-tial inequities for larger corporations as well as small businesses that are not incorporated. No matter what threshold is established to delineate “small” from “large” corporations, companies that ex-ceed the threshold even by a small amount will face tax conse-quences. In addition, small businesses that are structured as sole
Table 54: Potential Impact of Exempting Small Businesses From Virginia’s Corporate Income Tax Tax Principle Potential Advantages Potential Disadvantages Simplicity Significantly reduced compliance burden
for corporations Reduced State administrative burden
Incentive for small businesses to restruc-ture or form as C corporations strictly for tax purposes
Economic Favorability
Beneficial but small impact on economic growth and among small corporations
Increased appeal for small corporations to remain or locate in Virginia
Disincentive for small businesses to grow beyond exemption threshold
Reliability Reduced State tax revenue Significant system change that may re-
duce certainty of tax liability and stability of tax revenue
Incentive to divide operations between smaller entities
Equitability Different treatment relative to larger cor-porations and small businesses struc-tured as pass-through entities and sole proprietorships
Source: JLARC staff analysis.
Chapter 8: Major Tax Restructuring Could Disrupt System Reliability 109
proprietorships or pass-through entities will continue to be taxed under the individual income tax system, even if they are otherwise identical to small corporations. This disparity could create an in-centive for small businesses to incorporate strictly for tax purpos-es, which could result in inefficiencies and additional revenue loss-es to the State through the individual income tax system.
OPTION: CONSIDER ELIMINATING VIRGINIA’S CORPORATE INCOME TAX
While eliminating Virginia’s CIT could result in somewhat higher employment and economic growth, this action would likely result in significant State revenue losses. Eliminating the CIT could facil-itate economic growth by reducing corporations’ cost of doing busi-ness in Virginia, and acting as an economic development tool to at-tract corporations whose critical business requirements can be met in the State. However, the State is already regarded as a highly favorable place to do business, and it is unclear how much addi-tional benefit would result from eliminating its corporate tax given the significant revenue impact associated with this option.
An analysis of the dynamic effects of this option finds that Virgin-ia’s employment and gross state product (GSP) could grow under certain favorable but unlikely circumstances, but that the magni-tude of this growth may not be sufficient to make up for lost CIT revenue. When less favorable but somewhat more likely assump-tions are used, results indicate that employment and the economy could decline in Virginia if its CIT was eliminated. Exempting C corporations from income taxation could also create inequities for other business entities, although it would avoid the double taxa-tion of corporate income. In addition, eliminating the CIT could simplify the State’s tax system and reduce the tax compliance bur-den of corporations and administrative efforts of the State. Howev-er, the State CIT does not appear to be a major component of com-pliance or administrative costs. Table 56 summarizes the advantages and disadvantages of eliminating Virginia’s CIT.
Eliminating Virginia’s Corporate Income Would Likely Reduce State Revenue
While the research literature shows some evidence that reducing corporate income taxes can boost job growth and capital invest-ment, these gains have generally been found to be modest relative to foregone tax revenue as discussed in Chapter 6. Consistent with this literature, economic modeling conducted for this study and in other states suggests that lowering corporate income tax rates can be associated with job and economic growth under favorable but less likely circumstances, although this growth is not sufficient to recoup the revenues foregone by eliminating or reducing corporate
Chapter 8: Major Tax Restructuring Could Disrupt System Reliability 110
income taxes. The implication of this body of research is that alt-hough eliminating corporate taxes may generate some level of eco-nomic growth, this action is unlikely to “pay for itself” from the State’s perspective. Further, eliminating the CIT could have a negative impact on jobs and the economy if circumstances prove to be less than highly favorable. Whether the societal benefits of po-tential higher employment and economic growth outweigh likely revenue losses and potential economic losses is a policy choice.
Based on the most recent forecast (2009), eliminating the CIT could reduce State revenue by $705 million in fiscal year (FY) 2010, growing to $906 million by FY 2016. However, this static es-timate reflects only the direct effect of eliminating the CIT but does not account for numerous economic ramifications that would likely ensue. For example, a tax reduction could increase employ-ment and wages, thereby boosting workers’ disposable income and spending, and in turn favorable impacting individual income and sales tax collections.
To address these indirect economic ramifications and obtain a more comprehensive understanding of the effects of tax changes, economists and several states often utilize an approach called “dy-namic forecasting”. Still, even sophisticated economic models have limitations and should be considered with caution. Models cannot reflect all economic interactions that occur with major tax policy changes, and historical information cannot always accurately pre-dict future behavior. However, dynamic forecasting appears to be the best analytical tool available to estimate the impact of major tax changes and has been recommended by legislative organiza-tions such as the American Legislative Exchange Council (ALEC) and the National Conference of State Legislatures (NCSL).
For purposes of this study, scenarios were developed in partner-ship with economists at the University of Virginia and simulated using the REMI PI+ (REMI) model. The REMI model is regarded as one of the most sophisticated economic modeling tools available and is widely used in both the private and public sectors. Of the ten states reporting the use of dynamic forecasting in a report by the Heritage Foundation, half had adopted REMI. According to the model’s developers, REMI has been used by agencies in 30 states, including several of Virginia’s competitors (District of Columbia, Florida, Illinois, New York, North Carolina, and Texas) and south-ern neighbors (Kentucky, Louisiana, and Mississippi).
Based on the results of REMI models conducted by University of Virginia economists, it appears that eliminating the CIT could have beneficial effects on GSP and employment, using the most fa-vorable assumptions (Table 55). Under this scenario, Virginia GSP could grow by an additional $4 billion over the five-year period
REMI PI+ Model
The Regional Econom-ic Models, Inc. Policy Insights Plus (REMI PI+) model is a dynam-ic, multi-sector regional economic simulation model that can be used to forecast economic activity and measure the impact of public policy changes on economic activity, pop-ulation characteristics, and government fiscal variables. The model, which is categorized as an integrated regional econometric input-output model, offers advantages over con-ventional standalone econometric or input-output models. Re-gional economic fore-casts and simulations are generated by equa-tions calibrated specifi-cally for Virginia.
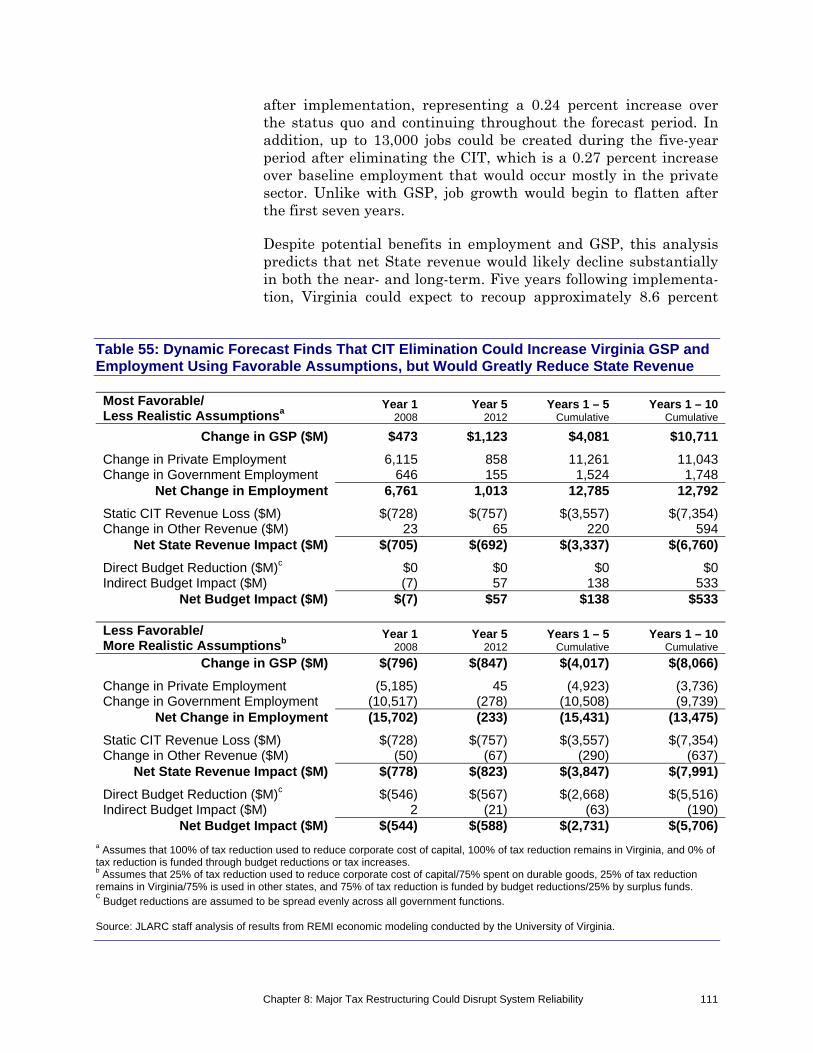
Chapter 8: Major Tax Restructuring Could Disrupt System Reliability 111
after implementation, representing a 0.24 percent increase over the status quo and continuing throughout the forecast period. In addition, up to 13,000 jobs could be created during the five-year period after eliminating the CIT, which is a 0.27 percent increase over baseline employment that would occur mostly in the private sector. Unlike with GSP, job growth would begin to flatten after the first seven years.
Despite potential benefits in employment and GSP, this analysis predicts that net State revenue would likely decline substantially in both the near- and long-term. Five years following implementa-tion, Virginia could expect to recoup approximately 8.6 percent
Table 55: Dynamic Forecast Finds That CIT Elimination Could Increase Virginia GSP and Employment Using Favorable Assumptions, but Would Greatly Reduce State Revenue
Most Favorable/ Less Realistic Assumptionsa
Year 12008
Year 52012
Years 1 – 5 Cumulative
Years 1 – 10Cumulative
Change in GSP ($M) $473 $1,123 $4,081 $10,711
Change in Private Employment 6,115 858 11,261 11,043Change in Government Employment 646 155 1,524 1,748
Net Change in Employment 6,761 1,013 12,785 12,792
Static CIT Revenue Loss ($M) $(728) $(757) $(3,557) $(7,354)Change in Other Revenue ($M) 23 65 220 594
Net State Revenue Impact ($M) $(705) $(692) $(3,337) $(6,760)
Direct Budget Reduction ($M)c $0 $0 $0 $0Indirect Budget Impact ($M) (7) 57 138 533
Net Budget Impact ($M) $(7) $57 $138 $533
Less Favorable/ More Realistic Assumptionsb
Year 12008
Year 52012
Years 1 – 5 Cumulative
Years 1 – 10Cumulative
Change in GSP ($M) $(796) $(847) $(4,017) $(8,066)
Change in Private Employment (5,185) 45 (4,923) (3,736)Change in Government Employment (10,517) (278) (10,508) (9,739)
Net Change in Employment (15,702) (233) (15,431) (13,475)
Static CIT Revenue Loss ($M) $(728) $(757) $(3,557) $(7,354)Change in Other Revenue ($M) (50) (67) (290) (637)
Net State Revenue Impact ($M) $(778) $(823) $(3,847) $(7,991)
Direct Budget Reduction ($M)c $(546) $(567) $(2,668) $(5,516)Indirect Budget Impact ($M) 2 (21) (63) (190)
Net Budget Impact ($M) $(544) $(588) $(2,731) $(5,706)a Assumes that 100% of tax reduction used to reduce corporate cost of capital, 100% of tax reduction remains in Virginia, and 0% of tax reduction is funded through budget reductions or tax increases. b Assumes that 25% of tax reduction used to reduce corporate cost of capital/75% spent on durable goods, 25% of tax reduction remains in Virginia/75% is used in other states, and 75% of tax reduction is funded by budget reductions/25% by surplus funds. c Budget reductions are assumed to be spread evenly across all government functions.
Source: JLARC staff analysis of results from REMI economic modeling conducted by the University of Virginia.
Chapter 8: Major Tax Restructuring Could Disrupt System Reliability 112
($65 million) of foregone corporate income taxes through increases in other revenue sources, such as the individual income tax, ac-cording to the model. Further, State expenditures would likely in-crease to accommodate economic growth, especially if newly creat-ed jobs are taken by workers who relocate from other states and require publicly-funded services such as education.
Over the entire five-year period, the net decrease in State revenue equates to approximately $260,000 for every permanent job creat-ed. To provide context on this figure, the most generous tax credit offered by competitor states is $12,500 per job created. In order to fully recoup lost tax revenue, nearly 160,000 permanent jobs would have to be created, or a twelve-fold increase over the model results, even under highly favorable conditions. While eliminating the CIT could prompt more corporations to locate or expand in Virginia, it does not appear likely that this level of job growth would occur.
These results are based on the most favorable course of action that corporations and the State could take. Specifically, they assume that corporations will use the full amount of tax reduction to re-duce their cost of capital entirely in Virginia, and that the State will not have to either cut spending or raise taxes to offset foregone CIT revenue. However, corporations may choose not to reinvest the entire amount of tax reductions in Virginia. Instead, they would likely utilize the benefit of a tax reduction wherever it was most needed, which would not necessarily be Virginia. In fact, repre-sentatives from multistate corporations indicated during inter-views that a tax reduction would likely be distributed across all states where they have employees. Corporations that conduct business in Virginia have approximately 15 percent of their em-ployees in the State, on average. In addition, because states are required to balance their budget, Virginia would need to find a funding source for eliminating its CIT. Unless surplus funds are available and not needed for other purposes, the State would likely have to reduce spending or increase other taxes. Reducing the State budget would likely result in the loss of government jobs that would partially offset job gains experienced in the private sector. Further, a reduction in State spending could diminish the quality of public services and infrastructure that corporations value, thereby weakening Virginia’s standing as a desirable place to con-duct business.
To capture conditions that are less favorable but more consistent with what the corporations interviewed indicated they would do, additional analyses were conducted. Eliminating the CIT could lead to a $4 billion decline in GSP, 13,475 fewer jobs, and $3.8 bil-lion less in State revenue over the five-year period following im-plementation when it is assumed that corporations will use 75 per-cent of their tax reduction in other states and for purposes other
Chapter 8: Major Tax Restructuring Could Disrupt System Reliability 113
than reducing their cost of capital, and that the State will have to make budget cuts to mitigate 75 percent of the impact of foregone CIT revenue. More information about the REMI model and as-sumptions used for these analyses are available in Appendix B.
While no U.S. state has eliminated its corporate income tax with-out replacing it with another tax structure, subnational tax reduc-tions have been implemented and studied in a few foreign coun-tries. However, it is unclear how robust or directly transferrable these studies’ results are to Virginia. For example, one Canadian study found that a 10 percentage point decrease in the corporate tax rate imposed by provinces could lead to a one to two percent increase in GSP. Similarly, a Swiss study found that a 4.5 percent-age point decrease in a canton’s corporate tax rate was correlated with higher GSP. However, each of these two jurisdictions had one of the highest tax rates in their country (16.5 percent in the Cana-dian province and 26.6 percent in the Swiss canton) before imple-menting the tax cut and therefore offered a much less favorable tax environment than Virginia. Further, neither of these jurisdic-tions completely eliminated their corporate tax. Therefore, it may not be appropriate to assume that findings from either study can be directly applied to estimate the effect of eliminating Virginia’s CIT.
Eliminating Virginia’s Corporate Income Tax Could Have Mixed Effects on Equitability
Nearly 70 percent of Virginia employers are not structured as C corporations and would therefore not benefit from the elimination of the CIT even if they are similar to corporations in other re-spects. This disparity could create an incentive for businesses op-erating solely or predominately in Virginia to reorganize as C cor-porations strictly for tax purposes, which would cause an additional loss of State revenue currently collected through the in-dividual income tax system. However, corporate income would no longer be double-taxed if the CIT were eliminated, which could im-prove equitability between C corporations and other types of busi-nesses.
Eliminating Virginia’s Corporate Income Tax Could Have Beneficial Impact on Economic Favorability
While Virginia’s CIT rate compares favorably to most other states, eliminating it altogether could provide an additional incentive for corporations to remain or locate in the State. Proposals to elimi-nate the CIT have been introduced in several states during the past two years, including South Carolina, Iowa, Minnesota, Rhode Island, and Georgia. However, no state has acted upon these pro-
Chapter 8: Major Tax Restructuring Could Disrupt System Reliability 114
posals. Only three states do not tax corporate activity, but they re-ly instead on other taxes as discussed in Chapter 2.
It is unclear to what extent corporations that wish to expand or re-locate can do so in Virginia, even if its tax environment were to further improve. As described in Chapter 6, corporations consider a multitude of factors when selecting site locations, and critical business factors must be in place for a location to be viable because tax incentives generally cannot fully compensate for shortcomings in production inputs such as labor. Further, while Virginia may be more competitive for foreign direct investment if its CIT is elimi-nated, it will still have to compete against other countries that may offer lower costs of inputs and overall tax rates than the Unit-ed States. In fact, a foreign corporation investing in Virginia after its CIT elimination would still face a federal CIT rate of 35 per-cent, making it the fourth highest tax rate of all international loca-tions as of 2009.
Eliminating Virginia’s Corporate Income Tax Could Simplify Tax System
Eliminating the State CIT would simplify the overall tax system and reduce the compliance burden of corporations and the State. The costs of tax compliance tend to be especially significant for smaller, Virginia-only corporations. In contrast, representatives from large multinational corporations indicated that the incremen-tal cost of complying with Virginia’s CIT was modest, in large part because much of the reporting and accounting requirements must be met to file tax returns in other states and at the federal level. Corporations interviewed estimated that tax personnel spent be-tween two and ten percent of their time on Virginia corporate tax-es. Eliminating the CIT would also reduce the administrative costs for TAX. Potential cost savings would be small because many tax functions are conducted for multiple State taxes. The department estimated $186,000 in cost savings and a reduction of two positions if the CIT were eliminated.
OPTION: CONSIDER TAXING PASS-THROUGH ENTITIES UNDER VIRGINIA’S CORPORATE INCOME TAX SYSTEM
Although businesses structured as pass-through entities (PTEs) have a similar profile to C corporations, their income is taxed un-der a different system and their associated tax liability is less, on average. In 2006, tax liability associated with PTE income was ap-proximately 15 percent lower under the individual income tax sys-tem than it would have been under the CIT system. This discrep-ancy occurs largely because the individual income tax system contains deductions and exemptions that are unavailable to C
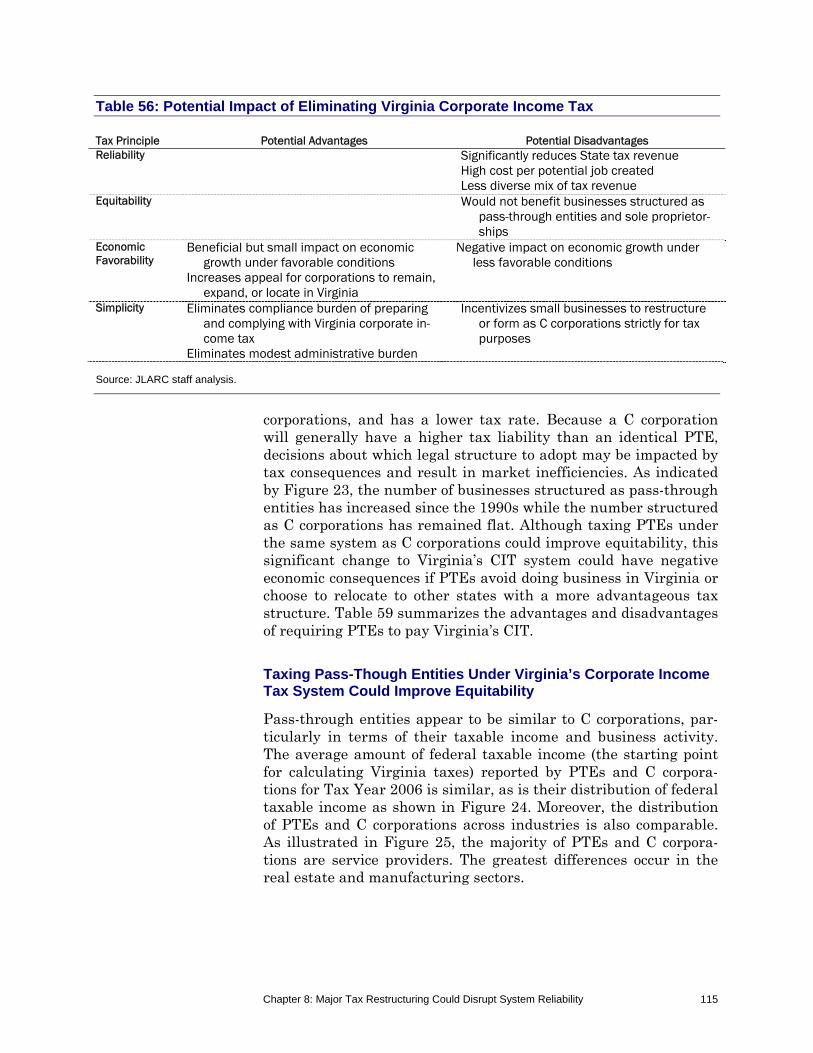
Chapter 8: Major Tax Restructuring Could Disrupt System Reliability 115
Table 56: Potential Impact of Eliminating Virginia Corporate Income Tax Tax Principle Potential Advantages Potential Disadvantages Reliability Significantly reduces State tax revenue
High cost per potential job created Less diverse mix of tax revenue
Equitability Would not benefit businesses structured as pass-through entities and sole proprietor-ships
Economic Favorability
Beneficial but small impact on economic growth under favorable conditions
Increases appeal for corporations to remain, expand, or locate in Virginia
Negative impact on economic growth under less favorable conditions
Simplicity Eliminates compliance burden of preparing and complying with Virginia corporate in-come tax
Eliminates modest administrative burden
Incentivizes small businesses to restructure or form as C corporations strictly for tax purposes
Source: JLARC staff analysis.
corporations, and has a lower tax rate. Because a C corporation will generally have a higher tax liability than an identical PTE, decisions about which legal structure to adopt may be impacted by tax consequences and result in market inefficiencies. As indicated by Figure 23, the number of businesses structured as pass-through entities has increased since the 1990s while the number structured as C corporations has remained flat. Although taxing PTEs under the same system as C corporations could improve equitability, this significant change to Virginia’s CIT system could have negative economic consequences if PTEs avoid doing business in Virginia or choose to relocate to other states with a more advantageous tax structure. Table 59 summarizes the advantages and disadvantages of requiring PTEs to pay Virginia’s CIT.
Taxing Pass-Though Entities Under Virginia’s Corporate Income Tax System Could Improve Equitability
Pass-through entities appear to be similar to C corporations, par-ticularly in terms of their taxable income and business activity. The average amount of federal taxable income (the starting point for calculating Virginia taxes) reported by PTEs and C corpora-tions for Tax Year 2006 is similar, as is their distribution of federal taxable income as shown in Figure 24. Moreover, the distribution of PTEs and C corporations across industries is also comparable. As illustrated in Figure 25, the majority of PTEs and C corpora-tions are service providers. The greatest differences occur in the real estate and manufacturing sectors.
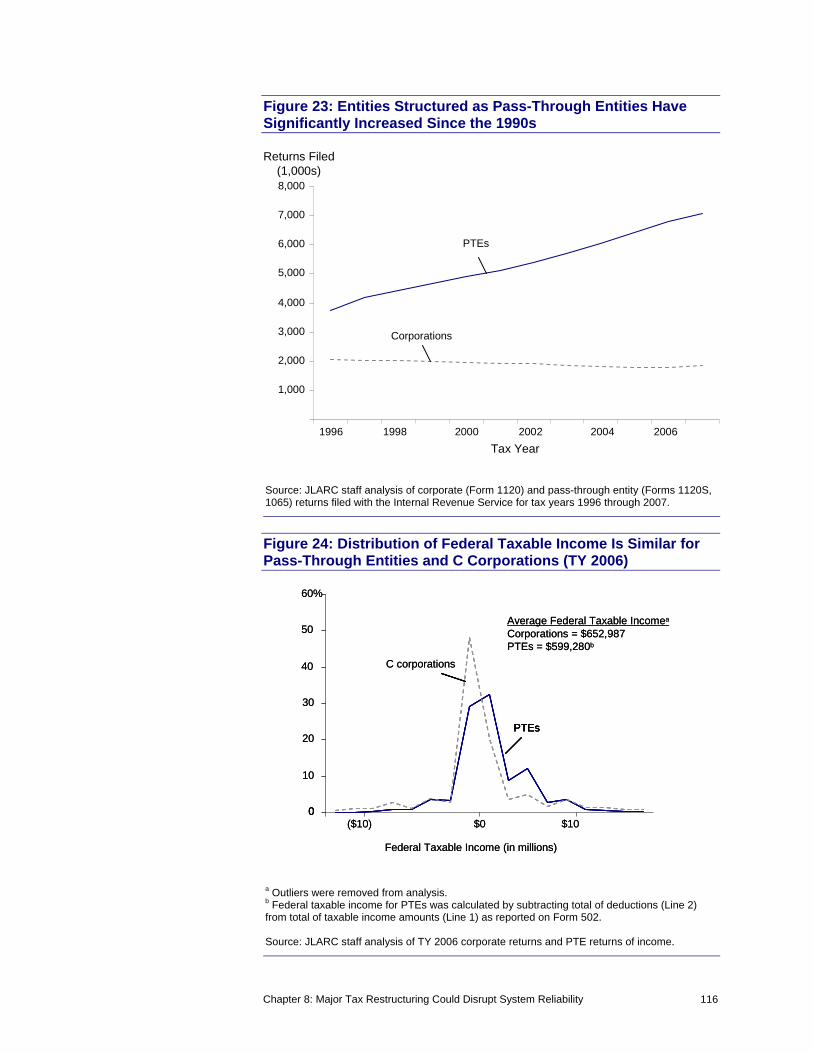
Chapter 8: Major Tax Restructuring Could Disrupt System Reliability 116
Figure 23: Entities Structured as Pass-Through Entities Have Significantly Increased Since the 1990s
1,000
2,000
3,000
4,000
5,000
6,000
7,000
8,000
1996 2000 2004 20061998 2002
Corporations
PTEs
Returns Filed(1,000s)
Tax Year
Source: JLARC staff analysis of corporate (Form 1120) and pass-through entity (Forms 1120S, 1065) returns filed with the Internal Revenue Service for tax years 1996 through 2007.
Figure 24: Distribution of Federal Taxable Income Is Similar for Pass-Through Entities and C Corporations (TY 2006)
0
10
20
30
40
50
60%
($10) $0 $10
Federal Taxable Income (in millions)
C corporations
PTEs
0
PTEs
Average Federal Taxable Incomea
Corporations = $652,987PTEs = $599,280b
0
10
20
30
40
50
60%
($10) $0 $10
Federal Taxable Income (in millions)
C corporations
PTEs
0
PTEs
Average Federal Taxable Incomea
Corporations = $652,987PTEs = $599,280b
a Outliers were removed from analysis. b Federal taxable income for PTEs was calculated by subtracting total of deductions (Line 2) from total of taxable income amounts (Line 1) as reported on Form 502. Source: JLARC staff analysis of TY 2006 corporate returns and PTE returns of income.
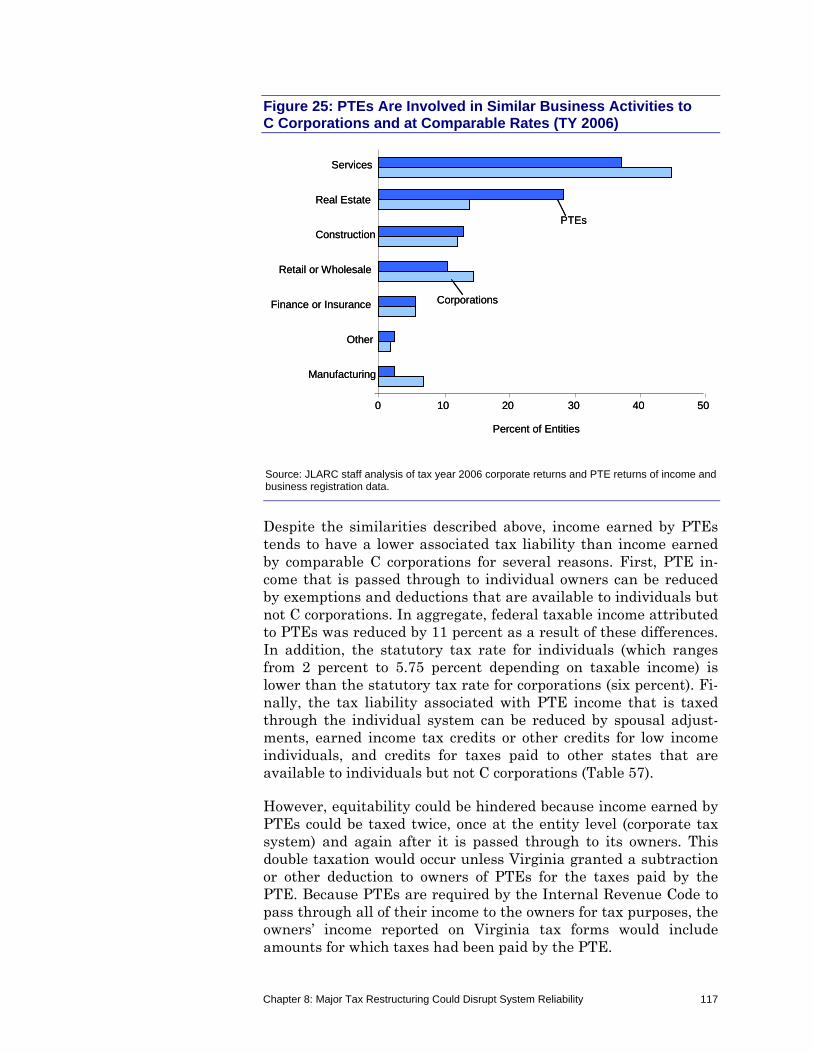
Chapter 8: Major Tax Restructuring Could Disrupt System Reliability 117
Figure 25: PTEs Are Involved in Similar Business Activities to C Corporations and at Comparable Rates (TY 2006)
0 10 20 30 40 50
Manufacturing
Other
Finance or Insurance
Retail or Wholesale
Construction
Real Estate
Services
Percent of Entities
PTEs
Corporations
0 10 20 30 40 50
Manufacturing
Other
Finance or Insurance
Retail or Wholesale
Construction
Real Estate
Services
Percent of Entities
PTEs
Corporations
Source: JLARC staff analysis of tax year 2006 corporate returns and PTE returns of income and business registration data.
Despite the similarities described above, income earned by PTEs tends to have a lower associated tax liability than income earned by comparable C corporations for several reasons. First, PTE in-come that is passed through to individual owners can be reduced by exemptions and deductions that are available to individuals but not C corporations. In aggregate, federal taxable income attributed to PTEs was reduced by 11 percent as a result of these differences. In addition, the statutory tax rate for individuals (which ranges from 2 percent to 5.75 percent depending on taxable income) is lower than the statutory tax rate for corporations (six percent). Fi-nally, the tax liability associated with PTE income that is taxed through the individual system can be reduced by spousal adjust-ments, earned income tax credits or other credits for low income individuals, and credits for taxes paid to other states that are available to individuals but not C corporations (Table 57).
However, equitability could be hindered because income earned by PTEs could be taxed twice, once at the entity level (corporate tax system) and again after it is passed through to its owners. This double taxation would occur unless Virginia granted a subtraction or other deduction to owners of PTEs for the taxes paid by the PTE. Because PTEs are required by the Internal Revenue Code to pass through all of their income to the owners for tax purposes, the owners’ income reported on Virginia tax forms would include amounts for which taxes had been paid by the PTE.
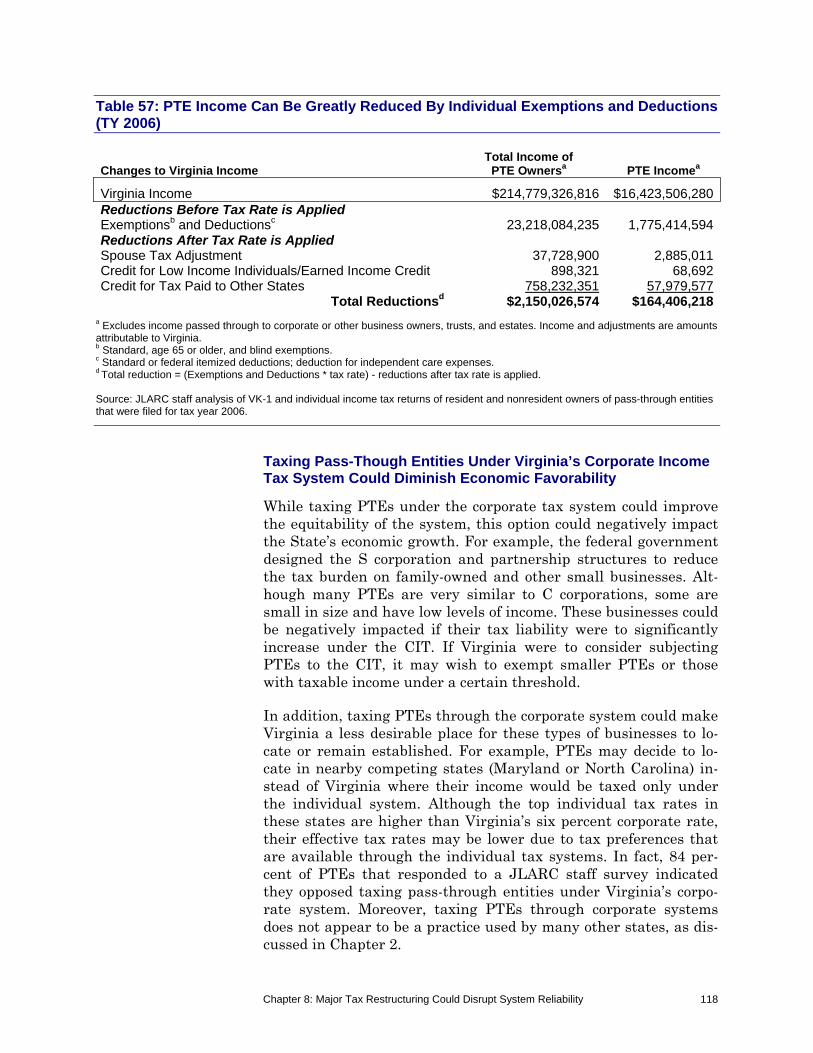
Chapter 8: Major Tax Restructuring Could Disrupt System Reliability 118
Table 57: PTE Income Can Be Greatly Reduced By Individual Exemptions and Deductions (TY 2006)
Changes to Virginia Income Total Income of
PTE Ownersa PTE Incomea
Virginia Income $214,779,326,816 $16,423,506,280Reductions Before Tax Rate is Applied Exemptionsb and Deductionsc 23,218,084,235 1,775,414,594Reductions After Tax Rate is Applied Spouse Tax Adjustment 37,728,900 2,885,011Credit for Low Income Individuals/Earned Income Credit 898,321 68,692Credit for Tax Paid to Other States 758,232,351 57,979,577
Total Reductionsd $2,150,026,574 $164,406,218a Excludes income passed through to corporate or other business owners, trusts, and estates. Income and adjustments are amounts attributable to Virginia. b Standard, age 65 or older, and blind exemptions. c Standard or federal itemized deductions; deduction for independent care expenses. d Total reduction = (Exemptions and Deductions * tax rate) - reductions after tax rate is applied.
Source: JLARC staff analysis of VK-1 and individual income tax returns of resident and nonresident owners of pass-through entities that were filed for tax year 2006.
Taxing Pass-Though Entities Under Virginia’s Corporate Income Tax System Could Diminish Economic Favorability
While taxing PTEs under the corporate tax system could improve the equitability of the system, this option could negatively impact the State’s economic growth. For example, the federal government designed the S corporation and partnership structures to reduce the tax burden on family-owned and other small businesses. Alt-hough many PTEs are very similar to C corporations, some are small in size and have low levels of income. These businesses could be negatively impacted if their tax liability were to significantly increase under the CIT. If Virginia were to consider subjecting PTEs to the CIT, it may wish to exempt smaller PTEs or those with taxable income under a certain threshold.
In addition, taxing PTEs through the corporate system could make Virginia a less desirable place for these types of businesses to lo-cate or remain established. For example, PTEs may decide to lo-cate in nearby competing states (Maryland or North Carolina) in-stead of Virginia where their income would be taxed only under the individual system. Although the top individual tax rates in these states are higher than Virginia’s six percent corporate rate, their effective tax rates may be lower due to tax preferences that are available through the individual tax systems. In fact, 84 per-cent of PTEs that responded to a JLARC staff survey indicated they opposed taxing pass-through entities under Virginia’s corpo-rate system. Moreover, taxing PTEs through corporate systems does not appear to be a practice used by many other states, as dis-cussed in Chapter 2.
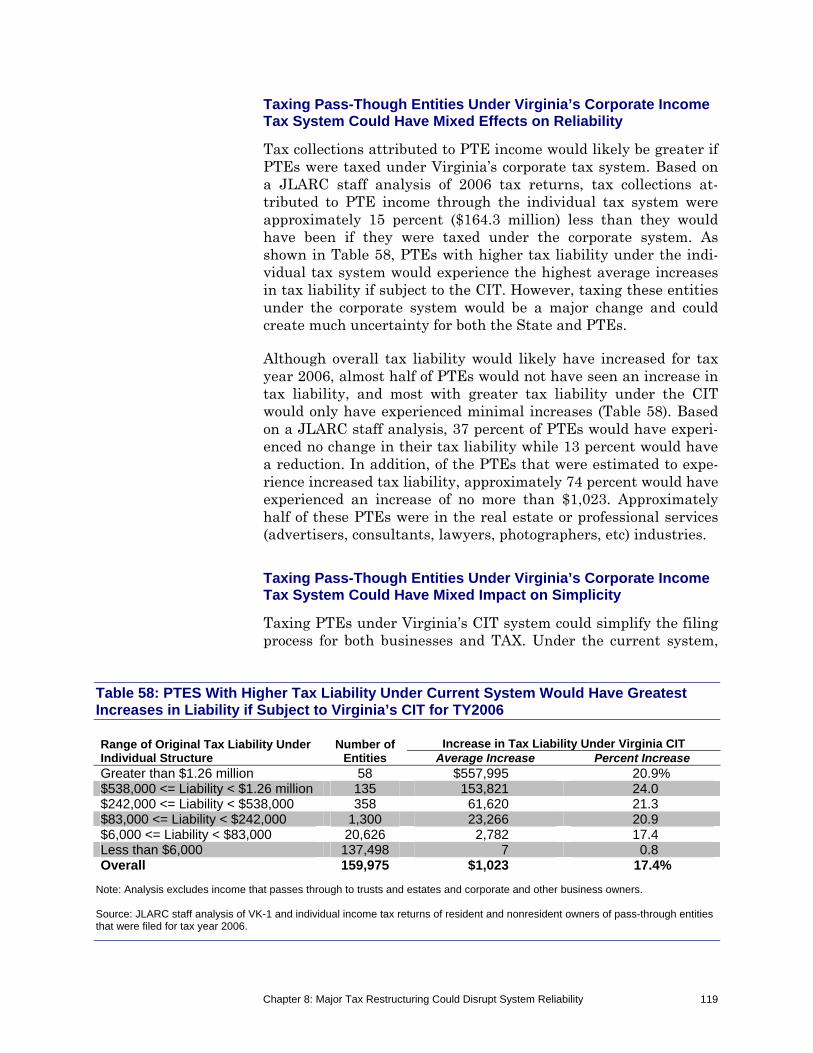
Chapter 8: Major Tax Restructuring Could Disrupt System Reliability 119
Taxing Pass-Though Entities Under Virginia’s Corporate Income Tax System Could Have Mixed Effects on Reliability
Tax collections attributed to PTE income would likely be greater if PTEs were taxed under Virginia’s corporate tax system. Based on a JLARC staff analysis of 2006 tax returns, tax collections at-tributed to PTE income through the individual tax system were approximately 15 percent ($164.3 million) less than they would have been if they were taxed under the corporate system. As shown in Table 58, PTEs with higher tax liability under the indi-vidual tax system would experience the highest average increases in tax liability if subject to the CIT. However, taxing these entities under the corporate system would be a major change and could create much uncertainty for both the State and PTEs.
Although overall tax liability would likely have increased for tax year 2006, almost half of PTEs would not have seen an increase in tax liability, and most with greater tax liability under the CIT would only have experienced minimal increases (Table 58). Based on a JLARC staff analysis, 37 percent of PTEs would have experi-enced no change in their tax liability while 13 percent would have a reduction. In addition, of the PTEs that were estimated to expe-rience increased tax liability, approximately 74 percent would have experienced an increase of no more than $1,023. Approximately half of these PTEs were in the real estate or professional services (advertisers, consultants, lawyers, photographers, etc) industries.
Taxing Pass-Though Entities Under Virginia’s Corporate Income Tax System Could Have Mixed Impact on Simplicity
Taxing PTEs under Virginia’s CIT system could simplify the filing process for both businesses and TAX. Under the current system,
Table 58: PTES With Higher Tax Liability Under Current System Would Have Greatest Increases in Liability if Subject to Virginia’s CIT for TY2006 Range of Original Tax Liability Under Individual Structure
Number of Entities
Increase in Tax Liability Under Virginia CITAverage Increase Percent Increase
Greater than $1.26 million 58 $557,995 20.9% $538,000 <= Liability < $1.26 million 135 153,821 24.0 $242,000 <= Liability < $538,000 358 61,620 21.3 $83,000 <= Liability < $242,000 1,300 23,266 20.9 $6,000 <= Liability < $83,000 20,626 2,782 17.4 Less than $6,000 137,498 7 0.8 Overall 159,975 $1,023 17.4%
Note: Analysis excludes income that passes through to trusts and estates and corporate and other business owners. Source: JLARC staff analysis of VK-1 and individual income tax returns of resident and nonresident owners of pass-through entities that were filed for tax year 2006.
Chapter 8: Major Tax Restructuring Could Disrupt System Reliability 120
PTEs must file a
return of income (Form 502) and, if necessary, related forms for calculating apportionment and other adjustments,
Virginia K-1 (VK-1) form for each of its owners,
unified nonresident owner return (Form 765), if all nonresi-dent owners agree to be included in the unified return.
The current filing process may not greatly burden PTEs with few owners, but likely becomes more significant as the number of own-ers increases. Although PTEs had an average of seven owners in 2006, over 2,500 PTEs had more than 20 owners, and more than 50 had over 1,000 owners.
TAX’s administrative burden would also be reduced if only one re-turn were required per PTE. If PTEs were taxed through the cor-porate system, the return of income would be replaced by the cor-porate return, and the VK-1 and unified nonresident return could be eliminated. In tax year 2006, TAX processed 540,000 VK-1 forms and 2,100 unified nonresident returns, and the number of PTEs appears to continue growing. According to TAX’s annual re-ports, the number of PTEs filing returns of income increased by seven percent (11,000 PTEs) between tax years 2005 and 2007.
However, requiring PTEs to pay Virginia’s CIT could increase oth-er facets of the tax burden for businesses as well as TAX. Busi-nesses’ compliance burden could increase because they would need to make adjustments to total income as reported on their federal return of partnership income form before filing corporate taxes in Virginia if the CIT included provisions to avoid double taxation at the PTE owners’ level. For example, PTE owners would need to re-duce their total income by taxes paid by the PTE before calculating their tax liability in Virginia, and TAX would need to develop guidance as to how PTE owners should perform this calculation. In addition, subjecting sole proprietorships to Virginia’s CIT could in-crease the complexity of the filing process. Currently, sole proprie-torships do not file a Form 502 PTE return of income. Instead, the business’s income is included in the owners individual income tax form. If sole proprietorships were taxed under the corporate sys-tem, owners would have to file both corporate income and individ-ual income tax returns.
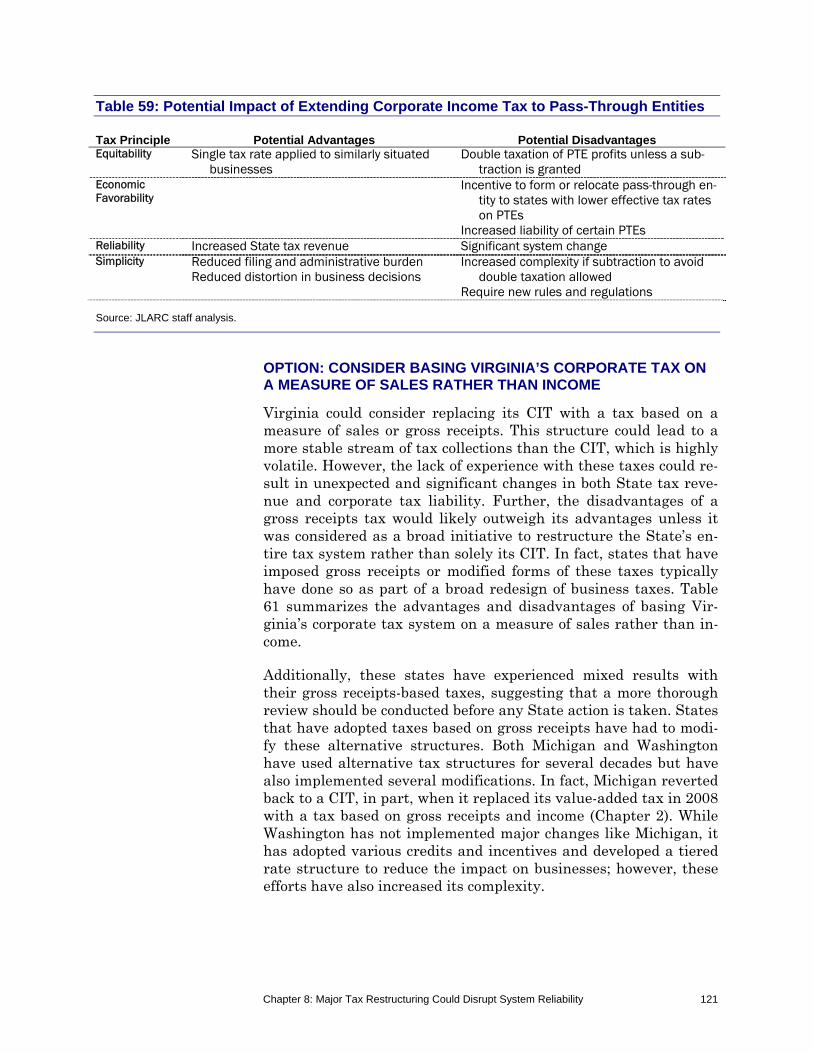
Chapter 8: Major Tax Restructuring Could Disrupt System Reliability 121
Table 59: Potential Impact of Extending Corporate Income Tax to Pass-Through Entities Tax Principle Potential Advantages Potential DisadvantagesEquitability Single tax rate applied to similarly situated
businesses Double taxation of PTE profits unless a sub-
traction is granted Economic Favorability
Incentive to form or relocate pass-through en-tity to states with lower effective tax rates on PTEs
Increased liability of certain PTEs Reliability Increased State tax revenue Significant system change Simplicity Reduced filing and administrative burden
Reduced distortion in business decisions Increased complexity if subtraction to avoid
double taxation allowed Require new rules and regulations
Source: JLARC staff analysis.
OPTION: CONSIDER BASING VIRGINIA’S CORPORATE TAX ON A MEASURE OF SALES RATHER THAN INCOME
Virginia could consider replacing its CIT with a tax based on a measure of sales or gross receipts. This structure could lead to a more stable stream of tax collections than the CIT, which is highly volatile. However, the lack of experience with these taxes could re-sult in unexpected and significant changes in both State tax reve-nue and corporate tax liability. Further, the disadvantages of a gross receipts tax would likely outweigh its advantages unless it was considered as a broad initiative to restructure the State’s en-tire tax system rather than solely its CIT. In fact, states that have imposed gross receipts or modified forms of these taxes typically have done so as part of a broad redesign of business taxes. Table 61 summarizes the advantages and disadvantages of basing Vir-ginia’s corporate tax system on a measure of sales rather than in-come.
Additionally, these states have experienced mixed results with their gross receipts-based taxes, suggesting that a more thorough review should be conducted before any State action is taken. States that have adopted taxes based on gross receipts have had to modi-fy these alternative structures. Both Michigan and Washington have used alternative tax structures for several decades but have also implemented several modifications. In fact, Michigan reverted back to a CIT, in part, when it replaced its value-added tax in 2008 with a tax based on gross receipts and income (Chapter 2). While Washington has not implemented major changes like Michigan, it has adopted various credits and incentives and developed a tiered rate structure to reduce the impact on businesses; however, these efforts have also increased its complexity.
Chapter 8: Major Tax Restructuring Could Disrupt System Reliability 122
Basing Virginia’s Corporate Tax on Measure of Sales Could Improve Reliability but Have a Mixed Impact on Equitability
Adopting a tax based on sales could improve some facets of Virgin-ia’s system of taxing businesses. For example, adopting a tax based on sales could improve the reliability of Virginia’s CIT because it tends to provide a more stable source of revenue than those based on net income or profits. Although tax revenues collected on gross receipts would still fluctuate from year to year, they would not vary as greatly as taxes based on income because all businesses would pay taxes every year. In contrast, businesses that are taxed on their income only pay taxes in years when they earn a profit. In addition, federal restrictions prohibiting states from taxing corpo-rations whose only in-state activities include soliciting sales of tangible goods apply to income but not gross receipts taxes, so Vir-ginia could collect taxes from these entities. While equitability could be improved if a gross receipts tax was imposed on all or most business structures rather than just C corporations, the tax could reduce vertical equity because all businesses are taxed at the same rate even though those with lower profits have less ability to pay the tax.
Basing Virginia’s Corporate Tax on Measure of Sales Could Hinder Economic Favorability
Adopting a gross receipts tax could negatively impact Virginia’s economic favorability if it increases the overall tax burden borne by businesses. One of the chief criticisms of a gross receipts tax is its pyramid effect on the total tax imposed on a product. Under a gross receipts tax system, a tax is applied every time a product changes hands (Table 60). In some industries, products move through multiple stages before reaching their finished stage. With each stage of production, the effective tax rate of the product in-creases, and industries with such products may be discouraged from locating or expanding their operations in Virginia. However, the impact that a gross receipts tax could have on businesses’ tax burden could be mitigated if it replaced multiple taxes or if certain deductions were allowed. For example, Virginia could consider im-plementing a gross receipts tax to replace corporate income and other forms of taxes paid by businesses similar to Texas, which re-placed its corporate franchise and property taxes with a modified gross receipts tax (Chapter 2).
Basing Virginia’s Corporate Tax on Measure of Sales Could Reduce Simplicity
While modifications to a gross receipts tax could address many of the negative consequences described above, they would likely in-crease the complexity of such a tax unless implemented as part of
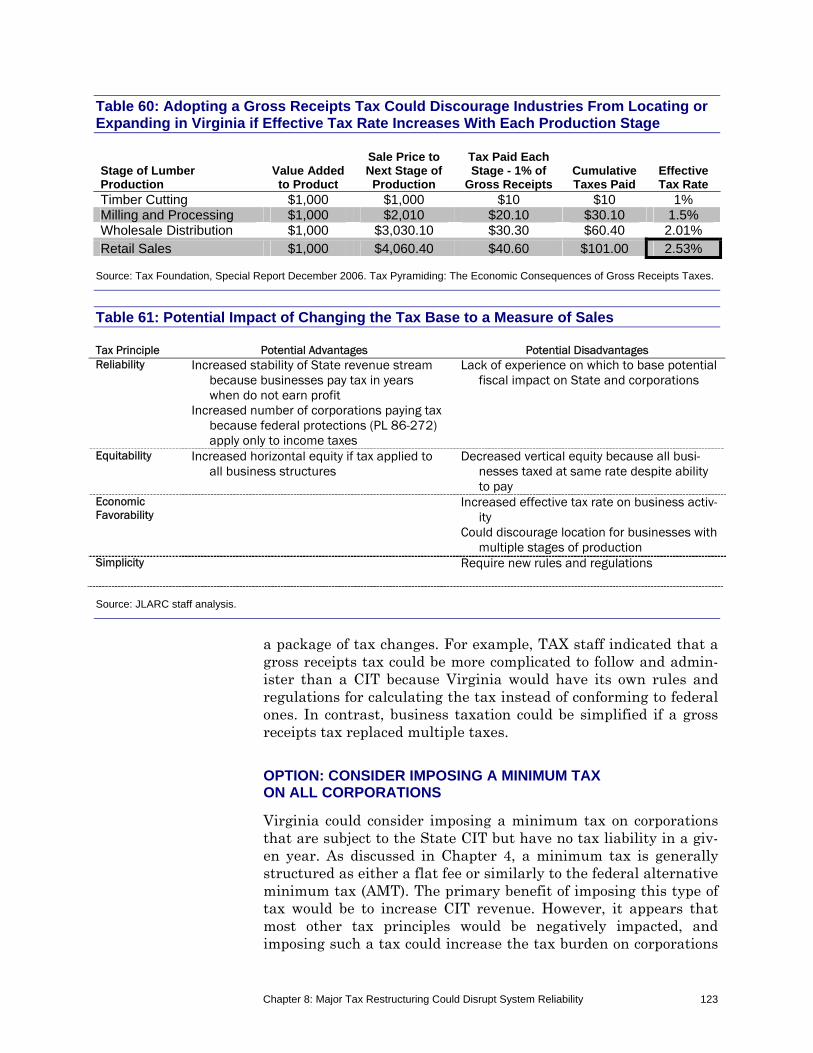
Chapter 8: Major Tax Restructuring Could Disrupt System Reliability 123
Table 60: Adopting a Gross Receipts Tax Could Discourage Industries From Locating or Expanding in Virginia if Effective Tax Rate Increases With Each Production Stage
Stage of Lumber Production
Value Added to Product
Sale Price to Next Stage of Production
Tax Paid Each Stage - 1% of
Gross Receipts Cumulative Taxes Paid
Effective Tax Rate
Timber Cutting $1,000 $1,000 $10 $10 1% Milling and Processing $1,000 $2,010 $20.10 $30.10 1.5% Wholesale Distribution $1,000 $3,030.10 $30.30 $60.40 2.01% Retail Sales $1,000 $4,060.40 $40.60 $101.00 2.53%
Source: Tax Foundation, Special Report December 2006. Tax Pyramiding: The Economic Consequences of Gross Receipts Taxes.
Table 61: Potential Impact of Changing the Tax Base to a Measure of Sales Tax Principle Potential Advantages Potential Disadvantages Reliability Increased stability of State revenue stream
because businesses pay tax in years when do not earn profit
Increased number of corporations paying tax because federal protections (PL 86-272) apply only to income taxes
Lack of experience on which to base potential fiscal impact on State and corporations
Equitability Increased horizontal equity if tax applied to all business structures
Decreased vertical equity because all busi-nesses taxed at same rate despite ability to pay
Economic Favorability
Increased effective tax rate on business activ-ity
Could discourage location for businesses with multiple stages of production
Simplicity Require new rules and regulations
Source: JLARC staff analysis.
a package of tax changes. For example, TAX staff indicated that a gross receipts tax could be more complicated to follow and admin-ister than a CIT because Virginia would have its own rules and regulations for calculating the tax instead of conforming to federal ones. In contrast, business taxation could be simplified if a gross receipts tax replaced multiple taxes.
OPTION: CONSIDER IMPOSING A MINIMUM TAX ON ALL CORPORATIONS
Virginia could consider imposing a minimum tax on corporations that are subject to the State CIT but have no tax liability in a giv-en year. As discussed in Chapter 4, a minimum tax is generally structured as either a flat fee or similarly to the federal alternative minimum tax (AMT). The primary benefit of imposing this type of tax would be to increase CIT revenue. However, it appears that most other tax principles would be negatively impacted, and imposing such a tax could increase the tax burden on corporations
Chapter 8: Major Tax Restructuring Could Disrupt System Reliability 124
that are unprofitable. Table 62 summarizes the advantages and disadvantages of imposing a minimum tax on all corporations.
Imposing a Minimum Tax Would Primarily Increase Reliability of State Revenues
The primary advantage of imposing a minimum tax appears to be increased State revenue collections. The extent to which revenue would increase depends on the base of the minimum tax and the number of entities that would be subject to it. While Virginia could impose a minimum tax based on a low flat fee to reduce the finan-cial burden on corporations, a large number of corporate taxpayers would be impacted. According to a JLARC staff analysis of tax year 2006 corporate returns, approximately 46,000 corporations (62 percent) had no taxable income and therefore no income tax liabil-ity.
While imposing a minimum tax would likely generate additional revenue for Virginia, it would likely have negative effects on sev-eral other components of reliability. First, imposing a minimum tax could burden corporations not realizing profits. One of the in-herent principles of the income tax is that entities are taxed based on their ability to pay. As a result, corporations with higher in-come pay higher taxes while corporations that realized net losses, such as new firms or established companies during economic downturns, have no tax liability. The federal AMT was designed as a measure to prevent high profit taxpayers from artificially creat-ing a net loss by taking advantage of deductions and other tax preferences. However, most state-level minimum taxes are also imposed on corporations that realized losses rather than only cor-porations that reduced their taxable income through tax prefer-ences.
Second, tax experts in favor of imposing a state minimum tax ar-gue that corporations should pay some amount for the public bene-fits they receive even in years in which they do not earn a profit. However, many corporations are likely paying some other form of State or local taxes such as the business and professional occupa-tions licensing tax, or sales and use tax in years when they do not earn a profit.
Imposing a Minimum Tax Could Hinder Simplicity of Virginia’s Corporate Income Tax System
Imposing a minimum tax could hinder simplicity, particularly if the minimum tax were based on a measure of sales such as gross receipts or gross profits. Such a structure would require corpora-tions to assess their tax liability on two bases and would increase TAX’s administrative duties of processing and auditing additional
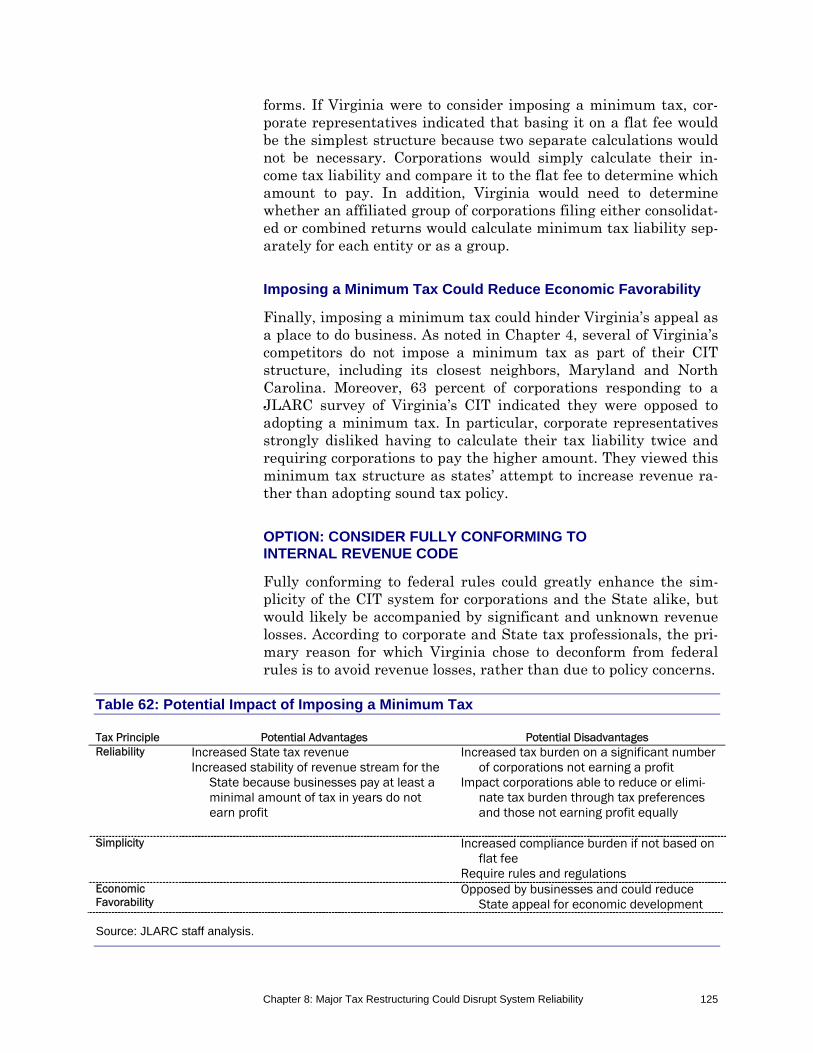
Chapter 8: Major Tax Restructuring Could Disrupt System Reliability 125
forms. If Virginia were to consider imposing a minimum tax, cor-porate representatives indicated that basing it on a flat fee would be the simplest structure because two separate calculations would not be necessary. Corporations would simply calculate their in-come tax liability and compare it to the flat fee to determine which amount to pay. In addition, Virginia would need to determine whether an affiliated group of corporations filing either consolidat-ed or combined returns would calculate minimum tax liability sep-arately for each entity or as a group.
Imposing a Minimum Tax Could Reduce Economic Favorability
Finally, imposing a minimum tax could hinder Virginia’s appeal as a place to do business. As noted in Chapter 4, several of Virginia’s competitors do not impose a minimum tax as part of their CIT structure, including its closest neighbors, Maryland and North Carolina. Moreover, 63 percent of corporations responding to a JLARC survey of Virginia’s CIT indicated they were opposed to adopting a minimum tax. In particular, corporate representatives strongly disliked having to calculate their tax liability twice and requiring corporations to pay the higher amount. They viewed this minimum tax structure as states’ attempt to increase revenue ra-ther than adopting sound tax policy.
OPTION: CONSIDER FULLY CONFORMING TO INTERNAL REVENUE CODE
Fully conforming to federal rules could greatly enhance the sim-plicity of the CIT system for corporations and the State alike, but would likely be accompanied by significant and unknown revenue losses. According to corporate and State tax professionals, the pri-mary reason for which Virginia chose to deconform from federal rules is to avoid revenue losses, rather than due to policy concerns.
Table 62: Potential Impact of Imposing a Minimum Tax Tax Principle Potential Advantages Potential Disadvantages Reliability Increased State tax revenue
Increased stability of revenue stream for the State because businesses pay at least a minimal amount of tax in years do not earn profit
Increased tax burden on a significant number of corporations not earning a profit
Impact corporations able to reduce or elimi-nate tax burden through tax preferences and those not earning profit equally
Simplicity Increased compliance burden if not based on
flat fee Require rules and regulations
Economic Favorability
Opposed by businesses and could reduce State appeal for economic development
Source: JLARC staff analysis.
Chapter 8: Major Tax Restructuring Could Disrupt System Reliability 126
As shown in Chapter 4, most of Virginia’s competitor states also deconform from federal rules in several areas. Based on interviews with corporate representatives and TAX staff, one of the most complex aspects of filing a CIT return in Virginia is having to ad-just federal taxable income to reflect areas in which Virginia has chosen to deconform, which are discussed in Chapter 3. In particu-lar, calculations related to net operating losses (NOL) and bonus depreciation are most prone to error. TAX staff indicated that the most common errors found in corporate returns were caused by the improper application of net operating losses. Because NOLs can be carried back for two years and forward for 20, the effects of decon-formity can be reflected in tax returns for many years. Similarly, the effect of deconforming from federal rules regarding bonus de-preciation will also be included in future tax years because they af-fect depreciation over the entire useful life of depreciable assets.
It is because of these lagged effects as well as data limitations that it is not possible to meaningfully estimate the potential fiscal im-pact of conforming to federal NOL and bonus depreciation provi-sions. However, it is important to note that these provisions only change the timing of tax collections rather than affecting how much is ultimately collected. When the State initially took action on these two provisions in 2003, it was estimated that conforming to both provisions would have lowered tax revenue by $9 million in the first year and $2 million in the second year, but would have in-creased tax collections by $4 million in the third year. Based on a 2010 TAX analysis, the State could forego $63 million in 2011 and $32 million in 2012 if it opted to fully conform to CODI provisions, and an additional $10 million in 2011 and $20 million in 2012 by fully conforming to the domestic production deduction provision.
OPTION: CONSIDER ADOPTING MANDATORY UNITARY COMBINED REPORTING
Although mandatory unitary combined reporting (MUCR) appears to be an effective mechanism for negating the effects of certain ag-gressive tax planning strategies, its adoption could have an uncer-tain impact on State revenue and business activity while further complicating Virginia’s CIT system. As discussed in Chapter 3, the tax liability of corporations can be artificially reduced by using several tax planning strategies deemed aggressive by tax depart-ments, such as the use of passive investment companies (PICs) and real estate investment trusts (REITs) that lack a legitimate business purpose, as well as the practice of transfer pricing below fair market value.
MUCR is cited as an effective way to limit corporations’ ability to shift profits to lower-tax states and reduce their tax liability, as well as to address PICs and REITs. To mitigate the impact of ag-
Chapter 8: Major Tax Restructuring Could Disrupt System Reliability 127
gressive PICs and REITs, Virginia has adopted measures that ap-pear to be relatively well-designed and to generally achieve their intended purpose without being unduly rigid for corporations, ac-cording to representatives from TAX and several corporations. To-gether, these provisions are estimated to have increased State rev-enue by approximately $40 million in each of the last two years.
However, there is currently no mechanism to proactively deter the use of transfer pricing, and the impact of this practice on State revenue is unknown. Under MUCR, multistate corporations would be required to file returns reflecting the combined income of all its affiliates that participate in the same or related activities, includ-ing those that do not have nexus in Virginia. As a result, the im-pact of income shifting between affiliates would be nullified. Table 63 summarizes the potential advantages and disadvantages of adopting MUCR.
Adopting Mandatory Unitary Combined Reporting Could Improve Equitability
Adopting MUCR could improve the equitability of Virginia’s tax system toward corporations that do not engage in aggressive tax planning activities such as improper transfer pricing. MUCR is generally accepted as an effective, if imperfect, tool for addressing aggressive tax planning, and has been in effect for over 20 years in most states that use it. Still, tax professionals interviewed by JLARC staff cautioned that this option would be unlikely to ad-dress all methods of aggressive tax planning. For example, a uni-tary group could conduct intercompany transactions with affiliates that are related yet not part of the unitary group, and still take advantage of transfer pricing. Further, new tax planning practices are always evolving, and tax professionals indicated that alterna-tive strategies would likely arise as more states adopt MUCR. Still, State audit efforts are geared to identify new strategies that are not yet addressed in the State’s tax system.
Adopting Mandatory Unitary Combined Reporting Could Have Unknown Impact on Reliability of State Revenue
Perhaps the greatest uncertainty about the impact of adopting MUCR is its fiscal impact on State revenue. Because corporations are not required to report any information on affiliates that do not presently have nexus in the State, it is unknown how many such affiliates would be newly included in a unitary group return and what their financial position may be. Yet whether the inclusion of these affiliates would increase or decrease Virginia tax collections depends upon their current and past profitability. Some of the en-tities brought into the unitary group may have losses and there-fore reduce the corporation’s Virginia taxable income, while the
Transfer Pricing
Corporations can re-duce their tax liability in a state by shifting in-come to affiliates through the sales of products and services not valued at a fair price. With this strate-gy, corporations first sell their products to affiliates located in lower-tax states, which in turn sell the goods to final customers. Corpo-rations can set the sales price of their products to affiliates at an artificially low level in order to minimize their profits in the high-er-tax state.
Chapter 8: Major Tax Restructuring Could Disrupt System Reliability 128
addition of profitable affiliates could allow the unitary group to uti-lize more of their net operating losses, which can be carried for-ward for up to 20 years as discussed in Chapter 3. Further, corpo-rations’ tax liability may go down in Virginia if newly added affiliates have a small apportionment factor that dilutes the group’s overall factor and reduces the amount of income appor-tioned to the State.
Although several states have attempted to determine the potential impact of adopting MUCR, their estimates often suffer from the same data limitations that precluded a Virginia-specific analysis. Their results ranged widely, from a three to a 20 percent increase in tax collections. This variation may be partially due to the fact that states often subject different corporations to their income tax, as described in Chapter 2. A regression analysis conducted for the state of Tennessee found no evidence that states using MUCR col-lect more revenue than other states, after controlling for differ-ences in tax systems. Only Minnesota conducted an analysis of the impact of MUCR after its implementation, which found that it had no effect on tax revenue. This finding was attributed to the impact of net operating losses that previously could not be used.
Because Virginia already addresses aggressive tax practices in-volving PICs and REITs, the potential increase in tax collections from adopting MUCR would likely be less than in states without such provisions. In fact, analyses conducted by states that have an addback provision estimated revenue increases of three to nine percent, rather than up to 20 percent. In addition, TAX has the au-thority to require affiliated corporations to file a unitary return if there is reason to believe that they engage in inappropriate trans-fer pricing, such that separate returns improperly reflect the “business done or the Virginia taxable income earned from busi-ness done in this Commonwealth.” Further, this authority is suffi-ciently broad to allow the department to require unitary filing when the PIC and REIT addback statutes are insufficient. TAX staff indicated that this authority is an excellent tool, although it has been less frequently needed since the enactment of addback provisions.
Adopting Mandatory Unitary Combined Reporting Could Negatively Affect Economic Favorability
Although the majority of states that impose a CIT have used MUCR for many years, only three of Virginia’s ten biggest compet-itor states (California, Illinois, and New York) have adopted this practice while the others utilize addback provisions, as described in Chapter 3. As a result, adopting MUCR in Virginia could be perceived as detrimental to the State’s business environment, ac-cording to interviews with corporate representatives. Still, given
Chapter 8: Major Tax Restructuring Could Disrupt System Reliability 129
Virginia’s otherwise favorable climate and attributes, it is unclear to what extent MUCR could diminish new and existing business activity in the State.
Interviews with corporate representatives and a review of the re-search literature suggest that businesses often oppose MUCR on grounds that it is an inappropriate reflection of the income earned in a state. Specifically, states that use MUCR impose taxes on cor-porate affiliates that do not have nexus, meaning no activity, in their state. While this may be appropriate to nullify the effect of transactions conducted strictly for tax purposes, it is not possible to limit MUCR strictly to corporations using aggressive tax plan-ning strategies. As a result, the income of corporations that do not engage in transfer pricing may not consistently be taxed where it is earned.
Adopting Mandatory Unitary Combined Reporting Could Hinder Simplicity
According to State tax professionals interviewed for this study and a review of the research literature, MUCR can be very complex to design and follow. In particular, representatives from TAX and corporations alike indicated that defining and determining which affiliates should be part of the unitary group could be especially difficult. In most states that use MUCR, two broad measures are applied to determine whether to include an affiliate. The first is based on a minimum level of common ownership (usually 50 per-cent) between affiliates, which is fairly concrete. The second gen-erally attempts to determine the extent and nature of the business relationship between affiliated members, which is more subjective and difficult to apply. For example, some states require a certain level of managerial and financial interaction characterized by “uni-ty of use and management”. Because most states appear to use varying definitions, corporations subject to MUCR in one state may file on a different unitary basis in another. Staff from TAX in-dicated that the transition to MUCR could be difficult as corpora-tions become familiar with Virginia’s definitions and parameters, and the State encounters situations unforeseen in statute or regu-lations. The transition could be accompanied by an increase in ap-peals and legal challenges, and may also necessitate a shift in the focus of audit functions.
OPTION: CONSIDER REPLACING TAX CREDITS WITH GRANTS
Replacing Virginia’s tax credits with grants administered inde-pendently of the CIT system could simplify the system and im-prove the cost-effectiveness of the incentives offered. Tax credits designed to encourage economic development could be replaced
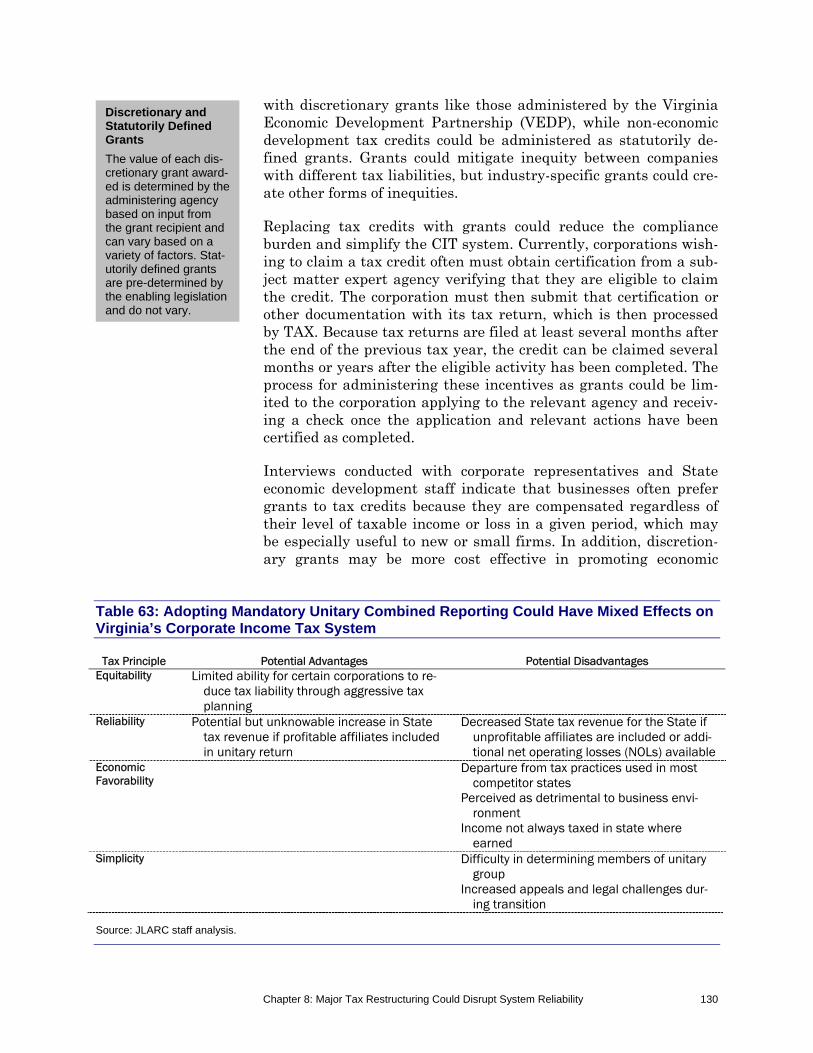
Chapter 8: Major Tax Restructuring Could Disrupt System Reliability 130
with discretionary grants like those administered by the Virginia Economic Development Partnership (VEDP), while non-economic development tax credits could be administered as statutorily de-fined grants. Grants could mitigate inequity between companies with different tax liabilities, but industry-specific grants could cre-ate other forms of inequities.
Replacing tax credits with grants could reduce the compliance burden and simplify the CIT system. Currently, corporations wish-ing to claim a tax credit often must obtain certification from a sub-ject matter expert agency verifying that they are eligible to claim the credit. The corporation must then submit that certification or other documentation with its tax return, which is then processed by TAX. Because tax returns are filed at least several months after the end of the previous tax year, the credit can be claimed several months or years after the eligible activity has been completed. The process for administering these incentives as grants could be lim-ited to the corporation applying to the relevant agency and receiv-ing a check once the application and relevant actions have been certified as completed.
Interviews conducted with corporate representatives and State economic development staff indicate that businesses often prefer grants to tax credits because they are compensated regardless of their level of taxable income or loss in a given period, which may be especially useful to new or small firms. In addition, discretion-ary grants may be more cost effective in promoting economic
Table 63: Adopting Mandatory Unitary Combined Reporting Could Have Mixed Effects on Virginia’s Corporate Income Tax System
Tax Principle Potential Advantages Potential Disadvantages Equitability Limited ability for certain corporations to re-
duce tax liability through aggressive tax planning
Reliability Potential but unknowable increase in State tax revenue if profitable affiliates included in unitary return
Decreased State tax revenue for the State if unprofitable affiliates are included or addi-tional net operating losses (NOLs) available
Economic Favorability
Departure from tax practices used in most competitor states
Perceived as detrimental to business envi-ronment
Income not always taxed in state where earned
Simplicity Difficulty in determining members of unitary group
Increased appeals and legal challenges dur-ing transition
Source: JLARC staff analysis.
Discretionary and Statutorily Defined Grants
The value of each dis-cretionary grant award-ed is determined by the administering agency based on input from the grant recipient and can vary based on a variety of factors. Stat-utorily defined grants are pre-determined by the enabling legislation and do not vary.
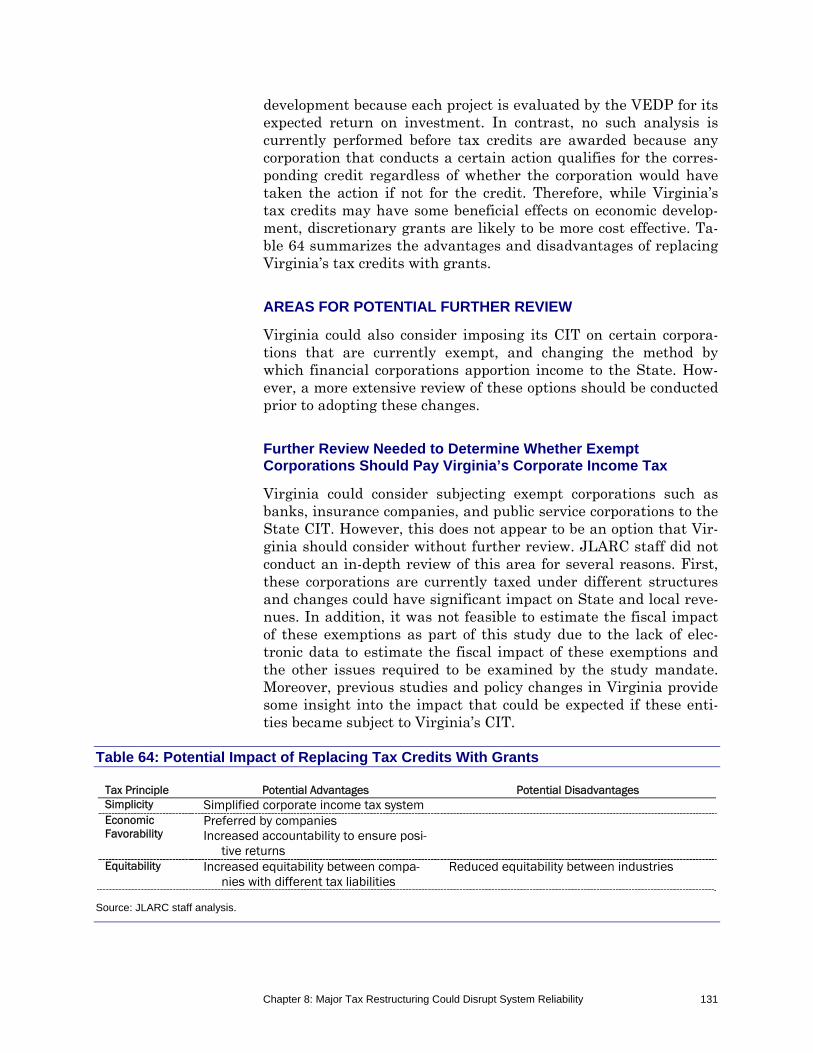
Chapter 8: Major Tax Restructuring Could Disrupt System Reliability 131
development because each project is evaluated by the VEDP for its expected return on investment. In contrast, no such analysis is currently performed before tax credits are awarded because any corporation that conducts a certain action qualifies for the corres- ponding credit regardless of whether the corporation would have taken the action if not for the credit. Therefore, while Virginia’s tax credits may have some beneficial effects on economic develop-ment, discretionary grants are likely to be more cost effective. Ta-ble 64 summarizes the advantages and disadvantages of replacing Virginia’s tax credits with grants.
AREAS FOR POTENTIAL FURTHER REVIEW
Virginia could also consider imposing its CIT on certain corpora-tions that are currently exempt, and changing the method by which financial corporations apportion income to the State. How-ever, a more extensive review of these options should be conducted prior to adopting these changes.
Further Review Needed to Determine Whether Exempt Corporations Should Pay Virginia’s Corporate Income Tax
Virginia could consider subjecting exempt corporations such as banks, insurance companies, and public service corporations to the State CIT. However, this does not appear to be an option that Vir-ginia should consider without further review. JLARC staff did not conduct an in-depth review of this area for several reasons. First, these corporations are currently taxed under different structures and changes could have significant impact on State and local reve-nues. In addition, it was not feasible to estimate the fiscal impact of these exemptions as part of this study due to the lack of elec-tronic data to estimate the fiscal impact of these exemptions and the other issues required to be examined by the study mandate. Moreover, previous studies and policy changes in Virginia provide some insight into the impact that could be expected if these enti-ties became subject to Virginia’s CIT.
Table 64: Potential Impact of Replacing Tax Credits With Grants
Tax Principle Potential Advantages Potential Disadvantages Simplicity Simplified corporate income tax system Economic Favorability
Preferred by companies Increased accountability to ensure posi-
tive returns
Equitability Increased equitability between compa-nies with different tax liabilities
Reduced equitability between industries
Source: JLARC staff analysis.
Chapter 8: Major Tax Restructuring Could Disrupt System Reliability 132
Equitability could be enhanced if banks, insurance companies, and public service corporations were subject to the same tax structure as other corporations. As described in Chapter 2, states have his-torically exempted these industries for various reasons, many of which are no longer relevant. However, tax revenue could be sig-nificantly impacted by requiring these corporations to pay the CIT. Subjecting banks to Virginia’s CIT could have a mixed effect on to-tal tax revenue because state revenues would increase but local revenues would decline. According to TAX staff, State tax revenue would likely increase if banks and other financial institutions were subject to Virginia’s CIT instead of the franchise tax. Compared to the CIT rate of six percent, the bank franchise tax is collected at a rate of one dollar per each $100 dollars of net capital, or at a rate of one percent. In contrast, local revenues would significantly de-crease because the State distributes 80 percent of franchise tax col-lections to local governments, which amounted to $87 million in lo-cal revenues in FY 2009.
Requiring public service corporations and insurance companies to pay Virginia’s CIT could result in revenue reductions. Most public service corporations with the exception of water companies are subject to Virginia’s CIT, but electric and telecommunications cor-porations may pay a minimum tax if their CIT liability is lower than their tax liability assessed on gross receipts. According to TAX data, the minimum tax generated $23 million more in tax revenue than would otherwise have been collected if these corpora-tions paid corporate income taxes instead. Data was not available to determine whether water companies would pay more or less un-der the CIT system than they pay on their gross receipts. Accord-ing to TAX staff, insurance companies would likely pay lower taxes if they were subject to Virginia’s CIT. Furthermore, a 2000 report to the General Assembly on Virginia’s insurance premium’s tax re-ported that a 15.1 percent tax on insurance companies’ income would be needed to yield equivalent revenues as Virginia’s premi-ums tax. This finding, although a decade old, suggests that tax col-lections from insurance companies would significantly decrease under the CIT.
Further Review Needed to Determine Whether Financial Corporation Apportionment Should Be Revised
Although adopting market-based sourcing could increase the equi-tability of Virginia’s CIT for companies providing tangible and in-tangible goods or services, it could result in the inequitable treat-ment of financial corporations. If the General Assembly wishes to adopt market-based sourcing, it should also consider whether the special apportionment method used by financial corporations should be changed to a market-based method as well. Currently, financial corporations use a special method to apportion income to

Chapter 8: Major Tax Restructuring Could Disrupt System Reliability 133
Virginia based on the proportion of income-producing activity in the Commonwealth over income-producing activity everywhere (a proportional cost of performance method). As indicated in Chapter 4, Virginia is the only state that apportions the income of financial corporations using this method. In contrast, most states apportion the income of these corporations based on sales alone or a special three-factor formula based on property (including intangibles), payroll, and sales.

Chapter 8: Major Tax Restructuring Could Disrupt System Reliability 134
Appendix A: Study Mandate 135
HOUSE JOINT RESOLUTION NO. 681 Directing the Joint Legislative Audit and Review Commission to study Virginia's corporate in-come tax system. Report.
Agreed to by the House of Delegates, February 26, 2009 Agreed to by the Senate, February 24, 2009
WHEREAS, Virginia has had some form of corporate tax since the mid-1850s; and
WHEREAS, the corporate income tax in its current form evolved in the early 1900s; and
WHEREAS, many changes have occurred in the way the tax is calculated since that time, includ-ing additional deductions, exemptions, and tax credits; and
WHEREAS, changes in the economy not only in Virginia and throughout the United States but also around the world affect the way businesses operate; and
WHEREAS, the corporate income tax system has been in existence for more than 100 years and has not been examined in its entirety in at least the last 30 years, and many global changes have occurred affecting businesses and how they operate; now, therefore, be it
RESOLVED by the House of Delegates, the Senate concurring, That the Joint Legislative Audit and Review Commission be directed to study Virginia’s corporate income tax system.
In conducting its study, Joint Legislative Audit and Review Commission shall examine all facets of the corporate income tax system and how it compares with other states' corporate income tax systems, especially those states similarly situated to Virginia economically and demographically. In particular, the Joint Legislative Audit and Review Commission shall compare corporate in-come tax rates, revenues, exemptions, credits, and any other tax preferences afforded corpora-tions. The Joint Legislative Audit and Review Commission shall also consider Virginia's use of a cost-of-performance formula to calculate corporate income tax of multistate corporations versus the use of a market-based assessment implemented by other states. Finally, the Joint Legislative Audit and Review Commission shall examine how many businesses have moved into and out of Virginia during the last 20 years and how many have expanded and minimized their operations in Virginia during the last 20 years and attempt to determine what impact the corporate income tax had on these actions.
Technical assistance shall be provided by the Department of Taxation and the Virginia Economic Development Partnership. All agencies of the Commonwealth shall provide assistance for this study, upon request.
Ap
pen
dix
AA SSttuuddyy MMaannddaattee

Appendix A: Study Mandate 136
The Joint Legislative Audit and Review Commission shall complete its meetings for the first year by November 30, 2009, and for the second year by November 30, 2010, and the chairman shall submit to the Division of Legislative Automated Systems an executive summary of its find-ings and recommendations no later than the first day of the next Regular Session of the General Assembly for each year. Each executive summary shall state whether the Joint Legislative Audit and Review Commission intends to submit to the General Assembly and the Governor a report of its findings and recommendations for publication as a House or Senate document. The execu-tive summaries and reports shall be submitted as provided in the procedures of the Division of Legislative Automated Systems for the processing of legislative documents and reports and shall be posted on the General Assembly's website.
Appendix B: Research Activities and Methods 137
Key research activities for this study included
case studies of seven corporations with Virginia locations;
survey of corporations and pass-through entities (PTEs);
quantitative analysis of corporate tax returns and PTE re-turns of income for tax year 2006, dynamic economic model-ing results, and national data on business locations between 1987 and 2007;
structured interviews with staff from State agencies and stakeholder groups;
reviews of Virginia’s and other states’ corporate income tax (CIT) systems; and
reviews of the research literature on state CIT systems and the effect of taxes on economic development.
CASE STUDIES OF CORPORATIONS
JLARC staff visited seven Virginia corporations to conduct struc-tured interviews with executive staff who have detailed knowledge of their employer’s income tax position and strategy for business expansion. Several criteria were used to ensure that the group of corporations selected represented a wide variety of business inter-ests, including size, industry, location, and changes in Virginia op-erations. These visits were conducted in May and June 2010, and each was completed in one day. In one case, the interview was handled over the phone to reduce the time and cost associated with travel. Executive corporate staff interviewed included directors and managers of state and local taxes, directors of government in-centives, directors of public affairs and government relations, facil-ity managers, and retained certified public accountants and tax at-torneys.
Topics discussed during case study interviews included
the burden of Virginia’s CIT relative to other State and local taxes,
the simplicity and equitability of Virginia’s CIT system,
Ap
pen
dix
BB
RReesseeaarrcchh AAccttiivviittiieess aanndd MMeetthhooddss
Appendix B: Research Activities and Methods 138
the potential options Virginia could implement to improve the CIT system,
the impact of taxes on economic development and corporate site location decisions, and
the effectiveness of tax and non-tax business incentives.
SURVEY OF BUSINESSES
JLARC staff surveyed Virginia businesses to gather their perspec-tive on Virginia’s CIT system and factors impacting site selections. The survey was designed to supplement the information obtained in site visits, structured interviews, and reviews of the literature. Survey topics included
the complexity of Virginia’s CIT returns and calculations;
the equitability of Virginia’s CIT rules;
the appropriateness of Virginia’s CIT liability;
the economic favorability of Virginia’s CIT incentives, includ-ing single sales factor (SSF) apportionment and tax credits; and
Virginia’s performance on factors impacting corporate site se-lection.
JLARC staff worked with 14 major business associations in Virgin-ia, including all of the local chambers of commerce, to disseminate information to their members about the survey and how to access it. Surveys were completed by 213 businesses, including 131 C cor-porations.
QUANTITATIVE ANALYSIS
JLARC staff analyzed data maintained by the Department of Tax-ation (TAX), specifically information contained in CIT returns and forms filed on behalf of PTEs and their owners. This data was used to analyze tax collections and develop a static estimate of how they might be impacted by potential changes to Virginia’s corporate tax structure. An economic modeling tool was used to create a dynamic forecast of the impact of eliminating Virginia’s CIT. JLARC staff also analyzed National Establishment Time Series (NETS) data to determine the extent to which businesses are locating and expand-ing in Virginia.
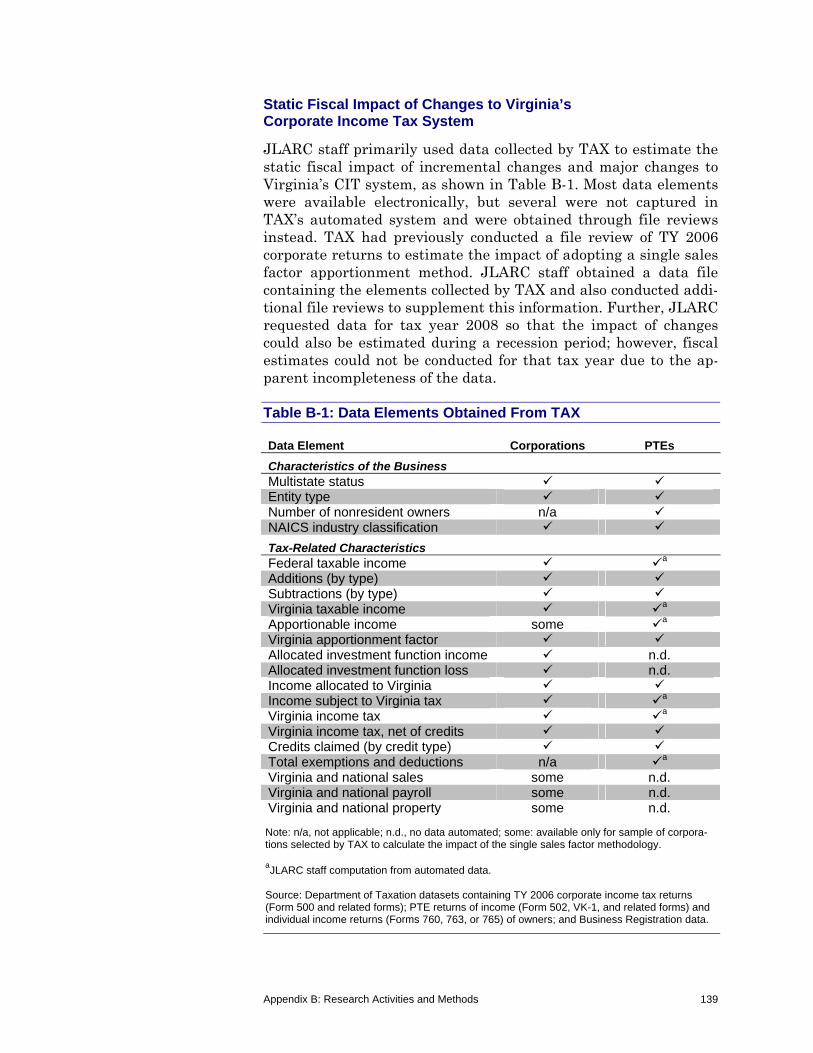
Appendix B: Research Activities and Methods 139
Static Fiscal Impact of Changes to Virginia’s Corporate Income Tax System
JLARC staff primarily used data collected by TAX to estimate the static fiscal impact of incremental changes and major changes to Virginia’s CIT system, as shown in Table B-1. Most data elements were available electronically, but several were not captured in TAX’s automated system and were obtained through file reviews instead. TAX had previously conducted a file review of TY 2006 corporate returns to estimate the impact of adopting a single sales factor apportionment method. JLARC staff obtained a data file containing the elements collected by TAX and also conducted addi-tional file reviews to supplement this information. Further, JLARC requested data for tax year 2008 so that the impact of changes could also be estimated during a recession period; however, fiscal estimates could not be conducted for that tax year due to the ap-parent incompleteness of the data.
Table B-1: Data Elements Obtained From TAX
Data Element Corporations PTEs
Characteristics of the Business Multistate status Entity type Number of nonresident owners n/a NAICS industry classification
Tax-Related Characteristics
Federal taxable income a
Additions (by type) Subtractions (by type) Virginia taxable income a
Apportionable income some a
Virginia apportionment factor Allocated investment function income n.d. Allocated investment function loss n.d. Income allocated to Virginia Income subject to Virginia tax a
Virginia income tax a
Virginia income tax, net of credits Credits claimed (by credit type) Total exemptions and deductions n/a a Virginia and national sales some n.d. Virginia and national payroll some n.d. Virginia and national property some n.d.
Note: n/a, not applicable; n.d., no data automated; some: available only for sample of corpora-tions selected by TAX to calculate the impact of the single sales factor methodology. aJLARC staff computation from automated data.
Source: Department of Taxation datasets containing TY 2006 corporate income tax returns (Form 500 and related forms); PTE returns of income (Form 502, VK-1, and related forms) and individual income returns (Forms 760, 763, or 765) of owners; and Business Registration data.
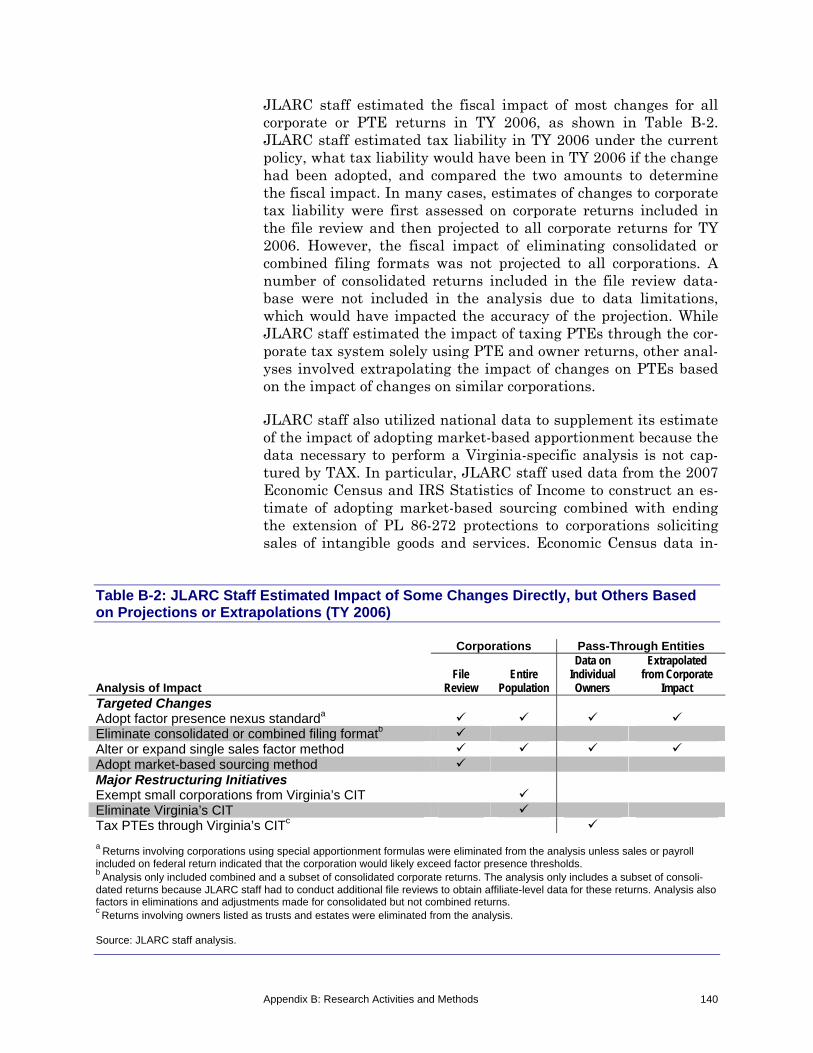
Appendix B: Research Activities and Methods 140
JLARC staff estimated the fiscal impact of most changes for all corporate or PTE returns in TY 2006, as shown in Table B-2. JLARC staff estimated tax liability in TY 2006 under the current policy, what tax liability would have been in TY 2006 if the change had been adopted, and compared the two amounts to determine the fiscal impact. In many cases, estimates of changes to corporate tax liability were first assessed on corporate returns included in the file review and then projected to all corporate returns for TY 2006. However, the fiscal impact of eliminating consolidated or combined filing formats was not projected to all corporations. A number of consolidated returns included in the file review data-base were not included in the analysis due to data limitations, which would have impacted the accuracy of the projection. While JLARC staff estimated the impact of taxing PTEs through the cor-porate tax system solely using PTE and owner returns, other anal-yses involved extrapolating the impact of changes on PTEs based on the impact of changes on similar corporations.
JLARC staff also utilized national data to supplement its estimate of the impact of adopting market-based apportionment because the data necessary to perform a Virginia-specific analysis is not cap-tured by TAX. In particular, JLARC staff used data from the 2007 Economic Census and IRS Statistics of Income to construct an es-timate of adopting market-based sourcing combined with ending the extension of PL 86-272 protections to corporations soliciting sales of intangible goods and services. Economic Census data in-
Table B-2: JLARC Staff Estimated Impact of Some Changes Directly, but Others Based on Projections or Extrapolations (TY 2006)
Analysis of Impact
Corporations Pass-Through Entities
File Review
Entire Population
Data on Individual Owners
Extrapolated from Corporate
Impact Targeted Changes Adopt factor presence nexus standarda Eliminate consolidated or combined filing formatb Alter or expand single sales factor method Adopt market-based sourcing method Major Restructuring Initiatives Exempt small corporations from Virginia’s CIT Eliminate Virginia’s CIT Tax PTEs through Virginia’s CITc
a Returns involving corporations using special apportionment formulas were eliminated from the analysis unless sales or payroll
included on federal return indicated that the corporation would likely exceed factor presence thresholds. b Analysis only included combined and a subset of consolidated corporate returns. The analysis only includes a subset of consoli-dated returns because JLARC staff had to conduct additional file reviews to obtain affiliate-level data for these returns. Analysis also factors in eliminations and adjustments made for consolidated but not combined returns. c Returns involving owners listed as trusts and estates were eliminated from the analysis. Source: JLARC staff analysis.
Appendix B: Research Activities and Methods 141
cludes estimates of the number of business establishments, total payroll, and population in Virginia and the United States. This in-formation was used to construct average Virginia property, pay-roll, and sales factors, and ultimately to estimate an average Vir-ginia apportionment factor under market-based apportionment. Then, JLARC staff applied the average apportionment factor for Virginia to the amount of federal taxable income reported to the federal government (Statistics of Income) for tax year 2006 to de-termine the amount of taxable income and tax liability in Virginia.
Dynamic Forecasting of the Impact of Eliminating Virginia’s Corporate Income Tax
JLARC staff collaborated with economists from the University of Virginia’s (UVA) Weldon Cooper Center for Public Service who used the Regional Economic Models, Inc Policy Insight Plus (REMI) model to estimate the dynamic effect of eliminating Virgin-ia’s CIT. The REMI model is a dynamic, multi-sector regional eco-nomic simulation model that can be used to forecast the effect of public policy changes on economic activity, population characteris-tics, and government fiscal variables. According to REMI, more than 30 states have used this model to evaluate proposed policy changes. The model used by UVA includes 70 industry sectors and has been specifically calibrated for Virginia to refine national in-formation from the Bureau of Economic Analysis, Bureau of Labor Statistics, and Bureau of the Census among others.
REMI has been extensively peer-reviewed over a period of two decades and is reportedly one of the most sophisticated dynamic models available. The model is categorized as an integrated re-gional econometric input-output model that offers several ad-vantages over stand-alone econometric or input-output models, in particular the ability to show the dynamic adjustments that occur in individual variables over time. REMI contains five major mod-ules (labor force and capital demand; population and labor force; wage, price, and cost; market shares; and output) that interact simultaneously.
One of the advantages of REMI is that the macroeconomic forecast built into the model can be customized by users. For purposes of this analysis, CIT collections and other revenue reflect the State’s official forecast for fiscal years 2008 through 2016. The distribu-tion of corporate income taxes by industry was based on Virginia CIT returns filed in 2006. Different assumptions were used to cre-ate a range of the potential effects of eliminating Virginia’s CIT. These assumptions were the extent to which: corporations would use tax reductions to reduce their cost of capital rather than pur-chase durable goods; corporations would spend their tax reduction in Virginia rather than other states; the decline in CIT revenue
Appendix B: Research Activities and Methods 142
would be offset by budget reductions rather than surplus funds. Assumptions were modeled from 0 to 100 percent in 25 percentage point increments, and permutations were created for the most rel-evant scenarios.
National Establishment Time Series Data
To analyze patterns in corporate activity during the past two dec-ades, JLARC staff procured a Virginia-specific version of the Na-tional Establishment Time Series (NETS) database jointly with the Virginia Economic Development Partnership (VEDP). The NETS database is based upon Dun & Bradstreet’s national estab-lishment database. The version procured by JLARC staff includes all business establishments or facilities that were located in Vir-ginia at any point from 1989 to 2007. JLARC staff filtered the data by industry to exclude those that are exempt from Virginia’s CIT, such as banks and insurance. Analyses were performed to deter-mine how the number of corporations, and their associated jobs and sales, changed in Virginia from 1989 to 2007. Part of this analysis involved identifying the states with which Virginia ap-pears to compete most actively, based on corporate relocations to and from the State during the past two decades.
The NETS database is limited in several notable ways. First, alt-hough the mandate specified that JLARC staff look at changes over the last 20 years, the NETS database available during the course of the study was limited to 19 years, 1989 to 2007. Second, the NETS database does not distinguish between C corporations, which are subject to Virginia’s CIT, and S corporations, which are not. As a result, the figures derived from the NETS data include both C and S corporations. The NETS data procured by JLARC staff does not include establishments that have never had a pres-ence in Virginia. As a result, it was not possible to directly com-pare the change in Virginia corporate activity with that in other states. Lastly, the overall NETS database is limited to establish-ments within the United States and does not record the destina-tion country of facilities that move offshore. This limitation pre-vented JLARC staff from empirically determining the extent to which Virginia has been competing with foreign countries over the last two decades.
STRUCTURED INTERVIEWS
JLARC staff conducted several interviews with staff of State-level entities and other state and national stakeholder groups. Struc-tured interviews with several groups were conducted to assist JLARC staff in gaining an understanding of Virginia’s CIT system, both currently and historically; identify issues with the current
Appendix B: Research Activities and Methods 143
system; and identify potential changes and their impact to Virgin-ia’s system
Virginia Department Taxation,
Virginia Chamber of Commerce,
Virginia Manufacturers Association,
Virginia Society of Certified Public Accountants, and
Tax research organizations.
JLARC staff also conducted structured interviews with the Virgin-ia Economic Development Partnership to determine the extent to which Virginia’s CIT system impacts its competitiveness for eco-nomic development relative to other states, impact of income tax credits and other incentives on business location decisions, effec-tiveness of income tax credits and other incentives, and options to make Virginia more competitive.
Finally, JLARC staff attended multiple meetings of the Governor’s Economic Development and Job Creation Commission and its sub-groups (Business Development, Business Recruitment, and Manu-facturing). These meetings supplemented other research because they included discussions related to Virginia’s CIT system and presentations by VEDP staff.
REVIEW OF VIRGINIA’S AND OTHER STATE CORPORATE INCOME TAX SYSTEMS
JLARC staff conducted a review of Virginia’s CIT system compared to that of other states. Comparisons were made between Virginia’s and other states’ systems regarding which businesses are taxed, what income is taxable, how income tax liability is calculated, and what tax credits or incentives are available.
In addition to interviews with TAX staff, JLARC staff conducted extensive reviews of the Code of Virginia, Virginia Administrative Code, Rulings of the Tax Commissioner, and other guidance docu-ments published by the Department of Taxation to gain an under-standing of Virginia’s CIT policies and practices. JLARC staff also examined previous reports to the General Assembly regarding Vir-ginia’s corporate tax system.
JLARC staff used the 2010 Multistate Tax Guide as the primary source of information regarding other states’ CIT systems. This guide is updated annually and provides summary information on most aspects of state CIT systems. Information published in this guide was collected through surveys of state tax or revenue de-partments. JLARC staff conducted additional reviews of state
Appendix B: Research Activities and Methods 144
statutes, guidance documents, tax forms, and tax department web-sites for other states.
Primary emphasis was placed on comparisons between Virginia’s CIT system and the systems of states with which Virginia most closely competes for economic development. Using analyses of the NETS database, JLARC staff identified Virginia’s top competitors as some of the larger states from the East Coast, Texas, Illinois, and California. These states had the highest volume of relocations to and from Virginia between 1989 and 2007.
REVIEW OF RESEARCH LITERATURE
JLARC staff reviewed the state CIT literature to gain an under-standing of principles of good tax systems, issues that commonly diminish these principles, effective mechanisms to combat tax planning, and effective tax incentives. In addition, staff conducted a review of the economic development literature to gain an under-standing of the linkage between taxes and economic development, factors impacting business location decisions, and the tax burden placed upon businesses.
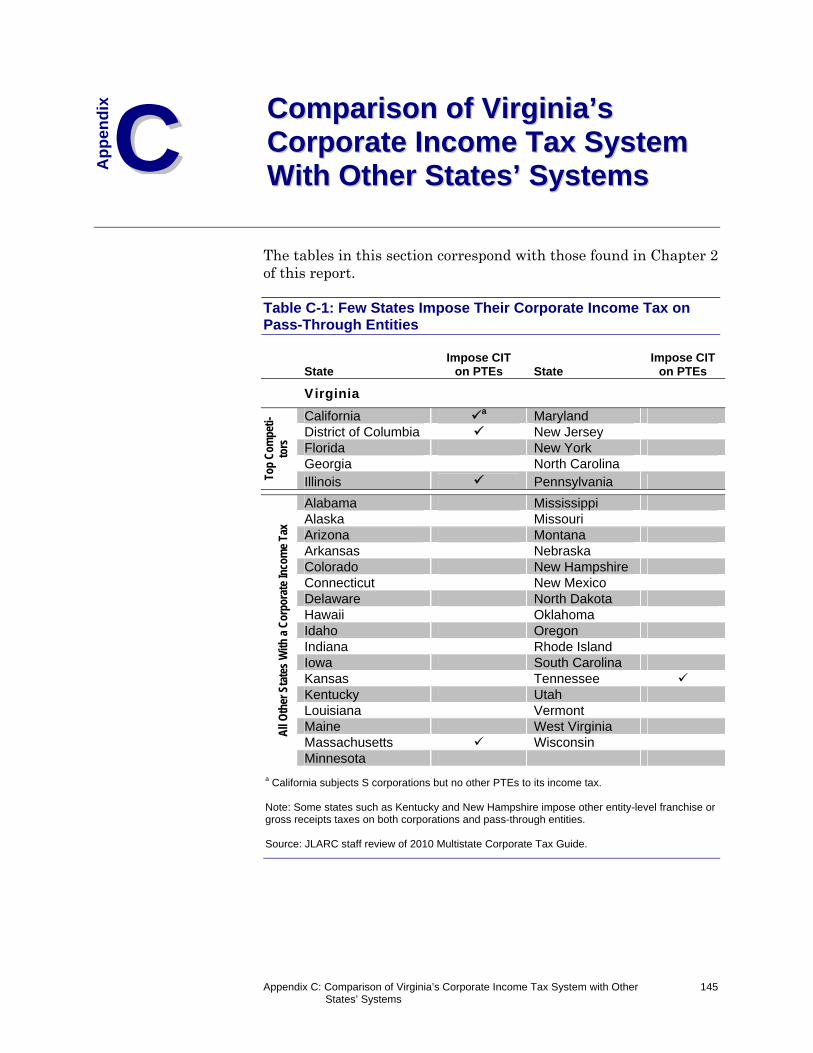
Appendix C: Comparison of Virginia’s Corporate Income Tax System with Other States’ Systems
145
The tables in this section correspond with those found in Chapter 2 of this report.
Table C-1: Few States Impose Their Corporate Income Tax on Pass-Through Entities
State Impose CIT
on PTEs State Impose CIT
on PTEs
Virginia
Top
Com
peti-
tors
California a Maryland District of Columbia New Jersey Florida New York Georgia North Carolina Illinois Pennsylvania
All
Oth
er S
tate
s W
ith a
Cor
pora
te In
com
e Ta
x
Alabama Mississippi Alaska Missouri Arizona Montana Arkansas Nebraska Colorado New Hampshire Connecticut New Mexico Delaware North Dakota Hawaii Oklahoma Idaho Oregon Indiana Rhode Island Iowa South Carolina Kansas Tennessee Kentucky Utah Louisiana Vermont Maine West Virginia Massachusetts Wisconsin Minnesota
a California subjects S corporations but no other PTEs to its income tax. Note: Some states such as Kentucky and New Hampshire impose other entity-level franchise or gross receipts taxes on both corporations and pass-through entities. Source: JLARC staff review of 2010 Multistate Corporate Tax Guide.
Ap
pen
dix
CC
CCoommppaarriissoonn ooff VViirrggiinniiaa’’ss CCoorrppoorraattee IInnccoommee TTaaxx SSyysstteemm WWiitthh OOtthheerr SSttaatteess’’ SSyysstteemmss
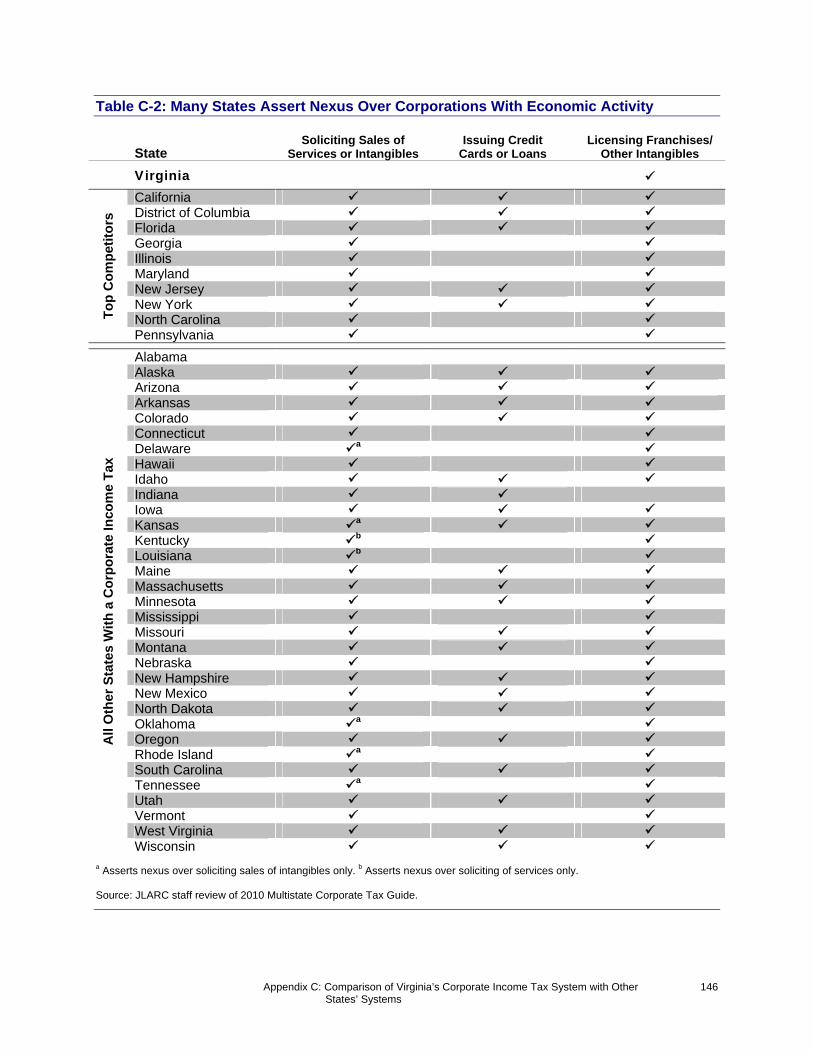
Appendix C: Comparison of Virginia’s Corporate Income Tax System with Other States’ Systems
146
Table C-2: Many States Assert Nexus Over Corporations With Economic Activity
State Soliciting Sales of
Services or Intangibles Issuing Credit
Cards or Loans Licensing Franchises/
Other Intangibles
Virginia
To
p C
om
pet
ito
rs
California District of Columbia Florida Georgia Illinois Maryland New Jersey New York North Carolina Pennsylvania
All
Oth
er S
tate
s W
ith
a C
orp
ora
te In
com
e T
ax
Alabama Alaska Arizona Arkansas Colorado Connecticut Delaware a Hawaii Idaho Indiana Iowa Kansas a Kentucky b Louisiana b Maine Massachusetts Minnesota Mississippi Missouri Montana Nebraska New Hampshire New Mexico North Dakota Oklahoma a Oregon Rhode Island a South Carolina Tennessee a Utah Vermont West Virginia Wisconsin
a Asserts nexus over soliciting sales of intangibles only. b Asserts nexus over soliciting of services only. Source: JLARC staff review of 2010 Multistate Corporate Tax Guide.
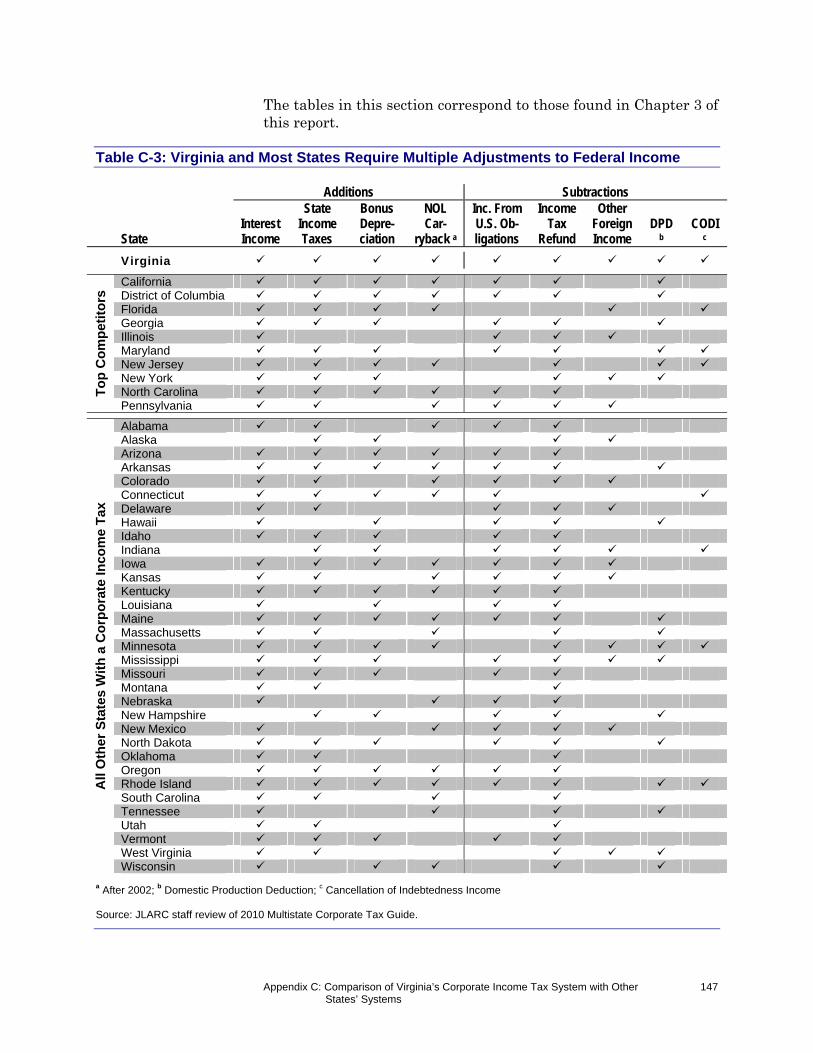
Appendix C: Comparison of Virginia’s Corporate Income Tax System with Other States’ Systems
147
The tables in this section correspond to those found in Chapter 3 of this report.
Table C-3: Virginia and Most States Require Multiple Adjustments to Federal Income Additions Subtractions
State
Interest Income
State Income Taxes
Bonus Depre-ciation
NOL Car-
ryback a
Inc. From U.S. Ob-ligations
Income Tax
Refund
Other Foreign Income
DPD b
CODIc
Virginia
To
p C
om
pet
ito
rs California
District of Columbia Florida Georgia Illinois Maryland New Jersey New York North Carolina Pennsylvania
All
Oth
er S
tate
s W
ith
a C
orp
ora
te In
com
e T
ax
Alabama Alaska Arizona Arkansas Colorado Connecticut Delaware Hawaii Idaho Indiana Iowa Kansas Kentucky Louisiana Maine Massachusetts Minnesota Mississippi Missouri Montana Nebraska New Hampshire New Mexico North Dakota Oklahoma Oregon Rhode Island South Carolina Tennessee Utah Vermont West Virginia Wisconsin
a After 2002; b Domestic Production Deduction; c Cancellation of Indebtedness Income Source: JLARC staff review of 2010 Multistate Corporate Tax Guide.
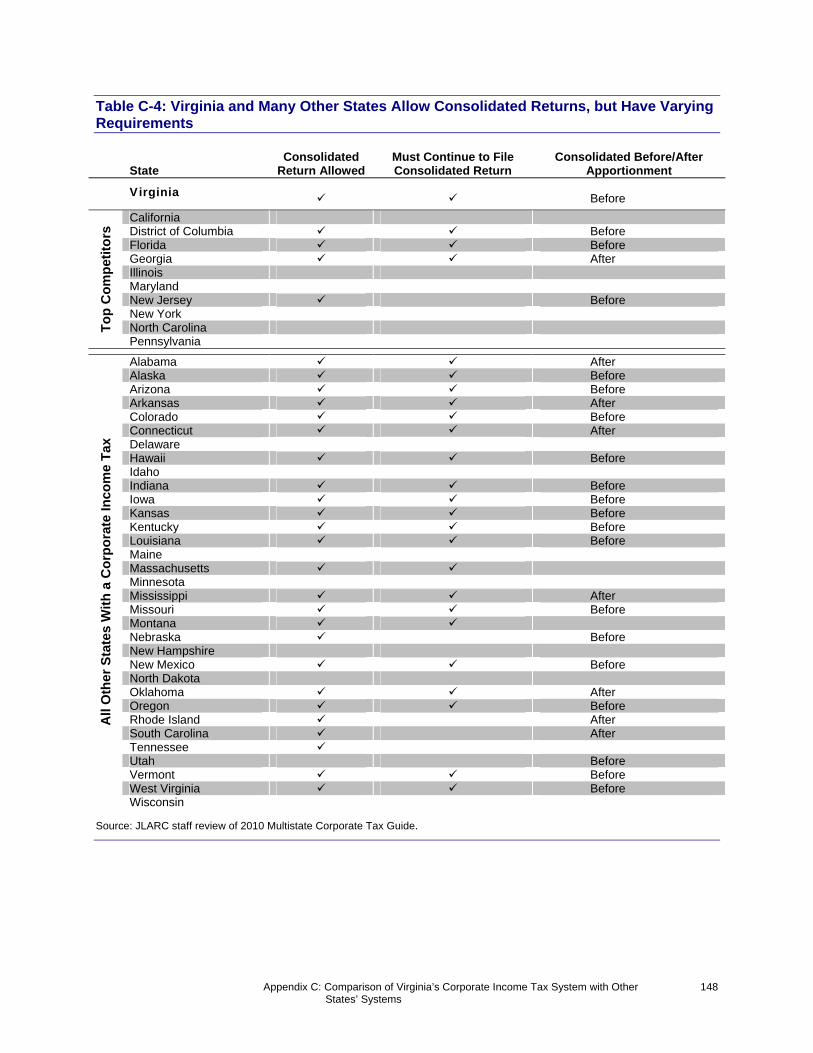
Appendix C: Comparison of Virginia’s Corporate Income Tax System with Other States’ Systems
148
Table C-4: Virginia and Many Other States Allow Consolidated Returns, but Have Varying Requirements
State Consolidated
Return Allowed Must Continue to FileConsolidated Return
Consolidated Before/After Apportionment
Virginia Before
To
p C
om
pet
ito
rs California
District of Columbia Before Florida Before Georgia After Illinois Maryland New Jersey Before New York North Carolina Pennsylvania
All
Oth
er S
tate
s W
ith
a C
orp
ora
te In
com
e T
ax
Alabama After Alaska Before Arizona Before Arkansas After Colorado Before Connecticut After Delaware Hawaii Before Idaho Indiana Before Iowa Before Kansas Before Kentucky Before Louisiana Before Maine Massachusetts Minnesota Mississippi After Missouri Before Montana Nebraska Before New Hampshire New Mexico Before North Dakota Oklahoma After Oregon Before Rhode Island After South Carolina After Tennessee Utah Before Vermont Before West Virginia Before Wisconsin
Source: JLARC staff review of 2010 Multistate Corporate Tax Guide.
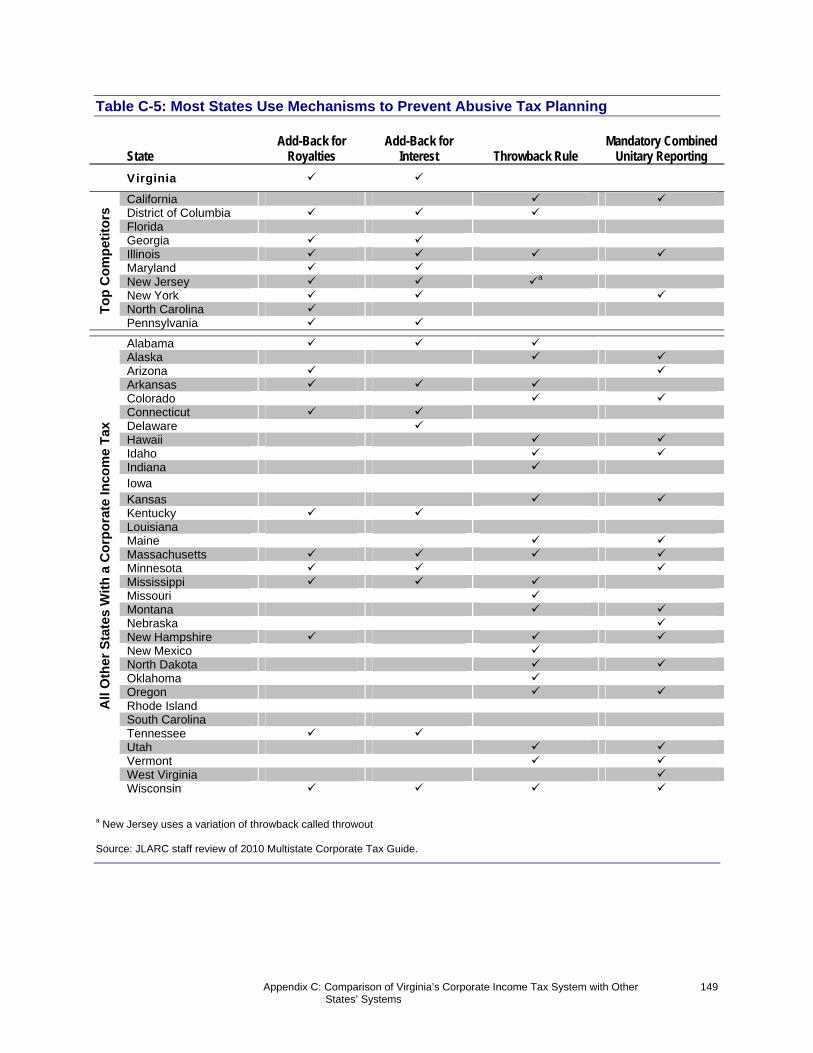
Appendix C: Comparison of Virginia’s Corporate Income Tax System with Other States’ Systems
149
Table C-5: Most States Use Mechanisms to Prevent Abusive Tax Planning
State
Add-Back for Royalties
Add-Back for Interest Throwback Rule
Mandatory Combined Unitary Reporting
Virginia
To
p C
om
pet
ito
rs California
District of Columbia Florida Georgia Illinois Maryland New Jersey a New York North Carolina Pennsylvania
All
Oth
er S
tate
s W
ith
a C
orp
ora
te In
com
e T
ax
Alabama Alaska Arizona Arkansas Colorado Connecticut Delaware Hawaii Idaho Indiana Iowa Kansas Kentucky Louisiana Maine Massachusetts Minnesota Mississippi Missouri Montana Nebraska New Hampshire New Mexico North Dakota Oklahoma Oregon Rhode Island South Carolina Tennessee Utah Vermont West Virginia Wisconsin
a New Jersey uses a variation of throwback called throwout Source: JLARC staff review of 2010 Multistate Corporate Tax Guide.
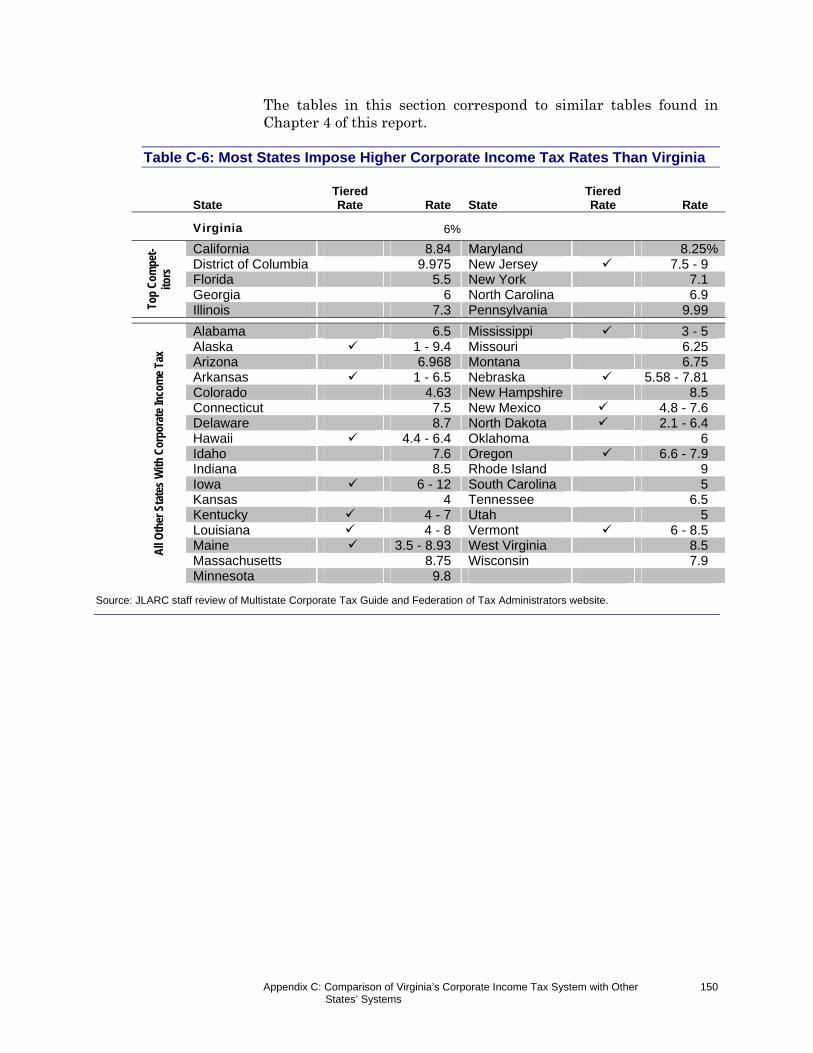
Appendix C: Comparison of Virginia’s Corporate Income Tax System with Other States’ Systems
150
The tables in this section correspond to similar tables found in Chapter 4 of this report.
Table C-6: Most States Impose Higher Corporate Income Tax Rates Than Virginia
State
Tiered Rate Rate State
Tiered Rate Rate
Virginia 6%
Top
Com
pet-
itors
California 8.84 Maryland 8.25%District of Columbia 9.975 New Jersey 7.5 - 9 Florida 5.5 New York 7.1 Georgia 6 North Carolina 6.9 Illinois 7.3 Pennsylvania 9.99
All
Oth
er S
tate
s W
ith C
orpo
rate
Inco
me
Tax
Alabama 6.5 Mississippi 3 - 5 Alaska 1 - 9.4 Missouri 6.25 Arizona 6.968 Montana 6.75 Arkansas 1 - 6.5 Nebraska 5.58 - 7.81 Colorado 4.63 New Hampshire 8.5 Connecticut 7.5 New Mexico 4.8 - 7.6 Delaware 8.7 North Dakota 2.1 - 6.4 Hawaii 4.4 - 6.4 Oklahoma 6 Idaho 7.6 Oregon 6.6 - 7.9 Indiana 8.5 Rhode Island 9 Iowa 6 - 12 South Carolina 5 Kansas 4 Tennessee 6.5 Kentucky 4 - 7 Utah 5 Louisiana 4 - 8 Vermont 6 - 8.5 Maine 3.5 - 8.93 West Virginia 8.5 Massachusetts 8.75 Wisconsin 7.9 Minnesota 9.8
Source: JLARC staff review of Multistate Corporate Tax Guide and Federation of Tax Administrators website.
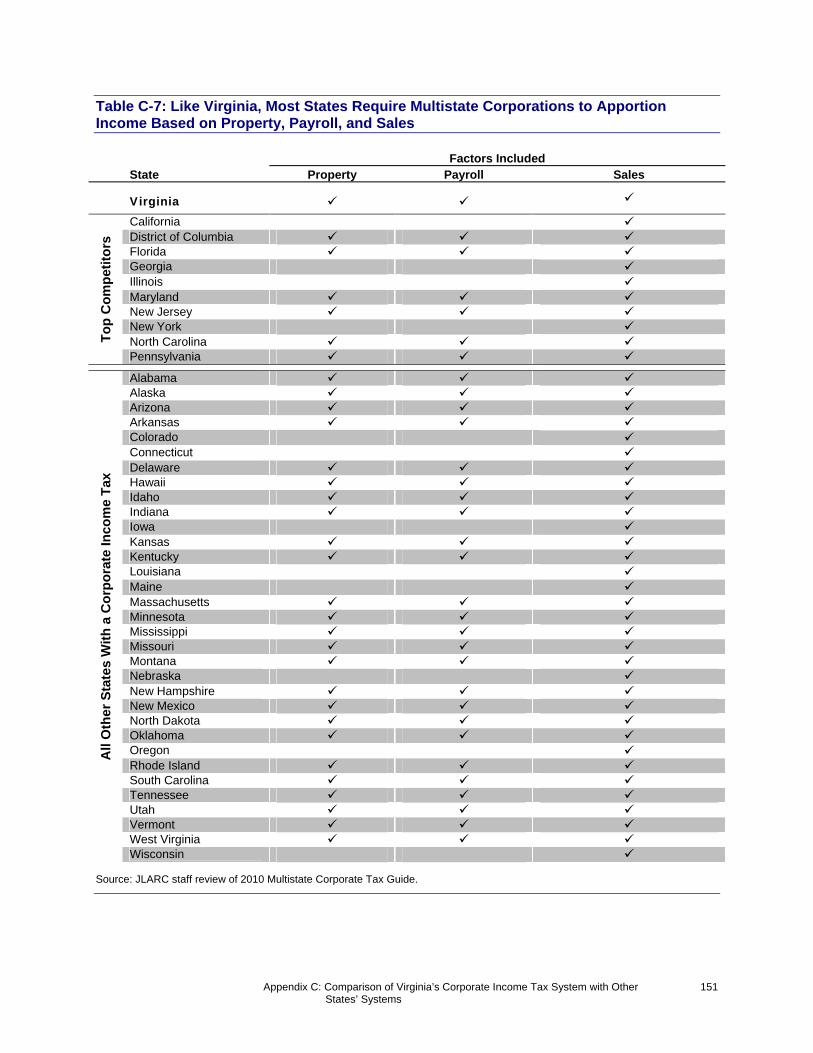
Appendix C: Comparison of Virginia’s Corporate Income Tax System with Other States’ Systems
151
Table C-7: Like Virginia, Most States Require Multistate Corporations to Apportion Income Based on Property, Payroll, and Sales
Factors Included State Property Payroll Sales
Virginia
To
p C
om
pet
ito
rs
California District of Columbia Florida Georgia Illinois Maryland New Jersey New York North Carolina Pennsylvania
All
Oth
er S
tate
s W
ith
a C
orp
ora
te In
com
e T
ax
Alabama Alaska Arizona Arkansas Colorado Connecticut Delaware Hawaii Idaho Indiana Iowa Kansas Kentucky Louisiana Maine Massachusetts Minnesota Mississippi Missouri Montana Nebraska New Hampshire New Mexico North Dakota Oklahoma Oregon Rhode Island South Carolina Tennessee Utah Vermont West Virginia Wisconsin
Source: JLARC staff review of 2010 Multistate Corporate Tax Guide.
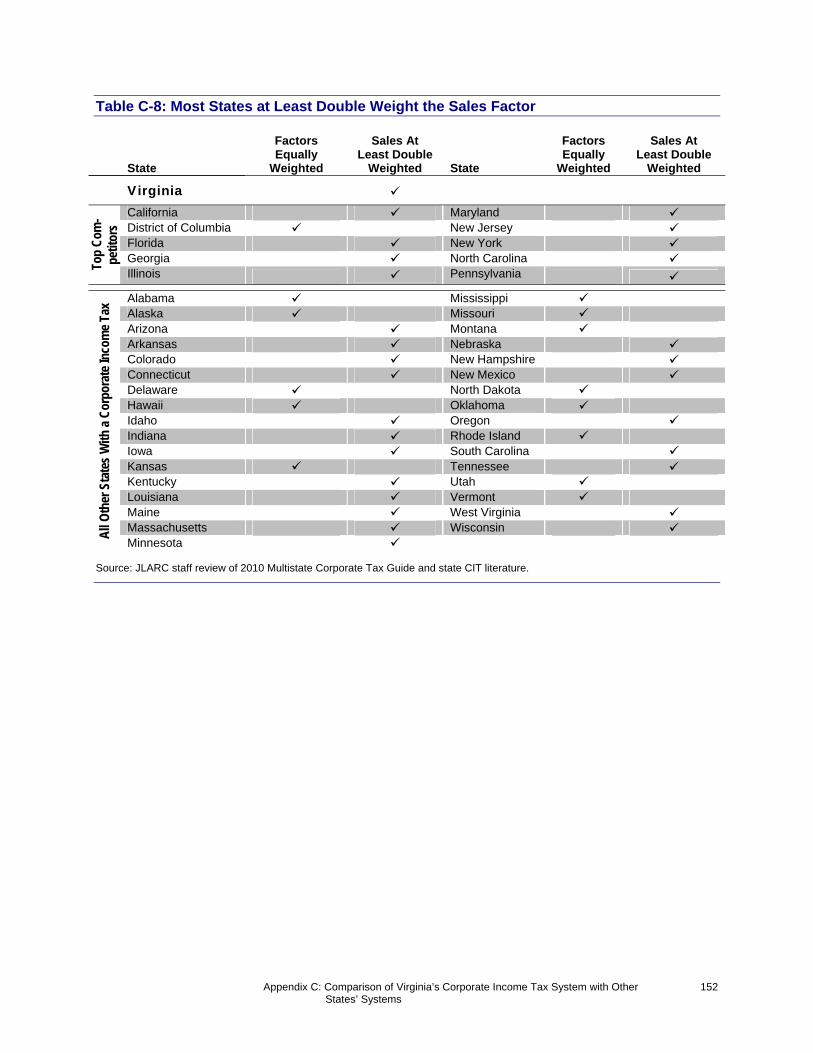
Appendix C: Comparison of Virginia’s Corporate Income Tax System with Other States’ Systems
152
Table C-8: Most States at Least Double Weight the Sales Factor
State
Factors Equally
Weighted
Sales At Least Double
Weighted State
Factors Equally
Weighted
Sales At Least Double
Weighted
Virginia
Top
Com
-pe
titor
s
California Maryland District of Columbia New Jersey Florida New York Georgia North Carolina Illinois Pennsylvania
All
Oth
er S
tate
s W
ith a
Cor
pora
te In
com
e Ta
x Alabama Mississippi Alaska Missouri Arizona Montana Arkansas Nebraska Colorado New Hampshire Connecticut New Mexico Delaware North Dakota Hawaii Oklahoma Idaho Oregon Indiana Rhode Island Iowa South Carolina Kansas Tennessee Kentucky Utah Louisiana Vermont Maine West Virginia Massachusetts Wisconsin Minnesota
Source: JLARC staff review of 2010 Multistate Corporate Tax Guide and state CIT literature.
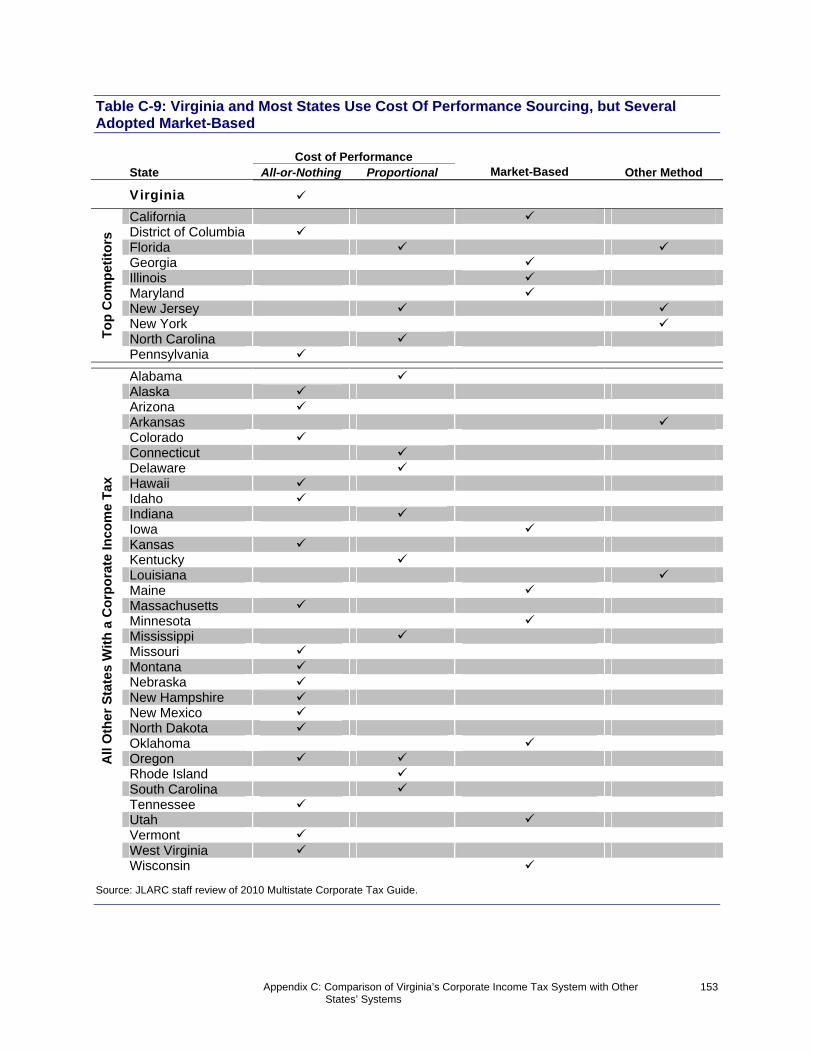
Appendix C: Comparison of Virginia’s Corporate Income Tax System with Other States’ Systems
153
Table C-9: Virginia and Most States Use Cost Of Performance Sourcing, but Several Adopted Market-Based
Cost of Performance State All-or-Nothing Proportional Market-Based Other Method
Virginia
To
p C
om
pet
ito
rs
California District of Columbia Florida Georgia Illinois Maryland New Jersey New York North Carolina Pennsylvania
All
Oth
er S
tate
s W
ith
a C
orp
ora
te In
com
e T
ax
Alabama Alaska Arizona Arkansas Colorado Connecticut Delaware Hawaii Idaho Indiana Iowa Kansas Kentucky Louisiana Maine Massachusetts Minnesota Mississippi Missouri Montana Nebraska New Hampshire New Mexico North Dakota Oklahoma Oregon Rhode Island South Carolina Tennessee Utah Vermont West Virginia Wisconsin
Source: JLARC staff review of 2010 Multistate Corporate Tax Guide.
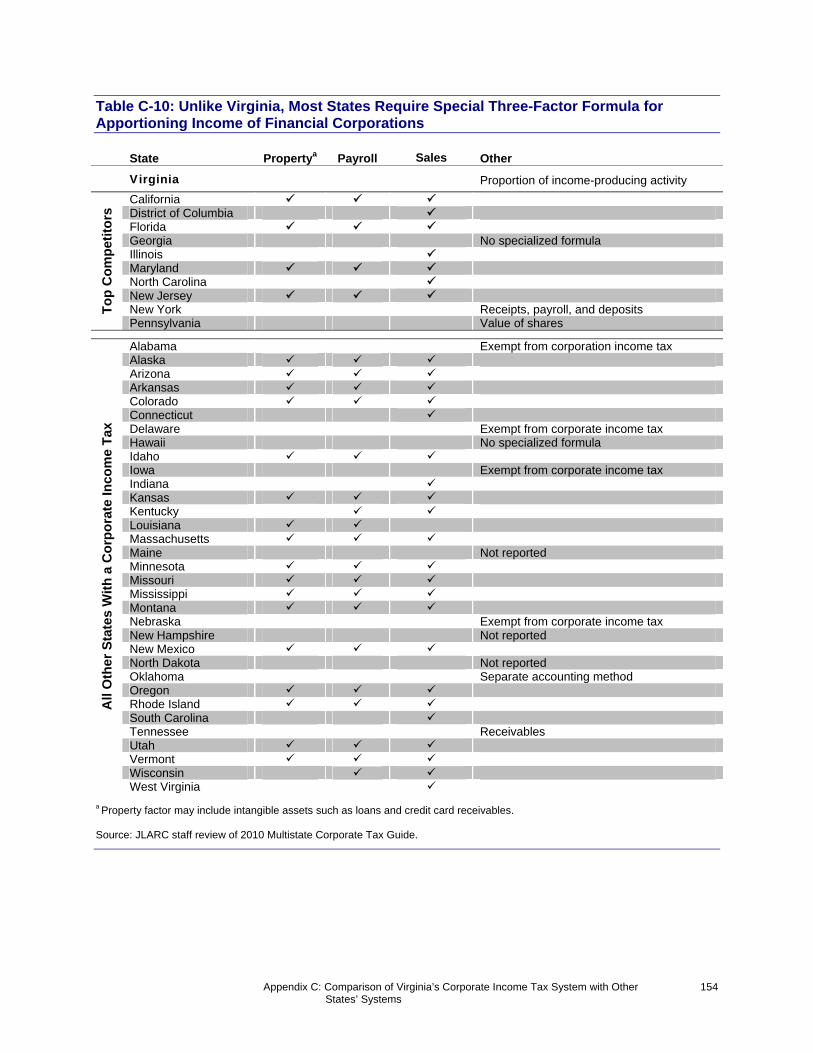
Appendix C: Comparison of Virginia’s Corporate Income Tax System with Other States’ Systems
154
Table C-10: Unlike Virginia, Most States Require Special Three-Factor Formula for Apportioning Income of Financial Corporations
State Propertya Payroll Sales Other
Virginia Proportion of income-producing activity
To
p C
om
pet
ito
rs California
District of Columbia Florida Georgia No specialized formula Illinois Maryland North Carolina New Jersey New York Receipts, payroll, and deposits Pennsylvania Value of shares
All
Oth
er S
tate
s W
ith
a C
orp
ora
te In
com
e T
ax
Alabama Exempt from corporation income tax Alaska Arizona Arkansas Colorado Connecticut Delaware Exempt from corporate income tax Hawaii No specialized formula Idaho Iowa Exempt from corporate income tax Indiana Kansas Kentucky Louisiana Massachusetts Maine Not reported Minnesota Missouri Mississippi Montana Nebraska Exempt from corporate income tax New Hampshire Not reported New Mexico North Dakota Not reported Oklahoma Separate accounting method Oregon Rhode Island South Carolina Tennessee Receivables Utah Vermont Wisconsin West Virginia
a Property factor may include intangible assets such as loans and credit card receivables. Source: JLARC staff review of 2010 Multistate Corporate Tax Guide.
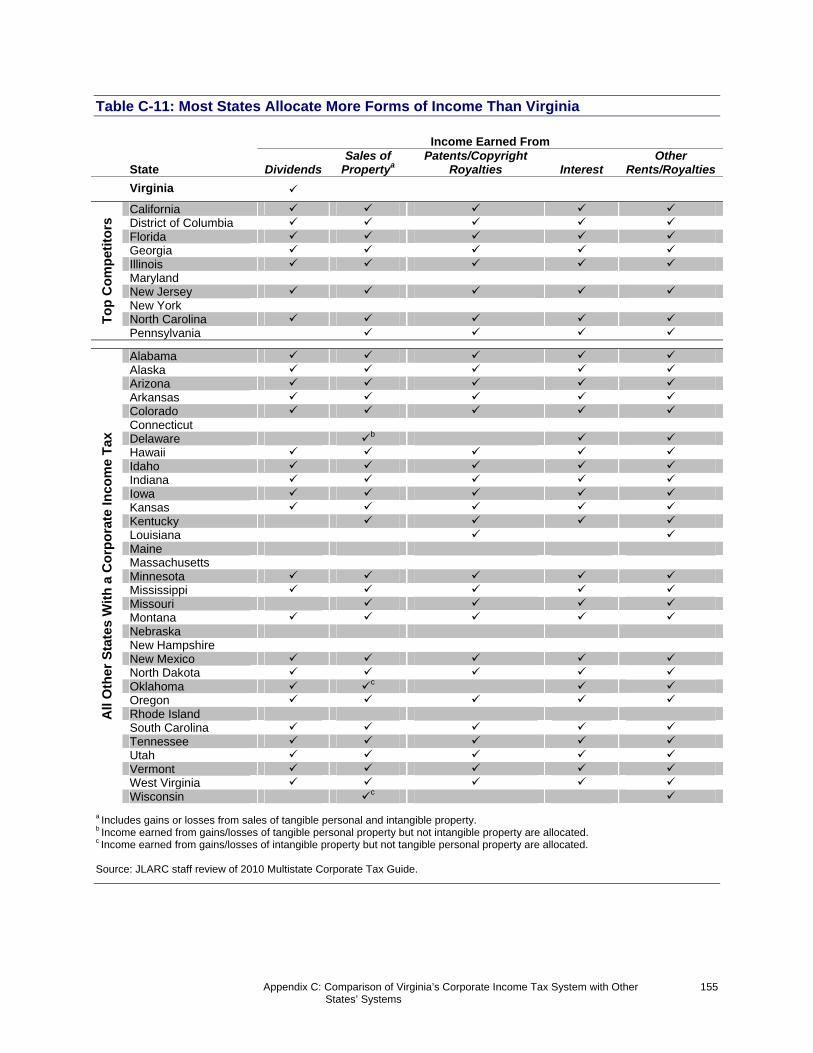
Appendix C: Comparison of Virginia’s Corporate Income Tax System with Other States’ Systems
155
Table C-11: Most States Allocate More Forms of Income Than Virginia
Income Earned From
State Dividends Sales of
Propertya Patents/Copyright
Royalties Interest Other
Rents/Royalties
Virginia
To
p C
om
pet
ito
rs California
District of Columbia Florida Georgia Illinois Maryland New Jersey New York North Carolina Pennsylvania
All
Oth
er S
tate
s W
ith
a C
orp
ora
te In
com
e T
ax
Alabama Alaska Arizona Arkansas Colorado Connecticut Delaware b Hawaii Idaho Indiana Iowa Kansas Kentucky Louisiana Maine Massachusetts Minnesota Mississippi Missouri Montana Nebraska New Hampshire New Mexico North Dakota Oklahoma c Oregon Rhode Island South Carolina Tennessee Utah Vermont West Virginia Wisconsin c
a Includes gains or losses from sales of tangible personal and intangible property. b Income earned from gains/losses of tangible personal property but not intangible property are allocated. c Income earned from gains/losses of intangible property but not tangible personal property are allocated. Source: JLARC staff review of 2010 Multistate Corporate Tax Guide.
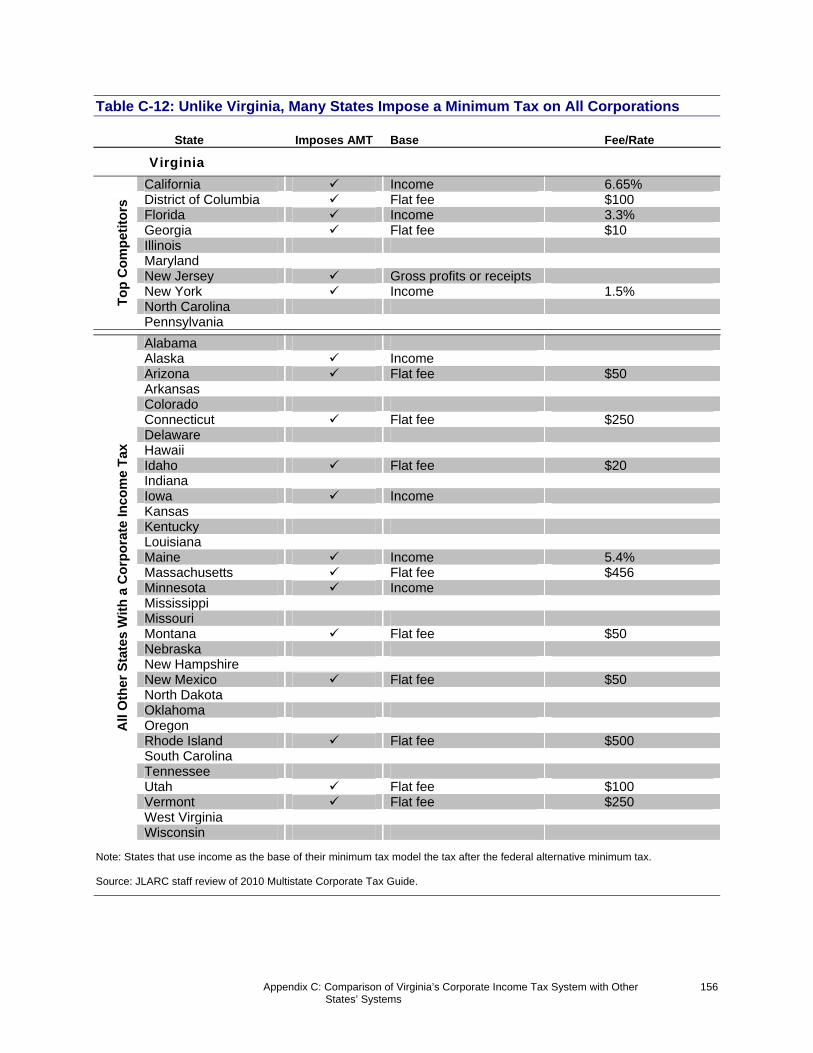
Appendix C: Comparison of Virginia’s Corporate Income Tax System with Other States’ Systems
156
Table C-12: Unlike Virginia, Many States Impose a Minimum Tax on All Corporations
State Imposes AMT Base Fee/Rate
Virginia
To
p C
om
pet
ito
rs
California Income 6.65% District of Columbia Flat fee $100 Florida Income 3.3% Georgia Flat fee $10 Illinois Maryland New Jersey Gross profits or receipts New York Income 1.5% North Carolina Pennsylvania
All
Oth
er S
tate
s W
ith
a C
orp
ora
te In
com
e T
ax
Alabama Alaska Income Arizona Flat fee $50 Arkansas Colorado Connecticut Flat fee $250 Delaware Hawaii Idaho Flat fee $20 Indiana Iowa Income Kansas Kentucky Louisiana Maine Income 5.4% Massachusetts Flat fee $456 Minnesota Income Mississippi Missouri Montana Flat fee $50 Nebraska New Hampshire New Mexico Flat fee $50 North Dakota Oklahoma Oregon Rhode Island Flat fee $500 South Carolina Tennessee Utah Flat fee $100 Vermont Flat fee $250 West Virginia Wisconsin
Note: States that use income as the base of their minimum tax model the tax after the federal alternative minimum tax. Source: JLARC staff review of 2010 Multistate Corporate Tax Guide.
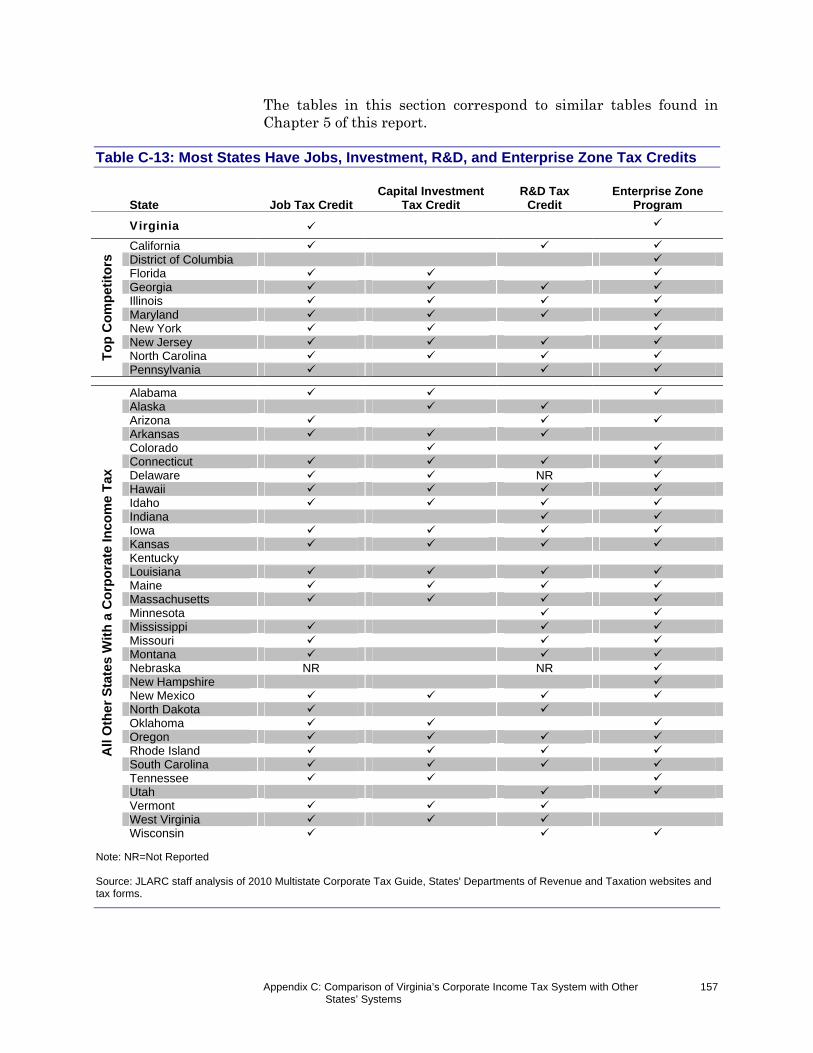
Appendix C: Comparison of Virginia’s Corporate Income Tax System with Other States’ Systems
157
The tables in this section correspond to similar tables found in Chapter 5 of this report.
Table C-13: Most States Have Jobs, Investment, R&D, and Enterprise Zone Tax Credits
State Job Tax Credit Capital Investment
Tax Credit R&D Tax
Credit Enterprise Zone
Program
Virginia
To
p C
om
pet
ito
rs California
District of Columbia Florida Georgia Illinois Maryland New York New Jersey North Carolina Pennsylvania
All
Oth
er S
tate
s W
ith
a C
orp
ora
te In
com
e T
ax
Alabama Alaska Arizona Arkansas Colorado Connecticut Delaware NR Hawaii Idaho Indiana Iowa Kansas Kentucky Louisiana Maine Massachusetts Minnesota Mississippi Missouri Montana Nebraska NR NR New Hampshire New Mexico North Dakota Oklahoma Oregon Rhode Island South Carolina Tennessee Utah Vermont West Virginia Wisconsin
Note: NR=Not Reported Source: JLARC staff analysis of 2010 Multistate Corporate Tax Guide, States' Departments of Revenue and Taxation websites and tax forms.

Appendix C: Comparison of Virginia’s Corporate Income Tax System with Other States’ Systems
158
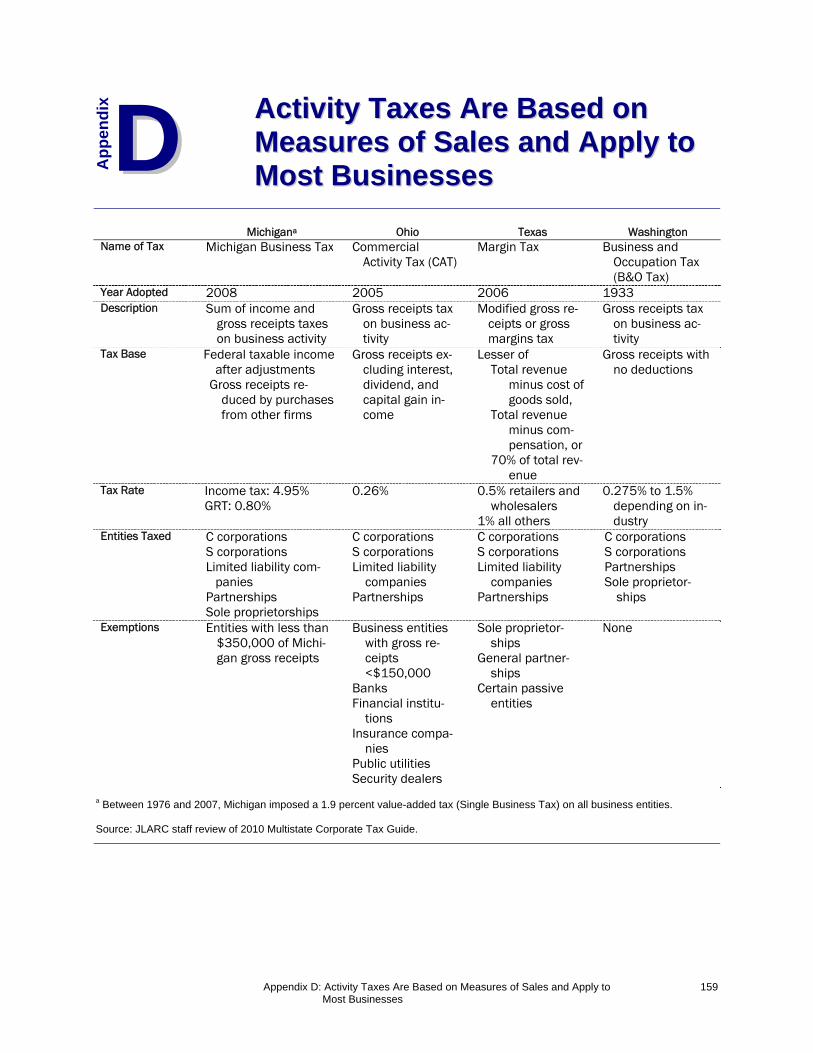
Appendix D: Activity Taxes Are Based on Measures of Sales and Apply to Most Businesses
159
Michigana Ohio Texas Washington Name of Tax Michigan Business Tax Commercial
Activity Tax (CAT) Margin Tax Business and
Occupation Tax (B&O Tax)
Year Adopted 2008 2005 2006 1933 Description Sum of income and
gross receipts taxes on business activity
Gross receipts tax on business ac-tivity
Modified gross re-ceipts or gross margins tax
Gross receipts tax on business ac-tivity
Tax Base Federal taxable income after adjustments
Gross receipts re-duced by purchases from other firms
Gross receipts ex-cluding interest, dividend, and capital gain in-come
Lesser of Total revenue
minus cost of goods sold,
Total revenue minus com-pensation, or
70% of total rev-enue
Gross receipts with no deductions
Tax Rate Income tax: 4.95% GRT: 0.80%
0.26% 0.5% retailers and wholesalers
1% all others
0.275% to 1.5% depending on in-dustry
Entities Taxed C corporations S corporations Limited liability com-
panies Partnerships Sole proprietorships
C corporations S corporations Limited liability
companies Partnerships
C corporations S corporations Limited liability
companies Partnerships
C corporations S corporations Partnerships Sole proprietor-
ships
Exemptions Entities with less than $350,000 of Michi-gan gross receipts
Business entities with gross re-ceipts <$150,000
Banks Financial institu-
tions Insurance compa-
nies Public utilities Security dealers
Sole proprietor-ships
General partner-ships
Certain passive entities
None
a Between 1976 and 2007, Michigan imposed a 1.9 percent value-added tax (Single Business Tax) on all business entities. Source: JLARC staff review of 2010 Multistate Corporate Tax Guide.
Ap
pen
dix
DD
AAccttiivviittyy TTaaxxeess AArree BBaasseedd oonn MMeeaassuurreess ooff SSaalleess aanndd AAppppllyy ttoo MMoosstt BBuussiinneesssseess

Appendix D: Activity Taxes Are Based on Measures of Sales and Apply to Most Businesses
160
Appendix E: Agency Responses 161
As a part of an extensive validation process, State agencies and other entities involved in a JLARC assessment are given the op-portunity to comment on an exposure draft of the report. JLARC staff provided exposure drafts of this report to the Secretary of Fi-nance, the Department of Taxation, and the Virginia Economic Development Partnership. Appropriate technical corrections re-sulting from comments provided by these entities have been made in this version of the report. This appendix includes a written re-sponse from the Department of Taxation.
Ap
pen
dix
EE AAggeennccyy RReessppoonnsseess

Appendix E: Agency Responses 162
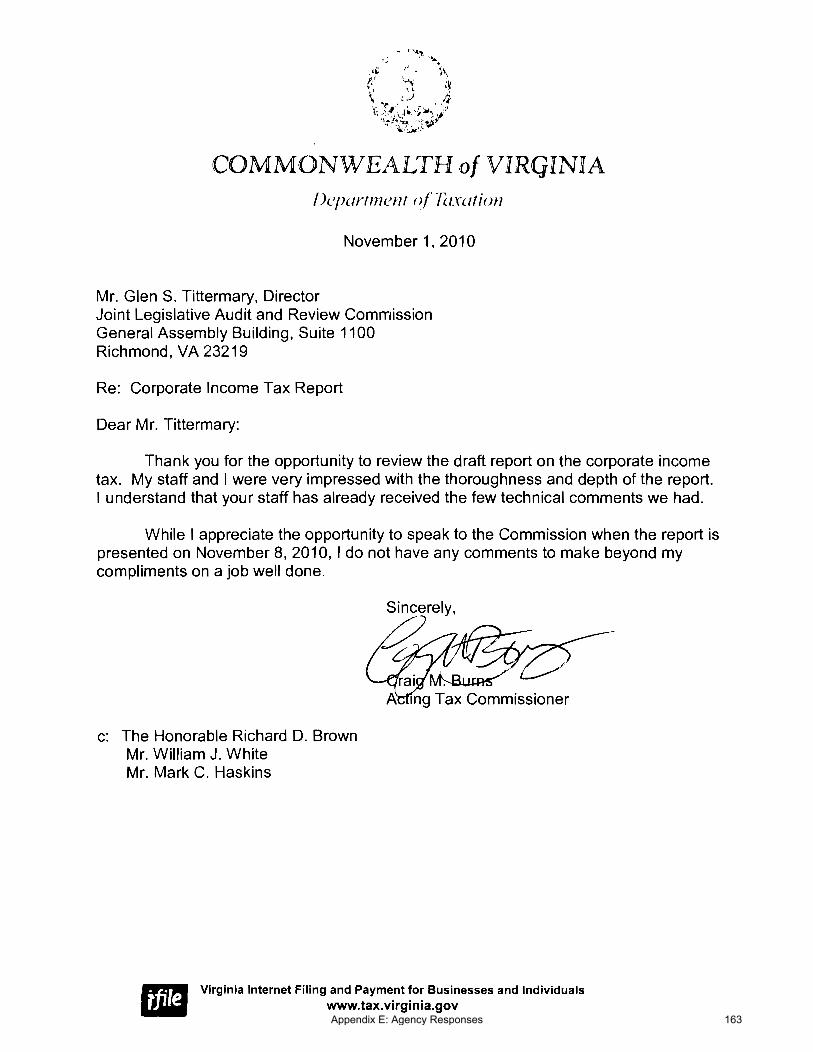
\._..-i ,41;
COMMONWEALTH of VIRGINIADc’parlment of [L’cation
November 1, 2010
Mr. Glen S. Tittermary, DirectorJoint Legislative Audit and Review CommissionGeneral Assembly Building, Suite 1100Richmond, VA 23219
Re: Corporate Income Tax Report
Dear Mr. Tittermary:
Thank you for the opportunity to review the draft report on the corporate incometax. My staff and I were very impressed with the thoroughness and depth of the report.I understand that your staff has already received the few technical comments we had.
While I appreciate the opportunity to speak to the Commission when the report ispresented on November 8, 2010, I do not have any comments to make beyond mycompliments on a job well done.
Sincerely,
A ing Tax Commissioner
c: The Honorable Richard D. BrownMr. William J. WhiteMr. Mark C. Haskins
Virginia Internet Filing and Payment for Businesses and Individualswww.tax.virginia.gov
Appendix E: Agency Responses 163

Appendix E: Agency Responses 164

JLARC Staff
Research Staff
Janice G. Baab
Aris W. Bearse
Jamie S. Bitz
Justin C. Brown
Ashley S. Colvin
Andrew B. Dickinson
Martha L. Erwin
Harold E. Greer III
Mark R. Gribbin
Anna B. Haley
Paula C. Lambert
Bradley B. Marsh
Joseph M. McMahon
Eric H. Messick
Ellen J. Miller
Nathalie Molliet-Ribet
Gregory J. Rest
David A. Reynolds
Robert B. Rotz
Kimberly A. Sarte
Walter L. Smiley
Tracey R. Smith
Glen S. Tittermary
Massey S. J. Whorley
Christine D. Wolfe
Support Staff
Joan M. Irby
Betsy M. Jackson

Recent JLARC Reports
2010 Reports 396. Virginia Compared to the Other States, 2010 Edition
397. Special Report: Assessment of the U.S. Bureau of Justice Statistics Report on Sexual Victimization in
Juvenile Correctional Centers
398. Review of Information Technology Services in Virginia: Final Report
399. Semi-Annual VRS Investment Report No. 34
400. Review of Post-election Audits of Voting Equipment
401. Placing More Treasury-managed Funds in Virginia Banks
402. Reducing Veteran Homelessness in Virginia
403. Review of State Spending: 2010 Update
404. Interim Report: Fraud and Error in Virginia’s Medicaid Program
405. Review of Virginia’s Transportation Planning and Programming
406. VRS Biennial Status and Semi-Annual Investment Report No. 35
407. Special Report: State Spending on Standards of Quality (SOQ) Costs, FY 2010
These reports are available on the JLARC website at http://jlarc.virginia.gov


Joint Legislative Audit and Review CommissionSuite 1100 • General Assembly Building • Capitol Square • Richmond, Virginia 23219804-786-1258 • Fax 804-371-0101 • http://jlarc.virginia.gov