Embed Size (px)
Citation preview

SA Mine
Review of trends in the South African mining industry
November 2010

II SA Mine – Review of trends in the South African mining industry

SA Mine – Review of trends in the South African mining industry III
Table of Contents
1. Executive summary 1
2. Scope of this publication 4
3. South African mining industry 7
4. Financial performance 19
5. Safety performance 29
6. A year full of regulations and politics 31
7. Total tax contribution by the mining industry 35
8. Sustainable mining 39
9. Other information 41

1 SA Mine – Review of trends in the South African mining industry
1. Executive summary

SA Mine – Review of trends in the South African mining industry 2
In 2010, clear signs could be seen of the start of a new, albeit somewhat shaky growth cycle. Although improved production and increased prices did find their way to market capitalisation, it will be a while still until these improvements are reflected in historic financial results.
This, the second publication of the review of trends in the South African mining industry, again focuses on the state of the mining sector in South Africa.
The increase in USD commodity prices – potentially a boon for SA mining houses – was largely negated by the strength of the South African rand, and mining cost increased above inflation which ate into profitability. Revenues took an 8% dip, whilst operating expenses shot up by 10%, the result was a massive slide of 42% in net profit. Operating cash flows decreased by 35%, creating the need for cash preservation, and this meant that investing cash flows had to be cut by 29%.
The balance sheet remained fairly strong, although liquidity is still under pressure for a number of companies as they gear up for the next upswing.
An issue that is of critical importance to the industry is the improvement in safety standards. Mining companies, the government and labour unions will have to make a joint effort to bring safety performance in line with the zero-harm objective.
Corporate activity this year included a few initial public offerings. This again put the spotlight on the opportunities and challenges that exist in the industry. A large challenge remains the debate on nationalisation – a debate that overshadowed the benefit that the listings had for the stakeholders in these companies. The emotions associated with nationalisation unfortunately mean that it is difficult for people to take an objective stance in the debate. What no one can deny, however, is the valuable contribution the mining industry makes to the country.
Our total tax contribution survey shows a significant contribution by the mining industry to the fiscus. Mining companies should however continue to act as good corporate citizens and communicate their efforts towards sustainability to manage perceptions.
We expect 2011 to be a better year for the industry, with price improvements and a recovery in production flowing through to results. It may be difficult to sustain margins, though, due to high labour costs and electricity increases.
We trust you will find this document of value, look forward to sharing trends with you in the future and would appreciate any feedback you might have.
Hein Boegman African Mining Leader

3 SA Mine – Review of trends in the South African mining industry

SA Mine – Review of trends in the South African mining industry 4
2. Scope of this publication
5 SA Mine – Review of trends in the South African mining industry
PwC’s annual SA Mine publication gives readers an overview of how the big players in the South African mining sector performed over the past financial year, ended up to June 2010.
We base our findings on the financial results of mining companies with a primary listing on the Johannesburg Stock Exchange (JSE), as well as those with a secondary listing whose main operations are in Africa. We only looked at companies with a market capitalisation of more than R200 million, and we excluded companies with suspended listings. Section 9 contains a list of all the mining companies that we have included in the report.
Our selection criteria exclude global mining companies Anglo American and BHP Billiton. Although both these companies have South African roots, their global exposure and size mean that they do not necessarily reflect trends in the South African mining environment. While many of the entities that are included also have international exposure, the bulk of their operations are Africa-based.
The findings of this report is based on publicly available information – mainly annual reports. Where annual reports were not available, we have used preliminary reviewed results.
This year’s results reflect the bottom of the cycle that started after the market crash in 2008. However, companies with year-ends after December 2009 have already started showing the improvement expected from the higher price environment that has since developed, and many are optimistic that the year ahead should see the start of a significant new upswing.

SA Mine – Review of trends in the South African mining industry 6
Highlights Current year R’billion
Preceding year R’billion
Difference R’billion
% Change
Revenue from ordinary activities 227 246 (19) (8%)
Adjusted EBITDA * 48 84 (36) (43%)
Impairment reversal/(charge) 2 (25) (27) (108%)
Net profit 20 34 (14) (42%)
Net operating cash flows 40 61 (21) (35%)
Total capital expenditure 58 68 (10) (16%)
Total assets 548 515 33 6%
Current year Preceding year
Key ratios % %
Adjusted EBITDA margin * 21% 34%
Net profit margin * 9% 14%
Gearing percentage * 10% 9%
*Refer to Section 10 for a glossary of terms and non-GAAP measures used
7 SA Mine – Review of trends in the South African mining industry
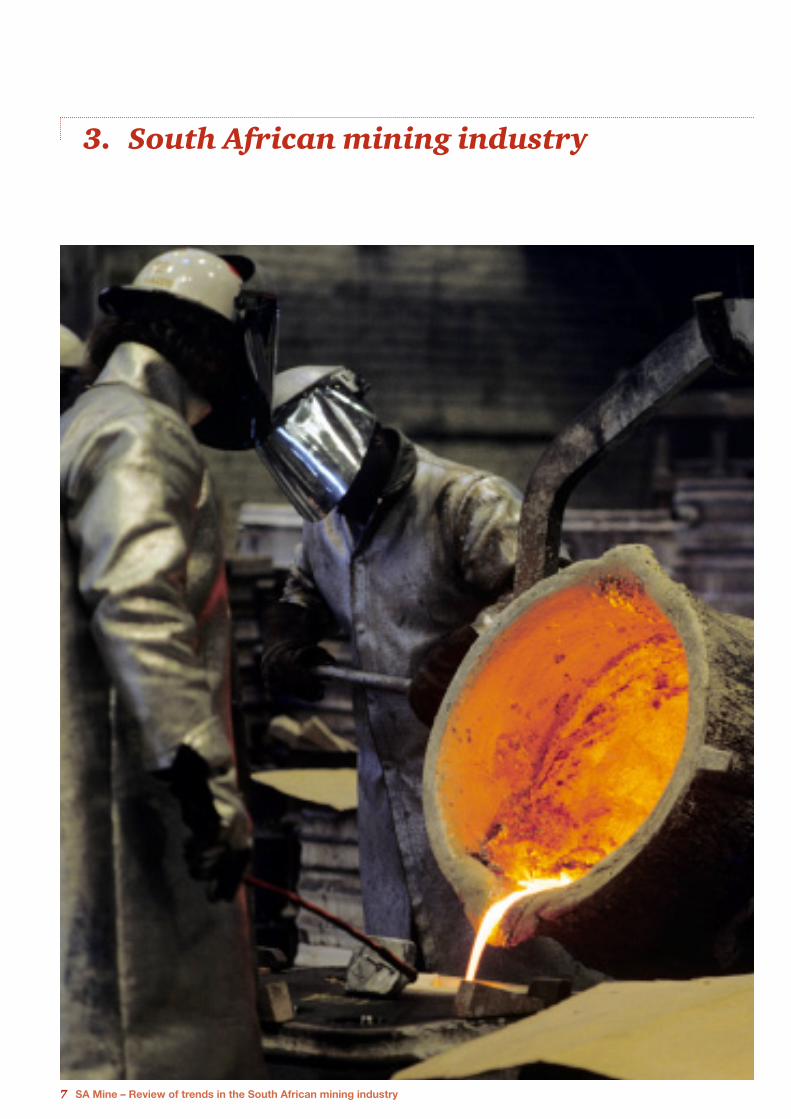
3. South African mining industry

SA Mine – Review of trends in the South African mining industry 8
This year’s publication reflects the tail end of the recent global recession and a rather shaky start to an expected new commodity boom cycle. Although market capitalisation has benefited from improved production and prices, these improvements are however not evident in the recently reported financial results.
Market capitalisation
The total market capitalisation of the 41 companies (2009: 34 companies) included in our review increased from R667 billion in 2009 to R879 billion in 2010. This is a significant increase, but one has to keep in mind that it is still far below the 2008 levels.
We included nine new companies in our analysis. Six of them were either new listings, companies previously suspended or existing listed entities with significant new acquisitions. Investor interest in the industry was evident through the successful multi-billion rand listings of Optimum Coal and, subsequent to our reporting period, Royal Bafokeng Platinum.
Two entities surveyed in the preceding year were excluded from our 2010 review – Kiwara Plc was taken over by First Quantum not listed on the JSE, and Uranium One Inc’s African presence shrunk after it closed its Dominium mine.

9 SA Mine – Review of trends in the South African mining industry
Platinum
Gold
Diversified
Other
R295,186 bn44%
R20,873 bn3%
R138,999 bn21%
R212,056 bn32%
Figure 2: Market Capitalisation June 2009 by commodity
Source: Business DayDescription: Figure 2: R' billion market capitalisation for the 34 companies included in the 2009 aggregation
Platinum
Gold
Diversified
Other
R397,027 bn45%
R27,226 bn3%
R215,300 bn25%
R239,334 bn27%
Figure 1: Market Capitalisation June 2010 by commodity
Source: Business DayDescription: Figure 1: R' billion market capitalisation for the 41 companies included in the 2010 aggregation

SA Mine – Review of trends in the South African mining industry 10
The market capitalisation of the top ten companies show an improvement when compared with 2009. At the same time, though, one can see that most non-gold companies are still far below the market capitalisation levels achieved in June 2008, before the market crash.
0
50
100
150
200
250
300
350Jun-10
Jun-09
Jun-08
Aquarius
Harmony
LonminARM
Exxaro
Gold Fields
Kumba
Impala
Anglogold Ash
anti
Anglo Plat
inum
Figure 3: Market capitalisation of Top Ten companies
Source: Business DayDescription: Figure 3: Market capitalisation for the Top 10 entities
R’ b
illio
n
Company
Anglo Platinum is still in the number one position after a 51% increase in market capitalisation since June 2009. AngloGold Ashanti performed well, overtaking Impala Platinum to claim second place. Gold Fields and Harmony had a more subdued market capitalisation performance and slipped from fourth and sixth positions to fifth and ninth respectively. Kumba Iron Ore climbed from fifth to fourth place with an impressive 81% market capitalisation growth – the best in the top ten. It managed to keep up momentum and was vying for second place after June. Aquarius Platinum replaced Assore in the 10th spot to increase the number of platinum companies in the top 10 to four.
The performance of most companies was largely impacted by the improvement in Rand commodity prices despite mostly stagnant growth.

11 SA Mine – Review of trends in the South African mining industry
PGMs
Coal
Gold
Iron ore
Other metals
28%
12%
13%
21%26%
Figure 4: Percentage mining revenue per commodity
Source: Statistics SADescription: Figure 4: Percentage mining revenue per commodity
Contribution by commodity
In 2005, coal and platinum group metals (PGMs) overtook gold as the biggest revenue-generating commodities. Last year it looked as though coal would be able to dislodge PGMs as the biggest revenue generator. However, PGMs retained the top spot on the back of a better price recovery.
For the 12 months to June 2010, the relative breakdown of mining revenues, excluding other non-metallic ores, was as follows:
• PGMs: R64,9 billion (2009: R68,9 billion)
• Coal: R60,3 billion (2009: R68,6 billion)
• Gold: R48,8 billion (2009: R47,9 billion)
• Iron ore: R31,6 billion (2009: R27,6 billion)
• Other metallic minerals (including manganese, copper and nickel): R28,0 billion (2009: R29,1 billion).
Iron ore was the only commodity that showed a meaningful increase in revenue earned. The high revenue levels of 2009 were still supported by the back-end of the previous commodity price boom, which effectively ended in October 2008. The impact of lower production was also mostly felt in 2010.

SA Mine – Review of trends in the South African mining industry 12
Price-driven growth
For South Africa, this mining boom started in 2006 with across-the-board commodity price increases. Unlike 2002, when revenue increases were mostly driven by a weakened Rand, the boom started in, and aided, a relatively strong Rand environment.
Figure 5 indicates the real Rand revenue per ounce of platinum and gold over the last 10 years. Real prices were derived by adjusting Rand prices for the impact of inflation, as measured against CPI movements. We replaced the last four years’ CPI with the average unit cost increases of the top five companies, which was significantly higher than CPI.
Figure 5: Real Rand price per oz
Source: World Gold Council, Johnson Matthey and PwC calculationDescription: Figure 5: Real Rand price per oz
R/o
z
Month
0
2000
4000
6000
8000
10000Gold
Platinum
Oct-10Oct-09Oct-08Oct-07Oct-06Oct-05Oct-04Oct-03Oct-02Oct-01Oct-00
Despite gold trading at all-time USD record highs, it is currently merely at real Rand levels experienced since 2006. Platinum is also below real Rand price levels experienced since 2000.
These lower real prices demonstrate how cost pressures have eroded profitability in the industry.

13 SA Mine – Review of trends in the South African mining industry
0
50
100
150
200
250
PGMs
Coal
Gold
Iron ore
Other metallicminerals
2010200920082007200620052004200320022001
Figure 6: Mining Revenue
Source: Statistics SADescription: Figure 6: Annual mining revenue to June
R’ b
illio
n
Year
PGM revenues were to a large extent the backbone of the recent boom, reaching a 39% contribution level in 2007. In 2009, though, the price-driven growth in coal and the production-driven growth in iron ore more than offset the decline in PGM revenues.
This year, total mining revenue declined for the first time since 2004. The decline, which was largely price-driven, was felt across the board. Iron ore was the exception, showing an impressive 14% revenue growth that was mainly supported by higher production.
As can be seen in Figure 7, USD commodity prices have been steadily improving since the lows they experienced at the end of 2008. The exaggerated USD commodity price growth is fuelled to a large extent by a weak USD, though. Figure 8 points to much lower price increases in Rand terms.

SA Mine – Review of trends in the South African mining industry 14
Figure 7: USD Commodity price movements
Source: AME Outlook, AME Iron ore outlook, Johnson Matthey, World Gold CouncilDescription: Figure 7: Rebased USD commodity prices
50
100
150
200
250
300
Iron Ore
Platinum
Gold
Coal
Sep-1
0
Jul-1
0
May-1
0
Mar-10
Jan-1
0
Nov-09
Sep-0
9
Jul-0
9
May-0
9
Mar-09
Jan-0
9
Nov-08
Sep-0
8
Jul-0
8
May-0
8
Mar-08
Jan-0
8
Nov-07
Sep-0
7
Jul-0
7
Ind
ex
Months
Figure 8: ZAR Commodity price movements
Source: AME Outlook, AME Iron ore outlook, Johnson Matthey, World Gold CouncilDescription: Figure 8: Rebased Rand commodity prices
50
100
150
200
250
300
350
Iron Ore
Platinum
Gold
Coal
Sep-1
0
Jul-1
0
May-1
0
Mar-10
Jan-1
0
Nov-09
Sep-0
9
Jul-0
9
May-0
9
Mar-09
Jan-0
9
Nov-08
Sep-0
8
Jul-0
8
May-0
8
Mar-08
Jan-0
8
Nov-07
Sep-0
7
Jul-0
7
Ind
ex
Months

15 SA Mine – Review of trends in the South African mining industry
Supply side of the equation
Annual production figures for gold, PGMs and diamonds continued to fall. The lack of investment and the lagging impact of cuts in production capacity during the economic crisis, as well as the impact of safety stoppages, are to a large extent responsible for these reductions.
Iron ore production increased in line with expectations, with the Sishen expansion project being mainly responsible for the growth.
Coal production remained largely unchanged despite significant interest in the commodity.
Figure 9: Annual production
Source: Statistics SADescription: Figure 9: Annual production rebased to July 2000
0
50
100
150
200Diamonds
Gold
PGMs
Iron ore
Coal
2010200920082007200620052004200320022001
Ind
ex
Year
SA Mine – Review of trends in the South African mining industry 16
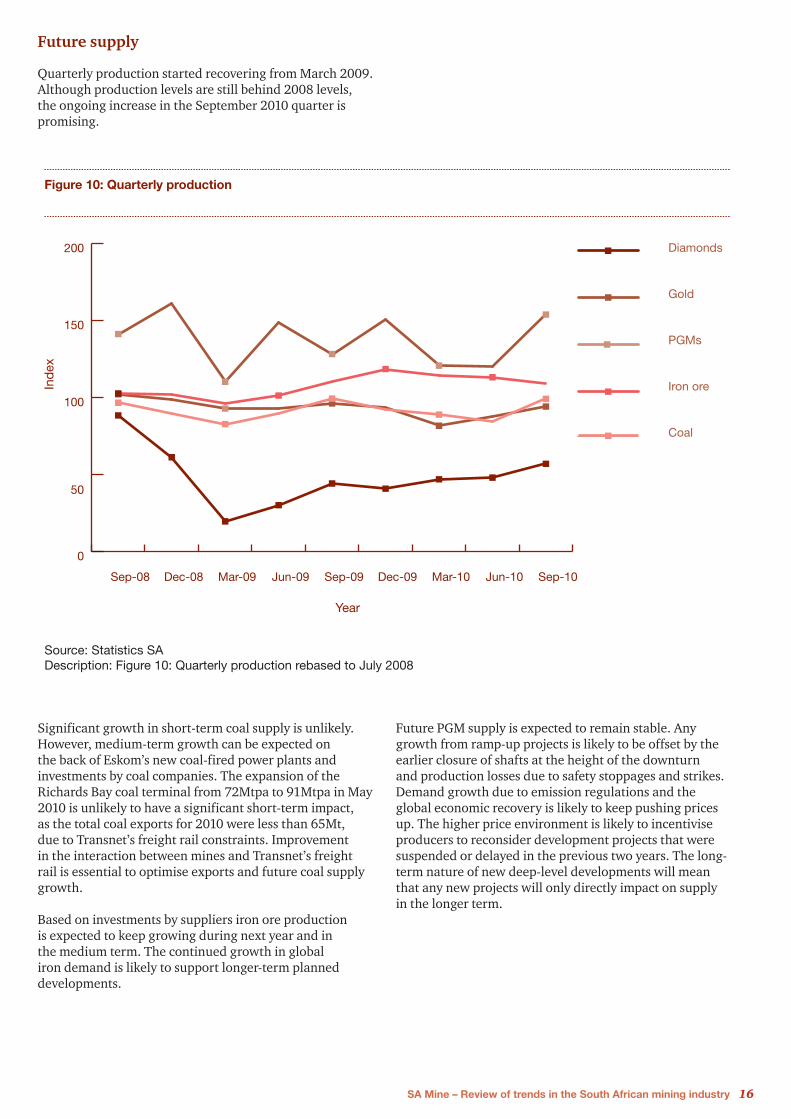
Future supply
Quarterly production started recovering from March 2009. Although production levels are still behind 2008 levels, the ongoing increase in the September 2010 quarter is promising.
Figure 10: Quarterly production
Source: Statistics SADescription: Figure 10: Quarterly production rebased to July 2008
0
50
100
150
200 Diamonds
Gold
PGMs
Iron ore
Coal
Sep-10Jun-10Mar-10Dec-09Sep-09Jun-09Mar-09Dec-08Sep-08
Ind
ex
Year
Significant growth in short-term coal supply is unlikely. However, medium-term growth can be expected on the back of Eskom’s new coal-fired power plants and investments by coal companies. The expansion of the Richards Bay coal terminal from 72Mtpa to 91Mtpa in May 2010 is unlikely to have a significant short-term impact, as the total coal exports for 2010 were less than 65Mt, due to Transnet’s freight rail constraints. Improvement in the interaction between mines and Transnet’s freight rail is essential to optimise exports and future coal supply growth.
Based on investments by suppliers iron ore production is expected to keep growing during next year and in the medium term. The continued growth in global iron demand is likely to support longer-term planned developments.
Future PGM supply is expected to remain stable. Any growth from ramp-up projects is likely to be offset by the earlier closure of shafts at the height of the downturn and production losses due to safety stoppages and strikes. Demand growth due to emission regulations and the global economic recovery is likely to keep pushing prices up. The higher price environment is likely to incentivise producers to reconsider development projects that were suspended or delayed in the previous two years. The long-term nature of new deep-level developments will mean that any new projects will only directly impact on supply in the longer term.

17 SA Mine – Review of trends in the South African mining industry
Last year the gold majors were optimistic that they would be able to deliver production from South Africa maintaining at least the same levels as 2008. Unfortunately, due to lost production as a result of safety stoppages, the targets were not achieved. It is noteworthy though that the 7% decline in production for the year was well below the average decline of more than 10% for the preceding six years. An improvement in operating and safety performance will hopefully signal the end of the extended decline in gold production in South Africa. Renewed investment in the industry with ambitious projects starting to come on stream will hopefully stabilise gold supply and could potentially add marginal growth in the medium term. In the long term we expect the decline to continue.
South African mining production can only grow with appropriate direct mining investment, related infrastructure investments to secure power supply, and the transport and training of a skilled workforce.
• Electricity supply will remain tight for the foreseeable future. Power cost pressure and supply security meant that the industry had to reduce per-production-unit usage. A number of innovative measures, along with closures, did much to curb demand. However, one of the concerns, if not constraints, for new projects remains electricity supply security.
• The impact of transport constraints is currently most evident in lower coal exports and the detrimental impact on rural roads. The allocation of extra capacity at the Richards Bay Coal Terminal will add pressure to freight rail constraints, with no apparent ability to increase availability. Ongoing investment is also required in the Northern Cape to ensure sufficient freight rail capacity for new iron ore developments.
• The skills shortage felt at the height of the previous boom is not as evident in the current environment, after rationalisation to right size. The reality though is that significant investment is required in this area to ensure an efficient and effective workforce to support future growth. Various large mining companies have in-house training centres and support studies through bursaries and loans. Retaining these skilled employees becomes increasingly difficult in an upswing, though, with global competition for South Africa’s sought-after experienced labour.
These structural constraints will require mining companies to partner with the public sector to achieve growth.

SA Mine – Review of trends in the South African mining industry 18

19 SA Mine – Review of trends in the South African mining industry
4. Financial performance

SA Mine – Review of trends in the South African mining industry 20
Current year R’billion
Preceding year R’billion
Difference R’billion
% Change
Revenue from ordinary activities 227 246 (19) (8%)
Operating expenses (179) (162) (17) 10%
Adjusted EBITDA* 48 84 (36) (43%)
Other income 11 14 (3) (21%)
Impairment reversal/(charge) 2 (25) 27 (108%)
Amortisation (24) (20) (4) 20%
PBIT* 37 53 (16) (31%)
Net finance cost (3) (1) (2) 150%
Tax expense (14) (18) 4 (20%)
Net profit 20 34 (14) (42%)
Adjusted EBITDA margin * 21% 34%
Net profit margin * 9% 14%
*Refer to Section 10 for a glossary of terms and non-GAAP measures used
Revenue
Revenue decreased by 8% in the current year, as opposed to an increase of 9% in 2009. As one would expect during a change in cycle, the performance of companies with year-ends between July 2009 and December 2009 was significantly weaker than that of companies with year-ends between January 2010 and June 2010. The former still reflected the brunt of the downturn in their results, showing a R22 billion decrease in revenue, whereas the latter reflected the start of the upturn with a R3 billion increase in revenue.
Our 2009 report highlighted a distinct revenue difference between gold and other commodities. This year there was no significant disparity between the performances of the different commodity producers.
Operating expenses
Operating expenses increased by 10% as opposed to the 14% experienced in 2009. This is well above CPI. When excluding companies that had increases in operating expenses directly attributable to increased production from new developments or acquisitions, the increase percentage reduces to 7%. Although lower, this increase occurred despite the general stability or decrease in production volumes. The result was an increase in unit costs, albeit at lower levels than those of the preceding year.
Summary of operating expense increase
Current year R’billion
Preceding year R’billion
Difference R’billion
% Change
Platinum companies 67 62 5 7%
Gold companies 56 54 2 5%
Companies with increases in production 34 27 7 27%
Other 22 19 3 16%
179 162 17 10%
Income statement
21 SA Mine – Review of trends in the South African mining industry
It was evident, though, that significant effort went into cost-saving exercises and the phasing out of marginal operations. Most companies had restructuring programmes which aimed to right-size the business for anticipated future production levels. Investors were willing to give the industry time to implement these restructuring programmes but will demand results in the future.
Employee benefits and contractors
Consumables and mining supplies
Utilities
Exploration
Royalties
Metal movements/purchases
Other
6%
19%
41%
1%
2%
10%
21%
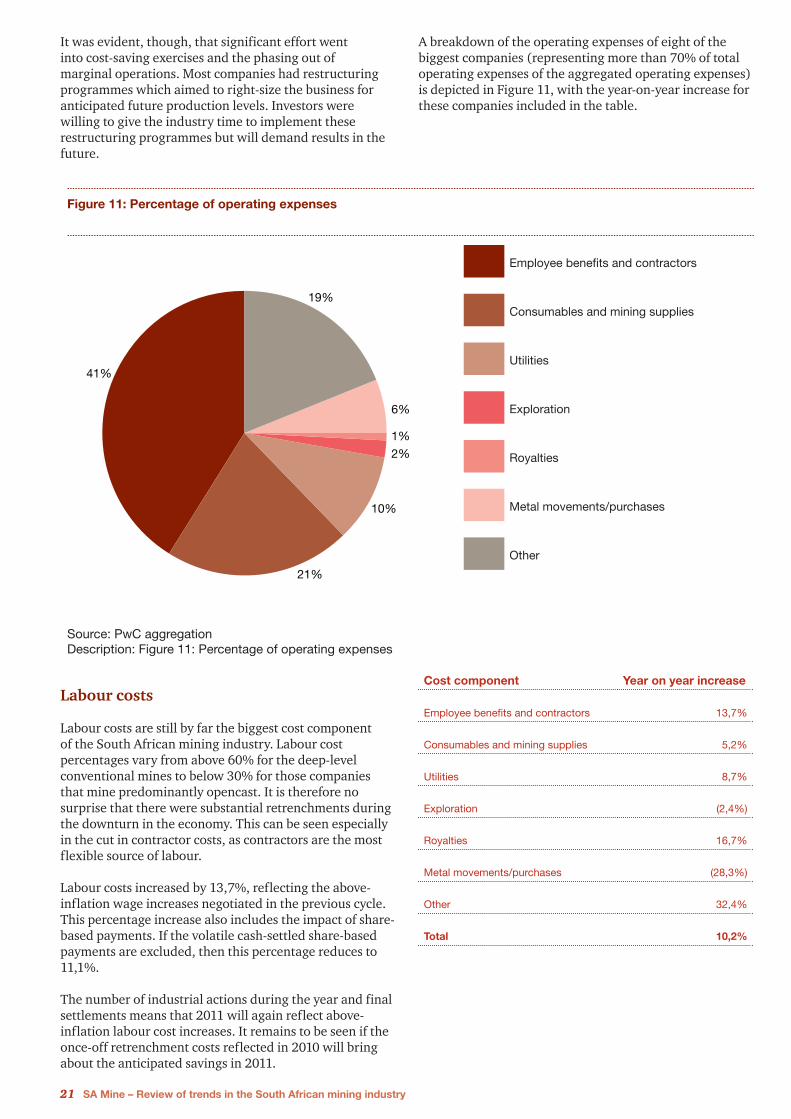
Figure 11: Percentage of operating expenses
Source: PwC aggregationDescription: Figure 11: Percentage of operating expenses
A breakdown of the operating expenses of eight of the biggest companies (representing more than 70% of total operating expenses of the aggregated operating expenses) is depicted in Figure 11, with the year-on-year increase for these companies included in the table.
Labour costs
Labour costs are still by far the biggest cost component of the South African mining industry. Labour cost percentages vary from above 60% for the deep-level conventional mines to below 30% for those companies that mine predominantly opencast. It is therefore no surprise that there were substantial retrenchments during the downturn in the economy. This can be seen especially in the cut in contractor costs, as contractors are the most flexible source of labour.
Labour costs increased by 13,7%, reflecting the above-inflation wage increases negotiated in the previous cycle. This percentage increase also includes the impact of share-based payments. If the volatile cash-settled share-based payments are excluded, then this percentage reduces to 11,1%.
The number of industrial actions during the year and final settlements means that 2011 will again reflect above-inflation labour cost increases. It remains to be seen if the once-off retrenchment costs reflected in 2010 will bring about the anticipated savings in 2011.
Cost component Year on year increase
Employee benefits and contractors 13,7%
Consumables and mining supplies 5,2%
Utilities 8,7%
Exploration (2,4%)
Royalties 16,7%
Metal movements/purchases (28,3%)
Other 32,4%
Total 10,2%

SA Mine – Review of trends in the South African mining industry 22
Consumables
The consumables increase of 5,2% benefitted from lower commodity prices, which directly impact chemicals, reagents and grinding material. With the recovery in commodity prices, we expect this component to again show an above-inflation increase next year.
Utilities
Utilities, including electricity and water, already represent 10% of total operating costs. It is therefore essential not only from a power security point of view but also from a cost-saving perspective that companies focus on opportunities to decrease their power consumption. The relatively low percentage cost increase of 8,7% was positively impacted by AngloGold Ashanti, which managed to reduce energy costs at its operations outside South Africa. If AngloGold Ashanti is excluded, the utilities cost component shows an increase of 20%. With the 25% annual Eskom price increases, this percentage is likely to grow.
Exploration costs
Exploration costs were an easy target for cash preservation strategies and decreased by 2,4% when compared to the preceding year. It is pleasing to note that the decrease was only marginal. For the long-term sustainability of the industry, it is essential that companies maintain their exploration programmes even in downturns.
Royalties
Royalty expenses reflect existing contractual royalty payments as well as the new national royalty expense from 1 March 2010. This expense will reflect a full year of royalties in 2011 and will increase the cost base of the industry.
Metal movements/purchases
This cost component relates predominantly to the PGM refiners that buy concentrate from junior producers for refining. The decrease reflects the lower average prices experienced at the beginning of the year.
Other
Included in the ‘Other’ cost component is the transport cost for the bulk commodities. This increase therefore also reflects the increase in production levels for these commodities.
The upward cost pressure will continue in 2011 and will keep eroding margins.
Impairment
As expected, with the recovery in commodity prices, 2010 did not render the same level of impairments as those recognised in 2009. A R5,3 billion reversal of impairment at AngloGold Ashanti due to higher long-term gold price assumptions was somewhat offset by a R1,4 billion impairment at Exxaro for one of its suspended mineral sands operations, and other minor impairments.
Despite the increase in commodity prices, margins remain under pressure. If there are any technical difficulties with operations, therefore, it could mean that the recoverability of assets has to be reconsidered.
Amortisation
Despite stable production, depreciation increased due to the higher capital base of new developments. The increased capital base can be attributed to the increased depth of new developments and the high-cost environment in which recent developments took place. We expect that depreciation costs will continue to increase.
Net finance cost
The low level of finance costs reflects the traditionally low levels of gearing maintained by most SA mining companies. The increase in finance costs for 2010 reflects a slight increase in debt levels, and increased rates are generally attached to restructured finance transactions.
Taxation
The effective tax rate increased from 34% to 41%. The increase relates to derivative expenditure at AngloGold Ashanti which was regarded as non-tax deductible and amounts taxable at Lonmin, despite a net loss position partially offset by capital gains, taxed at a lower rate at Anglo Platinum.
Net Profit
Net profit suffered as a result of the economic crisis and the decrease in prices in the previous year. The 42% decrease in profitability reflects an even worse position at a 68% reduction when one excludes the impact of impairment provisions and reversals.
The preceding year’s performance was still positively impacted by the dying stages of the boom and the resurgence of gold companies after the crash.
Strategies used in the preceding year to preserve cash affected this year’s cash flow statement as well.

23 SA Mine – Review of trends in the South African mining industry
Aggregated cash flow statement
Current year
R’billion
Preceding year
R’billion
Difference
R’billion
% Change
Cash flows related to operating activities
Cash generated from operations 59 91 (32) (35%)
Other (7) (11) 4 (32%)
Income taxes paid (12) (19) 7 (37%)
Net operating cash flows 40 61 (21) (35%)
Cash flows related to investing activities
Capital expenditure on property, plant and equipment (58) (68) 10 (16%)
Purchase of investments (6) (12) 6 (48%)
Sale of investments 19 15 4 19%
Other (1) 1 (2) (166%)
Net investing cash flows (46) (64) 18 (29%)
Cash flows related to financing activities
Proceeds from ordinary share issues 17 21 (4) (23%)
Proceeds from interest-bearing liabilities 58 45 13 31%
Repayment of interest-bearing liabilities and finance
leases
(55) (29) (26) 86%
Distribution to shareholders (15) (35) 20 (58%)
Net financing cash flows 5 2 3 170%
Net decrease in cash and cash equivalents (1) (1) 0 (0%)
Cash and cash equivalents at beginning of period 44 45 (1) (2%)
Cash and cash equivalents at end of period 43 44 (1) (1%)

SA Mine – Review of trends in the South African mining industry 24
Cash from operating activities (R21 billion decrease or 35%)
The R32 billion decrease in cash flow from operations reflects the decrease in operating profits.
Other cash flows from operating activities include a R6 billion hedge close-out cost for AngloGold Ashanti (2009: R8 billion).
This year the “tax paid” amount was less than the tax expense, as one would expect in light of the capital allowances received by the mining industry. In 2009, tax paid was more than the tax expense, as final payments relating to the earlier boom period still had to be made. The general lag in tax payments compared to the tax expense will mean a continued low tax payment for 2011, with an increase expected thereafter.
Cash flows from investing activities (net decrease of R18 billion or 29%)
Capital expenditure on property, plant and equipment
After the credit crisis, little funding was available. Companies therefore had to preserve their available cash. This, together with the low-price environment, caused companies to suspend or delay capital expenditure resulting in a decrease of 16% capital expenditure. The decrease in prices meant that even companies with strong balance sheets without cash could not necessarily make use of the opportunity to acquire “bargains” or to develop, in order to benefit from the next upswing. This lack of development at the bottom end of the cycle is likely to worsen the supply shortfall during the next upswing, as the shortfall will be driven by both demand and supply factors.
Fifty-six per cent of the aggregated capital expenditure was incurred by only four companies: Anglo Platinum (R11,3 billion, 2009: R14,4 billion), AngloGold Ashanti (R8,7 billion, 2009: R9,8 billion), Gold Fields (R7,7 billion, 2009: R7,6 billion) and Impala Platinum (R4,4 billion, 2009: R6,8 billion). In the preceding year these companies estimated that they would reduce their combined capital expenditure for the year under review by 27%. As conditions improved, their combined reduction in capital expenditure resulted in a reduction of only 17%. Expenditure is expected to remain at similar levels for 2011.
Investments
Movement in investments relates to general disposals of non-core assets to generate cash.
Net proceeds from investments sold and purchased realised R13 billion (2009: R3 billion). AngloGold Ashanti realised R9,7 billion, mainly from its sale of its interest in Boddington; Mvelaphanda Resources realised R3 billion as part of its unbundling; and Gold Fields realised R2,8 billion, mainly from its sale of Eldorado Gold.
Although there was no significant investment activity, we anticipate further consolidation at the junior level which could see a net cash amount spent on investments next year.
Cash flows from financing activities (net increase of R3 billion or 170%)
Equity
Equity was raised across the industry with platinum, gold and coal benefitting. It was particularly pleasing to see the initial public offer of Optimum Coal and subsequent listing of Royal Bafokeng Platinum. The oversubscription for these offers demonstrates the appetite by investors to share in the next possible upswing.
Borrowings
Net cash inflow from borrowings was R3 billion (2009: R16 billion). Borrowing activities were largely to restructure existing debt for rates and maturities.
Distributions to shareholders
Distributions to shareholders decreased from R35 billion in the preceding year to R15 billion in the current year as a result of the low levels of cash available. Kumba Iron Ore bucked the trend with a R8,2 billion distribution to shareholders on the back of good results achieved over the last few years. Impala Platinum was the only platinum producer that paid a reasonable dividend of R1,9 billion. Apart from Exxaro and Gold Fields, no one else paid dividends which in aggregate exceeded R1 billion.
Companies will have to weigh up the benefit of reinvesting cash and paying out surplus cash as dividends. With the recovery in commodity prices, a return to dividends is expected for 2011.

25 SA Mine – Review of trends in the South African mining industry
Aggregated financial position
Financial position Current year R’billion
Previous year R’billion
Difference R’billion
% Change
Current Assets
Cash and cash equivalents 43 44 (1) (2%)
Inventories 41 38 3 7%
Receivables and other current assets 32 31 1 2%
Derivative financial assets 3 6 (3) (54%)
Assets held for sale 5 17 (12) (71%)
Total current assets 124 136 (12) (9%)
Non-current Assets
Property, plant and equipment 353 313 40 13%
Goodwill 11 11 – 0%
Investments 32 28 4 15%
Derivative financial assets 3 3 – 0%
Other non-current assets 26 25 1 4%
Total non-current assets 425 380 45 12%
Total assets 549 516 33 6%
Share Capital and Reserves
Share capital 199 192 7 3%
Reserves and non-controlling interest 124 109 15 14%
Total equity 323 301 22 7%
Current Liabilities
Accounts payable and other liabilities 46 48 (2) (3%)
Interest-bearing liabilities 21 30 (9) (29%)
Derivative financial liabilities 20 17 3 16%
Total current liabilities 87 94 (8) (8%)
Non-current Liabilities
Interest-bearing liabilities 56 44 12 26%
Deferred taxation liabilities 55 50 5 9%
Derivative financial liabilities 5 3 2 67%
Other non-current liabilities 23 22 1 3%
Total non-current liabilities 139 119 20 17%
Total liabilities 226 214 12 5%
Total equity and liabilities 549 515 33 6%
SA Mine – Review of trends in the South African mining industry 26
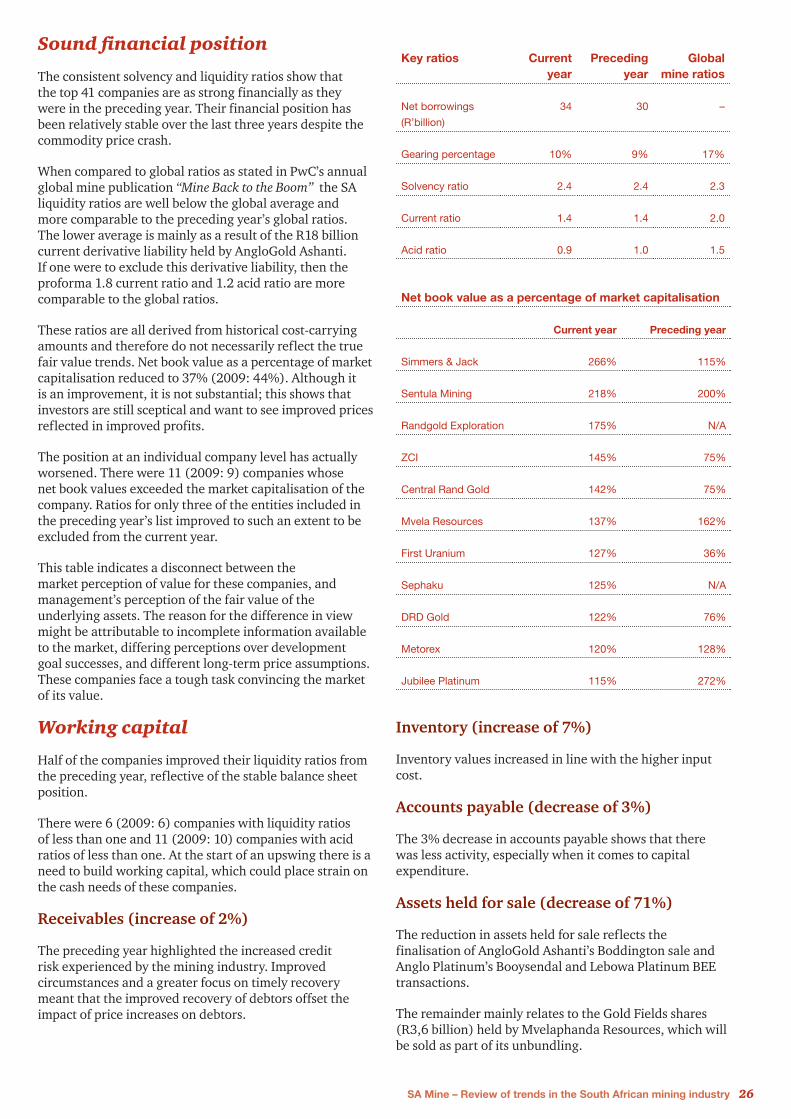
Key ratios Current year
Preceding year
Global mine ratios
Net borrowings
(R’billion)
34 30 –
Gearing percentage 10% 9% 17%
Solvency ratio 2.4 2.4 2.3
Current ratio 1.4 1.4 2.0
Acid ratio 0.9 1.0 1.5
Sound financial position
The consistent solvency and liquidity ratios show that the top 41 companies are as strong financially as they were in the preceding year. Their financial position has been relatively stable over the last three years despite the commodity price crash.
When compared to global ratios as stated in PwC’s annual global mine publication “Mine Back to the Boom” the SA liquidity ratios are well below the global average and more comparable to the preceding year’s global ratios. The lower average is mainly as a result of the R18 billion current derivative liability held by AngloGold Ashanti. If one were to exclude this derivative liability, then the proforma 1.8 current ratio and 1.2 acid ratio are more comparable to the global ratios.
These ratios are all derived from historical cost-carrying amounts and therefore do not necessarily reflect the true fair value trends. Net book value as a percentage of market capitalisation reduced to 37% (2009: 44%). Although it is an improvement, it is not substantial; this shows that investors are still sceptical and want to see improved prices reflected in improved profits.
The position at an individual company level has actually worsened. There were 11 (2009: 9) companies whose net book values exceeded the market capitalisation of the company. Ratios for only three of the entities included in the preceding year’s list improved to such an extent to be excluded from the current year.
This table indicates a disconnect between the market perception of value for these companies, and management’s perception of the fair value of the underlying assets. The reason for the difference in view might be attributable to incomplete information available to the market, differing perceptions over development goal successes, and different long-term price assumptions. These companies face a tough task convincing the market of its value.
Working capital
Half of the companies improved their liquidity ratios from the preceding year, reflective of the stable balance sheet position.
There were 6 (2009: 6) companies with liquidity ratios of less than one and 11 (2009: 10) companies with acid ratios of less than one. At the start of an upswing there is a need to build working capital, which could place strain on the cash needs of these companies.
Receivables (increase of 2%)
The preceding year highlighted the increased credit risk experienced by the mining industry. Improved circumstances and a greater focus on timely recovery meant that the improved recovery of debtors offset the impact of price increases on debtors.
Net book value as a percentage of market capitalisation
Current year Preceding year
Simmers & Jack 266% 115%
Sentula Mining 218% 200%
Randgold Exploration 175% N/A
ZCI 145% 75%
Central Rand Gold 142% 75%
Mvela Resources 137% 162%
First Uranium 127% 36%
Sephaku 125% N/A
DRD Gold 122% 76%
Metorex 120% 128%
Jubilee Platinum 115% 272%
Inventory (increase of 7%)
Inventory values increased in line with the higher input cost.
Accounts payable (decrease of 3%)
The 3% decrease in accounts payable shows that there was less activity, especially when it comes to capital expenditure.
Assets held for sale (decrease of 71%)
The reduction in assets held for sale reflects the finalisation of AngloGold Ashanti’s Boddington sale and Anglo Platinum’s Booysendal and Lebowa Platinum BEE transactions.
The remainder mainly relates to the Gold Fields shares (R3,6 billion) held by Mvelaphanda Resources, which will be sold as part of its unbundling.

27 SA Mine – Review of trends in the South African mining industry
Derivatives
Of the 41 companies aggregated, only AngloGold Ashanti has a significant hedge portfolio addressing both gold price risk and foreign exchange risk. At year-end its net derivative fair value position was a liability of R18 billion (R20 billion liability and R2 billion in assets). It also paid R6 billion (2009: R8 billion) during the year to close out certain derivative positions. The full position was closed out after the reporting period.
The only other significant derivative exposure relate to project finance hedging requirements. Palabora Mining Company has a R3,2 billion (2009: R1,7 billion) forward copper sales contract exposure. As project finance again becomes available for mining projects, one could expect to see an increase in this type of hedging.
Financing for sustainability
South African mining companies and banks have traditionally been conservative when it comes to funding mining projects. The 10% gearing ratio (2009: 9%) is still extremely conservative when compared to the 17% of the global top 40 companies as discussed in PwC’s publication “Mine Back to the Boom”. Net borrowings as a percentage of market capitalisation stood at just 3,8%, compared to the preceding year’s 5,2%. This improvement is largely due to the market capitalisation improvement.
Of the 41 companies aggregated, only 17 (2009: 17) were in a net borrowings position.
Although the overall gearing movement remained much the same, a number of individual companies had some significant gearing movements.
Of the top 10 companies, 80% (2009: 70%) were in a net borrowing position, as opposed to 29% (2009: 24%) of the remainder of the selected 41 companies. The disparity in this ratio could indicate that financial institutions prefer to provide finance based on strong balance sheets, rather than project-specific finance as required by the mid-tier and junior mining companies.
Figure 12: Gearing for the Top 10 Companies
Source: PwC calculationDescription: Figure 12: Gearing ratio for the top 10 companies
Gea
ring
per
cent
age
Companies
-25
-20
-15
-10
-5
0
5
10
15
20
25
30
35
402010
2009
Aqua
rius
Har
mon
y
Lonm
in
ARM
Exxa
ro
Gol
d Fi
elds
Kum
ba Ir
on O
re
Impa
la P
latin
um
Ang
logo
ld A
shan
ti
Ang
lo P
latin
um

SA Mine – Review of trends in the South African mining industry 28

29 SA Mine – Review of trends in the South African mining industry
5. Safety performance

SA Mine – Review of trends in the South African mining industry 30
Mining companies, government and unions alike realise how important employee safety is if the industry is to remain sustainable in the long term. This is evident in the emphasis placed on safety in company annual reports, safety stoppages and union commentary.
The seriousness with which all parties involved see the safety imperative was evident in financial statements, with a large number of companies referring to safety stoppages as a reason for lower production.
It is pleasing to note that the efforts to improve safety seems to be paying off. The DMR reported a 24% decline in fatalities for the year. The biggest reason for fatalities is still fall-of-ground incidents, followed by machinery-related underground incidents.
Of our top 10 companies, Kumba Iron Ore reflected the best safety record with regard to lost-time injuries. Anglo Platinum and Exxaro Resources showed the best improvement on the previous year.
Although we’ve seen an excellent improvement in safety matters, it is common cause that zero harm is not only the objective, but should be achieved.
Unions, government and companies are all committed to seeing a decline in mining fatalities, in order to be internationally competitive.
Figure 13: LTIFR
Source: Annual reportsDescription: Figure 13: Lost Time Injury Frequency Rate (LTIFR) per million man hours
LTIF
R
Top 10 companies
0
2
4
6
8
102010
2009
Harmony
Anglo Platinum
Anglogold
Ashanti
Lonmin
Gold�elds
Impala Platin
um
African Rainbow
MineralsAquariu
s
Exxaro Resources
Kumba Iron Ore

31 SA Mine – Review of trends in the South African mining industry
6. A year full of regulations and politics

SA Mine – Review of trends in the South African mining industry 32
No SA mining publication would be complete without reference to regulatory concerns and the nationalisation debate. 2010 in particular had its fair share of controversy in this area.
Prospecting and mining rights
Perceptions of corruption and incompetence in the awarding of new prospecting and mining rights were previously based on delays in the assessing and approval of applications. These perceptions were further fuelled by some high-profile disputed allocation of rights during the year.
• In February 2010, Kumba Iron Ore announced that although it had applied for the remaining 21.4% mining right at its Sishen Iron Ore project, previously held by Arcelor Mittal South Africa, a prospecting right over this 21.4% interest was granted by the Department of Mineral Resources (DMR) to a third party, Imperial Crown Trading. Although the DMR contends that due process was followed in the allocation, various legal actions might mean that the matter may only eventually be settled in court.
• Lonmin’s new order mining rights were initially only requested and awarded for PGMs. A request for associated minerals relating to the same area was only subsequently submitted. However, for a small portion of its land, a prospecting right for base metals associated with PGMs was awarded to Keysha Investments on a first-come-first-served basis. Lonmin was therefore “illegally” mining the associated minerals from the Keysha Investments prospecting right area. In August, the DMR instructed Lonmin to cease disposal of these associated minerals. A subsequent court order allowed Lonmin to continue selling the associated minerals, although the company needs to account for its disposal of minerals awarded to Keysha under its prospecting right.
• In November, Palabora Mining Company lodged an appeal to the DMR which had (apparently due to a “systems error”) granted copper and associated minerals mining rights to Foskor on the existing old order mining right area of Palabora Mining Company.
• Other less public mining/prospecting rights disputes which seemingly arose from opportunistic applications for prospecting rights on existing mining areas raise further uncertainty.
It would appear that in order to address the concerns resulting from these disputes, the Minister of Mineral Resources announced a six-month moratorium in August 2010 on receiving new prospecting rights applications. Apparently, new systems will be put in place to increase the transparency and effectiveness of the mining rights process. It is pleasing to note that the legitimacy of the process is receiving due attention. We hope that the renewed focus will provide the desired outcome.

33 SA Mine – Review of trends in the South African mining industry
Environmental approvals
In addition to the bureaucracy associated with mining rights, mining companies also need to comply with the ever increasing “burden” of environmental legislation. The importance of these requirements cannot be better illustrated than through the acid water crises anticipated on the Witwatersrand.
The unfortunate disconnect between the administration process of the DMR and the Department of Water Affairs (DWA) and other environmental agencies, became apparent during the year. A classic example was the threat of closure at Coal of Africa’s Mooiplaats mine, after it became known that although they possessed valid mining rights, appropriate environmental compliance was seemingly lacking. The company also had to suspend development at its Vele project due to environmental concerns.
First Uranium also had to temporarily delay development of its Mine Waste Solutions expansion project when environmental authorisations were withdrawn. Although they were reinstated shortly thereafter, the suspension meant that a $17 million counter party penalty was incurred due to development goals that could not be met on time. Ironically, the expansion should provide for a much more environmentally-friendly solution to existing tailings dams in the area.
The lack of new water usage licences for some operating mining companies is well-publicised. Most of these companies still operate under their old water permits or draft water usage licences. The delay in awarding these licences could hamper timely commencement and completion of new planned projects.
A key element to environmental management is the need for funds and guarantees to be in place for the required rehabilitation upon mine closure. When new order
mining rights are issued, it is a typical requirement that companies provide proof of funds available for the full current cost estimate of rehabilitation. This requirement is often unrealistic for junior mining companies that would rather set funds aside over the expected life of the mine and rehabilitate in future. Insurance products to cater for this purpose unfortunately fell into disfavour but will hopefully be reinstated in order to address this entry barrier for new mining companies. It is imperative that mining companies engage with the DMR to find workable solutions for the unique rehabilitation funding needs of individual projects.
Our analysis indicated varying levels of disclosure relating to the rehabilitation provision and estimates for mining companies. Sixteen of the companies in our review included all the relevant information for the table alongside, which provides a good indication of the exposure relating to rehabilitation. It is pleasing to note that the gap between the covered positions and the total current cost estimate is narrowing. More important however, is the need for sustainable solutions to fund the difference.
Current year
R'billion
Previous
year
R'billion
Rehabilitation provision amount 11 11
Current cost estimate of provision 16 13
Rehabilitation trust assets/deposits (6) (5)
Current cost estimate not covered by
trust assets or deposits
10 8
Guarantees (4) (3)
Uncovered current cost estimate 6 5

SA Mine – Review of trends in the South African mining industry 34
It is evident from the table that the mining industry is a significant contributor to the country’s wealth. Unfortunate examples of regional nationalisation failures elsewhere, e.g. Zimbabwe vs. Zambia, North Korea vs. South Korea and East Germany vs. West Germany are clear to see. In our opinion, South Africa cannot afford the risk to the mining industry’s contribution by engaging in a nationalisation experiment. We hope that the nationalisation debate will put the spotlight on the mining industry and demonstrate its investment potential - and the benefits from free market investment for the South African public.
Current year
Preceding year
% of GDP 5% 6%
% of total corporation tax income
to SARS
8% 13%
Number of people employed in
industry
503,000 488,000
Average monthly earnings in
industry
R12,618 R12,035
Average monthly earnings across all
industries
R11,825 R11,020
Source: Statistics SA
The nationalisation debate
The challenges in obtaining new order mining rights and environmental authorisation for projects pales into insignificance when the nationalisation debate begins. Security of tenure is essential when one makes investment decisions that span up to 30 years, or more. Because so much is at stake, the emotions associated with nationalisation unfortunately make it difficult for one to take an objective stance.
The views on nationalisation vary from “South Africa’s mines are already fully nationalised as all minerals belong to the state” to “it could never happen”. The current position is somewhere in between. The state already owns various mining interests through the IDC, the new state-owned mining company African Exploration & Finance Company, and purpose build companies like Alexkor. As to the debate, the ANC tasked experts to investigate successful models on which to base the role of central governments in mining. The outcome of this research is only expected to impact ANC policymaking by 2014. An outsider could probably be forgiven for viewing the current debate within the ANC as much more of a political power struggle than an ideological assessment.
Despite the opposing views on the matter, there appears to be a unified view that the mineral wealth of the country should benefit its citizens. Wholesale nationalisation would attempt to achieve this goal through the earning of profits from mining companies. The National Union of Mineworkers (NUM) does not support wholesale nationalisation but could support strategic investment by the state in the industry. The union believes that proceeds from such mining activities by the state should be ring-fenced for education (20%), health (20%), rural development (20%) as well as re-investment into the state mining company (40%). The Minister of Mineral Resources, who has spoken out against nationalisation, made the following statement during her 17 August 2010 media address: “The mining sector, together with its related industries, remains critical to the country’s socio-economic development… it is clear that the mining industry is potentially an important cog in the wheel that is driving the war against poverty and underdevelopment in our country.”
With significant income already generated from mining companies on a “risk-free” basis, it is hard to understand why the state should assume ownership. If made responsible for mining companies, the state would have to fund new developments with cash that could be used elsewhere, and manage the industry with human resources currently not available. By providing a stable and efficient operating and regulatory environment for mining companies, the state should be able to attract more direct investment from mining companies; which would increase tax revenue collected from mining companies.
The following information provides an indication of the contribution of the mining industry on the country:

35 SA Mine – Review of trends in the South African mining industry
7. Total tax contribution by the mining industry

SA Mine – Review of trends in the South African mining industry 36
Total Tax Contribution (TTC) is a methodology for identifying and measuring all of the different taxes, royalties and other amounts that companies pay to government. Our TTC study with mining companies and South African companies, published in May 2010, helped to create transparency regarding the size of the economic contribution that mining companies make to the public finances in the countries where they operate. The mining industry, perhaps more than others, remits large amounts of non-income taxes to various levels of government in different forms. However, these non-income taxes may not be highlighted in financial statements, leaving an incomplete picture of the contribution that mining companies make.
Mining companies are under increased public scrutiny regarding the taxes they pay. In some countries, governments have looked at imposing additional levies on the sector, or are doing so now. There is also growing pressure on both government and business to increase transparency in the extractive industries, with a call for companies to “publish what they pay”, and for governments to “publish what they receive” – and how they use these revenues. The Dodd Frank Wall Street Reform Act, signed by US President Barack Obama in July 2010, will in future require SEC-registered companies in the sector to disclose their payments to government by country and by project. Our TTC work with mining companies has helped to shed light on the scale of the economic contribution they make to public finances. A number of them are using this information in their corporate reporting.
The TTC study specific to mining companies in South Africa was based on 10 companies and looked at their taxes and other contributions paid to government. It showed that mining companies pay significant other amounts in addition to corporate income tax.
What do mining companies contribute?
Our TTC study showed that, on average:
• Corporate income tax is only 79% of all taxes and contributions borne by mining companies.
• The total tax rate for all taxes borne as a percentage of profit adjusted for tax expenses amounts to 20%.
• For every R1 of corporate income tax, mining companies pay another R0,96 in taxes collected, when one excludes the impact of refunds.
• Mining companies contribute an amount equivalent to 9,45% of their turnover to government.
It is interesting to note that the 20% of profit figure in the TTC study is well below the cash tax paid according to our aggregation, as a percentage of profit before tax of 35% (2009: 36%). The difference partially relates to net VAT inputs received back by mining companies, which mostly export with VAT outputs at a zero rate. The remainder of the difference is explained by the more than average capital expenditure programmes for the companies included in the TTC survey. Mining capital expenditure provides a full tax deduction in the year of the expense.

37 SA Mine – Review of trends in the South African mining industry
Figure 14 shows the breakdown of total taxes contributed by the mining companies included in the PwC South African TTC survey. This breakdown does not include the net refund of product taxes, which amounts to about 20% of the TTC and relates mostly to VAT inputs claimed in excess of VAT outputs.
Corporate income tax
STC
Mining taxes
Property taxes
Planet taxes
People taxes
32%60%
0%
0%
1%
7%
Figure 14: Tax contribution
Source: PwC TTC What is the actual contribution of large companies to the fiscusDescription: Figure 14: Pie chart showing the average position for taxes and contributions borne by mining companies
The study was carried out using the PwC Total Tax Contribution Framework. This is straightforward in concept, not tax-technical and therefore relatively easy for stakeholders to grasp, many of whom have limited knowledge of tax complexities. By focusing on payments, it provides a measure of what companies contribute to the public finances, and the creation of prosperity and stability for the communities in which they operate.
The TTC Framework distinguishes between taxes borne and taxes collected. Taxes borne are the company’s own cost and will affect its results; for example, property taxes will form part of property costs. Taxes collected are those that the company administers on behalf of government and collects from others; for example, employee income taxes are deducted through the payroll. Taxes collected will have an administrative cost for the company and will also have an impact on the company’s business; for example, employment taxes affect the cost of labour.
The TTC Framework also extends to royalties and other payments and contributions to government, such as fees and other levies and contributions to local infrastructure. These are also an important part of the company’s economic footprint and are particularly relevant to the mining sector. The new mining royalty, effective from March 2010, is not yet included in the breakdown and will add a significant additional cost to the mining sector.
We have received a positive response to our first study for the global mining industry, validating our perception that there is keen interest in better understanding the complete tax and other payments that mining companies make to government.
The study results have been used by government, investors and civil society organisations, as well as industry players and mining companies themselves.

SA Mine – Review of trends in the South African mining industry 38

39 SA Mine – Review of trends in the South African mining industry
8. Sustainable mining

SA Mine – Review of trends in the South African mining industry 40
For a very long time, the mining industry has been in the sustainability spotlight because of its impact on water quality, high energy demand and post-closure legacy.
This has to a large extent resulted in mining companies leading the way over other industries as regards annual sustainability reporting. Many large mining companies are publishing highly transparent sustainability reports that are balanced and rich in sustainability data, earning them inclusion in several sustainability indices and rewards. The requirement for such reporting has now been formalised in the King III requirements.
Assurance of key performance indicators as well as their alignment with reporting and ethical principles as prescribed by the Global Reporting Initiative (GRI), and industry bodies such as the International Council on Mining and Metals (ICMM), raise their credibility and demonstrate their ability to perform consistently. However, the outlook on small-scale or marginal miners is very different.
The marginal miner business model often offers quick access for previously disadvantaged entrants to get into the sector. Where older and less profitable operations are acquired, marginal miners often do not have adequate provisions that are required for rehabilitation, both during operation and after closure. This means that the environmental and social costs of mining are externalised, threatening to bring the good record of industry leaders into disrepute. Inadequately closed old mines in Gauteng are causing rising acid mine drainage that threatens to start decanting into Gauteng’s water courses. The resulting pollution will be devastating.
The past decades have seen many regulatory changes in the mining sector. These encourage safer production and more sustainable environmental and social practices. What mines really need right now is the necessary encouragement and support to embed more sustainable practices and to develop their enabling capacity. Ways in which to kick-start the laggards and support marginal miners should be found. The industry leaders have gone a long way towards conducting themselves in a ‘sustainable’ way – not meaning to function in perpetuity but to act in a responsible way over the period of the project, including the closure phase. Sustainability in the mining industry is about converting non-renewable natural capital into other forms of capital that generate more long-term benefits for society, than the negative impacts caused by environmental damage and social disruptions.
The ability to operate sustainably hinges on mines’ ability to show consistent performance with minimal impact on the rivers that support us, the land we cultivate, our livestock, the air we breathe and the human capital needed throughout a mine’s life cycle. It means a willingness to adequately absorb those costs that have been borne by the environment and communities in the past.

41 SA Mine – Review of trends in the South African mining industry
9. Other information
SA Mine – Review of trends in the South African mining industry 42
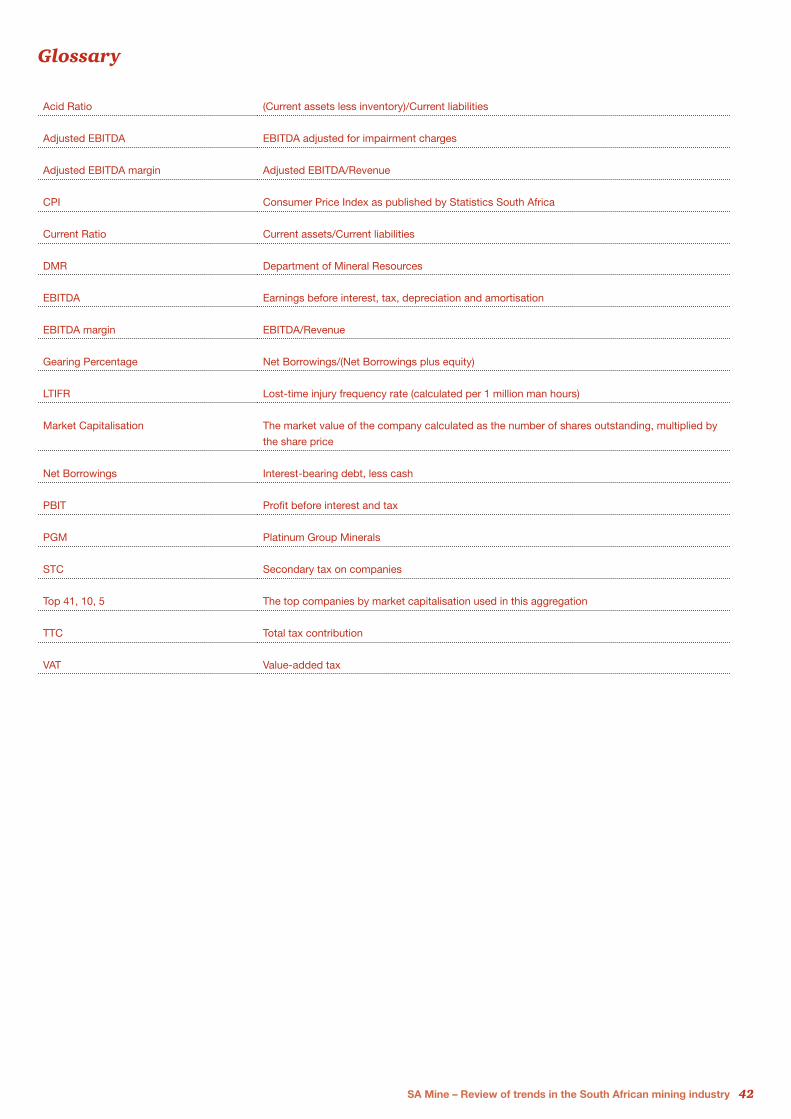
Acid Ratio (Current assets less inventory)/Current liabilities
Adjusted EBITDA EBITDA adjusted for impairment charges
Adjusted EBITDA margin Adjusted EBITDA/Revenue
CPI Consumer Price Index as published by Statistics South Africa
Current Ratio Current assets/Current liabilities
DMR Department of Mineral Resources
EBITDA Earnings before interest, tax, depreciation and amortisation
EBITDA margin EBITDA/Revenue
Gearing Percentage Net Borrowings/(Net Borrowings plus equity)
LTIFR Lost-time injury frequency rate (calculated per 1 million man hours)
Market Capitalisation The market value of the company calculated as the number of shares outstanding, multiplied by
the share price
Net Borrowings Interest-bearing debt, less cash
PBIT Profit before interest and tax
PGM Platinum Group Minerals
STC Secondary tax on companies
Top 41, 10, 5 The top companies by market capitalisation used in this aggregation
TTC Total tax contribution
VAT Value-added tax
Glossary

43 SA Mine – Review of trends in the South African mining industry
Company Year-end
African Rainbow Minerals Limited (ARM) 30/06/2010
AngloGold Ashanti Limited 31/12/2009
Anglo Platinum Limited 31/12/2009
Anooraq Resources Corporation 31/12/2009
Aquarius Platinum Limited 30/06/2009
Assore Limited 30/06/2009
Central Rand Gold Limited 31/12/2009
Coal of Africa Limited 30/06/2010
DRD Gold Limited 30/06/2010
Eastern Platinum Limited 31/12/2009
Exxaro Resources Limited 31/12/2009
Firestone Energy Limited 30/06/2010
First Uranium Corporation 31/03/2010
Gold Fields Limited 30/06/2010
Gold One International Limited 31/12/2009
Great Basin Gold Limited 31/12/2009
Harmony Gold Mining Company Limited 30/06/2010
Impala Platinum Holdings Limited (Implats) 30/06/2010
Jubilee Platinum Plc 30/06/2010
Keaton Energy Holdings Limited 31/03/2010
Kumba Iron Ore Limited 31/12/2009
Lonmin Plc 30/09/2009
Merafe Resources Limited 31/12/2009
Metmar Limited 28/02/2010
Metorex Limited 30/06/2010*
Mvelaphanda Resources Limited 30/06/2009
Northam Platinum Limited 30/06/2009
Optimum Coal Holdings Limited 30/06/2010
Palabora Mining Company Limited 31/12/2009
Pan African Resources Plc 30/06/2010
Companies aggregated

SA Mine – Review of trends in the South African mining industry 44
Basis of compiling this report
We aggregated the financial results of mining companies with a primary listing on the Johannesburg Stock Exchange (JSE) and mining companies whose main operations are in Africa and that have a secondary listing on the JSE, for the financial year ends to June 2010. We used a cut off market capitalisation of R200 million and excluded all companies with suspended listings.
Our selected criteria excluded global mining companies Anglo American and BHP Billiton. Although both these companies have South African roots, their global exposure and size means that they do not necessarily reflect trends in the South African mining environment. A large number of the entities included also have international exposure. However, the bulk of their operations are based in Africa.
The results aggregated in this report have been sourced from information that is publicly available, primarily annual reports or reviewed results made available to shareholders. Companies have different year ends and report under different accounting regimes.
Information has been aggregated for the financial years of individual companies and no adjustments have been made to take into account different reporting requirements and year ends. As such, the financial information shown for 2010 covers reporting periods from 1 October 2008 to 30 June 2010, with each company’s results included for the 12-month financial reporting period that falls into this timeframe.
Information for the previous year comprises information for the 41 companies selected in the current year except where indicated otherwise.
All currency figures in this publication are reported in South African rands, except where specifically stated
otherwise. The results of companies that report in currencies other than the rand have been translated at the average rand exchange rate for the financial year, with balance sheet items translated at the closing rand exchange rate.
Some diversified companies undertake part of their activities outside the mining industry. No attempt has been made to exclude such non-mining activities from the aggregated financial information.
About PwC
PwC firms provide industry-focused assurance, tax and advisory services to enhance value for their clients. More than 163,000 people in 151 countries in firms across the PwC network share their thinking, experience and solutions to develop fresh perspectives and practical advice.
See www.pwc.com for more information.
PwC Mining Centre of Excellence
PwC Mining Centre of Excellence is a major player in the South African mining sector and offers the industry expertise in audit, tax, risk management, environmental services and transaction support.
Our diverse client base covers the full spectrum of economic activities in the mining sector. We bring appropriate local knowledge and experience to bear and use the depth of our resources to bring clients a professional service specifically tailored to meet their requirements.
Having successfully stood up to the challenge to retain skills in South Africa, our teams have the capability and availability to service all our mining clients.
Company Year-end
Petmin Limited 30/06/2009
Platmin Limited 31/12/2009
Randgold and Exploration Company Limited 31/12/2009
Sentula Mining Limited 31/03/2010
Sephaku Holdings Limited 30/06/2010
Simmers & Jack Mines Limited 31/03/2010
Transhex Group Limited 31/03/2010
Village Main Reef Mining Company (1934) Limited 30/06/2010
Wesizwe Platinum Limited 31/12/2009
Witwatersrand Consolidated Gold Resources Limited (Witsgold) 28/02/2010
Zambia Copper Investments Limited 31/03/2010

45 SA Mine – Review of trends in the South African mining industry
We would like to thank the following people for their valuable contribution to this report:
• Andries Rossouw
• Eruk Bergh
• Laetitia Le Roux
• Nthato Makhetha
• Petrus Gildenhuys
• Scott Williams
• Tanya Liversage
• Troopti Naik
Hein Boegman African Mining Leader Tel: +27 (11) 797 4335 Email: [email protected]
Pieter Hough Energy & Mining Assurance Partner Tel: +27 (11) 797 4158 Email: [email protected]
Andries Rossouw Energy & Mining Assurance Partner Tel: +27 (11) 797 4060 Email: [email protected]
Simon Venables Transactions Leader Tel: +27 (11) 797 5660 Email: [email protected]
Gert Meiring Tax Partner Tel: +27 (11) 797 5506 Email: [email protected]
Allison Ramsden Sustainability Partner Tel: +27 (11) 797 4658 Email: [email protected]
Tim Goldsmith Global Mining Leader Tel: +61 (3) 8603 2016 Email: [email protected]
Underground mining pictures courtesy of Royal Bafokeng Platinum Ltd.
To learn more about the issues raised in this report and our services, please contact:

SA Mine – Review of trends in the South African mining industry 46

47 SA Mine – Review of trends in the South African mining industry
Notes

SA Mine – Review of trends in the South African mining industry 48

© 2011 PricewaterhouseCoopers (“PwC”), a South African firm, PwC is part of the PricewaterhouseCoopers International Limited (“PwCIL”) network that consists of separate and independent legal entities that do not act as agents of PwCIL or any other member firm, nor is PwCIL or the separate firms responsible or liable for the acts or omissions of each other in any way. No portion of this document may be reproduced by any process without the written permission of PwC.
www.pwc.com/za