Embed Size (px)
Citation preview
R E V I E W O F T H E E C O N O M Y 2 0 1 4
1 EMPOWERING OUR PEOPLE THROUGH SUSTAINED ECONOMIC GROWTH AND PROSPERITY
GOVERNMENT OF THE REPUBLIC OF TRINIDAD AND TOBAGO
R E V I E W O F T H E E C O N O M Y2 0 1 4
R E V I E W O F T H E E C O N O M Y 2 0 1 4
2EMPOWERING OUR PEOPLE THROUGH SUSTAINED ECONOMIC GROWTH AND PROSPERITY
Overview 26Domestic Agriculture 26Export Agriculture 28Manufacturing 28Overview 28Iron and Steel 29Cement 30Services 31Overview 31Construction 31Tourism 31Prices 32Productivity 33Population 34Labour Force and Employment 34Unemployment 34Labour Force / Job Creation 35
Central Government Operations 36
Overview 36Revenue 37Expenditure 39Financing 41Public Debt and Debt Service 41
Rest of The Non-Financial Public Sector Operations 46
Overview 46Cash Operations 46Current Transfers To State Enterprises & Public Utilities 47Capital Expenditure 47Capital Transfers From Central Government 48
C O N T E N T S
The International Economy 6
Global Overview 6United States 7Canada 7The United Kingdom 7The Euro Area 8Japan 8Emerging and Developing Asia 9Latin America and The Caribbean 10Commonwealth of Independent States (CIS) 10Middle East and North Africa (MENA) 11Sub-Saharan Africa 11
Economic Performance of CARICOM States 14
Introduction 14Barbados 15Jamaica 15Guyana 16ECCU 17
Summary of Macroeconomic Performance of The Trinidad and Tobago Economy 19
The Real Economy 21
Gross Domestic Product (GDP) 21Petroleum 22Drilling 22Crude Oil and Condensate 22Natural Gas 23Petrochemicals (Ammonia, Urea and Methanol) 25Agriculture 26
R E V I E W O F T H E E C O N O M Y 2 0 1 4
3 EMPOWERING OUR PEOPLE THROUGH SUSTAINED ECONOMIC GROWTH AND PROSPERITY
Trade and Payments 61
Balance of Payments 61Current Account 61Capital Account 61Foreign Reserves 61Heritage and Stabilisation Fund (Hsf) 62Balance of Visible Trade 63Caricom Trade 63Caricom-Canada Trade and Development Agreement 63Trinidad and Tobago / El Salvador Agreement 63Trinidad and Tobago/ Guatemala Partial Scope Agreement 64Trinidad and Tobago / Panama Partial Scope Agreement 64World Trade Organization (WTO) – Agreement On Trade Facilitation 64
Trinidad and Tobago Credit Ratings 49
Moody’s Investors Service 49Standard & Poor’s Ratings Services 50Caribbean Information and Credit Rating Services Limited (Caricris) 51Monetary Conditions 52Central Bank Operations 52Foreign Exchange Market 52
The Monetary Sector 52
Monetary Conditions 52Central Bank Operations 52Foreign Exchange Market 52Money Supply and Commercial Banks’ Deposits and Credits 53Interest Rates 54Liquidity Management 55Financial Sector Performance 55Capital Market Activity 55Regulatory Developments 59Legislative Developments 59
CONTENTS
R E V I E W O F T H E E C O N O M Y 2 0 1 4
4EMPOWERING OUR PEOPLE THROUGH SUSTAINED ECONOMIC GROWTH AND PROSPERITY
Table 1: Macroeconomic Indicators for Selected Economies 13
Table 2: Macroeconomic Indicators for Selected CARICOM Economies 18
Table 3: Oil and Gas Prices 23
Table 4: Cash Statement of Operations of the Rest of the Non-Financial Public Sector 48
Table 5: Trinidad and Tobago Credit Rating History: 2006-2014 By Moody’s Investors Service 50
Table 6: Trinidad and Tobago Credit Rating History: 2006 -2014 By Standard and Poor’s Ratings Services 51
Table 7: Trinidad and Tobago Credit Rating History: 2008 – 2014 By CariCRIS 51
Table 8: Commercial Banks and Non-Bank Financial Institutions’ Foreign Currency Sales and Purchases (US$ Mn.) 53
Table 9: Total Registrants 56
Table 10: Summary Balance of Payments (US$ million) 62
LIST OF FIGURES
LIST OF TABLES
Figure 1: Development and Exploratory Drilling 22
Figure 2: Natural Gas Production and Utilisation 24
Figure 3: Exports of LNG by Destination 25
Figure 4: Petrochemical Prices (Ammonia, Urea and Methanol) 25
Figure 5: Production, Exports and Local Sales of Iron and Steel 29
Figure 6: Cement Production, Export and Local Sales 31
Figure 7: Prices – Percentage Change (Year-on-Year) 32
Figure 8: Distribution of Unemployed Persons by Age Group (2013) 35
Figure 9: Central Government Fiscal Operations 37
Figure 10: Central Government Revenue 39
Figure 11: Central Government Expenditure 40
Figure 12: Recurrent Expenditure Major Components 41
Figure 13: Public Sector Debt and Debt Servicing 42
Figure 14: Exchange Rates – Buying Rate (TT$ per US$) 53
Figure 15: Repo Rate and Prime Interest Rates 54
Figure 16: Commercial Banks’ weighted average deposit and loan spread 54
Figure 17: Liquidity Indicators 55
Figure 18: Comparative Analysis – Market Share 58
CONTENTS
R E V I E W O F T H E E C O N O M Y 2 0 1 4
5 EMPOWERING OUR PEOPLE THROUGH SUSTAINED ECONOMIC GROWTH AND PROSPERITY
LIST OF APPENDICES
CONTENTS
Appendix 1 Gross Domestic Product of Trinidad and Tobago at Constant (2000) Prices /TT$ Millions/ 65
Appendix 2 Gross Domestic Product of Trinidad and Tobago at Constant (2000) Prices /Percentage Change/ 66
Appendix 3 Gross Domestic Product of Trinidad and Tobago at Constant (2000) Prices
/Percentage Contribution/ 67
Appendix 4 Gross Domestic Product of Trinidad and Tobago at Market Prices (Current Prices)
/TT$ Millions/ 68
Appendix 5Gross Domestic Product of Trinidad and Tobago at Market Prices (Current Prices)
/Percentage Change/ 69
Appendix 6 Gross Domestic Product of Trinidad and Tobago at Market Prices (Current Prices) /Percentage Contribution/ 70
Appendix 7 Development and Exploratory Drilling and Domestic Crude Production 71
Appendix 8 Natural Gas and Liquefied Natural Gas Production and Utilisation 72
Appendix 9 Petrochemicals Production and Exports /Tonnes ‘000/ 73
Appendix 10 Iron and Steel Production /Tonnes ‘000/ 74
Appendix 11 Change in Prices, Productivity and Average Weekly Earnings /Percentage Change/ 75
Appendix 12 Population, Labour Force and Employment (Mid-year) 76
Appendix 13 Mid-year Estimates of Population by Age 77
Appendix 14 Labour Force by Industry and Employment Status (CSSP Estimates) /Hundreds (‘00)/ 78
Appendix 15 Exchange Rate for Selected Currencies 79
Appendix 16 Money Supply /TT$ Millions/ 80
Appendix 17 Commercial Banks’ Liquid Assets /TT$ Millions/ 81
Appendix 18 Commercial Banks’ Domestic Credit /TT$ Millions/ 82
Appendix 19 Commercial Banks’ Interest Rates 83
Appendix 20 Secondary Market Activities 84
Appendix 21 Central Government Fiscal Operations /TT$ Millions/ 85
Appendix 22 Central Government Revenue /TT$ Millions/ 86
Appendix 23 Central Government Expenditure and Net Lending /TT$ Millions/ 87
Appendix 24 Central Government Financing Transaction /TT$ Millions/ 88
Appendix 25 Total Public Debt and Debt Service 89
Appendix 26 Trinidad and Tobago - Net Foreign Reserves /US$ Millions/ 90
Appendix 27 Trade with CARICOM Countries /TT$ Millions/ 91
Appendix 28 Balance of Visible Trade /TT$ Millions/ 92
R E V I E W O F T H E E C O N O M Y 2 0 1 4
6EMPOWERING OUR PEOPLE THROUGH SUSTAINED ECONOMIC GROWTH AND PROSPERITY
T H E I N T E R N AT I O N A L E C O N O M Y 1
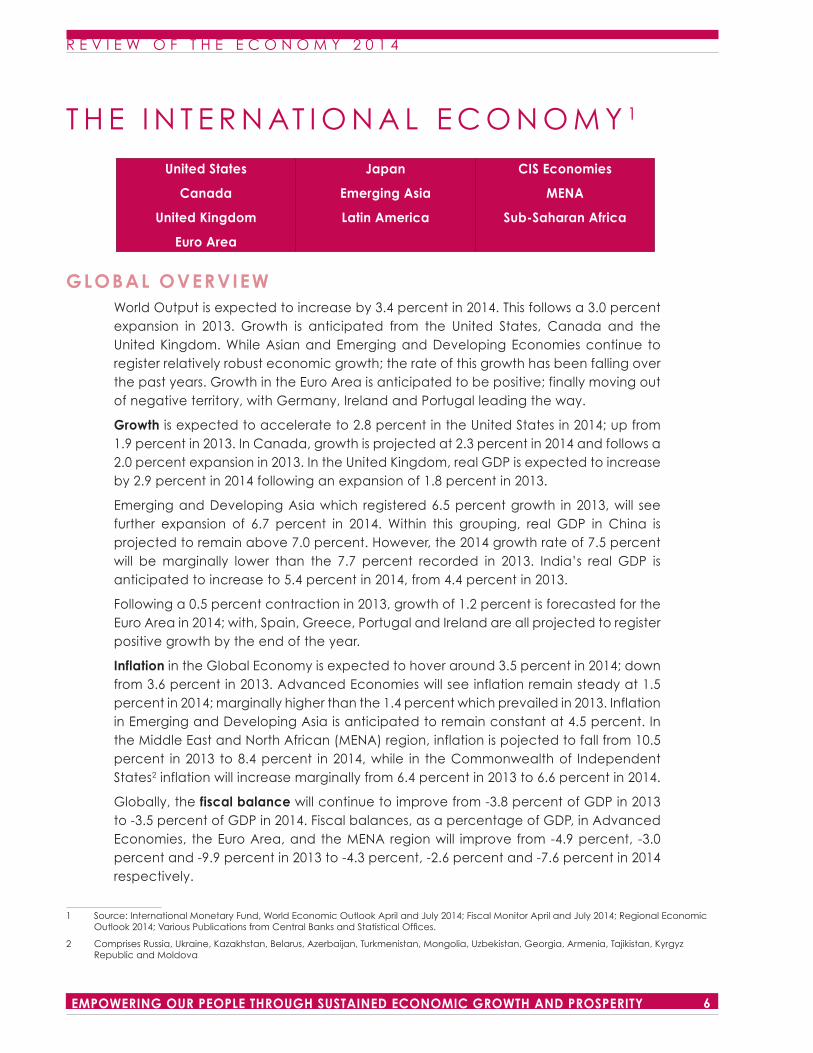
GLOBAL OVERVIEWWorld Output is expected to increase by 3.4 percent in 2014. This follows a 3.0 percent expansion in 2013. Growth is anticipated from the United States, Canada and the United Kingdom. While Asian and Emerging and Developing Economies continue to register relatively robust economic growth; the rate of this growth has been falling over the past years. Growth in the Euro Area is anticipated to be positive; finally moving out of negative territory, with Germany, Ireland and Portugal leading the way.
Growth is expected to accelerate to 2.8 percent in the United States in 2014; up from 1.9 percent in 2013. In Canada, growth is projected at 2.3 percent in 2014 and follows a 2.0 percent expansion in 2013. In the United Kingdom, real GDP is expected to increase by 2.9 percent in 2014 following an expansion of 1.8 percent in 2013.
Emerging and Developing Asia which registered 6.5 percent growth in 2013, will see further expansion of 6.7 percent in 2014. Within this grouping, real GDP in China is projected to remain above 7.0 percent. However, the 2014 growth rate of 7.5 percent will be marginally lower than the 7.7 percent recorded in 2013. India’s real GDP is anticipated to increase to 5.4 percent in 2014, from 4.4 percent in 2013.
Following a 0.5 percent contraction in 2013, growth of 1.2 percent is forecasted for the Euro Area in 2014; with, Spain, Greece, Portugal and Ireland are all projected to register positive growth by the end of the year.
Inflation in the Global Economy is expected to hover around 3.5 percent in 2014; down from 3.6 percent in 2013. Advanced Economies will see inflation remain steady at 1.5 percent in 2014; marginally higher than the 1.4 percent which prevailed in 2013. Inflation in Emerging and Developing Asia is anticipated to remain constant at 4.5 percent. In the Middle East and North African (MENA) region, inflation is pojected to fall from 10.5 percent in 2013 to 8.4 percent in 2014, while in the Commonwealth of Independent States2 inflation will increase marginally from 6.4 percent in 2013 to 6.6 percent in 2014.
Globally, the fiscal balance will continue to improve from -3.8 percent of GDP in 2013 to -3.5 percent of GDP in 2014. Fiscal balances, as a percentage of GDP, in Advanced Economies, the Euro Area, and the MENA region will improve from -4.9 percent, -3.0 percent and -9.9 percent in 2013 to -4.3 percent, -2.6 percent and -7.6 percent in 2014 respectively.
1 Source: International Monetary Fund, World Economic Outlook April and July 2014; Fiscal Monitor April and July 2014; Regional Economic Outlook 2014; Various Publications from Central Banks and Statistical Offices.
2 Comprises Russia, Ukraine, Kazakhstan, Belarus, Azerbaijan, Turkmenistan, Mongolia, Uzbekistan, Georgia, Armenia, Tajikistan, Kyrgyz Republic and Moldova
United States
Canada
United Kingdom
Euro Area
Japan
Emerging Asia
Latin America
CIS Economies
MENA
Sub-Saharan Africa
R E V I E W O F T H E E C O N O M Y 2 0 1 4
7 EMPOWERING OUR PEOPLE THROUGH SUSTAINED ECONOMIC GROWTH AND PROSPERITY
United States
Canada
United Kingdom
Euro Area
Japan
Emerging Asia
Latin America
CIS Economies
MENA
Sub-Saharan Africa
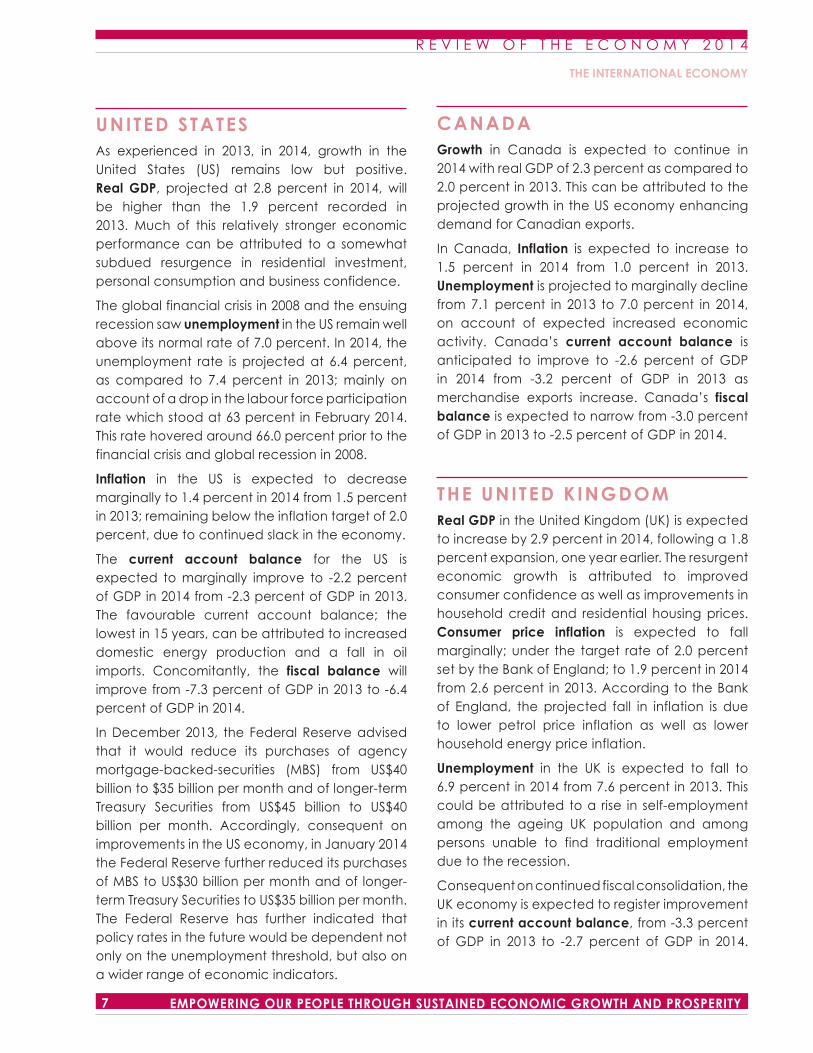
UNITED STATESAs experienced in 2013, in 2014, growth in the United States (US) remains low but positive. Real GDP, projected at 2.8 percent in 2014, will be higher than the 1.9 percent recorded in 2013. Much of this relatively stronger economic performance can be attributed to a somewhat subdued resurgence in residential investment, personal consumption and business confidence.
The global financial crisis in 2008 and the ensuing recession saw unemployment in the US remain well above its normal rate of 7.0 percent. In 2014, the unemployment rate is projected at 6.4 percent, as compared to 7.4 percent in 2013; mainly on account of a drop in the labour force participation rate which stood at 63 percent in February 2014. This rate hovered around 66.0 percent prior to the financial crisis and global recession in 2008.
Inflation in the US is expected to decrease marginally to 1.4 percent in 2014 from 1.5 percent in 2013; remaining below the inflation target of 2.0 percent, due to continued slack in the economy.
The current account balance for the US is expected to marginally improve to -2.2 percent of GDP in 2014 from -2.3 percent of GDP in 2013. The favourable current account balance; the lowest in 15 years, can be attributed to increased domestic energy production and a fall in oil imports. Concomitantly, the fiscal balance will improve from -7.3 percent of GDP in 2013 to -6.4 percent of GDP in 2014.
In December 2013, the Federal Reserve advised that it would reduce its purchases of agency mortgage-backed-securities (MBS) from US$40 billion to $35 billion per month and of longer-term Treasury Securities from US$45 billion to US$40 billion per month. Accordingly, consequent on improvements in the US economy, in January 2014 the Federal Reserve further reduced its purchases of MBS to US$30 billion per month and of longer-term Treasury Securities to US$35 billion per month. The Federal Reserve has further indicated that policy rates in the future would be dependent not only on the unemployment threshold, but also on a wider range of economic indicators.
CANADAGrowth in Canada is expected to continue in 2014 with real GDP of 2.3 percent as compared to 2.0 percent in 2013. This can be attributed to the projected growth in the US economy enhancing demand for Canadian exports.
In Canada, Inflation is expected to increase to 1.5 percent in 2014 from 1.0 percent in 2013. Unemployment is projected to marginally decline from 7.1 percent in 2013 to 7.0 percent in 2014, on account of expected increased economic activity. Canada’s current account balance is anticipated to improve to -2.6 percent of GDP in 2014 from -3.2 percent of GDP in 2013 as merchandise exports increase. Canada’s fiscal balance is expected to narrow from -3.0 percent of GDP in 2013 to -2.5 percent of GDP in 2014.
THE UNITED KINGDOMReal GDP in the United Kingdom (UK) is expected to increase by 2.9 percent in 2014, following a 1.8 percent expansion, one year earlier. The resurgent economic growth is attributed to improved consumer confidence as well as improvements in household credit and residential housing prices. Consumer price inflation is expected to fall marginally; under the target rate of 2.0 percent set by the Bank of England; to 1.9 percent in 2014 from 2.6 percent in 2013. According to the Bank of England, the projected fall in inflation is due to lower petrol price inflation as well as lower household energy price inflation.
Unemployment in the UK is expected to fall to 6.9 percent in 2014 from 7.6 percent in 2013. This could be attributed to a rise in self-employment among the ageing UK population and among persons unable to find traditional employment due to the recession.
Consequent on continued fiscal consolidation, the UK economy is expected to register improvement in its current account balance, from -3.3 percent of GDP in 2013 to -2.7 percent of GDP in 2014.
THE INTERNATIONAL ECONOMY
R E V I E W O F T H E E C O N O M Y 2 0 1 4
8EMPOWERING OUR PEOPLE THROUGH SUSTAINED ECONOMIC GROWTH AND PROSPERITY
In addition, the fiscal balance is expected to marginally improve from -5.8 percent of GDP in 2013 to -5.3 percent of GDP in 2014.
THE EURO AREA 3
Following a 0.5 percent contraction in 2013, growth in real GDP is projected at 1.2 percent in the Euro Area for 2014. Germany, Portugal and Ireland are all expected to contribute to the resurgence, with real GDP growth projected at 1.7 percent, 1.2 percent and 1.7 percent respectively. Growth in Germany is attributable to high consumer confidence, improved financial situation of households and favourable funding conditions. Consequent to reforms in the labour market and more gradual fiscal consolidation; Spain is also expected to post positive real GDP of 0.9 percent, up from -1.2 percent in 2013. Although growth in the Greek economy may appear small, with real GDP of 0.6 percent in 2014, this performance nevertheless represents a significant turn-around when compared to the -3.9 percent contraction posted in 2013. The Greek turnaround is attributable to increased exports and investment.
Due to weak demand, inflation in the Euro Area is expected to fall to 0.9 percent in 2014; down from 1.3 percent in 2013. Inflation in Germany is projected to fall marginally from 1.6 percent in 2013 to 1.4 percent in 2014 due to decreasing prices for goods and services and the impact of a mild winter on energy prices. Spain will also experience lower inflation of 0.3 percent in 2014 as compared to 1.5 percent in 2013, while inflation in Portugal and Ireland is expected to increase marginally to 0.7 percent and 0.6 percent respectively, from 0.4 percent and 0.5 percent respectively. Greece will continue to experience deflation of -0.4 percent in 2014 as compared to -0.9 percent in 2013. Once again this is attributed to weak domestic demand, falling unit labour costs and implementation of market reforms.
3 Austria, Belgium, Cyprus, Estonia, Finland, France, Germany, Greece, Ireland, Italy, Luxemburg, Malta, Netherlands, Portugal, Slovak Republic, Slovenia, Spain
Due to improvements in the economies of member countries, unemployment in the Euro Area is expected to fall to 11.9 percent in 2014 from 12.1 percent in 2013. Unemployment in Spain, Greece and Portugal is anticipated to fall from 26.4 percent, 27.3 percent and 16.3 percent in 2013 respectively, to 25.5 percent, 26.3 percent and 15.7 percent in 2014. Unemployment in Germany will continue to hover around 5.2 percent.
The fiscal balance in the Euro Area is anticipated to improve from -3.0 percent of GDP in 2013 to -2.6 percent of GDP in 2014. The German economy will run a zero percent fiscal balance, while most other economies will see improvements in their fiscal balances. However, the fiscal balance in Greece is expected to deteriorate marginally from -2.6 percent of GDP in 2013 to -2.7 percent of GDP in 2014.
JAPANReal GDP in Japan is anticipated to decline marginally from 1.5 percent in 2013 to 1.4 percent in 2014, as the economy experiences a slow recovery in exports and rising import demands. Even with the constrained growth, inflation is projected to increase from 0.4 percent in 2013 to 2.8 percent, due to robust private consumption and public spending. Unemployment in Japan is expected to fall slightly from 4.0 percent in 2013 to 3.9 percent in 2014.
Japan’s current account surplus is projected to expand to 1.2 percent of GDP from 0.7 percent of GDP in 2013, as the recovery in exports continues and levels off. The fiscal deficit is expected to lessen to -7.2 percent of GDP from -8.4 percent of GDP in 2013. Structural reforms are required to boost growth, especially since constrained growth could have significant negative spillovers for economies with strong trade and foreign direct investment linkages with Japan.
THE INTERNATIONAL ECONOMY
R E V I E W O F T H E E C O N O M Y 2 0 1 4
9 EMPOWERING OUR PEOPLE THROUGH SUSTAINED ECONOMIC GROWTH AND PROSPERITY
EMERGING AND DEVELOPING ASIA 4
Real GDP in Emerging and Developing Asia will increase by 6.7 percent in 2014 over the 6.5 percent growth in 2013. Inflation in the region is anticipated to remain at the 2013 level of 4.5 percent while the current account balance will continue to be positive at 1.2 percent of GDP and the fiscal balance projected to deteriorate marginally to -2.8 percent of GDP in 2014.
While economic growth in China will continue to be strong, with projected real GDP of 7.5 percent in 2014; this performance is still lower than the 7.7 percent posted in 2013; as well as the almost 10 percent growth rate previously recorded. The announcement of the Government’s reform agenda has improved sentiment, but progress on rebalancing the economy remains tentative. However, the implementation of the envisaged reforms, mainly the removal of factor subsidies and administered credit should positively impact private labour income and foster further rebalancing. Inflation in China is anticipated to increase to 3.0 percent as compared to 2.6 percent in 2013.
Unemployment in China is expected to remain at the 2013 level of 4.1 percent. China’s current account balance is anticipated to marginally increase to 2.2 percent of GDP from 2.1 percent of GDP in 2013. China’s fiscal balance, however, is anticipated to deteriorate marginally to -2.0 percent of GDP from -1.9 percent of GDP in 2013.
In India, real GDP is expected to expand by 1.0 percent from a low of 4.4 percent in 2013, to 5.4 percent in 2014; well below the growth levels registered prior to the financial crisis in 2008. According to the Reserve Bank of India, the downward spiral in growth was caused in large part, by structural factors that impeded investment. Stagnation of industrial growth in the Indian economy has resulted in contraction in
4 Comprises China, Hong Kong SAR, India, Indonesia, Korea, Malaysia, the Philippines, Singapore, Taiwan Province of China, Thailand and Vietnam.
the production of capital goods and consumer durables.
Inflation in India is expected to fall from 9.5 percent in 2013 to 8.0 percent in 2014, due to declining vegetable, cereal, sugar and edible oil prices. India’s current account balance is expected to increase marginally to -2.4 percent of GDP in 2014 from -2.0 percent of GDP in 2013. India’s fiscal balance is forecasted to marginally improve to -7.2 percent of GDP in 2014 as compared to -7.3 percent of GDP in 2013.
The June 2013 announcement of reduced asset purchases by the US Federal Reserve triggered capital outflows from emerging economy bond markets including the Indian bond market. This prompted a weakening of the Indian currency as the Rupee fell to 66.95 Indian Rupee per US Dollar in August 2013; motivating equity sell-offs. Subsequent policy reforms by the Reserve Bank of India, lessened the impact of reductions in asset purchases by the US Federal Reserve.
Real GDP in Singapore is expected to contract from 4.1 percent in 2013 to 3.6 percent real GDP in 2014. This decline is attributable to lower investment and private consumption. In contrast, real GDP is anticipated to expand by 3.7 percent for both Hong Kong and South Korea. This compares to the 2.9 percent and 2.8 percent posted by both countries in 2013. Singapore and Hong Kong also expect to see inflation fall marginally from 2.4 percent and 4.3 percent respectively in 2013 to 2.3 percent and 4.0 percent respectively in 2014. Contrariwise, South Korea forecasts an increase in inflation from 1.3 percent in 2013 to 1.8 percent in 2014.
THE INTERNATIONAL ECONOMY
R E V I E W O F T H E E C O N O M Y 2 0 1 4
10EMPOWERING OUR PEOPLE THROUGH SUSTAINED ECONOMIC GROWTH AND PROSPERITY
LAT IN AMERICA AND THE CARIBBEAN 5
Real GDP in Latin America and the Caribbean is projected at 2.5 percent in 2014 as compared to 2.7 percent posted in 2013. The economic contraction is attributable to low business confidence, weak investment and constrained demand for the region’s exports. Likewise, growth in the larger countries of the region; with the exception of Mexico; is projected to decline in 2014. Argentina and Venezuela are expected to register growth of 0.5 percent and -0.5 percent, compared to 4.3 percent and 1.0 percent in 2013, respectively; and due primarily to elevated levels of uncertainty. Growth in Brazil and Panama is forecasted at 1.8 percent and 7.2 percent, compared to 2.3 percent and 8.0 percent in 2013, respectively. The weak growth in the Brazilian economy is due to domestic supply constraints in infrastructure and fragile private business confidence. However, growth in Mexico is anticipated to surge from 1.1 percent in 2013 to 3.0 percent in 2014; as a result of an accommodative fiscal policy stance and increased domestic demand.
Inflation in Brazil and Panama, is expected to decline from 6.2 percent and 4.0 percent respectively in 2013 to 5.9 percent and 3.8 percent respectively in 2014. However, as economic activity expands, Mexico’s inflation rate is projected to increase to 4.0 percent in 2014 from 3.8 percent in 2013. The one-time effects of tax measures introduced in Mexico, and the recent depreciation of the Brazilian currency are expected to contain inflation close to the upper end of the inflation target range of 4.0 percent for Mexico and 6.5 percent for Brazil. Inflation in Venezuela is forecasted to remain the highest in the region increasing from 40.7 percent in 2013 to 50.7 percent in 2014, and attributable to persistently loose macroeconomic policies.
5 Comprises Brazil, Argentina, Colombia, Venezuela, Peru, Chile, Ecuador, Bolivia, Uruguay, Paraguay, Antigua and Barbuda, The Bahamas, Barbados, Dominica, Dominican Republic, Haiti, Jamaica, St. Kitts and Nevis, St. Lucia, St. Vincent and the Grenadines, Trinidad and Tobago, Mexico, Panama, Costa Rica, El Salvador, Guatemala, Honduras, and Nicaragua
Consequent to the slowing of economic growth, Unemployment in Argentina and Brazil is projected to increase from 7.1 percent and 5.4 percent in 2013 to 7.6 percent and 5.6 percent in 2014, respectively. Unemployment in Panama is projected to remain at 4.5 percent. However, as a result of the expected resurgence of the Mexican economy, unemployment is anticipated to decline from 4.9 percent in 2013 to 4.5 percent in 2014.
The current account balance for Latin America and the Caribbean is expected to remain at -2.7 percent of GDP in 2014. Additionally, it is anticipated that the region’s fiscal deficit would widen from -2.9 percent of GDP in 2013 to -3.2 percent of GDP in 2014. It is also expected that Argentina and Mexico would run larger fiscal deficits in 2014, moving from -3.5 percent and -3.8 percent of GDP in 2013 to -5.3 percent and -4.1 percent of GDP in 2014, respectively. Structural reforms to improve productivity and competitiveness in the region remain a priority, along with more effective investment in infrastructure and human capital. Further, there is need for additional measures focusing on the reduction of vulnerabilities to external shocks.
COMMONWEALTH OF INDEPENDENT STATES (CIS) 6
Real GDP in the Commonwealth of Independent States (CIS) is expected to decline from 2.2 percent in 2013 to 0.9 percent in 2014; attributed to weak investment, political tensions and policy uncertainty in some cases. Growth in Russia, is estimated to decline from the 2013 level of 1.3 percent to 0.2 percent due to fallout from geopolitical tensions relating to Ukraine.
Consumer inflation, in the regional grouping is forecasted to increase from 6.4 percent in 2013 to 6.6 percent in 2014. Specifically, in Russia,
6 Comprises Russia, Ukraine, Kazakhstan, Belarus, Azerbaijan, Turkmenistan, Mongolia, Uzbekistan, Georgia, Armenia, Tajikistan, Kyrgyz Republic and Moldova
THE INTERNATIONAL ECONOMY
R E V I E W O F T H E E C O N O M Y 2 0 1 4
11 EMPOWERING OUR PEOPLE THROUGH SUSTAINED ECONOMIC GROWTH AND PROSPERITY
inflation is anticipated to decline by 1.0 percent to 5.8 percent in 2014. In addition, Russia’s unemployment rate is anticipated to move from 5.5 percent in 2013 to 6.2 percent in 2014 as a result of weaker economic activity.
The current account surplus for the CIS is expected to expand from 0.7 percent of GDP in 2013 to 1.9 percent of GDP in 2014. Russia’s current account surplus is also expected to expand to 2.1 percent of GDP from 1.6 percent of GDP in 2013, while its fiscal deficit is anticipated to decline from -1.3 percent of GDP in 2013, to -0.7 percent of GDP in 2014.
MIDDLE EAST AND NORTH AFRICA (MENA) 7
Real GDP in the MENA region is expected to increase from 2.2 percent in 2013, to 3.2 percent in 2014, as growth in exports improves and public and private investment accelerates. Growth in the Islamic Republic of Iran is anticipated to improve significantly from -1.7 percent in 2013 to 1.5 percent in 2014. Economic growth in Saudi Arabia and Egypt is also expected to strengthen from 3.8 percent and 2.1 percent in 2013 to 4.1 percent and 2.3 percent in 2014, respectively. However, slowdowns are expected in Qatar and Sudan (from 6.1 percent and 3.4 percent in 2013, to 5.9 percent and 2.7 percent in 2014, respectively). Growth in Lebanon has remained stagnant at 1.0 percent in 2013 and 2014 due to the conflict in neighbouring Syria.
Inflation in the region is expected to decline from 10.5 percent in 2013 to 8.4 percent in 2014. Specifically, inflation in Saudi Arabia and Qatar estimated to be less than 5.0 percent in 2014 period, due to softening food prices. The inflation rate for the Islamic Republic of Iran is expected to decline from 35.2 percent in 2013 to a still significantly elevated 23.0 percent in 2014.
7 Comprises Algeria, Bahrain, Djibouti, Egypt, Islamic Republic of Iran, Iraq, Jordan, Kuwait, Lebanon, Libya, Mauritania, Morocco, Oman, Qatar, Saudi Arabia, Sudan, Syrian Arab Republic, Tunisia, United Arab Emirates and Republic of Yemen
The relative reduction in inflation is consequent to the easing of geopolitical tensions with the United States and the rest of the world. Inflation in Sudan and Lebanon is anticipated to decline from 36.5 percent and 3.2 percent in 2013 to 20.4 percent and 2.0 percent in 2014. Inflation in Sudan continues to be impacted by several factors including a 29.0 percent devaluation of the currency; removal of fuel subsidies in 2013, as well as continued fiscal consolidation in 2014. However, as economic activity accelerates in Egypt, higher inflation of 10.7 percent is anticipated in 2014. This compares to 6.9 percent in 2013.
The current account surplus for the region is expected to decline from 10.3 percent of GDP in 2013 to 8.7 percent of GDP in 2014, on account of falling oil revenues. The fiscal deficit in 2014 is projected to approximate -7.6 percent of GDP, as compared to -9.9 percent of GDP in 2013. The region is presently characterized by weak confidence, high unemployment, low competitiveness and large public sector deficits. Reforms to increase and diversify potential output and improve competitiveness remain a priority for expanded output and economic growth.
SUB-SAHARAN AFRICA 8
Sub-Saharan Africa is expected to post economic growth of 5.4 percent in 2014, as compared to 4.9 percent in 2013. This relatively robust growth is attributed to improved agricultural production and investment in natural resources and infrastructure. Real GDP in South Africa, which measured 1.9 percent in 2013, is expected to register a further 2.3 percent in 2014. This performance is largely due to improvements in
8 Comprises Angola, Benin, Botswana, Burkina Faso, Burundi, Cameroon, Cape Verde, Central African Republic, Chad, Comoros, Democratic Republic of Congo, Republic of Congo, Cote d’Ivoire, Equatorial Guinea, Eritrea, Ethiopia, Gabon, The Gambia, Ghana, Guinea, Guinea-Bissau, Kenya, Lesotho, Liberia, Madagascar, Malawi, Mali, Mauritius, Mozambique, Namibia, Nigeria, Rwanda, Sao Tome and Principe, Senegal, Seychelles, Sierra Leone, South Africa, south Sudan, Swaziland, Tanzania, Togo, Uganda, Zambia and Zimbabwe.
THE INTERNATIONAL ECONOMY
R E V I E W O F T H E E C O N O M Y 2 0 1 4
12EMPOWERING OUR PEOPLE THROUGH SUSTAINED ECONOMIC GROWTH AND PROSPERITY
external demand. In Nigeria, growth remains strong on account of high oil prices, the expansion of production in non-oil sectors and repairs to major oil pipelines; with an expected increase from 6.3 percent in 2013 to 7.1 percent in 2014.
The rate of growth of consumer prices in this region is expected to decline slightly from 6.3 percent in 2013 to 6.1 percent in 2014, resulting from moderate food prices and tight monetary policy. Nigeria’s inflation rate is also projected to decline from 8.5 percent in 2013 to 7.3 percent in 2014. However, due to the weakening of the South African currency and consequent to external balances, inflation in South Africa is expected to increase from 5.8 percent in 2013 to 6.0 percent in 2014.
The current account deficit for the region is anticipated to remain unchanged at the 2013 level of -3.6 percent of GDP. However, the current account deficit for South Africa is expected to contract from -5.8 percent of GDP in 2013 to -5.4 percent of GDP in 2014, as exports improve. The current account surplus in Nigeria is expected to expand marginally from 4.7 percent of GDP in 2013, to 4.9 percent of GDP in 2014. Due to
continued strong growth, Nigeria’s fiscal deficit is expected to improve to -1.8 percent of GDP from -4.9 percent of GDP in 2013, while South Africa’s fiscal deficit is expected to move marginally from -4.3 percent of GDP in 2013 to -4.4 percent of GDP in 2014.
During the period of the financial crisis, (2008 to 2012), real GDP growth in Ghana averaged 8.5 percent. Real GDP growth in 2013 slowed to 5.4 percent and is expected to further decline to 4.8 percent in 2014 on account of volatility in gold prices which impacted the mining and quarrying sector of the economy. Inflation in Ghana is forecasted to be higher in 2014; up to 13.0 percent from 11.7 percent in 2013 and just above the revised 2014 inflation target of 12.0 percent. The current account balance is anticipated to improve to -10.6 percent of GDP in 2014, as compared to -13.2 percent of GDP the previous year and attributable to fiscal consolidation initiatives of the Government.
THE INTERNATIONAL ECONOMY
R E V I E W O F T H E E C O N O M Y 2 0 1 4
13 EMPOWERING OUR PEOPLE THROUGH SUSTAINED ECONOMIC GROWTH AND PROSPERITY
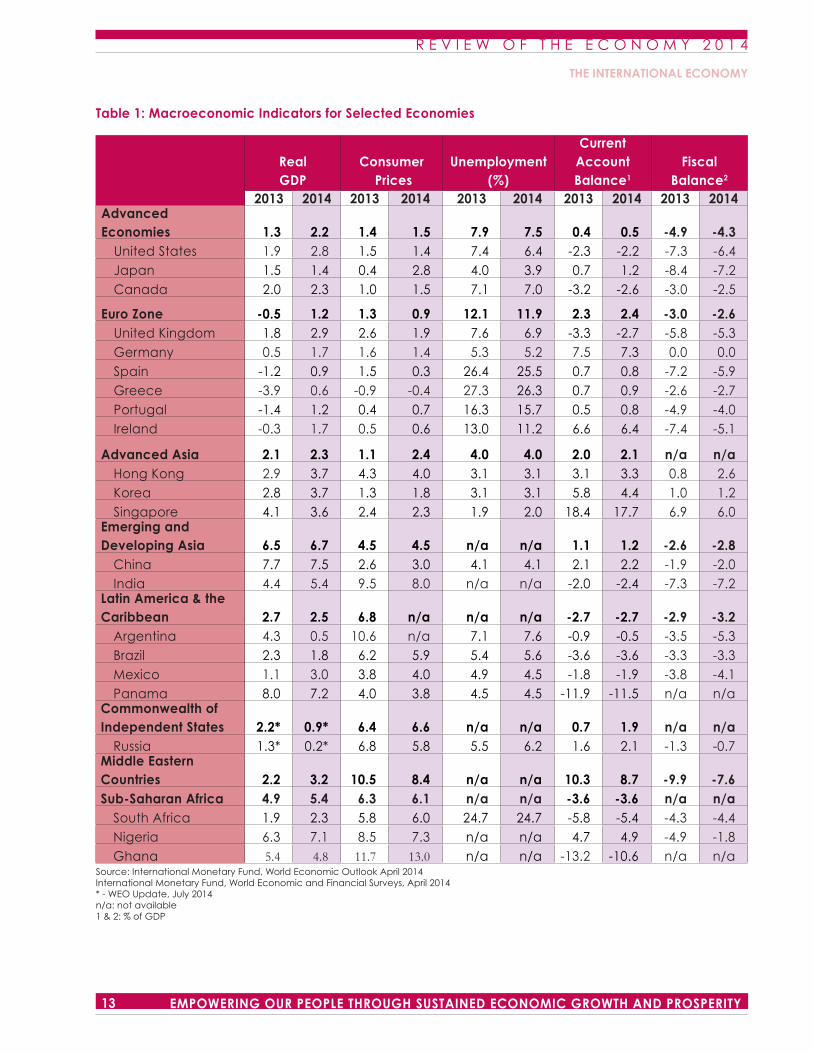
Table 1: Macroeconomic Indicators for Selected Economies
RealGDP
Consumer Prices
Unemployment(%)
Current AccountBalance1
FiscalBalance2
2013 2014 2013 2014 2013 2014 2013 2014 2013 2014Advanced Economies 1.3 2.2 1.4 1.5 7.9 7.5 0.4 0.5 -4.9 -4.3
United States 1.9 2.8 1.5 1.4 7.4 6.4 -2.3 -2.2 -7.3 -6.4Japan 1.5 1.4 0.4 2.8 4.0 3.9 0.7 1.2 -8.4 -7.2Canada 2.0 2.3 1.0 1.5 7.1 7.0 -3.2 -2.6 -3.0 -2.5
Euro Zone -0.5 1.2 1.3 0.9 12.1 11.9 2.3 2.4 -3.0 -2.6United Kingdom 1.8 2.9 2.6 1.9 7.6 6.9 -3.3 -2.7 -5.8 -5.3Germany 0.5 1.7 1.6 1.4 5.3 5.2 7.5 7.3 0.0 0.0Spain -1.2 0.9 1.5 0.3 26.4 25.5 0.7 0.8 -7.2 -5.9Greece -3.9 0.6 -0.9 -0.4 27.3 26.3 0.7 0.9 -2.6 -2.7Portugal -1.4 1.2 0.4 0.7 16.3 15.7 0.5 0.8 -4.9 -4.0Ireland -0.3 1.7 0.5 0.6 13.0 11.2 6.6 6.4 -7.4 -5.1
Advanced Asia 2.1 2.3 1.1 2.4 4.0 4.0 2.0 2.1 n/a n/aHong Kong 2.9 3.7 4.3 4.0 3.1 3.1 3.1 3.3 0.8 2.6Korea 2.8 3.7 1.3 1.8 3.1 3.1 5.8 4.4 1.0 1.2Singapore 4.1 3.6 2.4 2.3 1.9 2.0 18.4 17.7 6.9 6.0
Emerging and Developing Asia 6.5 6.7 4.5 4.5 n/a n/a 1.1 1.2 -2.6 -2.8
China 7.7 7.5 2.6 3.0 4.1 4.1 2.1 2.2 -1.9 -2.0India 4.4 5.4 9.5 8.0 n/a n/a -2.0 -2.4 -7.3 -7.2
Latin America & the Caribbean 2.7 2.5 6.8 n/a n/a n/a -2.7 -2.7 -2.9 -3.2
Argentina 4.3 0.5 10.6 n/a 7.1 7.6 -0.9 -0.5 -3.5 -5.3Brazil 2.3 1.8 6.2 5.9 5.4 5.6 -3.6 -3.6 -3.3 -3.3Mexico 1.1 3.0 3.8 4.0 4.9 4.5 -1.8 -1.9 -3.8 -4.1Panama 8.0 7.2 4.0 3.8 4.5 4.5 -11.9 -11.5 n/a n/a
Commonwealth of Independent States 2.2* 0.9* 6.4 6.6 n/a n/a 0.7 1.9 n/a n/a
Russia 1.3* 0.2* 6.8 5.8 5.5 6.2 1.6 2.1 -1.3 -0.7Middle Eastern Countries 2.2 3.2 10.5 8.4 n/a n/a 10.3 8.7 -9.9 -7.6Sub-Saharan Africa 4.9 5.4 6.3 6.1 n/a n/a -3.6 -3.6 n/a n/a
South Africa 1.9 2.3 5.8 6.0 24.7 24.7 -5.8 -5.4 -4.3 -4.4Nigeria 6.3 7.1 8.5 7.3 n/a n/a 4.7 4.9 -4.9 -1.8Ghana 5.4 4.8 11.7 13.0 n/a n/a -13.2 -10.6 n/a n/a
Source: International Monetary Fund, World Economic Outlook April 2014 International Monetary Fund, World Economic and Financial Surveys, April 2014* - WEO Update, July 2014 n/a: not available1 & 2: % of GDP
THE INTERNATIONAL ECONOMY
R E V I E W O F T H E E C O N O M Y 2 0 1 4
14EMPOWERING OUR PEOPLE THROUGH SUSTAINED ECONOMIC GROWTH AND PROSPERITY
E C O N O M I C P E R F O R M A N C E O F C A R I C O M S TAT E S 9 1
9 Source:-IMF Regional Economic Report -April 2014/Western Hemisphere IMF country report -ECLAC - Economic Survey of Latin America and the Caribbean - 2014 Briefing paper
Introduction
Barbados
Jamaica
Guyana
ECCU Countries
INTRODUCTIONBeset by high debt levels, weak competitiveness and financial fragilities, economic activity and growth remained tepid in most Caribbean territories101in 2013. However, the region’s commodity exporters – in particular, Guyana and Suriname - have seen stronger growth of 4.8 and 4.7 percent respectively; well above that of tourism-dependent nations where growth measured 0.75 percent; up from close to zero in 2012. In Haiti, the economy expanded by 4.3 percent as activities continued apace in reconstruction, textile and agriculture.
This trend is expected to improve in 2014 with GDP growth picking up to 2.0 percent from 1.2 percent in 2013 as economies that are more service export-oriented gain from the resumption of economic growth in the United States, as well as the economic recovery in the United Kingdom and the eurozone economies. The major economies, including Jamaica, Barbados and Guyana are expected to register economic growth of 1.2 percent, 0.5 percent, and 4.5 percent respectively.
10 Aruba, The Bahamas, Barbados, Belize, ECCU, Guyana, Haiti, Jamaica, Suriname, Trinidad and Tobago, Curacao and Sint Maarten.
Lingering policy challenges in 2014 have left some Caribbean economies highly vulnerable as fiscal and external balances remain highly correlated. Notwithstanding these challenges, it is expected that public-spending adjustments in the Caribbean should bolster the fiscal outturn in the medium term.
For the ECCU112 countries, delays in the resolution of troubled financial institutions, have dampened the outlook for the region. High and rising Non-Performing Loans (NPLs), along with a regulatory interest rate floor on savings deposits, resulted in low bank profitability and subdued private sector credit.
Inflation remained generally low, except in Jamaica where it climbed to 9.7 percent, from 8 percent in 2012 mirroring the pass-through of nominal exchange rate depreciation and higher administered prices.
Fiscal balances worsened as public sector gross debt levels remained high, averaging more than 90 percent of GDP in the tourism-dependent economies. Contrariwise, public debt levels
11 Antigua and Barbuda, Dominica, Grenada, St. Kitts and Nevis, St. Lucia and St. Vincent and the Grenadines, as well as Anguilla and Monsterrat which are dependent territories of the United Kingdom.
R E V I E W O F T H E E C O N O M Y 2 0 1 4
15 EMPOWERING OUR PEOPLE THROUGH SUSTAINED ECONOMIC GROWTH AND PROSPERITY
amongst commodity exporters averaged close to 50 percent of GDP.
BARBADOSBarbados’ economic performance deteriorated in 2013 due to pronounced weakness across both traded and non-traded sectors. The average unemployment rate remained at double digit levels of 11.6 percent and 11.9 percent, in 2012 and 2013 respectively.
The decline in international reserves through most of 2013 was arrested in the first quarter of 2014 following external borrowing during December 2013 and March 2014. Consequently, the level of international reserves has settled at US$570 million; the equivalent of 3.3 months of import cover.
The balance of payments registered a large deficit in 2013 owing a widening of the current account deficit to 11.4 percent of GDP, as compared to 10.1 percent of GDP in 2012. Contributory factors include; a waning of tourism receipts and goods exports coupled with reductions in inflows of long-term private capital which plunged to its lowest level since 2004.
In December, 2013, Moody’s Investor Services downgraded Barbados two notches from Ba1 to Ba3 with a negative outlook, alluding to persistent recessionary conditions, prolonged wide fiscal deficits, rising debt and increasing government liquidity risks. This downgrade was elicited by an announcement of a wider-than-expected fiscal deficit exceeding 11 percent of GDP in confluence with heightened fiscal inflexibility and liquidity risk. The authorities have programmed a reduction of the overall fiscal deficit from 8 percent of GDP in 2012/2013 to less than 3 percent of GDP in 2013/2014 and less than 2 percent of GDP by 2020/2021.
The central government deficit in the fiscal year 2013/14 is estimated at 12 percent of GDP, owing mostly to unbudgeted transfers to public enterprises. Central government gross
debt, excluding securities held by the National Insurance scheme, rose to 96 percent of GDP at March 2014.
By the end of 2013, unemployment rose to 13.2 percent as the December announcement brought a reduction in the civil service in 2014/2015 by approximately 3,500, or 15 percent of the total, with further downsizing by attrition of about 500 per year until 2018/2019.
As part of the measures to address the fiscal challenges, the Government introduced the Barbados Revenue Authority on April 1, 2014, and engaged the Caribbean Technical Assistance Centre (CARTAC) for assistance in improving the monitoring of the performance of state-owned entities. Further technical assistance is expected from the IMF, CARTAC and the IDB, in a bid to strengthen revenue administration and expenditure containment, in line with the country’s medium term goals.
JAMAICAThe Jamaican economy is displaying signs of recovery in 2013 with growth recorded at 0.5 percent as compared to -0.5 percent in 2012. The fragile recovery is evidenced by a sizeable contraction of the current account deficit, falling inflation and economic growth of 1.6 percent in the first quarter of 2014. The public sector’s fiscal position was balanced in fiscal 2013/14; departing from a deficit exceeding 4 percent of GDP in the previous year. This positive outcome emanated from a comprehensive economic reform programme under the IMF’s Extended Fund Facility (EFF), approved on May 1, 2013. Mining, agriculture and tourism contributed to this nascent recovery, although depressed economic conditions remain significant coupled with the economic and social costs associated with the adjustment effort.
Enhanced fiscal rules spurred a reduction in public sector debt from 147 percent of GDP in March 2013 to 140 percent one year later. A reduction
ECONOMIC PERFORMANCE OF CARICOM STATES
R E V I E W O F T H E E C O N O M Y 2 0 1 4
16EMPOWERING OUR PEOPLE THROUGH SUSTAINED ECONOMIC GROWTH AND PROSPERITY
in public debt to 60 percent of GDP is envisioned by 2025/26. The implementation of the EFF has complemented the country’s external sector as, in a relatively short space of time, Jamaica’s Balance of Payments posted a primary surplus (7.5 percent) and a near balance for the overall public sector; exceptional by international standards. Provisional data indicated that while Jamaica’s current account deficit remains substantial, it has improved considerably. The current account deficit narrowed to 9.5 percent of GDP on 2013/2014; a decrease of 2 percentage points relative to the previous year. This improvement in 2013 was reflected in all sub-accounts, particularly the trade balance, consequential to a sharp decline in imports.
Unemployment declined from 16.0 percent to 13.5 percent between April 2013 and January 2014, while inflation fell to 7.6 percent (year-on-year) at the end of April 2014, as the depreciation of the exchange rate abated somewhat during the period. Notwithstanding this promising economic performance, Jamaica’s financial system remains heavily exposed to government’s debt holdings; a high possibility of a disruption of external financing flows, lower partner-country growth; oil price shocks; and natural disasters.
GUYANAThe Guyanese economy maintained its upward trajectory, experiencing its seventh year of uninterrupted growth. Attributable to this macroeconomic resurgence are the implementation of a Value Added Tax (VAT); favourable commodity prices; significant inflows of foreign direct investment (FDI); and debt relief under the Heavily Indebted Poor Countries Initiative (HIPC).
Real GDP expanded by 5.2 percent in 2013 with non-sugar GDP increasing by 6.3 percent, mirroring the underlying strength of other sectors
of the economy. FDI decreased by 27.1 percent to US$214.0 million. In 2013, private sector credit accelerated by 34.6 percent cumulatively while external debt declined by 8.3 percent in 2012 to 41.8 percent of GDP.
The rice industry enjoyed another favourable year, with a production of 535,439 tonnes in 2013; a 26.9 percent increase in production over the previous year’s output and the highest annual production in the history of the industry. Augmenting this record output were ongoing investments in drainage and irrigation, increased acreage and improved yields.
Conversely, the fishing industry declined 6.5 percent due to some overfishing which prompted a suspension of issuance of further industrial fishing licenses and a consequential reduction in the operational trawler fleet. Likewise, sugar production contracted by 14.4 percent in 2013 to 186,771 tonnes as the industry was afflicted by labour shortages and disruptions, erratic weather and managerial capacity constraints.
Vibrant expansion in private sector construction, buoyed by government’s housing drive as well as by commercial construction and public sector projects, occasioned a 22.6 percent growth in the construction sector, which positively impacted the services industry which recorded 5. 5 percent growth by the end of 2013.
Net domestic credit expanded by 25.2 percent to $123.9 billion in 2013, owing to an increase in credit both to private and public sectors. The Consumer Price Index was recorded as 0.9 percent in 2013; the lowest rate of inflation in decades.
At the end of 2013, Guyana’s total external debt stock stood at US$1.2 billion, a decrease of 8.3 percent from the previous year, attributable largely to the conclusion of two (2) additional compensation agreements under the PetroCaribe arrangement, which erased some US$281.1 million of oil debt.
ECONOMIC PERFORMANCE OF CARICOM STATES
R E V I E W O F T H E E C O N O M Y 2 0 1 4
17 EMPOWERING OUR PEOPLE THROUGH SUSTAINED ECONOMIC GROWTH AND PROSPERITY
ECCURecovery in the ECCU has been ‘listless’, as the region continues to face significant headwinds since the 3-year recession ended in 2012. Flat growth in 2012 improved to 0.5 percent in 2013, reflecting some countries’ strong commitment to addressing large fiscal deficits. Most of the ECCU’s consolidation efforts, supported in part by substantial savings from Venezuela’s PetroCaribe financing, have tempered the region’s recent decline.
In 2013, inflation moderated to 0.1 percent from 2.4 percent in 2012 as domestic demand remained subdued and food and fuel prices softened. Inflation rates varied from 0.2 percent in St. Vincent and the Grenadines to 0.4 percent in St. Kitts and Nevis and -1.4 percent in St. Lucia.
The external current account deficit widened further to 17.6 percent of GDP in 2013 from 17.1 percent of GDP in 2012. Grenada, and St. Vincent and the Grenadines posted deteriorations from 19.2 percent to 27.2 percent, and 27.8 percent to 28.9 percent, respectively. However, St. Kitts and Nevis, Antigua and Barbuda, St. Lucia and Dominica witnessed some improvement in this regard.
Grenada’s economic recovery is expected to be modest with marginal growth of 1.1 percent in 2014 and a narrowing of its current account deficit
during the IMF’s comprehensive adjustment programme.
On June 26, 2014, the IMF approved a three-year SDR 14.04 million arrangement under the Extended Credit Facility (ECF) for Grenada, with a comprehensive strategy consisting of fiscal consolidation, debt restructuring and fiscal structural reforms.
Antigua and Barbuda, though facing headwinds, is expected to grow by 1.6 percent, up from 0.5 percent in 2013. However, risks remain high due to the country’s unsustainable fiscal situation and the large share of non-performing loans in the banking system.
Persistent high debt levels mirrored a constant public sector gross debt of 86.2 percent in 2013.
A three-year Stand-By Arrangement (SBA), approved in July 2011 for St. Kitts and Nevis, diffused some economic momentum, as public debt, which stood at 164 percent of GDP in 2010, diminished to 104 percent of GDP by the end of 2013, reflecting considerable progress in policy efforts, adjustments and critical reforms.
In August, 2014 the IMF approved a disbursement equal to SDR 4.15 million (about US$6.4 million) for St. Vincent and the Grenadines. This initiative is geared towards the country’s urgent balance of payments needs consequent to flooding and landslides in December 2013 that occasioned considerable infrastructural, housing and agricultural damage.
ECONOMIC PERFORMANCE OF CARICOM STATES
R E V I E W O F T H E E C O N O M Y 2 0 1 4
18EMPOWERING OUR PEOPLE THROUGH SUSTAINED ECONOMIC GROWTH AND PROSPERITY
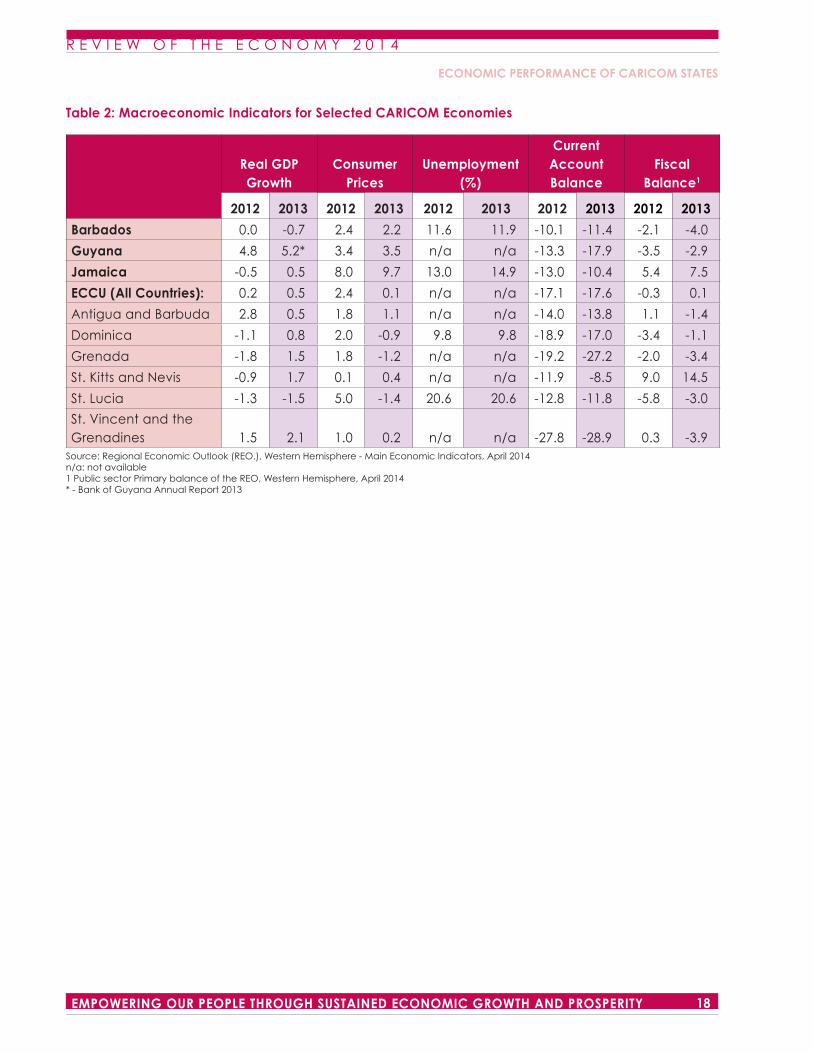
Table 2: Macroeconomic Indicators for Selected CARICOM Economies
Real GDP Growth
Consumer Prices
Unemployment (%)
Current AccountBalance
Fiscal Balance1
2012 2013 2012 2013 2012 2013 2012 2013 2012 2013
Barbados 0.0 -0.7 2.4 2.2 11.6 11.9 -10.1 -11.4 -2.1 -4.0
Guyana 4.8 5.2* 3.4 3.5 n/a n/a -13.3 -17.9 -3.5 -2.9
Jamaica -0.5 0.5 8.0 9.7 13.0 14.9 -13.0 -10.4 5.4 7.5
ECCU (All Countries): 0.2 0.5 2.4 0.1 n/a n/a -17.1 -17.6 -0.3 0.1
Antigua and Barbuda 2.8 0.5 1.8 1.1 n/a n/a -14.0 -13.8 1.1 -1.4
Dominica -1.1 0.8 2.0 -0.9 9.8 9.8 -18.9 -17.0 -3.4 -1.1
Grenada -1.8 1.5 1.8 -1.2 n/a n/a -19.2 -27.2 -2.0 -3.4
St. Kitts and Nevis -0.9 1.7 0.1 0.4 n/a n/a -11.9 -8.5 9.0 14.5
St. Lucia -1.3 -1.5 5.0 -1.4 20.6 20.6 -12.8 -11.8 -5.8 -3.0
St. Vincent and the Grenadines 1.5 2.1 1.0 0.2 n/a n/a -27.8 -28.9 0.3 -3.9
Source: Regional Economic Outlook (REO.), Western Hemisphere - Main Economic Indicators, April 2014 n/a: not available1 Public sector Primary balance of the REO, Western Hemisphere, April 2014* - Bank of Guyana Annual Report 2013
ECONOMIC PERFORMANCE OF CARICOM STATES
R E V I E W O F T H E E C O N O M Y 2 0 1 4
19 EMPOWERING OUR PEOPLE THROUGH SUSTAINED ECONOMIC GROWTH AND PROSPERITY
SUMMARY OF MACROECONOMIC PERFORMANCE OF THE TR INIDAD AND TOBAGO ECONOMYTrinidad and Tobago’s economy continues to gain momentum and is expected to expand in real terms by 1.9 percent in calendar 2014, following growth of 1.7 percent in 2013. This outlook is premised on a projected 1.0 percent in the Petroleum sector complimented by a 2.5 percent expansion in the non-petroleum sector. The services sub-sector, with 51.8 percent, continues to be the largest contributor to non-petroleum GDP.
The energy sector is expected to record its second consecutive year of positive economic growth, with a smaller expansion of 1.0 percent in 2014, down from 1.6 percent in 2013 and reflecting expansions in the exploration and production, petrochemicals, service contractors and distribution sub-industries.
Headline inflation continued its downward trajectory in 2014, remaining at subdued levels year-on-year for the first six months of 2014 settling at 3.0 percent by June following some fluctuations earlier in the year. Core inflation remained relatively stable throughout the period, decreasing marginally to 2.5 percent in June from 2.6 percent in January. Year-on-year, headline inflation has remained at single digit levels for twenty-three consecutive months.
Unemployment edged up to 3.7 percent in the fourth quarter of fiscal 2013, from the previous historical low of 3.5 percent in the third quarter. In most industries, with the exception of Construction; Petroleum and Gas; and Wholesale and Retail Trade, Restaurants and Hotels, unemployment rates were below the national average.
With the subdued inflationary environment prevailing and the continued, albeit weakened, economic growth of the domestic economy, the Central Bank of Trinidad and Tobago maintained
an accommodative monetary policy stance, in an attempt at boosting economic activity. While there has been a small pick-up in core inflation in the early months of 2014, Headline inflation has remained under five percent. During the 9-month period October 2013 to June 2014, the Bank kept its main policy rate, the Repo rate, unchanged at 2.75 percent, while utilizing a number of liquidity management instruments in an attempt to contain the high liquidity levels. In response, commercial banks maintained both their basic prime lending rates and the interest rate on term loans at 7.5 percent in an effort to encourage borrowing. The weighted average deposit rate was also held constant at a subdued 0.2 percent over the period.
As business lending recovered lending to the private sector by the consolidated financial system rose by 5.8 percent on a year-on-year basis to March 2014, up from 3.2 percent in September 2013 and 2.4 percent one year earlier. Commercial Banks’ lending to the private sector expanded by 6.0 percent in March 2014 compared with 4.6 percent in March 2013.
The composition of the growth in private sector credit has become more evenly distributed as business lending recovered in the first quarter of 2014 coming on the heels of 14 consecutive months of year-on-year declines. Business loans granted by the consolidated financial system rose 2.1 percent in March 2014 with the recovery in business lending being driven by strong loan growth to the distribution sector of 23.1 percent and the services sector of 7.9 percent. Consumer credit by the consolidated financial system continue to expand by 5.8 percent on a year-on-year basis to March 2014, manifested by strong growth in housing related loans. Historically low mortgage rates continued to spur demand for real estate mortgage loans in 2014 with the supply of real estate mortgage loans granted by the consolidated financial system remaining in double-digit territory.
The Central Bank expanded its liquidity management framework in December 2013,
ECONOMIC PERFORMANCE OF CARICOM STATES
R E V I E W O F T H E E C O N O M Y 2 0 1 4
20EMPOWERING OUR PEOPLE THROUGH SUSTAINED ECONOMIC GROWTH AND PROSPERITY
increasing the borrowing limits under the Treasury Bills and Notes Acts. The Central Bank intensified its open market operations in April 2014 in an effort to contain liquidity in the domestic economy by removing $1.2 billion from the banking system through the issue of a $1.0 billion Treasury bond in June 2013. Between October 2013 and April 2014, the Bank rolled over three commercial banks’ fixed deposits (to the value of $5 billion) held by the Central Bank which matured during the period. Also, approximately $4.8 billion was indirectly removed from the system via the sale of US$750 million in the same seven-month period.
The weighted average buying rate of the Trinidad and Tobago dollar appreciated slightly to TT$6.3654 per US$ at the end of June 2014 from TT$6.3878 per US$1 in the corresponding period ending June 2013. Similarly, the weighted average selling rate appreciated to TT$6.4110 per US$1 from TT$6.4215 per US$1 over the same period.
The overall deficit on Central Government Operations for fiscal 2014 is projected at $4,876.6 million or 2.7 percent of GDP, compared to an overall deficit of 3.0 percent of GDP for fiscal 2013. Total Revenue and Grants is estimated at $59,911.7 million or 33.5 percent of GDP, of which Tax Revenue is expected to be the major component, contributing $47,705.3 million. Capital Revenue is estimated to more than double over the receipts of fiscal 2013. Total Expenditure and Net Lending is estimated at $64,788.3 million or 36.2 percent of GDP, approximately the same proportion of GDP as fiscal 2013.
The Overall Balance of the Rest of the Non-Financial Public Sector recorded a deficit of $3,293.3 million for the first half of fiscal 2014 as compared to a surplus of $65.4 million for the same period of fiscal 2013. The operational deficits on
the State Enterprises and Public Utilities accounts reflected the performance for the period.
Net Public Sector Debt is projected to increase by 10.7 percent from $70,929.5 million in fiscal 2013 to $78,494.7 million by the end of the current fiscal year. Net Public Sector Debt as a percentage of GDP is expected to increase by 3.3 percent from 40.4 percent in fiscal 2013 to 43.4 percent in fiscal 2014.
The Net Asset Value of the Heritage and Stabilisation Fund increased to US$ 5,563.3 million, at the end of the third quarter in fiscal 2014. The positive performance of the fund is due solely to gains from the investment portfolio of the Fund as no deposits were recorded for the period.
The Balance of Payments is projected to record a surplus of US$786.3 million in 2013, a vast improvement from the deficit of US$622.0 million for 2012. This surplus reflects the positive expansion in the external current account balance which improved by 173.7 percent due mainly to an improvement in the services account. The improvement in the deficit on the capital account recorded in 2012 was reversed as the deficit expanded by 14.3 percent to US$1,785.2 million.
The balance of visible trade declined by 33.0 percent over the period April 2013 to May 2014, as compared to the previous comparative period as exports declined and imports marginally expanded. However, the balance of trade excluding mineral fuels declined by 11.2 percent to TT$3,203.4 million for the period.
Trinidad and Tobago’s gross official reserves expanded by 11.0 percent to US$10,219.8 million at the end of July 2014, representing 12.0 months of prospective imports of goods and non-factor services.
ECONOMIC PERFORMANCE OF CARICOM STATES
R E V I E W O F T H E E C O N O M Y 2 0 1 4
21 EMPOWERING OUR PEOPLE THROUGH SUSTAINED ECONOMIC GROWTH AND PROSPERITY
sub-sector’s expansion of 2.2 percent in 2013, but weaker than the expansions of 3.8 percent and 3.6 percent which were attained in 2011 and 2012 respectively. As a result, the sub-sector’s share of GDP is projected to rise to 51.8 percent in 2014, from 51.2 percent in 2013.
The manufacturing sub-sector, the second largest non-petroleum sub-sector, is expected to contract marginally by 0.7 percent in 2014. This negative performance is nonetheless an improvement on the sub-sector’s sharper declines of 1.8 percent in 2013, and 5.8 percent in 2012. The contribution of the manufacturing sub-sector to real GDP is expected to fall to 8.5 percent in 2014, from 8.7 percent in 2013. Flat growth of 0.8 percent is projected in the remaining non-petroleum sub-sector, agriculture, in 2014. This is a notably weaker outturn than the sub-sector’s expansion of 5.1 percent in 2013.
The petroleum sector is expected to record its second consecutive year of positive economic growth, with a smaller expansion of 1.0 percent in 2014, down from 1.6 percent in 2013. The positive, albeit modest, outturn reflects expansions in the exploration and production, petrochemicals, service contractors and distribution sub-
GROSS DOMEST IC PRODUCT (GDP) 129
According to the latest estimates from the Central Statistical Office, the economy of Trinidad and Tobago is expected to expand in real terms by 1.9 percent in 2014, following expansions of 1.4 percent, and 1.7 percent in 2012 and 2013 respectively. Driving the accelerated growth in 2014 is a 2.5 percent increase in real economic activity in the non-petroleum sector, along with a 1.0 percent expansion in the petroleum sector (Appendices 1 to 3).
Growth in the non-petroleum sector is expected to strengthen to 2.5 percent in 2014, from 1.6 percent in 2013. This marks the sector’s fourth consecutive year of real growth, which has averaged 2.4 percent over the 2011 to 2014 period. The sector’s contribution to overall GDP is projected to increase to 60.9 percent in 2014, from 60.5 percent in 2013.
Services, the largest non-petroleum sub-sector, is expected to register the strongest performance in the non-petroleum sector, with growth of 3.0 percent in 2014. This is an improvement on the
12 GDP is quoted in constant (2000) prices unless otherwise stated
Gross Domestic Product
Petroleum
Agriculture
Manufacturing
Services
Prices
Productivity
Population
Labour Force and Employment
T H E R E A L E C O N O M Y
R E V I E W O F T H E E C O N O M Y 2 0 1 4
22EMPOWERING OUR PEOPLE THROUGH SUSTAINED ECONOMIC GROWTH AND PROSPERITY
industries. Growth in exploration and production, the largest petroleum sub-sector, is expected to slow to 0.6 percent from 1.3 percent, on account of lower crude oil and natural gas production, arising from ageing oil reservoirs and planned upstream stoppages. An uptick in gas output is however likely during the final months of the year as upstream operations normalize. The smaller petroleum sector expansion has led to a lower projected contribution to real GDP for the sector, from 38.8 percent in 2013, to 38.5 percent in 2014.
Marginal growth of 0.6 percent is projected in exploration and production, the largest petroleum sub-industry. This is just under half of the sub-industry’s expansion of 1.3 percent in 2013. In contrast, a strong turnaround is expected in the petrochemicals sub-industry, the third largest, with growth of 5.2 percent in 2014, following a decline of 1.7 percent in 2013. Positive performances are also projected in service contractors (2.0 percent, down from 8.7 percent) and distribution (10.0 percent, up from 5.0 percent).
The outlook for the petroleum sector in 2014 is constrained by an anticipated contraction of 2.9 percent in refining (including Atlantic LNG), the second largest petroleum sub-industry. This contraction is due to natural gas supply challenges for downstream refiners, the planned maintenance work conducted at the Point a Pierre oil refinery in early 2014, and the decision by Petrotrin to operate its oil refinery well below capacity level in response to lower refining margins. This negative performance is a reversal of the sub-industry’s 2.2 percent growth recorded in 2013. A sharper decline of 26.9 percent is also anticipated in asphalt production in 2014, following the 14.1 percent increase attained in 2013.
PETROLEUMDRILLING
Forty seven (47) wells were drilled by petroleum companies during the first eight months of fiscal
2013/2014, a decline of 26.6 percent, when compared to the 64 wells drilled in the previous comparative period. Of these, 40 wells were for development (down from 62), reflecting a decline of 35.5 percent; and 7 wells were for exploration (up from 2), an increase of 250.0 percent (Appendix 7).
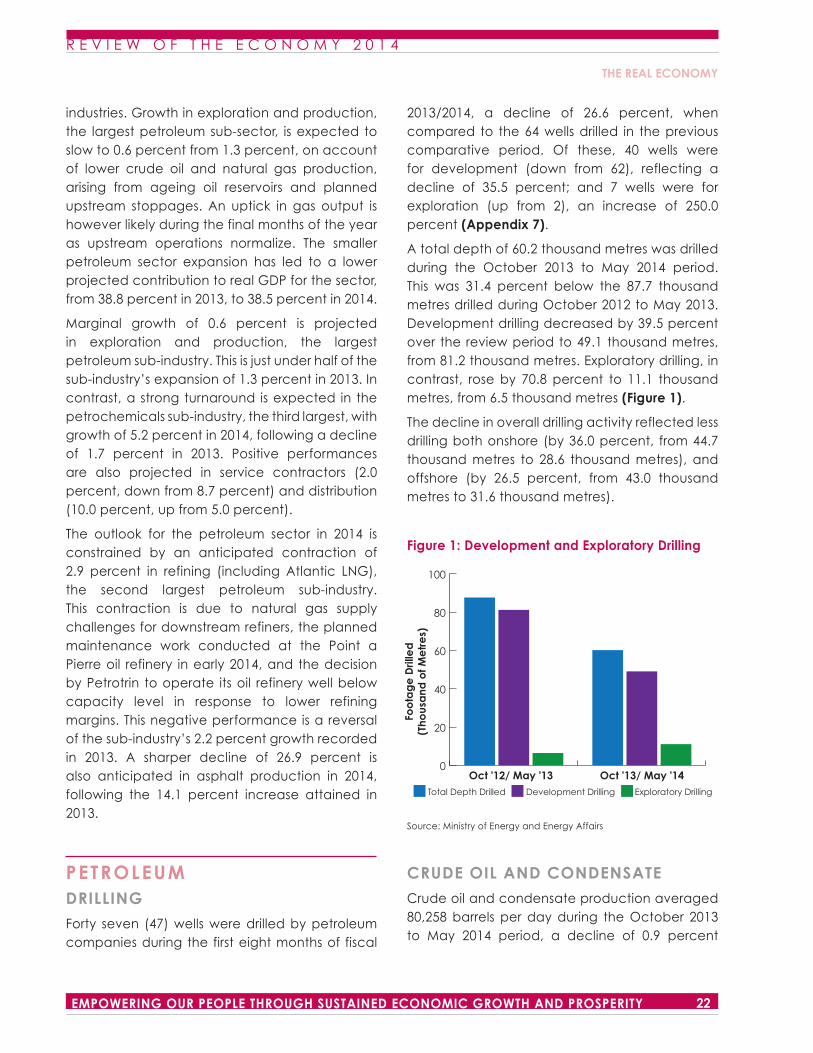
A total depth of 60.2 thousand metres was drilled during the October 2013 to May 2014 period. This was 31.4 percent below the 87.7 thousand metres drilled during October 2012 to May 2013. Development drilling decreased by 39.5 percent over the review period to 49.1 thousand metres, from 81.2 thousand metres. Exploratory drilling, in contrast, rose by 70.8 percent to 11.1 thousand metres, from 6.5 thousand metres (Figure 1).
The decline in overall drilling activity reflected less drilling both onshore (by 36.0 percent, from 44.7 thousand metres to 28.6 thousand metres), and offshore (by 26.5 percent, from 43.0 thousand metres to 31.6 thousand metres).
Figure 1: Development and Exploratory Drilling
Source: Ministry of Energy and Energy Affairs
CRUDE OIL AND CONDENSATE
Crude oil and condensate production averaged 80,258 barrels per day during the October 2013 to May 2014 period, a decline of 0.9 percent
Total Depth Drilled Development Drilling Exploratory Drilling
0
20
40
60
80
100
Oct '12/ May '13 Oct '13/ May '14
Foo
tag
e D
rille
d(T
hous
and
of M
etr
es)
THE REAL ECONOMY
R E V I E W O F T H E E C O N O M Y 2 0 1 4
23 EMPOWERING OUR PEOPLE THROUGH SUSTAINED ECONOMIC GROWTH AND PROSPERITY
from the 81,010 barrels per day produced in the comparative 2012/2013 period. This outturn represented a 2.3 percent decline in crude production (from 68,715 barrels per day to 67,163 barrels per day). The fall in crude production was partially offset by a 6.5 percent rise in condensate production (from 12,295 barrels per day to 13,095 barrels per day), on account of the extraction of wetter natural gas during the period (Appendix 7).
Marine production of crude and condensate decreased by 1.7 percent to 57,245 barrels per day in the 2013/2014 period, whereas onshore production rose by 1.0 percent to 23,013 barrels per day. This resulted in a marginal decline in the share of total crude and condensate, produced in marine areas, to 71.3 percent from 71.9 percent, and a corresponding increase in the share produced onshore to 28.7 percent from 28.1 percent.
West Texas Intermediate crude oil prices were noticeably higher during the first nine months of fiscal 2014, as compared to the same period one year earlier. In contrast, European Brent prices remained comparatively flat. Crude prices continued to be supported by the ongoing global economic recovery, and the increased tensions and armed conflicts in the Middle East.
The average monthly price per barrel of West Texas Intermediate (WTI) crude oil fell from US$100.54 in October 2013 to a fiscal year low of
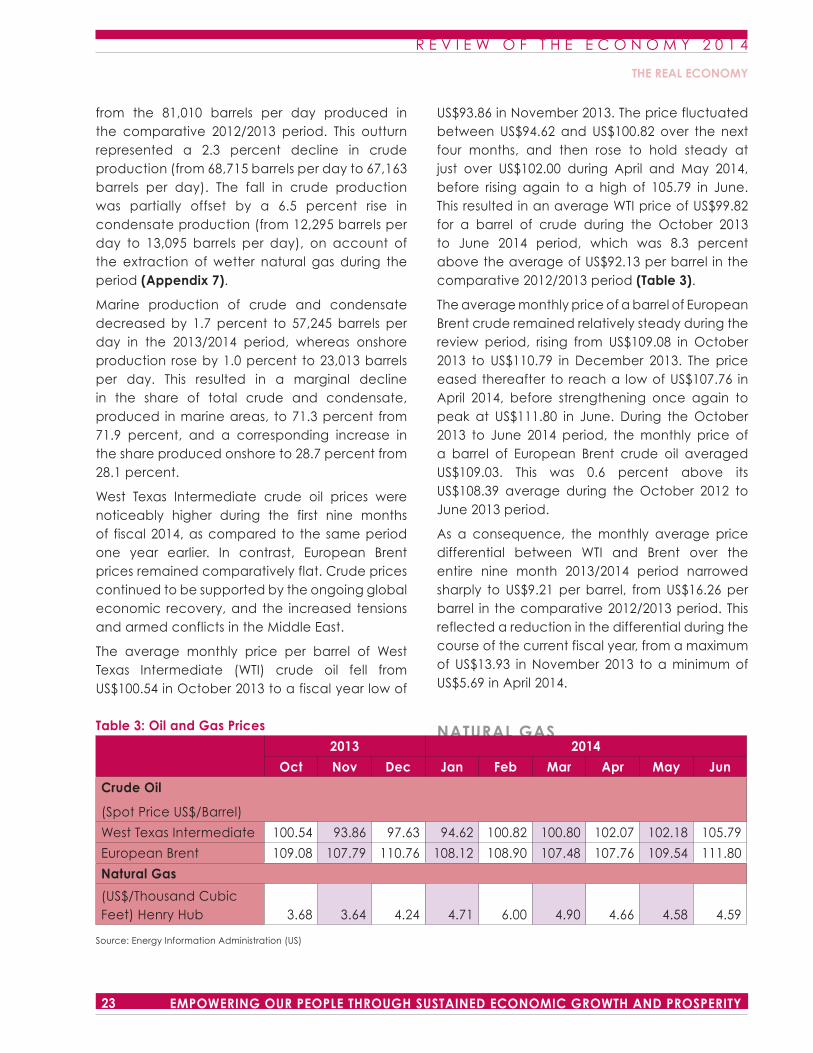
US$93.86 in November 2013. The price fluctuated between US$94.62 and US$100.82 over the next four months, and then rose to hold steady at just over US$102.00 during April and May 2014, before rising again to a high of 105.79 in June. This resulted in an average WTI price of US$99.82 for a barrel of crude during the October 2013 to June 2014 period, which was 8.3 percent above the average of US$92.13 per barrel in the comparative 2012/2013 period (Table 3).
The average monthly price of a barrel of European Brent crude remained relatively steady during the review period, rising from US$109.08 in October 2013 to US$110.79 in December 2013. The price eased thereafter to reach a low of US$107.76 in April 2014, before strengthening once again to peak at US$111.80 in June. During the October 2013 to June 2014 period, the monthly price of a barrel of European Brent crude oil averaged US$109.03. This was 0.6 percent above its US$108.39 average during the October 2012 to June 2013 period.
As a consequence, the monthly average price differential between WTI and Brent over the entire nine month 2013/2014 period narrowed sharply to US$9.21 per barrel, from US$16.26 per barrel in the comparative 2012/2013 period. This reflected a reduction in the differential during the course of the current fiscal year, from a maximum of US$13.93 in November 2013 to a minimum of US$5.69 in April 2014.
NATURAL GASTable 3: Oil and Gas Prices
2013 2014
Oct Nov Dec Jan Feb Mar Apr May Jun
Crude Oil
(Spot Price US$/Barrel)
West Texas Intermediate 100.54 93.86 97.63 94.62 100.82 100.80 102.07 102.18 105.79
European Brent 109.08 107.79 110.76 108.12 108.90 107.48 107.76 109.54 111.80
Natural Gas
(US$/Thousand Cubic Feet) Henry Hub 3.68 3.64 4.24 4.71 6.00 4.90 4.66 4.58 4.59
Source: Energy Information Administration (US)
THE REAL ECONOMY
R E V I E W O F T H E E C O N O M Y 2 0 1 4
24EMPOWERING OUR PEOPLE THROUGH SUSTAINED ECONOMIC GROWTH AND PROSPERITY
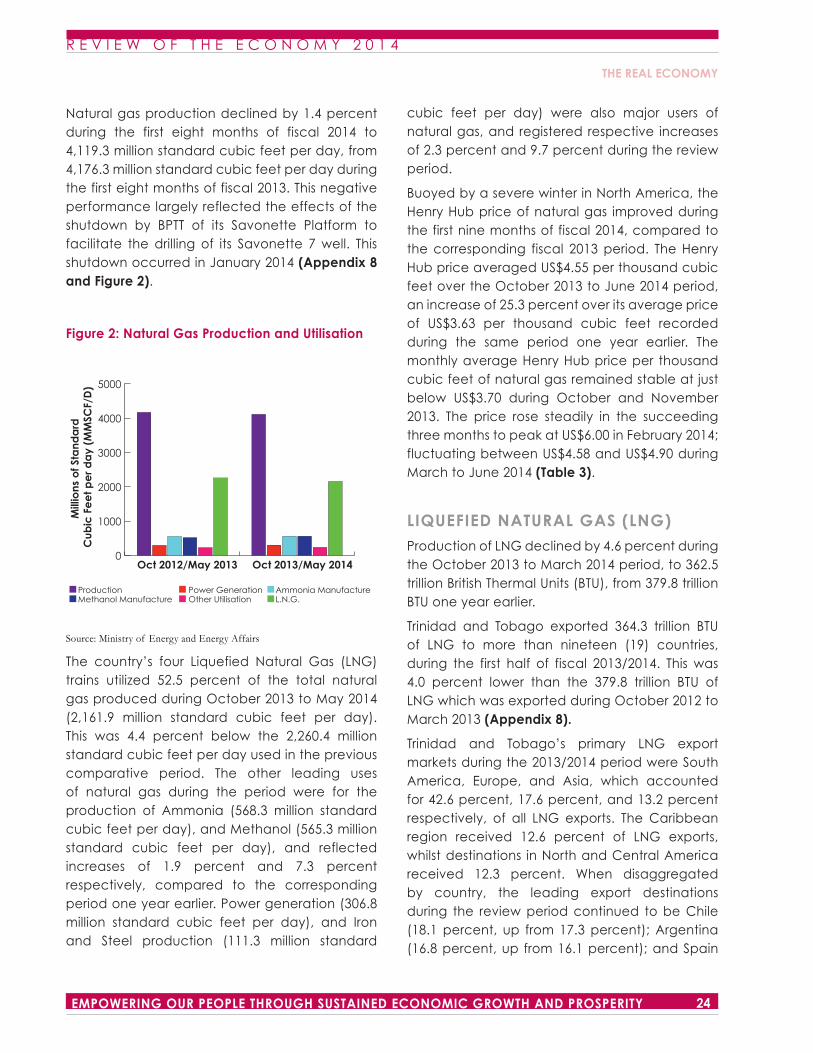
Natural gas production declined by 1.4 percent during the first eight months of fiscal 2014 to 4,119.3 million standard cubic feet per day, from 4,176.3 million standard cubic feet per day during the first eight months of fiscal 2013. This negative performance largely reflected the effects of the shutdown by BPTT of its Savonette Platform to facilitate the drilling of its Savonette 7 well. This shutdown occurred in January 2014 (Appendix 8 and Figure 2).
Figure 2: Natural Gas Production and Utilisation
Source: Ministry of Energy and Energy Affairs
The country’s four Liquefied Natural Gas (LNG) trains utilized 52.5 percent of the total natural gas produced during October 2013 to May 2014 (2,161.9 million standard cubic feet per day). This was 4.4 percent below the 2,260.4 million standard cubic feet per day used in the previous comparative period. The other leading uses of natural gas during the period were for the production of Ammonia (568.3 million standard cubic feet per day), and Methanol (565.3 million standard cubic feet per day), and reflected increases of 1.9 percent and 7.3 percent respectively, compared to the corresponding period one year earlier. Power generation (306.8 million standard cubic feet per day), and Iron and Steel production (111.3 million standard
Production Power Generation Ammonia ManufactureMethanol Manufacture Other Utilisation L.N.G.
0
1000
2000
3000
4000
5000
Oct 2012/May 2013 Oct 2013/May 2014
Mill
ions
of S
tand
ard
C
ubic
Fe
et p
er d
ay
(MM
SCF/
D)
cubic feet per day) were also major users of natural gas, and registered respective increases of 2.3 percent and 9.7 percent during the review period.
Buoyed by a severe winter in North America, the Henry Hub price of natural gas improved during the first nine months of fiscal 2014, compared to the corresponding fiscal 2013 period. The Henry Hub price averaged US$4.55 per thousand cubic feet over the October 2013 to June 2014 period, an increase of 25.3 percent over its average price of US$3.63 per thousand cubic feet recorded during the same period one year earlier. The monthly average Henry Hub price per thousand cubic feet of natural gas remained stable at just below US$3.70 during October and November 2013. The price rose steadily in the succeeding three months to peak at US$6.00 in February 2014; fluctuating between US$4.58 and US$4.90 during March to June 2014 (Table 3).
LIQUEFIED NATURAL GAS (LNG)
Production of LNG declined by 4.6 percent during the October 2013 to March 2014 period, to 362.5 trillion British Thermal Units (BTU), from 379.8 trillion BTU one year earlier.
Trinidad and Tobago exported 364.3 trillion BTU of LNG to more than nineteen (19) countries, during the first half of fiscal 2013/2014. This was 4.0 percent lower than the 379.8 trillion BTU of LNG which was exported during October 2012 to March 2013 (Appendix 8).
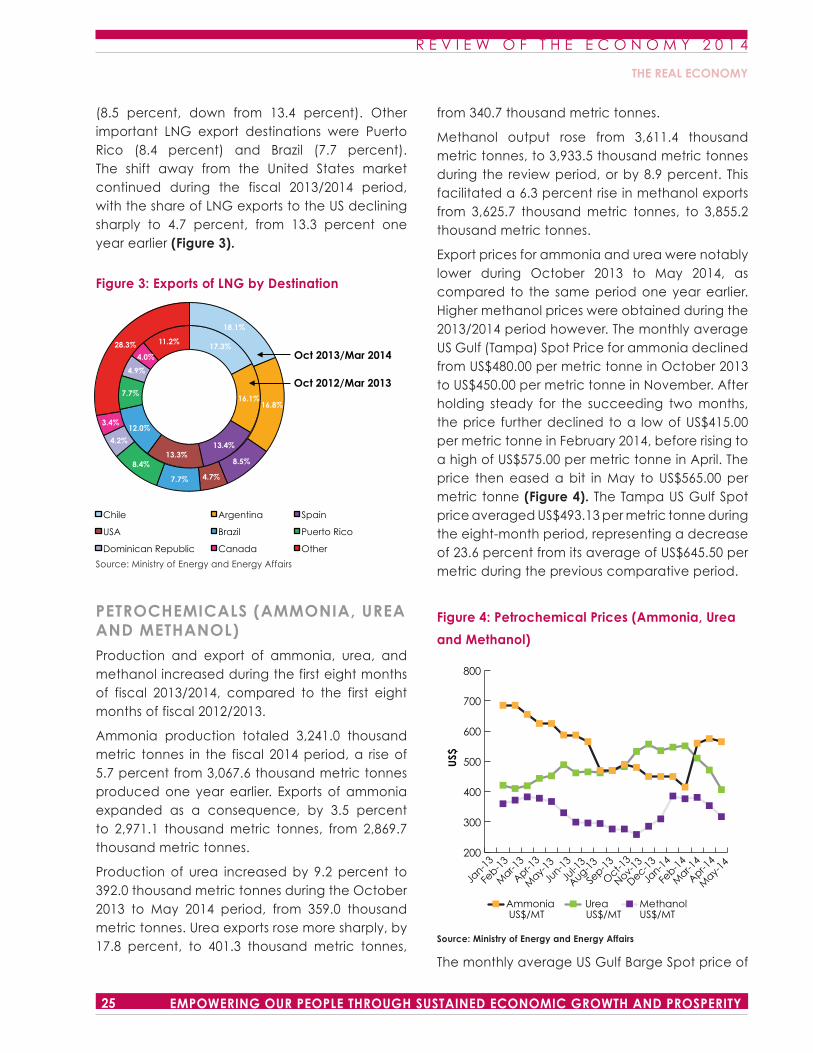
Trinidad and Tobago’s primary LNG export markets during the 2013/2014 period were South America, Europe, and Asia, which accounted for 42.6 percent, 17.6 percent, and 13.2 percent respectively, of all LNG exports. The Caribbean region received 12.6 percent of LNG exports, whilst destinations in North and Central America received 12.3 percent. When disaggregated by country, the leading export destinations during the review period continued to be Chile (18.1 percent, up from 17.3 percent); Argentina (16.8 percent, up from 16.1 percent); and Spain
THE REAL ECONOMY
R E V I E W O F T H E E C O N O M Y 2 0 1 4
25 EMPOWERING OUR PEOPLE THROUGH SUSTAINED ECONOMIC GROWTH AND PROSPERITY
(8.5 percent, down from 13.4 percent). Other important LNG export destinations were Puerto Rico (8.4 percent) and Brazil (7.7 percent). The shift away from the United States market continued during the fiscal 2013/2014 period, with the share of LNG exports to the US declining sharply to 4.7 percent, from 13.3 percent one year earlier (Figure 3).
Figure 3: Exports of LNG by Destination
Source: Ministry of Energy and Energy Affairs
PETROCHEMICALS (AMMONIA, UREA AND METHANOL)
Production and export of ammonia, urea, and methanol increased during the first eight months of fiscal 2013/2014, compared to the first eight months of fiscal 2012/2013.
Ammonia production totaled 3,241.0 thousand metric tonnes in the fiscal 2014 period, a rise of 5.7 percent from 3,067.6 thousand metric tonnes produced one year earlier. Exports of ammonia expanded as a consequence, by 3.5 percent to 2,971.1 thousand metric tonnes, from 2,869.7 thousand metric tonnes.
Production of urea increased by 9.2 percent to 392.0 thousand metric tonnes during the October 2013 to May 2014 period, from 359.0 thousand metric tonnes. Urea exports rose more sharply, by 17.8 percent, to 401.3 thousand metric tonnes,
17.3%
16.1%
13.4% 13.3%
12.0%
7.7%
4.9%
4.0%
11.2%
18.1%
16.8%
8.5%
4.7% 7.7%
8.4%
4.2%
3.4%
28.3%
Chile Argentina Spain
USA Brazil Puerto Rico
Dominican Republic Canada Other
Oct 2013/Mar 2014
Oct 2012/Mar 2013
from 340.7 thousand metric tonnes.
Methanol output rose from 3,611.4 thousand metric tonnes, to 3,933.5 thousand metric tonnes during the review period, or by 8.9 percent. This facilitated a 6.3 percent rise in methanol exports from 3,625.7 thousand metric tonnes, to 3,855.2 thousand metric tonnes.
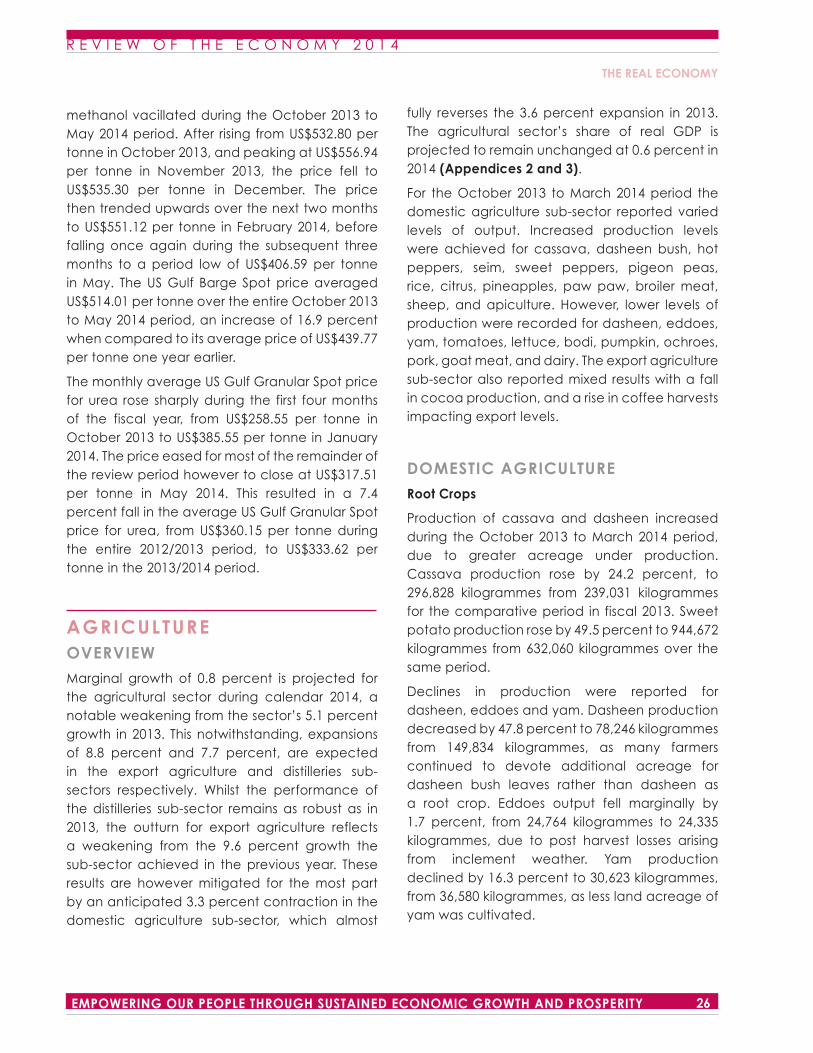
Export prices for ammonia and urea were notably lower during October 2013 to May 2014, as compared to the same period one year earlier. Higher methanol prices were obtained during the 2013/2014 period however. The monthly average US Gulf (Tampa) Spot Price for ammonia declined from US$480.00 per metric tonne in October 2013 to US$450.00 per metric tonne in November. After holding steady for the succeeding two months, the price further declined to a low of US$415.00 per metric tonne in February 2014, before rising to a high of US$575.00 per metric tonne in April. The price then eased a bit in May to US$565.00 per metric tonne (Figure 4). The Tampa US Gulf Spot price averaged US$493.13 per metric tonne during the eight-month period, representing a decrease of 23.6 percent from its average of US$645.50 per metric during the previous comparative period.
Figure 4: Petrochemical Prices (Ammonia, Urea
and Methanol)
Source: Ministry of Energy and Energy Affairs
The monthly average US Gulf Barge Spot price of
200
300
400
500
600
700
800
Jan-1
3
Feb-1
3
Mar-1
3
Apr-13
May-
13
Jun-1
3
Jul-1
3
Aug-13
Sep-1
3
Oct-1
3
Nov-13
Dec-13
Jan-1
4
Feb-1
4
Mar-1
4
Apr-14
May-
14
US$
Ammonia US$/MT
Urea US$/MT
Methanol US$/MT
THE REAL ECONOMY
R E V I E W O F T H E E C O N O M Y 2 0 1 4
26EMPOWERING OUR PEOPLE THROUGH SUSTAINED ECONOMIC GROWTH AND PROSPERITY
methanol vacillated during the October 2013 to May 2014 period. After rising from US$532.80 per tonne in October 2013, and peaking at US$556.94 per tonne in November 2013, the price fell to US$535.30 per tonne in December. The price then trended upwards over the next two months to US$551.12 per tonne in February 2014, before falling once again during the subsequent three months to a period low of US$406.59 per tonne in May. The US Gulf Barge Spot price averaged US$514.01 per tonne over the entire October 2013 to May 2014 period, an increase of 16.9 percent when compared to its average price of US$439.77 per tonne one year earlier.
The monthly average US Gulf Granular Spot price for urea rose sharply during the first four months of the fiscal year, from US$258.55 per tonne in October 2013 to US$385.55 per tonne in January 2014. The price eased for most of the remainder of the review period however to close at US$317.51 per tonne in May 2014. This resulted in a 7.4 percent fall in the average US Gulf Granular Spot price for urea, from US$360.15 per tonne during the entire 2012/2013 period, to US$333.62 per tonne in the 2013/2014 period.
AGRICULTUREOVERVIEW
Marginal growth of 0.8 percent is projected for the agricultural sector during calendar 2014, a notable weakening from the sector’s 5.1 percent growth in 2013. This notwithstanding, expansions of 8.8 percent and 7.7 percent, are expected in the export agriculture and distilleries sub-sectors respectively. Whilst the performance of the distilleries sub-sector remains as robust as in 2013, the outturn for export agriculture reflects a weakening from the 9.6 percent growth the sub-sector achieved in the previous year. These results are however mitigated for the most part by an anticipated 3.3 percent contraction in the domestic agriculture sub-sector, which almost
fully reverses the 3.6 percent expansion in 2013. The agricultural sector’s share of real GDP is projected to remain unchanged at 0.6 percent in 2014 (Appendices 2 and 3).
For the October 2013 to March 2014 period the domestic agriculture sub-sector reported varied levels of output. Increased production levels were achieved for cassava, dasheen bush, hot peppers, seim, sweet peppers, pigeon peas, rice, citrus, pineapples, paw paw, broiler meat, sheep, and apiculture. However, lower levels of production were recorded for dasheen, eddoes, yam, tomatoes, lettuce, bodi, pumpkin, ochroes, pork, goat meat, and dairy. The export agriculture sub-sector also reported mixed results with a fall in cocoa production, and a rise in coffee harvests impacting export levels.
DOMESTIC AGRICULTURE
Root Crops
Production of cassava and dasheen increased during the October 2013 to March 2014 period, due to greater acreage under production. Cassava production rose by 24.2 percent, to 296,828 kilogrammes from 239,031 kilogrammes for the comparative period in fiscal 2013. Sweet potato production rose by 49.5 percent to 944,672 kilogrammes from 632,060 kilogrammes over the same period.
Declines in production were reported for dasheen, eddoes and yam. Dasheen production decreased by 47.8 percent to 78,246 kilogrammes from 149,834 kilogrammes, as many farmers continued to devote additional acreage for dasheen bush leaves rather than dasheen as a root crop. Eddoes output fell marginally by 1.7 percent, from 24,764 kilogrammes to 24,335 kilogrammes, due to post harvest losses arising from inclement weather. Yam production declined by 16.3 percent to 30,623 kilogrammes, from 36,580 kilogrammes, as less land acreage of yam was cultivated.
THE REAL ECONOMY
R E V I E W O F T H E E C O N O M Y 2 0 1 4
27 EMPOWERING OUR PEOPLE THROUGH SUSTAINED ECONOMIC GROWTH AND PROSPERITY
Vegetables
The vegetable sub-sector reported varied results during the fiscal 2013/2014 review period. There were increases in production for hot pepper (5.5 percent), seim (68.1 percent), sweet pepper (34 percent) and pigeon peas (187.3 percent). Lower production levels were however observed for other vegetables due to unfavourable weather conditions, including cabbage (12.9 percent), tomatoes (4.3 percent), lettuce (32.4 percent), bodi (6.8 percent), pumpkin (45.8 percent) and ochro (24.5 percent).
Paddy
Rice production totalled 2,332.1 metric tonnes during the October 2013 to March 2014 period, an increase of 50.3 percent when compared to the 1,552.1 metric tonnes produced during October 2012 to March 2013. The increase in production reflects both the drive by the Ministry of Food Production to increase the land acreage available for rice cultivation, and an improvement in the quality of rice seeds used for planting.
Other Crops
Citrus - The National Agricultural Marketing and Development Corporation’s (NAMDEVCO’s) Northern Wholesale Market recorded a 20.0 percent increase in the number of oranges available for the first half of fiscal 2013/2014, to 1,052,300 oranges, from 876,800 oranges in the comparative 2012/2013 period. Likewise, grapefruit production increased by 36.1 percent during the period to 223,100 fruits. The increase in citrus output was due to prevailing favourable weather conditions.
Pineapple - Production of pineapples increased by 19.8 percent to 299,057 kilogrammes, over the period October 2013 to March 2014, from 249,528 kilogrammes one year earlier, on account of favourable weather conditions and improved production methods.
Paw Paw - Paw Paw production increased by 22.5 percent to 143,992 kilogrammes during the 2013/2014 period, from 117,558 kilogrammes in 2012/2013, due to favourable weather conditions and improved post-harvest techniques.
Livestock
During the review period the livestock sub-sector faced a number of challenges, which negatively affected production and efficiency. These include limited supply and availability of quality breeding stock; the high cost of inputs (feed, drugs and other consumables); labour intensive production systems coupled with a scarcity of trained labour; and the prevalence of praedial larceny.
Poultry
Broiler meat production increased by 1.2 percent during the period under review to 32.8 million kilogrammes, from 32.4 million kilogrammes in the previous period. The number of broilers sold rose more sharply, by 74.7 percent, in the fiscal 2013/2014 period to 17.3 million heads of chicken, from 9.9 million heads of chicken one year earlier. The poultry industry experienced some instability during the early part of the review period as some poultry farmers and operators adjusted to a 15 percent import surcharge which was levied on imported chicken. However, stability has returned to the industry and broiler sales are expected to trend upward.
Pork
Domestic pork production declined by 9.4 percent to 1,384,000 kilogrammes in the 2013/2014 period, from 1,527,000 kilogrammes in the corresponding 2012/2013 period, amidst increasing imports of pork.
One major stakeholder continued to experiment unsuccessfully with alternative methods for managing farm waste, in order to comply with the Water Pollution Rules enforced by the
THE REAL ECONOMY
R E V I E W O F T H E E C O N O M Y 2 0 1 4
28EMPOWERING OUR PEOPLE THROUGH SUSTAINED ECONOMIC GROWTH AND PROSPERITY
Environmental Management Authority (EMA). Additionally, the local industry continued to be plagued by a shortage of labour, competition from cheaper imports, the high cost and short supply of feed, and the downsizing of pig farms due to issues of efficiency and profitability. Prospects for the industry will depend largely on its ability to compete with the rising level of imports of pork, to attract labour, and to comply with the EMA’s stipulations for protecting the environment. With the latter in mind, a proposal has been forwarded to the Green Fund to develop a solution to sustainably manage pig industry waste.
Small Ruminants
Mutton production rose by 70.0 percent from 62,600 kilogrammes in 2012/2013 to 106,400 kilogrammes in 2013/2014. During the same period, the number of sheep sold increased by 7.1 percent from 4,200 heads to 4,500 heads. These positive outturns resulted from the expansion of the Sheep Production Unit of the Ministry of Food Production which continued to produce and disseminate quality stock to the sheep farming community. Improvements in housing for sheep have also contributed to a reduction in morbidity, and an overall improvement in the efficiency of the rearing system.
Production of goat meat decreased by 52.2 percent to 10,800 kilogrammes, from 22,600 kilogrammes. The number of goats sold also fell by 31.3 percent to 1,100 heads, from 1,600 heads. These negative results could be attributed to the presence of Johne’s disease in the local goat population; the unsuspected importation of diseased animals as well as the lack of expansion of pens.
Apiculture (Bees)
Honey production increased sharply by 233.3 percent to 200,000 litres from 60,000 litres due to favourable weather conditions, an increase in the number of beekeepers and the exposure of beekeepers to improved technology by
County Extension Officers. Several measures are being taken by the Ministry of Food Production to ensure that Trinidad and Tobago remains pest and disease free including an amendment to the Beekeeping and Bee Products Act and the drafting of a protocol for the importation of honey into Trinidad and Tobago.
EXPORT AGRICULTURE
Cocoa
During the six-month period to March 2014, cocoa bean production decreased by 60.6 percent to 131,416 kilogrammes from 333,651 kilogrammes in the corresponding 2012/2013 period. This decline reflected unfavourable weather conditions with periods of heavy rainfall and spells of extreme dry periods; fluctuations in the production patterns delaying production, and a decline in the number of cocoa farmers.
Coffee
Coffee production increased sharply by 338.0 percent to 1,555 kilogrammes from 355 kilogrammes. The strong performance was primarily due to the implementation of outreach and extension programs by the Ministry of Food Production which sought to renew farmers’ interest in coffee cultivation.
MANUFACTURINGOVERVIEW
For calendar 2014, real economic activity in the manufacturing sector is expected to decline by 0.7 percent; following declines of 5.8 percent and 1.8 percent in 2012 and 2013 respectively. As a result, the sector’s contribution to real GDP is expected to fall marginally from 8.7 percent in 2013 to 8.5 percent in 2014 (Appendices 2 and 3).
The negative performance of the manufacturing sector reflects contractions in most manufacturing sub-sectors. The strongest declines are forecasted
THE REAL ECONOMY
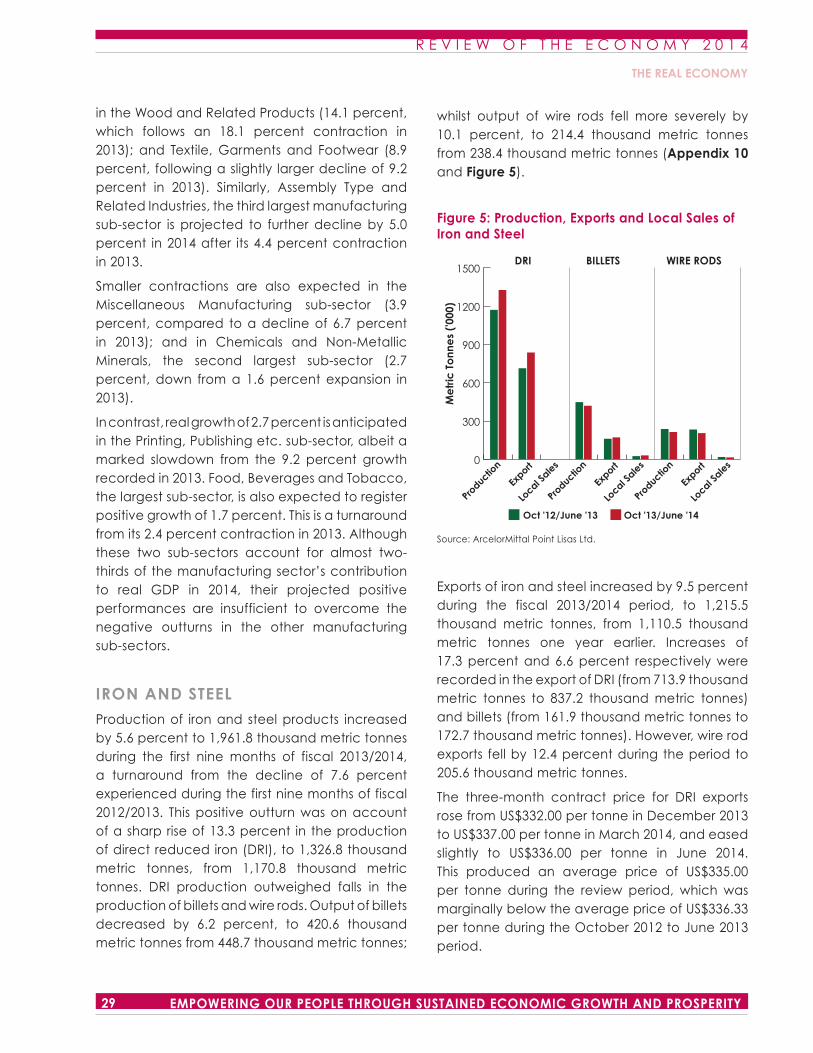
R E V I E W O F T H E E C O N O M Y 2 0 1 4
29 EMPOWERING OUR PEOPLE THROUGH SUSTAINED ECONOMIC GROWTH AND PROSPERITY
in the Wood and Related Products (14.1 percent, which follows an 18.1 percent contraction in 2013); and Textile, Garments and Footwear (8.9 percent, following a slightly larger decline of 9.2 percent in 2013). Similarly, Assembly Type and Related Industries, the third largest manufacturing sub-sector is projected to further decline by 5.0 percent in 2014 after its 4.4 percent contraction in 2013.
Smaller contractions are also expected in the Miscellaneous Manufacturing sub-sector (3.9 percent, compared to a decline of 6.7 percent in 2013); and in Chemicals and Non-Metallic Minerals, the second largest sub-sector (2.7 percent, down from a 1.6 percent expansion in 2013).
In contrast, real growth of 2.7 percent is anticipated in the Printing, Publishing etc. sub-sector, albeit a marked slowdown from the 9.2 percent growth recorded in 2013. Food, Beverages and Tobacco, the largest sub-sector, is also expected to register positive growth of 1.7 percent. This is a turnaround from its 2.4 percent contraction in 2013. Although these two sub-sectors account for almost two-thirds of the manufacturing sector’s contribution to real GDP in 2014, their projected positive performances are insufficient to overcome the negative outturns in the other manufacturing sub-sectors.
IRON AND STEEL
Production of iron and steel products increased by 5.6 percent to 1,961.8 thousand metric tonnes during the first nine months of fiscal 2013/2014, a turnaround from the decline of 7.6 percent experienced during the first nine months of fiscal 2012/2013. This positive outturn was on account of a sharp rise of 13.3 percent in the production of direct reduced iron (DRI), to 1,326.8 thousand metric tonnes, from 1,170.8 thousand metric tonnes. DRI production outweighed falls in the production of billets and wire rods. Output of billets decreased by 6.2 percent, to 420.6 thousand metric tonnes from 448.7 thousand metric tonnes;
whilst output of wire rods fell more severely by 10.1 percent, to 214.4 thousand metric tonnes from 238.4 thousand metric tonnes (Appendix 10 and Figure 5).
Figure 5: Production, Exports and Local Sales of Iron and Steel
Source: ArcelorMittal Point Lisas Ltd.
Exports of iron and steel increased by 9.5 percent during the fiscal 2013/2014 period, to 1,215.5 thousand metric tonnes, from 1,110.5 thousand metric tonnes one year earlier. Increases of 17.3 percent and 6.6 percent respectively were recorded in the export of DRI (from 713.9 thousand metric tonnes to 837.2 thousand metric tonnes) and billets (from 161.9 thousand metric tonnes to 172.7 thousand metric tonnes). However, wire rod exports fell by 12.4 percent during the period to 205.6 thousand metric tonnes.
The three-month contract price for DRI exports rose from US$332.00 per tonne in December 2013 to US$337.00 per tonne in March 2014, and eased slightly to US$336.00 per tonne in June 2014. This produced an average price of US$335.00 per tonne during the review period, which was marginally below the average price of US$336.33 per tonne during the October 2012 to June 2013 period.
0
300
600
900
1200
1500
Oct '12/June '13 Oct '13/June '14
Me
tric
To
nne
s ('0
00)
DRI BILLETS WIRE RODS
Local S
ales
Productio
n
Export
Local S
ales
Productio
n
Export
Local S
ales
Productio
n
Export
THE REAL ECONOMY
R E V I E W O F T H E E C O N O M Y 2 0 1 4
30EMPOWERING OUR PEOPLE THROUGH SUSTAINED ECONOMIC GROWTH AND PROSPERITY
The export price of billets rose during the first five months of fiscal 2013/2014 from US$505.00 per tonne in October 2013 to US$515.00 per tonne in February 2014, declining steadily in the subsequent four months to US$487.50 per tonne in June. The price averaged US$503.90 per tonne during the nine-month period, 4.0 percent below the average price of US$525.03 during the same period one year earlier.
Wire rod export prices were lower on average by 2.0 percent during the fiscal 2013/2014 period (US$593.77 per tonne), when compared to the previous fiscal period (US$605.89 per tonne). The monthly price rose from US$590.00 per tonne in October 2013 to US$607.50 per tonne in February 2014, but eased steadily thereafter to US$586.00 per tonne in May; before rising to US$592.10 per tonne in June 2014.
Sales of steel products on the domestic market rose by 4.7 percent in the 2013/2014 period to 46.9 thousand metric tonnes from 44.8 thousand metric tonnes. This increase reflected greater local sales of billets (19.7 percent) from 26.2 thousand metric tonnes to 31.4 thousand metric tonnes; which occurred amidst a drop in wire rod sales (16.4 percent) from 18.6 thousand metric tonnes to 15.6 thousand metric tonnes.
CEMENT
Cement production declined by 2.6 percent, from 637.1 thousand metric tonnes to 620.7 thousand metric tonnes during the October 2013 to June 2014 period (Figure 6). Most of the fall in output occurred in the second quarter of fiscal 2014 with production dropping by 23.4 thousand metric tonnes in that quarter, or by 11.5 percent compared to one year earlier. This fall in production resulted from a planned extended stop for major refurbishment on one of the kilns at
the local cement plant, and the annual stoppage of operation in March 2014 of a second kiln. With the completion of these maintenance stops, production trended upward during the third quarter to register an increase of 10.2 thousand metric tonnes, or 4.5 percent, compared to the third quarter of fiscal 2013. Higher production levels are expected to be sustained during the remainder of the fiscal year in response to strong demand from the local construction sector.
Total cement sales fell by 2.2 percent during the nine-month fiscal 2013/2014 period, to 624.2 thousand metric tonnes, from 638.2 thousand metric tonnes in the comparative 2012/2013 period. Cement export sales declined sharply by 31.9 percent, from 182.3 thousand metric tonnes to 124.2 thousand metric tonnes, resulting from the prioritizing of domestic supplies to meet increased demand in the local market. As a consequence, the share of export sales to total cement sales during the October 2013 to June 2014 period, fell sharply to 19.9 percent, from 28.6 percent one year earlier.
Domestic cement sales rose by 9.7 percent, to 500.0 thousand metric tonnes from 455.9 thousand metric tonnes, due to increased local construction activity. As a result, domestic sales accounted for 80.1 percent of the total cement sales in the fiscal 2014 period, which was notably larger than its 71.4 percent share in the previous comparative period.
Based on an average of all brands sold on the domestic market, the price of a bag of cement, increased marginally by 0.2 percent, from $58.10 to $58.20 over the October 2013 to June 2014 period. In June 2014 the local cement manufacturer announced price increases of 9.0 percent and 15.0 percent on its cement products with effect from July 1st 2014, in response to rising operational costs.
THE REAL ECONOMY
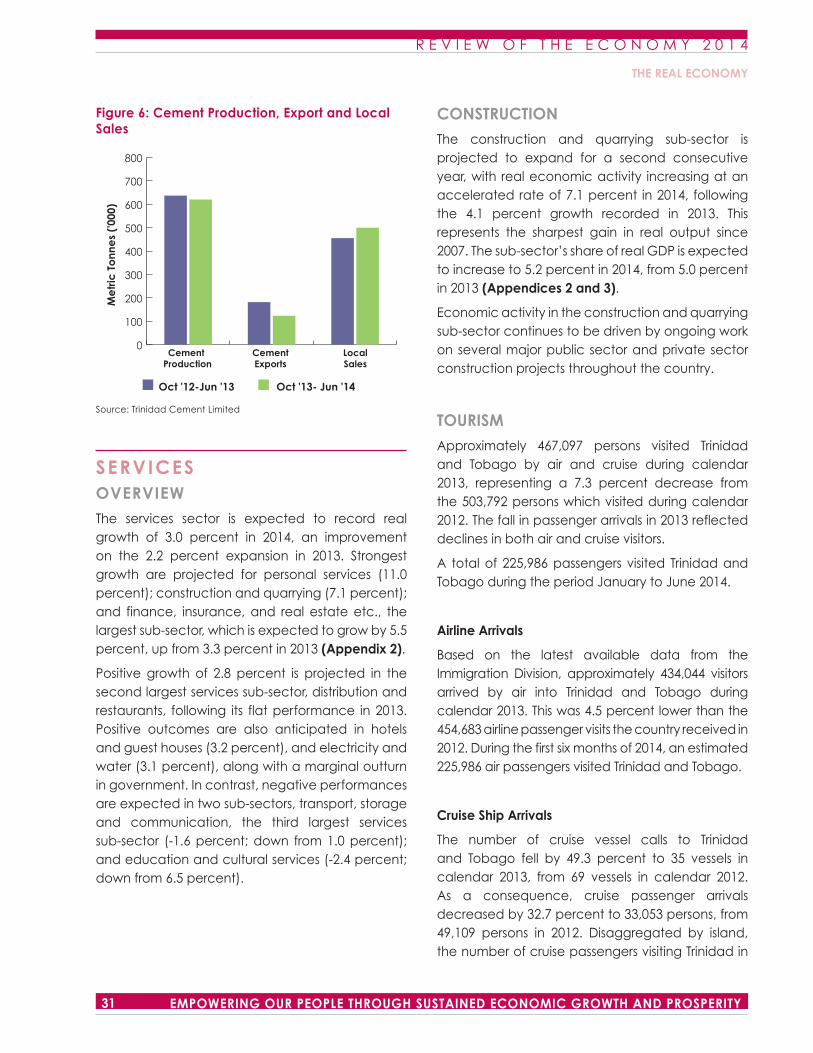
R E V I E W O F T H E E C O N O M Y 2 0 1 4
31 EMPOWERING OUR PEOPLE THROUGH SUSTAINED ECONOMIC GROWTH AND PROSPERITY
Figure 6: Cement Production, Export and Local Sales
Source: Trinidad Cement Limited
SERVICESOVERVIEW
The services sector is expected to record real growth of 3.0 percent in 2014, an improvement on the 2.2 percent expansion in 2013. Strongest growth are projected for personal services (11.0 percent); construction and quarrying (7.1 percent); and finance, insurance, and real estate etc., the largest sub-sector, which is expected to grow by 5.5 percent, up from 3.3 percent in 2013 (Appendix 2).
Positive growth of 2.8 percent is projected in the second largest services sub-sector, distribution and restaurants, following its flat performance in 2013. Positive outcomes are also anticipated in hotels and guest houses (3.2 percent), and electricity and water (3.1 percent), along with a marginal outturn in government. In contrast, negative performances are expected in two sub-sectors, transport, storage and communication, the third largest services sub-sector (-1.6 percent; down from 1.0 percent); and education and cultural services (-2.4 percent; down from 6.5 percent).
0
100
200
300
400
500
600
700
800
Oct '12-Jun '13 Oct '13- Jun '14
Cement Production
CementExports
LocalSales
Me
tric
To
nne
s ('0
00)
CONSTRUCTION
The construction and quarrying sub-sector is projected to expand for a second consecutive year, with real economic activity increasing at an accelerated rate of 7.1 percent in 2014, following the 4.1 percent growth recorded in 2013. This represents the sharpest gain in real output since 2007. The sub-sector’s share of real GDP is expected to increase to 5.2 percent in 2014, from 5.0 percent in 2013 (Appendices 2 and 3).
Economic activity in the construction and quarrying sub-sector continues to be driven by ongoing work on several major public sector and private sector construction projects throughout the country.
TOURISM
Approximately 467,097 persons visited Trinidad and Tobago by air and cruise during calendar 2013, representing a 7.3 percent decrease from the 503,792 persons which visited during calendar 2012. The fall in passenger arrivals in 2013 reflected declines in both air and cruise visitors.
A total of 225,986 passengers visited Trinidad and Tobago during the period January to June 2014.
Airline Arrivals
Based on the latest available data from the Immigration Division, approximately 434,044 visitors arrived by air into Trinidad and Tobago during calendar 2013. This was 4.5 percent lower than the 454,683 airline passenger visits the country received in 2012. During the first six months of 2014, an estimated 225,986 air passengers visited Trinidad and Tobago.
Cruise Ship Arrivals
The number of cruise vessel calls to Trinidad and Tobago fell by 49.3 percent to 35 vessels in calendar 2013, from 69 vessels in calendar 2012. As a consequence, cruise passenger arrivals decreased by 32.7 percent to 33,053 persons, from 49,109 persons in 2012. Disaggregated by island, the number of cruise passengers visiting Trinidad in
THE REAL ECONOMY
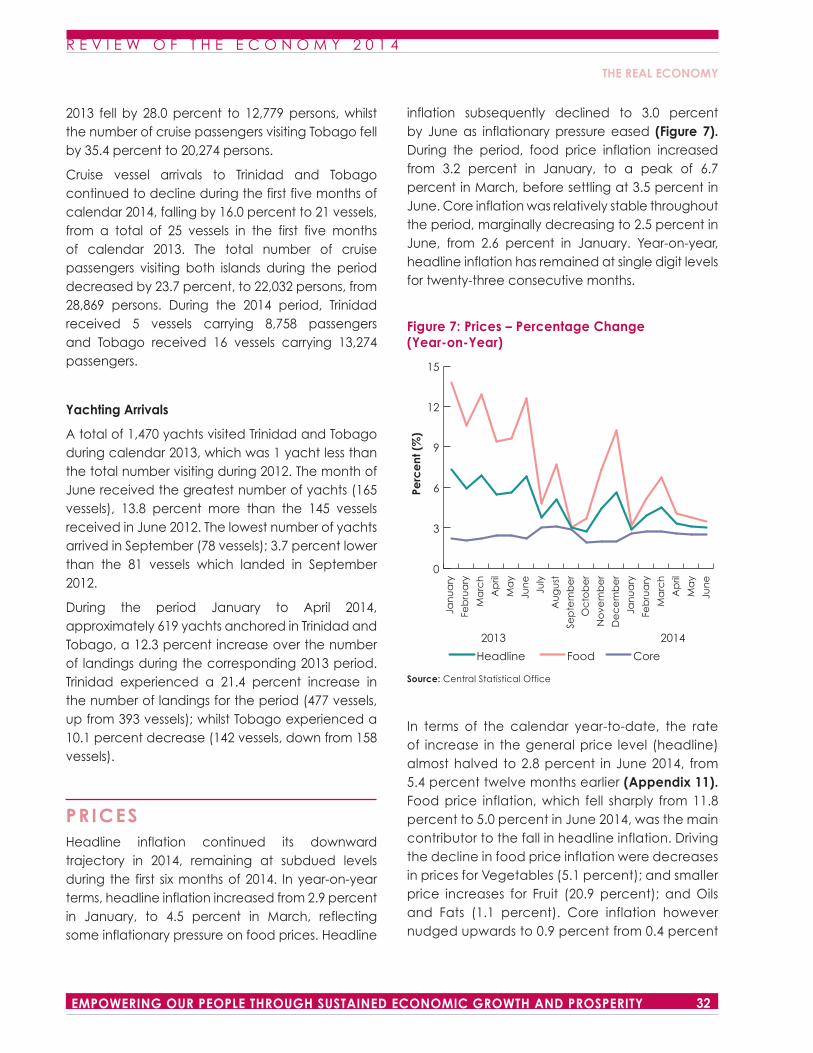
R E V I E W O F T H E E C O N O M Y 2 0 1 4
32EMPOWERING OUR PEOPLE THROUGH SUSTAINED ECONOMIC GROWTH AND PROSPERITY
2013 fell by 28.0 percent to 12,779 persons, whilst the number of cruise passengers visiting Tobago fell by 35.4 percent to 20,274 persons.
Cruise vessel arrivals to Trinidad and Tobago continued to decline during the first five months of calendar 2014, falling by 16.0 percent to 21 vessels, from a total of 25 vessels in the first five months of calendar 2013. The total number of cruise passengers visiting both islands during the period decreased by 23.7 percent, to 22,032 persons, from 28,869 persons. During the 2014 period, Trinidad received 5 vessels carrying 8,758 passengers and Tobago received 16 vessels carrying 13,274 passengers.
Yachting Arrivals
A total of 1,470 yachts visited Trinidad and Tobago during calendar 2013, which was 1 yacht less than the total number visiting during 2012. The month of June received the greatest number of yachts (165 vessels), 13.8 percent more than the 145 vessels received in June 2012. The lowest number of yachts arrived in September (78 vessels); 3.7 percent lower than the 81 vessels which landed in September 2012.
During the period January to April 2014, approximately 619 yachts anchored in Trinidad and Tobago, a 12.3 percent increase over the number of landings during the corresponding 2013 period. Trinidad experienced a 21.4 percent increase in the number of landings for the period (477 vessels, up from 393 vessels); whilst Tobago experienced a 10.1 percent decrease (142 vessels, down from 158 vessels).
PRICESHeadline inflation continued its downward trajectory in 2014, remaining at subdued levels during the first six months of 2014. In year-on-year terms, headline inflation increased from 2.9 percent in January, to 4.5 percent in March, reflecting some inflationary pressure on food prices. Headline
inflation subsequently declined to 3.0 percent by June as inflationary pressure eased (Figure 7). During the period, food price inflation increased from 3.2 percent in January, to a peak of 6.7 percent in March, before settling at 3.5 percent in June. Core inflation was relatively stable throughout the period, marginally decreasing to 2.5 percent in June, from 2.6 percent in January. Year-on-year, headline inflation has remained at single digit levels for twenty-three consecutive months.
Figure 7: Prices – Percentage Change (Year-on-Year)
Source: Central Statistical Office
In terms of the calendar year-to-date, the rate of increase in the general price level (headline) almost halved to 2.8 percent in June 2014, from 5.4 percent twelve months earlier (Appendix 11). Food price inflation, which fell sharply from 11.8 percent to 5.0 percent in June 2014, was the main contributor to the fall in headline inflation. Driving the decline in food price inflation were decreases in prices for Vegetables (5.1 percent); and smaller price increases for Fruit (20.9 percent); and Oils and Fats (1.1 percent). Core inflation however nudged upwards to 0.9 percent from 0.4 percent
0
3
6
9
12
15
Ja
nu
ary
Fe
bru
ary
M
arc
h
A
pril
M
ay
Ju
ne
Ju
ly
A
ug
ust
Se
pte
mb
er
O
cto
be
r
N
ove
mb
er
D
ec
em
be
r
Ja
nu
ary
Fe
bru
ary
M
arc
h
A
pril
M
ay
Ju
ne
Headline Food Core
Perc
ent
(%
)
2013 2014
THE REAL ECONOMY
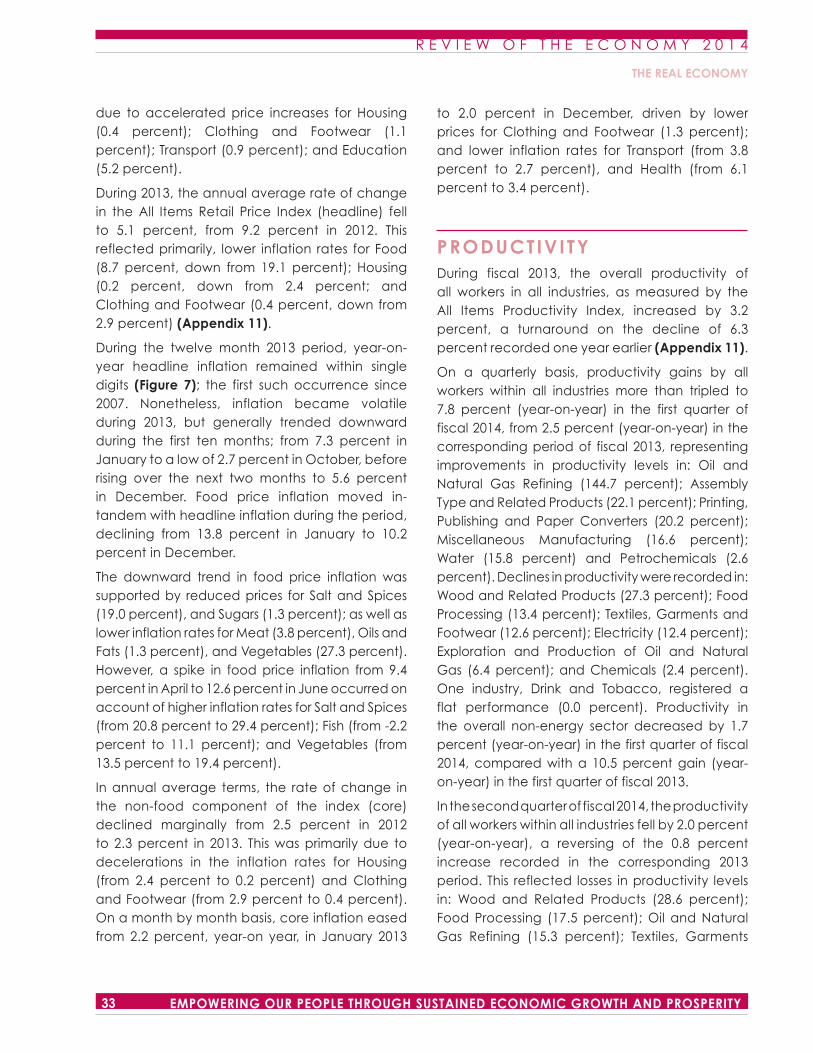
R E V I E W O F T H E E C O N O M Y 2 0 1 4
33 EMPOWERING OUR PEOPLE THROUGH SUSTAINED ECONOMIC GROWTH AND PROSPERITY
due to accelerated price increases for Housing (0.4 percent); Clothing and Footwear (1.1 percent); Transport (0.9 percent); and Education (5.2 percent).
During 2013, the annual average rate of change in the All Items Retail Price Index (headline) fell to 5.1 percent, from 9.2 percent in 2012. This reflected primarily, lower inflation rates for Food (8.7 percent, down from 19.1 percent); Housing (0.2 percent, down from 2.4 percent; and Clothing and Footwear (0.4 percent, down from 2.9 percent) (Appendix 11).
During the twelve month 2013 period, year-on-year headline inflation remained within single digits (Figure 7); the first such occurrence since 2007. Nonetheless, inflation became volatile during 2013, but generally trended downward during the first ten months; from 7.3 percent in January to a low of 2.7 percent in October, before rising over the next two months to 5.6 percent in December. Food price inflation moved in-tandem with headline inflation during the period, declining from 13.8 percent in January to 10.2 percent in December.
The downward trend in food price inflation was supported by reduced prices for Salt and Spices (19.0 percent), and Sugars (1.3 percent); as well as lower inflation rates for Meat (3.8 percent), Oils and Fats (1.3 percent), and Vegetables (27.3 percent). However, a spike in food price inflation from 9.4 percent in April to 12.6 percent in June occurred on account of higher inflation rates for Salt and Spices (from 20.8 percent to 29.4 percent); Fish (from -2.2 percent to 11.1 percent); and Vegetables (from 13.5 percent to 19.4 percent).
In annual average terms, the rate of change in the non-food component of the index (core) declined marginally from 2.5 percent in 2012 to 2.3 percent in 2013. This was primarily due to decelerations in the inflation rates for Housing (from 2.4 percent to 0.2 percent) and Clothing and Footwear (from 2.9 percent to 0.4 percent). On a month by month basis, core inflation eased from 2.2 percent, year-on year, in January 2013
to 2.0 percent in December, driven by lower prices for Clothing and Footwear (1.3 percent); and lower inflation rates for Transport (from 3.8 percent to 2.7 percent), and Health (from 6.1 percent to 3.4 percent).
PRODUCTIVITYDuring fiscal 2013, the overall productivity of all workers in all industries, as measured by the All Items Productivity Index, increased by 3.2 percent, a turnaround on the decline of 6.3 percent recorded one year earlier (Appendix 11).
On a quarterly basis, productivity gains by all workers within all industries more than tripled to 7.8 percent (year-on-year) in the first quarter of fiscal 2014, from 2.5 percent (year-on-year) in the corresponding period of fiscal 2013, representing improvements in productivity levels in: Oil and Natural Gas Refining (144.7 percent); Assembly Type and Related Products (22.1 percent); Printing, Publishing and Paper Converters (20.2 percent); Miscellaneous Manufacturing (16.6 percent); Water (15.8 percent) and Petrochemicals (2.6 percent). Declines in productivity were recorded in: Wood and Related Products (27.3 percent); Food Processing (13.4 percent); Textiles, Garments and Footwear (12.6 percent); Electricity (12.4 percent); Exploration and Production of Oil and Natural Gas (6.4 percent); and Chemicals (2.4 percent). One industry, Drink and Tobacco, registered a flat performance (0.0 percent). Productivity in the overall non-energy sector decreased by 1.7 percent (year-on-year) in the first quarter of fiscal 2014, compared with a 10.5 percent gain (year-on-year) in the first quarter of fiscal 2013.
In the second quarter of fiscal 2014, the productivity of all workers within all industries fell by 2.0 percent (year-on-year), a reversing of the 0.8 percent increase recorded in the corresponding 2013 period. This reflected losses in productivity levels in: Wood and Related Products (28.6 percent); Food Processing (17.5 percent); Oil and Natural Gas Refining (15.3 percent); Textiles, Garments
THE REAL ECONOMY
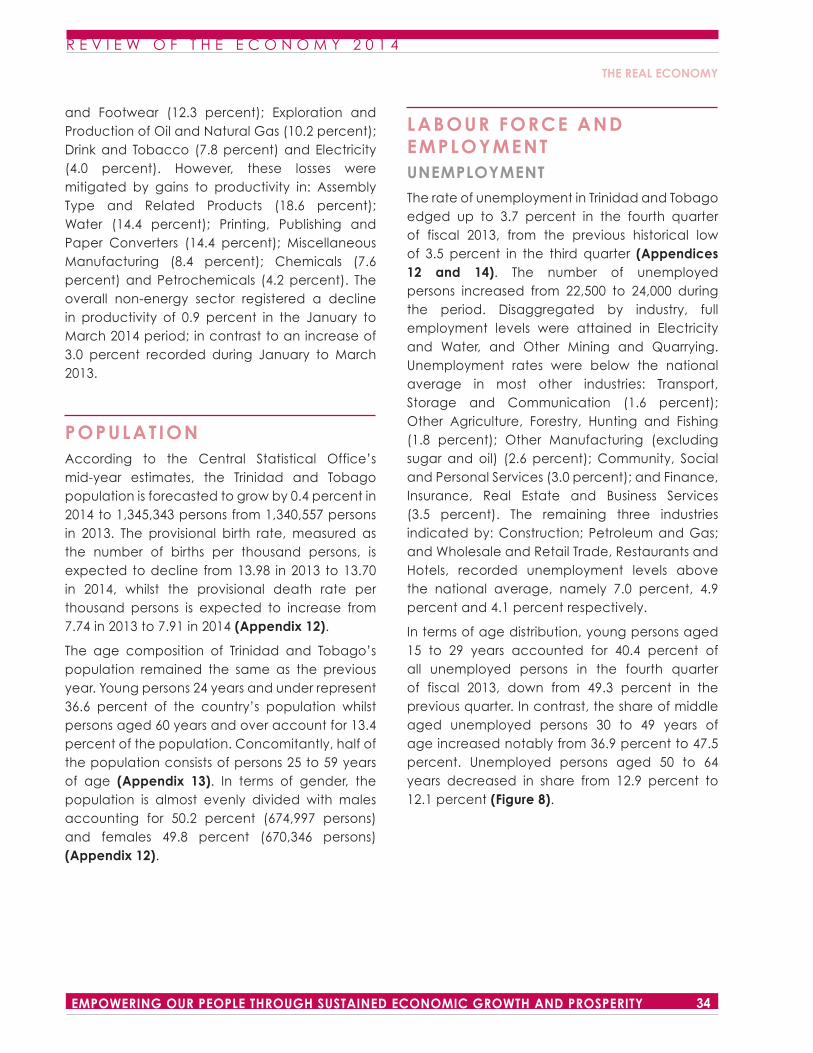
R E V I E W O F T H E E C O N O M Y 2 0 1 4
34EMPOWERING OUR PEOPLE THROUGH SUSTAINED ECONOMIC GROWTH AND PROSPERITY
and Footwear (12.3 percent); Exploration and Production of Oil and Natural Gas (10.2 percent); Drink and Tobacco (7.8 percent) and Electricity (4.0 percent). However, these losses were mitigated by gains to productivity in: Assembly Type and Related Products (18.6 percent); Water (14.4 percent); Printing, Publishing and Paper Converters (14.4 percent); Miscellaneous Manufacturing (8.4 percent); Chemicals (7.6 percent) and Petrochemicals (4.2 percent). The overall non-energy sector registered a decline in productivity of 0.9 percent in the January to March 2014 period; in contrast to an increase of 3.0 percent recorded during January to March 2013.
POPULATIONAccording to the Central Statistical Office’s mid-year estimates, the Trinidad and Tobago population is forecasted to grow by 0.4 percent in 2014 to 1,345,343 persons from 1,340,557 persons in 2013. The provisional birth rate, measured as the number of births per thousand persons, is expected to decline from 13.98 in 2013 to 13.70 in 2014, whilst the provisional death rate per thousand persons is expected to increase from 7.74 in 2013 to 7.91 in 2014 (Appendix 12).
The age composition of Trinidad and Tobago’s population remained the same as the previous year. Young persons 24 years and under represent 36.6 percent of the country’s population whilst persons aged 60 years and over account for 13.4 percent of the population. Concomitantly, half of the population consists of persons 25 to 59 years of age (Appendix 13). In terms of gender, the population is almost evenly divided with males accounting for 50.2 percent (674,997 persons) and females 49.8 percent (670,346 persons) (Appendix 12).
LABOUR FORCE AND EMPLOYMENTUNEMPLOYMENT
The rate of unemployment in Trinidad and Tobago edged up to 3.7 percent in the fourth quarter of fiscal 2013, from the previous historical low of 3.5 percent in the third quarter (Appendices 12 and 14). The number of unemployed persons increased from 22,500 to 24,000 during the period. Disaggregated by industry, full employment levels were attained in Electricity and Water, and Other Mining and Quarrying. Unemployment rates were below the national average in most other industries: Transport, Storage and Communication (1.6 percent); Other Agriculture, Forestry, Hunting and Fishing (1.8 percent); Other Manufacturing (excluding sugar and oil) (2.6 percent); Community, Social and Personal Services (3.0 percent); and Finance, Insurance, Real Estate and Business Services (3.5 percent). The remaining three industries indicated by: Construction; Petroleum and Gas; and Wholesale and Retail Trade, Restaurants and Hotels, recorded unemployment levels above the national average, namely 7.0 percent, 4.9 percent and 4.1 percent respectively.
In terms of age distribution, young persons aged 15 to 29 years accounted for 40.4 percent of all unemployed persons in the fourth quarter of fiscal 2013, down from 49.3 percent in the previous quarter. In contrast, the share of middle aged unemployed persons 30 to 49 years of age increased notably from 36.9 percent to 47.5 percent. Unemployed persons aged 50 to 64 years decreased in share from 12.9 percent to 12.1 percent (Figure 8).
THE REAL ECONOMY
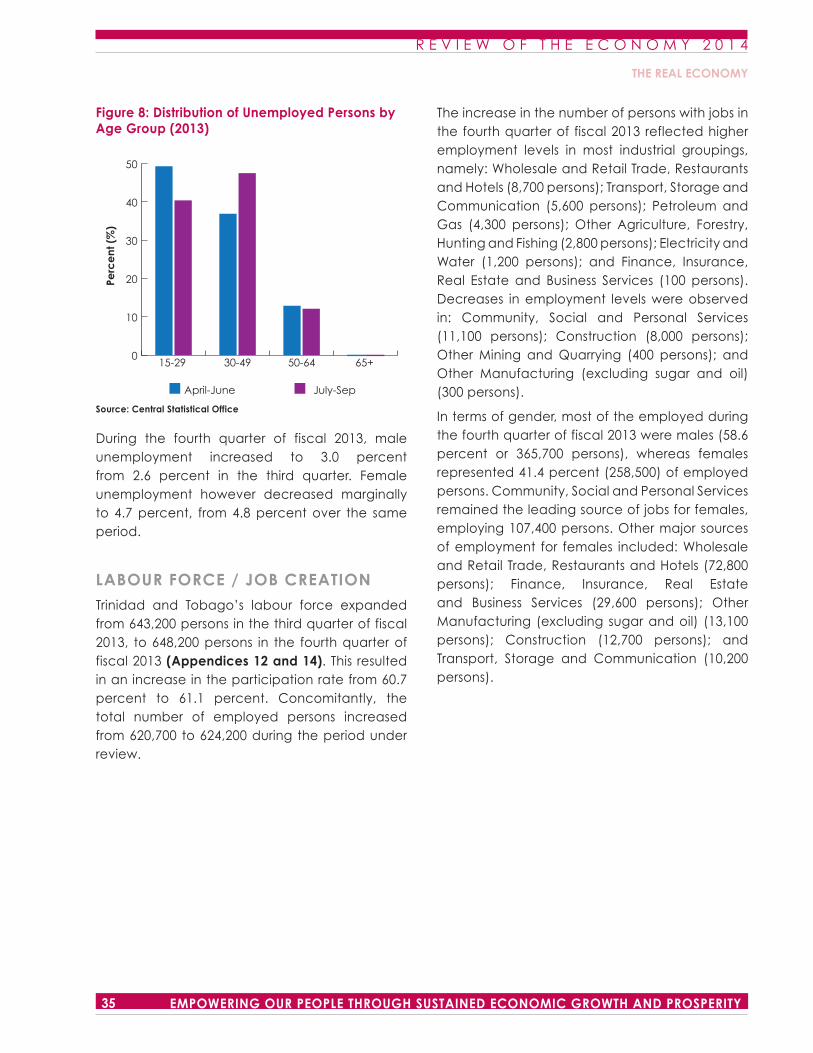
R E V I E W O F T H E E C O N O M Y 2 0 1 4
35 EMPOWERING OUR PEOPLE THROUGH SUSTAINED ECONOMIC GROWTH AND PROSPERITY
Figure 8: Distribution of Unemployed Persons by Age Group (2013)
Source: Central Statistical Office
During the fourth quarter of fiscal 2013, male unemployment increased to 3.0 percent from 2.6 percent in the third quarter. Female unemployment however decreased marginally to 4.7 percent, from 4.8 percent over the same period.
LABOUR FORCE / JOB CREATION
Trinidad and Tobago’s labour force expanded from 643,200 persons in the third quarter of fiscal 2013, to 648,200 persons in the fourth quarter of fiscal 2013 (Appendices 12 and 14). This resulted in an increase in the participation rate from 60.7 percent to 61.1 percent. Concomitantly, the total number of employed persons increased from 620,700 to 624,200 during the period under review.
0
10
20
30
40
50
15-29 30-49 50-64 65+
April-June July-Sep
Perc
ent
(%
)The increase in the number of persons with jobs in the fourth quarter of fiscal 2013 reflected higher employment levels in most industrial groupings, namely: Wholesale and Retail Trade, Restaurants and Hotels (8,700 persons); Transport, Storage and Communication (5,600 persons); Petroleum and Gas (4,300 persons); Other Agriculture, Forestry, Hunting and Fishing (2,800 persons); Electricity and Water (1,200 persons); and Finance, Insurance, Real Estate and Business Services (100 persons). Decreases in employment levels were observed in: Community, Social and Personal Services (11,100 persons); Construction (8,000 persons); Other Mining and Quarrying (400 persons); and Other Manufacturing (excluding sugar and oil) (300 persons).
In terms of gender, most of the employed during the fourth quarter of fiscal 2013 were males (58.6 percent or 365,700 persons), whereas females represented 41.4 percent (258,500) of employed persons. Community, Social and Personal Services remained the leading source of jobs for females, employing 107,400 persons. Other major sources of employment for females included: Wholesale and Retail Trade, Restaurants and Hotels (72,800 persons); Finance, Insurance, Real Estate and Business Services (29,600 persons); Other Manufacturing (excluding sugar and oil) (13,100 persons); Construction (12,700 persons); and Transport, Storage and Communication (10,200 persons).
THE REAL ECONOMY
R E V I E W O F T H E E C O N O M Y 2 0 1 4
36EMPOWERING OUR PEOPLE THROUGH SUSTAINED ECONOMIC GROWTH AND PROSPERITY
OVERVIEWThe budget for fiscal 2014 was originally premised on an average oil price of US$80 per barrel of crude and a natural gas price of US$2.75 per metric cubic feet (mcf). Total Revenue and Grants were estimated at $55,005.4 million or 32.1 percent of Gross Domestic Product (GDP).13 Current Revenue was expected to contribute 98.1 percent of Total Revenue and Grants, while Capital Revenue, inclusive of Grants, was expected to contribute 1.9 percent. With Total Expenditure and Net Lending estimated at $61,362.5 million or 35.8 percent of GDP, the projected budget deficit was $6,357.1 million or 3.7 percent of GDP for fiscal 2014. Additionally, a Current Account Balance of $1,243.7 million was anticipated.
Based on Mid-Year Revised projections for fiscal 2014, the Central Government’s fiscal operations were expected to culminate in an Overall Deficit of $5,866.7 million or 3.4 percent of GDPTotal Revenue and Grants were expected to increase from the budgeted estimate to $59,542.7 million or 34.8 percent of GDP, while Total Expenditure and Net Lending were estimated at $65,409.4 million or 38.2 percent of GDP. On the Current Account, a
13 Budget 2014 as well as mid-year revised estimates for 2014 based on fiscal 2013 GDP.
surplus of $3,203.5 million was projected. Budgetary estimates for average oil and natural gas prices remained unchanged at US$80 per barrel of crude and US$2.75 per mcf of gas respectively.
According to revised estimates for fiscal 2014, the Central Government’s operations are expected to result in an Overall Deficit of $4,876.6 million or 2.7 percent of GDP. Total Revenue and Grants are anticipated to amount to $59,911.7 million or 33.5 percent of GDP14. while Total Expenditure and Net Lending is estimated at $64,788.3 million or 36.2 percent of GDP. A $3,634.4 million surplus is expected on the Current Account.
At September 30, 2013, the Heritage and Stabilisation Fund (HSF) stood at US$5,150.7 million. Although no transfers were made to the fund during the first nine months of fiscal 2014, the Net Asset Value of the Fund as at June 30, 2014 had appreciated to US$5,563.3 million.
14 Revised estimates for 2014 based on fiscal 2014 GDP.
C E N T R A L G O V E R N M E N T O P E R AT I O N S
Overview
Revenue
Expenditure
Financing
Public Debt and Debt Service
Trinidad and Tobago Credit Ratings
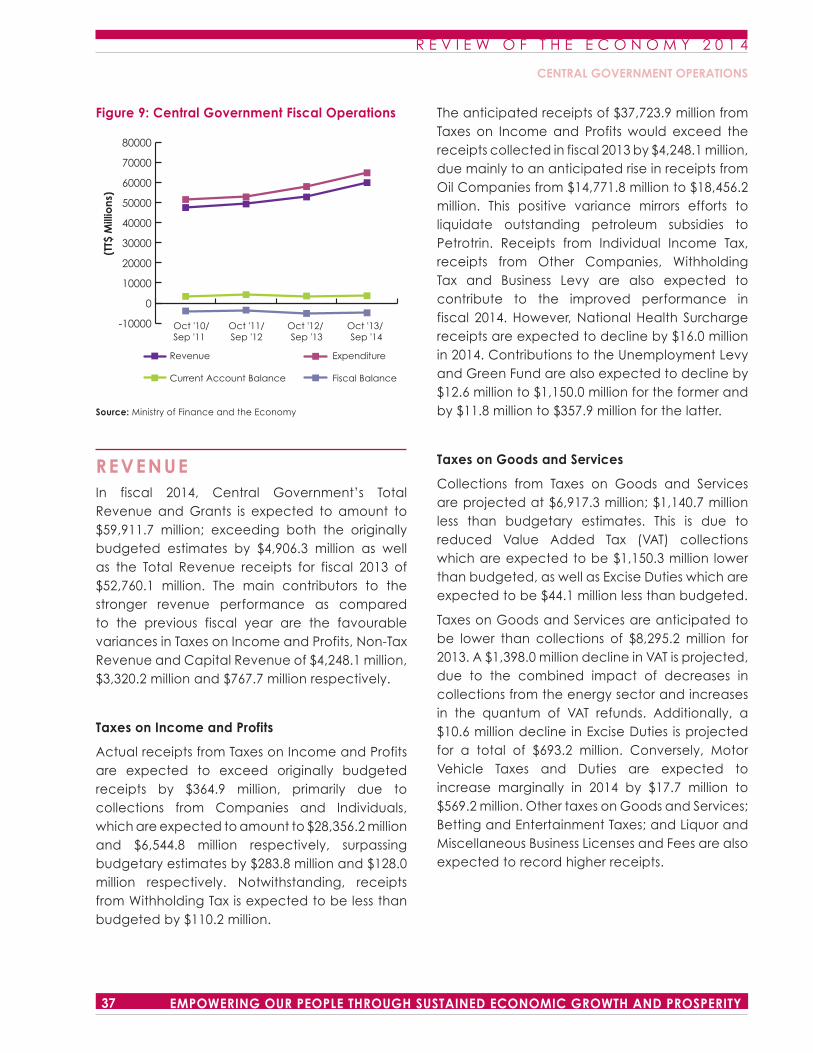
R E V I E W O F T H E E C O N O M Y 2 0 1 4
37 EMPOWERING OUR PEOPLE THROUGH SUSTAINED ECONOMIC GROWTH AND PROSPERITY
Figure 9: Central Government Fiscal Operations
Source: Ministry of Finance and the Economy
REVENUEIn fiscal 2014, Central Government’s Total Revenue and Grants is expected to amount to $59,911.7 million; exceeding both the originally budgeted estimates by $4,906.3 million as well as the Total Revenue receipts for fiscal 2013 of $52,760.1 million. The main contributors to the stronger revenue performance as compared to the previous fiscal year are the favourable variances in Taxes on Income and Profits, Non-Tax Revenue and Capital Revenue of $4,248.1 million, $3,320.2 million and $767.7 million respectively.
Taxes on Income and Profits
Actual receipts from Taxes on Income and Profits are expected to exceed originally budgeted receipts by $364.9 million, primarily due to collections from Companies and Individuals, which are expected to amount to $28,356.2 million and $6,544.8 million respectively, surpassing budgetary estimates by $283.8 million and $128.0 million respectively. Notwithstanding, receipts from Withholding Tax is expected to be less than budgeted by $110.2 million.
Revenue Expenditure
Current Account Balance Fiscal Balance
-10000
0
10000
20000
30000
40000
50000
60000
70000
80000
Oct '10/ Oct '11/ Oct '12/ Oct '13/ Sep '11 Sep '12 Sep '13 Sep '14
(TT$
Mill
ions
)The anticipated receipts of $37,723.9 million from Taxes on Income and Profits would exceed the receipts collected in fiscal 2013 by $4,248.1 million, due mainly to an anticipated rise in receipts from Oil Companies from $14,771.8 million to $18,456.2 million. This positive variance mirrors efforts to liquidate outstanding petroleum subsidies to Petrotrin. Receipts from Individual Income Tax, receipts from Other Companies, Withholding Tax and Business Levy are also expected to contribute to the improved performance in fiscal 2014. However, National Health Surcharge receipts are expected to decline by $16.0 million in 2014. Contributions to the Unemployment Levy and Green Fund are also expected to decline by $12.6 million to $1,150.0 million for the former and by $11.8 million to $357.9 million for the latter.
Taxes on Goods and Services
Collections from Taxes on Goods and Services are projected at $6,917.3 million; $1,140.7 million less than budgetary estimates. This is due to reduced Value Added Tax (VAT) collections which are expected to be $1,150.3 million lower than budgeted, as well as Excise Duties which are expected to be $44.1 million less than budgeted.
Taxes on Goods and Services are anticipated to be lower than collections of $8,295.2 million for 2013. A $1,398.0 million decline in VAT is projected, due to the combined impact of decreases in collections from the energy sector and increases in the quantum of VAT refunds. Additionally, a $10.6 million decline in Excise Duties is projected for a total of $693.2 million. Conversely, Motor Vehicle Taxes and Duties are expected to increase marginally in 2014 by $17.7 million to $569.2 million. Other taxes on Goods and Services; Betting and Entertainment Taxes; and Liquor and Miscellaneous Business Licenses and Fees are also expected to record higher receipts.
CENTRAL GOVERNMENT OPERATIONS
R E V I E W O F T H E E C O N O M Y 2 0 1 4
38EMPOWERING OUR PEOPLE THROUGH SUSTAINED ECONOMIC GROWTH AND PROSPERITY
Taxes on International Trade
Collections from Taxes on International Trade, consisting mainly of Import Duties, are estimated at $196.8 million higher than originally budgeted; a 6.0 percent improvement over collections received in fiscal 2013. Expected receipts from Taxes on International Trade will amount to $2,744.1 million.
Additionally, collections of Other Taxes, namely Stamp Duties, are expected to amount to $279.0 million, representing an increase of $33.3 million from fiscal 2013.
Taxes on Property
The expected outturn of $41.0 million on Taxes on Property is $0.6 million less than the budgeted estimate for 2014 and also $3.8 million less than the fiscal year 2013 receipts. Taxes on Property continue to be minimal as no legislation to resume the collection of Land and Building Taxes has been put in place.
Non-Tax Revenue
The expected receipts in Non-Tax Revenue are anticipated to be more than its budgetary estimate for the 2014 fiscal year. This $5,218.7 million variance reflects higher-than-originally-budgeted Profits from Non-Financial Enterprises of $4,455.5 million. Non-Tax Receipts are expected to amount to $10,937.3 million in 2014, representing a 43.6 percent increase over last fiscal year’s collections of $7,617.1 million. This improved performance reflects higher dividend payments of $3.4 billion from the National Gas Company, resulting in an expected rise in overall Profits from Non-Financial Enterprises by 187.0 percent to $6,193.3 million. Overall receipts from
Non-Financial Enterprises were also impacted by a $70.3 million increase in profits from the National Lotteries Control Board in 2014. Collections under Administrative Fees and Charges are expected to increase by 39.1 percent to $726.6 million in 2014, accounting for the projected increase of deposits from the Water and Sewage Authority (WASA), arising out of its collection of water improvement rates on behalf of the government. Anticipated receipt from Royalties on oil is $2,443.8 million; $62.8 million more than was collected in fiscal 2013.
Under Non-Tax Revenues, declines are expected in revenues from Other Non-Tax Revenue; Profits from Financial Enterprises; Interest Income and Non-Industrial Sales. In 2014, Other Non-Tax Revenue is anticipated to decline by 41.4 percent ($1,132.3 million) as the share of profits from Oil Companies (through Production Sharing Contracts) is expected to register a decline of $100.0 million. Additionally, Profits from Financial Enterprises; Interest Income and Non-Industrial Sales are anticipated to decline to $403.1 million; $19.4 million and $18.8 million respectively.
Capital Revenue
For fiscal 2014, Capital Revenue receipts are expected to surpass both the budgeted expectation for 2014 (by $237.8 million), as well as Capital Revenue receipts in the previous fiscal year (by $ 767.7 million). Grants, a major component of Capital Revenue, are expected to increase by 55.7 percent, from $82.0 million in 2013 to $127.7 million in 2014, resulting from unanticipated grant funding received under the European Union Financing Agreement for Accompanying Measures for Sugar Protocol Countries.
CENTRAL GOVERNMENT OPERATIONS
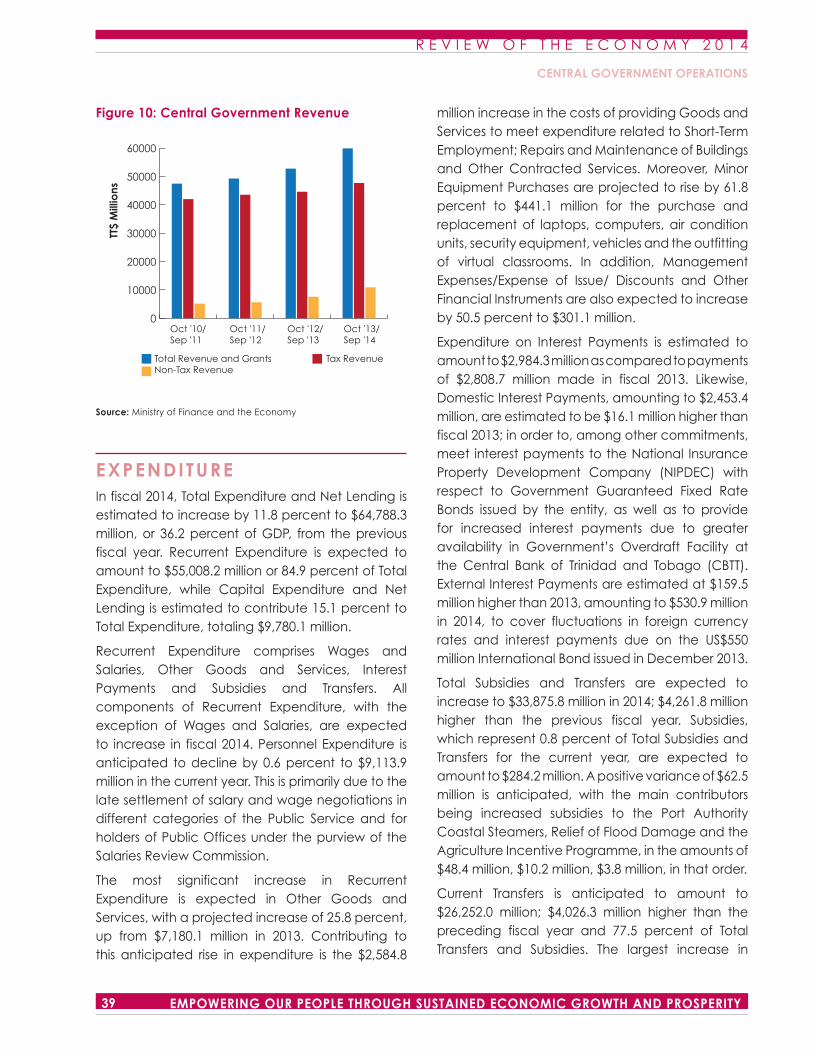
R E V I E W O F T H E E C O N O M Y 2 0 1 4
39 EMPOWERING OUR PEOPLE THROUGH SUSTAINED ECONOMIC GROWTH AND PROSPERITY
Figure 10: Central Government Revenue
Source: Ministry of Finance and the Economy
EXPENDITUREIn fiscal 2014, Total Expenditure and Net Lending is estimated to increase by 11.8 percent to $64,788.3 million, or 36.2 percent of GDP, from the previous fiscal year. Recurrent Expenditure is expected to amount to $55,008.2 million or 84.9 percent of Total Expenditure, while Capital Expenditure and Net Lending is estimated to contribute 15.1 percent to Total Expenditure, totaling $9,780.1 million.
Recurrent Expenditure comprises Wages and Salaries, Other Goods and Services, Interest Payments and Subsidies and Transfers. All components of Recurrent Expenditure, with the exception of Wages and Salaries, are expected to increase in fiscal 2014. Personnel Expenditure is anticipated to decline by 0.6 percent to $9,113.9 million in the current year. This is primarily due to the late settlement of salary and wage negotiations in different categories of the Public Service and for holders of Public Offices under the purview of the Salaries Review Commission.
The most significant increase in Recurrent Expenditure is expected in Other Goods and Services, with a projected increase of 25.8 percent, up from $7,180.1 million in 2013. Contributing to this anticipated rise in expenditure is the $2,584.8
Total Revenue and Grants Tax RevenueNon-Tax Revenue
0
10000
20000
30000
40000
50000
60000
TT$
Mill
ions
Oct '10/ Oct '11/ Oct '12/ Oct '13/ Sep '11 Sep '12 Sep '13 Sep '14
million increase in the costs of providing Goods and Services to meet expenditure related to Short-Term Employment; Repairs and Maintenance of Buildings and Other Contracted Services. Moreover, Minor Equipment Purchases are projected to rise by 61.8 percent to $441.1 million for the purchase and replacement of laptops, computers, air condition units, security equipment, vehicles and the outfitting of virtual classrooms. In addition, Management Expenses/Expense of Issue/ Discounts and Other Financial Instruments are also expected to increase by 50.5 percent to $301.1 million.
Expenditure on Interest Payments is estimated to amount to $2,984.3 million as compared to payments of $2,808.7 million made in fiscal 2013. Likewise, Domestic Interest Payments, amounting to $2,453.4 million, are estimated to be $16.1 million higher than fiscal 2013; in order to, among other commitments, meet interest payments to the National Insurance Property Development Company (NIPDEC) with respect to Government Guaranteed Fixed Rate Bonds issued by the entity, as well as to provide for increased interest payments due to greater availability in Government’s Overdraft Facility at the Central Bank of Trinidad and Tobago (CBTT). External Interest Payments are estimated at $159.5 million higher than 2013, amounting to $530.9 million in 2014, to cover fluctuations in foreign currency rates and interest payments due on the US$550 million International Bond issued in December 2013.
Total Subsidies and Transfers are expected to increase to $33,875.8 million in 2014; $4,261.8 million higher than the previous fiscal year. Subsidies, which represent 0.8 percent of Total Subsidies and Transfers for the current year, are expected to amount to $284.2 million. A positive variance of $62.5 million is anticipated, with the main contributors being increased subsidies to the Port Authority Coastal Steamers, Relief of Flood Damage and the Agriculture Incentive Programme, in the amounts of $48.4 million, $10.2 million, $3.8 million, in that order.
Current Transfers is anticipated to amount to $26,252.0 million; $4,026.3 million higher than the preceding fiscal year and 77.5 percent of Total Transfers and Subsidies. The largest increase in
CENTRAL GOVERNMENT OPERATIONS
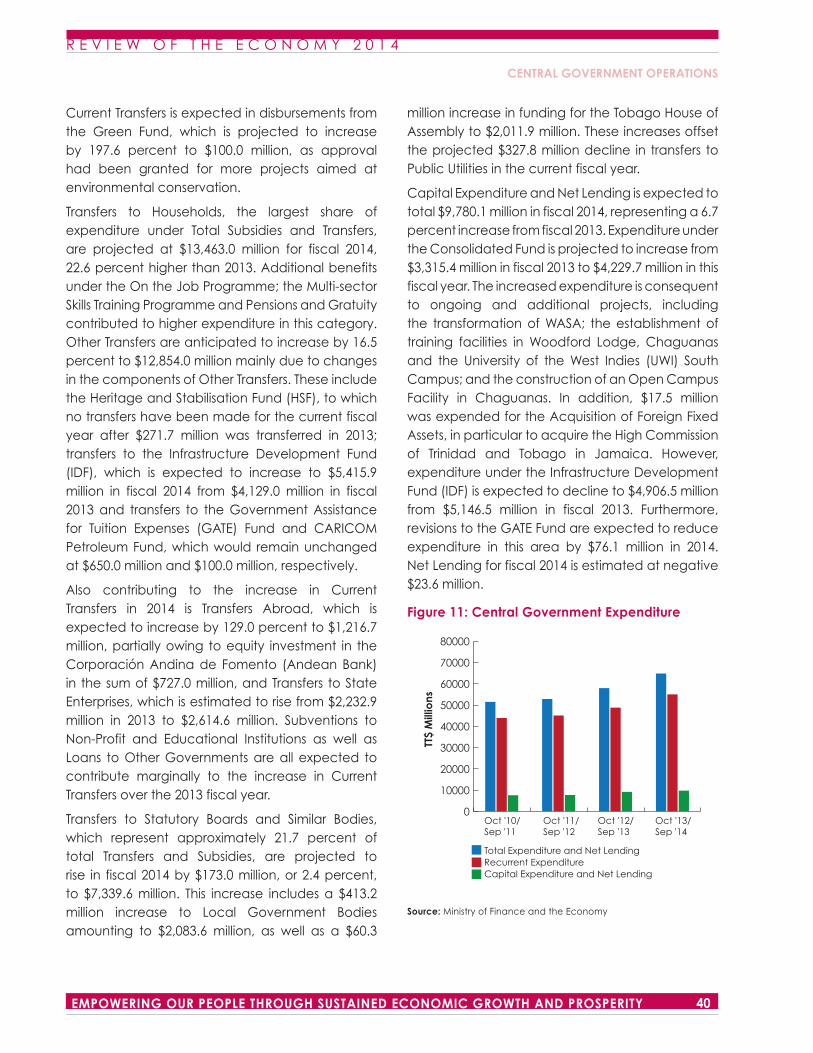
R E V I E W O F T H E E C O N O M Y 2 0 1 4
40EMPOWERING OUR PEOPLE THROUGH SUSTAINED ECONOMIC GROWTH AND PROSPERITY
Current Transfers is expected in disbursements from the Green Fund, which is projected to increase by 197.6 percent to $100.0 million, as approval had been granted for more projects aimed at environmental conservation.
Transfers to Households, the largest share of expenditure under Total Subsidies and Transfers, are projected at $13,463.0 million for fiscal 2014, 22.6 percent higher than 2013. Additional benefits under the On the Job Programme; the Multi-sector Skills Training Programme and Pensions and Gratuity contributed to higher expenditure in this category. Other Transfers are anticipated to increase by 16.5 percent to $12,854.0 million mainly due to changes in the components of Other Transfers. These include the Heritage and Stabilisation Fund (HSF), to which no transfers have been made for the current fiscal year after $271.7 million was transferred in 2013; transfers to the Infrastructure Development Fund (IDF), which is expected to increase to $5,415.9 million in fiscal 2014 from $4,129.0 million in fiscal 2013 and transfers to the Government Assistance for Tuition Expenses (GATE) Fund and CARICOM Petroleum Fund, which would remain unchanged at $650.0 million and $100.0 million, respectively.
Also contributing to the increase in Current Transfers in 2014 is Transfers Abroad, which is expected to increase by 129.0 percent to $1,216.7 million, partially owing to equity investment in the Corporación Andina de Fomento (Andean Bank) in the sum of $727.0 million, and Transfers to State Enterprises, which is estimated to rise from $2,232.9 million in 2013 to $2,614.6 million. Subventions to Non-Profit and Educational Institutions as well as Loans to Other Governments are all expected to contribute marginally to the increase in Current Transfers over the 2013 fiscal year.
Transfers to Statutory Boards and Similar Bodies, which represent approximately 21.7 percent of total Transfers and Subsidies, are projected to rise in fiscal 2014 by $173.0 million, or 2.4 percent, to $7,339.6 million. This increase includes a $413.2 million increase to Local Government Bodies amounting to $2,083.6 million, as well as a $60.3
million increase in funding for the Tobago House of Assembly to $2,011.9 million. These increases offset the projected $327.8 million decline in transfers to Public Utilities in the current fiscal year.
Capital Expenditure and Net Lending is expected to total $9,780.1 million in fiscal 2014, representing a 6.7 percent increase from fiscal 2013. Expenditure under the Consolidated Fund is projected to increase from $3,315.4 million in fiscal 2013 to $4,229.7 million in this fiscal year. The increased expenditure is consequent to ongoing and additional projects, including the transformation of WASA; the establishment of training facilities in Woodford Lodge, Chaguanas and the University of the West Indies (UWI) South Campus; and the construction of an Open Campus Facility in Chaguanas. In addition, $17.5 million was expended for the Acquisition of Foreign Fixed Assets, in particular to acquire the High Commission of Trinidad and Tobago in Jamaica. However, expenditure under the Infrastructure Development Fund (IDF) is expected to decline to $4,906.5 million from $5,146.5 million in fiscal 2013. Furthermore, revisions to the GATE Fund are expected to reduce expenditure in this area by $76.1 million in 2014. Net Lending for fiscal 2014 is estimated at negative $23.6 million.
Figure 11: Central Government Expenditure
Source: Ministry of Finance and the Economy
Total Expenditure and Net LendingRecurrent ExpenditureCapital Expenditure and Net Lending
0
10000
20000
30000
40000
50000
60000
70000
80000
Oct '10/ Oct '11/ Oct '12/ Oct '13/Sep '11 Sep '12 Sep '13 Sep '14
TT$
Mill
ions
CENTRAL GOVERNMENT OPERATIONS
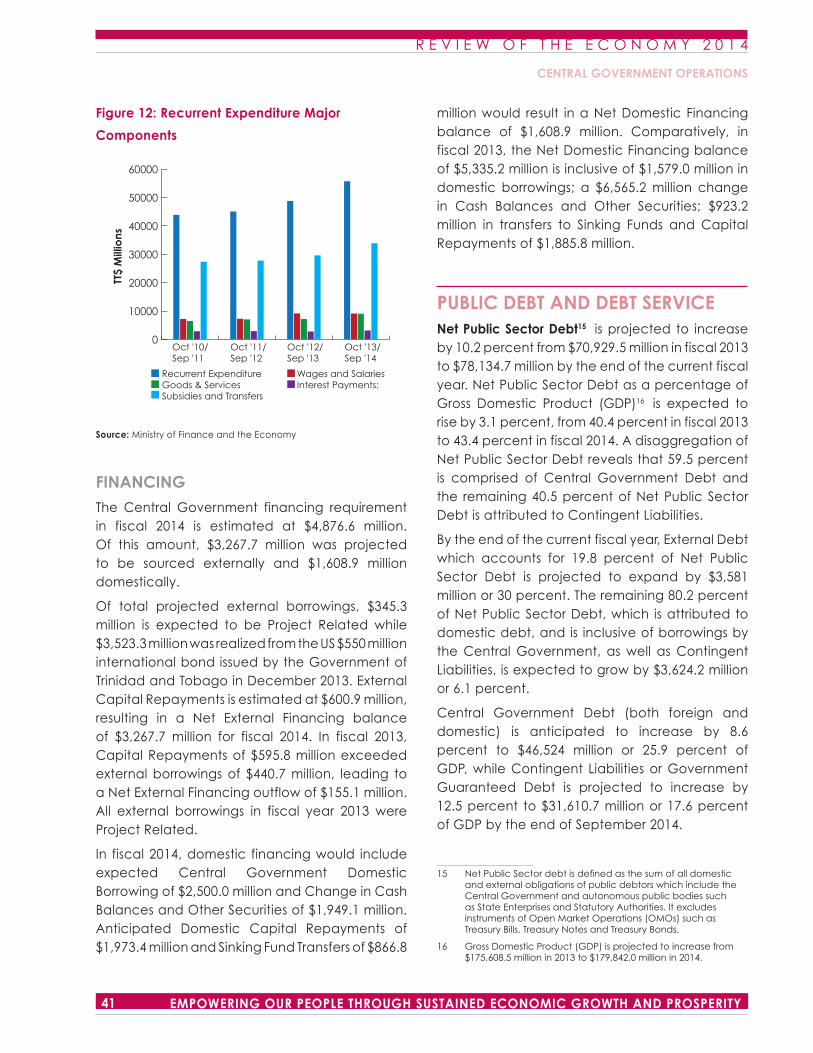
R E V I E W O F T H E E C O N O M Y 2 0 1 4
41 EMPOWERING OUR PEOPLE THROUGH SUSTAINED ECONOMIC GROWTH AND PROSPERITY
Figure 12: Recurrent Expenditure Major
Components
Source: Ministry of Finance and the Economy
FINANCING
The Central Government financing requirement in fiscal 2014 is estimated at $4,876.6 million. Of this amount, $3,267.7 million was projected to be sourced externally and $1,608.9 million domestically.
Of total projected external borrowings, $345.3 million is expected to be Project Related while $3,523.3 million was realized from the US $550 million international bond issued by the Government of Trinidad and Tobago in December 2013. External Capital Repayments is estimated at $600.9 million, resulting in a Net External Financing balance of $3,267.7 million for fiscal 2014. In fiscal 2013, Capital Repayments of $595.8 million exceeded external borrowings of $440.7 million, leading to a Net External Financing outflow of $155.1 million. All external borrowings in fiscal year 2013 were Project Related.
In fiscal 2014, domestic financing would include expected Central Government Domestic Borrowing of $2,500.0 million and Change in Cash Balances and Other Securities of $1,949.1 million. Anticipated Domestic Capital Repayments of $1,973.4 million and Sinking Fund Transfers of $866.8
Recurrent Expenditure Wages and SalariesGoods & Services Interest Payments:Subsidies and Transfers
0
10000
20000
30000
40000
50000
60000
Oct '10/ Oct '11/ Oct '12/ Oct '13/Sep '11 Sep '12 Sep '13 Sep '14
TT$
Mill
ions
million would result in a Net Domestic Financing balance of $1,608.9 million. Comparatively, in fiscal 2013, the Net Domestic Financing balance of $5,335.2 million is inclusive of $1,579.0 million in domestic borrowings; a $6,565.2 million change in Cash Balances and Other Securities; $923.2 million in transfers to Sinking Funds and Capital Repayments of $1,885.8 million.
PUBLIC DEBT AND DEBT SERVICENet Public Sector Debt1512is projected to increase by 10.2 percent from $70,929.5 million in fiscal 2013 to $78,134.7 million by the end of the current fiscal year. Net Public Sector Debt as a percentage of Gross Domestic Product (GDP)16 is expected to rise by 3.1 percent, from 40.4 percent in fiscal 2013 to 43.4 percent in fiscal 2014. A disaggregation of Net Public Sector Debt reveals that 59.5 percent is comprised of Central Government Debt and the remaining 40.5 percent of Net Public Sector Debt is attributed to Contingent Liabilities.
By the end of the current fiscal year, External Debt which accounts for 19.8 percent of Net Public Sector Debt is projected to expand by $3,581 million or 30 percent. The remaining 80.2 percent of Net Public Sector Debt, which is attributed to domestic debt, and is inclusive of borrowings by the Central Government, as well as Contingent Liabilities, is expected to grow by $3,624.2 million or 6.1 percent.
Central Government Debt (both foreign and domestic) is anticipated to increase by 8.6 percent to $46,524 million or 25.9 percent of GDP, while Contingent Liabilities or Government Guaranteed Debt is projected to increase by 12.5 percent to $31,610.7 million or 17.6 percent of GDP by the end of September 2014.
15 Net Public Sector debt is defined as the sum of all domestic and external obligations of public debtors which include the Central Government and autonomous public bodies such as State Enterprises and Statutory Authorities. It excludes instruments of Open Market Operations (OMOs) such as Treasury Bills, Treasury Notes and Treasury Bonds.
16 Gross Domestic Product (GDP) is projected to increase from $175,608.5 million in 2013 to $179,842.0 million in 2014.
CENTRAL GOVERNMENT OPERATIONS
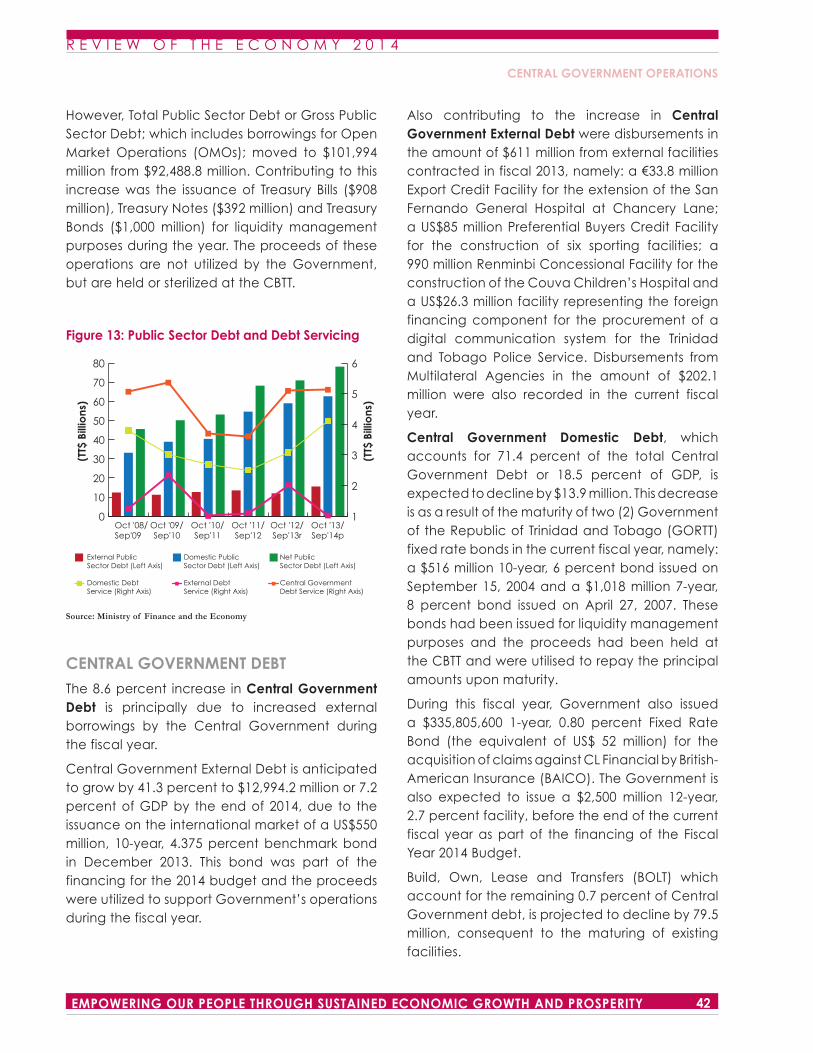
R E V I E W O F T H E E C O N O M Y 2 0 1 4
42EMPOWERING OUR PEOPLE THROUGH SUSTAINED ECONOMIC GROWTH AND PROSPERITY
However, Total Public Sector Debt or Gross Public Sector Debt; which includes borrowings for Open Market Operations (OMOs); moved to $101,994 million from $92,488.8 million. Contributing to this increase was the issuance of Treasury Bills ($908 million), Treasury Notes ($392 million) and Treasury Bonds ($1,000 million) for liquidity management purposes during the year. The proceeds of these operations are not utilized by the Government, but are held or sterilized at the CBTT.
Figure 13: Public Sector Debt and Debt Servicing
Source: Ministry of Finance and the Economy
CENTRAL GOVERNMENT DEBT
The 8.6 percent increase in Central Government Debt is principally due to increased external borrowings by the Central Government during the fiscal year.
Central Government External Debt is anticipated to grow by 41.3 percent to $12,994.2 million or 7.2 percent of GDP by the end of 2014, due to the issuance on the international market of a US$550 million, 10-year, 4.375 percent benchmark bond in December 2013. This bond was part of the financing for the 2014 budget and the proceeds were utilized to support Government’s operations during the fiscal year.
External Public Domestic Public Net Public Sector Debt (Left Axis) Sector Debt (Left Axis) Sector Debt (Left Axis)
Domestic Debt External Debt Central Government Service (Right Axis) Service (Right Axis) Debt Service (Right Axis)
0
10
20
30
40
50
60
70
80
1
2
3
4
5
6
Oct '08/ Oct '09/ Oct '10/ Oct '11/ Oct '12/ Oct '13/Sep'09 Sep'10 Sep'11 Sep'12 Sep'13r Sep'14p
(TT$
Bill
ions
)
(TT$
Bill
ions
)
Also contributing to the increase in Central Government External Debt were disbursements in the amount of $611 million from external facilities contracted in fiscal 2013, namely: a €33.8 million Export Credit Facility for the extension of the San Fernando General Hospital at Chancery Lane; a US$85 million Preferential Buyers Credit Facility for the construction of six sporting facilities; a 990 million Renminbi Concessional Facility for the construction of the Couva Children’s Hospital and a US$26.3 million facility representing the foreign financing component for the procurement of a digital communication system for the Trinidad and Tobago Police Service. Disbursements from Multilateral Agencies in the amount of $202.1 million were also recorded in the current fiscal year.
Central Government Domestic Debt, which accounts for 71.4 percent of the total Central Government Debt or 18.5 percent of GDP, is expected to decline by $13.9 million. This decrease is as a result of the maturity of two (2) Government of the Republic of Trinidad and Tobago (GORTT) fixed rate bonds in the current fiscal year, namely: a $516 million 10-year, 6 percent bond issued on September 15, 2004 and a $1,018 million 7-year, 8 percent bond issued on April 27, 2007. These bonds had been issued for liquidity management purposes and the proceeds had been held at the CBTT and were utilised to repay the principal amounts upon maturity.
During this fiscal year, Government also issued a $335,805,600 1-year, 0.80 percent Fixed Rate Bond (the equivalent of US$ 52 million) for the acquisition of claims against CL Financial by British-American Insurance (BAICO). The Government is also expected to issue a $2,500 million 12-year, 2.7 percent facility, before the end of the current fiscal year as part of the financing of the Fiscal Year 2014 Budget.
Build, Own, Lease and Transfers (BOLT) which account for the remaining 0.7 percent of Central Government debt, is projected to decline by 79.5 million, consequent to the maturing of existing facilities.
CENTRAL GOVERNMENT OPERATIONS
R E V I E W O F T H E E C O N O M Y 2 0 1 4
43 EMPOWERING OUR PEOPLE THROUGH SUSTAINED ECONOMIC GROWTH AND PROSPERITY
CONTINGENT LIABILITIES
Contingent Liabilities, comprising both Letters of Guarantee issued and new Government Guaranteed debt is expected to rise by 12.5 percent or $3,502.8 million in fiscal 2014. This increase is principally due to the increase in Letters of Guarantees (formerly Letters of Comfort) by $2,311.2 million to $10,324.2 million in this fiscal year. Letters of Guarantee issued in respect of State Enterprises for the period under review, accounted for $1,492.8 million, whilst Statutory Authorities accounted for the remaining $818.4 million.
Letters of Guarantee issued to State Enterprises in this fiscal year is anticipated to increase by 24.7 percent from the previous fiscal year, to $7,527.4 million. During the fiscal year, Letters of Guarantee issued included: a $285.3 million 11- year, 2 percent bond issued by the Education Facilities Company Limited (EFCL) for cost variations in the construction of Early Childhood Care (ECCE) centres, primary and secondary schools, a $50 million 1.50 percent revolving term loan by the Export-Import Bank of Trinidad and Tobago to support the Bank’s core business and a US$15 million 3.49 percent revolving term loan by the National Flour Mills Limited (NFM) to fund routine grain/commodity purchases.
Three (3) financing facilities issued by the Urban Development Corporation of Trinidad and Tobago (UDeCOTT) also contributed to the increase in Letters of Guarantee for the current fiscal year, namely: a $500 million, 1-year, 0.60 percent facility and a $496 million, 2-year, 0.85 percent facility to finance the base building works and fit-out phase of the Government Campus Plaza; as well as a $227.14 million, 1-year, 0.51 percent facility to finance base building repair works and fit-out of the Ministry of Education Office Tower.
Letters of Guarantee issued to Statutory Authorities increased by 41.4 percent from fiscal 2013, to $2,796.8 million, as a result of the issuance of Letters of Guarantee in respect of borrowings by the National Carnival Commission (NCC) ($150
million, 1-year, 2.99 percent) to settle outstanding debts to contractors and suppliers of goods and services and finance expenditure related to Carnival 2014, and a $700 million increase in the Housing Development Company (HDC) existing Bridge Facility of $500 million, bringing the total facility to $1,200 million at a tenor of 6-months and a fixed interest rate of 1.75 percent to finance housing development projects by the Corporation.
It is anticipated that by the end of FY2013/2014, Guaranteed Debt (i.e. not including Letters of Guarantee or Letters of Comfort) will increase by 5.9 percent or $1,191.7 million. This expected rise in guaranteed debt is due to the issuance via the Central Bank e-auction system of a $1,500 million, 12-year, 2.85 percent facility by the National Infrastructure Development Company Limited (NIDCO) for the extension of the San Fernando Highway to Point Fortin; a $115 million, 11-year, 2.70 percent facility by the Rural Development Company of Trinidad and Tobago (RDC) for the construction and outfitting of the Princes Town Regional Corporation Complex; and a $151 million facility by NIPDEC for the expansion and refurbishment of the San Fernando Family Court.
There were no conversions of Letters of Guarantee to Government Guaranteed Debt, over the period under review.
DEBT SERVICE
During fiscal year 2014, Central Government Debt Service is estimated to increase by $38 million to $5,130.4 million. Domestic Debt Service, which accounts for 80 percent of total debt service, is estimated at $4,105.8 million for the year, an increase of $1,027.2 million (33.4 percent). This increase in Domestic Debt Service is as a result of the maturity of two (2) GORTT fixed rate bonds, namely: a $516 million, 10-year, 6 percent bond and a $1,018 million, 7-year, 8 percent bond. It should be noted that those bonds were issued for liquidity management purposes and the proceeds had been held at the CBTT and utilized to repay
CENTRAL GOVERNMENT OPERATIONS
R E V I E W O F T H E E C O N O M Y 2 0 1 4
44EMPOWERING OUR PEOPLE THROUGH SUSTAINED ECONOMIC GROWTH AND PROSPERITY
the outstanding principal amounts. External Debt Service is anticipated to be $1,024.7 million.
OPEN MARKET OPERATIONS1714
In December 2013, Parliament agreed to an amendment of the statutory borrowing limits under the Treasury Bills Act, Chap. 71:40 (from $15,000 million to $30,000 million) and Treasury Notes Act, Chap 71:39 (from $5,000 million to $15,000 million). Following the issuance of the Treasury Bills Legal Notice No. 252 and Treasury Notes Legal Notice No. 253 in December 2013, the CBTT was able to resume utilization of these short-term instruments for its open market operations. Accordingly, the quantum of Treasury Bills issued increased from $15,000 million to $15,908 million while Treasury Notes on issue, increased from $5,000 million to $5,392 million.
17 Open Market Operations are excluded in the calculation of Net Public Sector Debt but are included in the calculation of Gross Public Sector Debt.
In the current fiscal year, to further assist in domestic liquidity management, the Government issued a bond under the authority of the Treasury Bonds Act, 2008 Chap 71:43. The $1,000 million, 7-year, 2.20 percent bond, issued on June 27, 2014 was oversubscribed with total bids amounting to $2,144.19 million at an effective interest rate of 2 percent.
CENTRAL GOVERNMENT OPERATIONS
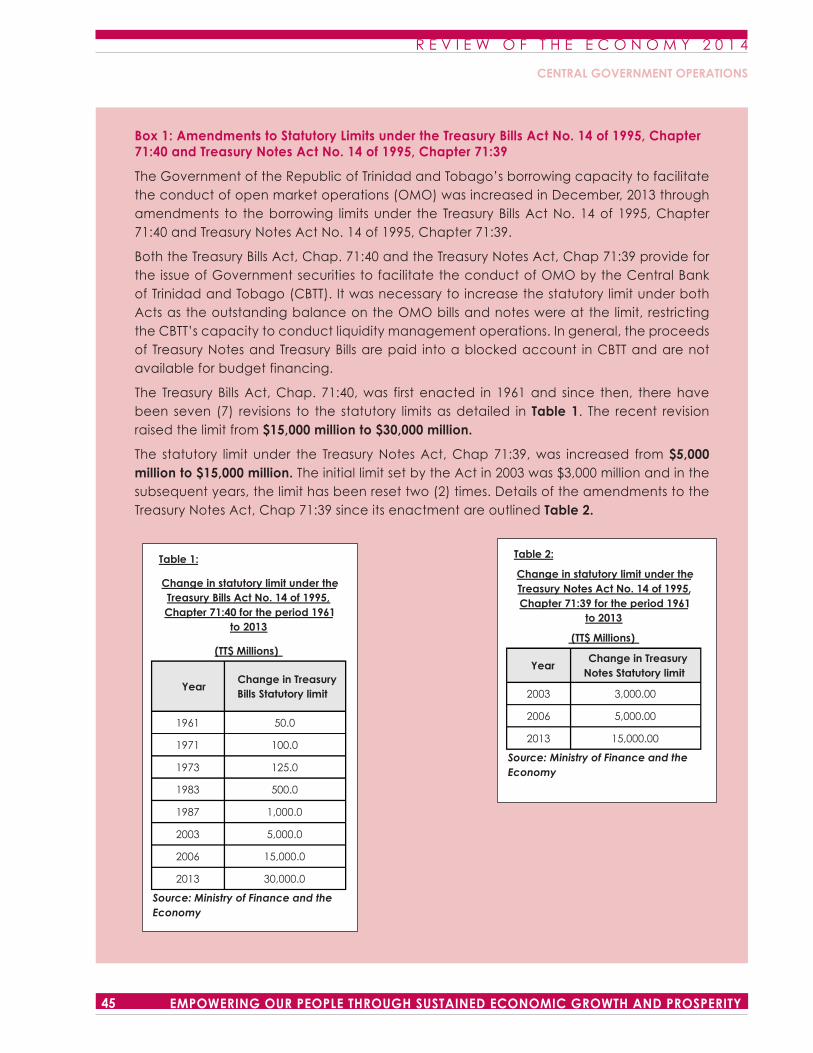
R E V I E W O F T H E E C O N O M Y 2 0 1 4
45 EMPOWERING OUR PEOPLE THROUGH SUSTAINED ECONOMIC GROWTH AND PROSPERITY
Box 1: Amendments to Statutory Limits under the Treasury Bills Act No. 14 of 1995, Chapter 71:40 and Treasury Notes Act No. 14 of 1995, Chapter 71:39
The Government of the Republic of Trinidad and Tobago’s borrowing capacity to facilitate the conduct of open market operations (OMO) was increased in December, 2013 through amendments to the borrowing limits under the Treasury Bills Act No. 14 of 1995, Chapter 71:40 and Treasury Notes Act No. 14 of 1995, Chapter 71:39.
Both the Treasury Bills Act, Chap. 71:40 and the Treasury Notes Act, Chap 71:39 provide for the issue of Government securities to facilitate the conduct of OMO by the Central Bank of Trinidad and Tobago (CBTT). It was necessary to increase the statutory limit under both Acts as the outstanding balance on the OMO bills and notes were at the limit, restricting the CBTT’s capacity to conduct liquidity management operations. In general, the proceeds of Treasury Notes and Treasury Bills are paid into a blocked account in CBTT and are not available for budget financing.
The Treasury Bills Act, Chap. 71:40, was first enacted in 1961 and since then, there have been seven (7) revisions to the statutory limits as detailed in Table 1. The recent revision raised the limit from $15,000 million to $30,000 million.
The statutory limit under the Treasury Notes Act, Chap 71:39, was increased from $5,000 million to $15,000 million. The initial limit set by the Act in 2003 was $3,000 million and in the subsequent years, the limit has been reset two (2) times. Details of the amendments to the Treasury Notes Act, Chap 71:39 since its enactment are outlined Table 2.
Table 1:
Change in statutory limit under the Treasury Bills Act No. 14 of 1995, Chapter 71:40 for the period 1961
to 2013
(TT$ Millions)
Year Change in Treasury Bills Statutory limit
1961 50.0
1971 100.0
1973 125.0
1983 500.0
1987 1,000.0
2003 5,000.0
2006 15,000.0
2013 30,000.0
Source: Ministry of Finance and the Economy
Table 2:
Change in statutory limit under the Treasury Notes Act No. 14 of 1995, Chapter 71:39 for the period 1961
to 2013
(TT$ Millions)
Year Change in Treasury
Notes Statutory limit
2003 3,000.00
2006 5,000.00
2013 15,000.00
Source: Ministry of Finance and the Economy
CENTRAL GOVERNMENT OPERATIONS
R E V I E W O F T H E E C O N O M Y 2 0 1 4
46EMPOWERING OUR PEOPLE THROUGH SUSTAINED ECONOMIC GROWTH AND PROSPERITY
amount, $609.5 million was transferred to State Enterprises and $259.2 to Public Utilities. At the same time, Current Transfers from the Central Government to State Enterprises decreased by $213.0 million and $277.3 million for Public Utilities.
CASH OPERATIONS Cash Operations of the consolidated Rest of the Non-Financial Public Sector generated an operating surplus of $1,122.4 million during the six months of fiscal 2014; 74.1 percent lower than the $4,331.6 million surplus generated in the comparative period of the previous year.
The net operating surplus recorded was mainly attributable to the activities of the National Gas Company (NGC) ($971.9 million), the Telecommunications Services of Trinidad and Tobago Limited ($652.6 million), the Petroleum Company of Trinidad and Tobago (PETROTRIN) ($414.6 million), and to a lesser extent Trinidad Nitrogen Company Limited (TRINGEN) ($193.0 million). PETROTRIN’s Operating Surplus of $414.6 million is a reflection of its sale of goods and services, in spite of Operational Costs excluding Wages, Salaries and Interest payments which amount to $11,166.7 million. It should be noted, that PETROTRIN had the highest operating revenues for the period, amounting to $13,083.85.
OVERVIEWDuring the review period of October 2013 to March 2014, the combined operations of the Rest of the Non-Financial Public Sector18 recorded a deficit of $3,293.3 million, when compared to the recorded surplus of $65.4 million for the same period of fiscal 2013. State Enterprises1916 recorded a combined deficit of $3,959.1 million while Public Utilities2017posted a combined surplus of $665.8 million.
Capital Transfers from Central Government decreased from $902.3 million to $868.7 million during the six months to March 31, 2014. Of this
18 Rest of Non-Financial Public Sector refers to the consolidation of the operations of thirteen (13) State Enterprises (which represent approximately 80 percent of the operations of State Enterprises) and six (6) Public Utilities.
19 State Enterprise refer to the consolidated operations of fourteen (14) companies, namely: Caribbean Airlines Ltd., National Maintenance Training & Security Co., National Gas Co., National Helicopter Services Ltd., National Infrastructure Development Co. Ltd., National Petroleum Marketing Co., Petroleum Co. of Trinidad & Tobago, Point Lisas Industrial Port Development Co., Trinidad & Tobago Solid Waste Management Co. Ltd., Trinidad Nitrogen Co. Ltd., Trinidad & Tobago Mortgage Finance Co., Urban Development Corp. of Trinidad & Tobago, and Vehicle Management Corp. of Trinidad & Tobago.
20 Public Utilities refer to the consolidated operations of six (6) companies, namely: Airport Authority of Trinidad & Tobago, Port Authority of Trinidad & Tobago, Public Transport Service Corp., Telecommunications Services of Trinidad & Tobago, Trinidad & Tobago Electricity Commission, and Water & Sewerage Authority.
R E S T O F T H E N O N - F I N A N C I A L P U B L I C S E C T O R O P E R AT I O N S
Overview
Cash Operations
Current Transfers to State Enterprises and Public Utilities
Capital Expenditure
Capital Transfers from Central Government
R E V I E W O F T H E E C O N O M Y 2 0 1 4
47 EMPOWERING OUR PEOPLE THROUGH SUSTAINED ECONOMIC GROWTH AND PROSPERITY
At the same time, the operating revenues of the NGC decreased as a result of less favourable methanol and ammonia prices. The operating revenues of TRINGEN reflected a decrease, resulting from the declining prices of ammonia and also due to gas curtailment and leakages which adversely affected its operations.
Among the non-energy sector State Enterprises, Caribbean Airlines Limited’s (CAL) operating deficit for the period amounted to $172.2 million and was the largest for this grouping. This deficit was partly offset by the surplus contributions from the operations of the National Maintenance, Training and Security Company Limited (MTS) ($68.1 million) and the Point Lisas Industrial Port Development Company (PLIPDECO) ($8.3 million).
Over the review period, Public Utilities recorded a deficit of $237.7 million, a 74.9 percent decrease from the $948.7 million deficit recorded in the first six months of fiscal 2013.
With regard to Public Utilities, the Telecommunications Services of Trinidad and Tobago (TSTT) was the only company to generate a surplus, recorded at $652.6 million. The other five (5) utilities recorded operating deficits with a cumulative total of $890.3 million; the Water and Sewerage Authority (WASA) was responsible for 68.8 percent ($612.8 million) of the overall deficit associated with the Public Utilities on account of higher operational expenses including purchases of chemicals, materials, contracted services, and plant maintenance and upgrades.
CURRENT TRANSFERS TO STATE ENTERPRISES & PUBLIC UTILITIESFor the six months ending March 31, 2014, Current Transfers from Central Government amounted to $979.6 million, representing a decrease of 33.4 percent over the corresponding period of the previous fiscal year. Of this amount, $196.5 million (20.1 percent) was transferred to State Enterprises, while $783.1 million (79.9 percent) was transferred to Public Utilities.
During this period, transfers to the Water and Sewerage Authority (WASA) amounted to $585.5 million, or 74.8 percent of total transfers to Public Utilities. At the same time, Caribbean Airlines Limited (CAL) was the largest recipient of transfers to the State Enterprises Sector with $101.1 million in transfers.
CAPITAL EXPENDITUREOver the review period, Capital Expenditure incurred by both State Enterprises and Public Utilities, totalled $4,140.6 million; of which State Enterprises and Public Utilities accounted for 87.6 percent and 12.4 percent, respectively. Only $1,162.6 million or 28.1 percent, of the total budget was used for government projects.
Capital Expenditure by State Enterprises amounted to $3,629.1 million, of which PETROTRIN utilised $19.2 million for its continuing Gasoline Optimisation Programme (GOP) and $82.5 million for the Ultra-Low Sulphur Diesel Unit (ULSD). As at March 2014, the total commitment (including expenditure of $9,084.4 million) on the GOP reached $9,178.2 million. At the end of March 2014, the project was 99.78 percent complete. The ULSD is designed to produce higher grade diesel to meet stringent new quality specifications (sulphur and aromatics) in the local, regional and international markets. Total expenditure for the ULSD project as at March 31, 2014 was $2,332.5 million. The cost of completion of this project is estimated at US$425 million.
Of the Capital Expenditure undertaken by State Enterprises, the National Gas Company (NGC) utilised $1,062.7 million, of which $291.8 million was utilised for Fixed Capital Formation and $767.8 million for the purchase of equity.
Additionally, the capital expenditure by non-energy State Enterprises was relatively high, with the National Infrastructure Development Company Limited (NIDCO) spending $695.1 million on its infrastructural projects. The Urban Development Corporation of Trinidad and Tobago Limited (UDeCOTT) also spent $254.8 million for the construction of various
REST OF THE NON-FINANCIAL PUBLIC SECTOR OPERATIONS
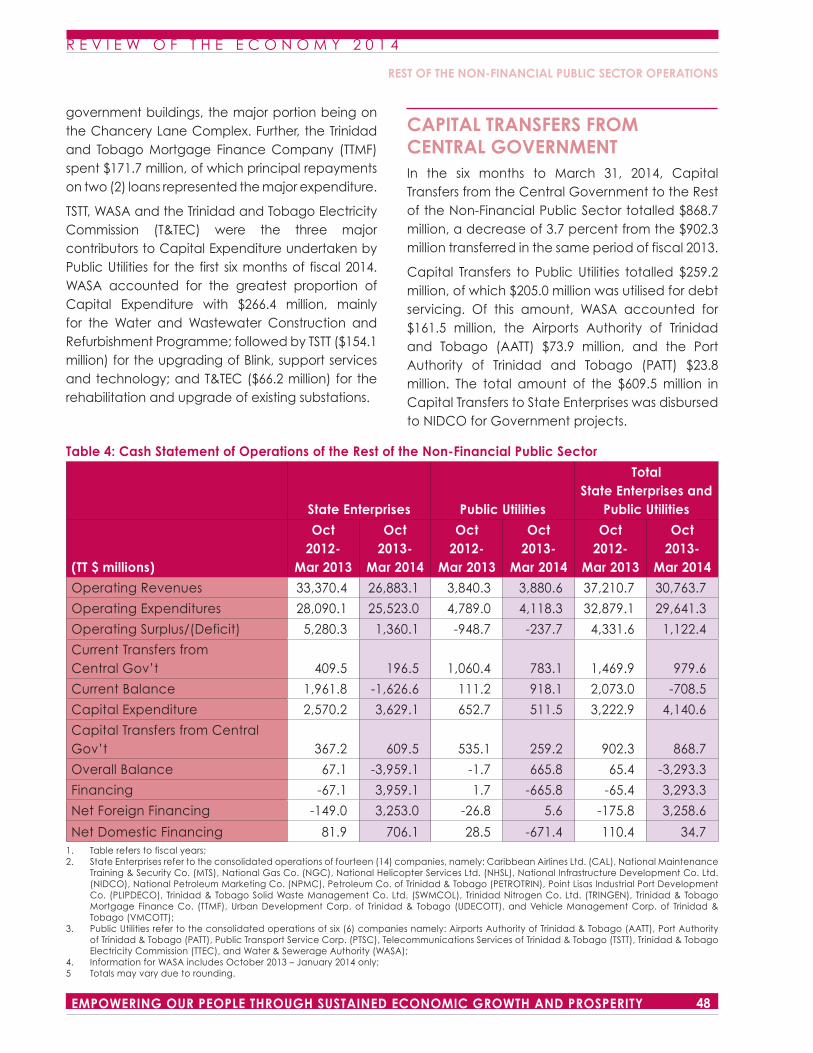
R E V I E W O F T H E E C O N O M Y 2 0 1 4
48EMPOWERING OUR PEOPLE THROUGH SUSTAINED ECONOMIC GROWTH AND PROSPERITY
government buildings, the major portion being on the Chancery Lane Complex. Further, the Trinidad and Tobago Mortgage Finance Company (TTMF) spent $171.7 million, of which principal repayments on two (2) loans represented the major expenditure.
TSTT, WASA and the Trinidad and Tobago Electricity Commission (T&TEC) were the three major contributors to Capital Expenditure undertaken by Public Utilities for the first six months of fiscal 2014. WASA accounted for the greatest proportion of Capital Expenditure with $266.4 million, mainly for the Water and Wastewater Construction and Refurbishment Programme; followed by TSTT ($154.1 million) for the upgrading of Blink, support services and technology; and T&TEC ($66.2 million) for the rehabilitation and upgrade of existing substations.
CAPITAL TRANSFERS FROM CENTRAL GOVERNMENTIn the six months to March 31, 2014, Capital Transfers from the Central Government to the Rest of the Non-Financial Public Sector totalled $868.7 million, a decrease of 3.7 percent from the $902.3 million transferred in the same period of fiscal 2013.
Capital Transfers to Public Utilities totalled $259.2 million, of which $205.0 million was utilised for debt servicing. Of this amount, WASA accounted for $161.5 million, the Airports Authority of Trinidad and Tobago (AATT) $73.9 million, and the Port Authority of Trinidad and Tobago (PATT) $23.8 million. The total amount of the $609.5 million in Capital Transfers to State Enterprises was disbursed to NIDCO for Government projects.
Table 4: Cash Statement of Operations of the Rest of the Non-Financial Public Sector
State Enterprises Public Utilities
TotalState Enterprises and
Public Utilities
(TT $ millions)
Oct 2012-
Mar 2013
Oct 2013-
Mar 2014
Oct 2012-
Mar 2013
Oct 2013-
Mar 2014
Oct 2012-
Mar 2013
Oct 2013-
Mar 2014
Operating Revenues 33,370.4 26,883.1 3,840.3 3,880.6 37,210.7 30,763.7
Operating Expenditures 28,090.1 25,523.0 4,789.0 4,118.3 32,879.1 29,641.3
Operating Surplus/(Deficit) 5,280.3 1,360.1 -948.7 -237.7 4,331.6 1,122.4
Current Transfers from Central Gov’t 409.5 196.5 1,060.4 783.1 1,469.9 979.6
Current Balance 1,961.8 -1,626.6 111.2 918.1 2,073.0 -708.5
Capital Expenditure 2,570.2 3,629.1 652.7 511.5 3,222.9 4,140.6
Capital Transfers from Central Gov’t 367.2 609.5 535.1 259.2 902.3 868.7
Overall Balance 67.1 -3,959.1 -1.7 665.8 65.4 -3,293.3
Financing -67.1 3,959.1 1.7 -665.8 -65.4 3,293.3
Net Foreign Financing -149.0 3,253.0 -26.8 5.6 -175.8 3,258.6
Net Domestic Financing 81.9 706.1 28.5 -671.4 110.4 34.71. Table refers to fiscal years;2. State Enterprises refer to the consolidated operations of fourteen (14) companies, namely: Caribbean Airlines Ltd. (CAL), National Maintenance
Training & Security Co. (MTS), National Gas Co. (NGC), National Helicopter Services Ltd. (NHSL), National Infrastructure Development Co. Ltd. (NIDCO), National Petroleum Marketing Co. (NPMC), Petroleum Co. of Trinidad & Tobago (PETROTRIN), Point Lisas Industrial Port Development Co. (PLIPDECO), Trinidad & Tobago Solid Waste Management Co. Ltd. (SWMCOL), Trinidad Nitrogen Co. Ltd. (TRINGEN), Trinidad & Tobago Mortgage Finance Co. (TTMF), Urban Development Corp. of Trinidad & Tobago (UDECOTT), and Vehicle Management Corp. of Trinidad & Tobago (VMCOTT);
3. Public Utilities refer to the consolidated operations of six (6) companies namely: Airports Authority of Trinidad & Tobago (AATT), Port Authority of Trinidad & Tobago (PATT), Public Transport Service Corp. (PTSC), Telecommunications Services of Trinidad & Tobago (TSTT), Trinidad & Tobago Electricity Commission (TTEC), and Water & Sewerage Authority (WASA);
4. Information for WASA includes October 2013 – January 2014 only;5 Totals may vary due to rounding.
REST OF THE NON-FINANCIAL PUBLIC SECTOR OPERATIONS
R E V I E W O F T H E E C O N O M Y 2 0 1 4
49 EMPOWERING OUR PEOPLE THROUGH SUSTAINED ECONOMIC GROWTH AND PROSPERITY
TR INIDAD AND TOBAGO CREDIT RAT INGSTrinidad and Tobago is currently rated by three international rating agencies, Moody’s Investors Service (Moody’s), Standard & Poor’s Ratings Services and the Caribbean-based Caribbean Information and Credit Rating Services Limited (CariCRIS). The continued trend of solid economic performance, combined with steps to improve the regulatory environment, and firm commitment to savings through the Heritage and Stabilization Fund (HSF) has ensured that the Republic of Trinidad and Tobago continues to enjoy investment grade status with stable outlook. The economy remains one of the most resilient in the Caribbean, in light of recent downgrades to credit ratings and outlook for countries in the region including Barbados, Grenada, Bermuda, Suriname, and Puerto Rico.
MOODY’S INVESTORS SERVICE
In January 2014, following its annual ratings review, Moody’s Investors Service (Moody’s) affirmed its Baa1 rating for Government of Trinidad and Tobago Bonds in both foreign and domestic currency. This endorsement of the country’s ratings hinged on an aggressive fiscal stimulus programme, promoting the fiscal strength of the economy, an accommodative monetary stance, a relatively moderate and affordable debt burden, strong external position and committed savings in the Heritage and Stabilization Fund (HSF).
The country’s outlook remains stable on account of fiscal savings, consistent current account surpluses and a strong international reserve position. Moody’s also projected a growth rate of 2.9 percent in 2014 with continued positive performance in 2015, citing as the major driving force of this growth, the expansion in exploration
and energy production, particularly in upstream gas projects. They indicated however, that growth prospects could be stymied by constrained macroeconomic policies and infrastructure deficiencies.
Moody’s has identified Trinidad and Tobago’s country risks as uncertainty in growth prospects due to commodity price volatility, high fiscal deficits, and limited opportunities to diversify the economy along alternative growth paths. They indicated that upward adjustment in these ratings would depend on increased foreign investment in oil and natural gas exploration as well as boosting of output in the hydrocarbon sector. This must be partnered with strengthening of existing fiscal frameworks and debt management practices, as well as utilization of the HSF as a tool for effective countercyclical fiscal policy.
Moody’s, in conducting its sovereign rating exercise also downgraded the ratings of both First Citizens Bank Limited (FCB) and the Petroleum Company of Trinidad and Tobago (Petrotrin) to a stable outlook. Petrotrins’ downgrade was based on the company’s weaker-than-expected performance from high cost exposure and operational disruptions, whilst corporate governance issues, weakened profitability indicators and rising operating cost contributed to FCB’s downgrade.
Regionally, Trinidad and Tobago has maintained its positive ratings due to its vibrant energy sector, and low reliance on the volatile tourism industry. Traditionally, Bermuda, Barbados, the Cayman Islands, and the Bahamas are the highest rated Caribbean islands, with the Bahamas and Barbados historically rated as investment grade. However, Moody’s has downgraded ratings for Barbados from Ba3 to B3; Bermuda from Aa3 to A1; and Puerto Rico from Ba2 to B2; as well as changed the outlook of Suriname from positive to stable.
REST OF THE NON-FINANCIAL PUBLIC SECTOR OPERATIONS
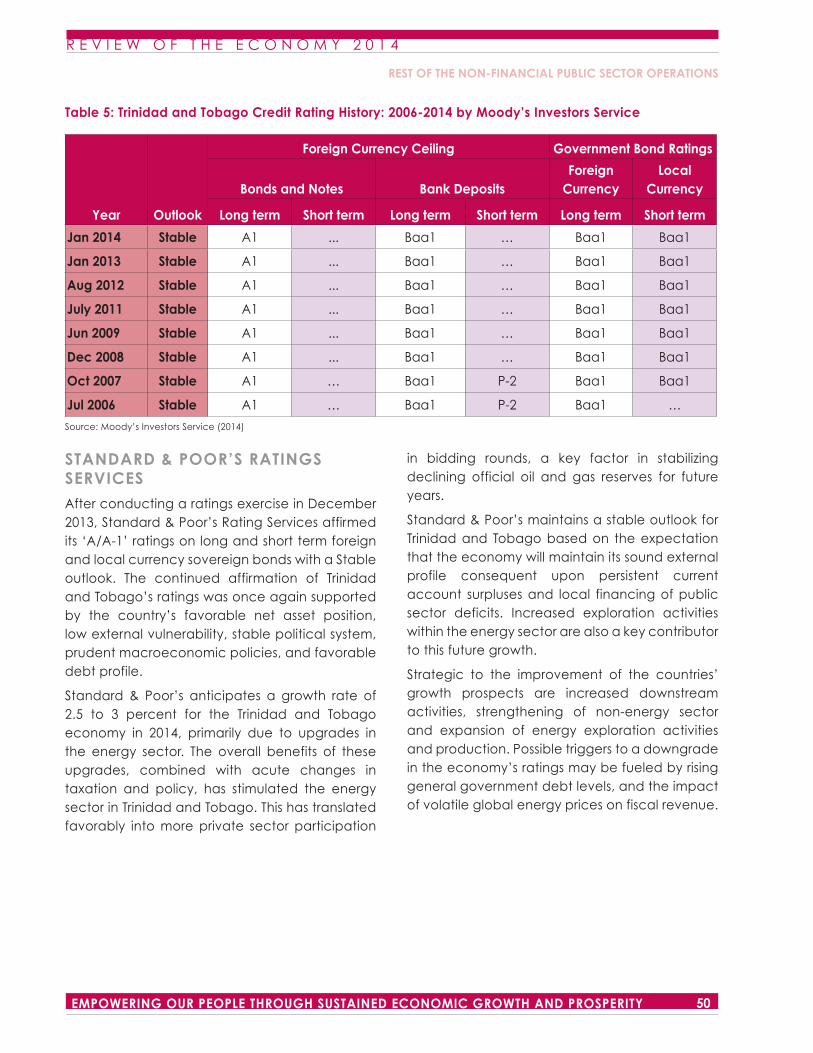
R E V I E W O F T H E E C O N O M Y 2 0 1 4
50EMPOWERING OUR PEOPLE THROUGH SUSTAINED ECONOMIC GROWTH AND PROSPERITY
STANDARD & POOR’S RATINGS SERVICES
After conducting a ratings exercise in December 2013, Standard & Poor’s Rating Services affirmed its ‘A/A-1’ ratings on long and short term foreign and local currency sovereign bonds with a Stable outlook. The continued affirmation of Trinidad and Tobago’s ratings was once again supported by the country’s favorable net asset position, low external vulnerability, stable political system, prudent macroeconomic policies, and favorable debt profile.
Standard & Poor’s anticipates a growth rate of 2.5 to 3 percent for the Trinidad and Tobago economy in 2014, primarily due to upgrades in the energy sector. The overall benefits of these upgrades, combined with acute changes in taxation and policy, has stimulated the energy sector in Trinidad and Tobago. This has translated favorably into more private sector participation
in bidding rounds, a key factor in stabilizing declining official oil and gas reserves for future years.
Standard & Poor’s maintains a stable outlook for Trinidad and Tobago based on the expectation that the economy will maintain its sound external profile consequent upon persistent current account surpluses and local financing of public sector deficits. Increased exploration activities within the energy sector are also a key contributor to this future growth.
Strategic to the improvement of the countries’ growth prospects are increased downstream activities, strengthening of non-energy sector and expansion of energy exploration activities and production. Possible triggers to a downgrade in the economy’s ratings may be fueled by rising general government debt levels, and the impact of volatile global energy prices on fiscal revenue.
Table 5: Trinidad and Tobago Credit Rating History: 2006-2014 by Moody’s Investors Service
Year Outlook
Foreign Currency Ceiling Government Bond Ratings
Bonds and Notes Bank DepositsForeign
CurrencyLocal
Currency
Long term Short term Long term Short term Long term Short term
Jan 2014 Stable A1 ... Baa1 … Baa1 Baa1
Jan 2013 Stable A1 ... Baa1 … Baa1 Baa1
Aug 2012 Stable A1 ... Baa1 … Baa1 Baa1
July 2011 Stable A1 ... Baa1 … Baa1 Baa1
Jun 2009 Stable A1 ... Baa1 … Baa1 Baa1
Dec 2008 Stable A1 ... Baa1 … Baa1 Baa1
Oct 2007 Stable A1 … Baa1 P-2 Baa1 Baa1
Jul 2006 Stable A1 … Baa1 P-2 Baa1 …
Source: Moody’s Investors Service (2014)
REST OF THE NON-FINANCIAL PUBLIC SECTOR OPERATIONS
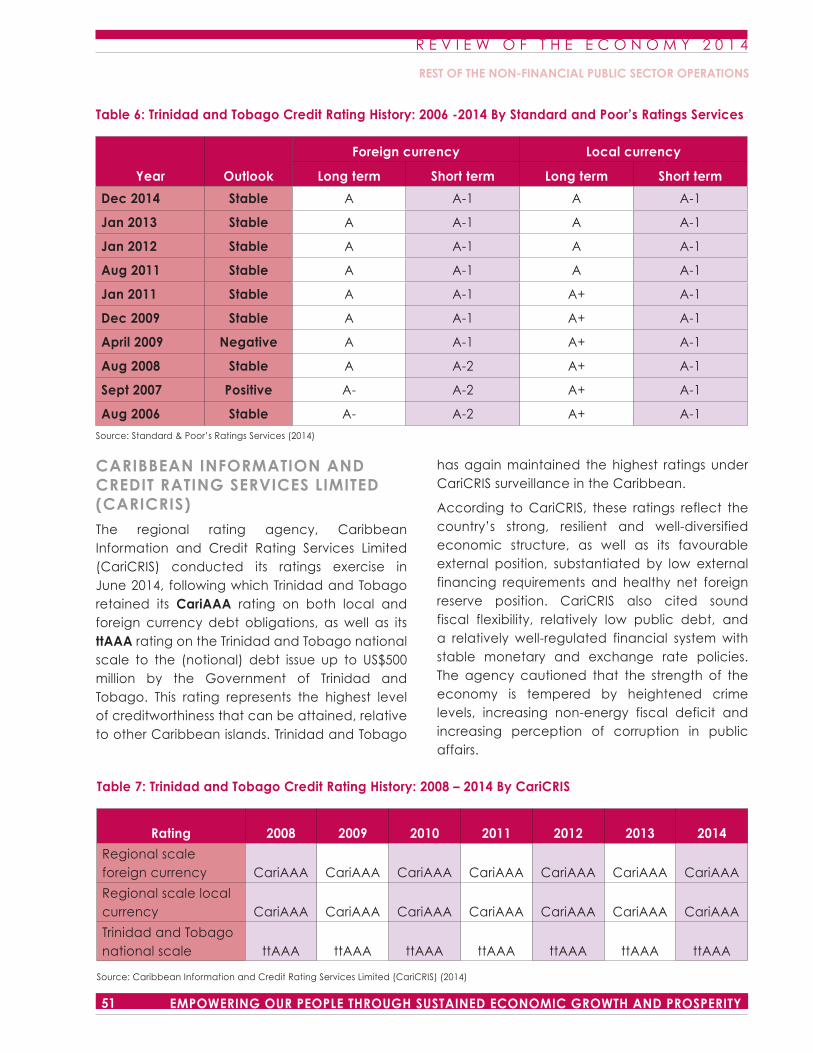
R E V I E W O F T H E E C O N O M Y 2 0 1 4
51 EMPOWERING OUR PEOPLE THROUGH SUSTAINED ECONOMIC GROWTH AND PROSPERITY
CARIBBEAN INFORMATION AND CREDIT RATING SERVICES LIMITED (CARICRIS)
The regional rating agency, Caribbean Information and Credit Rating Services Limited (CariCRIS) conducted its ratings exercise in June 2014, following which Trinidad and Tobago retained its CariAAA rating on both local and foreign currency debt obligations, as well as its ttAAA rating on the Trinidad and Tobago national scale to the (notional) debt issue up to US$500 million by the Government of Trinidad and Tobago. This rating represents the highest level of creditworthiness that can be attained, relative to other Caribbean islands. Trinidad and Tobago
has again maintained the highest ratings under CariCRIS surveillance in the Caribbean.
According to CariCRIS, these ratings reflect the country’s strong, resilient and well-diversified economic structure, as well as its favourable external position, substantiated by low external financing requirements and healthy net foreign reserve position. CariCRIS also cited sound fiscal flexibility, relatively low public debt, and a relatively well-regulated financial system with stable monetary and exchange rate policies. The agency cautioned that the strength of the economy is tempered by heightened crime levels, increasing non-energy fiscal deficit and increasing perception of corruption in public affairs.
Table 6: Trinidad and Tobago Credit Rating History: 2006 -2014 By Standard and Poor’s Ratings Services
Year Outlook
Foreign currency Local currency
Long term Short term Long term Short term
Dec 2014 Stable A A-1 A A-1
Jan 2013 Stable A A-1 A A-1
Jan 2012 Stable A A-1 A A-1
Aug 2011 Stable A A-1 A A-1
Jan 2011 Stable A A-1 A+ A-1
Dec 2009 Stable A A-1 A+ A-1
April 2009 Negative A A-1 A+ A-1
Aug 2008 Stable A A-2 A+ A-1
Sept 2007 Positive A- A-2 A+ A-1
Aug 2006 Stable A- A-2 A+ A-1
Source: Standard & Poor’s Ratings Services (2014)
Table 7: Trinidad and Tobago Credit Rating History: 2008 – 2014 By CariCRIS
Rating 2008 2009 2010 2011 2012 2013 2014
Regional scale foreign currency CariAAA CariAAA CariAAA CariAAA CariAAA CariAAA CariAAA
Regional scale local currency CariAAA CariAAA CariAAA CariAAA CariAAA CariAAA CariAAA
Trinidad and Tobago national scale ttAAA ttAAA ttAAA ttAAA ttAAA ttAAA ttAAA
Source: Caribbean Information and Credit Rating Services Limited (CariCRIS) (2014)
REST OF THE NON-FINANCIAL PUBLIC SECTOR OPERATIONS
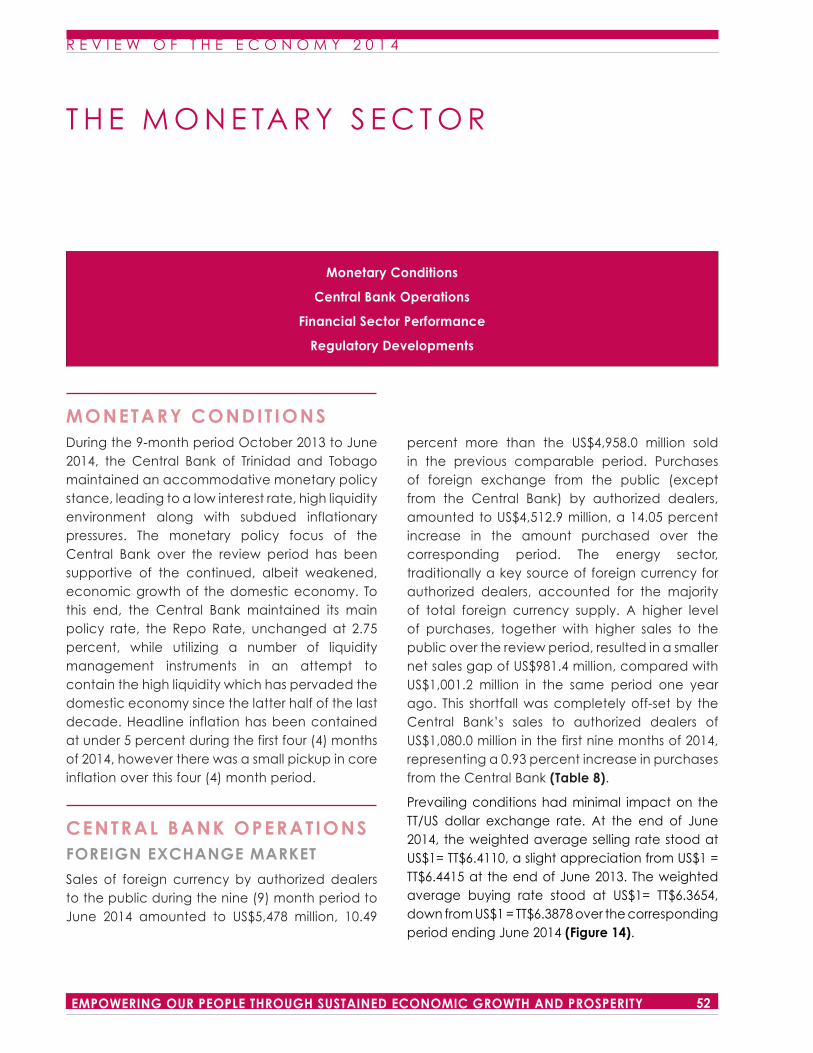
R E V I E W O F T H E E C O N O M Y 2 0 1 4
52EMPOWERING OUR PEOPLE THROUGH SUSTAINED ECONOMIC GROWTH AND PROSPERITY
T H E M O N E TA R Y S E C T O R
Monetary Conditions
Central Bank Operations
Financial Sector Performance
Regulatory Developments
MONETARY CONDIT IONSDuring the 9-month period October 2013 to June 2014, the Central Bank of Trinidad and Tobago maintained an accommodative monetary policy stance, leading to a low interest rate, high liquidity environment along with subdued inflationary pressures. The monetary policy focus of the Central Bank over the review period has been supportive of the continued, albeit weakened, economic growth of the domestic economy. To this end, the Central Bank maintained its main policy rate, the Repo Rate, unchanged at 2.75 percent, while utilizing a number of liquidity management instruments in an attempt to contain the high liquidity which has pervaded the domestic economy since the latter half of the last decade. Headline inflation has been contained at under 5 percent during the first four (4) months of 2014, however there was a small pickup in core inflation over this four (4) month period.
CENTRAL BANK OPERATIONSFOREIGN EXCHANGE MARKET
Sales of foreign currency by authorized dealers to the public during the nine (9) month period to June 2014 amounted to US$5,478 million, 10.49
percent more than the US$4,958.0 million sold in the previous comparable period. Purchases of foreign exchange from the public (except from the Central Bank) by authorized dealers, amounted to US$4,512.9 million, a 14.05 percent increase in the amount purchased over the corresponding period. The energy sector, traditionally a key source of foreign currency for authorized dealers, accounted for the majority of total foreign currency supply. A higher level of purchases, together with higher sales to the public over the review period, resulted in a smaller net sales gap of US$981.4 million, compared with US$1,001.2 million in the same period one year ago. This shortfall was completely off-set by the Central Bank’s sales to authorized dealers of US$1,080.0 million in the first nine months of 2014, representing a 0.93 percent increase in purchases from the Central Bank (Table 8).
Prevailing conditions had minimal impact on the TT/US dollar exchange rate. At the end of June 2014, the weighted average selling rate stood at US$1= TT$6.4110, a slight appreciation from US$1 = TT$6.4415 at the end of June 2013. The weighted average buying rate stood at US$1= TT$6.3654, down from US$1 = TT$6.3878 over the corresponding period ending June 2014 (Figure 14).
Table 8: Commercial Banks and Non-Bank Financial Institutions’ Foreign Currency Sales and Purchases (US$ Mn.)
PeriodPurchases from
the PublicSales to the
PublicNet Sales to the Public
Purchases From the
Central Bank
2012 4,859.1 6,713.7 1,854.6 1,785.0
2013 5,802.2 7,076.4 1,274.2 1,315.0
Oct 2012 – Jun 2013 3,956.8 4,958.0 1,001.2 1,070.0
Oct 2013 – Jun 2014 4,512.9 5,478.0 981.4 1,080.0
Percentage Change (year-on-year) 14.05 10.49 -1.98 0.93
Source: Central Bank of Trinidad and Tobago.
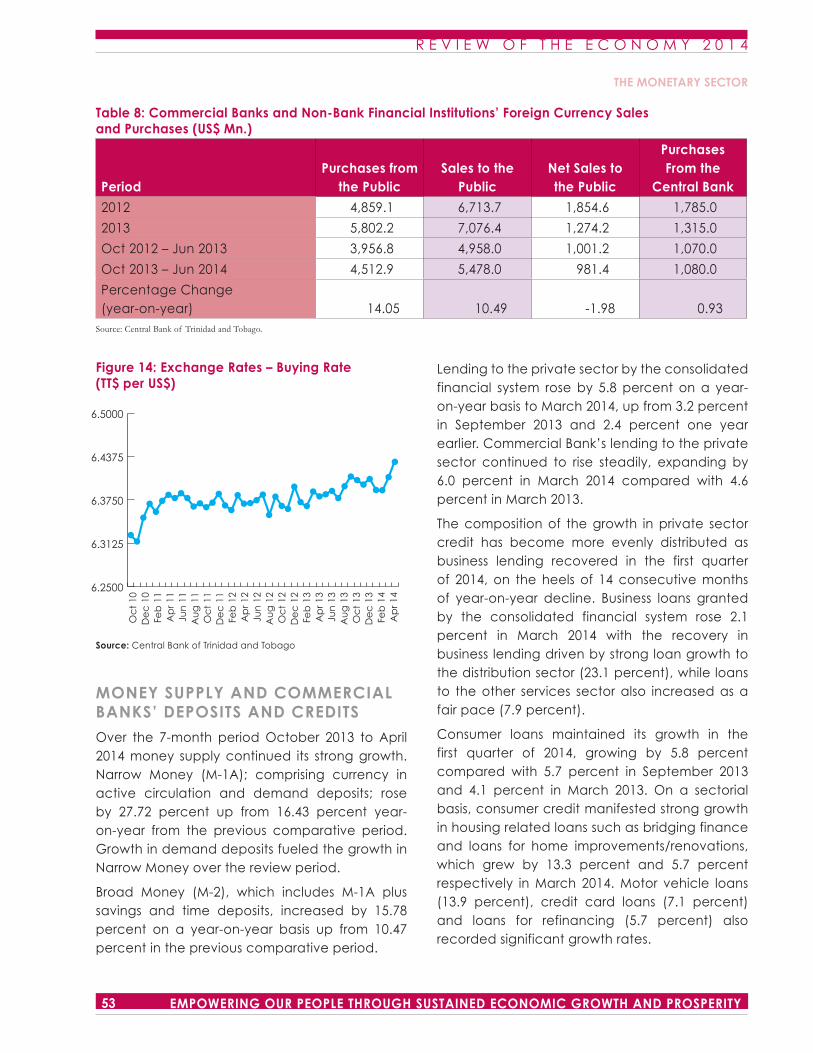
R E V I E W O F T H E E C O N O M Y 2 0 1 4
53 EMPOWERING OUR PEOPLE THROUGH SUSTAINED ECONOMIC GROWTH AND PROSPERITY
Lending to the private sector by the consolidated financial system rose by 5.8 percent on a year-on-year basis to March 2014, up from 3.2 percent in September 2013 and 2.4 percent one year earlier. Commercial Bank’s lending to the private sector continued to rise steadily, expanding by 6.0 percent in March 2014 compared with 4.6 percent in March 2013.
The composition of the growth in private sector credit has become more evenly distributed as business lending recovered in the first quarter of 2014, on the heels of 14 consecutive months of year-on-year decline. Business loans granted by the consolidated financial system rose 2.1 percent in March 2014 with the recovery in business lending driven by strong loan growth to the distribution sector (23.1 percent), while loans to the other services sector also increased as a fair pace (7.9 percent).
Consumer loans maintained its growth in the first quarter of 2014, growing by 5.8 percent compared with 5.7 percent in September 2013 and 4.1 percent in March 2013. On a sectorial basis, consumer credit manifested strong growth in housing related loans such as bridging finance and loans for home improvements/renovations, which grew by 13.3 percent and 5.7 percent respectively in March 2014. Motor vehicle loans (13.9 percent), credit card loans (7.1 percent) and loans for refinancing (5.7 percent) also recorded significant growth rates.
Figure 14: Exchange Rates – Buying Rate(TT$ per US$)
Source: Central Bank of Trinidad and Tobago
MONEY SUPPLY AND COMMERCIAL BANKS’ DEPOSITS AND CREDITS
Over the 7-month period October 2013 to April 2014 money supply continued its strong growth. Narrow Money (M-1A); comprising currency in active circulation and demand deposits; rose by 27.72 percent up from 16.43 percent year-on-year from the previous comparative period. Growth in demand deposits fueled the growth in Narrow Money over the review period.
Broad Money (M-2), which includes M-1A plus savings and time deposits, increased by 15.78 percent on a year-on-year basis up from 10.47 percent in the previous comparative period.
6.2500
6.3125
6.3750
6.4375
6.5000
Oc
t 10
De
c 1
0Fe
b 1
1A
pr 1
1Ju
n 1
1A
ug
11
Oc
t 11
De
c 1
1Fe
b 1
2A
pr 1
2Ju
n 1
2A
ug
12
Oc
t 12
De
c 1
2Fe
b 1
3A
pr 1
3Ju
n 1
3A
ug
13
Oc
t 13
De
c 1
3Fe
b 1
4A
pr 1
4
percent more than the US$4,958.0 million sold in the previous comparable period. Purchases of foreign exchange from the public (except from the Central Bank) by authorized dealers, amounted to US$4,512.9 million, a 14.05 percent increase in the amount purchased over the corresponding period. The energy sector, traditionally a key source of foreign currency for authorized dealers, accounted for the majority of total foreign currency supply. A higher level of purchases, together with higher sales to the public over the review period, resulted in a smaller net sales gap of US$981.4 million, compared with US$1,001.2 million in the same period one year ago. This shortfall was completely off-set by the Central Bank’s sales to authorized dealers of US$1,080.0 million in the first nine months of 2014, representing a 0.93 percent increase in purchases from the Central Bank (Table 8).
Prevailing conditions had minimal impact on the TT/US dollar exchange rate. At the end of June 2014, the weighted average selling rate stood at US$1= TT$6.4110, a slight appreciation from US$1 = TT$6.4415 at the end of June 2013. The weighted average buying rate stood at US$1= TT$6.3654, down from US$1 = TT$6.3878 over the corresponding period ending June 2014 (Figure 14).
Table 8: Commercial Banks and Non-Bank Financial Institutions’ Foreign Currency Sales and Purchases (US$ Mn.)
PeriodPurchases from
the PublicSales to the
PublicNet Sales to the Public
Purchases From the
Central Bank
2012 4,859.1 6,713.7 1,854.6 1,785.0
2013 5,802.2 7,076.4 1,274.2 1,315.0
Oct 2012 – Jun 2013 3,956.8 4,958.0 1,001.2 1,070.0
Oct 2013 – Jun 2014 4,512.9 5,478.0 981.4 1,080.0
Percentage Change (year-on-year) 14.05 10.49 -1.98 0.93
Source: Central Bank of Trinidad and Tobago.
THE MONETARY SECTOR
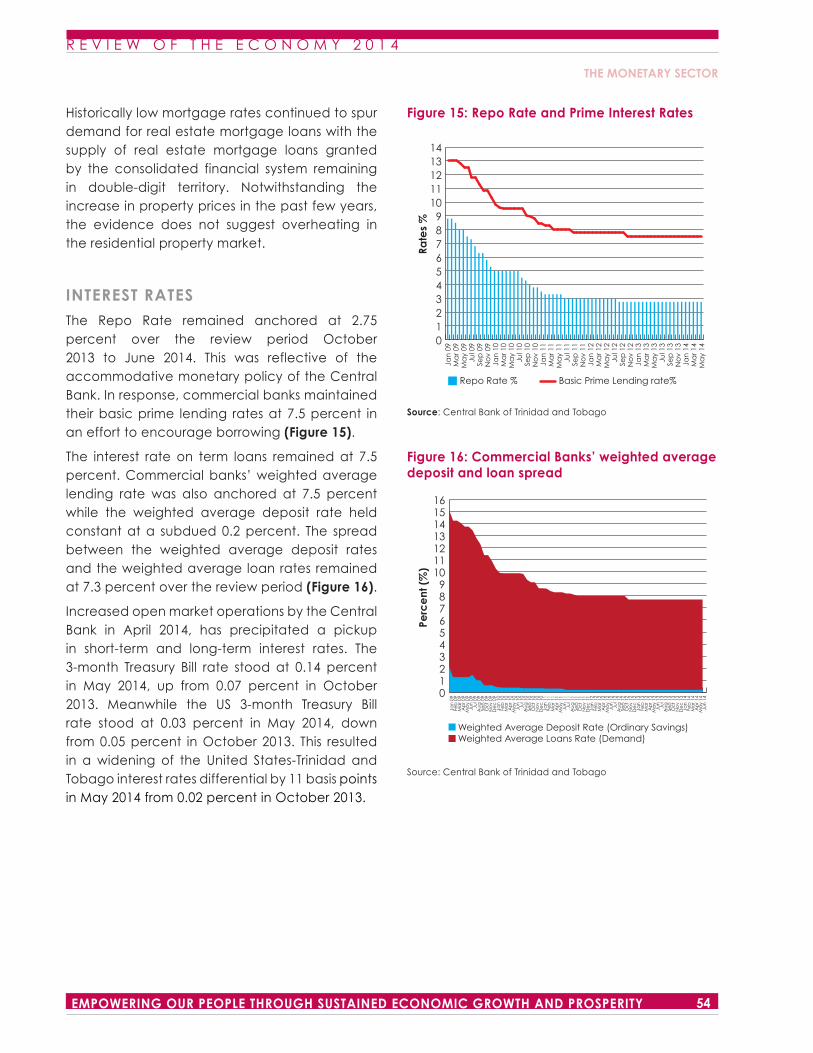
R E V I E W O F T H E E C O N O M Y 2 0 1 4
54EMPOWERING OUR PEOPLE THROUGH SUSTAINED ECONOMIC GROWTH AND PROSPERITY
Figure 15: Repo Rate and Prime Interest Rates
Source: Central Bank of Trinidad and Tobago
Figure 16: Commercial Banks’ weighted average deposit and loan spread
Source: Central Bank of Trinidad and Tobago
0123456789
1011121314
Rate
s %
Repo Rate % Basic Prime Lending rate%
Jan
09
Ma
r 09
Ma
y 09
Jul 0
9Se
p 0
9N
ov
09Ja
n 1
0M
ar 1
0M
ay
10Ju
l 10
Sep
10
No
v 10
Jan
11
Ma
r 11
Ma
y 11
Jul 1
1Se
p 1
1N
ov
11Ja
n 1
2M
ar 1
2M
ay
12Ju
l 12
Sep
12
No
v 12
Jan
13
Ma
r 13
Ma
y 13
Jul 1
3Se
p 1
3N
ov
13Ja
n 1
4M
ar 1
4M
ay
140123456789
10111213141516
Jan
09
Feb
09
Ma
r 09
Ap
r 09
Ma
y 09
Jun
09
Jul 0
9A
ug
09
Sep
09
Oc
t 09
No
v 09
De
c 0
9Ja
n 1
0Fe
b 1
0M
ar 1
0A
pr 1
0M
ay
10Ju
n 1
0Ju
l 10
Au
g 1
0Se
p 1
0O
ct
10N
ov
10D
ec
10
Jan
11
Feb
11
Ma
r 11
Ap
r 11
Ma
y 11
Jun
11
Jul 1
1A
ug
11
Sep
11
Oc
t 11
No
v 11
De
c 1
1Ja
n 1
2Fe
b 1
2M
ar 1
2A
pr 1
2M
ay
12Ju
n 1
2Ju
l 12
Au
g 1
2Se
p 1
2O
ct
12N
ov
12D
ec
12
Jan
13
Feb
13
Ma
r 13
Ap
r 13
Ma
y 13
Jun
13
Jul 1
3A
ug
13
Sep
13
Oc
t 13
No
v 13
De
c 1
3Ja
n 1
4Fe
b 1
4M
ar 1
4A
pr 1
4M
ay
14Ju
n 1
4
Perc
ent
(%
)
Weighted Average Deposit Rate (Ordinary Savings)Weighted Average Loans Rate (Demand)
Historically low mortgage rates continued to spur demand for real estate mortgage loans with the supply of real estate mortgage loans granted by the consolidated financial system remaining in double-digit territory. Notwithstanding the increase in property prices in the past few years, the evidence does not suggest overheating in the residential property market.
INTEREST RATES
The Repo Rate remained anchored at 2.75 percent over the review period October 2013 to June 2014. This was reflective of the accommodative monetary policy of the Central Bank. In response, commercial banks maintained their basic prime lending rates at 7.5 percent in an effort to encourage borrowing (Figure 15).
The interest rate on term loans remained at 7.5 percent. Commercial banks’ weighted average lending rate was also anchored at 7.5 percent while the weighted average deposit rate held constant at a subdued 0.2 percent. The spread between the weighted average deposit rates and the weighted average loan rates remained at 7.3 percent over the review period (Figure 16).
Increased open market operations by the Central Bank in April 2014, has precipitated a pickup in short-term and long-term interest rates. The 3-month Treasury Bill rate stood at 0.14 percent in May 2014, up from 0.07 percent in October 2013. Meanwhile the US 3-month Treasury Bill rate stood at 0.03 percent in May 2014, down from 0.05 percent in October 2013. This resulted in a widening of the United States-Trinidad and Tobago interest rates differential by 11 basis points in May 2014 from 0.02 percent in October 2013.
THE MONETARY SECTOR
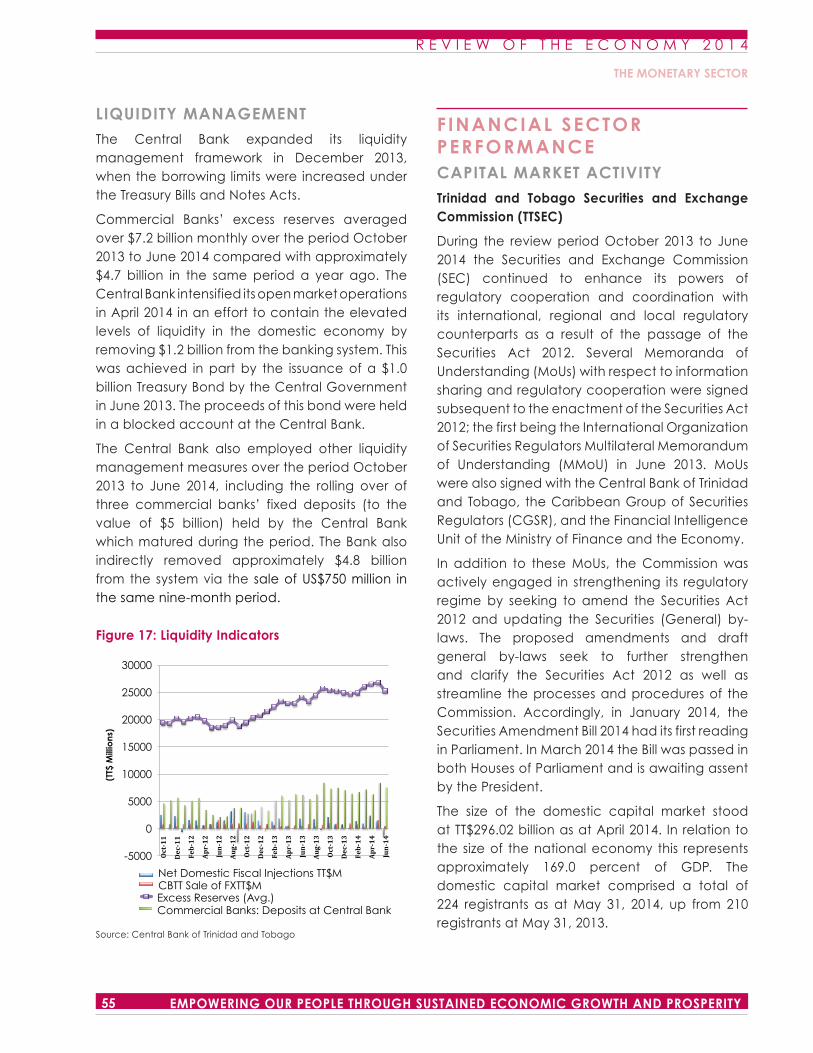
R E V I E W O F T H E E C O N O M Y 2 0 1 4
55 EMPOWERING OUR PEOPLE THROUGH SUSTAINED ECONOMIC GROWTH AND PROSPERITY
LIQUIDITY MANAGEMENT
The Central Bank expanded its liquidity management framework in December 2013, when the borrowing limits were increased under the Treasury Bills and Notes Acts.
Commercial Banks’ excess reserves averaged over $7.2 billion monthly over the period October 2013 to June 2014 compared with approximately $4.7 billion in the same period a year ago. The Central Bank intensified its open market operations in April 2014 in an effort to contain the elevated levels of liquidity in the domestic economy by removing $1.2 billion from the banking system. This was achieved in part by the issuance of a $1.0 billion Treasury Bond by the Central Government in June 2013. The proceeds of this bond were held in a blocked account at the Central Bank.
The Central Bank also employed other liquidity management measures over the period October 2013 to June 2014, including the rolling over of three commercial banks’ fixed deposits (to the value of $5 billion) held by the Central Bank which matured during the period. The Bank also indirectly removed approximately $4.8 billion from the system via the sale of US$750 million in the same nine-month period.
Figure 17: Liquidity Indicators
Source: Central Bank of Trinidad and Tobago
F INANCIAL SECTOR PERFORMANCECAPITAL MARKET ACTIVITY
Trinidad and Tobago Securities and Exchange Commission (TTSEC)
During the review period October 2013 to June 2014 the Securities and Exchange Commission (SEC) continued to enhance its powers of regulatory cooperation and coordination with its international, regional and local regulatory counterparts as a result of the passage of the Securities Act 2012. Several Memoranda of Understanding (MoUs) with respect to information sharing and regulatory cooperation were signed subsequent to the enactment of the Securities Act 2012; the first being the International Organization of Securities Regulators Multilateral Memorandum of Understanding (MMoU) in June 2013. MoUs were also signed with the Central Bank of Trinidad and Tobago, the Caribbean Group of Securities Regulators (CGSR), and the Financial Intelligence Unit of the Ministry of Finance and the Economy.
In addition to these MoUs, the Commission was actively engaged in strengthening its regulatory regime by seeking to amend the Securities Act 2012 and updating the Securities (General) by-laws. The proposed amendments and draft general by-laws seek to further strengthen and clarify the Securities Act 2012 as well as streamline the processes and procedures of the Commission. Accordingly, in January 2014, the Securities Amendment Bill 2014 had its first reading in Parliament. In March 2014 the Bill was passed in both Houses of Parliament and is awaiting assent by the President.
The size of the domestic capital market stood at TT$296.02 billion as at April 2014. In relation to the size of the national economy this represents approximately 169.0 percent of GDP. The domestic capital market comprised a total of 224 registrants as at May 31, 2014, up from 210 registrants at May 31, 2013.
30000
25000
20000
15000
10000
5000
0
-5000
Net Domestic Fiscal Injections TT$MCBTT Sale of FXTT$M
(TT$
Mill
ions
)
Excess Reserves (Avg.)Commercial Banks: Deposits at Central Bank
THE MONETARY SECTOR
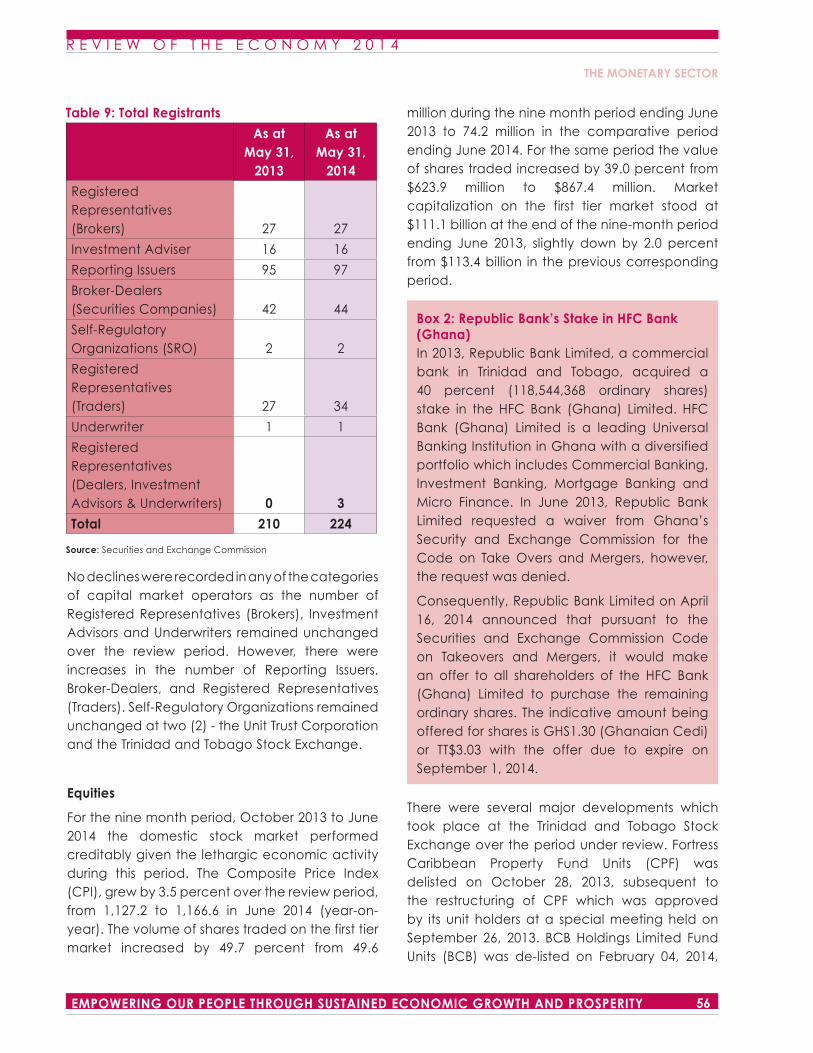
R E V I E W O F T H E E C O N O M Y 2 0 1 4
56EMPOWERING OUR PEOPLE THROUGH SUSTAINED ECONOMIC GROWTH AND PROSPERITY
No declines were recorded in any of the categories of capital market operators as the number of Registered Representatives (Brokers), Investment Advisors and Underwriters remained unchanged over the review period. However, there were increases in the number of Reporting Issuers, Broker-Dealers, and Registered Representatives (Traders). Self-Regulatory Organizations remained unchanged at two (2) - the Unit Trust Corporation and the Trinidad and Tobago Stock Exchange.
Equities
For the nine month period, October 2013 to June 2014 the domestic stock market performed creditably given the lethargic economic activity during this period. The Composite Price Index (CPI), grew by 3.5 percent over the review period, from 1,127.2 to 1,166.6 in June 2014 (year-on-year). The volume of shares traded on the first tier market increased by 49.7 percent from 49.6
million during the nine month period ending June 2013 to 74.2 million in the comparative period ending June 2014. For the same period the value of shares traded increased by 39.0 percent from $623.9 million to $867.4 million. Market capitalization on the first tier market stood at $111.1 billion at the end of the nine-month period ending June 2013, slightly down by 2.0 percent from $113.4 billion in the previous corresponding period.
There were several major developments which took place at the Trinidad and Tobago Stock Exchange over the period under review. Fortress Caribbean Property Fund Units (CPF) was delisted on October 28, 2013, subsequent to the restructuring of CPF which was approved by its unit holders at a special meeting held on September 26, 2013. BCB Holdings Limited Fund Units (BCB) was de-listed on February 04, 2014,
Box 2: Republic Bank’s Stake in HFC Bank (Ghana)In 2013, Republic Bank Limited, a commercial bank in Trinidad and Tobago, acquired a 40 percent (118,544,368 ordinary shares) stake in the HFC Bank (Ghana) Limited. HFC Bank (Ghana) Limited is a leading Universal Banking Institution in Ghana with a diversified portfolio which includes Commercial Banking, Investment Banking, Mortgage Banking and Micro Finance. In June 2013, Republic Bank Limited requested a waiver from Ghana’s Security and Exchange Commission for the Code on Take Overs and Mergers, however, the request was denied.
Consequently, Republic Bank Limited on April 16, 2014 announced that pursuant to the Securities and Exchange Commission Code on Takeovers and Mergers, it would make an offer to all shareholders of the HFC Bank (Ghana) Limited to purchase the remaining ordinary shares. The indicative amount being offered for shares is GHS1.30 (Ghanaian Cedi) or TT$3.03 with the offer due to expire on September 1, 2014.
Table 9: Total Registrants
As at May 31,
2013
As at May 31,
2014
Registered Representatives (Brokers) 27 27
Investment Adviser 16 16
Reporting Issuers 95 97
Broker-Dealers (Securities Companies) 42 44
Self-Regulatory Organizations (SRO) 2 2
Registered Representatives (Traders) 27 34
Underwriter 1 1
Registered Representatives (Dealers, Investment Advisors & Underwriters) 0 3
Total 210 224
Source: Securities and Exchange Commission
THE MONETARY SECTOR
R E V I E W O F T H E E C O N O M Y 2 0 1 4
57 EMPOWERING OUR PEOPLE THROUGH SUSTAINED ECONOMIC GROWTH AND PROSPERITY
pursuant to an application for de-listing made by the Exchange. On January 15, 2014, the Board of Commissioners considered the application and approved the de-listing.
Primary Bond Market
The primary bond market continued its creditable performance in light of current high levels of liquidity and nascent economic activity. A total of ten (10) bonds, with a face value of TT$12,225.2 million, were issued by Trinidad and Tobago issuers on both the domestic and foreign capital markets over the period October 2013 to August 2014. Of the ten (10) bonds issued eight (8), with a face value of TT$8.4 billion, were issued on the domestic capital market; comparing favourably with the performance of the market in the previous comparative period, when eleven (11) bonds with an aggregate face value of just over TT$3.3 billion were issued. In addition to the eight (8) domestic issues, two (2) bonds, with a face value of US$593.39 million, were issued primarily in foreign capital markets. In December 2013, a US$550 million bond was issued by the Central Government, US$500 million of which was raised in foreign capital markets and US$50 million raised in the domestic capital market. The second foreign issue of US$43.4 million was made by Sagicor Financial Corporation.
The primary bond market was again dominated by the State sector as State Enterprises issued four (4) bonds, while the Central Government issued two (2) bonds, raising a combined TT$9,976.5 million, or 81.6 percent of the total face value of bonds issued over the review period. The two issues by the Central Government included a US$550 million bond raised in December 2013 and a TT$1,000 million Treasury Bond raised in June 2014. The first issue carried a maturity period of ten (10) years and a coupon rate of 4.375 percent per annum and was part of the financing of the 2014 budget. The second issue carried a seven (7) year maturity with a coupon rate of 2.2 percent and formed part of a liquidity absorption exercise in collaboration with the Central Bank.
The Central Government also issued a TT$ 335.8 million 1 year bond (equivalent to US$52 million) in June 2014 to assist with liabilities emanating from the CLICO/British American Insurance Company (BAICO) commitments. The Urban Development Corporation of Trinidad and Tobago (UDECOTT) was the dominant State Enterprise issuer, placing one (1) bond in November 2013 with a face value of TT$3,457.8 million; a tenor of 15 years and coupon rate of 4.75 percent. This was part of a bridging finance arrangement for the Government Campus Plaza representing the take out of a $2,400 million bridge loan together with a $1,057.8 million in capitalised interest. In August 2014, First Citizens Bank Limited issued a TT$500.0 million bond, comprising of a TT$400.0 million, 7 year 3.1 percent fixed rate bond, and a TT$100.0, 10 year 3.25 percent fixed rate bond.
The low interest rate environment is indicative of the high levels of liquidity which continues to prevail in the domestic economy. Private sector activity on the domestic capital market was somewhat upbeat as investors sought to take advantage of the low interest rate environment. Of the ten (10) bonds issued during the review period, four (4) came to market as private placements by private sector firms. Unicomer Trinidad Limited issued a $320.5 million, multi-tranche, multi-rate bond in November 2013; Guardian Holdings Limited issued a TT$450.0 million 1 year, 2.8 percent fixed rate bond; Sagicor Financial Corporation issued a US$43.4 (TT$278.4) million 1 and a half year, 4.6 percent per annum fixed rate bond; while Massy Holdings Limited issued a TT$1,200 million bond in August 2014 comprising a TT$600 million 15 year, 5.17 percent fixed rate bond and another TT$600.0 million 10 year, 3.49 percent fixed rate bond.
Mutual Funds
The mutual fund sector continued to be an attractive investment alternative to instruments such as commercial bank deposits and treasury bills, given the prevailing high liquidity, low interest rate environment in the local economy. The nine-
THE MONETARY SECTOR
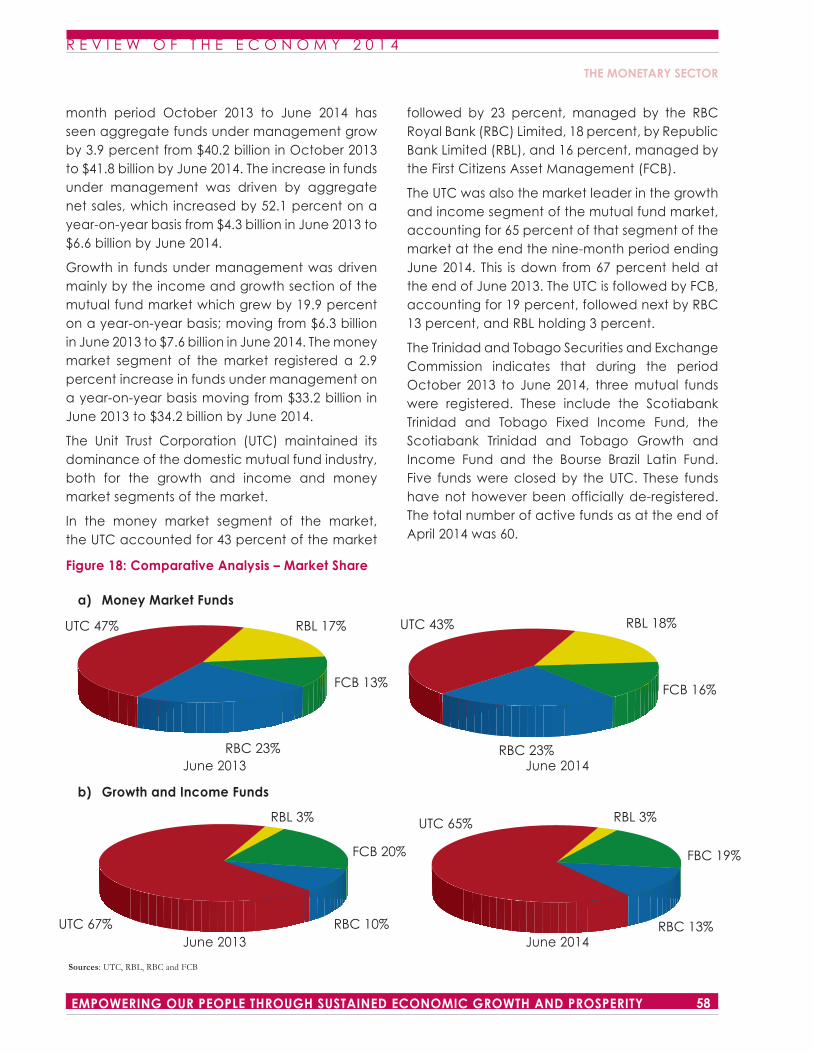
R E V I E W O F T H E E C O N O M Y 2 0 1 4
58EMPOWERING OUR PEOPLE THROUGH SUSTAINED ECONOMIC GROWTH AND PROSPERITY
month period October 2013 to June 2014 has seen aggregate funds under management grow by 3.9 percent from $40.2 billion in October 2013 to $41.8 billion by June 2014. The increase in funds under management was driven by aggregate net sales, which increased by 52.1 percent on a year-on-year basis from $4.3 billion in June 2013 to $6.6 billion by June 2014.
Growth in funds under management was driven mainly by the income and growth section of the mutual fund market which grew by 19.9 percent on a year-on-year basis; moving from $6.3 billion in June 2013 to $7.6 billion in June 2014. The money market segment of the market registered a 2.9 percent increase in funds under management on a year-on-year basis moving from $33.2 billion in June 2013 to $34.2 billion by June 2014.
The Unit Trust Corporation (UTC) maintained its dominance of the domestic mutual fund industry, both for the growth and income and money market segments of the market.
In the money market segment of the market, the UTC accounted for 43 percent of the market
followed by 23 percent, managed by the RBC Royal Bank (RBC) Limited, 18 percent, by Republic Bank Limited (RBL), and 16 percent, managed by the First Citizens Asset Management (FCB).
The UTC was also the market leader in the growth and income segment of the mutual fund market, accounting for 65 percent of that segment of the market at the end the nine-month period ending June 2014. This is down from 67 percent held at the end of June 2013. The UTC is followed by FCB, accounting for 19 percent, followed next by RBC 13 percent, and RBL holding 3 percent.
The Trinidad and Tobago Securities and Exchange Commission indicates that during the period October 2013 to June 2014, three mutual funds were registered. These include the Scotiabank Trinidad and Tobago Fixed Income Fund, the Scotiabank Trinidad and Tobago Growth and Income Fund and the Bourse Brazil Latin Fund. Five funds were closed by the UTC. These funds have not however been officially de-registered. The total number of active funds as at the end of April 2014 was 60.
Figure 18: Comparative Analysis – Market Share
a) Money Market Funds
b) Growth and Income Funds
Sources: UTC, RBL, RBC and FCB
RBL 3%
FCB 20%
RBC 10%UTC 67%
RBL 3%UTC 65%
FBC 19%
RBC 13%
UTC 47% RBL 17%
FCB 13%
RBC 23%
RBL 18%
FCB 16%
RBC 23%
UTC 43%
June 2013
June 2013
June 2014
June 2014
THE MONETARY SECTOR
R E V I E W O F T H E E C O N O M Y 2 0 1 4
59 EMPOWERING OUR PEOPLE THROUGH SUSTAINED ECONOMIC GROWTH AND PROSPERITY
REGULATORY DEVELOPMENTSLEGISLATIVE DEVELOPMENTS
During the review period, the Central Bank of Trinidad and Tobago (CBTT) expanded its regulatory horizon to encompass Systematically Important Financial Institutions (SIFIs). Additionally, in preparation for the Fourth Round Mutual Evaluation to be conducted in 2015, strengthening of the Anti-Money Laundering and Counter Terrorist Financing (AML/CTF) regime continued. Progress was also made in the modernisation of legislation for the Insurance and Credit Union sectors. The CBTT, the Ministry of Finance and the Economy, together with the Board of Inland Revenue (BIR) continued their collaboration to ensure Trinidad and Tobago’s compliance with the requirements of the Foreign Account Tax Compliance Act (FATCA).
Financial Institutions (Prudential Criteria) Regulations, 1994
Following consultation with the Regional Technical Working Group for Basel implementation, the CBTT has revised the initial draft proposals for the repeal and replacement of the Financial Institutions (Prudential Criteria) Regulations, 1994. By August 2014, the revised proposal will be circulated for comments and thereafter, consultations will commence. Further, the CBTT will commence planning for a Quantitative Impact Study. The new Regulations seek to amend the local capital adequacy framework, which governs licenced financial institutions.
The Draft Insurance Bill
The Draft Insurance Bill seeks to provide a new regulatory framework to improve the oversight of insurance companies, strengthen prudential requirements and enhance corporate governance practices within the sector. The Insurance Bill 2013 was laid in Parliament in November 2013 and is currently before a Joint Select Committee (JSC) for a detailed review
based on stakeholder representations. The JSC is expected to provide a report to Parliament in 2014.
The Draft Credit Union Bill
The draft Credit Union Bill seeks to regulate the financial activities of Credit Unions and secondary bodies carrying on the business of a Credit Union. The revised draft Credit Union Bill and consequential amendments to the Co-operatives Societies Act are currently before the Legislative Review Committee (LRC). Further, in March 2014, the Consultation Paper for the establishment of mandatory protection for depositors and members of Credit Unions was issued by the CBTT.
Occupational Pension Plans Bill
The CBTT issued the final Policy Proposal Document (PPD) for the development of an Occupational Pension Plans Bill in December 2012. The proposals seek to ensure that the rights of plan members and beneficiaries are protected through the strengthening of prudential criteria, increased disclosure requirements and improved governance. Currently, refinements are being considered for provisions for the alignment of the framework in both the private and public sectors.
Bureaux de Change
The CBTT has commenced the strengthening of the legislative framework for and supervision of Bureaux de Change. In April 2014, the CBTT presented protocols for a revised regulatory and supervisory framework, incorporating additional licensing requirements such as minimum capital requirements and proper criteria for officers and directors.
Foreign Account Tax Compliance Act (FATCA)
The United States (US) FATCA, which took effect on January 1, 2013, requires that the global financial industry track and report to the US Internal Revenue
THE MONETARY SECTOR
R E V I E W O F T H E E C O N O M Y 2 0 1 4
60EMPOWERING OUR PEOPLE THROUGH SUSTAINED ECONOMIC GROWTH AND PROSPERITY
Services (IRS), any US citizen who holds offshore financial accounts. In making relevant preparations for compliance with FATCA, the Government of Trinidad and Tobago engaged the IRS in discussions for the adoption of Model 1: Reciprocal Intergovernmental Agreement of FATCA.
Under this model, financial institutions in Trinidad and Tobago will report the required information to the BIR who would be designated the Local Competent Authority. Currently, the necessary legislation is being reviewed to amend the support of the transmission of tax information, and to give the BIR the appropriate authority in this respect.
Financial Institutions have since been advised to register on the FATCA website as a “Participating Institution” until such time that Trinidad and Tobago enters into an Agreement in Substance with the US Government. At that time, the financial institutions are required to change their registration to a “Model 1 Institution”.
Regulating Systemically Important Financial Institutions (SIFIs)
In December 2013, Cabinet agreed that five (5) institutions, which were previously unregulated, be treated as SIFIs and come under the CBTT’s regulatory remit. These institutions are:
I. the Home Mortgage Bank (HMB);
ii. the Board of Management incorporated under the National Insurance Act, Chap. 32:01;
iii. the Unit Trust Corporation of Trinidad and Tobago (UTC);
iv. the Trinidad and Tobago Mortgage Finance Company (TTMF); and
v. the Agricultural Development Bank of Trinidad and Tobago (ADB).
These institutions, along with the four (4) largest banks and two (2) largest insurance companies, have been deemed SIFIs given their size and the socio-economic implications of their failure to the country.
Anti-Money Laundering and Counter Terrorist Financing (AML/CFT)
Trinidad and Tobago continued to strengthen its AML/CFT regime and address deficiencies identified in the Third Round Mutual Evaluation of 2005. In May 2014, the Caribbean Financial Action Task Force (CFATF) Plenary reported that Trinidad and Tobago had made significant progress in its compliance with the Core and Key Recommendations. Trinidad and Tobago was rated fully compliant with eight (8) Core and Key Recommendations, and largely compliant with the remaining Recommendations, except for Recommendation #3: Money laundering offence. Moreover, Trinidad and Tobago commenced the conduct of a National Risk Assessment in preparation for the Fourth Round Mutual Evaluation scheduled for January 2015.
In May 2014, the Financial Intelligence Unit (FIU) signed a Memorandum of Understanding with the Trinidad and Tobago Securities and Exchange Commission (TTSEC) and the CBTT for enhanced cooperation and collaboration in the regulation of the AML/CFT. All Supervisory Authorities have significantly increased the number of on-site examinations to ensure adequacy of compliance among those supervised.
Capital Market Development
During the review period, the CBTT organised a Capital Markets Development Initiative (CMDI) and formed a CMDI Secretariat for the orderly development of Trinidad and Tobago’s Capital Markets.
National Financial Crisis Management Plan
In February 2014, the Ministry of Finance and the Economy, the Deposit Insurance Corporation (DIC) and the TTSEC, approved the draft National Financial Crisis Management Plan and established a Representative Task Force. The Task Force will undertake the development of the Operational and Legal sections of the National Financial Crisis Management Plan before the end of 2014.
THE MONETARY SECTOR
R E V I E W O F T H E E C O N O M Y 2 0 1 4
61 EMPOWERING OUR PEOPLE THROUGH SUSTAINED ECONOMIC GROWTH AND PROSPERITY
T R A D E A N D PAY M E N T S
Balance of Payments
Heritage and Stabilisation Fund
Balance of Visible Trade
BALANCE OF PAYMENTSThe Balance of Payments (BOP) is projected to record a surplus of US$786.3 million in 2013, representing a vast improvement from the deficit of US$622.0 million projected for 2012. This surplus is a reflection of a positive expansion in the current account balance, which improved from US$939.7 million in 2012 to US$2,571.5 million in 2013. The capital and financial account deficit grew from US$1,561.7 million in 2012 to US$1,785.2 million in 2013. (Table 10)
CURRENT ACCOUNT
The current account increased by 173.7 percent due mainly to a 79.3 percent improvement in the services (net) account. The merchandise trade balance registered a marginal decline, moving from US$3,918.4 million in 2012 to US$3,898.8 in 2013, due in part to declines in both exports and imports. The services (net) account increased by 79.0 percent in 2013 mainly due to lower net outflows of communication and insurance services; moving from US$369.2 million in 2012 to US$662.0 million in 2013. Income (net) registered a deficit of US$2,015.3 million in 2013 due to lower dividend payments to foreign direct investors as well as a reduction in the earnings of foreign firms. Also contributing to the positive performance in the current account is the 2.1 percent decline in
imports from US$9,065.0 in 2012 to US$8,870.8 in 2013. (Table 10)
CAPITAL ACCOUNT
The deficit on the capital account expanded by 14.3 percent due in part to an 85.5 percent increase in the private sector deficit which increased from US$935.6 million in 2012 to US$1,735.8 million in 2013. However, the commercial banks net foreign balances improved from a deficit of US$668.7 in 2012 to a surplus of US$95.0 in 2013 as their net foreign balances abroad was reduced due to a net inflow arising from a matured foreign investment of a non-bank financial institution. The deficit in the public sector component also contracted by 92.1 percent owing to higher government receipts from the December 2013, international bond issue. (Table 10)
FOREIGN RESERVES
Gross Official Reserves (GOR) increased by 8.5 percent from US$9,200.7 million or 10.4 months of prospective import cover in 2012 to US$9,987.0 million or 12.0 months of prospective import cover in 2013. Subsequently gross official reserves expanded to US$10,219.8 million at the end of July 2014, representing 12.0 months of prospective imports of goods and non-factor services. The movement of reserves is reflective of the
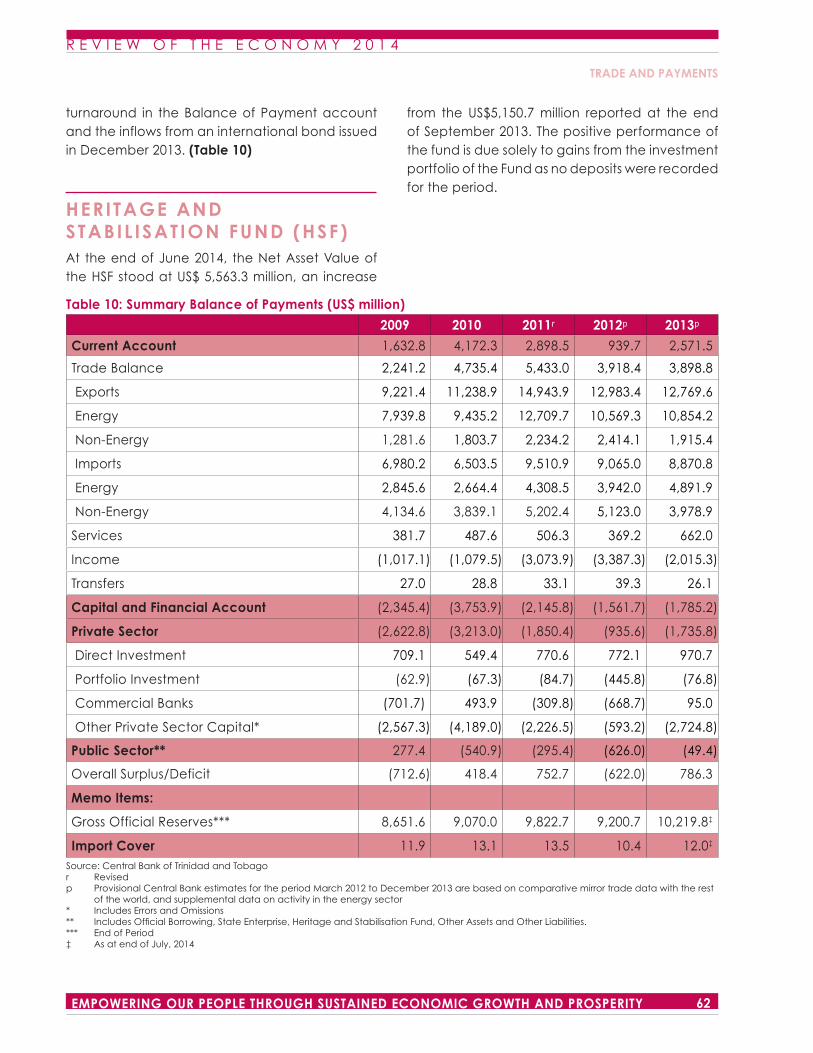
R E V I E W O F T H E E C O N O M Y 2 0 1 4
62EMPOWERING OUR PEOPLE THROUGH SUSTAINED ECONOMIC GROWTH AND PROSPERITY
turnaround in the Balance of Payment account and the inflows from an international bond issued in December 2013. (Table 10)
HERITAGE AND STABIL ISAT ION FUND (HSF)At the end of June 2014, the Net Asset Value of the HSF stood at US$ 5,563.3 million, an increase
from the US$5,150.7 million reported at the end of September 2013. The positive performance of the fund is due solely to gains from the investment portfolio of the Fund as no deposits were recorded for the period.
Table 10: Summary Balance of Payments (US$ million)
2009 2010 2011ʳ 2012ᵖ 2013ᵖCurrent Account 1,632.8 4,172.3 2,898.5 939.7 2,571.5
Trade Balance 2,241.2 4,735.4 5,433.0 3,918.4 3,898.8
Exports 9,221.4 11,238.9 14,943.9 12,983.4 12,769.6
Energy 7,939.8 9,435.2 12,709.7 10,569.3 10,854.2
Non-Energy 1,281.6 1,803.7 2,234.2 2,414.1 1,915.4
Imports 6,980.2 6,503.5 9,510.9 9,065.0 8,870.8
Energy 2,845.6 2,664.4 4,308.5 3,942.0 4,891.9
Non-Energy 4,134.6 3,839.1 5,202.4 5,123.0 3,978.9
Services 381.7 487.6 506.3 369.2 662.0
Income (1,017.1) (1,079.5) (3,073.9) (3,387.3) (2,015.3)
Transfers 27.0 28.8 33.1 39.3 26.1
Capital and Financial Account (2,345.4) (3,753.9) (2,145.8) (1,561.7) (1,785.2)
Private Sector (2,622.8) (3,213.0) (1,850.4) (935.6) (1,735.8)
Direct Investment 709.1 549.4 770.6 772.1 970.7
Portfolio Investment (62.9) (67.3) (84.7) (445.8) (76.8)
Commercial Banks (701.7) 493.9 (309.8) (668.7) 95.0
Other Private Sector Capital* (2,567.3) (4,189.0) (2,226.5) (593.2) (2,724.8)
Public Sector** 277.4 (540.9) (295.4) (626.0) (49.4)
Overall Surplus/Deficit (712.6) 418.4 752.7 (622.0) 786.3
Memo Items:
Gross Official Reserves*** 8,651.6 9,070.0 9,822.7 9,200.7 10,219.8‡
Import Cover 11.9 13.1 13.5 10.4 12.0‡ Source: Central Bank of Trinidad and Tobagor Revisedp Provisional Central Bank estimates for the period March 2012 to December 2013 are based on comparative mirror trade data with the rest
of the world, and supplemental data on activity in the energy sector* Includes Errors and Omissions** Includes Official Borrowing, State Enterprise, Heritage and Stabilisation Fund, Other Assets and Other Liabilities.*** End of Period‡ As at end of July, 2014
TRADE AND PAYMENTS
R E V I E W O F T H E E C O N O M Y 2 0 1 4
63 EMPOWERING OUR PEOPLE THROUGH SUSTAINED ECONOMIC GROWTH AND PROSPERITY
BALANCE OF VIS IBLE TRADEFor the period April 2013 to May 2014, Trinidad and Tobago’s balance of visible trade declined by 33.0 percent to TT$21,164.7 million from TT$31,579.8 million in the previous comparative period. Exports declined from TT$120,178.8 million to TT$112,346.7 million while imports marginally expanded from TT$88,599.0 million to TT$91,182.0 million in the corresponding period. This under-performance in the balance of visible trade was attributed to declines in trade in mineral fuel (44.7 percent), trade in mineral fuels non- UPA (43.3 percent), trade excluding mineral fuels UPA (32.6 percent) and trade excluding mineral fuels (28.0 percent). The trade deficit in mineral fuels UPA persisted as it expanded by 413.9 percent in the period under review (Appendix 28).
CARICOM TRADETrinidad and Tobago’s balance of trade with CARICOM countries increased from TT$17,614.5 million for the period April 2012 to May 2013, to TT$18,848.9 million for the period April 2013 to May 2014. The improvement in the trade balance reflects an 11.8 percent increase in the export of mineral fuels which moved from TT$14,572.4 million to TT$16,201.8 million. Import of mineral fuels declined by 1.8 percent, moving from TT$566.7 million to TT$556.3 million in the same period. However, the balance of trade, excluding mineral fuels declined by 11.2 percent from TT$3,608.8 million to TT$3,203.4 million. This decline is attributed to a 12.8 percent fall in exports excluding mineral fuels as it more than outweighed the 18.3 percent decline in imports excluding mineral fuels (Appendix 27).
CARICOM-CANADA TRADE AND DEVELOPMENT AGREEMENTNegotiations for the CARICOM-Canada Trade and Development Agreement, designed to replace the Caribbean-Canada Trade Agreement (CARIBCAN) waiver are in an uncertain state.
Prior to the 7th and last Negotiating Round, Canada informed that 30 June 2014 marked the end of its negotiating mandate and the date for conclusion of the Agreement. However, at the end of the Seventh Round of Negotiations held in June 2014, three key areas still remained outstanding preventing an Agreement, namely Market Access in Goods, Services and Investment.
CARICOM Heads of Government have since approached Canada on a way forward in light of the impasse. In the absence of a successful conclusion of the CARICOM-Canada Trade and Development Agreement before 1 August 2014, Trinidad and Tobago has signalled that it may purse a Bilateral Free Trade Agreement or some other arrangement with Canada to secure its trading interests in that market.
TR INIDAD AND TOBAGO / EL SALVADOR AGREEMENTTrinidad and Tobago commenced negotiations with El Salvador for a Partial Scope Agreement (PSA) in October 2013. This Agreement will cover Goods, Services, Institutional Issues and Dispute Settlement and also seeks to concretize Trinidad and Tobago’s efforts to enhance export capacity and deepen trade relations with Central America. Three (3) Rounds of negotiations have been completed thus far and the negotiations are still on-going.
TRADE AND PAYMENTS
R E V I E W O F T H E E C O N O M Y 2 0 1 4
64EMPOWERING OUR PEOPLE THROUGH SUSTAINED ECONOMIC GROWTH AND PROSPERITY
Trinidad and Tobago also commenced negotiations for a Bilateral Investment Treaty (BIT) in January 2014, which aims at creating the framework for the promotion and protection of the investment, of nationals and companies in both Trinidad and Tobago and El Salvador. It is expected that the negotiations for the PSTA and the BIT will be completed by the end of calendar 2014.
TR INIDAD AND TOBAGO/ GUATEMALA PART IAL SCOPE AGREEMENTTrinidad and Tobago and Guatemala concluded negotiations for a Partial Scope Trade Agreement and Agreements in Investment, Culture and Tourism in 2013.
The Agreement was submitted to the Thirty-Seventh Meeting of the CARICOM Council for Trade and Economic Development (COTED) in November 2013 for its approval. Some CARICOM Member States have indicated objections to some of the commitments made in the Agreement, especially in relation to specific goods such as cheese, breadfruit, sorrel and pharmaceutical products.
Trinidad and Tobago is working to resolve the outstanding areas of divergence with CARICOM Member States towards entry into force and implementation of the Agreement by way of domestic legislation. It is expected that the Agreement will be finalized by the end of calendar 2014.
TR INIDAD AND TOBAGO / PANAMA PART IAL SCOPE AGREEMENTThe Trinidad and Tobago/Panama Partial Scope Agreement which was signed in October 2013 provides access into Panama for 230 products from Trinidad and Tobago and offers reduced tariffs on 248 products from Panama.
Trinidad and Tobago fulfilled its legal requirements under the Revised Treaty of Chaguaramas for obtaining approval from CARICOM and is currently working towards implementing the Agreement by way of domestic legislation. The Agreement also provides for future negotiation of a Bilateral Investment Treaty (BIT); services liberalization and additional market access for products three (3) years after entry into force.
WORLD TRADE ORGANIZATION (WTO) – AGREEMENT ON TRADE FACIL I TAT IONIn December 2013, Members of the World Trade Organization (WTO) finalized a multilateral trade agreement, commonly referred to as the “Bali Package”. The Bali package consists of a subset of four agreements (Trade Facilitation, Agriculture, Cotton and Development) from the broader Doha Development Agenda. The package also includes a number of other agreements for the regular work of the WTO Council of Ministers.
Of the four agreements concluded on the Doha Agenda, the most significant is the Agreement on Trade Facilitation. The Agreement seeks to reduce the cost of trading by eliminating bureaucratic red tape and limiting processing times at the border and ports of entry. For Trinidad and Tobago, this Agreement would complement the country’s efforts to improve the ease of doing business locally.
TRADE AND PAYMENTS
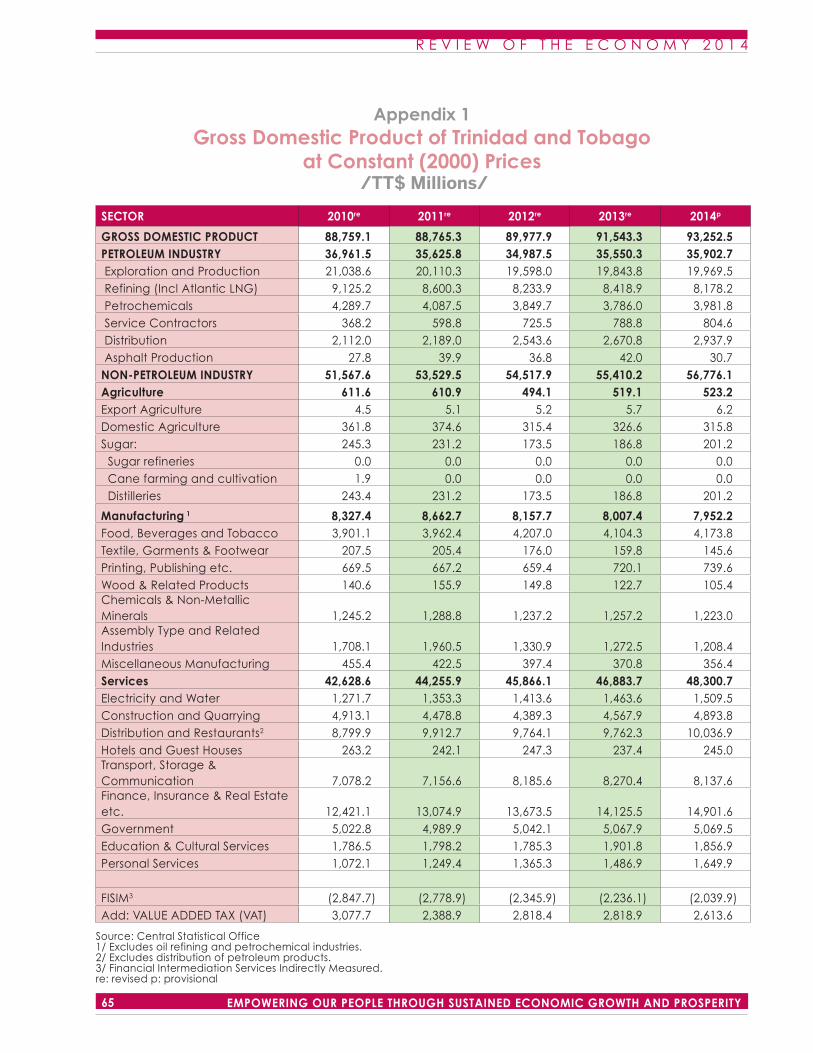
R E V I E W O F T H E E C O N O M Y 2 0 1 4
PBEMPOWERING OUR PEOPLE THROUGH SUSTAINED ECONOMIC GROWTH AND PROSPERITY
R E V I E W O F T H E E C O N O M Y 2 0 1 4
65 EMPOWERING OUR PEOPLE THROUGH SUSTAINED ECONOMIC GROWTH AND PROSPERITY
Appendix 1Gross Domestic Product of Trinidad and Tobago
at Constant (2000) Prices /TT$ Millions/
SECTOR 2010re 2011re 2012re 2013re 2014p
GROSS DOMESTIC PRODUCT 88,759.1 88,765.3 89,977.9 91,543.3 93,252.5 PETROLEUM INDUSTRY 36,961.5 35,625.8 34,987.5 35,550.3 35,902.7 Exploration and Production 21,038.6 20,110.3 19,598.0 19,843.8 19,969.5 Refining (Incl Atlantic LNG) 9,125.2 8,600.3 8,233.9 8,418.9 8,178.2 Petrochemicals 4,289.7 4,087.5 3,849.7 3,786.0 3,981.8 Service Contractors 368.2 598.8 725.5 788.8 804.6 Distribution 2,112.0 2,189.0 2,543.6 2,670.8 2,937.9 Asphalt Production 27.8 39.9 36.8 42.0 30.7 NON-PETROLEUM INDUSTRY 51,567.6 53,529.5 54,517.9 55,410.2 56,776.1 Agriculture 611.6 610.9 494.1 519.1 523.2 Export Agriculture 4.5 5.1 5.2 5.7 6.2 Domestic Agriculture 361.8 374.6 315.4 326.6 315.8 Sugar: 245.3 231.2 173.5 186.8 201.2 Sugar refineries 0.0 0.0 0.0 0.0 0.0 Cane farming and cultivation 1.9 0.0 0.0 0.0 0.0 Distilleries 243.4 231.2 173.5 186.8 201.2
Manufacturing 1 8,327.4 8,662.7 8,157.7 8,007.4 7,952.2 Food, Beverages and Tobacco 3,901.1 3,962.4 4,207.0 4,104.3 4,173.8 Textile, Garments & Footwear 207.5 205.4 176.0 159.8 145.6 Printing, Publishing etc. 669.5 667.2 659.4 720.1 739.6 Wood & Related Products 140.6 155.9 149.8 122.7 105.4 Chemicals & Non-Metallic Minerals 1,245.2 1,288.8 1,237.2 1,257.2 1,223.0 Assembly Type and Related Industries 1,708.1 1,960.5 1,330.9 1,272.5 1,208.4 Miscellaneous Manufacturing 455.4 422.5 397.4 370.8 356.4 Services 42,628.6 44,255.9 45,866.1 46,883.7 48,300.7 Electricity and Water 1,271.7 1,353.3 1,413.6 1,463.6 1,509.5 Construction and Quarrying 4,913.1 4,478.8 4,389.3 4,567.9 4,893.8 Distribution and Restaurants2 8,799.9 9,912.7 9,764.1 9,762.3 10,036.9 Hotels and Guest Houses 263.2 242.1 247.3 237.4 245.0 Transport, Storage & Communication 7,078.2 7,156.6 8,185.6 8,270.4 8,137.6 Finance, Insurance & Real Estate etc. 12,421.1 13,074.9 13,673.5 14,125.5 14,901.6 Government 5,022.8 4,989.9 5,042.1 5,067.9 5,069.5 Education & Cultural Services 1,786.5 1,798.2 1,785.3 1,901.8 1,856.9 Personal Services 1,072.1 1,249.4 1,365.3 1,486.9 1,649.9
FISIM3 (2,847.7) (2,778.9) (2,345.9) (2,236.1) (2,039.9)Add: VALUE ADDED TAX (VAT) 3,077.7 2,388.9 2,818.4 2,818.9 2,613.6
Source: Central Statistical Office 1/ Excludes oil refining and petrochemical industries. 2/ Excludes distribution of petroleum products. 3/ Financial Intermediation Services Indirectly Measured. re: revised p: provisional
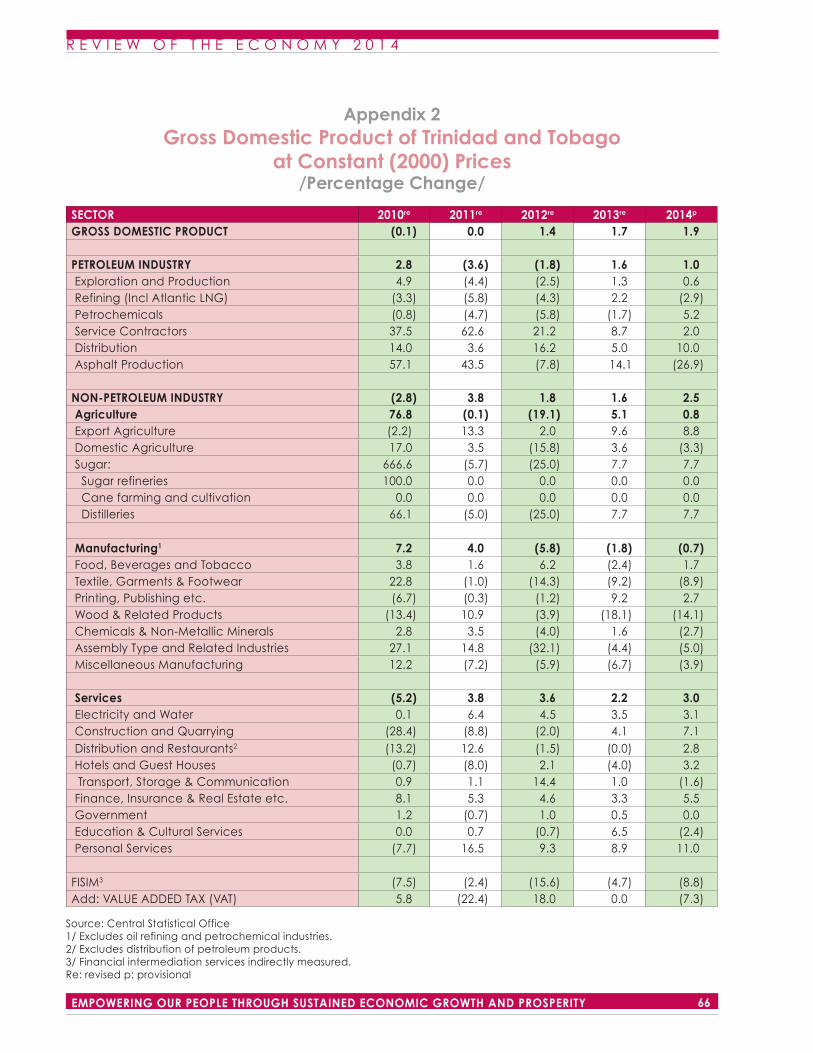
R E V I E W O F T H E E C O N O M Y 2 0 1 4
66EMPOWERING OUR PEOPLE THROUGH SUSTAINED ECONOMIC GROWTH AND PROSPERITY
R E V I E W O F T H E E C O N O M Y 2 0 1 4
67 EMPOWERING OUR PEOPLE THROUGH SUSTAINED ECONOMIC GROWTH AND PROSPERITY
Appendix 2Gross Domestic Product of Trinidad and Tobago
at Constant (2000) Prices/Percentage Change/
SECTOR 2010re 2011re 2012re 2013re 2014p
GROSS DOMESTIC PRODUCT (0.1) 0.0 1.4 1.7 1.9 PETROLEUM INDUSTRY 2.8 (3.6) (1.8) 1.6 1.0 Exploration and Production 4.9 (4.4) (2.5) 1.3 0.6 Refining (Incl Atlantic LNG) (3.3) (5.8) (4.3) 2.2 (2.9) Petrochemicals (0.8) (4.7) (5.8) (1.7) 5.2 Service Contractors 37.5 62.6 21.2 8.7 2.0 Distribution 14.0 3.6 16.2 5.0 10.0 Asphalt Production 57.1 43.5 (7.8) 14.1 (26.9) NON-PETROLEUM INDUSTRY (2.8) 3.8 1.8 1.6 2.5 Agriculture 76.8 (0.1) (19.1) 5.1 0.8 Export Agriculture (2.2) 13.3 2.0 9.6 8.8 Domestic Agriculture 17.0 3.5 (15.8) 3.6 (3.3) Sugar: 666.6 (5.7) (25.0) 7.7 7.7
Sugar refineries 100.0 0.0 0.0 0.0 0.0 Cane farming and cultivation 0.0 0.0 0.0 0.0 0.0 Distilleries 66.1 (5.0) (25.0) 7.7 7.7
Manufacturing1 7.2 4.0 (5.8) (1.8) (0.7) Food, Beverages and Tobacco 3.8 1.6 6.2 (2.4) 1.7 Textile, Garments & Footwear 22.8 (1.0) (14.3) (9.2) (8.9) Printing, Publishing etc. (6.7) (0.3) (1.2) 9.2 2.7 Wood & Related Products (13.4) 10.9 (3.9) (18.1) (14.1) Chemicals & Non-Metallic Minerals 2.8 3.5 (4.0) 1.6 (2.7) Assembly Type and Related Industries 27.1 14.8 (32.1) (4.4) (5.0) Miscellaneous Manufacturing 12.2 (7.2) (5.9) (6.7) (3.9) Services (5.2) 3.8 3.6 2.2 3.0 Electricity and Water 0.1 6.4 4.5 3.5 3.1 Construction and Quarrying (28.4) (8.8) (2.0) 4.1 7.1 Distribution and Restaurants2 (13.2) 12.6 (1.5) (0.0) 2.8 Hotels and Guest Houses (0.7) (8.0) 2.1 (4.0) 3.2
Transport, Storage & Communication 0.9 1.1 14.4 1.0 (1.6) Finance, Insurance & Real Estate etc. 8.1 5.3 4.6 3.3 5.5 Government 1.2 (0.7) 1.0 0.5 0.0 Education & Cultural Services 0.0 0.7 (0.7) 6.5 (2.4) Personal Services (7.7) 16.5 9.3 8.9 11.0 FISIM3 (7.5) (2.4) (15.6) (4.7) (8.8)Add: VALUE ADDED TAX (VAT) 5.8 (22.4) 18.0 0.0 (7.3)
Source: Central Statistical Office1/ Excludes oil refining and petrochemical industries.2/ Excludes distribution of petroleum products. 3/ Financial intermediation services indirectly measured.Re: revised p: provisional
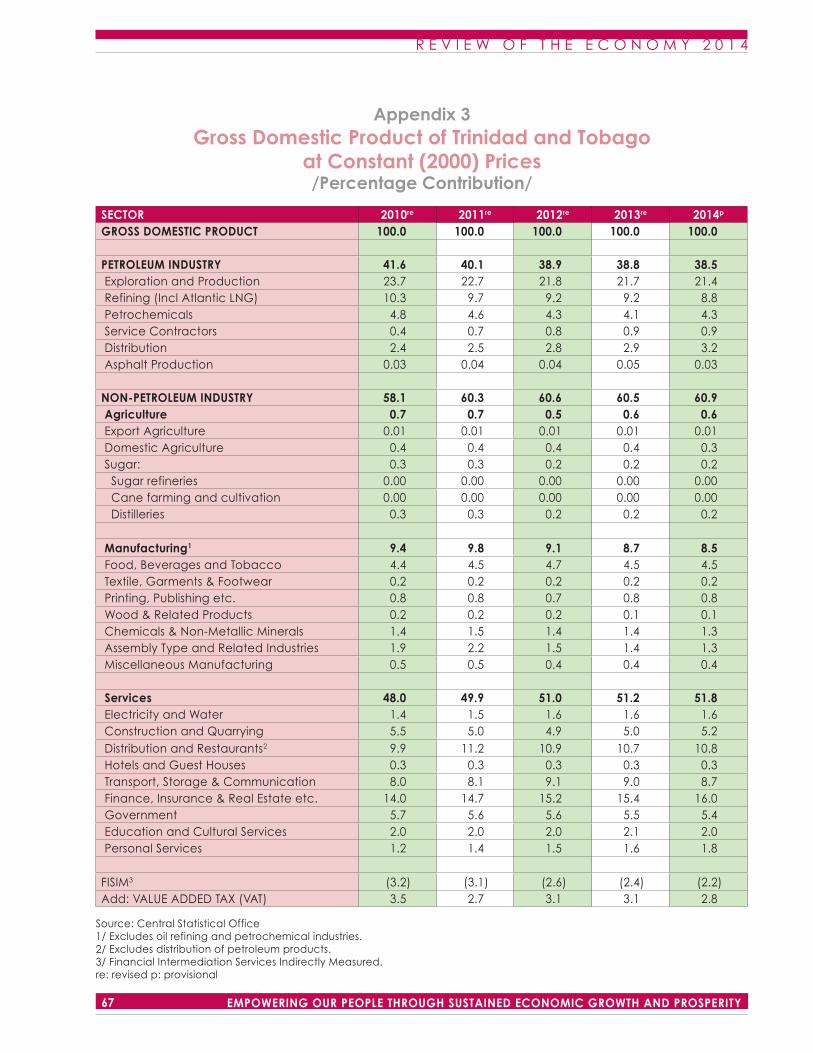
R E V I E W O F T H E E C O N O M Y 2 0 1 4
66EMPOWERING OUR PEOPLE THROUGH SUSTAINED ECONOMIC GROWTH AND PROSPERITY
R E V I E W O F T H E E C O N O M Y 2 0 1 4
67 EMPOWERING OUR PEOPLE THROUGH SUSTAINED ECONOMIC GROWTH AND PROSPERITY
Appendix 3Gross Domestic Product of Trinidad and Tobago
at Constant (2000) Prices/Percentage Contribution/
SECTOR 2010re 2011re 2012re 2013re 2014p
GROSS DOMESTIC PRODUCT 100.0 100.0 100.0 100.0 100.0 PETROLEUM INDUSTRY 41.6 40.1 38.9 38.8 38.5 Exploration and Production 23.7 22.7 21.8 21.7 21.4 Refining (Incl Atlantic LNG) 10.3 9.7 9.2 9.2 8.8 Petrochemicals 4.8 4.6 4.3 4.1 4.3 Service Contractors 0.4 0.7 0.8 0.9 0.9 Distribution 2.4 2.5 2.8 2.9 3.2 Asphalt Production 0.03 0.04 0.04 0.05 0.03 NON-PETROLEUM INDUSTRY 58.1 60.3 60.6 60.5 60.9 Agriculture 0.7 0.7 0.5 0.6 0.6 Export Agriculture 0.01 0.01 0.01 0.01 0.01 Domestic Agriculture 0.4 0.4 0.4 0.4 0.3 Sugar: 0.3 0.3 0.2 0.2 0.2
Sugar refineries 0.00 0.00 0.00 0.00 0.00 Cane farming and cultivation 0.00 0.00 0.00 0.00 0.00 Distilleries 0.3 0.3 0.2 0.2 0.2
Manufacturing1 9.4 9.8 9.1 8.7 8.5 Food, Beverages and Tobacco 4.4 4.5 4.7 4.5 4.5 Textile, Garments & Footwear 0.2 0.2 0.2 0.2 0.2 Printing, Publishing etc. 0.8 0.8 0.7 0.8 0.8 Wood & Related Products 0.2 0.2 0.2 0.1 0.1 Chemicals & Non-Metallic Minerals 1.4 1.5 1.4 1.4 1.3 Assembly Type and Related Industries 1.9 2.2 1.5 1.4 1.3 Miscellaneous Manufacturing 0.5 0.5 0.4 0.4 0.4 Services 48.0 49.9 51.0 51.2 51.8 Electricity and Water 1.4 1.5 1.6 1.6 1.6 Construction and Quarrying 5.5 5.0 4.9 5.0 5.2 Distribution and Restaurants2 9.9 11.2 10.9 10.7 10.8 Hotels and Guest Houses 0.3 0.3 0.3 0.3 0.3 Transport, Storage & Communication 8.0 8.1 9.1 9.0 8.7 Finance, Insurance & Real Estate etc. 14.0 14.7 15.2 15.4 16.0 Government 5.7 5.6 5.6 5.5 5.4 Education and Cultural Services 2.0 2.0 2.0 2.1 2.0 Personal Services 1.2 1.4 1.5 1.6 1.8 FISIM3 (3.2) (3.1) (2.6) (2.4) (2.2)Add: VALUE ADDED TAX (VAT) 3.5 2.7 3.1 3.1 2.8
Source: Central Statistical Office1/ Excludes oil refining and petrochemical industries.2/ Excludes distribution of petroleum products. 3/ Financial Intermediation Services Indirectly Measured.re: revised p: provisional
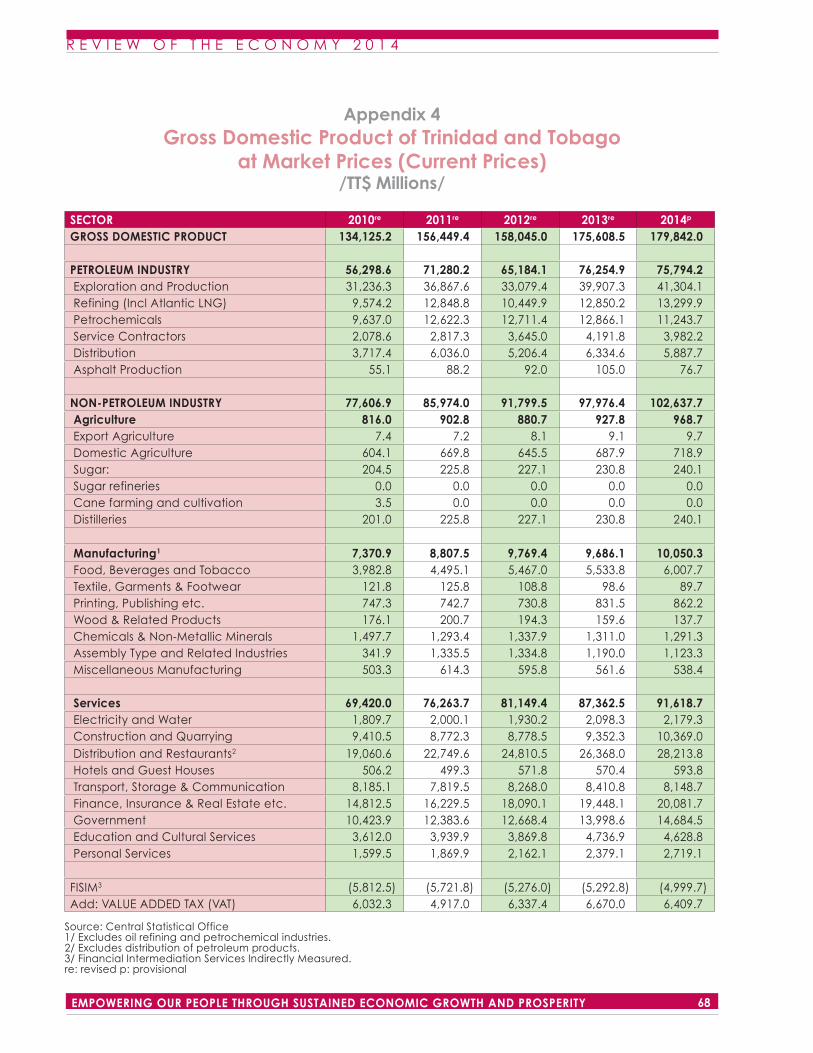
R E V I E W O F T H E E C O N O M Y 2 0 1 4
68EMPOWERING OUR PEOPLE THROUGH SUSTAINED ECONOMIC GROWTH AND PROSPERITY
R E V I E W O F T H E E C O N O M Y 2 0 1 4
69 EMPOWERING OUR PEOPLE THROUGH SUSTAINED ECONOMIC GROWTH AND PROSPERITY
Appendix 4Gross Domestic Product of Trinidad and Tobago
at Market Prices (Current Prices)/TT$ Millions/
SECTOR 2010re 2011re 2012re 2013re 2014p
GROSS DOMESTIC PRODUCT 134,125.2 156,449.4 158,045.0 175,608.5 179,842.0 PETROLEUM INDUSTRY 56,298.6 71,280.2 65,184.1 76,254.9 75,794.2 Exploration and Production 31,236.3 36,867.6 33,079.4 39,907.3 41,304.1 Refining (Incl Atlantic LNG) 9,574.2 12,848.8 10,449.9 12,850.2 13,299.9 Petrochemicals 9,637.0 12,622.3 12,711.4 12,866.1 11,243.7 Service Contractors 2,078.6 2,817.3 3,645.0 4,191.8 3,982.2 Distribution 3,717.4 6,036.0 5,206.4 6,334.6 5,887.7 Asphalt Production 55.1 88.2 92.0 105.0 76.7 NON-PETROLEUM INDUSTRY 77,606.9 85,974.0 91,799.5 97,976.4 102,637.7 Agriculture 816.0 902.8 880.7 927.8 968.7 Export Agriculture 7.4 7.2 8.1 9.1 9.7 Domestic Agriculture 604.1 669.8 645.5 687.9 718.9 Sugar: 204.5 225.8 227.1 230.8 240.1 Sugar refineries 0.0 0.0 0.0 0.0 0.0 Cane farming and cultivation 3.5 0.0 0.0 0.0 0.0 Distilleries 201.0 225.8 227.1 230.8 240.1 Manufacturing1 7,370.9 8,807.5 9,769.4 9,686.1 10,050.3 Food, Beverages and Tobacco 3,982.8 4,495.1 5,467.0 5,533.8 6,007.7 Textile, Garments & Footwear 121.8 125.8 108.8 98.6 89.7 Printing, Publishing etc. 747.3 742.7 730.8 831.5 862.2 Wood & Related Products 176.1 200.7 194.3 159.6 137.7 Chemicals & Non-Metallic Minerals 1,497.7 1,293.4 1,337.9 1,311.0 1,291.3 Assembly Type and Related Industries 341.9 1,335.5 1,334.8 1,190.0 1,123.3 Miscellaneous Manufacturing 503.3 614.3 595.8 561.6 538.4 Services 69,420.0 76,263.7 81,149.4 87,362.5 91,618.7 Electricity and Water 1,809.7 2,000.1 1,930.2 2,098.3 2,179.3 Construction and Quarrying 9,410.5 8,772.3 8,778.5 9,352.3 10,369.0 Distribution and Restaurants2 19,060.6 22,749.6 24,810.5 26,368.0 28,213.8 Hotels and Guest Houses 506.2 499.3 571.8 570.4 593.8 Transport, Storage & Communication 8,185.1 7,819.5 8,268.0 8,410.8 8,148.7 Finance, Insurance & Real Estate etc. 14,812.5 16,229.5 18,090.1 19,448.1 20,081.7 Government 10,423.9 12,383.6 12,668.4 13,998.6 14,684.5 Education and Cultural Services 3,612.0 3,939.9 3,869.8 4,736.9 4,628.8 Personal Services 1,599.5 1,869.9 2,162.1 2,379.1 2,719.1 FISIM3 (5,812.5) (5,721.8) (5,276.0) (5,292.8) (4,999.7)Add: VALUE ADDED TAX (VAT) 6,032.3 4,917.0 6,337.4 6,670.0 6,409.7
Source: Central Statistical Office1/ Excludes oil refining and petrochemical industries. 2/ Excludes distribution of petroleum products. 3/ Financial Intermediation Services Indirectly Measured.re: revised p: provisional
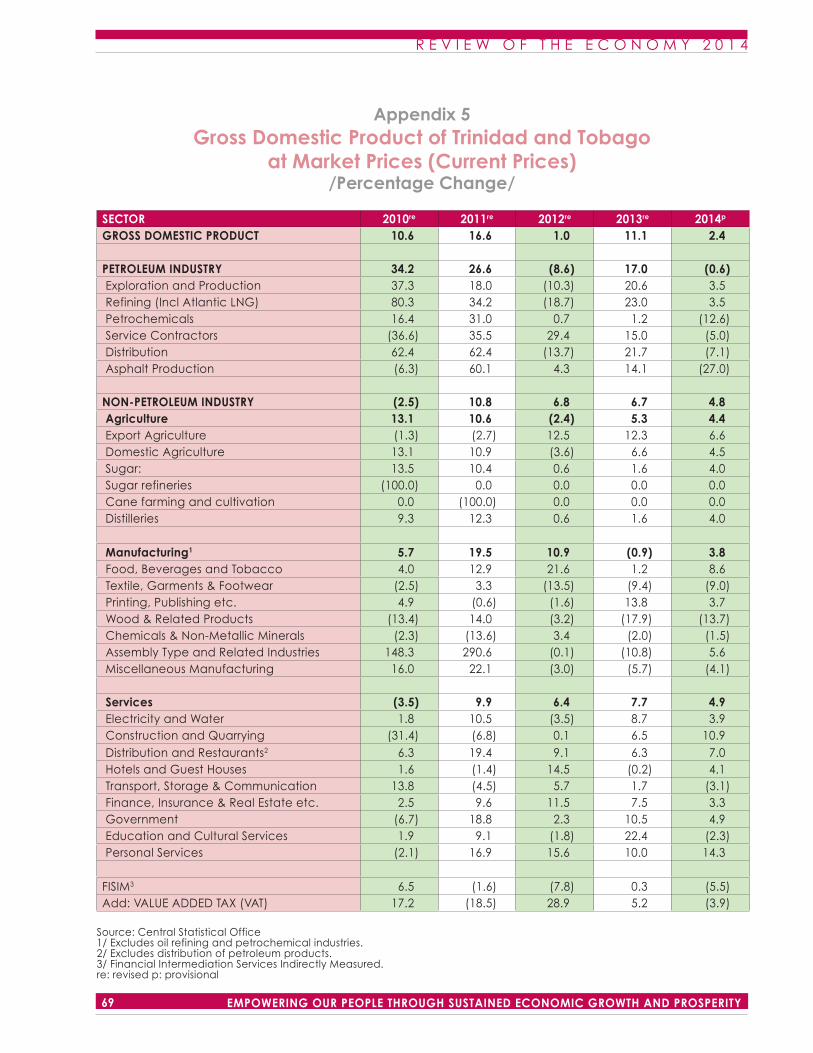
R E V I E W O F T H E E C O N O M Y 2 0 1 4
68EMPOWERING OUR PEOPLE THROUGH SUSTAINED ECONOMIC GROWTH AND PROSPERITY
R E V I E W O F T H E E C O N O M Y 2 0 1 4
69 EMPOWERING OUR PEOPLE THROUGH SUSTAINED ECONOMIC GROWTH AND PROSPERITY
Appendix 5Gross Domestic Product of Trinidad and Tobago
at Market Prices (Current Prices)/Percentage Change/
SECTOR 2010re 2011re 2012re 2013re 2014p
GROSS DOMESTIC PRODUCT 10.6 16.6 1.0 11.1 2.4 PETROLEUM INDUSTRY 34.2 26.6 (8.6) 17.0 (0.6) Exploration and Production 37.3 18.0 (10.3) 20.6 3.5 Refining (Incl Atlantic LNG) 80.3 34.2 (18.7) 23.0 3.5 Petrochemicals 16.4 31.0 0.7 1.2 (12.6) Service Contractors (36.6) 35.5 29.4 15.0 (5.0) Distribution 62.4 62.4 (13.7) 21.7 (7.1) Asphalt Production (6.3) 60.1 4.3 14.1 (27.0) NON-PETROLEUM INDUSTRY (2.5) 10.8 6.8 6.7 4.8 Agriculture 13.1 10.6 (2.4) 5.3 4.4 Export Agriculture (1.3) (2.7) 12.5 12.3 6.6 Domestic Agriculture 13.1 10.9 (3.6) 6.6 4.5 Sugar: 13.5 10.4 0.6 1.6 4.0 Sugar refineries (100.0) 0.0 0.0 0.0 0.0 Cane farming and cultivation 0.0 (100.0) 0.0 0.0 0.0 Distilleries 9.3 12.3 0.6 1.6 4.0 Manufacturing1 5.7 19.5 10.9 (0.9) 3.8 Food, Beverages and Tobacco 4.0 12.9 21.6 1.2 8.6 Textile, Garments & Footwear (2.5) 3.3 (13.5) (9.4) (9.0) Printing, Publishing etc. 4.9 (0.6) (1.6) 13.8 3.7 Wood & Related Products (13.4) 14.0 (3.2) (17.9) (13.7) Chemicals & Non-Metallic Minerals (2.3) (13.6) 3.4 (2.0) (1.5) Assembly Type and Related Industries 148.3 290.6 (0.1) (10.8) 5.6 Miscellaneous Manufacturing 16.0 22.1 (3.0) (5.7) (4.1) Services (3.5) 9.9 6.4 7.7 4.9 Electricity and Water 1.8 10.5 (3.5) 8.7 3.9 Construction and Quarrying (31.4) (6.8) 0.1 6.5 10.9 Distribution and Restaurants2 6.3 19.4 9.1 6.3 7.0 Hotels and Guest Houses 1.6 (1.4) 14.5 (0.2) 4.1 Transport, Storage & Communication 13.8 (4.5) 5.7 1.7 (3.1) Finance, Insurance & Real Estate etc. 2.5 9.6 11.5 7.5 3.3 Government (6.7) 18.8 2.3 10.5 4.9 Education and Cultural Services 1.9 9.1 (1.8) 22.4 (2.3) Personal Services (2.1) 16.9 15.6 10.0 14.3 FISIM3 6.5 (1.6) (7.8) 0.3 (5.5)Add: VALUE ADDED TAX (VAT) 17.2 (18.5) 28.9 5.2 (3.9)
Source: Central Statistical Office1/ Excludes oil refining and petrochemical industries.2/ Excludes distribution of petroleum products.3/ Financial Intermediation Services Indirectly Measured.re: revised p: provisional
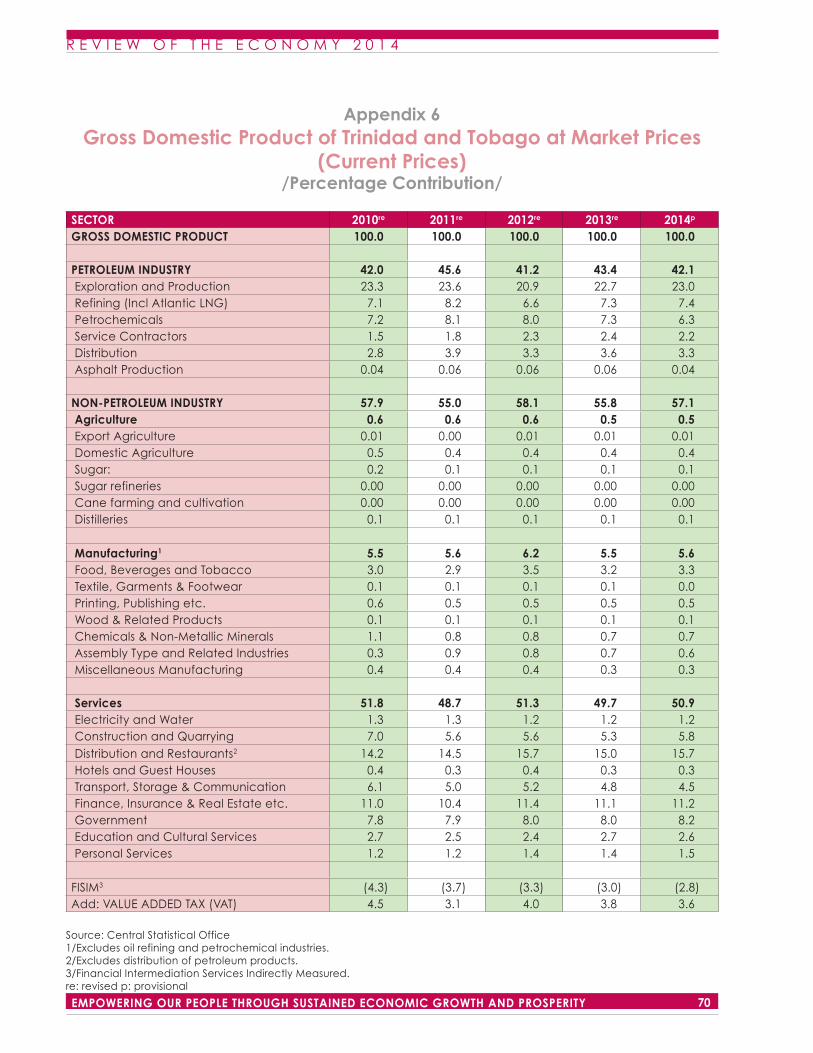
R E V I E W O F T H E E C O N O M Y 2 0 1 4
70EMPOWERING OUR PEOPLE THROUGH SUSTAINED ECONOMIC GROWTH AND PROSPERITY
R E V I E W O F T H E E C O N O M Y 2 0 1 4
71 EMPOWERING OUR PEOPLE THROUGH SUSTAINED ECONOMIC GROWTH AND PROSPERITY
Appendix 6Gross Domestic Product of Trinidad and Tobago at Market Prices
(Current Prices)/Percentage Contribution/
SECTOR 2010re 2011re 2012re 2013re 2014p
GROSS DOMESTIC PRODUCT 100.0 100.0 100.0 100.0 100.0 PETROLEUM INDUSTRY 42.0 45.6 41.2 43.4 42.1 Exploration and Production 23.3 23.6 20.9 22.7 23.0 Refining (Incl Atlantic LNG) 7.1 8.2 6.6 7.3 7.4 Petrochemicals 7.2 8.1 8.0 7.3 6.3 Service Contractors 1.5 1.8 2.3 2.4 2.2 Distribution 2.8 3.9 3.3 3.6 3.3 Asphalt Production 0.04 0.06 0.06 0.06 0.04 NON-PETROLEUM INDUSTRY 57.9 55.0 58.1 55.8 57.1 Agriculture 0.6 0.6 0.6 0.5 0.5 Export Agriculture 0.01 0.00 0.01 0.01 0.01 Domestic Agriculture 0.5 0.4 0.4 0.4 0.4 Sugar: 0.2 0.1 0.1 0.1 0.1 Sugar refineries 0.00 0.00 0.00 0.00 0.00 Cane farming and cultivation 0.00 0.00 0.00 0.00 0.00 Distilleries 0.1 0.1 0.1 0.1 0.1 Manufacturing1 5.5 5.6 6.2 5.5 5.6 Food, Beverages and Tobacco 3.0 2.9 3.5 3.2 3.3 Textile, Garments & Footwear 0.1 0.1 0.1 0.1 0.0 Printing, Publishing etc. 0.6 0.5 0.5 0.5 0.5 Wood & Related Products 0.1 0.1 0.1 0.1 0.1 Chemicals & Non-Metallic Minerals 1.1 0.8 0.8 0.7 0.7 Assembly Type and Related Industries 0.3 0.9 0.8 0.7 0.6 Miscellaneous Manufacturing 0.4 0.4 0.4 0.3 0.3 Services 51.8 48.7 51.3 49.7 50.9 Electricity and Water 1.3 1.3 1.2 1.2 1.2 Construction and Quarrying 7.0 5.6 5.6 5.3 5.8 Distribution and Restaurants2 14.2 14.5 15.7 15.0 15.7 Hotels and Guest Houses 0.4 0.3 0.4 0.3 0.3 Transport, Storage & Communication 6.1 5.0 5.2 4.8 4.5 Finance, Insurance & Real Estate etc. 11.0 10.4 11.4 11.1 11.2 Government 7.8 7.9 8.0 8.0 8.2 Education and Cultural Services 2.7 2.5 2.4 2.7 2.6 Personal Services 1.2 1.2 1.4 1.4 1.5 FISIM3 (4.3) (3.7) (3.3) (3.0) (2.8)Add: VALUE ADDED TAX (VAT) 4.5 3.1 4.0 3.8 3.6
Source: Central Statistical Office1/Excludes oil refining and petrochemical industries.2/Excludes distribution of petroleum products.3/Financial Intermediation Services Indirectly Measured.re: revised p: provisional
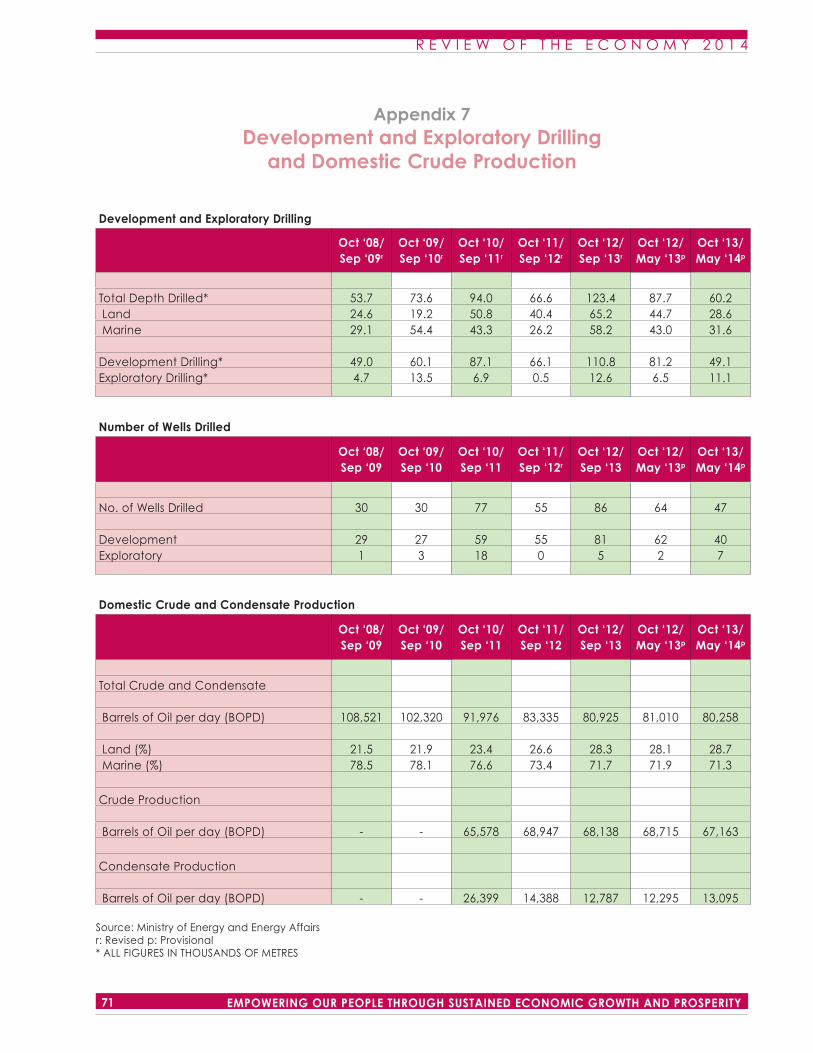
R E V I E W O F T H E E C O N O M Y 2 0 1 4
70EMPOWERING OUR PEOPLE THROUGH SUSTAINED ECONOMIC GROWTH AND PROSPERITY
R E V I E W O F T H E E C O N O M Y 2 0 1 4
71 EMPOWERING OUR PEOPLE THROUGH SUSTAINED ECONOMIC GROWTH AND PROSPERITY
Appendix 7Development and Exploratory Drilling
and Domestic Crude Production
Development and Exploratory Drilling
Oct ‘08/ Sep ‘09r
Oct ‘09/ Sep ‘10r
Oct ‘10/ Sep ‘11r
Oct ‘11/ Sep ‘12r
Oct ‘12/ Sep ‘13r
Oct ‘12/ May ‘13p
Oct ‘13/ May ‘14p
Total Depth Drilled* 53.7 73.6 94.0 66.6 123.4 87.7 60.2 Land 24.6 19.2 50.8 40.4 65.2 44.7 28.6 Marine 29.1 54.4 43.3 26.2 58.2 43.0 31.6 Development Drilling* 49.0 60.1 87.1 66.1 110.8 81.2 49.1Exploratory Drilling* 4.7 13.5 6.9 0.5 12.6 6.5 11.1
Number of Wells Drilled
Oct ‘08/ Sep ‘09
Oct ‘09/ Sep ‘10
Oct ‘10/ Sep ‘11
Oct ‘11/ Sep ‘12r
Oct ‘12/ Sep ‘13
Oct ‘12/ May ‘13p
Oct ‘13/ May ‘14p
No. of Wells Drilled 30 30 77 55 86 64 47 Development 29 27 59 55 81 62 40Exploratory 1 3 18 0 5 2 7
Domestic Crude and Condensate Production
Oct ‘08/ Sep ‘09
Oct ‘09/ Sep ‘10
Oct ‘10/ Sep ‘11
Oct ‘11/ Sep ‘12
Oct ‘12/ Sep ‘13
Oct ‘12/ May ‘13p
Oct ‘13/ May ‘14p
Total Crude and Condensate Barrels of Oil per day (BOPD) 108,521 102,320 91,976 83,335 80,925 81,010 80,258 Land (%) 21.5 21.9 23.4 26.6 28.3 28.1 28.7 Marine (%) 78.5 78.1 76.6 73.4 71.7 71.9 71.3
Crude Production Barrels of Oil per day (BOPD) - - 65,578 68,947 68,138 68,715 67,163
Condensate Production Barrels of Oil per day (BOPD) - - 26,399 14,388 12,787 12,295 13,095
Source: Ministry of Energy and Energy Affairsr: Revised p: Provisional* ALL FIGURES IN THOUSANDS OF METRES
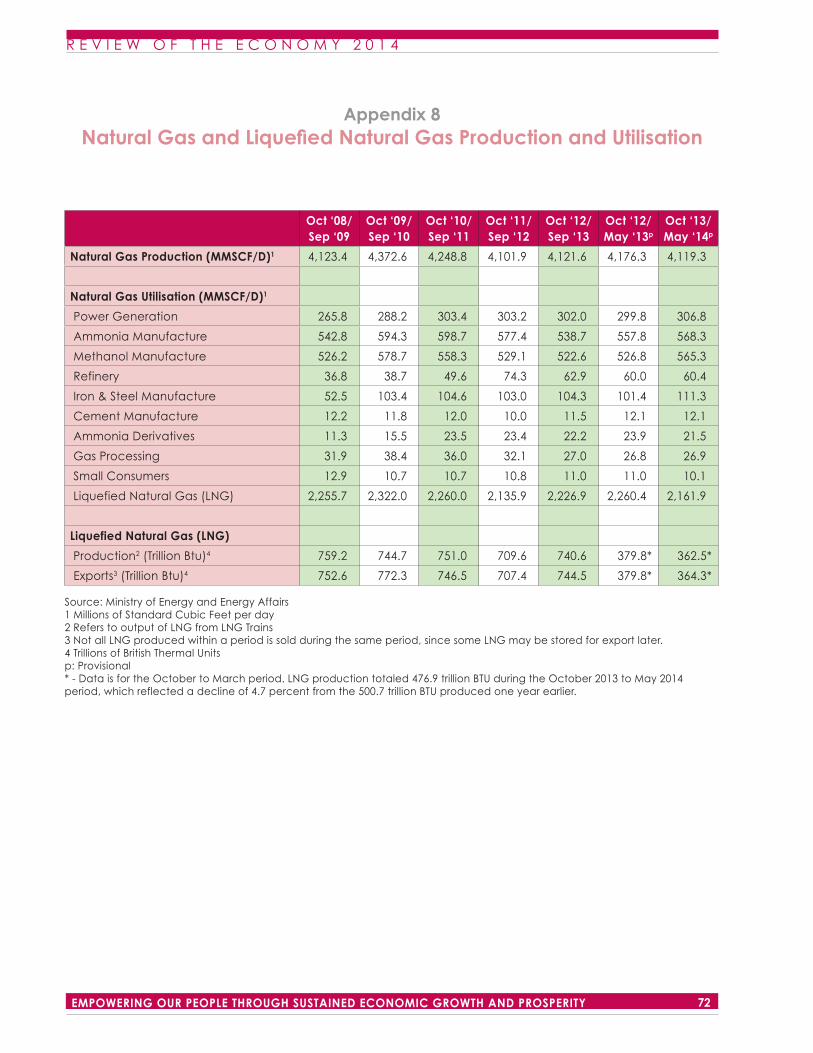
R E V I E W O F T H E E C O N O M Y 2 0 1 4
72EMPOWERING OUR PEOPLE THROUGH SUSTAINED ECONOMIC GROWTH AND PROSPERITY
R E V I E W O F T H E E C O N O M Y 2 0 1 4
73 EMPOWERING OUR PEOPLE THROUGH SUSTAINED ECONOMIC GROWTH AND PROSPERITY
Appendix 8Natural Gas and Liquefied Natural Gas Production and Utilisation
Oct ‘08/ Sep ‘09
Oct ‘09/ Sep ‘10
Oct ‘10/ Sep ‘11
Oct ‘11/ Sep ‘12
Oct ‘12/ Sep ‘13
Oct ‘12/ May ‘13p
Oct ‘13/ May ‘14p
Natural Gas Production (MMSCF/D)1 4,123.4 4,372.6 4,248.8 4,101.9 4,121.6 4,176.3 4,119.3
Natural Gas Utilisation (MMSCF/D)1
Power Generation 265.8 288.2 303.4 303.2 302.0 299.8 306.8
Ammonia Manufacture 542.8 594.3 598.7 577.4 538.7 557.8 568.3
Methanol Manufacture 526.2 578.7 558.3 529.1 522.6 526.8 565.3
Refinery 36.8 38.7 49.6 74.3 62.9 60.0 60.4
Iron & Steel Manufacture 52.5 103.4 104.6 103.0 104.3 101.4 111.3
Cement Manufacture 12.2 11.8 12.0 10.0 11.5 12.1 12.1
Ammonia Derivatives 11.3 15.5 23.5 23.4 22.2 23.9 21.5
Gas Processing 31.9 38.4 36.0 32.1 27.0 26.8 26.9
Small Consumers 12.9 10.7 10.7 10.8 11.0 11.0 10.1
Liquefied Natural Gas (LNG) 2,255.7 2,322.0 2,260.0 2,135.9 2,226.9 2,260.4 2,161.9
Liquefied Natural Gas (LNG)
Production2 (Trillion Btu)4 759.2 744.7 751.0 709.6 740.6 379.8* 362.5*
Exports3 (Trillion Btu)4 752.6 772.3 746.5 707.4 744.5 379.8* 364.3*
Source: Ministry of Energy and Energy Affairs1 Millions of Standard Cubic Feet per day2 Refers to output of LNG from LNG Trains3 Not all LNG produced within a period is sold during the same period, since some LNG may be stored for export later.4 Trillions of British Thermal Unitsp: Provisional* - Data is for the October to March period. LNG production totaled 476.9 trillion BTU during the October 2013 to May 2014 period, which reflected a decline of 4.7 percent from the 500.7 trillion BTU produced one year earlier.
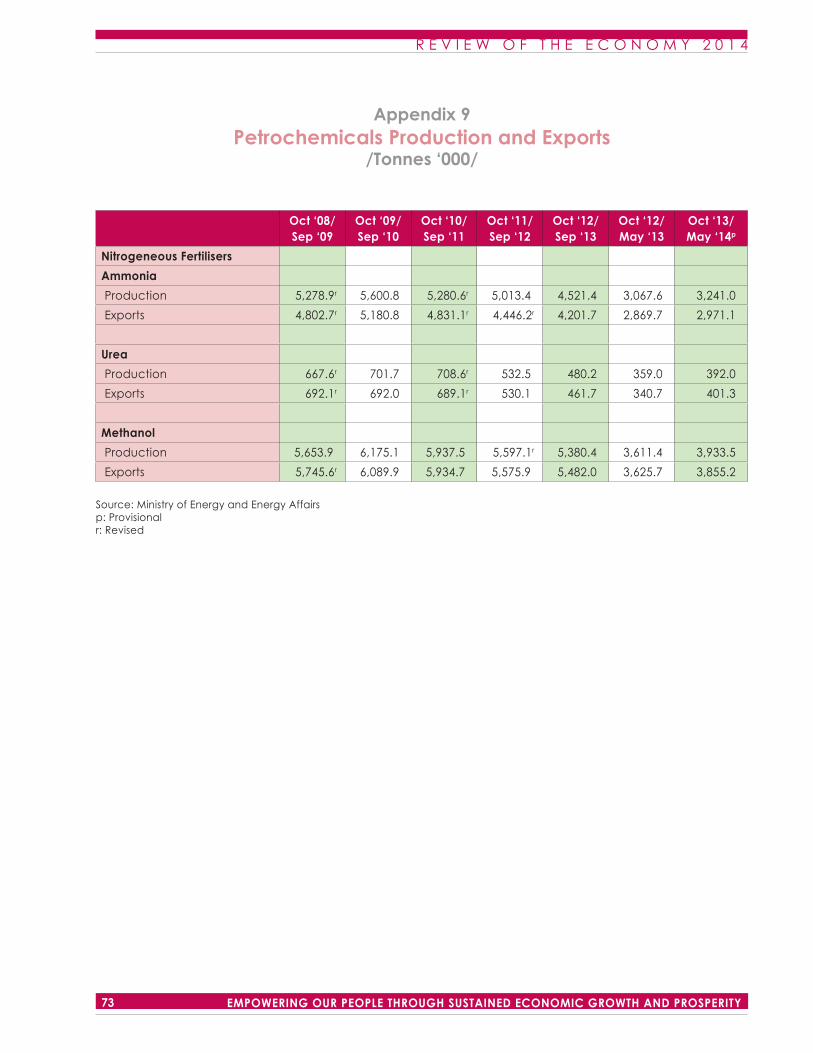
R E V I E W O F T H E E C O N O M Y 2 0 1 4
72EMPOWERING OUR PEOPLE THROUGH SUSTAINED ECONOMIC GROWTH AND PROSPERITY
R E V I E W O F T H E E C O N O M Y 2 0 1 4
73 EMPOWERING OUR PEOPLE THROUGH SUSTAINED ECONOMIC GROWTH AND PROSPERITY
Appendix 9Petrochemicals Production and Exports
/Tonnes ‘000/
Oct ‘08/Sep ‘09
Oct ‘09/Sep ‘10
Oct ‘10/Sep ‘11
Oct ‘11/Sep ‘12
Oct ‘12/Sep ‘13
Oct ‘12/May ‘13
Oct ‘13/May ‘14p
Nitrogeneous Fertilisers
Ammonia
Production 5,278.9r 5,600.8 5,280.6r 5,013.4 4,521.4 3,067.6 3,241.0
Exports 4,802.7r 5,180.8 4,831.1r 4,446.2r 4,201.7 2,869.7 2,971.1
Urea
Production 667.6r 701.7 708.6r 532.5 480.2 359.0 392.0
Exports 692.1r 692.0 689.1r 530.1 461.7 340.7 401.3
Methanol
Production 5,653.9 6,175.1 5,937.5 5,597.1r 5,380.4 3,611.4 3,933.5
Exports 5,745.6r 6,089.9 5,934.7 5,575.9 5,482.0 3,625.7 3,855.2
Source: Ministry of Energy and Energy Affairsp: Provisionalr: Revised
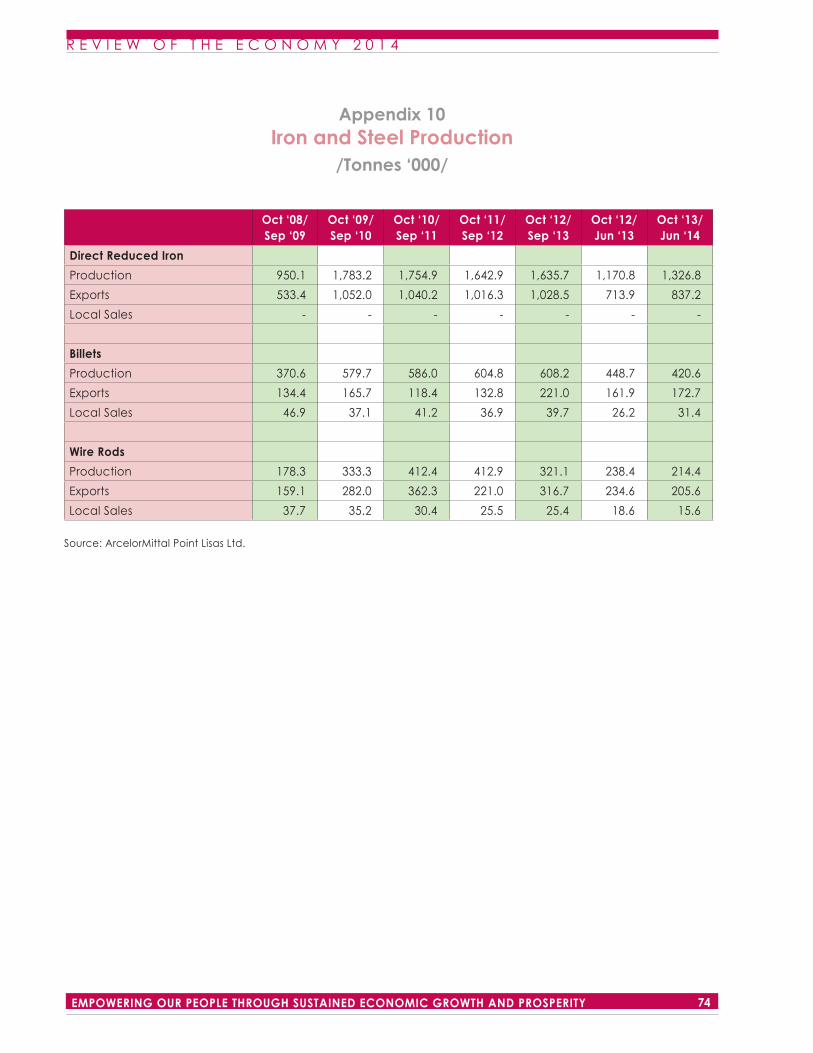
R E V I E W O F T H E E C O N O M Y 2 0 1 4
74EMPOWERING OUR PEOPLE THROUGH SUSTAINED ECONOMIC GROWTH AND PROSPERITY
R E V I E W O F T H E E C O N O M Y 2 0 1 4
75 EMPOWERING OUR PEOPLE THROUGH SUSTAINED ECONOMIC GROWTH AND PROSPERITY
Appendix 10Iron and Steel Production
/Tonnes ‘000/
Oct ‘08/ Sep ‘09
Oct ‘09/ Sep ‘10
Oct ‘10/ Sep ‘11
Oct ‘11/ Sep ‘12
Oct ‘12/ Sep ‘13
Oct ‘12/ Jun ‘13
Oct ‘13/ Jun ‘14
Direct Reduced Iron
Production 950.1 1,783.2 1,754.9 1,642.9 1,635.7 1,170.8 1,326.8
Exports 533.4 1,052.0 1,040.2 1,016.3 1,028.5 713.9 837.2
Local Sales - - - - - - -
Billets
Production 370.6 579.7 586.0 604.8 608.2 448.7 420.6
Exports 134.4 165.7 118.4 132.8 221.0 161.9 172.7
Local Sales 46.9 37.1 41.2 36.9 39.7 26.2 31.4
Wire Rods
Production 178.3 333.3 412.4 412.9 321.1 238.4 214.4
Exports 159.1 282.0 362.3 221.0 316.7 234.6 205.6
Local Sales 37.7 35.2 30.4 25.5 25.4 18.6 15.6
Source: ArcelorMittal Point Lisas Ltd.
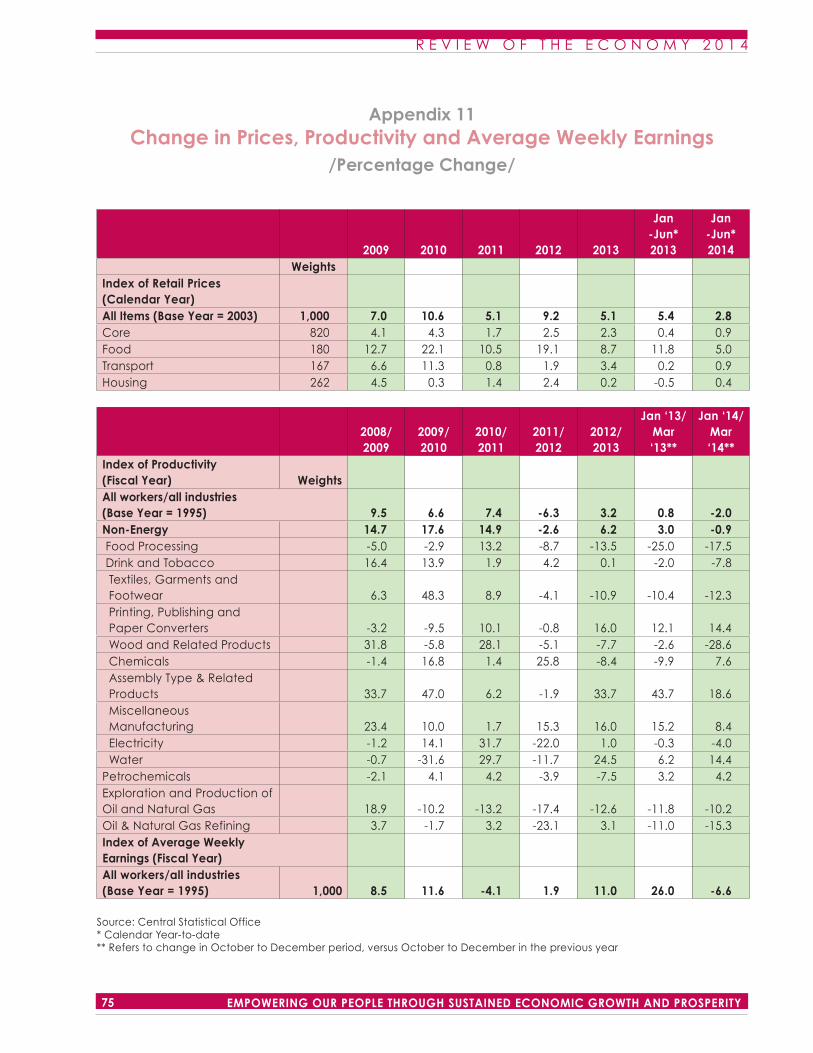
R E V I E W O F T H E E C O N O M Y 2 0 1 4
74EMPOWERING OUR PEOPLE THROUGH SUSTAINED ECONOMIC GROWTH AND PROSPERITY
R E V I E W O F T H E E C O N O M Y 2 0 1 4
75 EMPOWERING OUR PEOPLE THROUGH SUSTAINED ECONOMIC GROWTH AND PROSPERITY
Appendix 11Change in Prices, Productivity and Average Weekly Earnings
/Percentage Change/
2009 2010 2011 2012 2013
Jan -Jun*2013
Jan -Jun*2014
WeightsIndex of Retail Prices (Calendar Year) All Items (Base Year = 2003) 1,000 7.0 10.6 5.1 9.2 5.1 5.4 2.8Core 820 4.1 4.3 1.7 2.5 2.3 0.4 0.9Food 180 12.7 22.1 10.5 19.1 8.7 11.8 5.0Transport 167 6.6 11.3 0.8 1.9 3.4 0.2 0.9Housing 262 4.5 0.3 1.4 2.4 0.2 -0.5 0.4
2008/ 2009
2009/ 2010
2010/ 2011
2011/ 2012
2012/ 2013
Jan ‘13/Mar ‘13**
Jan ‘14/Mar ‘14**
Index of Productivity (Fiscal Year) Weights All workers/all industries (Base Year = 1995) 9.5 6.6 7.4 -6.3 3.2 0.8 -2.0Non-Energy 14.7 17.6 14.9 -2.6 6.2 3.0 -0.9 Food Processing -5.0 -2.9 13.2 -8.7 -13.5 -25.0 -17.5 Drink and Tobacco 16.4 13.9 1.9 4.2 0.1 -2.0 -7.8
Textiles, Garments and Footwear 6.3 48.3 8.9 -4.1 -10.9 -10.4 -12.3Printing, Publishing and Paper Converters -3.2 -9.5 10.1 -0.8 16.0 12.1 14.4Wood and Related Products 31.8 -5.8 28.1 -5.1 -7.7 -2.6 -28.6Chemicals -1.4 16.8 1.4 25.8 -8.4 -9.9 7.6Assembly Type & Related Products 33.7 47.0 6.2 -1.9 33.7 43.7 18.6Miscellaneous Manufacturing 23.4 10.0 1.7 15.3 16.0 15.2 8.4Electricity -1.2 14.1 31.7 -22.0 1.0 -0.3 -4.0Water -0.7 -31.6 29.7 -11.7 24.5 6.2 14.4
Petrochemicals -2.1 4.1 4.2 -3.9 -7.5 3.2 4.2Exploration and Production of Oil and Natural Gas 18.9 -10.2 -13.2 -17.4 -12.6 -11.8 -10.2Oil & Natural Gas Refining 3.7 -1.7 3.2 -23.1 3.1 -11.0 -15.3Index of Average Weekly Earnings (Fiscal Year)All workers/all industries (Base Year = 1995) 1,000 8.5 11.6 -4.1 1.9 11.0 26.0 -6.6
Source: Central Statistical Office * Calendar Year-to-date ** Refers to change in October to December period, versus October to December in the previous year
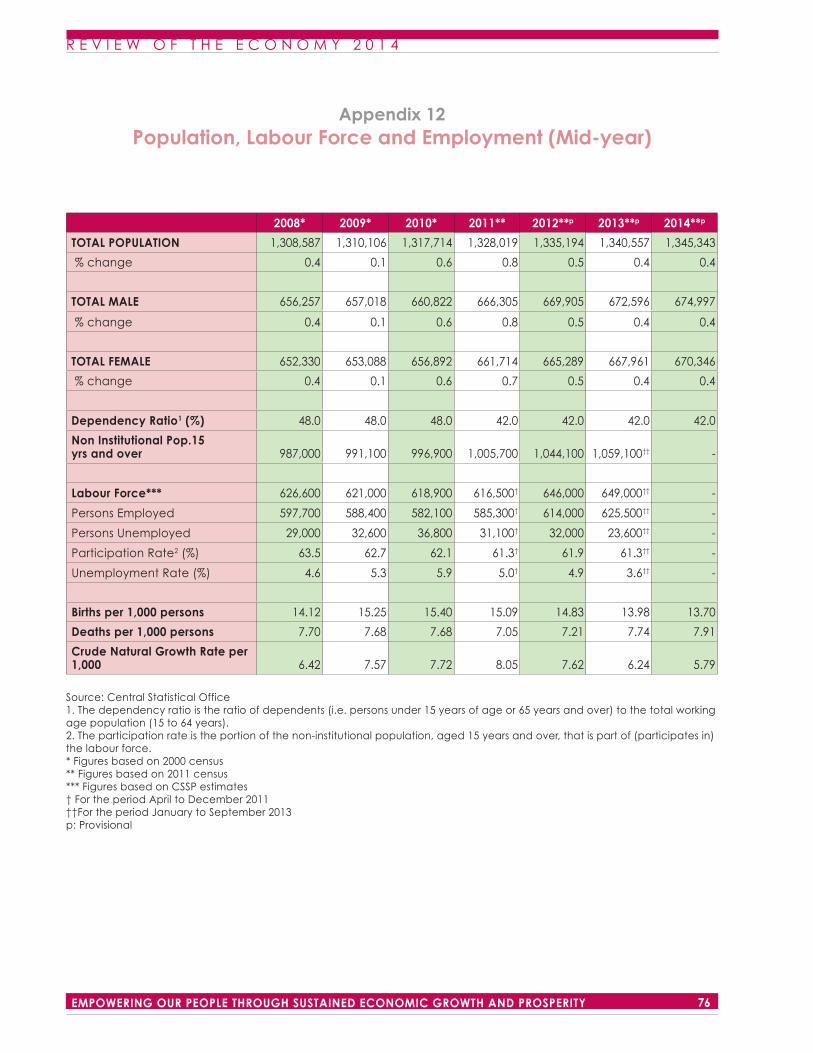
R E V I E W O F T H E E C O N O M Y 2 0 1 4
76EMPOWERING OUR PEOPLE THROUGH SUSTAINED ECONOMIC GROWTH AND PROSPERITY
R E V I E W O F T H E E C O N O M Y 2 0 1 4
77 EMPOWERING OUR PEOPLE THROUGH SUSTAINED ECONOMIC GROWTH AND PROSPERITY
Appendix 12Population, Labour Force and Employment (Mid-year)
2008* 2009* 2010* 2011** 2012**p 2013**p 2014**p
TOTAL POPULATION 1,308,587 1,310,106 1,317,714 1,328,019 1,335,194 1,340,557 1,345,343
% change 0.4 0.1 0.6 0.8 0.5 0.4 0.4
TOTAL MALE 656,257 657,018 660,822 666,305 669,905 672,596 674,997
% change 0.4 0.1 0.6 0.8 0.5 0.4 0.4
TOTAL FEMALE 652,330 653,088 656,892 661,714 665,289 667,961 670,346
% change 0.4 0.1 0.6 0.7 0.5 0.4 0.4
Dependency Ratio1 (%) 48.0 48.0 48.0 42.0 42.0 42.0 42.0
Non Institutional Pop.15 yrs and over 987,000 991,100 996,900 1,005,700 1,044,100 1,059,100†† -
Labour Force*** 626,600 621,000 618,900 616,500† 646,000 649,000†† -
Persons Employed 597,700 588,400 582,100 585,300† 614,000 625,500†† -
Persons Unemployed 29,000 32,600 36,800 31,100† 32,000 23,600†† -
Participation Rate2 (%) 63.5 62.7 62.1 61.3† 61.9 61.3†† -
Unemployment Rate (%) 4.6 5.3 5.9 5.0† 4.9 3.6†† -
Births per 1,000 persons 14.12 15.25 15.40 15.09 14.83 13.98 13.70
Deaths per 1,000 persons 7.70 7.68 7.68 7.05 7.21 7.74 7.91
Crude Natural Growth Rate per 1,000 6.42 7.57 7.72 8.05 7.62 6.24 5.79
Source: Central Statistical Office1. The dependency ratio is the ratio of dependents (i.e. persons under 15 years of age or 65 years and over) to the total working age population (15 to 64 years).2. The participation rate is the portion of the non-institutional population, aged 15 years and over, that is part of (participates in) the labour force.* Figures based on 2000 census** Figures based on 2011 census*** Figures based on CSSP estimates† For the period April to December 2011††For the period January to September 2013p: Provisional
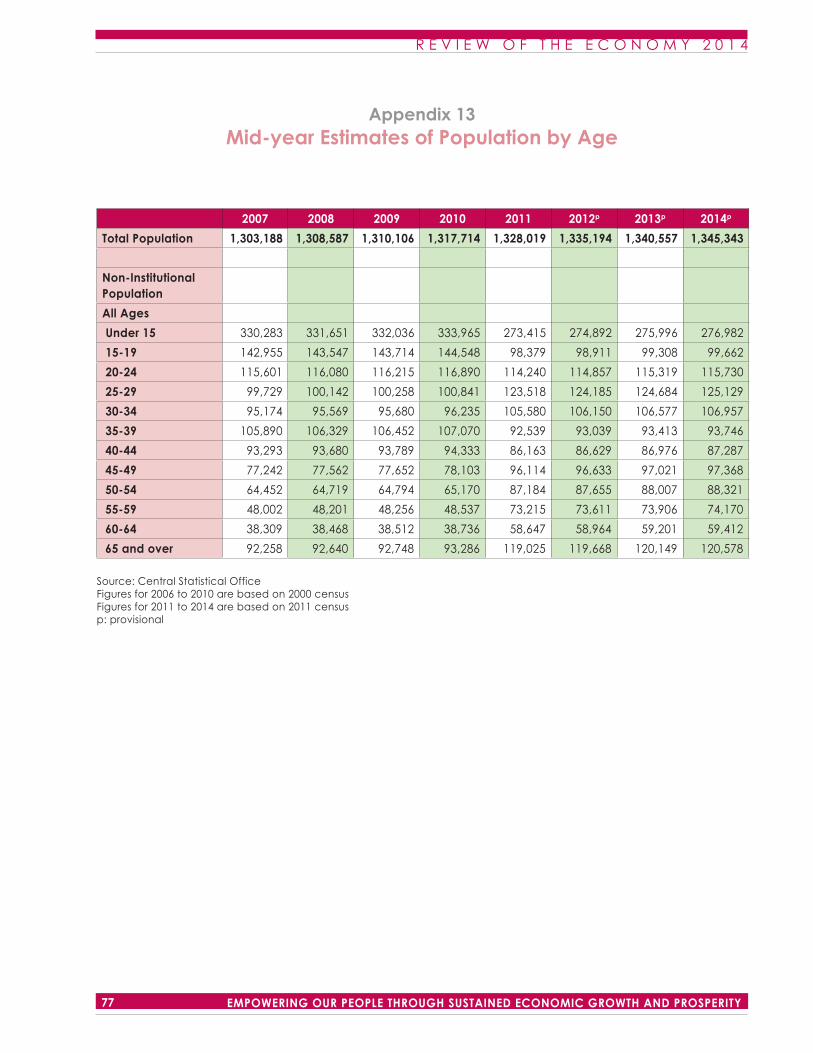
R E V I E W O F T H E E C O N O M Y 2 0 1 4
76EMPOWERING OUR PEOPLE THROUGH SUSTAINED ECONOMIC GROWTH AND PROSPERITY
R E V I E W O F T H E E C O N O M Y 2 0 1 4
77 EMPOWERING OUR PEOPLE THROUGH SUSTAINED ECONOMIC GROWTH AND PROSPERITY
Appendix 13Mid-year Estimates of Population by Age
2007 2008 2009 2010 2011 2012p 2013p 2014p
Total Population 1,303,188 1,308,587 1,310,106 1,317,714 1,328,019 1,335,194 1,340,557 1,345,343
Non-Institutional Population
All Ages
Under 15 330,283 331,651 332,036 333,965 273,415 274,892 275,996 276,982
15-19 142,955 143,547 143,714 144,548 98,379 98,911 99,308 99,662
20-24 115,601 116,080 116,215 116,890 114,240 114,857 115,319 115,730
25-29 99,729 100,142 100,258 100,841 123,518 124,185 124,684 125,129
30-34 95,174 95,569 95,680 96,235 105,580 106,150 106,577 106,957
35-39 105,890 106,329 106,452 107,070 92,539 93,039 93,413 93,746
40-44 93,293 93,680 93,789 94,333 86,163 86,629 86,976 87,287
45-49 77,242 77,562 77,652 78,103 96,114 96,633 97,021 97,368
50-54 64,452 64,719 64,794 65,170 87,184 87,655 88,007 88,321
55-59 48,002 48,201 48,256 48,537 73,215 73,611 73,906 74,170
60-64 38,309 38,468 38,512 38,736 58,647 58,964 59,201 59,412
65 and over 92,258 92,640 92,748 93,286 119,025 119,668 120,149 120,578
Source: Central Statistical OfficeFigures for 2006 to 2010 are based on 2000 censusFigures for 2011 to 2014 are based on 2011 census p: provisional
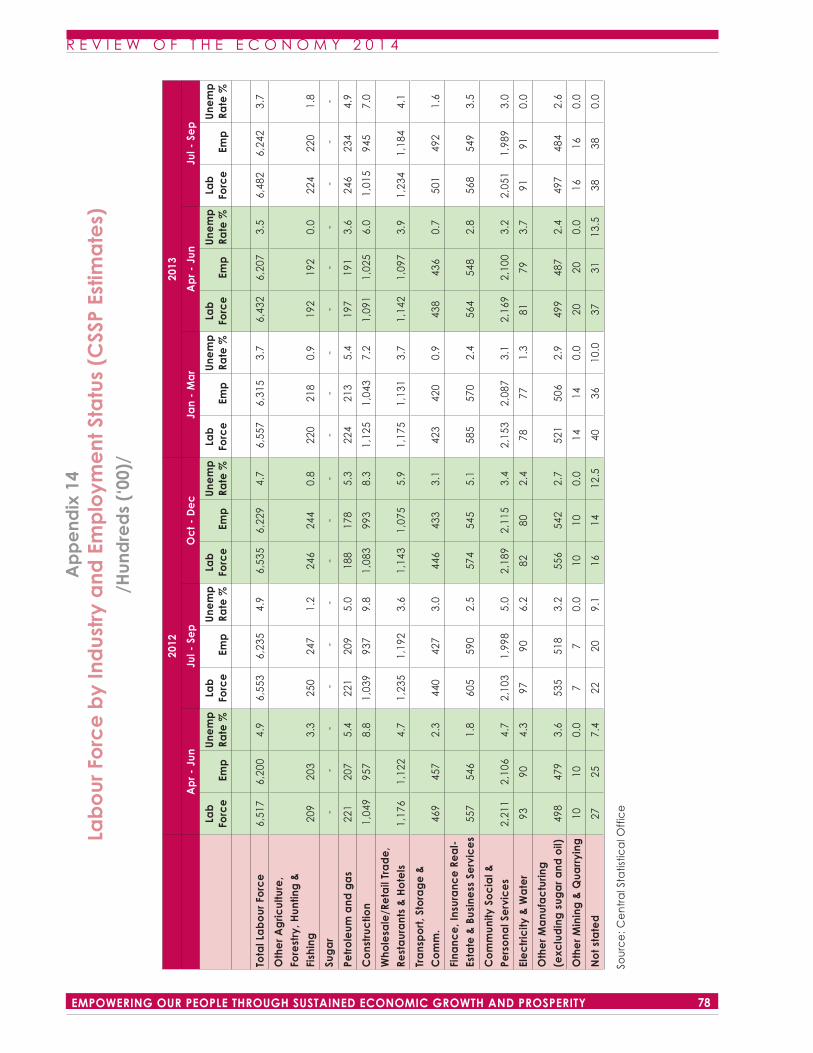
R E V I E W O F T H E E C O N O M Y 2 0 1 4
78EMPOWERING OUR PEOPLE THROUGH SUSTAINED ECONOMIC GROWTH AND PROSPERITY
R E V I E W O F T H E E C O N O M Y 2 0 1 4
79 EMPOWERING OUR PEOPLE THROUGH SUSTAINED ECONOMIC GROWTH AND PROSPERITY
Ap
pe
ndix
14
Lab
our
Fo
rce
by
Ind
ustr
y a
nd E
mp
loym
ent
Sta
tus
(CSS
P Es
tima
tes)
/Hun
dre
ds
(‘00
)/
20
1220
13
A
pr
- Ju
nJu
l - S
ep
Oc
t - D
ec
Ja
n -
Ma
rA
pr
- Ju
nJu
l - S
ep
La
b
Forc
e E
mp
Une
mp
Ra
te %
Lab
Fo
rce
Em
pU
nem
p
Rate
%La
b
Forc
e E
mp
Une
mp
Ra
te %
Lab
Fo
rce
Em
pU
nem
p
Rate
%La
b
Forc
e E
mp
Une
mp
Ra
te %
Lab
Fo
rce
Em
pU
nem
p
Rate
%
Tota
l La
bo
ur F
orc
e6,
517
6,20
04.
96,
553
6,23
54.
9 6
,535
6,
229
4.7
6,5
57
6,3
15
3.7
6,4
32
6,2
07
3.5
6,48
26,
242
3.7
Oth
er
Ag
ricul
ture
, Fo
rest
ry, H
untin
g &
Fi
shin
g20
920
33.
325
024
71.
2 2
46
244
0.8
220
2
18
0.9
192
1
92
0.0
224
220
1.8
Sug
ar
- -
- -
- -
-
--
-
-
- -
-
-
-
-
-
Petr
ole
um a
nd g
as
221
207
5.4
221
209
5.0
188
17
85.
3 2
24
213
5.
4 1
97
191
3.
624
623
44.
9
Co
nstr
uctio
n 1
,049
95
78.
81,
039
937
9.8
1,0
83
993
8.3
1,1
25
1,0
43
7.2
1,0
91
1,0
25
6.0
1,0
15
945
7.0
Who
lesa
le/R
eta
il Tr
ad
e,
Rest
aur
ant
s &
Ho
tels
1,17
61,
122
4.7
1,23
51,
192
3.6
1,1
43
1,07
55.
9 1
,175
1
,131
3.
7 1
,142
1
,097
3.
91,
234
1,18
44.
1
Tra
nsp
ort
, Sto
rag
e &
C
om
m.
469
457
2.3
440
427
3.0
446
43
33.
1 4
23
420
0.
9 4
38
436
0.
750
149
21.
6
Fina
nce
, Ins
ura
nce
Re
al-
Esta
te &
Bus
ine
ss S
erv
ice
s55
754
61.
860
559
02.
5 5
74
545
5.1
585
5
70
2.4
564
5
48
2.8
568
549
3.5
Co
mm
unity
So
cia
l &
Pers
ona
l Se
rvic
es
2,21
12,
106
4.7
2,10
31,
998
5.0
2,1
89
2,11
53.
4 2
,153
2
,087
3.
1 2
,169
2
,100
3.
22,
051
1,98
93.
0
Ele
ctr
icity
& W
ate
r93
904.
397
906.
2 8
2 80
2.4
78
77
1.3
81
79
3.7
9191
0.0
Oth
er
Ma
nufa
ctu
ring
(e
xclu
din
g s
uga
r a
nd o
il)49
847
93.
653
551
83.
2 5
56
542
2.7
521
5
06
2.9
499
4
87
2.4
497
484
2.6
Oth
er
Min
ing
& Q
uarr
ying
1010
0.0
77
0.0
10
100.
0 1
4 1
4 0.
0 2
0 2
0 0.
016
160.
0
No
t sta
ted
2725
7.4
2220
9.1
16
1412
.5 4
0 3
6 10
.0 3
7 3
1 13
.538
380.
0
Sou
rce
: Ce
ntr
al S
tatis
tica
l Off
ice
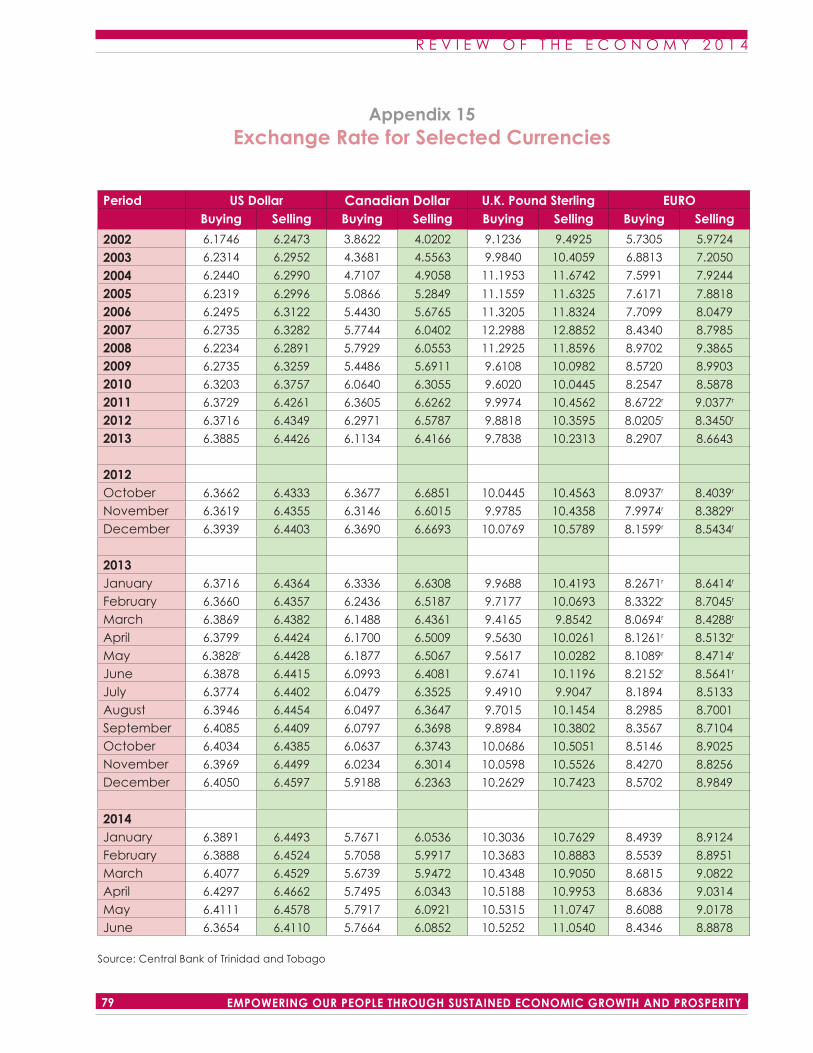
R E V I E W O F T H E E C O N O M Y 2 0 1 4
78EMPOWERING OUR PEOPLE THROUGH SUSTAINED ECONOMIC GROWTH AND PROSPERITY
R E V I E W O F T H E E C O N O M Y 2 0 1 4
79 EMPOWERING OUR PEOPLE THROUGH SUSTAINED ECONOMIC GROWTH AND PROSPERITY
Appendix 15Exchange Rate for Selected Currencies
Period US Dollar Canadian Dollar U.K. Pound Sterling EURO
Buying Selling Buying Selling Buying Selling Buying Selling
2002 6.1746 6.2473 3.8622 4.0202 9.1236 9.4925 5.7305 5.9724
2003 6.2314 6.2952 4.3681 4.5563 9.9840 10.4059 6.8813 7.2050
2004 6.2440 6.2990 4.7107 4.9058 11.1953 11.6742 7.5991 7.9244
2005 6.2319 6.2996 5.0866 5.2849 11.1559 11.6325 7.6171 7.8818
2006 6.2495 6.3122 5.4430 5.6765 11.3205 11.8324 7.7099 8.0479
2007 6.2735 6.3282 5.7744 6.0402 12.2988 12.8852 8.4340 8.7985
2008 6.2234 6.2891 5.7929 6.0553 11.2925 11.8596 8.9702 9.3865
2009 6.2735 6.3259 5.4486 5.6911 9.6108 10.0982 8.5720 8.9903
2010 6.3203 6.3757 6.0640 6.3055 9.6020 10.0445 8.2547 8.5878
2011 6.3729 6.4261 6.3605 6.6262 9.9974 10.4562 8.6722r 9.0377r
2012 6.3716 6.4349 6.2971 6.5787 9.8818 10.3595 8.0205r 8.3450r
2013 6.3885 6.4426 6.1134 6.4166 9.7838 10.2313 8.2907 8.6643
2012October 6.3662 6.4333 6.3677 6.6851 10.0445 10.4563 8.0937r 8.4039r
November 6.3619 6.4355 6.3146 6.6015 9.9785 10.4358 7.9974r 8.3829r
December 6.3939 6.4403 6.3690 6.6693 10.0769 10.5789 8.1599r 8.5434r
2013January 6.3716 6.4364 6.3336 6.6308 9.9688 10.4193 8.2671r 8.6414r
February 6.3660 6.4357 6.2436 6.5187 9.7177 10.0693 8.3322r 8.7045r
March 6.3869 6.4382 6.1488 6.4361 9.4165 9.8542 8.0694r 8.4288r
April 6.3799 6.4424 6.1700 6.5009 9.5630 10.0261 8.1261r 8.5132r
May 6.3828r 6.4428 6.1877 6.5067 9.5617 10.0282 8.1089r 8.4714r
June 6.3878 6.4415 6.0993 6.4081 9.6741 10.1196 8.2152r 8.5641r
July 6.3774 6.4402 6.0479 6.3525 9.4910 9.9047 8.1894 8.5133
August 6.3946 6.4454 6.0497 6.3647 9.7015 10.1454 8.2985 8.7001
September 6.4085 6.4409 6.0797 6.3698 9.8984 10.3802 8.3567 8.7104
October 6.4034 6.4385 6.0637 6.3743 10.0686 10.5051 8.5146 8.9025
November 6.3969 6.4499 6.0234 6.3014 10.0598 10.5526 8.4270 8.8256
December 6.4050 6.4597 5.9188 6.2363 10.2629 10.7423 8.5702 8.9849
2014January 6.3891 6.4493 5.7671 6.0536 10.3036 10.7629 8.4939 8.9124
February 6.3888 6.4524 5.7058 5.9917 10.3683 10.8883 8.5539 8.8951
March 6.4077 6.4529 5.6739 5.9472 10.4348 10.9050 8.6815 9.0822
April 6.4297 6.4662 5.7495 6.0343 10.5188 10.9953 8.6836 9.0314
May 6.4111 6.4578 5.7917 6.0921 10.5315 11.0747 8.6088 9.0178
June 6.3654 6.4110 5.7664 6.0852 10.5252 11.0540 8.4346 8.8878
Source: Central Bank of Trinidad and Tobago
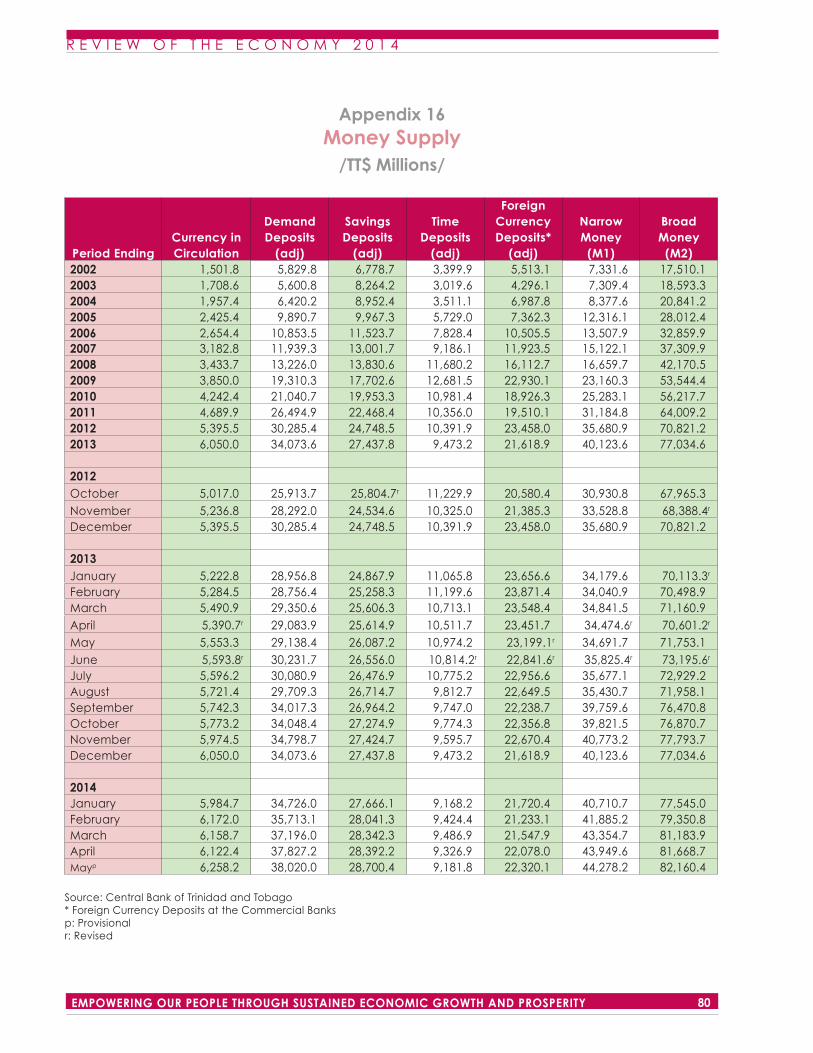
R E V I E W O F T H E E C O N O M Y 2 0 1 4
80EMPOWERING OUR PEOPLE THROUGH SUSTAINED ECONOMIC GROWTH AND PROSPERITY
R E V I E W O F T H E E C O N O M Y 2 0 1 4
81 EMPOWERING OUR PEOPLE THROUGH SUSTAINED ECONOMIC GROWTH AND PROSPERITY
Appendix 16Money Supply
/TT$ Millions/
Period Ending Currency in Circulation
Demand Deposits
(adj)
Savings Deposits
(adj)
Time Deposits
(adj)
Foreign Currency Deposits*
(adj)
Narrow Money
(M1)
Broad Money
(M2)2002 1,501.8 5,829.8 6,778.7 3,399.9 5,513.1 7,331.6 17,510.12003 1,708.6 5,600.8 8,264.2 3,019.6 4,296.1 7,309.4 18,593.32004 1,957.4 6,420.2 8,952.4 3,511.1 6,987.8 8,377.6 20,841.22005 2,425.4 9,890.7 9,967.3 5,729.0 7,362.3 12,316.1 28,012.42006 2,654.4 10,853.5 11,523.7 7,828.4 10,505.5 13,507.9 32,859.92007 3,182.8 11,939.3 13,001.7 9,186.1 11,923.5 15,122.1 37,309.92008 3,433.7 13,226.0 13,830.6 11,680.2 16,112.7 16,659.7 42,170.52009 3,850.0 19,310.3 17,702.6 12,681.5 22,930.1 23,160.3 53,544.42010 4,242.4 21,040.7 19,953.3 10,981.4 18,926.3 25,283.1 56,217.72011 4,689.9 26,494.9 22,468.4 10,356.0 19,510.1 31,184.8 64,009.22012 5,395.5 30,285.4 24,748.5 10,391.9 23,458.0 35,680.9 70,821.22013 6,050.0 34,073.6 27,437.8 9,473.2 21,618.9 40,123.6 77,034.6 2012October 5,017.0 25,913.7 25,804.7r 11,229.9 20,580.4 30,930.8 67,965.3November 5,236.8 28,292.0 24,534.6 10,325.0 21,385.3 33,528.8 68,388.4r
December 5,395.5 30,285.4 24,748.5 10,391.9 23,458.0 35,680.9 70,821.2 2013January 5,222.8 28,956.8 24,867.9 11,065.8 23,656.6 34,179.6 70,113.3r
February 5,284.5 28,756.4 25,258.3 11,199.6 23,871.4 34,040.9 70,498.9March 5,490.9 29,350.6 25,606.3 10,713.1 23,548.4 34,841.5 71,160.9April 5,390.7r 29,083.9 25,614.9 10,511.7 23,451.7 34,474.6r 70,601.2r
May 5,553.3 29,138.4 26,087.2 10,974.2 23,199.1r 34,691.7 71,753.1June 5,593.8r 30,231.7 26,556.0 10,814.2r 22,841.6r 35,825.4r 73,195.6r
July 5,596.2 30,080.9 26,476.9 10,775.2 22,956.6 35,677.1 72,929.2August 5,721.4 29,709.3 26,714.7 9,812.7 22,649.5 35,430.7 71,958.1September 5,742.3 34,017.3 26,964.2 9,747.0 22,238.7 39,759.6 76,470.8October 5,773.2 34,048.4 27,274.9 9,774.3 22,356.8 39,821.5 76,870.7November 5,974.5 34,798.7 27,424.7 9,595.7 22,670.4 40,773.2 77,793.7December 6,050.0 34,073.6 27,437.8 9,473.2 21,618.9 40,123.6 77,034.6 2014January 5,984.7 34,726.0 27,666.1 9,168.2 21,720.4 40,710.7 77,545.0February 6,172.0 35,713.1 28,041.3 9,424.4 21,233.1 41,885.2 79,350.8March 6,158.7 37,196.0 28,342.3 9,486.9 21,547.9 43,354.7 81,183.9April 6,122.4 37,827.2 28,392.2 9,326.9 22,078.0 43,949.6 81,668.7Mayp 6,258.2 38,020.0 28,700.4 9,181.8 22,320.1 44,278.2 82,160.4
Source: Central Bank of Trinidad and Tobago* Foreign Currency Deposits at the Commercial Banksp: Provisionalr: Revised
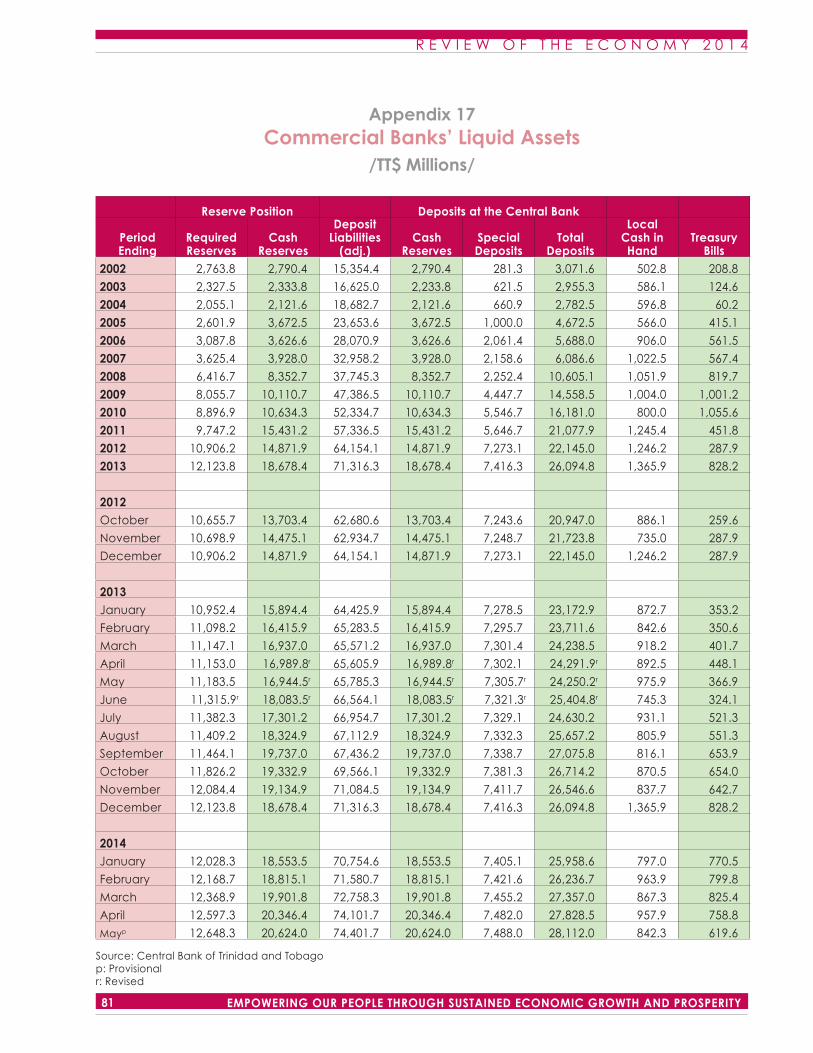
R E V I E W O F T H E E C O N O M Y 2 0 1 4
80EMPOWERING OUR PEOPLE THROUGH SUSTAINED ECONOMIC GROWTH AND PROSPERITY
R E V I E W O F T H E E C O N O M Y 2 0 1 4
81 EMPOWERING OUR PEOPLE THROUGH SUSTAINED ECONOMIC GROWTH AND PROSPERITY
Appendix 17Commercial Banks’ Liquid Assets
/TT$ Millions/
Reserve Position Deposits at the Central Bank
Period Ending
Required Reserves
Cash Reserves
Deposit Liabilities
(adj.)Cash
ReservesSpecial Deposits
Total Deposits
Local Cash in Hand
Treasury Bills
2002 2,763.8 2,790.4 15,354.4 2,790.4 281.3 3,071.6 502.8 208.8
2003 2,327.5 2,333.8 16,625.0 2,233.8 621.5 2,955.3 586.1 124.6
2004 2,055.1 2,121.6 18,682.7 2,121.6 660.9 2,782.5 596.8 60.2
2005 2,601.9 3,672.5 23,653.6 3,672.5 1,000.0 4,672.5 566.0 415.1
2006 3,087.8 3,626.6 28,070.9 3,626.6 2,061.4 5,688.0 906.0 561.5
2007 3,625.4 3,928.0 32,958.2 3,928.0 2,158.6 6,086.6 1,022.5 567.4
2008 6,416.7 8,352.7 37,745.3 8,352.7 2,252.4 10,605.1 1,051.9 819.7
2009 8,055.7 10,110.7 47,386.5 10,110.7 4,447.7 14,558.5 1,004.0 1,001.2
2010 8,896.9 10,634.3 52,334.7 10,634.3 5,546.7 16,181.0 800.0 1,055.6
2011 9,747.2 15,431.2 57,336.5 15,431.2 5,646.7 21,077.9 1,245.4 451.8
2012 10,906.2 14,871.9 64,154.1 14,871.9 7,273.1 22,145.0 1,246.2 287.9
2013 12,123.8 18,678.4 71,316.3 18,678.4 7,416.3 26,094.8 1,365.9 828.2
2012October 10,655.7 13,703.4 62,680.6 13,703.4 7,243.6 20,947.0 886.1 259.6
November 10,698.9 14,475.1 62,934.7 14,475.1 7,248.7 21,723.8 735.0 287.9
December 10,906.2 14,871.9 64,154.1 14,871.9 7,273.1 22,145.0 1,246.2 287.9
2013January 10,952.4 15,894.4 64,425.9 15,894.4 7,278.5 23,172.9 872.7 353.2
February 11,098.2 16,415.9 65,283.5 16,415.9 7,295.7 23,711.6 842.6 350.6
March 11,147.1 16,937.0 65,571.2 16,937.0 7,301.4 24,238.5 918.2 401.7
April 11,153.0 16,989.8r 65,605.9 16,989.8r 7,302.1 24,291.9r 892.5 448.1
May 11,183.5 16,944.5r 65,785.3 16,944.5r 7,305.7r 24,250.2r 975.9 366.9
June 11,315.9r 18,083.5r 66,564.1 18,083.5r 7,321.3r 25,404.8r 745.3 324.1
July 11,382.3 17,301.2 66,954.7 17,301.2 7,329.1 24,630.2 931.1 521.3
August 11,409.2 18,324.9 67,112.9 18,324.9 7,332.3 25,657.2 805.9 551.3
September 11,464.1 19,737.0 67,436.2 19,737.0 7,338.7 27,075.8 816.1 653.9
October 11,826.2 19,332.9 69,566.1 19,332.9 7,381.3 26,714.2 870.5 654.0
November 12,084.4 19,134.9 71,084.5 19,134.9 7,411.7 26,546.6 837.7 642.7
December 12,123.8 18,678.4 71,316.3 18,678.4 7,416.3 26,094.8 1,365.9 828.2
2014January 12,028.3 18,553.5 70,754.6 18,553.5 7,405.1 25,958.6 797.0 770.5
February 12,168.7 18,815.1 71,580.7 18,815.1 7,421.6 26,236.7 963.9 799.8
March 12,368.9 19,901.8 72,758.3 19,901.8 7,455.2 27,357.0 867.3 825.4
April 12,597.3 20,346.4 74,101.7 20,346.4 7,482.0 27,828.5 957.9 758.8
Mayp 12,648.3 20,624.0 74,401.7 20,624.0 7,488.0 28,112.0 842.3 619.6
Source: Central Bank of Trinidad and Tobagop: Provisionalr: Revised
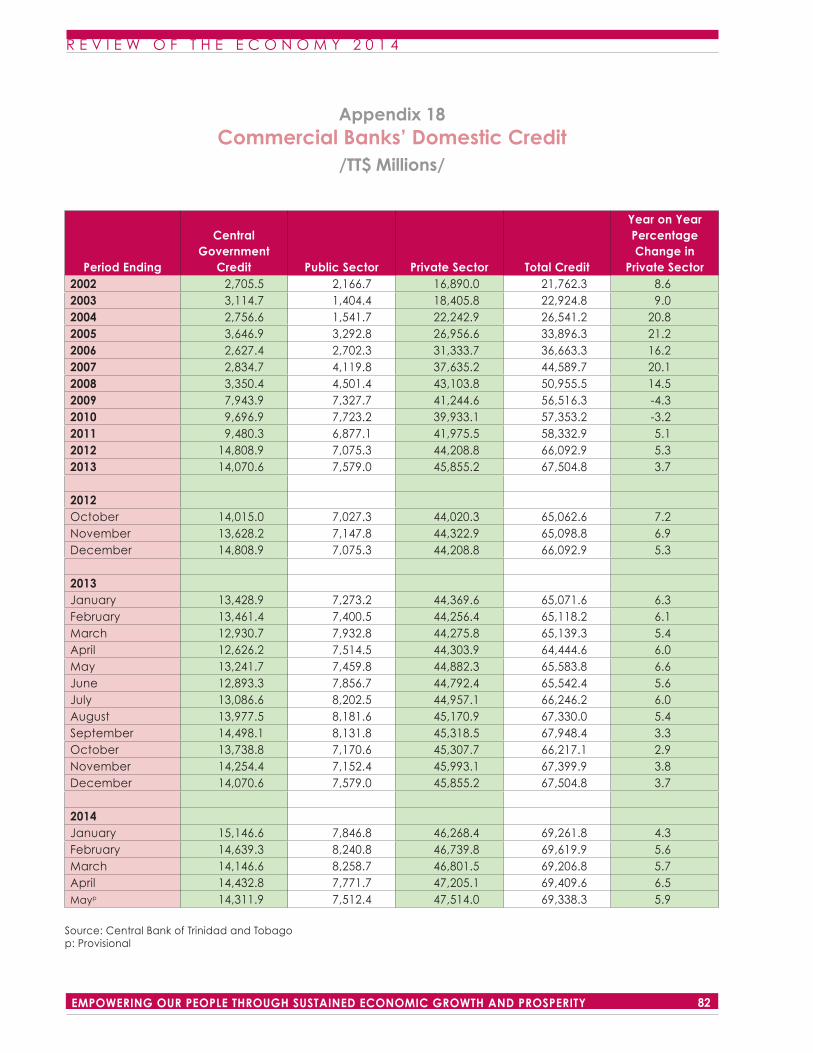
R E V I E W O F T H E E C O N O M Y 2 0 1 4
82EMPOWERING OUR PEOPLE THROUGH SUSTAINED ECONOMIC GROWTH AND PROSPERITY
R E V I E W O F T H E E C O N O M Y 2 0 1 4
83 EMPOWERING OUR PEOPLE THROUGH SUSTAINED ECONOMIC GROWTH AND PROSPERITY
Appendix 18Commercial Banks’ Domestic Credit
/TT$ Millions/
Period Ending
Central Government
Credit Public Sector Private Sector Total Credit
Year on Year Percentage Change in
Private Sector 2002 2,705.5 2,166.7 16,890.0 21,762.3 8.62003 3,114.7 1,404.4 18,405.8 22,924.8 9.02004 2,756.6 1,541.7 22,242.9 26,541.2 20.82005 3,646.9 3,292.8 26,956.6 33,896.3 21.22006 2,627.4 2,702.3 31,333.7 36,663.3 16.22007 2,834.7 4,119.8 37,635.2 44,589.7 20.12008 3,350.4 4,501.4 43,103.8 50,955.5 14.52009 7,943.9 7,327.7 41,244.6 56,516.3 -4.32010 9,696.9 7,723.2 39,933.1 57,353.2 -3.22011 9,480.3 6,877.1 41,975.5 58,332.9 5.12012 14,808.9 7,075.3 44,208.8 66,092.9 5.32013 14,070.6 7,579.0 45,855.2 67,504.8 3.7 2012October 14,015.0 7,027.3 44,020.3 65,062.6 7.2November 13,628.2 7,147.8 44,322.9 65,098.8 6.9December 14,808.9 7,075.3 44,208.8 66,092.9 5.3 2013January 13,428.9 7,273.2 44,369.6 65,071.6 6.3February 13,461.4 7,400.5 44,256.4 65,118.2 6.1March 12,930.7 7,932.8 44,275.8 65,139.3 5.4April 12,626.2 7,514.5 44,303.9 64,444.6 6.0May 13,241.7 7,459.8 44,882.3 65,583.8 6.6June 12,893.3 7,856.7 44,792.4 65,542.4 5.6July 13,086.6 8,202.5 44,957.1 66,246.2 6.0August 13,977.5 8,181.6 45,170.9 67,330.0 5.4September 14,498.1 8,131.8 45,318.5 67,948.4 3.3October 13,738.8 7,170.6 45,307.7 66,217.1 2.9November 14,254.4 7,152.4 45,993.1 67,399.9 3.8December 14,070.6 7,579.0 45,855.2 67,504.8 3.7 2014January 15,146.6 7,846.8 46,268.4 69,261.8 4.3February 14,639.3 8,240.8 46,739.8 69,619.9 5.6March 14,146.6 8,258.7 46,801.5 69,206.8 5.7April 14,432.8 7,771.7 47,205.1 69,409.6 6.5Mayp 14,311.9 7,512.4 47,514.0 69,338.3 5.9
Source: Central Bank of Trinidad and Tobagop: Provisional
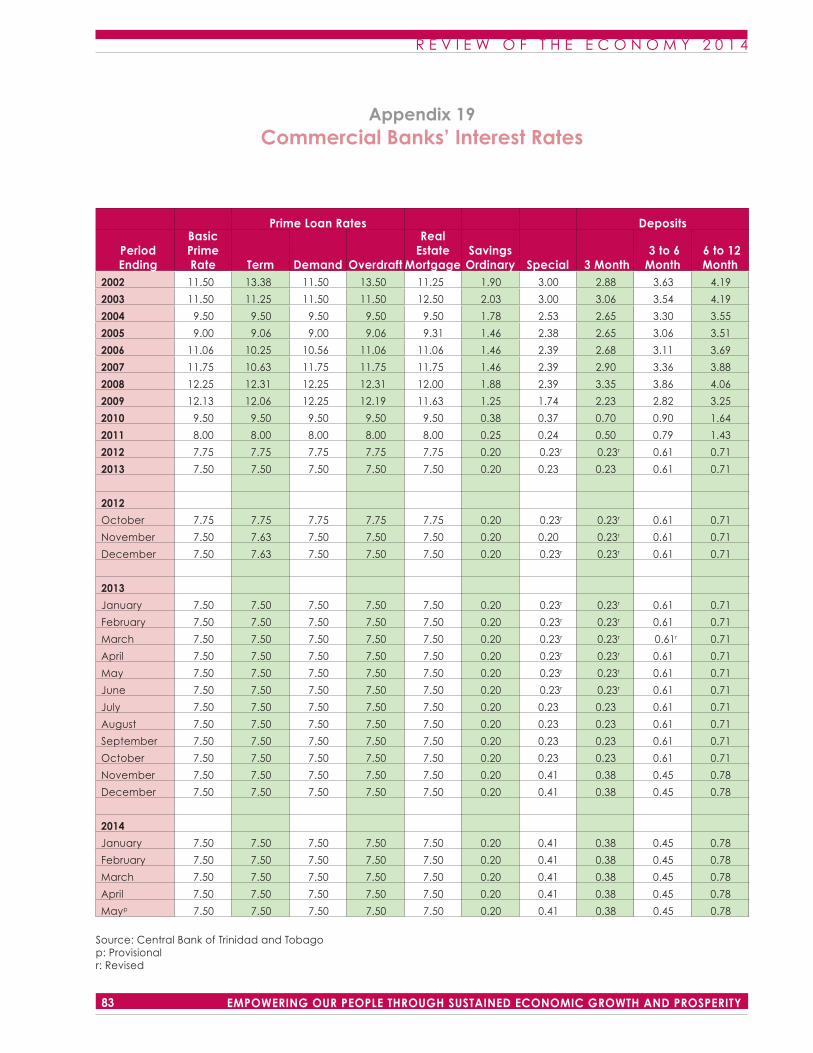
R E V I E W O F T H E E C O N O M Y 2 0 1 4
82EMPOWERING OUR PEOPLE THROUGH SUSTAINED ECONOMIC GROWTH AND PROSPERITY
R E V I E W O F T H E E C O N O M Y 2 0 1 4
83 EMPOWERING OUR PEOPLE THROUGH SUSTAINED ECONOMIC GROWTH AND PROSPERITY
Appendix 19Commercial Banks’ Interest Rates
Prime Loan Rates Deposits
Period Ending
Basic Prime Rate Term Demand Overdraft
Real Estate
MortgageSavings
Ordinary Special 3 Month 3 to 6 Month
6 to 12 Month
2002 11.50 13.38 11.50 13.50 11.25 1.90 3.00 2.88 3.63 4.19
2003 11.50 11.25 11.50 11.50 12.50 2.03 3.00 3.06 3.54 4.19
2004 9.50 9.50 9.50 9.50 9.50 1.78 2.53 2.65 3.30 3.55
2005 9.00 9.06 9.00 9.06 9.31 1.46 2.38 2.65 3.06 3.51
2006 11.06 10.25 10.56 11.06 11.06 1.46 2.39 2.68 3.11 3.69
2007 11.75 10.63 11.75 11.75 11.75 1.46 2.39 2.90 3.36 3.88
2008 12.25 12.31 12.25 12.31 12.00 1.88 2.39 3.35 3.86 4.06
2009 12.13 12.06 12.25 12.19 11.63 1.25 1.74 2.23 2.82 3.25
2010 9.50 9.50 9.50 9.50 9.50 0.38 0.37 0.70 0.90 1.64
2011 8.00 8.00 8.00 8.00 8.00 0.25 0.24 0.50 0.79 1.43
2012 7.75 7.75 7.75 7.75 7.75 0.20 0.23r 0.23r 0.61 0.71
2013 7.50 7.50 7.50 7.50 7.50 0.20 0.23 0.23 0.61 0.71
2012
October 7.75 7.75 7.75 7.75 7.75 0.20 0.23r 0.23r 0.61 0.71
November 7.50 7.63 7.50 7.50 7.50 0.20 0.20 0.23r 0.61 0.71
December 7.50 7.63 7.50 7.50 7.50 0.20 0.23r 0.23r 0.61 0.71
2013
January 7.50 7.50 7.50 7.50 7.50 0.20 0.23r 0.23r 0.61 0.71
February 7.50 7.50 7.50 7.50 7.50 0.20 0.23r 0.23r 0.61 0.71
March 7.50 7.50 7.50 7.50 7.50 0.20 0.23r 0.23r 0.61r 0.71
April 7.50 7.50 7.50 7.50 7.50 0.20 0.23r 0.23r 0.61 0.71
May 7.50 7.50 7.50 7.50 7.50 0.20 0.23r 0.23r 0.61 0.71
June 7.50 7.50 7.50 7.50 7.50 0.20 0.23r 0.23r 0.61 0.71
July 7.50 7.50 7.50 7.50 7.50 0.20 0.23 0.23 0.61 0.71
August 7.50 7.50 7.50 7.50 7.50 0.20 0.23 0.23 0.61 0.71
September 7.50 7.50 7.50 7.50 7.50 0.20 0.23 0.23 0.61 0.71
October 7.50 7.50 7.50 7.50 7.50 0.20 0.23 0.23 0.61 0.71
November 7.50 7.50 7.50 7.50 7.50 0.20 0.41 0.38 0.45 0.78
December 7.50 7.50 7.50 7.50 7.50 0.20 0.41 0.38 0.45 0.78
2014
January 7.50 7.50 7.50 7.50 7.50 0.20 0.41 0.38 0.45 0.78
February 7.50 7.50 7.50 7.50 7.50 0.20 0.41 0.38 0.45 0.78
March 7.50 7.50 7.50 7.50 7.50 0.20 0.41 0.38 0.45 0.78
April 7.50 7.50 7.50 7.50 7.50 0.20 0.41 0.38 0.45 0.78
Mayp 7.50 7.50 7.50 7.50 7.50 0.20 0.41 0.38 0.45 0.78
Source: Central Bank of Trinidad and Tobagop: Provisionalr: Revised
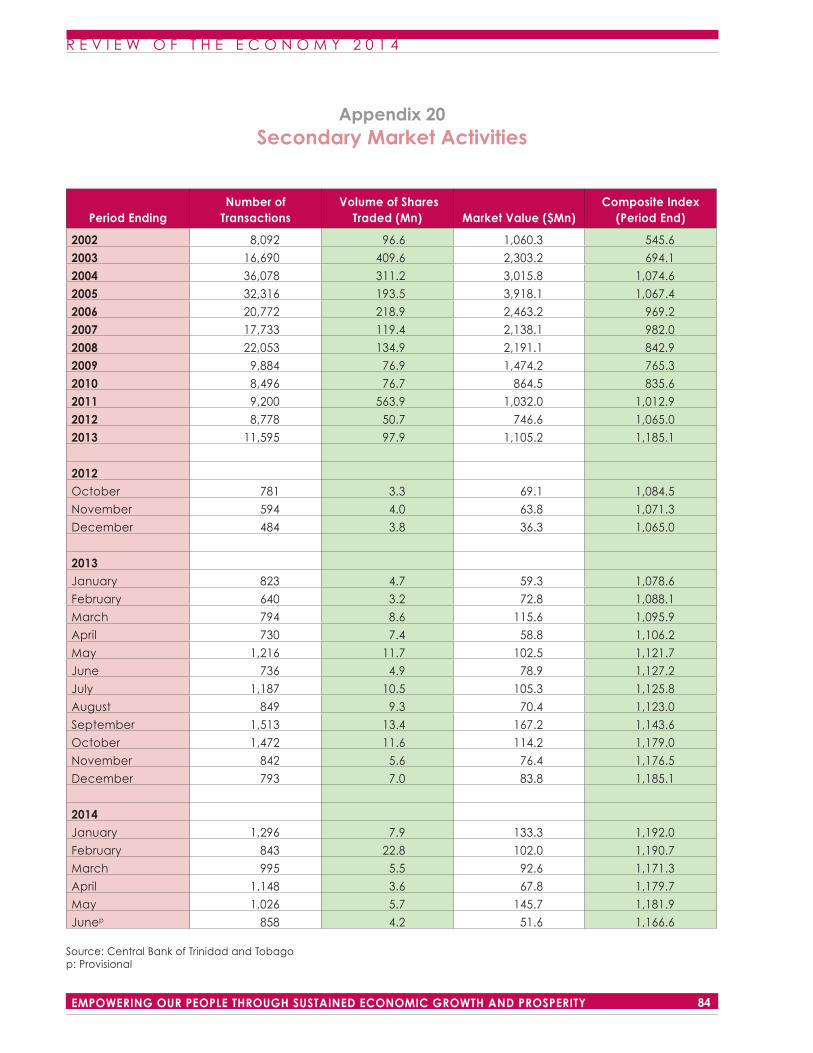
R E V I E W O F T H E E C O N O M Y 2 0 1 4
84EMPOWERING OUR PEOPLE THROUGH SUSTAINED ECONOMIC GROWTH AND PROSPERITY
R E V I E W O F T H E E C O N O M Y 2 0 1 4
85 EMPOWERING OUR PEOPLE THROUGH SUSTAINED ECONOMIC GROWTH AND PROSPERITY
Appendix 20Secondary Market Activities
Period EndingNumber of
Transactions Volume of Shares
Traded (Mn) Market Value ($Mn)Composite Index
(Period End)
2002 8,092 96.6 1,060.3 545.6
2003 16,690 409.6 2,303.2 694.1
2004 36,078 311.2 3,015.8 1,074.6
2005 32,316 193.5 3,918.1 1,067.4
2006 20,772 218.9 2,463.2 969.2
2007 17,733 119.4 2,138.1 982.0
2008 22,053 134.9 2,191.1 842.9
2009 9,884 76.9 1,474.2 765.3
2010 8,496 76.7 864.5 835.6
2011 9,200 563.9 1,032.0 1,012.9
2012 8,778 50.7 746.6 1,065.0
2013 11,595 97.9 1,105.2 1,185.1
2012October 781 3.3 69.1 1,084.5
November 594 4.0 63.8 1,071.3
December 484 3.8 36.3 1,065.0
2013January 823 4.7 59.3 1,078.6
February 640 3.2 72.8 1,088.1
March 794 8.6 115.6 1,095.9
April 730 7.4 58.8 1,106.2
May 1,216 11.7 102.5 1,121.7
June 736 4.9 78.9 1,127.2
July 1,187 10.5 105.3 1,125.8
August 849 9.3 70.4 1,123.0
September 1,513 13.4 167.2 1,143.6
October 1,472 11.6 114.2 1,179.0
November 842 5.6 76.4 1,176.5
December 793 7.0 83.8 1,185.1
2014January 1,296 7.9 133.3 1,192.0
February 843 22.8 102.0 1,190.7
March 995 5.5 92.6 1,171.3
April 1,148 3.6 67.8 1,179.7
May 1,026 5.7 145.7 1,181.9
Junep 858 4.2 51.6 1,166.6
Source: Central Bank of Trinidad and Tobagop: Provisional
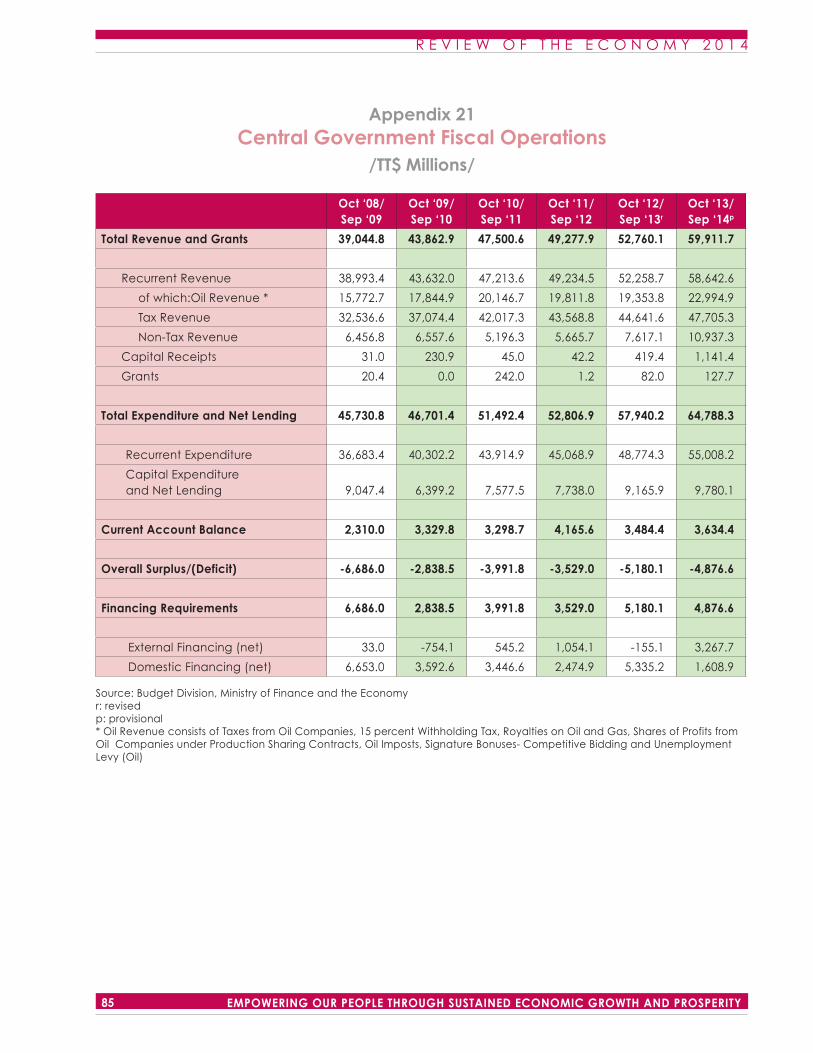
R E V I E W O F T H E E C O N O M Y 2 0 1 4
84EMPOWERING OUR PEOPLE THROUGH SUSTAINED ECONOMIC GROWTH AND PROSPERITY
R E V I E W O F T H E E C O N O M Y 2 0 1 4
85 EMPOWERING OUR PEOPLE THROUGH SUSTAINED ECONOMIC GROWTH AND PROSPERITY
Appendix 21Central Government Fiscal Operations
/TT$ Millions/
Oct ‘08/ Sep ‘09
Oct ‘09/ Sep ‘10
Oct ‘10/ Sep ‘11
Oct ‘11/ Sep ‘12
Oct ‘12/ Sep ‘13r
Oct ‘13/ Sep ‘14p
Total Revenue and Grants 39,044.8 43,862.9 47,500.6 49,277.9 52,760.1 59,911.7
Recurrent Revenue 38,993.4 43,632.0 47,213.6 49,234.5 52,258.7 58,642.6
of which:Oil Revenue * 15,772.7 17,844.9 20,146.7 19,811.8 19,353.8 22,994.9
Tax Revenue 32,536.6 37,074.4 42,017.3 43,568.8 44,641.6 47,705.3
Non-Tax Revenue 6,456.8 6,557.6 5,196.3 5,665.7 7,617.1 10,937.3
Capital Receipts 31.0 230.9 45.0 42.2 419.4 1,141.4
Grants 20.4 0.0 242.0 1.2 82.0 127.7
Total Expenditure and Net Lending 45,730.8 46,701.4 51,492.4 52,806.9 57,940.2 64,788.3
Recurrent Expenditure 36,683.4 40,302.2 43,914.9 45,068.9 48,774.3 55,008.2
Capital Expenditure and Net Lending 9,047.4 6,399.2 7,577.5 7,738.0 9,165.9 9,780.1
Current Account Balance 2,310.0 3,329.8 3,298.7 4,165.6 3,484.4 3,634.4
Overall Surplus/(Deficit) -6,686.0 -2,838.5 -3,991.8 -3,529.0 -5,180.1 -4,876.6
Financing Requirements 6,686.0 2,838.5 3,991.8 3,529.0 5,180.1 4,876.6
External Financing (net) 33.0 -754.1 545.2 1,054.1 -155.1 3,267.7
Domestic Financing (net) 6,653.0 3,592.6 3,446.6 2,474.9 5,335.2 1,608.9
Source: Budget Division, Ministry of Finance and the Economyr: revisedp: provisional* Oil Revenue consists of Taxes from Oil Companies, 15 percent Withholding Tax, Royalties on Oil and Gas, Shares of Profits from Oil Companies under Production Sharing Contracts, Oil Imposts, Signature Bonuses- Competitive Bidding and Unemployment Levy (Oil)
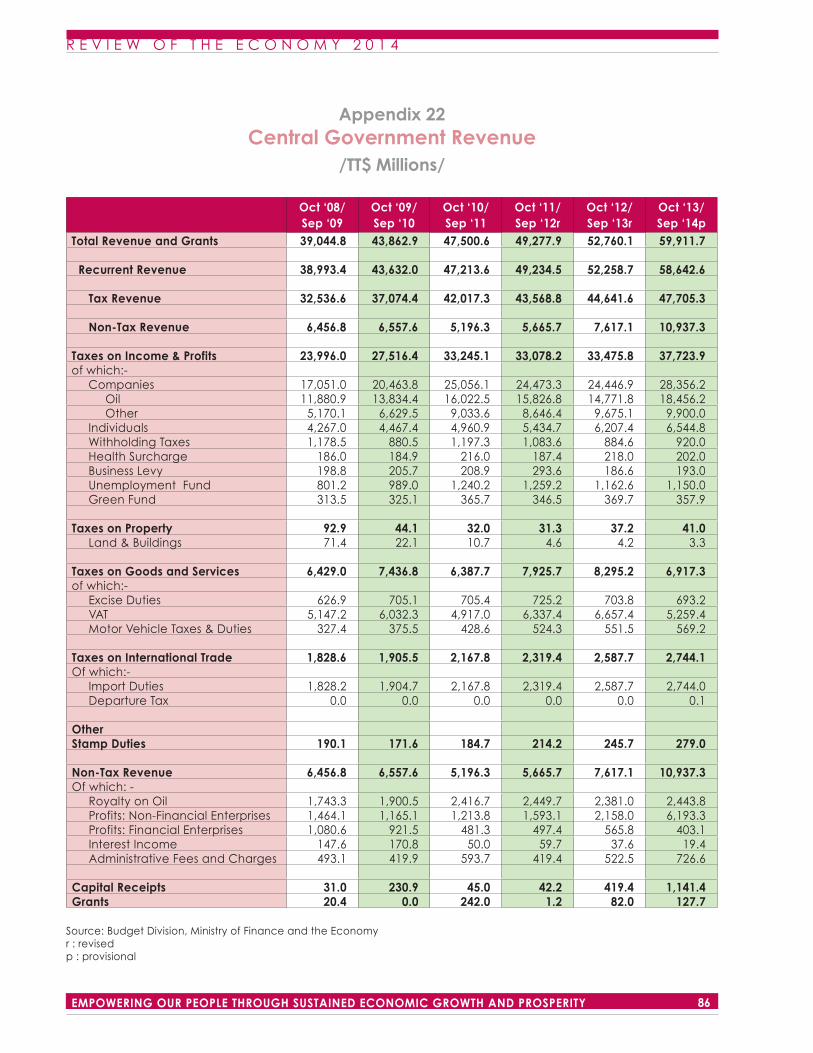
R E V I E W O F T H E E C O N O M Y 2 0 1 4
86EMPOWERING OUR PEOPLE THROUGH SUSTAINED ECONOMIC GROWTH AND PROSPERITY
R E V I E W O F T H E E C O N O M Y 2 0 1 4
87 EMPOWERING OUR PEOPLE THROUGH SUSTAINED ECONOMIC GROWTH AND PROSPERITY
Appendix 22Central Government Revenue
/TT$ Millions/
Oct ‘08/ Sep ‘09
Oct ‘09/ Sep ‘10
Oct ‘10/ Sep ‘11
Oct ‘11/ Sep ‘12r
Oct ‘12/ Sep ‘13r
Oct ‘13/ Sep ‘14p
Total Revenue and Grants 39,044.8 43,862.9 47,500.6 49,277.9 52,760.1 59,911.7 Recurrent Revenue 38,993.4 43,632.0 47,213.6 49,234.5 52,258.7 58,642.6 Tax Revenue 32,536.6 37,074.4 42,017.3 43,568.8 44,641.6 47,705.3 Non-Tax Revenue 6,456.8 6,557.6 5,196.3 5,665.7 7,617.1 10,937.3 Taxes on Income & Profits 23,996.0 27,516.4 33,245.1 33,078.2 33,475.8 37,723.9of which:- Companies 17,051.0 20,463.8 25,056.1 24,473.3 24,446.9 28,356.2 Oil 11,880.9 13,834.4 16,022.5 15,826.8 14,771.8 18,456.2 Other 5,170.1 6,629.5 9,033.6 8,646.4 9,675.1 9,900.0 Individuals 4,267.0 4,467.4 4,960.9 5,434.7 6,207.4 6,544.8 Withholding Taxes 1,178.5 880.5 1,197.3 1,083.6 884.6 920.0 Health Surcharge 186.0 184.9 216.0 187.4 218.0 202.0 Business Levy 198.8 205.7 208.9 293.6 186.6 193.0 Unemployment Fund 801.2 989.0 1,240.2 1,259.2 1,162.6 1,150.0 Green Fund 313.5 325.1 365.7 346.5 369.7 357.9 Taxes on Property 92.9 44.1 32.0 31.3 37.2 41.0 Land & Buildings 71.4 22.1 10.7 4.6 4.2 3.3 Taxes on Goods and Services 6,429.0 7,436.8 6,387.7 7,925.7 8,295.2 6,917.3of which:- Excise Duties 626.9 705.1 705.4 725.2 703.8 693.2 VAT 5,147.2 6,032.3 4,917.0 6,337.4 6,657.4 5,259.4 Motor Vehicle Taxes & Duties 327.4 375.5 428.6 524.3 551.5 569.2 Taxes on International Trade 1,828.6 1,905.5 2,167.8 2,319.4 2,587.7 2,744.1Of which:- Import Duties 1,828.2 1,904.7 2,167.8 2,319.4 2,587.7 2,744.0 Departure Tax 0.0 0.0 0.0 0.0 0.0 0.1 OtherStamp Duties 190.1 171.6 184.7 214.2 245.7 279.0 Non-Tax Revenue 6,456.8 6,557.6 5,196.3 5,665.7 7,617.1 10,937.3Of which: - Royalty on Oil 1,743.3 1,900.5 2,416.7 2,449.7 2,381.0 2,443.8 Profits: Non-Financial Enterprises 1,464.1 1,165.1 1,213.8 1,593.1 2,158.0 6,193.3 Profits: Financial Enterprises 1,080.6 921.5 481.3 497.4 565.8 403.1 Interest Income 147.6 170.8 50.0 59.7 37.6 19.4 Administrative Fees and Charges 493.1 419.9 593.7 419.4 522.5 726.6 Capital Receipts 31.0 230.9 45.0 42.2 419.4 1,141.4Grants 20.4 0.0 242.0 1.2 82.0 127.7
Source: Budget Division, Ministry of Finance and the Economyr : revisedp : provisional
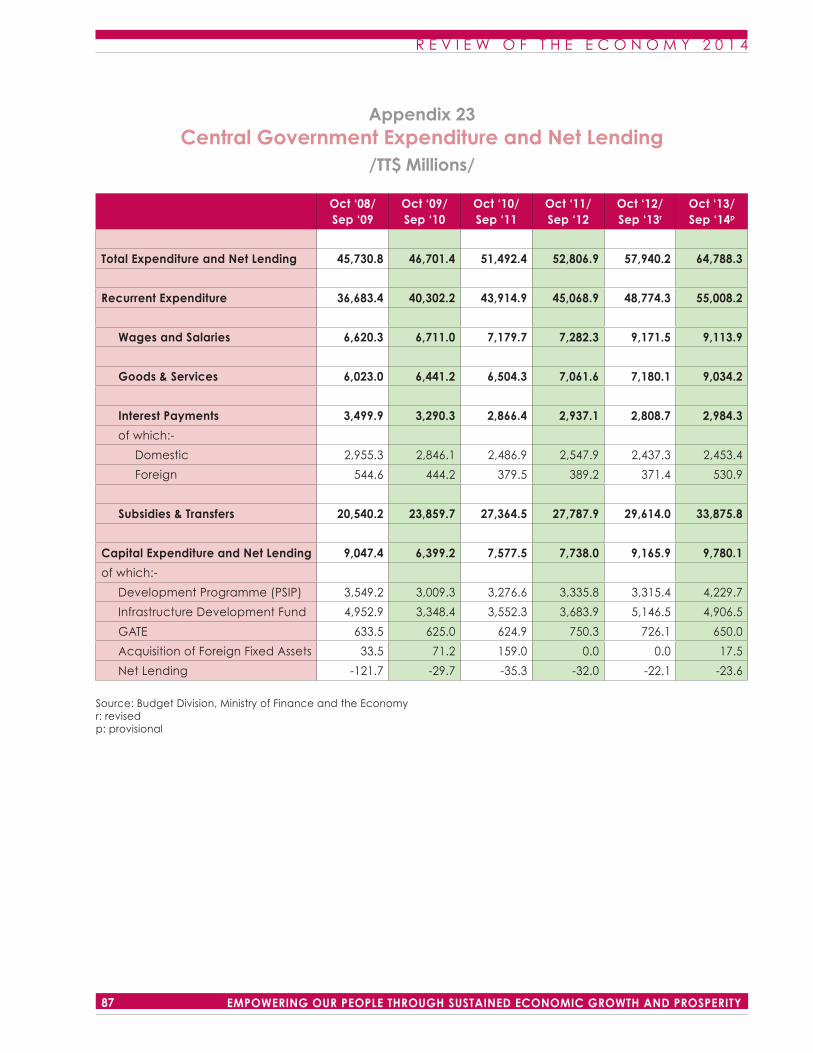
R E V I E W O F T H E E C O N O M Y 2 0 1 4
86EMPOWERING OUR PEOPLE THROUGH SUSTAINED ECONOMIC GROWTH AND PROSPERITY
R E V I E W O F T H E E C O N O M Y 2 0 1 4
87 EMPOWERING OUR PEOPLE THROUGH SUSTAINED ECONOMIC GROWTH AND PROSPERITY
Appendix 23Central Government Expenditure and Net Lending
/TT$ Millions/
Oct ‘08/ Sep ‘09
Oct ‘09/ Sep ‘10
Oct ‘10/ Sep ‘11
Oct ‘11/ Sep ‘12
Oct ‘12/ Sep ‘13r
Oct ‘13/ Sep ‘14p
Total Expenditure and Net Lending 45,730.8 46,701.4 51,492.4 52,806.9 57,940.2 64,788.3
Recurrent Expenditure 36,683.4 40,302.2 43,914.9 45,068.9 48,774.3 55,008.2
Wages and Salaries 6,620.3 6,711.0 7,179.7 7,282.3 9,171.5 9,113.9
Goods & Services 6,023.0 6,441.2 6,504.3 7,061.6 7,180.1 9,034.2
Interest Payments 3,499.9 3,290.3 2,866.4 2,937.1 2,808.7 2,984.3
of which:-
Domestic 2,955.3 2,846.1 2,486.9 2,547.9 2,437.3 2,453.4
Foreign 544.6 444.2 379.5 389.2 371.4 530.9
Subsidies & Transfers 20,540.2 23,859.7 27,364.5 27,787.9 29,614.0 33,875.8
Capital Expenditure and Net Lending 9,047.4 6,399.2 7,577.5 7,738.0 9,165.9 9,780.1
of which:-
Development Programme (PSIP) 3,549.2 3,009.3 3,276.6 3,335.8 3,315.4 4,229.7
Infrastructure Development Fund 4,952.9 3,348.4 3,552.3 3,683.9 5,146.5 4,906.5
GATE 633.5 625.0 624.9 750.3 726.1 650.0
Acquisition of Foreign Fixed Assets 33.5 71.2 159.0 0.0 0.0 17.5
Net Lending -121.7 -29.7 -35.3 -32.0 -22.1 -23.6
Source: Budget Division, Ministry of Finance and the Economyr: revisedp: provisional
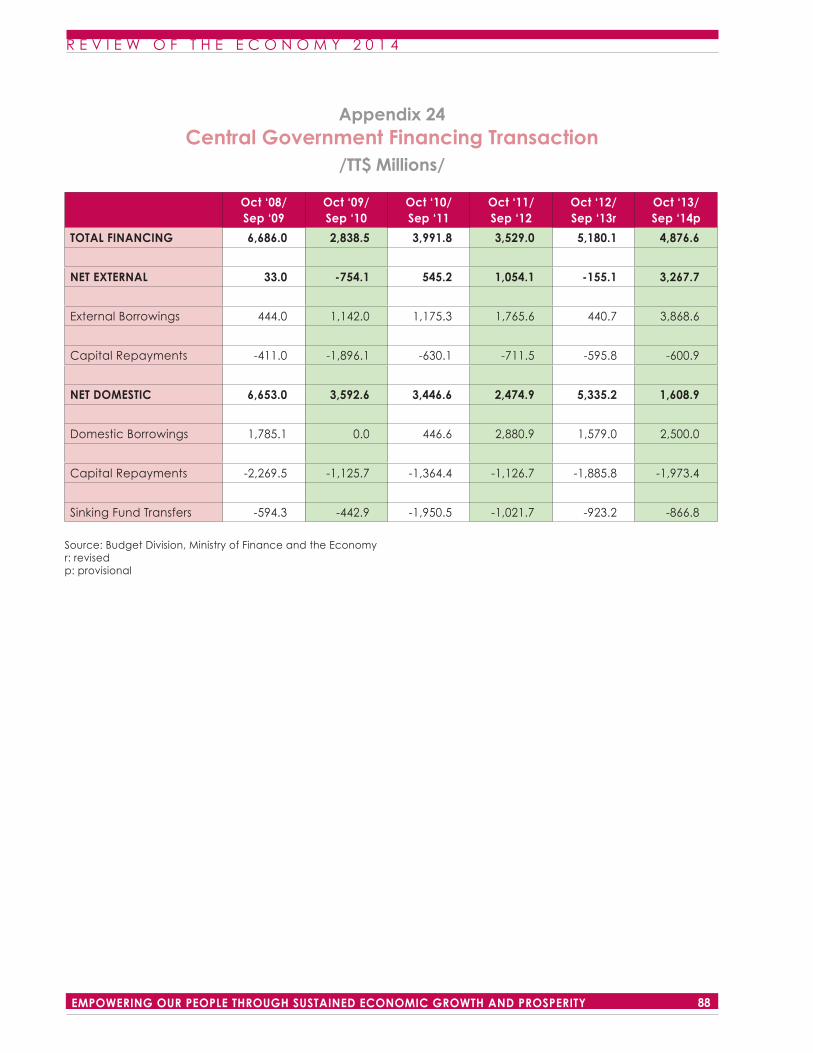
R E V I E W O F T H E E C O N O M Y 2 0 1 4
88EMPOWERING OUR PEOPLE THROUGH SUSTAINED ECONOMIC GROWTH AND PROSPERITY
R E V I E W O F T H E E C O N O M Y 2 0 1 4
89 EMPOWERING OUR PEOPLE THROUGH SUSTAINED ECONOMIC GROWTH AND PROSPERITY
Appendix 24Central Government Financing Transaction
/TT$ Millions/
Oct ‘08/ Sep ‘09
Oct ‘09/ Sep ‘10
Oct ‘10/ Sep ‘11
Oct ‘11/ Sep ‘12
Oct ‘12/ Sep ‘13r
Oct ‘13/ Sep ‘14p
TOTAL FINANCING 6,686.0 2,838.5 3,991.8 3,529.0 5,180.1 4,876.6
NET EXTERNAL 33.0 -754.1 545.2 1,054.1 -155.1 3,267.7
External Borrowings 444.0 1,142.0 1,175.3 1,765.6 440.7 3,868.6
Capital Repayments -411.0 -1,896.1 -630.1 -711.5 -595.8 -600.9
NET DOMESTIC 6,653.0 3,592.6 3,446.6 2,474.9 5,335.2 1,608.9
Domestic Borrowings 1,785.1 0.0 446.6 2,880.9 1,579.0 2,500.0
Capital Repayments -2,269.5 -1,125.7 -1,364.4 -1,126.7 -1,885.8 -1,973.4
Sinking Fund Transfers -594.3 -442.9 -1,950.5 -1,021.7 -923.2 -866.8
Source: Budget Division, Ministry of Finance and the Economyr: revisedp: provisional
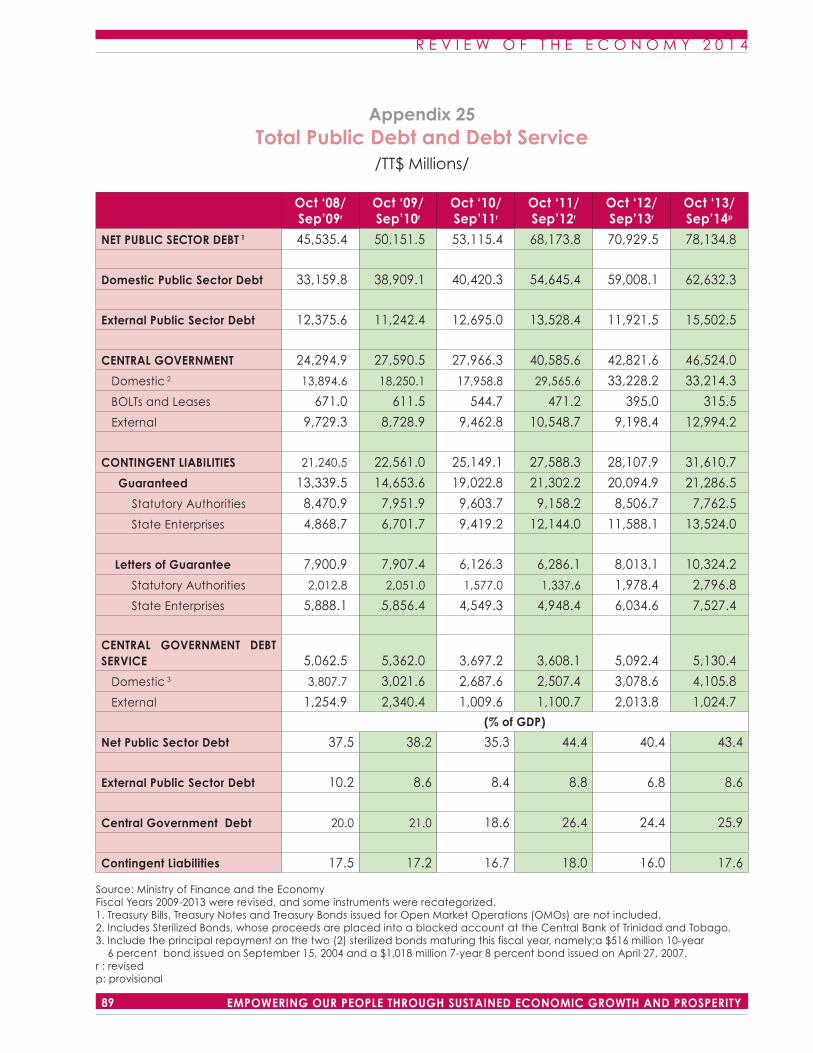
R E V I E W O F T H E E C O N O M Y 2 0 1 4
88EMPOWERING OUR PEOPLE THROUGH SUSTAINED ECONOMIC GROWTH AND PROSPERITY
R E V I E W O F T H E E C O N O M Y 2 0 1 4
89 EMPOWERING OUR PEOPLE THROUGH SUSTAINED ECONOMIC GROWTH AND PROSPERITY
Appendix 25Total Public Debt and Debt Service
/TT$ Millions/
Oct ‘08/ Sep’09r
Oct ‘09/ Sep’10r
Oct ‘10/ Sep’11r
Oct ‘11/ Sep’12r
Oct ‘12/ Sep’13r
Oct ‘13/ Sep’14p
NET PUBLIC SECTOR DEBT 1 45,535.4 50,151.5 53,115.4 68,173.8 70,929.5 78,134.8
Domestic Public Sector Debt 33,159.8 38,909.1 40,420.3 54,645.4 59,008.1 62,632.3
External Public Sector Debt 12,375.6 11,242.4 12,695.0 13,528.4 11,921.5 15,502.5
CENTRAL GOVERNMENT 24,294.9 27,590.5 27,966.3 40,585.6 42,821.6 46,524.0
Domestic 2 13,894.6 18,250.1 17,958.8 29,565.6 33,228.2 33,214.3
BOLTs and Leases 671.0 611.5 544.7 471.2 395.0 315.5
External 9,729.3 8,728.9 9,462.8 10,548.7 9,198.4 12,994.2
CONTINGENT LIABILITIES 21,240.5 22,561.0 25,149.1 27,588.3 28,107.9 31,610.7
Guaranteed 13,339.5 14,653.6 19,022.8 21,302.2 20,094.9 21,286.5
Statutory Authorities 8,470.9 7,951.9 9,603.7 9,158.2 8,506.7 7,762.5
State Enterprises 4,868.7 6,701.7 9,419.2 12,144.0 11,588.1 13,524.0
Letters of Guarantee 7,900.9 7,907.4 6,126.3 6,286.1 8,013.1 10,324.2
Statutory Authorities 2,012.8 2,051.0 1,577.0 1,337.6 1,978.4 2,796.8
State Enterprises 5,888.1 5,856.4 4,549.3 4,948.4 6,034.6 7,527.4
CENTRAL GOVERNMENT DEBT SERVICE 5,062.5 5,362.0 3,697.2 3,608.1 5,092.4 5,130.4
Domestic 3 3,807.7 3,021.6 2,687.6 2,507.4 3,078.6 4,105.8
External 1,254.9 2,340.4 1,009.6 1,100.7 2,013.8 1,024.7 (% of GDP)
Net Public Sector Debt 37.5 38.2 35.3 44.4 40.4 43.4
External Public Sector Debt 10.2 8.6 8.4 8.8 6.8 8.6
Central Government Debt 20.0 21.0 18.6 26.4 24.4 25.9
Contingent Liabilities 17.5 17.2 16.7 18.0 16.0 17.6
Source: Ministry of Finance and the EconomyFiscal Years 2009-2013 were revised, and some instruments were recategorized.1. Treasury Bills, Treasury Notes and Treasury Bonds issued for Open Market Operations (OMOs) are not included.2. Includes Sterilized Bonds, whose proceeds are placed into a blocked account at the Central Bank of Trinidad and Tobago.3. Include the principal repayment on the two (2) sterilized bonds maturing this fiscal year, namely;a $516 million 10-year 6 percent bond issued on September 15, 2004 and a $1,018 million 7-year 8 percent bond issued on April 27, 2007.r : revisedp: provisional
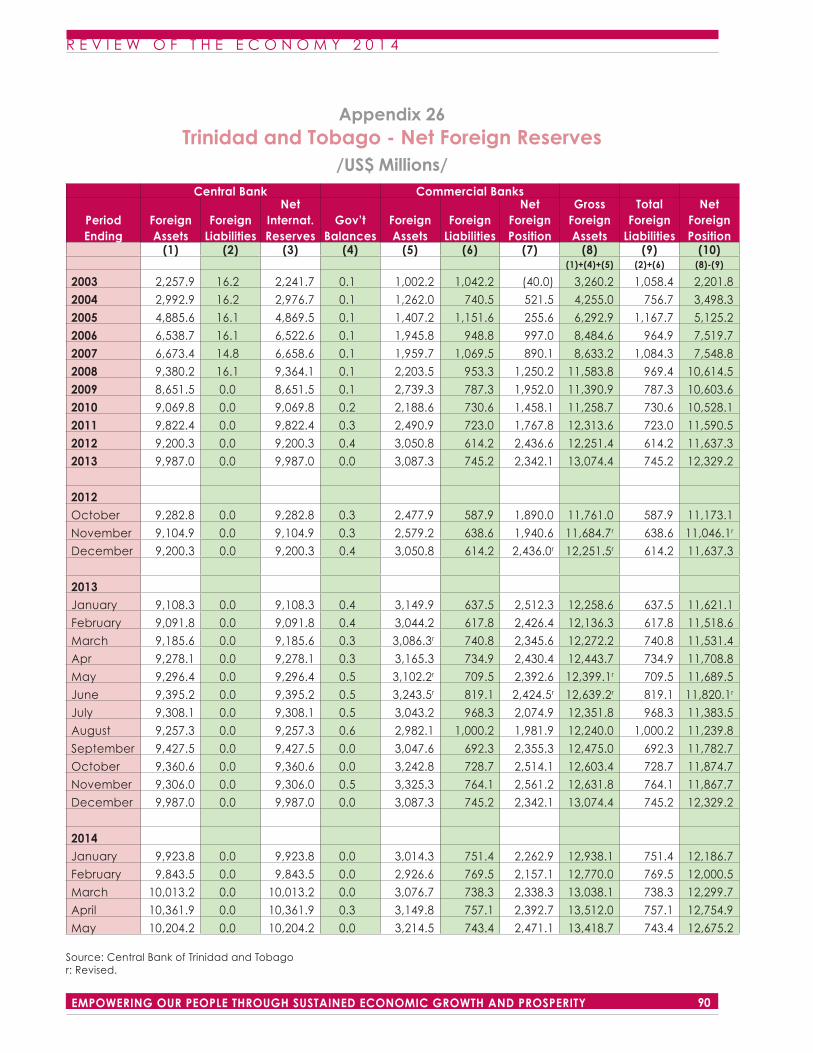
R E V I E W O F T H E E C O N O M Y 2 0 1 4
90EMPOWERING OUR PEOPLE THROUGH SUSTAINED ECONOMIC GROWTH AND PROSPERITY
R E V I E W O F T H E E C O N O M Y 2 0 1 4
91 EMPOWERING OUR PEOPLE THROUGH SUSTAINED ECONOMIC GROWTH AND PROSPERITY
Appendix 26Trinidad and Tobago - Net Foreign Reserves
/US$ Millions/ Central Bank Commercial Banks
Period Ending
Foreign Assets
Foreign Liabilities
Net Internat. Reserves
Gov’t Balances
Foreign Assets
Foreign Liabilities
Net Foreign Position
Gross Foreign Assets
Total Foreign
Liabilities
Net Foreign Position
(1) (2) (3) (4) (5) (6) (7) (8) (9) (10)(1)+(4)+(5) (2)+(6) (8)-(9)
2003 2,257.9 16.2 2,241.7 0.1 1,002.2 1,042.2 (40.0) 3,260.2 1,058.4 2,201.8
2004 2,992.9 16.2 2,976.7 0.1 1,262.0 740.5 521.5 4,255.0 756.7 3,498.3
2005 4,885.6 16.1 4,869.5 0.1 1,407.2 1,151.6 255.6 6,292.9 1,167.7 5,125.2
2006 6,538.7 16.1 6,522.6 0.1 1,945.8 948.8 997.0 8,484.6 964.9 7,519.7
2007 6,673.4 14.8 6,658.6 0.1 1,959.7 1,069.5 890.1 8,633.2 1,084.3 7,548.8
2008 9,380.2 16.1 9,364.1 0.1 2,203.5 953.3 1,250.2 11,583.8 969.4 10,614.5
2009 8,651.5 0.0 8,651.5 0.1 2,739.3 787.3 1,952.0 11,390.9 787.3 10,603.6
2010 9,069.8 0.0 9,069.8 0.2 2,188.6 730.6 1,458.1 11,258.7 730.6 10,528.1
2011 9,822.4 0.0 9,822.4 0.3 2,490.9 723.0 1,767.8 12,313.6 723.0 11,590.5
2012 9,200.3 0.0 9,200.3 0.4 3,050.8 614.2 2,436.6 12,251.4 614.2 11,637.3
2013 9,987.0 0.0 9,987.0 0.0 3,087.3 745.2 2,342.1 13,074.4 745.2 12,329.2
2012October 9,282.8 0.0 9,282.8 0.3 2,477.9 587.9 1,890.0 11,761.0 587.9 11,173.1
November 9,104.9 0.0 9,104.9 0.3 2,579.2 638.6 1,940.6 11,684.7r 638.6 11,046.1r
December 9,200.3 0.0 9,200.3 0.4 3,050.8 614.2 2,436.0r 12,251.5r 614.2 11,637.3
2013January 9,108.3 0.0 9,108.3 0.4 3,149.9 637.5 2,512.3 12,258.6 637.5 11,621.1
February 9,091.8 0.0 9,091.8 0.4 3,044.2 617.8 2,426.4 12,136.3 617.8 11,518.6
March 9,185.6 0.0 9,185.6 0.3 3,086.3r 740.8 2,345.6 12,272.2 740.8 11,531.4
Apr 9,278.1 0.0 9,278.1 0.3 3,165.3 734.9 2,430.4 12,443.7 734.9 11,708.8
May 9,296.4 0.0 9,296.4 0.5 3,102.2r 709.5 2,392.6 12,399.1r 709.5 11,689.5
June 9,395.2 0.0 9,395.2 0.5 3,243.5r 819.1 2,424.5r 12,639.2r 819.1 11,820.1r
July 9,308.1 0.0 9,308.1 0.5 3,043.2 968.3 2,074.9 12,351.8 968.3 11,383.5
August 9,257.3 0.0 9,257.3 0.6 2,982.1 1,000.2 1,981.9 12,240.0 1,000.2 11,239.8
September 9,427.5 0.0 9,427.5 0.0 3,047.6 692.3 2,355.3 12,475.0 692.3 11,782.7
October 9,360.6 0.0 9,360.6 0.0 3,242.8 728.7 2,514.1 12,603.4 728.7 11,874.7
November 9,306.0 0.0 9,306.0 0.5 3,325.3 764.1 2,561.2 12,631.8 764.1 11,867.7
December 9,987.0 0.0 9,987.0 0.0 3,087.3 745.2 2,342.1 13,074.4 745.2 12,329.2
2014January 9,923.8 0.0 9,923.8 0.0 3,014.3 751.4 2,262.9 12,938.1 751.4 12,186.7
February 9,843.5 0.0 9,843.5 0.0 2,926.6 769.5 2,157.1 12,770.0 769.5 12,000.5
March 10,013.2 0.0 10,013.2 0.0 3,076.7 738.3 2,338.3 13,038.1 738.3 12,299.7
April 10,361.9 0.0 10,361.9 0.3 3,149.8 757.1 2,392.7 13,512.0 757.1 12,754.9
May 10,204.2 0.0 10,204.2 0.0 3,214.5 743.4 2,471.1 13,418.7 743.4 12,675.2
Source: Central Bank of Trinidad and Tobagor: Revised.
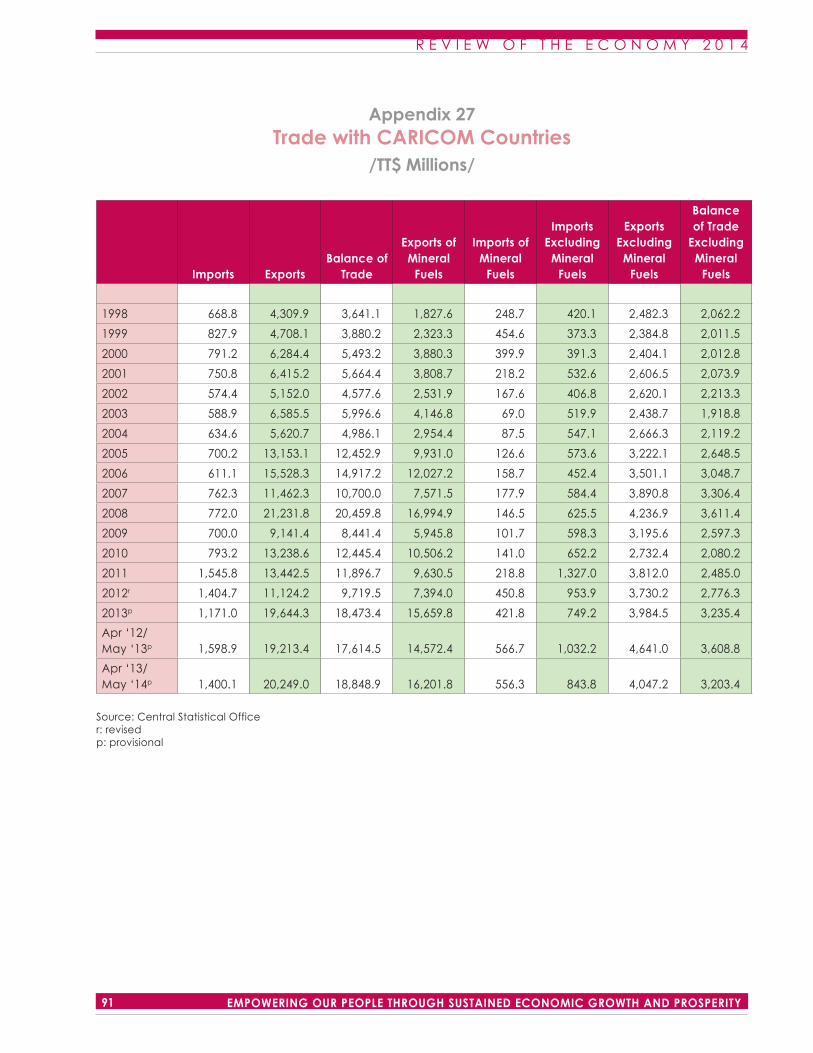
R E V I E W O F T H E E C O N O M Y 2 0 1 4
90EMPOWERING OUR PEOPLE THROUGH SUSTAINED ECONOMIC GROWTH AND PROSPERITY
R E V I E W O F T H E E C O N O M Y 2 0 1 4
91 EMPOWERING OUR PEOPLE THROUGH SUSTAINED ECONOMIC GROWTH AND PROSPERITY
Appendix 27Trade with CARICOM Countries
/TT$ Millions/
Imports ExportsBalance of
Trade
Exports of Mineral
Fuels
Imports of Mineral
Fuels
Imports Excluding
Mineral Fuels
Exports Excluding
Mineral Fuels
Balance of Trade
Excluding Mineral
Fuels
1998 668.8 4,309.9 3,641.1 1,827.6 248.7 420.1 2,482.3 2,062.2
1999 827.9 4,708.1 3,880.2 2,323.3 454.6 373.3 2,384.8 2,011.5
2000 791.2 6,284.4 5,493.2 3,880.3 399.9 391.3 2,404.1 2,012.8
2001 750.8 6,415.2 5,664.4 3,808.7 218.2 532.6 2,606.5 2,073.9
2002 574.4 5,152.0 4,577.6 2,531.9 167.6 406.8 2,620.1 2,213.3
2003 588.9 6,585.5 5,996.6 4,146.8 69.0 519.9 2,438.7 1,918.8
2004 634.6 5,620.7 4,986.1 2,954.4 87.5 547.1 2,666.3 2,119.2
2005 700.2 13,153.1 12,452.9 9,931.0 126.6 573.6 3,222.1 2,648.5
2006 611.1 15,528.3 14,917.2 12,027.2 158.7 452.4 3,501.1 3,048.7
2007 762.3 11,462.3 10,700.0 7,571.5 177.9 584.4 3,890.8 3,306.4
2008 772.0 21,231.8 20,459.8 16,994.9 146.5 625.5 4,236.9 3,611.4
2009 700.0 9,141.4 8,441.4 5,945.8 101.7 598.3 3,195.6 2,597.3
2010 793.2 13,238.6 12,445.4 10,506.2 141.0 652.2 2,732.4 2,080.2
2011 1,545.8 13,442.5 11,896.7 9,630.5 218.8 1,327.0 3,812.0 2,485.0
2012r 1,404.7 11,124.2 9,719.5 7,394.0 450.8 953.9 3,730.2 2,776.3
2013p 1,171.0 19,644.3 18,473.4 15,659.8 421.8 749.2 3,984.5 3,235.4
Apr ‘12/May ‘13p 1,598.9 19,213.4 17,614.5 14,572.4 566.7 1,032.2 4,641.0 3,608.8
Apr ‘13/May ‘14p 1,400.1 20,249.0 18,848.9 16,201.8 556.3 843.8 4,047.2 3,203.4
Source: Central Statistical Officer: revisedp: provisional
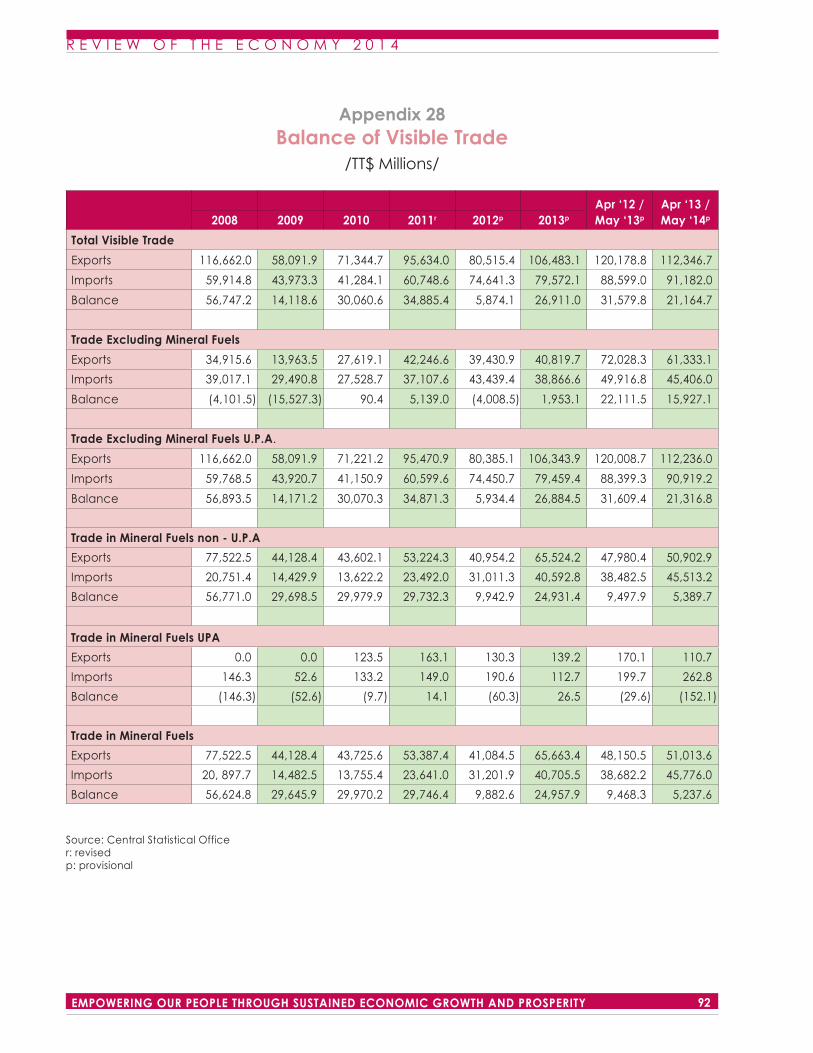
R E V I E W O F T H E E C O N O M Y 2 0 1 4
92EMPOWERING OUR PEOPLE THROUGH SUSTAINED ECONOMIC GROWTH AND PROSPERITY
R E V I E W O F T H E E C O N O M Y 2 0 1 4
PB EMPOWERING OUR PEOPLE THROUGH SUSTAINED ECONOMIC GROWTH AND PROSPERITY
Appendix 28Balance of Visible Trade
/TT$ Millions/
Apr ‘12 / May ‘13p
Apr ‘13 / May ‘14p2008 2009 2010 2011r 2012p 2013p
Total Visible Trade
Exports 116,662.0 58,091.9 71,344.7 95,634.0 80,515.4 106,483.1 120,178.8 112,346.7
Imports 59,914.8 43,973.3 41,284.1 60,748.6 74,641.3 79,572.1 88,599.0 91,182.0
Balance 56,747.2 14,118.6 30,060.6 34,885.4 5,874.1 26,911.0 31,579.8 21,164.7
Trade Excluding Mineral Fuels
Exports 34,915.6 13,963.5 27,619.1 42,246.6 39,430.9 40,819.7 72,028.3 61,333.1
Imports 39,017.1 29,490.8 27,528.7 37,107.6 43,439.4 38,866.6 49,916.8 45,406.0
Balance (4,101.5) (15,527.3) 90.4 5,139.0 (4,008.5) 1,953.1 22,111.5 15,927.1
Trade Excluding Mineral Fuels U.P.A.
Exports 116,662.0 58,091.9 71,221.2 95,470.9 80,385.1 106,343.9 120,008.7 112,236.0
Imports 59,768.5 43,920.7 41,150.9 60,599.6 74,450.7 79,459.4 88,399.3 90,919.2
Balance 56,893.5 14,171.2 30,070.3 34,871.3 5,934.4 26,884.5 31,609.4 21,316.8
Trade in Mineral Fuels non - U.P.A
Exports 77,522.5 44,128.4 43,602.1 53,224.3 40,954.2 65,524.2 47,980.4 50,902.9
Imports 20,751.4 14,429.9 13,622.2 23,492.0 31,011.3 40,592.8 38,482.5 45,513.2
Balance 56,771.0 29,698.5 29,979.9 29,732.3 9,942.9 24,931.4 9,497.9 5,389.7
Trade in Mineral Fuels UPA
Exports 0.0 0.0 123.5 163.1 130.3 139.2 170.1 110.7
Imports 146.3 52.6 133.2 149.0 190.6 112.7 199.7 262.8
Balance (146.3) (52.6) (9.7) 14.1 (60.3) 26.5 (29.6) (152.1)
Trade in Mineral Fuels
Exports 77,522.5 44,128.4 43,725.6 53,387.4 41,084.5 65,663.4 48,150.5 51,013.6
Imports 20, 897.7 14,482.5 13,755.4 23,641.0 31,201.9 40,705.5 38,682.2 45,776.0
Balance 56,624.8 29,645.9 29,970.2 29,746.4 9,882.6 24,957.9 9,468.3 5,237.6
Source: Central Statistical Officer: revisedp: provisional