Embed Size (px)
Citation preview
REVIEW OF THE ECONOMY 2009/10

Economic Advisory Council to the Prime MinisterHall-E
Vigyan BhawanMaulana Azad Road
New Delhi

33
I. GROWTH PERFORMaNCE aNd OuTlOOk
1. In the Council’s October 2009 Economic Outlook a growth rate of 6.5 per cent had been forecast for the current fiscal year, i.e. 2009/10. This estimate was based on the anticipation that the agricultural and allied sector would suffer a contraction of GDP of 2 per cent, while industry and services would both grow by 8.2 per cent. It was implicit in the forecast that this large negative growth in the farm sector would also adversely impinge on the expansion of non-farm activity up to a point.
2. The October forecast was done in the shadow of the weak South West monsoon which saw a record shortfall in precipitation of 24 per cent, similar to some of the years with the worst monsoon of past decades. In addition, in late September and early October 2009, unusually heavy rainfall in parts of the Deccan Peninsula, caused massive floods in parts of Andhra Pradesh and Karnataka, resulting in considerable damage to standing crops, including paddy and pulses.
3. The Council had expected a strong rebound in the second half of 2009/10, i.e. the third and fourth quarters. In part, the extent of the rebound would flow from a base-effect for the economy as a whole, and industry in particular, that had suffered severely from the impact of the crisis during the corresponding period of last year. That has indeed turned out to be a correct assessment, except that the rebound is stronger than had been estimated in October 2009.
4. The outcome in the farm sector has been much better than had been feared at the time when it became clear that the monsoon was going to be extremely poor. In the Council’s October assessment it had been estimated that the kharif rice harvest would show a substantial shortfall in excess of 15 per cent or of nearly 14 m.t. (million tonnes), compared to last year’s production. The recently revised Second Advance Estimate places kharif rice production at almost 73 m.t., which is about 12 m.t. less than last year. Higher rabi output is likely to reduce the output shortfall for rice. The Second Advance Estimate places total foodgrain production at 216.85 m.t in 2009/10, which is 17.62 m.t. less than last year’s production of 234.47 m.t. Of this shortfall, rice accounts

Review of the Economy 2009/10
4
for over 11 m.t. and coarse cereals almost 6 m.t. Oilseeds production has also suffered, but the decline would be restricted to 1.4 m.t or about 5 per cent. Sugarcane production has suffered a large decline of 12 per cent.
Table 1 GdP Growth – actual & Projected unit: per cent2005-06 2006-07 2007-08 2008-09 2009-10 2010-11 2011-12
QE AE f fYear-on-year Growth Rates
1 Agriculture & allied activities 5.2 3.7 4.7 1.6 –0.2 5.0 4.0
2 Mining & Quarrying 1.3 8.7 3.9 1.6 8.7 7.5 8.03 Manufacturing 9.6 14.9 10.3 3.2 8.9 8.9 9.24 Electricity, Gas & Water Supply 6.6 10.0 8.5 3.9 8.2 8.0 9.05 Construction 12.4 10.6 10.0 5.9 6.5 9.0 10.06 Trade, Hotels, Transport,
Storage & Communication12.1 11.7 10.7 7.6 8.3 9.0 11.0
7 Finance, insurance, real estate & business services
12.8 14.5 13.2 10.1 9.9 10.0 11.0
8 Community & personal services
7.6 2.6 6.7 13.9 8.2 7.0 7.0
9 Gross Domestic Product at factor cost
9.5 9.7 9.2 6.7 7.2 8.2 9.0
10 Industry (2 + 3 + 4 + 5) 9.3 12.7 9.5 3.9 8.6 8.7 9.211 Services (6 + 7 + 8) 11.1 10.2 10.5 9.8 8.7 8.8 10.112 Non-agriculture (9 - 1) 10.5 11.0 10.2 7.7 8.5 8.8 9.814 GDP (factor cost) per capita 7.8 8.1 7.7 5.2 5.7 6.7 7.5
Some Magnitudes15 GDP at factor cost - 2004/05
prices in Rs lakh crore (or Trillion)
32.5 35.6 38.9 41.5 44.5 48.2 52.5
16 GDP market & current prices in Rs lakh crore (or Trillion)
37.1 42.8 49.5 55.7 61.6 70.1 80.2
17 GDP market & current prices in US$ Billion
837 947 1,231 1,222 1,312 1,557 1,886
18 Population in Million 1,106 1,122 1,138 1,154 1,170 1,187 1,20319 GDP market prices per capita
current prices33,512 38,182 43,479 48,305 52,675 59,041 66,621
20 GDP market prices per capita in current US$
757 844 1,082 1,059 1,121 1,312 1,567
Note: QE refers to the Quick Estimates for National Income released on 29 Jan 2010. AE refers to the Advance Estimate for National Income released on 8 Feb 2010.
f stands for forecasts made by the Council.

5
Growth Performance and Outlook
5. The fact that, despite such a bad SW monsoon, the contraction in crop output, especially that of rice, has been restricted is in part due to the proactive measures adopted by Central and State Governments to protect the kharif crop and enhance the rabi planting. In part, this has also been a consequence of greater coverage of irrigation, especially of minor and micro irrigation. Finally, the rabi harvest may be somewhat better than that in the Second Advance Estimate.
6. The Advance Estimate of National Income in 2009/10, released on 8 February, 2010, indicate that the GDP for the economy is likely to grow by 7.2 per cent, with contraction in the farm sector GDP restricted to 0.2 per cent. GDP arising in industry is estimated to rise by 8.6 per cent and that in the services sector by 8.7 per cent. The overall non-agricultural GDP would thus have risen by 8.5 per cent in 2009/10. The economy grew by 7.0 per cent in the first half of this year and by 7.4 per cent in the second half of the year. This was despite the fact that the third quarter bore the brunt of the effect of the contraction in the output of kharif foodgrains.
7. Manufacturing GDP has seen a very sharp pick-up, especially from the third quarter onwards. While, overall for the year, manufacturing GDP is estimated to have risen by 8.9 per cent, that in the second half is estimated to have expanded by about 11.5 per cent. Mining and quarrying has picked up sharply, rising by 8.7 per cent for the year, on the back of higher natural gas output and also some improvement in coal production. Power output has also improved, especially from Q2 onwards. A strong recovery has also happened in the services sector as well.
8. The advance estimates are subject to revision on receipt of complete data for the fiscal year. In the assessment of the Council, it is possible that this revision may result in a further reduction in the farm sector GDP, to perhaps something closer to (–) 1 per cent. It is also possible that the extent of growth in the financial, real estate and business services sector will also be lower on revision. However, these are likely to be offset by an upward revision in manufacturing and construction. The very strong manufacturing output growth for December 2009 underscores this. Thus, it is most likely that the aggregate GDP growth rate may be revised marginally upwards.

Review of the Economy 2009/10
6
9. While the economic outcome in terms of GDP and components thereof for 2009/10 are now generally known, the more important forward-looking issue is about the economic outlook for 2010/11 and 2011/12. The Council has decided to make and share an indicative assessment of the outlook for 2010/11 and 2011/12. Obviously, many things about these years are not known at this point in time and there will be much greater variability associated with the assessments and assumptions that underpin these estimates. However, it is important to understand what is going on in this economy, its potential and constraints, and how all of these serve to frame questions and options upon which public policy must define its priorities. Assessments of both of these years assume a normal South West monsoon and absence of any major calamity or setback at the international level. It is also based on certain assessments about the international economy, which are discussed in the next section. The Council expects a bounce back in agricultural GDP in the next year and maintenance of the desired trend growth of 4 per cent in 2011/12. We expect industrial and service sector activity to continue to expand strongly through both these years. The Council is also assuming that the Government priorities and initiatives in the creation of infrastructure and the participation of the private sector in this process will proceed along desired lines.
10. On this basis, we are making an initial estimate that the economy would grow by 8.2 per cent in 2010/11 and by 9.0 per cent in 2011/12. The non-farm sector is expected to grow by 8.8 per cent in 2010/11 and 9.8 per cent in 2011/12, compared to 8.5 per cent in 2009/10. It is pertinent to note that in each of the three years, 2005/06, 2006/07 and 2007/08 the non-farm sector grew between 10 and 11 per cent each year. The Council’s growth estimate for 2010/11 has an upward bias.
11. The Council expects global conditions to be somewhat better in the coming years. As a result of this, there should be some recovery in export demand in 2010/11, a turnaround from the contraction suffered in the second half of 2008/09 and that in 2009/10, which is likely to be followed by modest growth in 2011/12. The most distinctive element of the growth process over the next few years will be that infrastructure asset creation and expansion will play the role of prime mover. We see the expansion of consumption, particularly private final consumption playing a supporting

7
role, showing fairly steady growth reflecting the increase in personal disposable incomes.
12. These are median estimates with both down-side and up-side potential. The down-side potential primarily flows from risks of deterioration in financial stability conditions and rising commodity prices on account of adverse developments in the global economy. On the domestic side, the most important risk factor would be the extent to which we are able to ramp up investment in infrastructure not only to increase demand in the first round, but also to relax constraints on output that arise from deficient infrastructure. The second most important domestic issue that could play a major role is price stability, i.e. inflation, especially that arising from supply constraints restricting farm sector output growth. The up-side to these estimates flow from better than expected improvement in export demand, and on the domestic side from much better outcomes in infrastructure and in the functioning of the government machinery.
Growth Performance and Outlook
8
II. INTERNaTIONal ECONOMIC CONdITIONS
13. The Council had analyzed some of the key characteristics of the financial crisis in the October outlook that need not be reiterated here. We had concluded that the advanced economies are likely to show a subdued pace of recovery in the coming years. The Council had also noted that global investors are likely to show greater discrimination and, in general, be more demanding in the coming years. The principal risk was viewed as flowing from developments in the global economy, as inflationary pressure picks up, on account of a rebound in commodity prices. The Council had also noted that there was a risk that came from the possibility of another setback in the world of finance, where even a small failure was likely to have amplified consequences.
14. Broadly, these conclusions remain valid today, even as we have more information about the process of economic recovery across the globe. The International Monetary Fund (IMF) in its update to the World Economic Outlook issued at the end of January 2010 made a short assessment of the world economy. It noted that real economic activity was “rebounding” and that the economic recovery was proceeding at “varying speeds”. The IMF expects that output in advanced economies will increase by 2.1 per cent in 2010 compared to a contraction of 3.2 per cent in 2009. For 2011, it expects that advanced economies will “edge-up” further to 2.4 per cent. However, high unemployment, “yet unhealed” financial systems and weak household balance sheets present continuing challenges.
15. The IMF expects that the emerging and developing economies would experience growth of 6.0 per cent in 2010, up from 2.1 per cent in 2009 and this would further accelerate to 6.3 per cent in 2011. This growth process is led by key Asian emerging economies which the IMF, by implication, characterizes as those having more favourable initial conditions, were better insulated against external shocks and had policies that were better designed and/or worked better on the ground.
9
International Economic Conditions
16. The IMF notes that financial conditions have improved dramatically, but concerns remain. Namely that, (a) bank lending remains sluggish (b) it is not offset by the record equity/corporate bond issues that have happened and (c) sovereign debt has come under pressure in “some small countries”.
17. The IMF is of the opinion that in the advanced countries there is little prospect of inflationary pressures on account of “still-low level of capacity utilization and well-anchored inflation expectation”. However, it does see potential for inflationary pressures in emerging and developing economies that are likely to “edge-up” in 2010.
18. The four downside risks that the IMF sees going forward are (i) “premature and incoherent exit” from expansionary polices, (ii) impaired state of the financial systems (in advanced economies) (iii) “rising concerns” about worsening budgetary positions and fiscal sustainability which “could unsettle financial markets” (iv) rise in commodity prices which could constrain the recovery even in advanced economies.
19. The developed economies including the US, Euro-zone, Japan and the UK have all come out of recession. As the Council had expected in October 2009, all signs suggest that it is a weak recovery. There is no sign yet to the contrary. Financial conditions have improved dramatically over the past several months but have been vulnerable to several bouts of nervousness, which is understandable. Monetary and fiscal accommodation in the advanced economies continues by and large unchanged. Fiscal deficits are extremely large by historical standards and the recently unveiled US Federal Budget suggests that this is likely to be a feature that will continue over the next few years.
20. Of the downside risks that the IMF had written about in its January 2010 update, the one that has materialized quite rapidly in recent weeks, is the extent to which financial markets have been unsettled by doubts about fiscal sustainability in some advanced economies. The difficulties of Greece have expanded the net of suspect economies in the Euro-zone, and the currency has taken a hit on that account. Nervousness, about how much unknown danger may yet lurk in government balances of some Euro-zone countries, has unsettled the market to such an extent, that it has led to a worldwide sell-off in equities and a massive increase in risk aversion.

Review of the Economy 2009/10
10
21. Some of these things had happened at the time when the financial crisis broke in September 2008. It is extremely unlikely that the developments of the past few weeks (since January 20, 2010) presage another crisis. However, the fact remains that the extent of the sell-off does underscore the degree of nervousness in the financial markets and that would not have been eased by the large budgeted deficit of fiscal year 2010 as well as the subsequent years unveiled by the US Government at the beginning of February 2010. It is axiomatic that very large deficits can not be sustained on a continuing basis as it leads to eventual increase in interest rates and debasement of the currency. However, the US dollar is the principal reserve currency and with the Euro-zone under the shadow of actual and potential fiscal delinquency in some member countries, global financial markets face very limited options, none of which look particularly appealing. These are not good conditions to support growth which invariably means some amount of risk taking by economic agents.
22. Though the financial crisis is now behind the advanced economies, their banking and financial systems remain fundamentally unchanged and retain the old suspect mortgage backed assets. Structurally too, changes have been limited. Then again, banks and financial systems have become risk averse, households are trying to rebalance their balance sheets and limiting indebtedness is always a part of this process. Under these conditions, large increases in bank credit to stressed sectors cannot be reasonably expected. Nor may it be desirable.
23. It seems to us that of the downside risks which the IMF had mentioned, the most important is the real worsening of budgetary positions. This casts a shadow on the fiscal sustainability of this path for major advanced economies that are also issuers of reserve currency. It is the deterioration in the real position that is a risk, not the “rising concerns” about it. Rallying commodity prices are also a major risk to economic growth in the emerging and developing economies, as well as to the economic recovery in the advanced economies. However, it has to be recognized that some of the increase in commodity prices is really the inverse of the confidence (or the lack of it) in the principal reserve currencies and the extremely low yields at the short end, which encourages investors to borrow short-term at low rates

11
and invest in commodities. A more stable currency with more normal interest rates would not encourage this kind of speculative pressure on commodity prices. That this indeed is the case, i.e., that prices of major commodities like crude oil have not changed in the last few months in reaction to fundamental economic forces of demand and supply but due to financial factors, can be readily recognized in the sharp increase in crude oil prices in the second half of 2009 and the large sell-off over the past few weeks. The fundamental fact remains that monetary and fiscal stability is a cornerstone for both financial and price stability.
24. Emerging and developing economies like India and China and our neighbors in South East Asia, will have to contend with the adverse consequences of commodity prices and the negative impact on the confidence of the financial sector that flow from the continuation of massive expansionary fiscal and monetary policies in the advanced economies, particularly issuers of reserve currency.
International Economic Conditions

12
III. STRuCTuRal FaCTORS
25. The Central Statistical Organization (CSO) has issued National Income Statistics on a new base year, namely 2004/05. Improved data capture has led to an increase in the assessed size of the economy of 3 to 6 per cent over recent years. CSO has also revised the investment estimates for 2007/08 and 2008/09, both slightly downwards. For 2007/08, the investment rate has been revised down from 39.1 per cent of GDP in the QE published last year to 37.7 per cent. Likewise, the provisional estimate for 2008/09 has been revised down from a little over 39 per cent to 34.9 per cent in the QE. In the October 2009 Outlook, the Council had pointed out that the 2008/09 provisional estimate for investment rate appeared to be too high, and had put forward an alternative estimate of 36.5 per cent. For the current year 2009/10, the Advance Estimate places Gross Domestic Capital Formation at 36.6 per cent which we perceive to be a reasonable assessment.
Table 2 Values of key Macro-economic ParametersInvest-ment Rate
Gross domestic
Fixed Capital
Formation
domestic Savings
Rate
Cur-rent ac-
count Bal-ance
domestic Savings
Rate
Final Con-sumption
Rate
Gross domes-tic Capital Formation
(GdCF)
GdCF in Fixed Capital
only
Final Consump-tion Expenditure
Pri-vate
Govt. Total Pvt. Corp.
Total Pvt. Corp.
Pri-vate
Govt. Total
Ratio to GdP at market prices Growth rate at Constant Prices
2000/01 * 24.3 22.7 23.7 –0.6 23.7 64.0 12.6 –4.0 –28.3 –0.01 –11.0 3.6 0.9 3.2
2001/02 * 22.8 23.6 23.5 0.7 23.5 64.5 12.4 3.8 8.6 7.4 3.6 5.7 2.3 5.2
2002/03 * 25.2 23.8 26.3 1.2 26.3 63.3 11.9 10.9 17.1 6.8 3.5 2.8 –0.4 2.3
2003/04 * 27.6 25.0 29.8 2.3 29.8 61.8 11.3 12.9 24.6 13.6 23.2 6.0 2.6 5.5
2004/05 32.7 28.8 32.2 –0.3 32.2 59.5 11.0 22.3* 68.1* 18.9* 62.8* 5.5* 3.6* 5.2*
2005/06 34.3 30.4 33.1 –1.2 33.1 58.2 10.9 16.0 44.1 15.3 41.7 8.6 8.3 8.5
2006/07 35.5 31.4 34.4 –1.0 34.4 57.8 10.4 16.1 20.2 14.3 18.7 8.3 3.8 7.6
2007/08 37.7 33.0 36.4 –1.3 36.4 57.1 10.4 15.2 23.0 15.2 20.6 9.6 9.7 9.6
2008/09 QE 34.9 33.0 32.5 –2.4 32.5 57.9 11.7 –2.4 –16.6 4.0 –5.1 6.8 16.7 8.3
2009/10 est. 36.2§ 33.0§ 34.0§ –2.2 34.0§ 57.8 12.1 5.2 7.5§ 5.2 5.0§ 4.2 8.2 4.9
2010/11 proj. 37.3 33.7 35.2 –2.1 35.2 56.0 10.8 15.0 20.0 12.8 15.0 6.8 3.1 6.2
2011/12 proj.
38.2 35.0 36.1 –2.1 36.1 55.5 10.3 12.7 14.4 12.8 15.0 8.0 4.0 7.4
Note: * For these years the GDP and component figures are as per the old NAS series; § Estimates
13
26. The sharp fall in the investment rate in 2008/09 derives mostly from a decline in inventories. The ratio of fixed investment to GDP has been assessed in the Advance Estimate at 32.3 per cent of GDP in 2009/10. The Council feels that the estimate of fixed capital formation will move upward on revision to 33 per cent or higher for 2009/10. For the moment, we are placing it marginally higher at 33.0 per cent of GDP (see Table 2) which is identical to the 33 per cent of 2007/08 and 2008/09 and qualitatively higher than the 25 per cent of 2003/04.
27. As noted in the October 2009 Outlook, the pace of fixed asset creation, as well as that of domestic savings, have experienced a structural break over the past six years. The fixed investment rate has shot up from 25 per cent and below, to 33 per cent and is likely to move up to over 35 per cent in a couple of years. The domestic savings rate, similarly, has gone from below 24 per cent in 2000/01 to over 36 per cent in 2007/08. The sharp decline in the savings rate in 2008/09 is entirely due to the large increase in Government dissavings, as a result of the large fiscal accommodation resorted to as a response to the financial crisis. Of the drop of 3.9 percentage points of the GDP in the domestic savings rate between 2007/08 and 2008/09, as much as 3.1 percentage points was on account of the increase in Government dissavings. In 2007/08, Government savings were a positive 0.6 per cent of GDP which changed to (–) 2.5 per cent in 2008/09. The QE for 2008/09 also suggests that there was a decline in financial savings of households from 11.2 per cent of GDP in 2007/08 to 10.4 of GDP in 2008/09. On looking at the underlying data on financial asset creation in the household sector, we are inclined to conclude that there may have been an underestimation of financial asset creation in the household sector. The gross financial asset creation in this sector in 2008/09 was estimated at 13.4 per cent of GDP compared to 14.5 per cent in the previous year and 15.2 per cent in the year prior to that. While claims on Government fell in 2008/09, no counterpart increase is recorded for the other components, which suggest the aggregate might have been an underestimate.
28. The savings rate estimated by us at 34 per cent for 2009/10 is expected to show a recovery. Household sector savings would exceed 23 per cent both in this year (2009/10) as well as in the coming years and approach 24 per cent of GDP in 2011/12. Government dissaving will continue to be large in
Structural Factors

Review of the Economy 2009/10
14
2009/10 but it is expected to fall in the coming years as fiscal consolidation reduces the deficit. The corporate savings rate has remained a little less than 9 per cent and we expect it to remain largely unchanged in the coming years as well. Overall, the domestic savings rate is expected to recover to 34.0 per cent in 2009/10, cross 35 per cent in 2010/11 and touch 36 per cent in 2011/12.
29. At constant prices, the annual increase in fixed capital formation is expected to recover from the 4 per cent growth recorded in 2008/09 to over 5 per cent in 2009/10 and rise to over 12 per cent in the coming two years. In particular, fixed capital formation in the private corporate sector, which suffered a setback in 2008/09 (– 5.1 per cent) is expected to recover to 15 per cent annual growth in 2010/11 and maintain double digit expansion in 2011/12.
30. The ratio of domestic private final consumption expenditure to GDP, has shown a steady decline over the recent years, as the savings rate has increased. We expect that there will be further small declines in this ratio in the coming two years as well. However, at constant prices, private final consumption expenditure should expand at a strong rate of around 7 per cent in coming years, reflecting the steady increase in personal disposable incomes. As a result of fiscal consolidation, we expect a slowing down of real growth in government final consumption expenditure.
31. The difference between the projected savings rate and the investment rate is, of course, the current account deficit. As may be noted from our projections, this current account deficit is expected to be little over 2 per cent in both 2010/11 and 2011/12. Given the robustness on India’s trade (goods and services) front, large capital flows and sizeable foreign exchange reserves, the pursuit of high rates of fixed investment and economic growth is consistent with the projected level of the current account deficit.
15
IV. SECTORal – aGRICulTuRE, INduSTRY aNd SERVICES
agriculture
32. The Second Advance Estimate released on 12 February 2010 show that foodgrain production in 2009/10 is likely to be 216.9 m.t., which is 17.6 m.t. lower than the output in 2008/09. Most of the loss of production was in the kharif season which in 2009/10 is expected to be 99.9 m.t. compared to 118.1 m.t. in the previous year. The Second Advance Estimate suggests that the rabi harvest of 2009/10 may be marginally higher than that in 2008/09, with wheat output set to nearly equal last year’s production of 80.7 m.t. Further, the rabi rice output pegged at 14.7 m.t. for the current year may actually turn out to be slightly higher. On the whole, it is likely that the overall rabi output may be slightly more than that indicated in the Second Advance Estimate.
33. This outcome is quite creditable considering the severe shortfall in SW monsoon precipitation, accelerated by the floods of late September/early October 2009. Rice output in the kharif was 12 m.t. less than that of last year. Overall, taking higher rabi production into account it is likely that the shortfall in rice production for the year as a whole may be restricted to 11 m.t. Coarse cereal production has taken a large hit, which is largely due to the bad monsoon, since most of the crop is grown in the kharif months and that too in rain-dependent regions of the country.
34. The output of pulses, notwithstanding the drought and floods, is marginally better than that of last year, in respect of most pulses. The biggest shortfall is in moong. The production of pulses has proved very inadequate given the level of domestic demand and the limited availability of certain kinds of domestically popular pulses in the international market. This is a critical area for future action to achieve significant improvements in the productivity of pulses and make it possible for our farmers to raise this remunerative crop in much greater quantity and in a profitable fashion.

Review of the Economy 2009/10
16
Table 3 Estimates of Farm Crop Output
Output in 2008/2009 (final) Output in 2009/10 (2nd aE) Change in 2009/10kharif Rabi Total kharif Rabi Total Percent absolute
Million Tonnes m.t.Rice 84.91 14.27 99.18 72.87 14.69 87.56 –11.7% –11.62Wheat 80.68 80.68 80.28 80.28 –0.5% –0.40Coarse Cereals 28.54 11.49 40.04 22.76 11.51 34.27 –14.4% –5.77Pulses 4.69 9.88 14.57 4.22 10.52 14.74 1.2% 0.17Foodgrains 118.144 116.32 234.47 99.85 117.00 216.85 –7.5% –17.61Jowar 3.05 4.19 7.24 2.51 4.26 6.77 –6.5% –0.47Bajra 8.89 8.89 6.39 6.39 –28.1% –2.50Maize 14.12 5.61 19.73 11.66 5.64 17.30 –12.3% –2.43Ragi 2.04 2.04 1.87 1.87 –8.3% –0.17Small millets 0.44 0.44 0.33 0.33 –25.7% –0.11Barley 1.69 1.69 1.61 1.61 –4.7% –0.08Coarse Cereals 28.54 11.49 40.04 22.76 11.51 34.27 –14.4% –5.77Tur (Arhar) 2.27 2.27 2.50 2.50 10.1% 0.23Gram 7.06 7.06 7.46 7.46 5.7% 0.40Urad 0.84 0.33 1.17 0.80 0.33 1.13 –3.4% –0.04Moong 0.78 0.26 1.04 0.41 0.26 0.67 –35.6% –0.37Others 0.80 2.23 3.03 0.51 2.47 2.98 –1.7% –0.05Pulses total 4.69 9.88 14.57 4.22 10.52 14.74 1.2% 0.17
Lakh Tonnes Lakh Tonnes
Nine Oilseeds 178.20 99.10 277.30 152.33 101.20 263.20 –5.1% –14.10Groundnut 56.20 15.50 71.70 39.20 16.10 55.30 –22.9% –16.40Castorseed 11.70 11.70 11.00 11.00 –6.0% –0.70Sesamum 6.40 6.40 6.00 6.00 –6.3% –0.40Nigerseed 1.20 1.20 1.10 1.10 –8.3% –0.10Rape & Mustard 72.00 72.00 74.30 74.30 3.2% 2.30Linseed 1.70 1.70 1.30 1.30 –23.5% –0.40Safflower 1.90 1.90 1.70 1.70 –10.5% –0.20Sunflower 3.60 8.00 11.60 2.50 7.80 10.30 –11.2% –1.30Soybean 99.10 99.10 102.20 102.20 3.1% 3.10Cotton Lakh bales of 170 kg 222.80 223.20 0.2% 0.40Jute & mesta Lakh bales of 180 kg 103.60 103.60 0.0% 0.00Sugarcane Lakh tonnes 2,850.30 2,512.70 –11.8% –337.60

17
35. Oilseeds output is also lower by 1.4 m.t. or by 5 per cent, compared to last year, primarily on account of lower groundnut production. The lower groundnut production is mostly the consequence of poor rainfall in the kharif planting season in Central and Western India.
36. Sugarcane output is lower by almost 12 per cent compared to last year. It needs to be pointed out that last year too production suffered a large decline compared to the previous year. The large shortfall in sugarcane production has led to a big gap between demand and domestic production of sugar.India is the largest consumer of sugar in the world and these factors have combined to result in a severe escalation of both domestic and world prices of sugar.
Industry and Services
37. In the October 2009 report, the Council had expected that output expansion in both the industrial and the services sectors would show a strong recovery in 2009/10. We had expected that the mining sector would continue to show a strong output expansion along the lines that it had recorded in June and July 2009. However, crude oil output has continued to show slackening growth in Q3, while growth in the output of coal fell to 5 per cent and below in Q3. As a result, despite the large increase in the production of natural gas, iron ore and some other minerals, overall expansion of the mining sector has remained at less than 10 per cent in Q3 and is likely to do so in the last quarter as well.
38. In August 2009, electricity generation increased by over 10 per cent and in September by nearly 8 per cent. However, this sharp improvement was not sustained in subsequent months. In Q3, electricity generation grew by an average of only 4.5 per cent and while there has been some improvement in January and early February 2010, it is likely that electricity generation growth will remain around 6 per cent in the final quarter of the current fiscal. The shortfall in power generation, as opposed to the programme generation, is in part due to lower hydel power generation, itself a consequence of the poor monsoons and the low level of reservoir capacity. However, inadequate coal production and delayed imports, have adversely affected coal availability, leading to lower thermal generation vis-à-vis programme levels.
Sectoral – Agriculture, Industry and Services
Review of the Economy 2009/10
18
Table 4 Trends in Industrial Output
Unit: per centGeneral Manu-
factureElectricity Mining Basic
goodsCapital goods
Intermedi-ate goods
Consumer GoodsTotal durables Non-
durables2007/08Q1 10.3 11.1 8.3 2.7 9.4 19.1 9.3 9.0 –0.7 12.4Q2 8.7 8.9 7.1 7.4 9.3 21.3 10.5 2.2 –5.5 5.1Q3 8.3 8.9 4.6 5.5 5.0 20.8 8.9 6.2 2.1 7.6Q4 6.7 7.3 5.5 5.2 4.7 12.2 7.1 6.8 0.1 8.92008/09Q1 5.3 5.8 2.0 4.0 3.1 7.9 2.6 8.6 3.5 10.1Q2 4.7 4.9 3.2 3.8 4.7 13.2 –1.7 6.6 10.8 5.1Q3 0.8 0.5 2.9 2.0 2.4 3.8 –5.8 3.3 -1.8 4.9Q4 0.8 0.3 3.0 0.9 0.4 5.0 –3.2 1.2 5.6 –0.12009/10Q1 3.8 3.4 6.0 6.8 6.3 2.0 7.4 –0.5 15.6 –5.3Q2 9.0 9.2 7.4 9.0 5.9 8.6 11.7 10.1 23.7 5.1Q3 13.1 14.3 4.5 9.5 5.9 21.6 18.7 11.9 33.8 5.2Q4 f 13.6 14.6 6.1 9.6 9.3 24.8 18.0 10.0 27.5 4.6
Note: f : denotes forecast for the Jan to March 2010 quarter
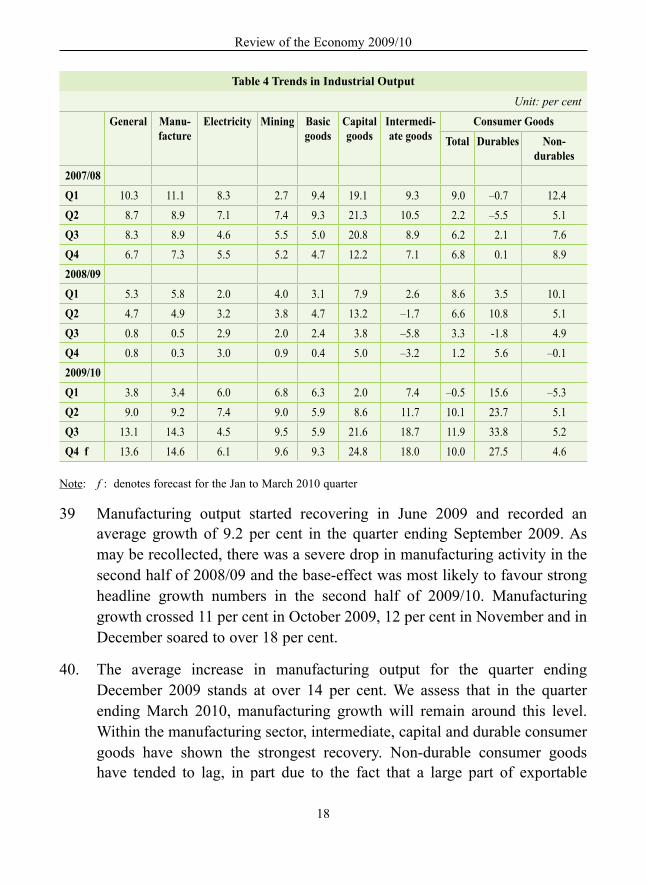
39 Manufacturing output started recovering in June 2009 and recorded an average growth of 9.2 per cent in the quarter ending September 2009. As may be recollected, there was a severe drop in manufacturing activity in the second half of 2008/09 and the base-effect was most likely to favour strong headline growth numbers in the second half of 2009/10. Manufacturing growth crossed 11 per cent in October 2009, 12 per cent in November and in December soared to over 18 per cent.
40. The average increase in manufacturing output for the quarter ending December 2009 stands at over 14 per cent. We assess that in the quarter ending March 2010, manufacturing growth will remain around this level. Within the manufacturing sector, intermediate, capital and durable consumer goods have shown the strongest recovery. Non-durable consumer goods have tended to lag, in part due to the fact that a large part of exportable
19
goods belong to this category – for example, textiles, where we know, export recovery has been sluggish. Non durable consumer goods have also lagged partly on account of the lower output of sugar.
41. At the 2-digit level, very strong recovery has been recorded in machinery and equipment, which has been growing by over 15 per cent in recent months and jumped to 44 per cent in December 2009. Likewise, transport equipment has shown remarkable growth touching 38 per cent in November and 82 per cent in December 2009. Basic chemicals, as well as petroleum refinery output, have both recorded significant improvements and are growing at well into double digits. Construction-related cement output has also showed sustained growth around double digits. Consumer goods such as cotton textiles, knitwear, leather products and food products have shown a lesser extent of recovery, however the trend has been somewhat erratic partly on account of the fact that a significant proportion is exported and recovery on the export front is not yet firmly established and partly due to lower production of sugar.
Sectoral – Agriculture, Industry and Services
20
V. ExTERNal SECTOR
42. Provisional estimates of the balance of payments are available for the first two quarters, i.e. the first half of 2009/10. The first half had a current account deficit of little under $19 billion, which was higher than the $16 billion recorded in the corresponding period of the previous year. The balance on the capital account in the first half of 2009/10 was slightly under $30 billion, significantly larger than $18 billion in the corresponding period of the previous year.
43. In the first half of 2009/10, exports continued to contract on a year-on-year basis. On balance of payment basis merchandise exports aggregated $81 billion in the first half of 2009/10, which was 27 per cent lower than that in the corresponding period of the previous year. Imports also contracted to $139 billion i.e. by 20 per cent. As a result, although the merchandise trade balance fell, the decline was by a smaller magnitude of less than 10 per cent.
44. There was a sharp decline in exports in both the first and the second quarters of 2009/10, though the fall in the second quarter was not as much as in the first. There was a massive decline in the value of exports of refined petroleum products in the first quarter (54 per cent) and a similar decline (33 per cent) in the second quarter. Export of gems and jewellery slipped by a small amount in the first quarter and then showed a surprisingly strong recovery in the second. Exports other than petro-products and gems and jewellery continued to suffer large declines of 35 per cent in the first quarter and 25 per cent in the second quarter of the year.
45. In the third quarter, there has been a small improvement in the value of overall exports. The largest gain has been in the value of petro-product exports (by 44 per cent). Gems and jewellery exports have remained more or less flat, while exports other than petro-products and gems and jewellery have improved significantly. Instead of declining, they have actually expanded by a small amount compared to last year’s levels. Early estimates for exports in January 2010 also show small year-on-year growth of 11 per cent. It is expected that in the last quarter items other than petro-products and gems and jewellery will show small gains, which combined with a substantial increase in the value of petro-products (a combination of price and quantity effects) would lead to a gain in total merchandise exports. Overall, on balance of payments

21
basis, merchandise exports are likely to be around $88 billion in the second half of 2009/10, which will be 12 per cent higher than in the corresponding period of the previous year.
46. Within merchandise exports, the most severely impacted appear to be engineering goods and cotton yarn, fabric and made-ups. Apparel exports have not shown much improvement, and in fact appear to have deteriorated in the third quarter after showing some signs of stabilization in the first half of 2009/10. Exports of man-made textiles have shown growth in the first and second quarters but deterioration in the third quarter.
Table 5 Balance of PaymentsUnit: US$ billion
2004/05 2005/06 2006/07 2007/08 2008/09 2009 / 10apr-Sep Oct-Mar Total
Merchandise Exports 85.2 105.2 128.9 166.2 189.0 81.1 87.5 168.7
Merchandise Imports 118.9 157.1 190.7 257.6 307.7 139.4 157.4 296.8Merchandise Trade Balance
–33.7 –51.9 –61.8 –91.5 –118.7 –58.2 –69.9 –128.1–4.7% –6.2% –6.5% –7.4% –9.7% –9.8%
Net Invisibles 31.2 42.0 52.2 75.7 89.9 39.6 59.0 98.6o/w Software & BPO
14.7 23.8 27.7 37.2 44.5 17.2 30.0 47.2
Private Remittances 20.5 24.5 29.8 41.7 44.6 26.7 30.0 55.7Investment Income –4.1 –4.1 –6.8 –4.4 –4.0 –2.1 –2.0 –4.1Current account Balance
–2.5 –9.9 –9.6 –15.74 –28.7 –18.6 –10.9 –29.5–0.3% –1.2% –1.0% –1.3% –2.4% –2.2%
Foreign Investment 13.0 15.5 14.8 45.0 3.5 32.1 15.2 47.3o/w FDI (net) 3.7 3.0 7.7 15.4 17.5 14.1 6.0 20.1Inbound FDI 6.0 8.9 22.7 34.2 35.0 21.0 15.0 36.0Outbound FDI 2.3 5.9 15.0 18.8 17.5 6.8 9.0 15.8Portfolio capital 9.3 12.5 7.1 29.6 –14.0 17.9 9.2 27.2Loans 10.9 7.9 24.5 41.9 4.1 0.7 6.5 7.2Banking capital 3.9 1.4 1.9 11.8 –3.2 1.2 3.8 4.9Other capital 0.7 1.2 4.2 9.5 4.5 –4.3 –6.5 –10.8Capital account Balance
28.0 25.5 45.2 108.0 8.7 29.6 19.0 48.53.9% 3.0% 4.8% 8.8% 0.7% 3.7%
Errors & Omissions 0.6 –0.5 1.0 1.2 1.1 –1.4 –1.4accretion to Reserves
26.2 15.1 36.6 92.2 –18.9 9.5 8.1 17.63.6% 1.8% 3.9% 7.5% –1.5% 1.3%
Note: Percentage figures refer to the value of the item as a ratio to GDP
External Sector
Review of the Economy 2009/10
22
47. Crude oil imports in both the first and the second quarters were lower by about 44 per cent. There was a slight increase in imports in Q3. The value of oil imports in Q4 is likely to show a significant increase largely reversing the 55 per cent decline in the corresponding quarter of the previous year. This will be, for the most part, due to the reversal in crude oil prices across these periods.
48. Import of gold and silver declined sharply in the second half of 2008/09. It has since recovered in 2009/10, particularly in the first and third quarters. In the final quarter, it is likely that the value of bullion imports will continue to show some increase. Imports of diamonds and other precious stones, which are linked to the export of gems and jewellery, have shown small contraction in each quarter, corresponding to the tepid expansion in the exports of gems and jewellery.
49. Imports of items other than crude oil, bullion and gems, have shown sharp declines in both the first and second quarters by 27 to 28 per cent. In the third quarter, the value of imports of items other than oil, bullion and precious stones showed a remarkable recovery, improving from a contraction of 28 per cent in the previous quarter, to a decline of only 3 per cent. In the last quarter of the fiscal year, these imports are expected to show significant improvement, which will be amplified by the fact that in the corresponding period of the previous year there had been an absolute decline.
50. Software/BPO exports registered a large contraction in the first half of 2009/10 of (–) 27 per cent. It is expected that there will be some recovery in the second half of the year and overall export earnings on software and BPO would aggregate $47 billion in 2009/10, 6 per cent more than in the previous year. This is broadly in line with the estimates made by NASSCOM.
51. Private remittances in H1 of 2009/10 have grown totalling $27 billion, compared to $25 billion in the first half of the previous year. Growth is expected in the second half as well, and in percentage terms may be quite large on account of the depressed level of remittances in the second half of 2008/09. Overall private remittances in 2009/10 are expected to be over $55 billion i.e. 25 per cent more than in 2008/09.
23
52. Overall net invisibles are expected to expand by little under 10 per cent to $99 billion compared to $90 billion in 2008/09.
53. The current account deficit for 2009/10 is estimated at little under $30 billion or 2.2 per cent of GDP which is an increase in absolute terms from $29 billion recorded last year but a small decline in terms of ratio to GDP (from 2.4 per cent in 2008/09).
54. On the capital account side, Foreign Direct Investment (FDI) on a net basis was virtually unchanged in the first half of 2009/10 at $14.1 billion which was almost identical to the figure of $14.0 billion in the corresponding period of the previous year. Both, gross inflows and outflows were also at the same level. In the second half of 2009/10, it is estimated that gross inflows will be about $15.0 billion which is slightly more than in the previous year but outflows are likely to be lower than last year. Thus, on a net basis, there would be an increase in FDI inflow. For the year as a whole, total net FDI inflow is assessed at $20.1 billion, slightly higher than the $17.5 billion recorded in the previous year.
55. Portfolio flows rose sharply in the first half of 2009/10 to $18.0 billion, primarily on account of strong FII inflows of $15.3 billion. In the third quarter, FII inflows were $5.3 billion and aggregate portfolio inflows are estimated to have been about $6.2 billion. The unsettled conditions in financial markets that have emerged since the third week of January make it difficult to assess to what extent portfolio flows would accrue on a net basis in the last quarter of the year. However, assuming some positive net FII and ADR/GDR inflows, overall portfolio flows in the second half of 2009/10 are placed at $9.2 billion.
56. External Commercial Borrowings (ECB) issuance has recovered since June 2009 and on a gross basis is likely to be about $20 billion in the full year. However, there are significant amounts of ECB repayments and their uses (repayment of FCCB and other debts as well as funding overseas asset acquisition) do not necessarily translate into remittances and hence net inflow has been quite subdued in the first half. Significant net inflows are not expected in the second half as well. Overall flows under the category of loan
External Sector
Review of the Economy 2009/10
24
capital stood at less than $1 billion in the first half and is estimated to rise to about $6.5 billion in the second half.
57. Overall, the capital account had a surplus of $29.6 billion in the first half and is expected to record a surplus of $19.0 billion in the second half. That is for the year as a whole, the capital balance will be in surplus to the extent of $48.5 billion. The overall balance of payment surplus was $9.5 billion in the first half and is expected to be $8.1 billion in the second half, resulting in an annual surplus of $17.6 billion, which would be recorded as an increase in foreign exchange reserves.
58. Our estimates of the balance of payment for 2009/10 vary to an extent from that made in October 2009. The difference mainly lies in a revised assessment of significantly lower export earnings, some reduction in imports and an increase in merchandise trade deficit of about $11 billion. This would be partially offset by stronger net invisible earnings which are now expected to be higher by more than $6 billion. Overall the current account deficit is expected to be larger by about $5 billion and also higher as a proportion of GDP. The capital account surplus is expected to be lower by about $9 billion. The net consequence is that the overall balance of payment surplus is now expected to be lower by $14 billion and to that extent the accretion to the foreign exchange reserves will also be lower.
25
VI. PRICES
59. The most prominent aspect of price movements in the current year has been the very high rates of inflation in food products – both primary and manufactured. The Wholesale Price Index (WPI) rate of inflation for primary foods crossed 20 per cent in November 2009 and even as at the end of the last week of January 2010 it was as high as 17.9 per cent. The inflation in manufactured food products has risen to 26.4 per cent in December 2009, compared to 8.9 per cent in March 2009.
60. As a result of the very high rates of inflation in food products, the consumer price index has also been reporting elevated rates of inflation. Inflation reported by the Consumer Price Index for Industrial Workers (CPI-IW) rose from 8.0 per cent in March 2009 to 11.6 in September 2009 and then to 15.0 per cent in December 2009.
61. Other than food products, prices of other primary and manufactured goods have generally not increased much. The overall headline rate of WPI inflation increased from 1.2 per cent in March 2009 to 1.5 per cent in October 2009 and then jumped to 7.3 per cent in December 2009. Much of this increase was on account of the sharp build-up in the prices of primary foods. Energy prices that had shown negative inflation for the better part of 2009, inched up to 4.3 per cent in December 2009. Manufactured goods, as a whole, saw inflation of 2.3 per cent in March 2009, which then fell to zero per cent in July 2009. Since then, manufacturing inflation has moved up, reaching 4.0 per cent in November and 5.2 per cent in December 2009.
62. The increase in the manufactured goods price index was mainly due to the rise in the prices of manufactured food products. If food products were to be excluded from manufactured products, the annual inflation of this residual, which includes manufactured intermediates and machinery items, would show negative inflation up to November and only a positive 0.5 per cent in December 2009. The biggest contributor to the rapid increase in the prices of manufactured food products was sugar (sugar, khandsari and gur). Were these sweeteners to be separated from manufactured food products, the residual would show that inflation increased from 4.1 per cent in March
Review of the Economy 2009/10
26
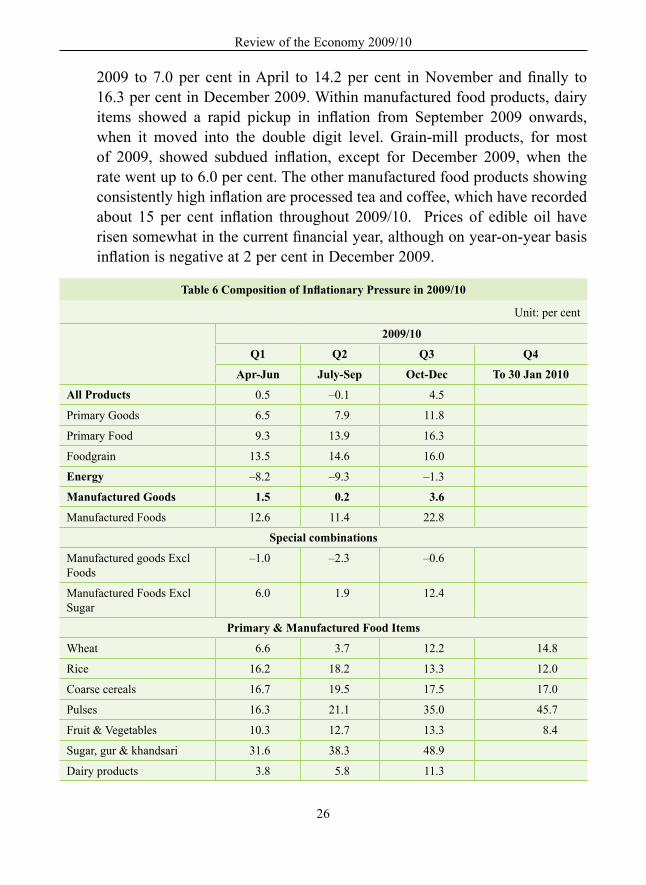
2009 to 7.0 per cent in April to 14.2 per cent in November and finally to 16.3 per cent in December 2009. Within manufactured food products, dairy items showed a rapid pickup in inflation from September 2009 onwards, when it moved into the double digit level. Grain-mill products, for most of 2009, showed subdued inflation, except for December 2009, when the rate went up to 6.0 per cent. The other manufactured food products showing consistently high inflation are processed tea and coffee, which have recorded about 15 per cent inflation throughout 2009/10. Prices of edible oil have risen somewhat in the current financial year, although on year-on-year basis inflation is negative at 2 per cent in December 2009.
Table 6 Composition of Inflationary Pressure in 2009/10
Unit: per cent
2009/10
Q1 Q2 Q3 Q4
apr-Jun July-Sep Oct-dec To 30 Jan 2010
all Products 0.5 –0.1 4.5
Primary Goods 6.5 7.9 11.8
Primary Food 9.3 13.9 16.3
Foodgrain 13.5 14.6 16.0
Energy –8.2 –9.3 –1.3
Manufactured Goods 1.5 0.2 3.6
Manufactured Foods 12.6 11.4 22.8
Special combinations
Manufactured goods Excl Foods
–1.0 –2.3 –0.6
Manufactured Foods Excl Sugar
6.0 1.9 12.4
Primary & Manufactured Food Items
Wheat 6.6 3.7 12.2 14.8
Rice 16.2 18.2 13.3 12.0
Coarse cereals 16.7 19.5 17.5 17.0
Pulses 16.3 21.1 35.0 45.7
Fruit & Vegetables 10.3 12.7 13.3 8.4
Sugar, gur & khandsari 31.6 38.3 48.9
Dairy products 3.8 5.8 11.3

27
63. Thus, the critical component of the inflationary process in the current fiscal (2009/10) derives from primary food and sugar. Within primary food, goods that have exhibited the highest rate of inflation, are foodgrains – pulses, wheat, rice, in that order, and sugar in the manufactured category.
64. Rice: The marketing year for rice runs October to September. In the marketing year 2008/09 the WPI for rice showed inflation of 20.9 per cent. Of this very large increase in prices, as much as 13.9 per cent occurred in the second half of 2008/09 (October–March) and the balance 6.2 per cent transpired in the first half of 2009/10 (April–September). In the four months (October–January) of the current marketing year 2009/10, WPI inflation in rice has been 3.3 per cent. Although the year-on-year inflation in rice at the end of January 2010 stood at 9.9 per cent, it does appear that the momentum of increase has declined over the last several months. In part, this is because rice production has perhaps not suffered as much as was feared in the summer of 2009.
65. The output of rice is expected to be lower by about 11 m.t in 2009/10 due to the nearly 12 m.t lower kharif production, though this may be partially offset by the rabi crop that is forecast to be larger than last year. It is expected that overall procurement of rice will be lower at around 27 m.t which will be 6 m.t less than the quantity procured in marketing year 2008/09. Procurement in Punjab and Haryana this year has been at the same level as last year, but procurement in other parts of the country is expected to be lower. Lower output and procurement makes for lower availability and even with the fairly large official stocks can result in conditions with a potential for fuelling inflationary expectations. This warrants some policy action. First, if procurement were to fall below 27 m.t, Government needs to consider imports to the extent of building up public stocks. Second, it needs to engage with the State governments to ensure that the 2.1 m.t of rice released till date under Open Market Sales Scheme (OMSS) and the special release made in January 2010 is picked up and distributed. Third, the current stock position of rice is not as comfortable as that of wheat. This makes it imperative to conserve as much of rice as possible till kharif 2010. This is an important precaution necessary to withstand
Prices

Review of the Economy 2009/10
28
any future shock to output. Towards this end, Government could also consider some demand management by offering more wheat under the Public Distribution System (PDS) in lieu of rice.
66. Wheat: Wheat prices remained subdued during the period when rice prices had been increasing during the second half of 2008/09 and continued to be so till the end of September 2009. However, from the week ending 17 October 2009 wheat prices began to rise quite sharply. As a result, since the end of March 2009, WPI for wheat shows inflation of 15.5 per cent which also happens to be the year-on-year inflation at the end of January 2010. This has transpired despite a good wheat harvest last year and substantial official stocks. In the current rabi season the wheat harvest is expected to be as good as last year’s and perhaps, as a result of this expectation and some success in open market intervention, the rate of increase in wheat prices has declined in the five weeks leading up to 30 January 2010.
67. The price of wheat is expected to remain soft in the weeks to come. This is on account of the fact that pick-up of wheat by bulk consumers, under the OMSS (at a reduced floor price) has been good. Second, the off-take of wheat by the State governments under the OMSS is also expected to improve. Third, Government has announced a decision to release about 2.5 m.t. of wheat at MSP based prices to the States in February and March 2010. Finally, there are indications that the standing rabi harvest is quite good and may result in output of over 80 m.t.. All these factors are expected to improve the market availability of wheat and help in reversing inflationary expectations, thereby cooling prices.
68. Pulses: The year-on-year inflation in pulses is 41.2 per cent, while the year-to-date inflation from the beginning of financial year 2009/10 up to the end of January 2010 is 38.7 per cent. In the five-year period since 2005/06, this is the second bout of steep inflation in pulses. The prices of pulses rose very sharply in 2005/06 averaging 33 per cent for the year. In the next year, it continued to rise but by a much more modest 13 per cent, before escalating in the current financial year. Although prices of all pulses have shown an increase in recent years, there has been variability in the extent of price increase. The larger increase on a cumulative basis has been in moong, urad, arhar (tur) and masoor, in that order, with the increase in the price of

29
gram being much more limited. In 2009/10, on year-on-year basis, the price of arhar (tur) and moong is 66–67 per cent higher while that of urad is 52 per cent higher.
Table 7 Price Change in PulsesUnit: per cent
Pulses Gram Arhar (Tur)*
Moong Masur Urad
Change in the Price Index for the Fiscal Year
2004/05 –2.6 –1.1 –7.1 0.9 –3.5 –2.9
2005/06 33.2 24.9 9.4 45.7 6.7 69.1
2006/07 13.4 20.2 8.4 14.5 14.0 8.4
2007/08 –1.9 5.8 15.2 –16.5 30.1 –18.1
2008/09 9.4 -6.7 17.1 19.9 15.7 14.7
2009/10 y.o.y. 41.2 3.9 67.5 65.6 19.3 52.3
2009/10 y.t.d. 33.2 3.1 41.4 60.2 25.5 39.3
Cumulative change in the price index beginning from 1 Jan 2005
30-Jan-10 115.2 53.4 121.7 161.1 116.4 150.8
Note: * Tur is a cultivar of pigeon pea (botanical: Cajanus cajan) grown in central and southern India, while Arhar is another cultivar planted mostly in the northern and eastern regions of the country.
69. There is limited substitutability in the case of different kinds of pulses. However, the problem seems to be most acute in the case of tur which is widely consumed in the southern states. Further, many of these pulses, including tur, are not grown to a significant extent outside India and, therefore procuring them by imports is not a ready option at present. In order to increase domestic availability, Government has reduced the import duty on pulses to zero and placed a ban on exports. Government agencies like STC, PEC, MMTC and the apex cooperative NAFED are being encouraged to import pulses and have been given 15 per cent subsidy to recoup any losses they might incur on such operations. In the case of pulses, the clear solution in the medium-term lies in the improvement in productivity from the present low level that characterizes the pulses economy in India. In addition, steps may be taken to popularize the consumption of yellow peas which is available in the international market and is in a position to substitute for some of our pulses that are in scarce supply.
Prices

Review of the Economy 2009/10
30
70. Sugar: On year-on-year basis the price index for sugar, khandsari and gur is up by 51.4 per cent in December 2009. The prices of sugar and related materials started increasing from August 2008, moving into double digit level by November. In March 2009, sugar prices were higher by 22.9 per cent. However, given the negative inflation that had characterized sugar in both 2006/07 and 2007/08, the March 2009-end number, although reporting high inflation, was only 1.8 per cent higher than it had been three years ago in March 2006. In the current year, however, sugar prices continue to increase quite dramatically and have risen by 35 per cent over March 2009.
71. As noted earlier, there has been a severe shortfall in domestic sugarcane output in 2008/09, which continued unabated in 2009/10. The sugar year runs from October to September. The current sugar year (2009/10) began with a record low opening stock of less than 2 m.t. There has been some import of raw sugar, in both the previous sugar year, as well as in the current year. However, processing raw sugar is only possible as long as the crushing of cane is taking place, and this will end for most states by March/April 2010. The expected output of sugar, including processed raw sugar, on the basis of output data available till the end of December 2009, and data for select states available till January 2010, is unlikely to be much more than 14 m.t. That means that the total availability of domestic white sugar, including the opening stock, would be less than 16 m.t. This is much lower than the estimated domestic consumption of around 22 m.t and also less than the total releases made of white sugar in the previous three years at 18, 19 and 21 m.t respectively.
72. On the basis of these assessments of production and the opening stock, it does not appear that it will be possible to maintain releases at the same level as in the previous three years especially in the closing months of sugar year 2009/10 i.e. June/July 2010 onwards. One should note that this overlaps the festival seasons, which begins in September/October. Even if there is some reduction in demand on account of high prices, the clear implication is that the stock position will rapidly approach the nil level even before the festival season begins. Fresh production of cane sugar will only become available from the end of November 2010 onwards.
31
73. Under these conditions, it is imperative that urgent steps are taken to import white sugar to the extent of the shortfall in availability, which may be assessed at somewhere in the region of 3 to 5 m.t. Given the high international prices that are principally a result of the aggravated state of short supply in India, which is the largest consumer of sugar, there is understandable hesitation to make such imports due to fear that when the material reaches Indian shores the price may be lower than the landed cost. It is, therefore, important that Government takes the initiative to start the process. Over the medium term, we need to have an appropriate policy framework to ensure that we can successfully tackle the problem of periodic scarcity of sugar and consequential high prices in the domestic market.
74. Outlook: The Reserve Bank of India (RBI) in its January 29, 2010 statement has revised the expectation for overall WPI at the end of March 2010 to 8.5 per cent. Almost all of this will be on account of higher prices for food items (primary and manufactured). The danger of this spreading to other commodities certainly exists, especially in the backdrop of the strong recovery that the Indian economy has been making since the summer of 2009. Policy must remain alive to the danger that a significant transfer of food price inflation to the general price level might occur in 2010/11, which in output terms is expected to have growth of more than 8 per cent.
75. International conditions, with the exception of crude oil, metals and a few other commodities, are not showing elevated prices. However, high volatility in financial markets and weakness in major currencies have encouraged investors to hedge their bets by investing in commodities. India and China, as well as several other developing countries are showing strong signs of growth and their elevated domestic demand in combination with unsettled financial conditions has the potential of causing commodity prices to rise further. This is another element that policy makers need to factor in when looking at growth conditions in the coming fiscal year.
Prices
32
VII. MONETaRY aNd FINaNCIal
76. In response to the global financial crisis, which erupted world-wide since September 2008, central banks rapidly expanded accommodation and reduced policy rates. RBI infused liquidity into the market, slashing the Cash Reserve Ratio (CRR) as well as policy rates, namely the repo and the reverse repo. A situation of excess liquidity was created and sustained with about Rs. 100,000 crore on an average basis coming in daily from banks through the reverse repo window. The overnight money market rate settled at a level lower than the reverse repo rate.
77. Credit growth remained sluggish through the second half of 2008/09, as well as 2009/10. This is not entirely unexpected. While banks may have been more cautious about making advances, borrowers too were seeking to reduce financial risk, i.e. to contain their leverage. Over the last one-and-a-half years it is believed that some companies have actually paid off short-term (one to two years) loans that they had taken as bridge finance in the months that followed the virtual closure of the IPO/FPO market after February 2008 as well as increasing difficulties faced in tying-up external loans in the first half of 2008. On a net basis in 2009/10, credit growth up to the end of January 2010 has been less than 9 per cent on a year-to-date basis. This is one percentage point lower than that registered over the corresponding period in the previous financial year.
78. The economy has rapidly rebounded from the global crisis and is now operating under vastly improved circumstances that can be considered to be “normal”. This necessitates that monetary policy revert to a more “neutral” stance from the excessively accommodative position it had adopted in response to the acute crisis in the second half of 2008/09. RBI has taken the first major step when, on 29 January 2010, it announced an increase in the CRR of 75 basis points (bps). Further action will depend upon the pick up in credit, liquidity conditions and further pressure on prices. During 2009/10 as a whole, fresh bank source of funds for the commercial sector aggregated little over Rs. 276,000 crore which was slightly less than that of last year.

33
However, credit expansion in the second half of the year (October–January) was much stronger in 2009/10 at Rs. 165,500 crore compared to Rs. 83,700 crore in the corresponding period of the previous year. Mobilization from the capital market by way of debt and equity during the current year,i.e. up to the end of January 2010, is over Rs. 239,000 crore, almost 50 per cent higher than in the corresponding period of the previous year. Issuance, in both the second half, as well as in the first four months of the current year has been quite strong.
Table 8 Fund Raising from Banking System and Capital Market
Rs in Crore 2007/08 2008/09 apr–Sep
2008/09
apr–Sep
2009/10
Oct–Jan
2008/09
Oct–Jan
2009/10
apr–Jan
2008/09
apr–Jan
2009/10
1 Bank Sources of Funds
1.1 Increase in Credit to Commercial Sector
446,299 431,393 202,948 110,901 83,740 165,551 286,688 276,452
1.2 Increase in bank holding of Govt securities *
187,861 195,333 8,871 208,505 189,024 33,925 197,895 242,430
2 Capital Market – all Sources
241,156 224,072 68,432 146,908 95,787 92,243 164,219 239,151
2.1 Debt (bonds) $ 128,602 209,164 55,947 102,968 94,026 71,874 149,974 174,842
2.2 Capital Market Equity Raising (a+b+c)
112,554 14,908 12,484 43,940 1,760 20,369 14,245 64,309
a IPO and FPO (public) 54,511 2,082 2,032 15,081 26 6,952 2,059 22,033
b QIP ** 25,525 189 75 26,181 114 12,963 189 39,144
c Rights 32,518 12,637 10,377 2,679 1,620 453 11,997 3,132
Note: $ Primarily private placement and Includes one public bond issue in 2008/09 * This includes reverse repo deposits because in this transaction banks are buying overnight securities from RBI ** Qualified Institutional ProgrammeSource: Reserve Bank of India and SEBI
79. The overall financing flow from the banking system and the capital market has been significantly larger in the current than in the previous year, notwithstanding the relative sluggishness of credit off-take from the banking system.
Monetary and Financial
Review of the Economy 2009/10
34
80. Conditions seem conducive to support a significant acceleration in the pace of asset creation in 2010/11. Funding, as we have seen, has already been substantially higher in the current year. Companies who have lined up internal sources of funds and/or equity issuances are likely to increase their credit lines once capital expenditure commences in the next fiscal, for which they seem to be prepared at this point. Thus, unless there are unexpected unfavourable set-backs, the investment climate should see a rapid recovery in credit growth accompanied by substantial issuances in the domestic capital market, as well as in the overseas equity and debt market.

35
VIII. NEEd FOR FISCal CORRECTION
81. Government finances have come under a severe strain since 2008/09 and fiscal imbalance in the country is now a matter of concern. The consolidated fiscal deficit including off-budget liabilities in 2008/09 was estimated at 10.4 per cent and is likely to be 10.3 per cent in the current fiscal. The consolidated debt-GDP ratio is estimated at 76.6 per cent in 2009/10 compared to 61.0 per cent in 1995/96 and 70.6 per cent in 2000/01. The ratio of interest payments to own revenue receipts accounted for 25.7 per cent at the Centre and 28.9 per cent in the States.
82. Government cannot continue with the kind of large revenue and fiscal deficits recorded in the last two years and will have to initiate fiscal consolidation in the coming fiscal year (2010/11) itself. Although the large deficits this year and the last year did have a counter-cyclical impact, it is necessary to initiate measures towards fiscal consolidation in the forthcoming budget to ensure fiscal sustainability, enable greater flexibility in monetary policy calibration, contain interest payments and to avoid upward pressure on interest rates. The recommendations of the Thirteenth Finance Commission will spell out the magnitude of correction required, the strategy and roadmap to achieve the correction and the role of Centre and States in this task over the course of the next five years.
83. In the meantime it is desirable for the Central government to work on the adjustment strategy in the forthcoming budget. Besides, with the ratio of revenue deficit to GDP at the Central level estimated at 4.4 per cent in 2008/09 and 4.8 per cent in 2009/10, the large government dissaving will have to be reversed in order to increase the overall levels of saving and investment in the economy.
84. In pursuing the exit strategy, two important facts must be noted. First, more of fiscal expansion has come from increase in expenditures than from tax cuts. At the Central level, as a ratio of GDP, the combined impact of the reduction in revenues due to economic slowdown and tax cuts between
Review of the Economy 2009/10
36
2007/08 and 2009/10 is estimated to have been 1.7 per cent. The reduction in the revenues due to cuts in excise duty and service tax is likely to have been around 0.5 per cent of GDP. In contrast, Central expenditures as a ratio of GDP increased by more than 2.2 percentage points. This implies that correctives must also focus on adjusting expenditures.
85. Second expenditure stimulus was directed at augmenting consumption and not investment. While revenue expenditure increased by 2.6 percentage points since 2007/08, capital expenditure actually declined by 0.4 percentage points. In fact, even when the government undertook an expansionary fiscal stance, the Centre’s capital expenditure as a ratio of GDP actually fell to 1.8 per cent in 2008/09 from 2.5 per cent in 2007/08. Even in 2009/10, it is budgeted to increase only to 2.1 per cent which is lower than the capital expenditure to GDP ratio in 2007/08.
86. Thus, while it is important to reduce the fiscal deficit significantly in the coming budget, it is important to safeguard capital expenditures, particularly in the infrastructure sectors. The analysis of plan outlay in many infrastructure sectors like coal, aviation, petroleum, power, roads and railways, shows that budgetary contribution in the outlay in 2009/10 is about 19 per cent and the remaining is expected to be mobilised from internal and extra-budgetary sources of public enterprises. Infrastructure spending is critical and even if the private sector investment in infrastructure is sought, Government will have to provide adequate viability gap funding. Thus, there is no scope for compressing capital expenditures while undertaking fiscal correction.
87. There are some items of expenditure which are committed and therefore, cannot be reduced. Interest payment and payment of salaries are two such items. However, there will be some relief on expenditures as the arrears of pay increases has already been paid out. Similarly, a substantial proportion of expenditure on the farm loan waiver has been paid out. Pay arrears in 2008/09 amounted to Rs. 16,883 crore and with arrears of various autonomous bodies and educational institutions included, the total was about Rs. 20,000 crore. Similarly, it is estimated that loan waiver amounting to more than Rs. 55,000 crore has been paid in 2008/09 and 2009/10 and the carry-over on this account to 2010/11 may not be large. The relief on expenditure on these two accounts could be close to 0.5
37
per cent of GDP. Similarly, if spending on various central schemes and subsidies is kept constant in absolute terms, there can be a decline of 0.5 percentage points of GDP. This should be feasible. Overall, it should be possible to reduce the expenditure-GDP ratio by about 1 percentage points without too much difficulty.
88. On the revenue side, it is clear that considerable preparatory work is needed before the GST reform is implemented and the April 2010 deadline will not be realistic. Nevertheless, the Central government can expand the base of the service tax by converting the selective taxation of services into a general taxation, unify the threshold and rate structure of CENVAT and service tax to introduce GST at the Central level. The unification may be done at a level in between the current rate and the previously existing general rate for excise duty. If service tax is expanded to cover previously exempted items like railway fares and freights this could add to the revenue by about 0.5 per cent of GDP. With inflows from disinvestment and spectrum auctions, it is possible to generate additional revenue of 0.8 per cent. Thus, it is realistic to budget for a reduction in the fiscal deficit of the Centre by 1.0 to 1.5 per cent in 2010/11 without any adverse impact on economic growth.
89. The expansion of the base of service tax will also help in assessing the base of State Goods and Services Tax (SGST) and help to finalise the revenue neutral rate of SGST as well as the mechanism for compensating states for the loss of revenue. This will also provide a measure of comfort to the States in making a smooth transition to the GST regime.
90. An important initiative in regard to the introduction of GST is that the Central government should immediately put in place a centralized agency to track inter-state transactions and function as a clearing house. This will also help in the computerized information system for CGST. This will ensure better tax compliance, prevent misuse of tax credit mechanism for input taxes and will enable a smoother mechanism for relieving the tax on exports.
Need for Fiscal Correction

38
Ix. CONCludING COMMENTS
Management of Prices
91. Price movements during fiscal 2009/10, as reflected in both the WPI and the CPI, have been characterized by very high rates of inflation in primary food articles and manufactured food products. The WPI rate of inflation for primary food articles crossed 20 per cent in November 2009 and even at the end of January 2010 was close to 18 per cent. Other than food products, the prices of other primary and manufactured goods have generally not increased by much.
92. Within the primary food articles basket, the goods that have exhibited the highest rate of inflation are foodgrains – pulses, wheat and rice, in decreasing order of magnitude. Within the manufactured food products segment, sugar products (sugar, khandsari and gur) have increased the most with annual inflation of over 51 per cent.
93. The inflation in rice prices, though caused primarily by inflationary expectations on account of the failure of the South West monsoon and flood losses in Andhra Pradesh and Karnataka, also appears to have affected wheat prices. Surprisingly, this was caused despite the record harvest of both wheat and rice in the preceding season and the availability of more than adequate public stocks.
94. This leads us to re-affirm the need for timely release of foodgrains from public stocks in sufficient quantities and at prices slightly below prevailing market prices, in order to cool inflationary expectations. Also, when there are early signals of a shortfall in production, advance planning for timely imports must form an integral part of policy.
95. Another factor, which considerably blunted the impact of foodgrain releases by the government, was the overload on the PDS. There is a clear imperative to develop a distribution channel by the State governments, to supplement the PDS, so as to enable faster distribution of the additional releases made by the central government.
39
Principal Constraints to Growth
96. The Council is of the view that the two principal constraints to growth that face India in the medium to long term are the low productivity in agriculture on the one hand and inadequate physical infrastructure on the other, of which, the most important component is the power sector.
agriculture – Research and development Policy97. Technology and organizational factors have emerged as a major constraint
to sustainable growth in agriculture. Though the private sector has made a significant contribution in evolving hybrid varieties of seeds for commercial crops the main responsibility for basic research especially that which benefits the poor and marginal farmer, continues to be that of the state. Since the Green Revolution years no major breakthrough has been witnessed in agricultural research mainly due to inadequate resource allocation, lacunae in content and organization of research, inefficiencies in extension activities and inadequate risk mitigation strategies for the farmer.
98. India currently spends about 0.7 percent of agricultural GDP on public agricultural research which is significantly lower than the allocation in countries like China. This must be raised to at least 1 per cent as recommended by the Steering Committee on Agriculture in the Eleventh Plan.
99. The other important intervention in the arena of publicly-funded agricultural research is in improving its content and making it contextual and relevant to the Indian farmer. There are a number of steps which can be taken in this regard. First, research has to be more focused in terms of the crops as well as the regions. For example, in the rain-fed areas, the focus should be on productivity raising technology in pulses and oilseeds while in the well-watered eastern region the focus should be on cereals.
100. Second, soil-health cards should be provided to all cultivators on priority basis to help arrest the trend of declining response to inputs like fertilizers and irrigation. The feasibility of accomplishing this task within a short time has been demonstrated in a few states, notably in Gujarat. Third, research targeted at resource conserving and environment friendly technologies and extensive propagation of existing technologies is a must. Fourth, the quality of seeds used especially cereals must be improved. In addition to extensive
Concluding Comments

Review of the Economy 2009/10
40
research in high yielding varieties it is necessary to revive the defunct seed corporations in the States, give incentives to the private sector to produce quality seeds for cereals and, strengthen seed quality certifying arrangements. Fifth, research in currently ignored areas like coarse cereals, pulses and sub-sectors of agriculture like horticulture, floriculture, sericulture, animal husbandry, forestry and fisheries must be encouraged. Sixth, while drawing up the research agenda, particular attention should be paid to domestic and international demand.
101. The research effort in agriculture is also stymied by some other factors. First, the lack of co-ordination between the extensive network of institutions which serve agriculture for research and extension. Their contribution to raise productivity on the small and marginal farms is particularly disappointing. Reviving an agency such as Small and Marginal Farmers Development Agency, to ensure that this section of cultivators receives benefits of research and technology, can be considered. Second, establishing accountability for results by establishing clear goals and assessing performance based on parameters like development of high yielding varieties, innovations in increasing efficiency of inputs and productivity increase in specific crops will go far. Third, in extension of research findings to farm level, there is a large scope for public-private partnership (PPP), as the public extension system has virtually collapsed. The private sector is especially strong in IT-enabled extension services. In several regions they have penetrated to the farm level with different models of contract farming.
102. Fourth, after the success of Bt-cotton and the benefits it has brought to the farmers in Gujarat and Maharashtra, it is imperative that the government must have a clear policy on Genetically Modified (GM) crops. The regulatory framework should clearly assess performance in the field and the impact on environmental and food safety issues and bring the results into the public domain at the shortest possible time.
103. Fifth, there is a need for risk mitigation strategies for the Indian farmer who is primarily exposed to four risks, namely credit and finance, price, acts of god and technology. Extending more credit through the banking sector, introduction of electronic spot markets, establishing the regulatory body for ware-housing and extensively using the insurance tool, based on new
41
Weather Based Crop Derivative Insurance Schemes which get triggered on account of inadequate or excess rainfall, high or low temperatures, and traditional insurance products against floods, earthquake etc separately are some steps which would protect the farmer against the uncertainties.
Power Sector
104. The need to accelerate power generating capacity and improve distribution network is of utmost importance. The shortage of peak power as well as of aggregate energy is officially estimated to be 10–15 per cent, but measured on a more comprehensive basis the shortage is higher. Indian industry and other sectors of the economy have responded to the severe power deficit by installing captive generation. The cost of grid power is itself fairly high compared to other countries, at about Rs. 5 (10 US cents) per unit. The fuel cost of generating power varies between Rs. 7–9 per unit i.e. between 15–20 US cents. The average cost of power for most industrial units thus works out to around Rs. 6–7 or 12–15 US cents. This is a handicap to the competitiveness of Indian industry and in general contributes to making our economy more higher cost than necessary. These large shortages also lead to production losses. The combined impact is quite adverse to sustained economic expansion.
105. The Tenth Plan (2002–2007) target for creating power generating capacity was 40 GW (Giga Watts), while the actual achievement was 21 GW. The Eleventh Plan (2007–2012) nearly doubled this target to 78.7 GW. While there have been slippages in the creation of capacity in the first three years of the Eleventh Plan, it is believed that, with some certainty, capacity creation by the end of the Eleventh Plan would be more than 62 GW, i.e. 79 per cent achievement. On “best effort” basis the actual capacity installed may exceed 70 GW.
106. It is important to note that notwithstanding the slippages, this extent of capacity creation is a major improvement over the previous five-year period. It is also notable that about one-third of the total capacity likely to be created in the Eleventh Plan period would be from the private corporate sector.
107. However, power shortages will remain. This flows from two different factors. The first is the historical deficit conditions that needs to be bridged and
Concluding Comments

Review of the Economy 2009/10
42
the excessively high plant load factors that the system has in consequence to operate under. This does not help in its ability to deal with changes in demand level through the day and also makes it more vulnerable to outages than otherwise.. The second factor derives from the trajectory of higher level of growth that the Indian economy is set upon. At this stage of economic growth, manufacturing activity has to show a significant upward spike and to that extent power generation must be able to keep up with it.
108. There are two kinds of constraints that have been identified as the source of delays in capacity augmentation. The first relates to the limitations in the availability of power plant equipment within the country. The second relates to difficulties in acquiring land, obtaining necessary clearances from the Ministry of Environment and Forests and the allocation of coal linkages/coal blocks. There is clear improvement in the situation in respect of the first category of constraints. BHEL has significantly raised its tooling capacity to 10 GW per year and this is likely to go up by another 40 per cent shortly. It is believed that a further increase to 20 GW may come about in a couple of years. A number of private companies have embarked on manufacturing of power plant equipments. Notable amongst them is the joint venture between Larsen and Toubro and Mitsubishi Industries, Bharat Forge and Alstom and JSW Energy with Toshiba. These developments suggest that the constraint on account of the limited availability of equipment is set to be drastically relaxed. However, the administrative issues relating to acquisition of land, environmental clearances and coal linkage/allocation remains and this has to be tackled on an urgent basis by Government.
109. It is now one-and-a-half years since India was able to regain access to global nuclear energy technology, as well as to nuclear fuel. There is an urgent need to make the necessary regulatory changes quickly, so that investment including that from established private companies interested in this business, can begin to flow. Nuclear power generation has a longer gestation period and the earlier these projects take-off the better. It is to be noted that we are a net importer of fossil fuels. Indeed the extent of coal import has been rising. These fossil fuels have seen a large increase in their prices over the past several years and this process is likely to continue. It is, therefore, important that we are able to scale-up the nuclear power industry so that its contribution to generation can rise from the current meagre level of 2 per

43
cent to something that is several times more by the end of this decade. In the October 2009 Outlook, we had suggested that Government consider an ambitious programme for initiating capacity creation in the nuclear power sector of around 150 GW over the next 15 years. Unless we are able to begin the process by enabling not only the public sector, but also the private sector to enter the business, we will fall drastically short of what is necessary to ensure energy security adequate to support sustained high economic growth.
110. Finally, on the power distribution side, despite some improvements, large “unaccounted for” losses continue. It is very important that we place a high priority on making the necessary investments and systemic changes so that the extent of this “unaccounted ” power loss is sharply reduced. This, aside from more rational pricing, is a pre-condition to making the power business financially viable and therefore capable of sustaining much needed continued high levels of investment on the generation side.
Concluding Comments