Embed Size (px)
Citation preview
Review of the Cities-IGWA-SWC Settlement Agreement and an Update on ESPA Water Administration and Aquifer ConditionsNatural Resources Interim Committee
October 12, 2018
1. ESPA Aquifer History
2. Review of Delivery Calls
3. IGWA/SWC Settlement Update
4. Recent ESPA Aquifer Trends
5. Consideration of Cities
Presentation Overview
Crystal Springs, 2018
6. Cities/IGWA/SWC Settlement Review
7. Cities/IGWA/SWC Settlement Legislative Support
8. ESPA Water Admin Update
The ESPA Aquifer in Review
4,000
4,300
4,600
4,900
5,200
5,500
5,800
6,100
6,400
6,700
7,000
0.00
2.00
4.00
6.00
8.00
10.00
12.00
14.00
16.00
18.00
20.00
1912
1918
1924
1930
1936
1942
1948
1954
1960
1966
1972
1978
1984
1990
1996
2002
2008
2014
2020
Disc
harg
e (c
fs)
Cum
ulat
ive
Stor
age
Chan
ge (m
illio
n ac
re-fe
et)
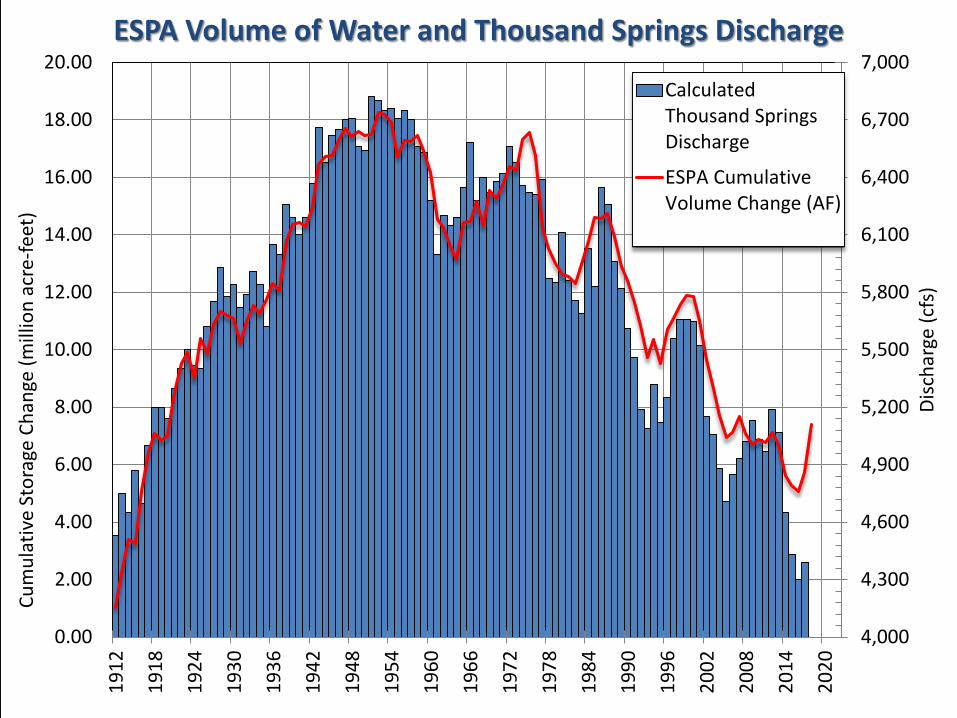
ESPA Volume of Water and Thousand Springs Discharge
CalculatedThousand SpringsDischarge
ESPA CumulativeVolume Change (AF)
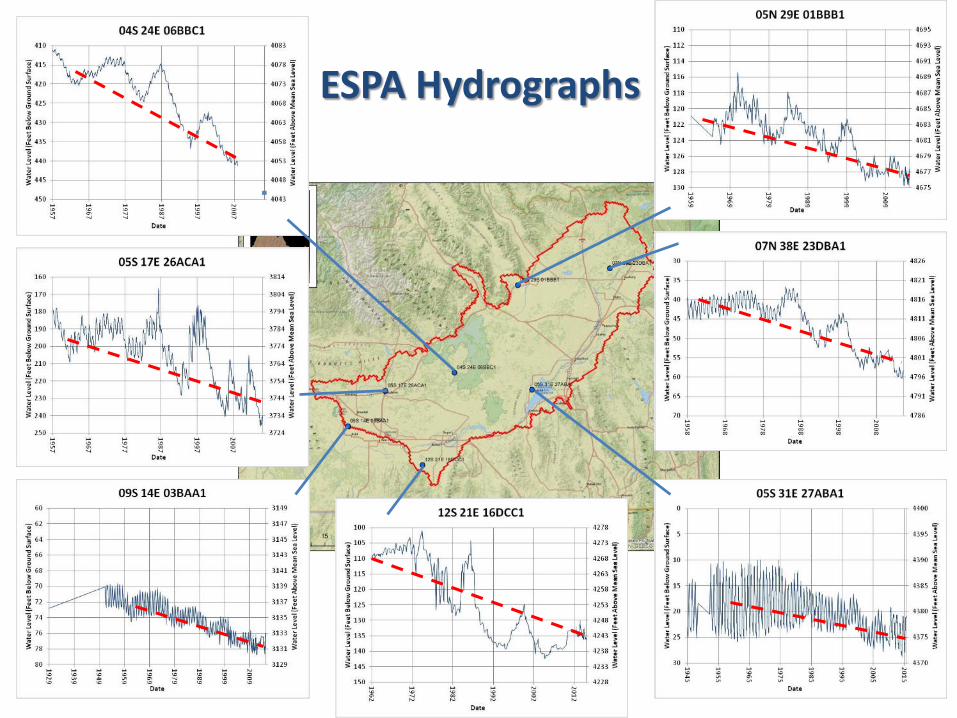
ESPA Hydrographs
200
300
400
500
1951 1955 1960 1965 1970 1975 1980 1985 1990 1995 2000 2005 2010 2015
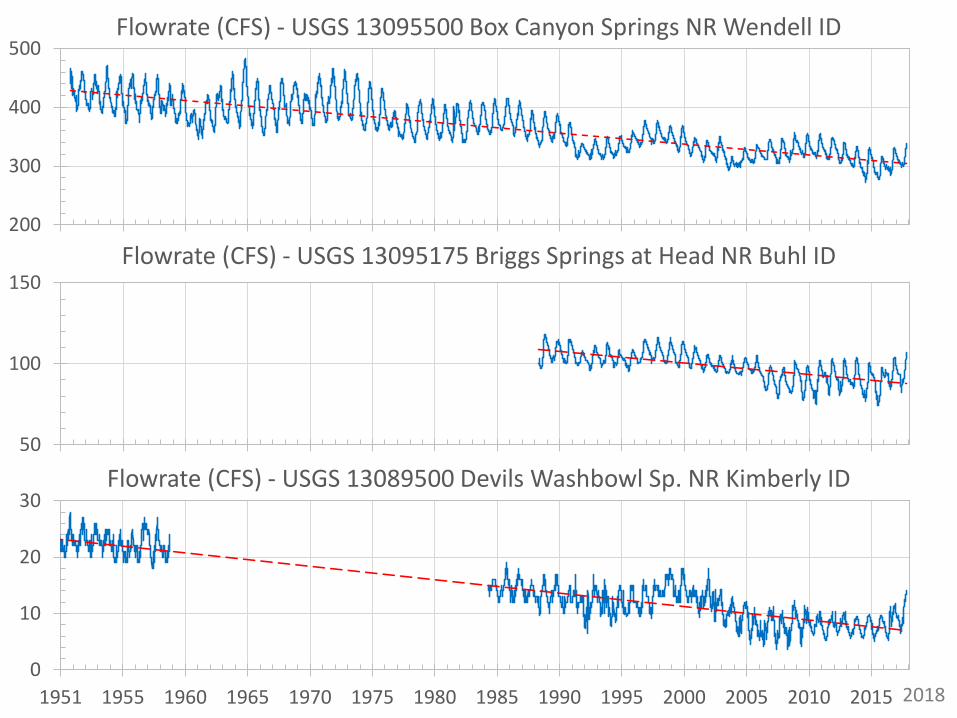
Flowrate (CFS) - USGS 13095500 Box Canyon Springs NR Wendell ID
50
100
150
1951 1955 1960 1965 1970 1975 1980 1985 1990 1995 2000 2005 2010 2015
Flowrate (CFS) - USGS 13095175 Briggs Springs at Head NR Buhl ID
0
10
20
30
1951 1955 1960 1965 1970 1975 1980 1985 1990 1995 2000 2005 2010 2015
Flowrate (CFS) - USGS 13089500 Devils Washbowl Sp. NR Kimberly ID
2018
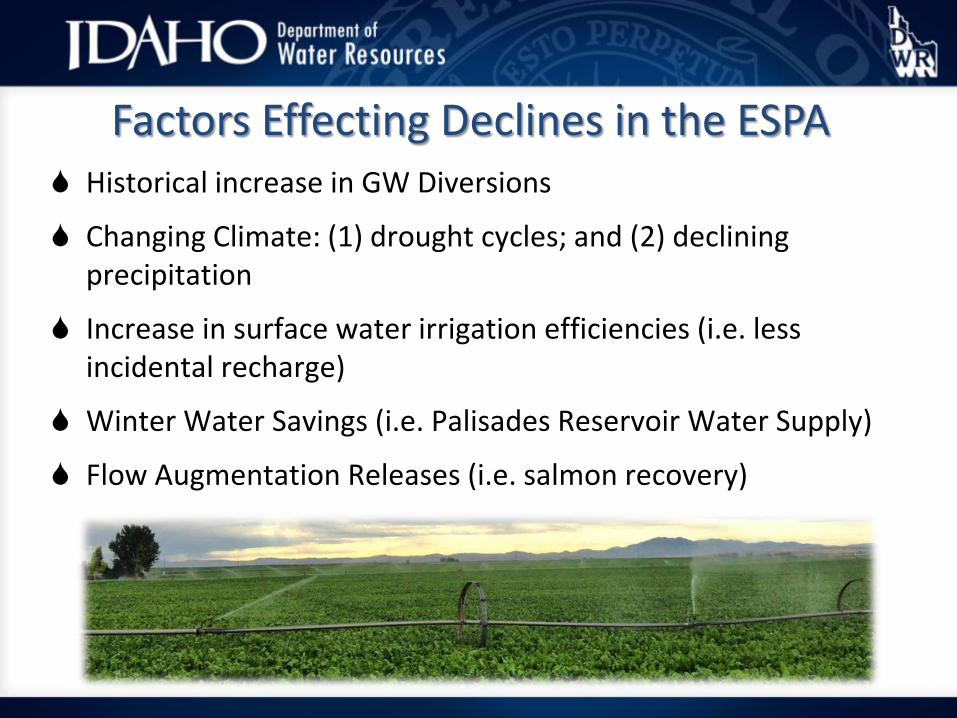
Historical increase in GW Diversions
Changing Climate: (1) drought cycles; and (2) declining precipitation
Increase in surface water irrigation efficiencies (i.e. less incidental recharge)
Winter Water Savings (i.e. Palisades Reservoir Water Supply)
Flow Augmentation Releases (i.e. salmon recovery)
Factors Effecting Declines in the ESPA
8
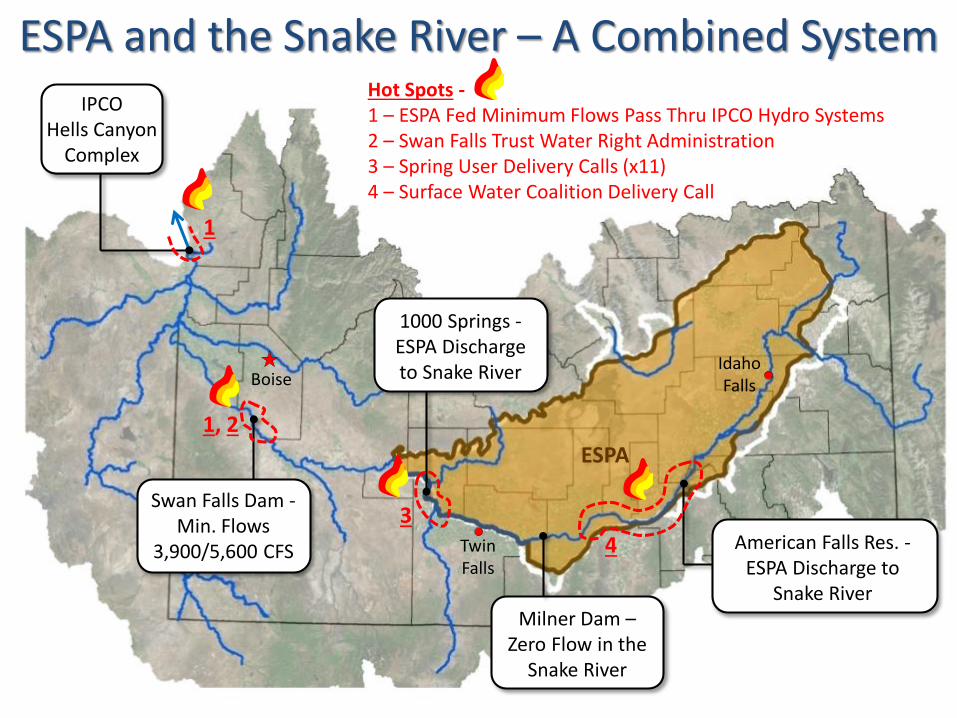
Swan Falls Dam -Min. Flows
3,900/5,600 CFS
IPCOHells Canyon
Complex
ESPA and the Snake River – A Combined System
Milner Dam –Zero Flow in the
Snake River
1000 Springs -ESPA Discharge to Snake River
American Falls Res. -ESPA Discharge to
Snake River
Boise
TwinFalls
IdahoFalls
ESPA
43
1, 2
Hot Spots -1 – ESPA Fed Minimum Flows Pass Thru IPCO Hydro Systems2 – Swan Falls Trust Water Right Administration 3 – Spring User Delivery Calls (x11)4 – Surface Water Coalition Delivery Call
1
1.00
1.20
1.40
1.60
1.80
2.00
2.20
2.40
1920 1930 1940 1950 1960 1970 1980 1990 2000 2010 2020
Annu
al R
each
Gai
n (m
illio
n ac
re-fe
et)
Water Year
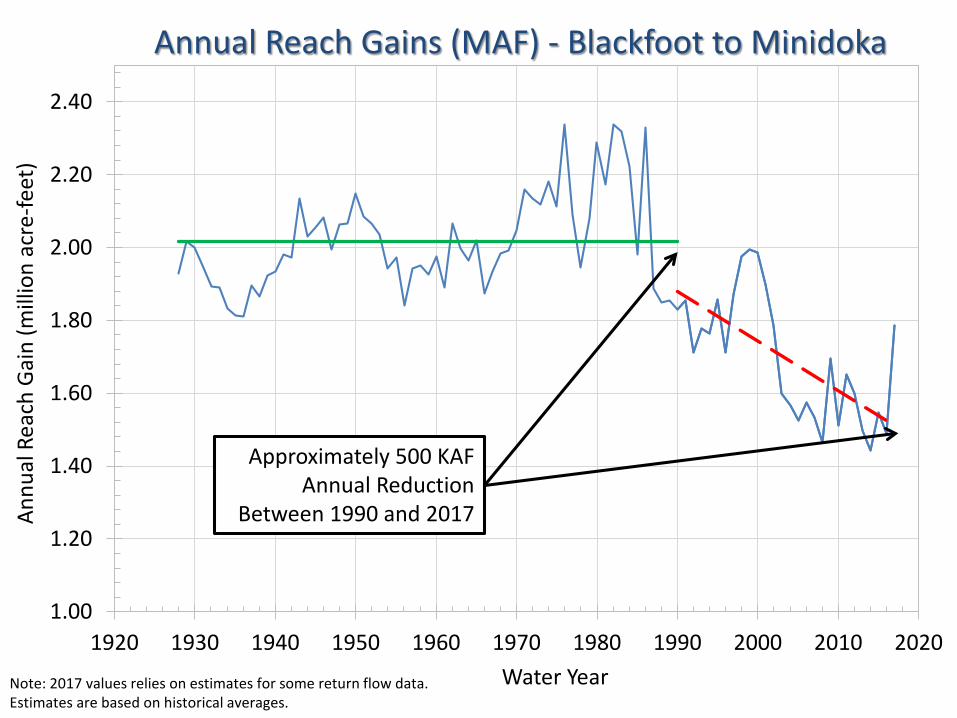
Annual Reach Gains (MAF) - Blackfoot to Minidoka
Note: 2017 values relies on estimates for some return flow data. Estimates are based on historical averages.
Approximately 500 KAF Annual Reduction
Between 1990 and 2017
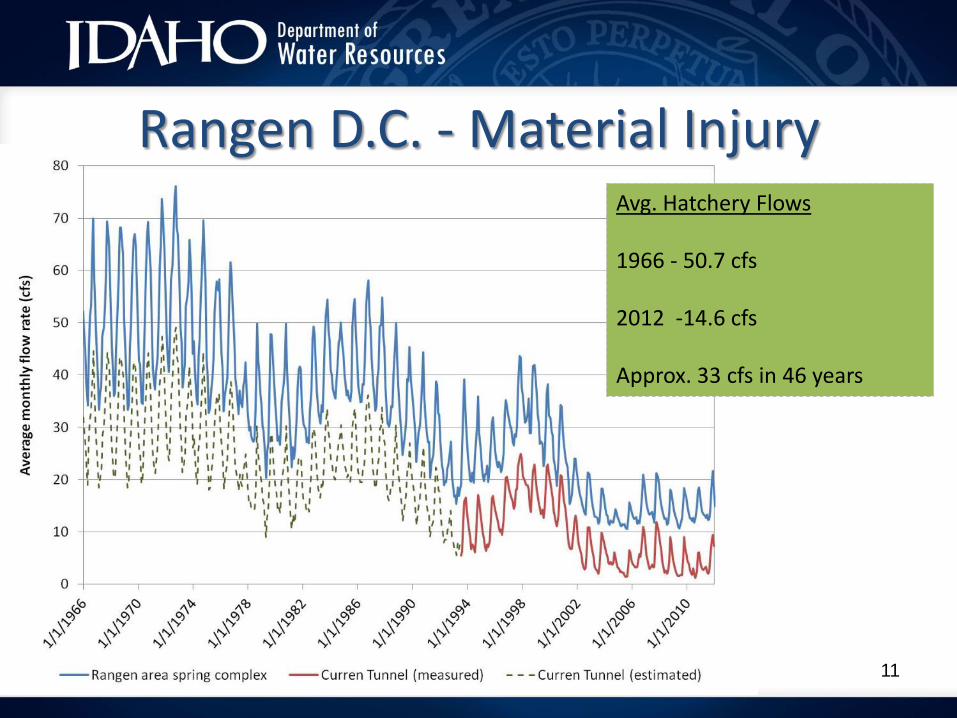
Spring Complex
Curren Tunnel
Rangen D.C. - Material InjuryAvg. Hatchery Flows
1966 - 50.7 cfs
2012 -14.6 cfs
Approx. 33 cfs in 46 years
11
0
2,000
4,000
6,000
8,000
10,000
12,000
CFS
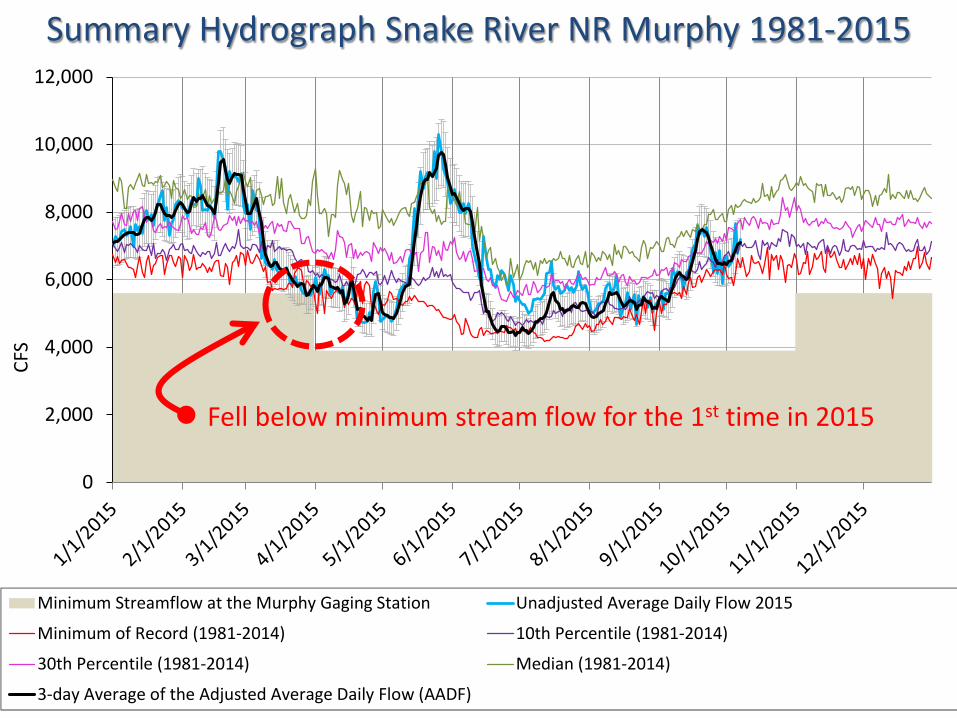
Minimum Streamflow at the Murphy Gaging Station Unadjusted Average Daily Flow 2015
Minimum of Record (1981-2014) 10th Percentile (1981-2014)
30th Percentile (1981-2014) Median (1981-2014)
3-day Average of the Adjusted Average Daily Flow (AADF)
Summary Hydrograph Snake River NR Murphy 1981-2015
Fell below minimum stream flow for the 1st time in 2015
Review of Delivery Calls
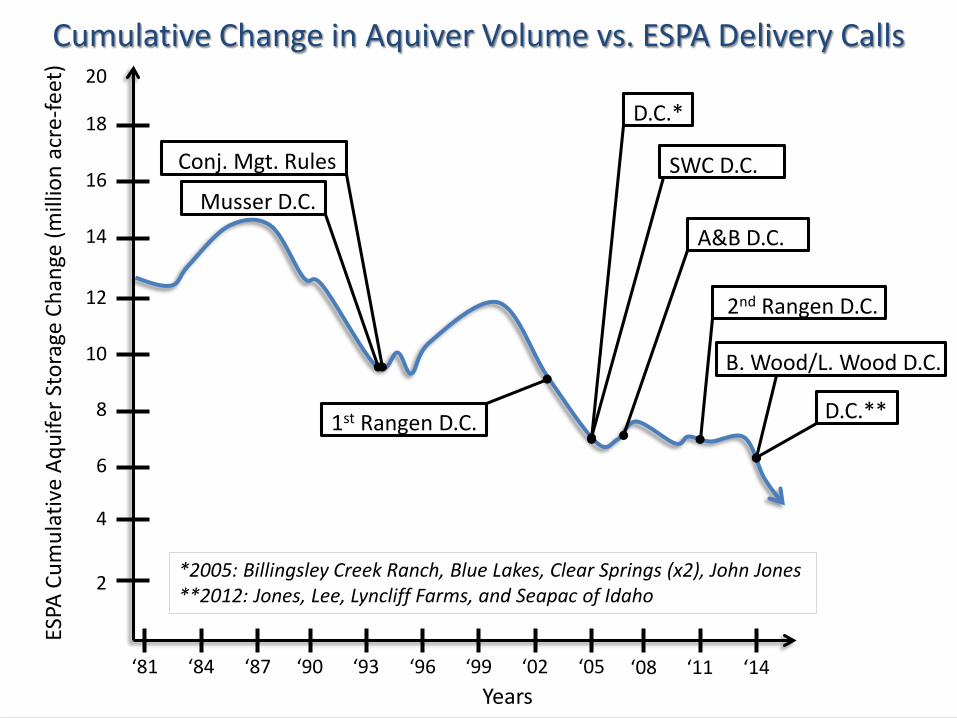
Cumulative Change in Aquiver Volume vs. ESPA Delivery Calls20
18
16
14
12
10
8
6
4
2
‘81 ‘84 ‘87 ‘90 ‘93 ‘96 ‘99 ‘02 ‘05 ‘08 ‘11 ‘14
ESPA
Cum
ulat
ive
Aqui
fer S
tora
ge C
hang
e (m
illio
n ac
re-fe
et)
Years
SWC D.C.
1st Rangen D.C.
B. Wood/L. Wood D.C.
D.C.*
A&B D.C.
Conj. Mgt. Rules
2nd Rangen D.C.
*2005: Billingsley Creek Ranch, Blue Lakes, Clear Springs (x2), John Jones**2012: Jones, Lee, Lyncliff Farms, and Seapac of Idaho
D.C.**
Musser D.C.
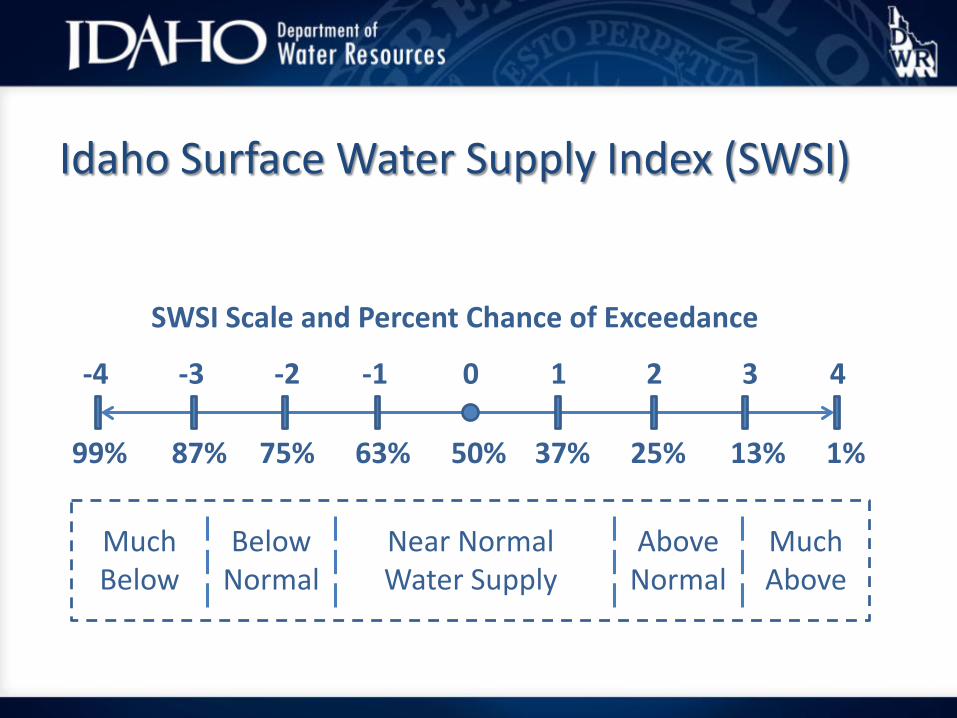
Idaho Surface Water Supply Index (SWSI)
0-1-2-3-4 4321
50%63%75%87%99% 1%13%25%37%
Much Below
Below Normal
Near Normal Water Supply
Much Above
Above Normal
SWSI Scale and Percent Chance of Exceedance
-5.0
-4.0
-3.0
-2.0
-1.0
0.0
1.0
2.0
3.0
4.0
5.0
1981
1983
1985
1987
1989
1991
1993
1995
1997
1999
2001
2003
2005
2007
2009
2011
2013
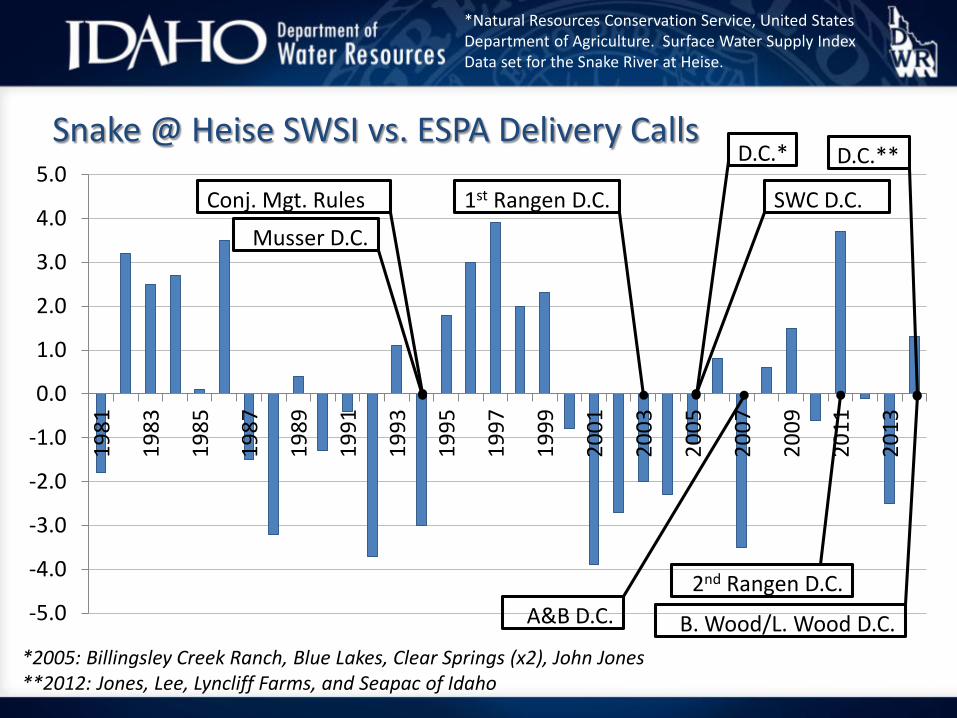
Snake @ Heise SWSI vs. ESPA Delivery Calls
SWC D.C.1st Rangen D.C.
B. Wood/L. Wood D.C.
D.C.*
A&B D.C.
Conj. Mgt. Rules
2nd Rangen D.C.
*2005: Billingsley Creek Ranch, Blue Lakes, Clear Springs (x2), John Jones**2012: Jones, Lee, Lyncliff Farms, and Seapac of Idaho
D.C.**
*Natural Resources Conservation Service, United States Department of Agriculture. Surface Water Supply IndexData set for the Snake River at Heise.
Musser D.C.
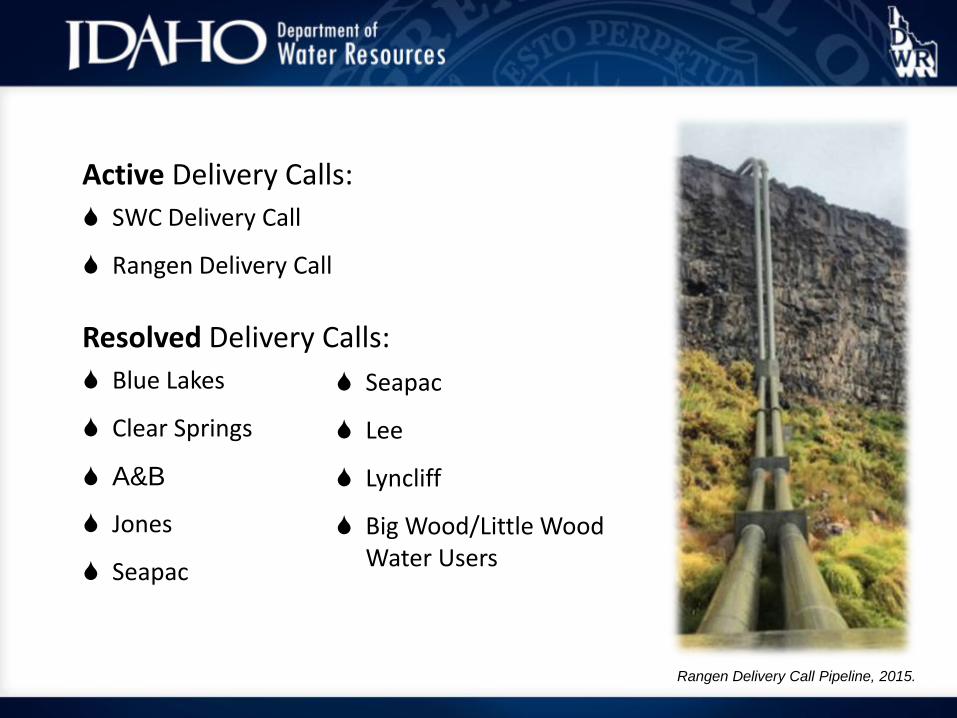
Rangen Delivery Call Pipeline, 2015.
Active Delivery Calls: SWC Delivery Call
Rangen Delivery Call
Resolved Delivery Calls: Blue Lakes
Clear Springs
A&B
Jones
Seapac
Seapac
Lee
Lyncliff
Big Wood/Little Wood Water Users
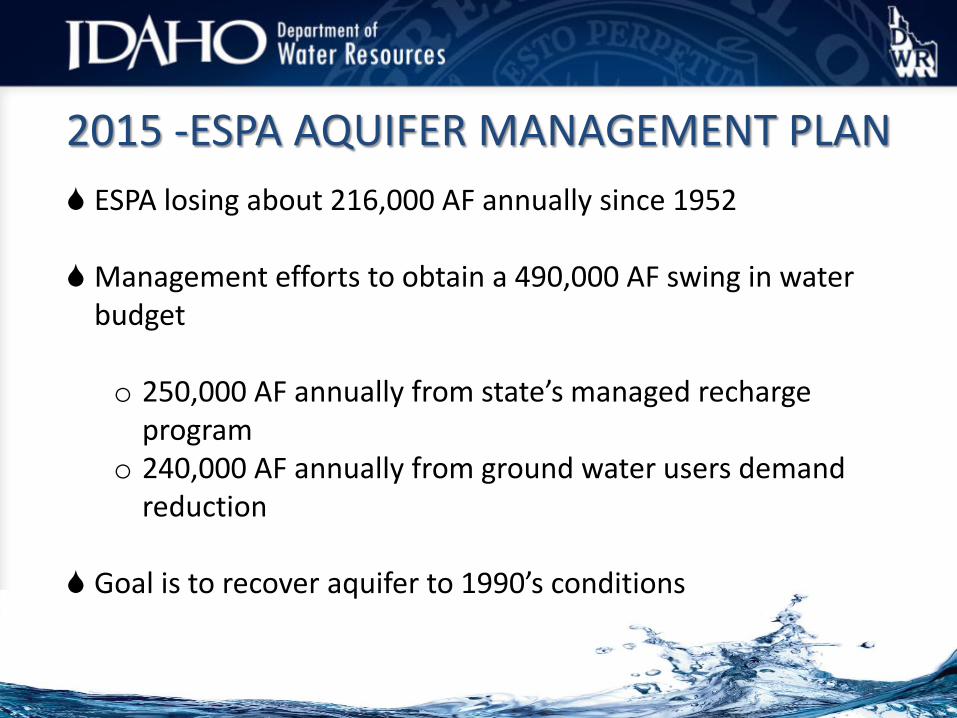
2015 -ESPA AQUIFER MANAGEMENT PLAN ESPA losing about 216,000 AF annually since 1952
Management efforts to obtain a 490,000 AF swing in water budget
o 250,000 AF annually from state’s managed recharge program
o 240,000 AF annually from ground water users demand reduction
Goal is to recover aquifer to 1990’s conditions
Review and Update of IGWA/SWC Settlement
Agreement
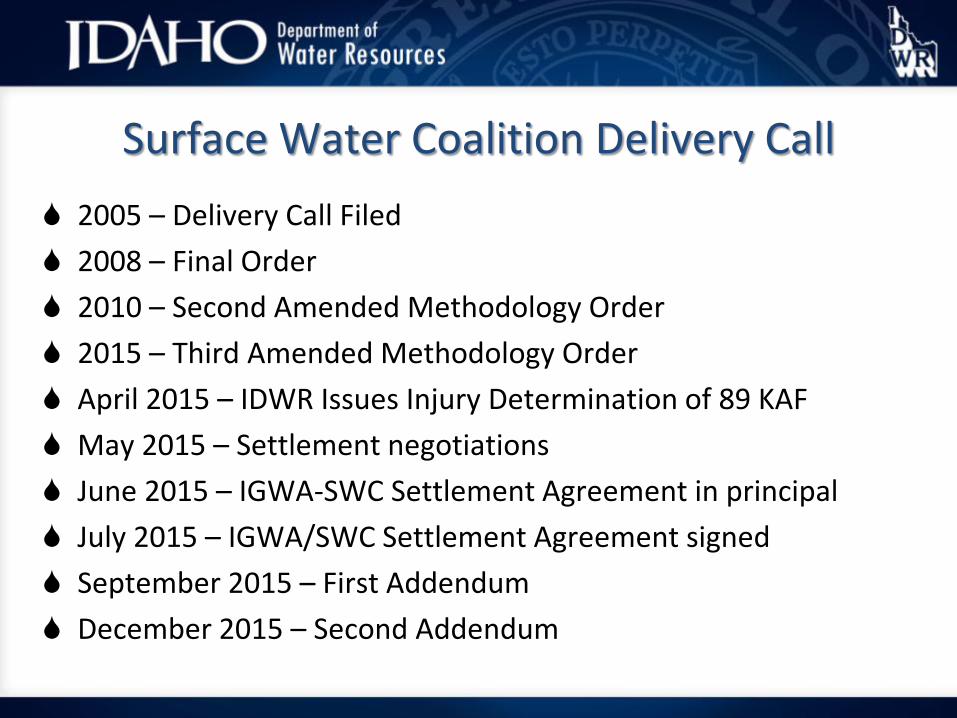
Surface Water Coalition Delivery Call 2005 – Delivery Call Filed 2008 – Final Order 2010 – Second Amended Methodology Order 2015 – Third Amended Methodology Order April 2015 – IDWR Issues Injury Determination of 89 KAF May 2015 – Settlement negotiations June 2015 – IGWA-SWC Settlement Agreement in principal July 2015 – IGWA/SWC Settlement Agreement signed September 2015 – First Addendum December 2015 – Second Addendum
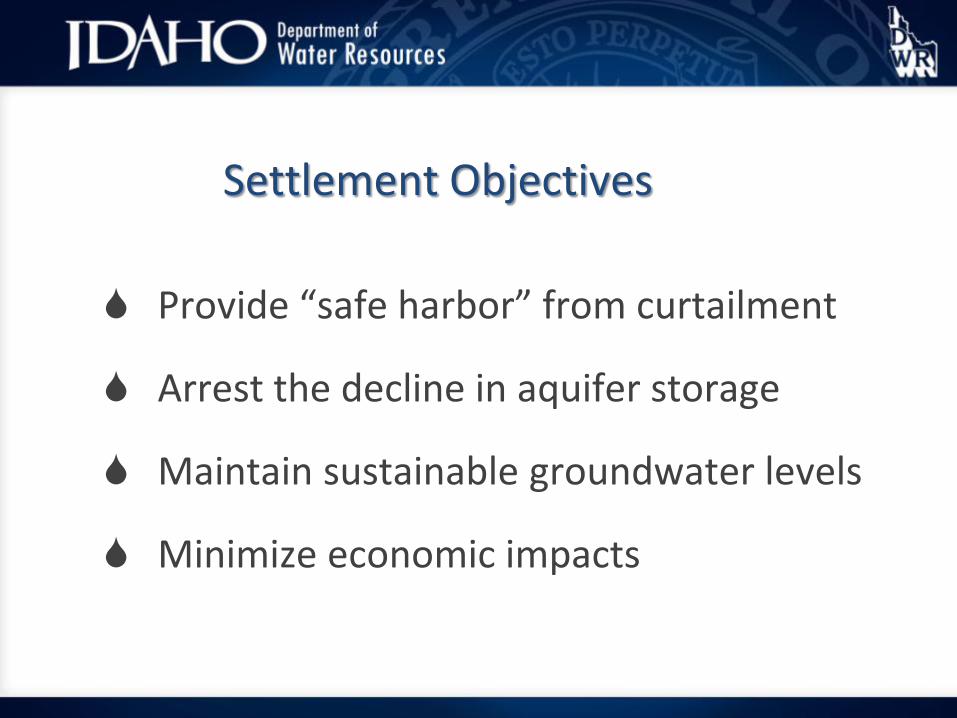
Settlement Objectives
Provide “safe harbor” from curtailment
Arrest the decline in aquifer storage
Maintain sustainable groundwater levels
Minimize economic impacts
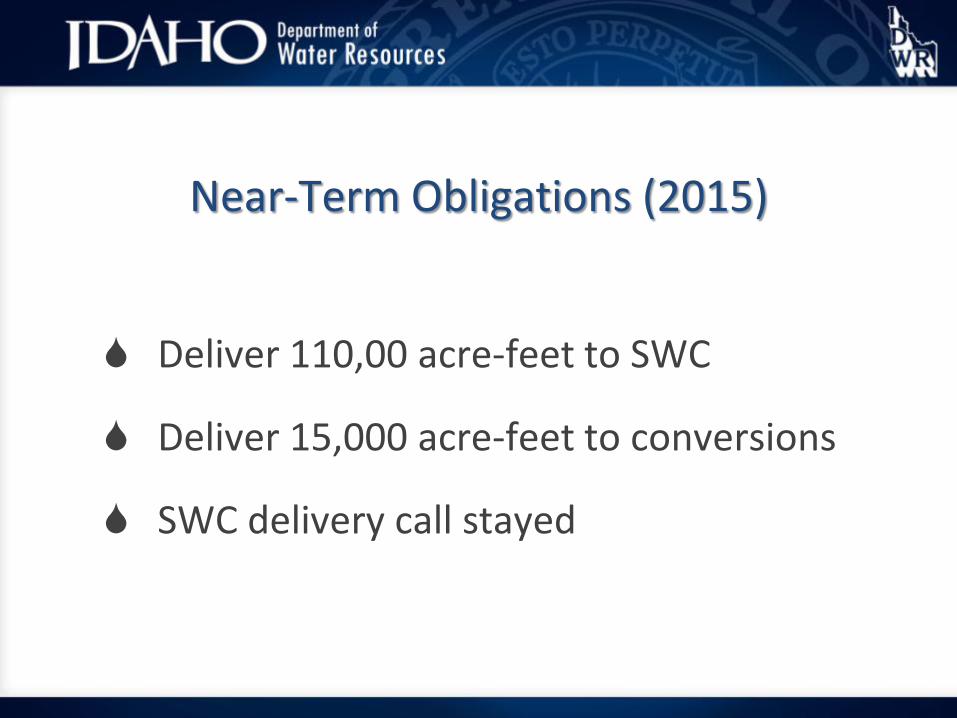
Near-Term Obligations (2015)
Deliver 110,00 acre-feet to SWC
Deliver 15,000 acre-feet to conversions
SWC delivery call stayed
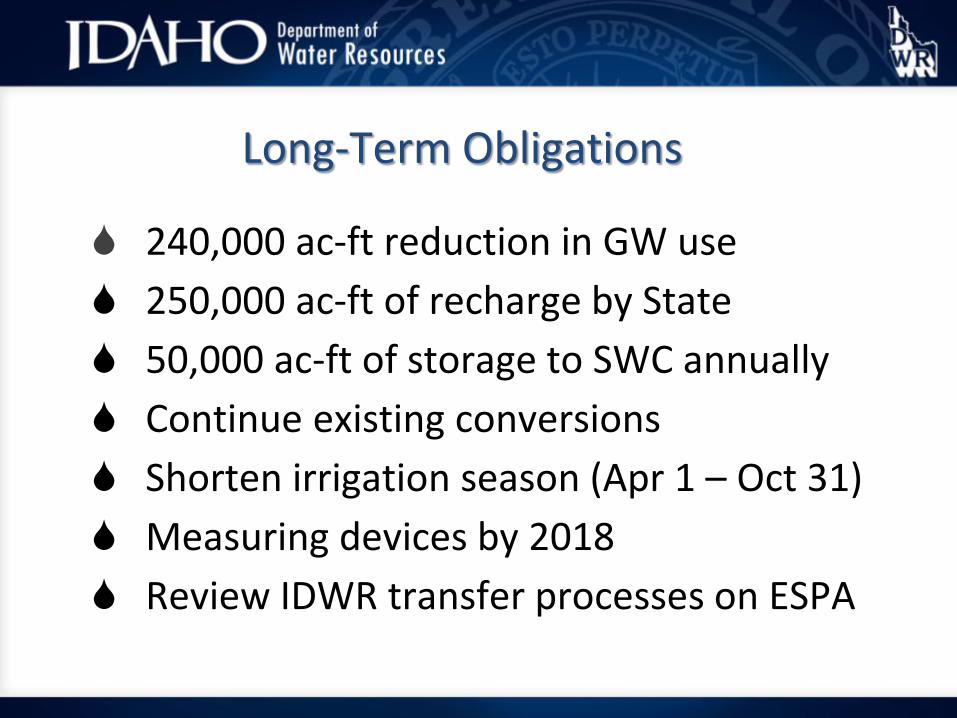
Long-Term Obligations
240,000 ac-ft reduction in GW use 250,000 ac-ft of recharge by State 50,000 ac-ft of storage to SWC annually Continue existing conversions Shorten irrigation season (Apr 1 – Oct 31) Measuring devices by 2018 Review IDWR transfer processes on ESPA
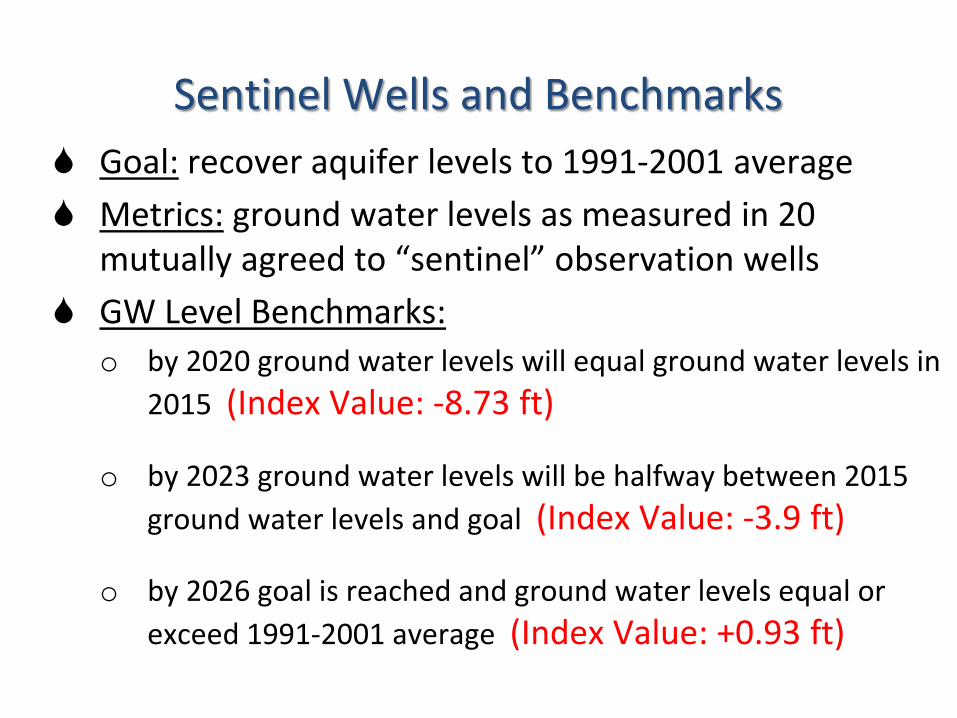
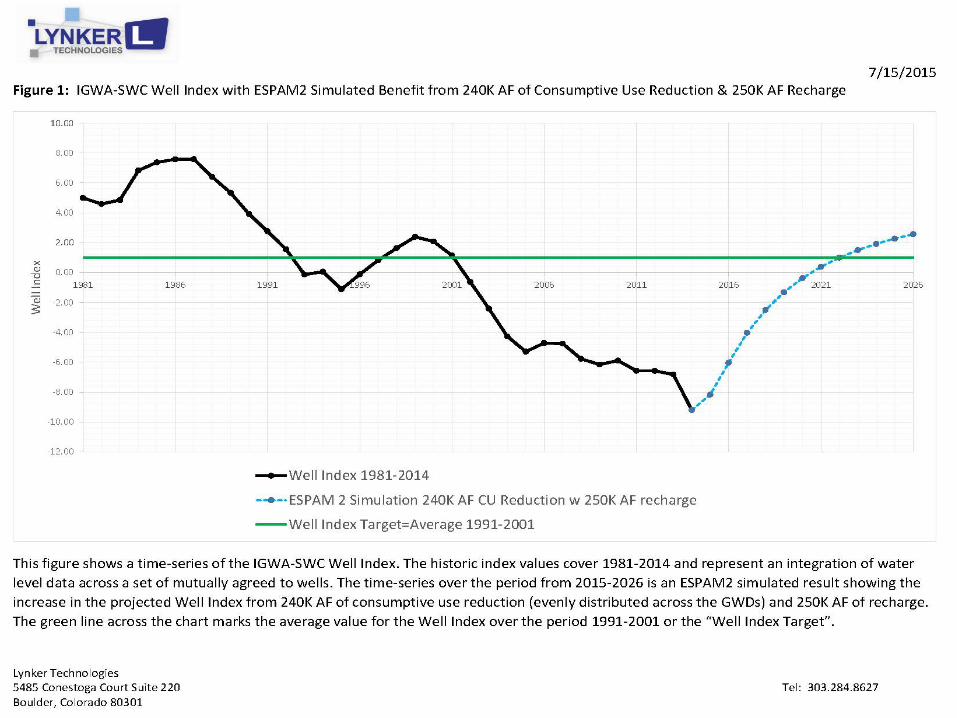
Sentinel Wells and Benchmarks Goal: recover aquifer levels to 1991-2001 average Metrics: ground water levels as measured in 20
mutually agreed to “sentinel” observation wells GW Level Benchmarks:
o by 2020 ground water levels will equal ground water levels in 2015 (Index Value: -8.73 ft)
o by 2023 ground water levels will be halfway between 2015 ground water levels and goal (Index Value: -3.9 ft)
o by 2026 goal is reached and ground water levels equal or exceed 1991-2001 average (Index Value: +0.93 ft)
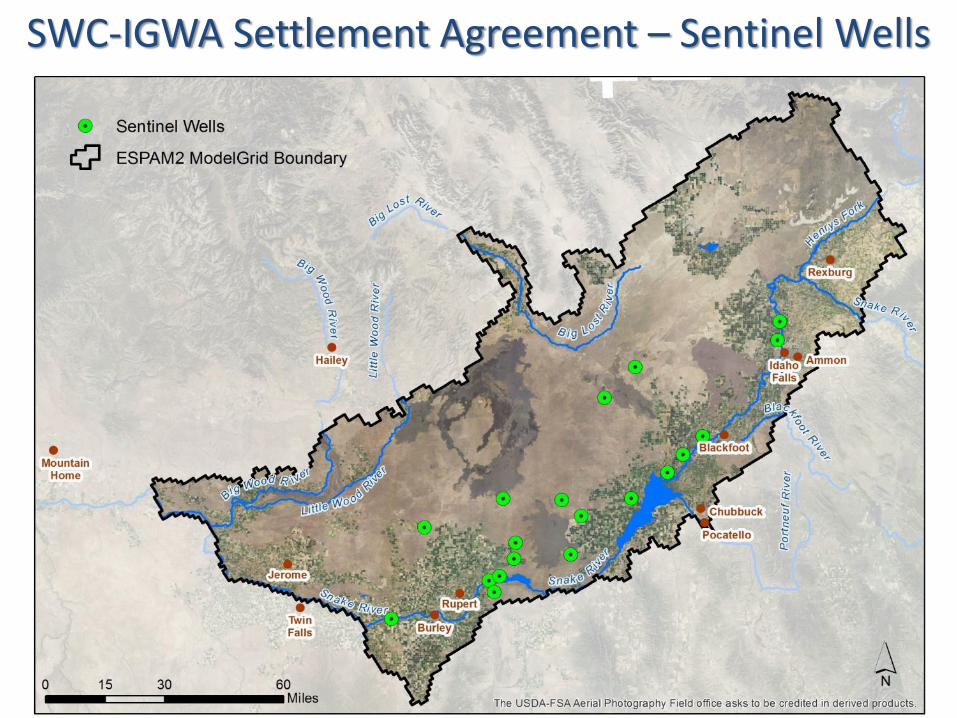
SWC-IGWA Settlement Agreement – Sentinel Wells
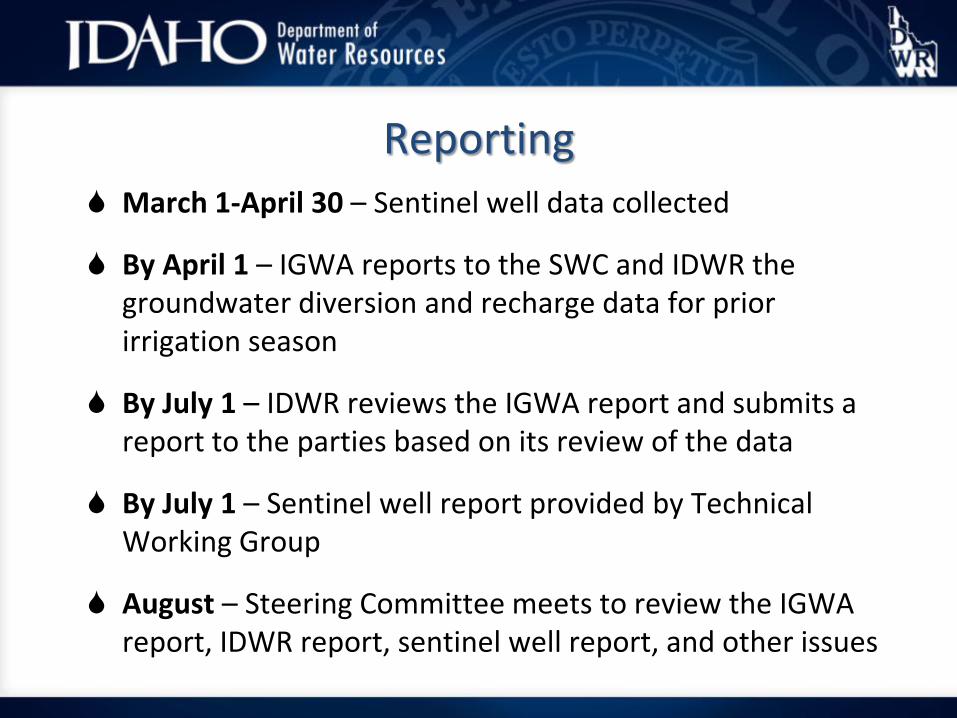
Reporting March 1-April 30 – Sentinel well data collected
By April 1 – IGWA reports to the SWC and IDWR the groundwater diversion and recharge data for prior irrigation season
By July 1 – IDWR reviews the IGWA report and submits a report to the parties based on its review of the data
By July 1 – Sentinel well report provided by Technical Working Group
August – Steering Committee meets to review the IGWA report, IDWR report, sentinel well report, and other issues
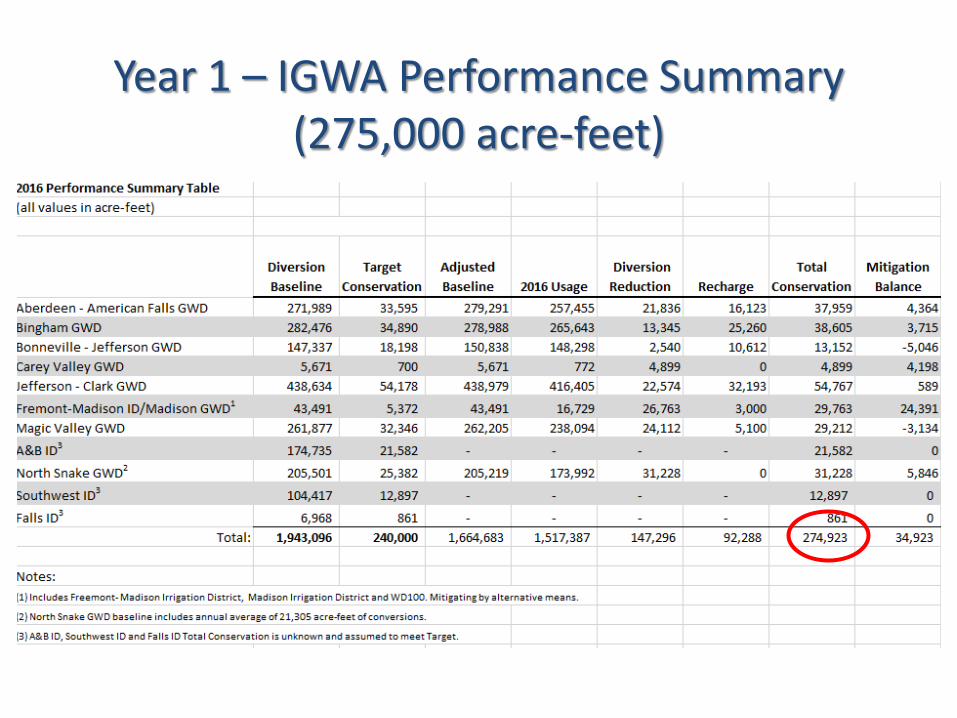
Year 1 – IGWA Performance Summary(275,000 acre-feet)
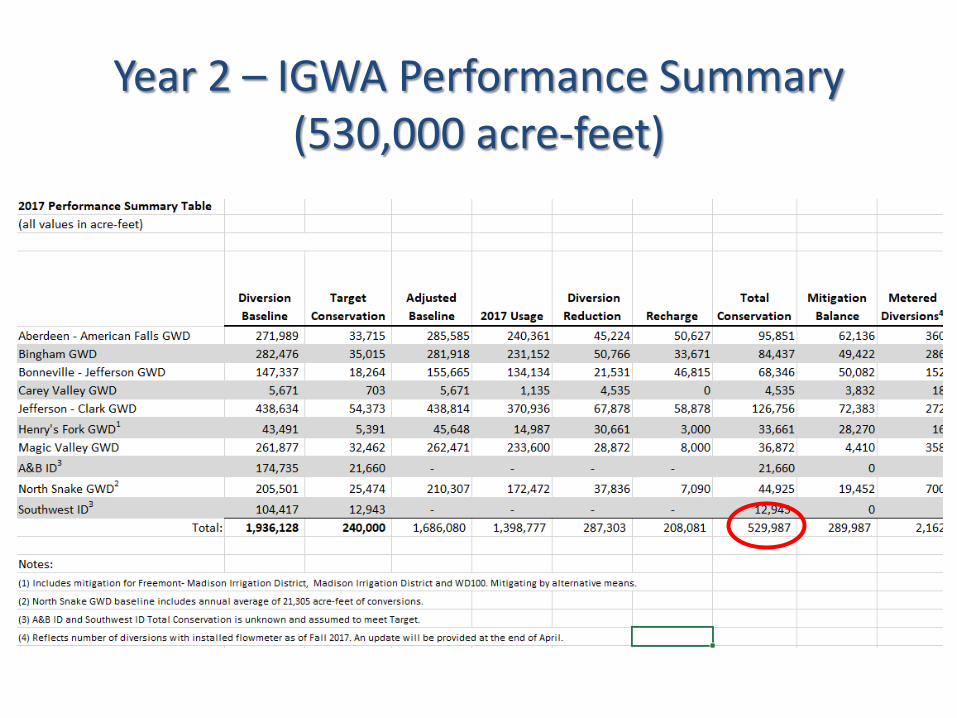
Year 2 – IGWA Performance Summary(530,000 acre-feet)
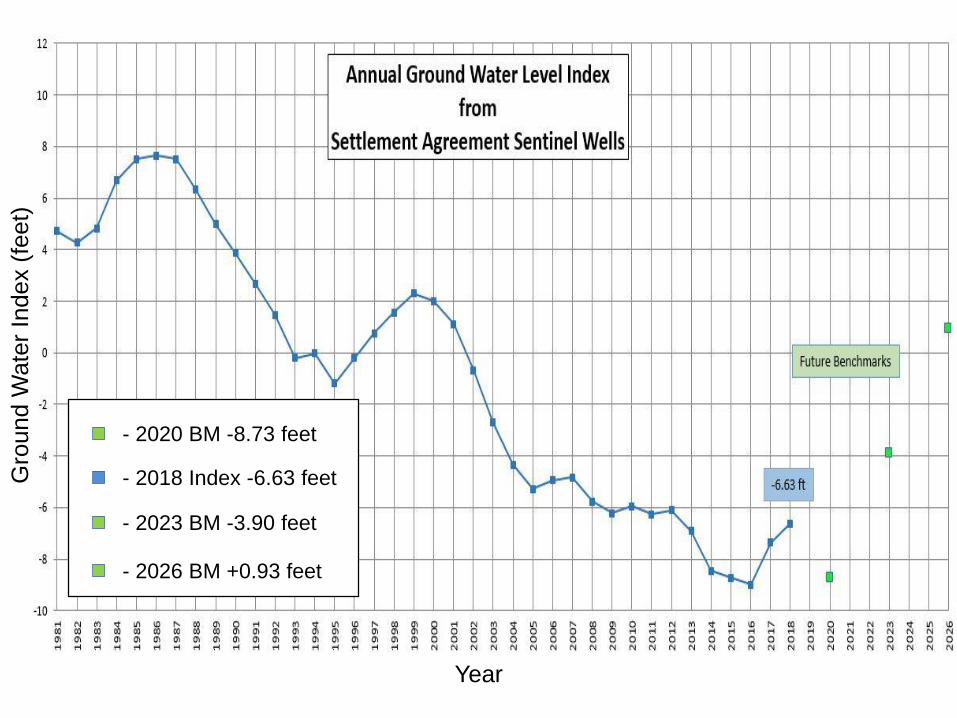
- 2020 BM -8.73 feet
- 2018 Index -6.63 feet
- 2023 BM -3.90 feet
- 2026 BM +0.93 feet
Year
Gro
und
Wat
er In
dex
(feet
)
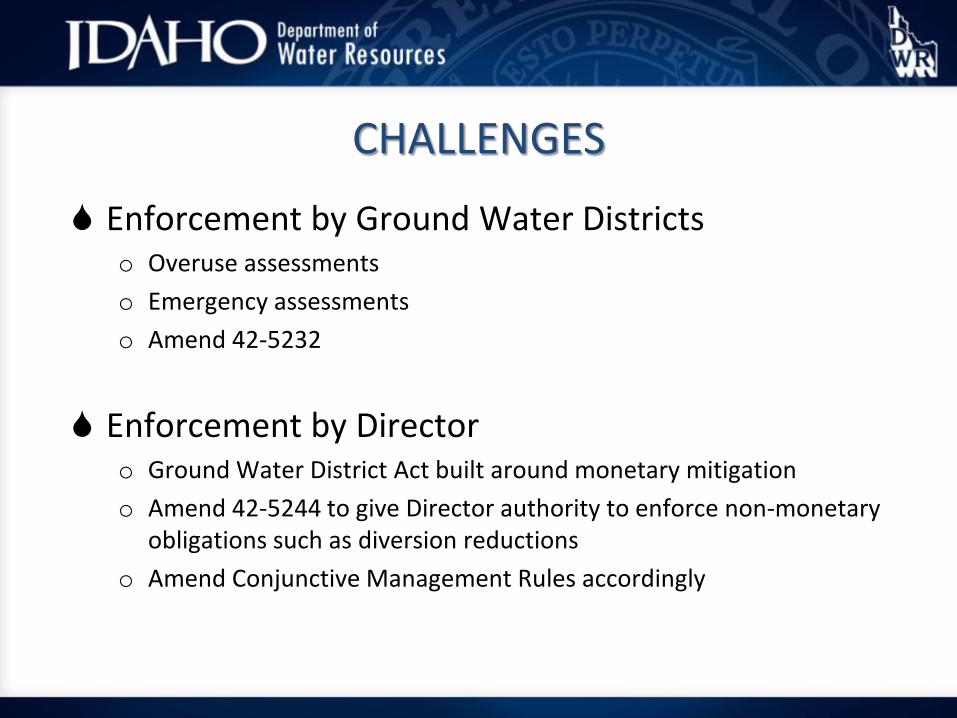
CHALLENGES
Enforcement by Ground Water Districtso Overuse assessmentso Emergency assessmentso Amend 42-5232
Enforcement by Directoro Ground Water District Act built around monetary mitigationo Amend 42-5244 to give Director authority to enforce non-monetary
obligations such as diversion reductionso Amend Conjunctive Management Rules accordingly
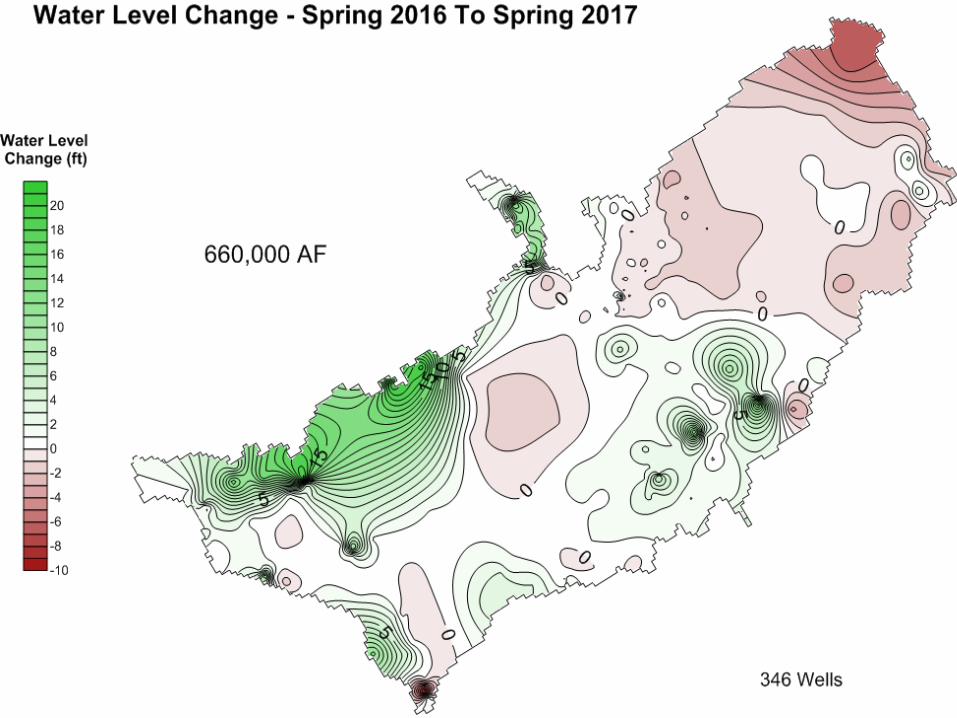
Recent ESPA Aquifer Conditions
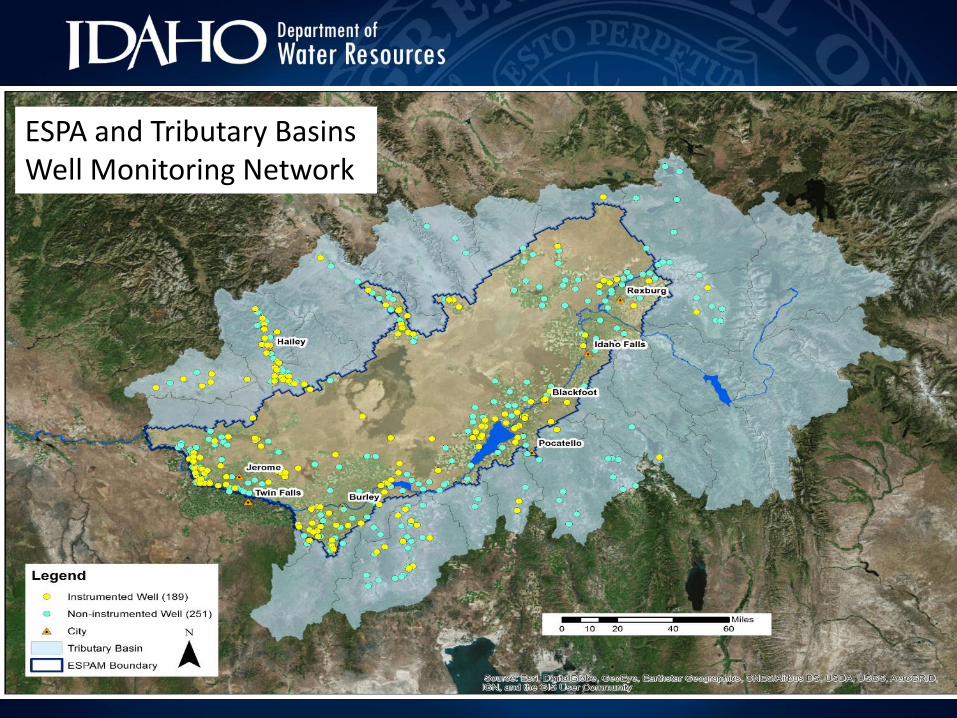
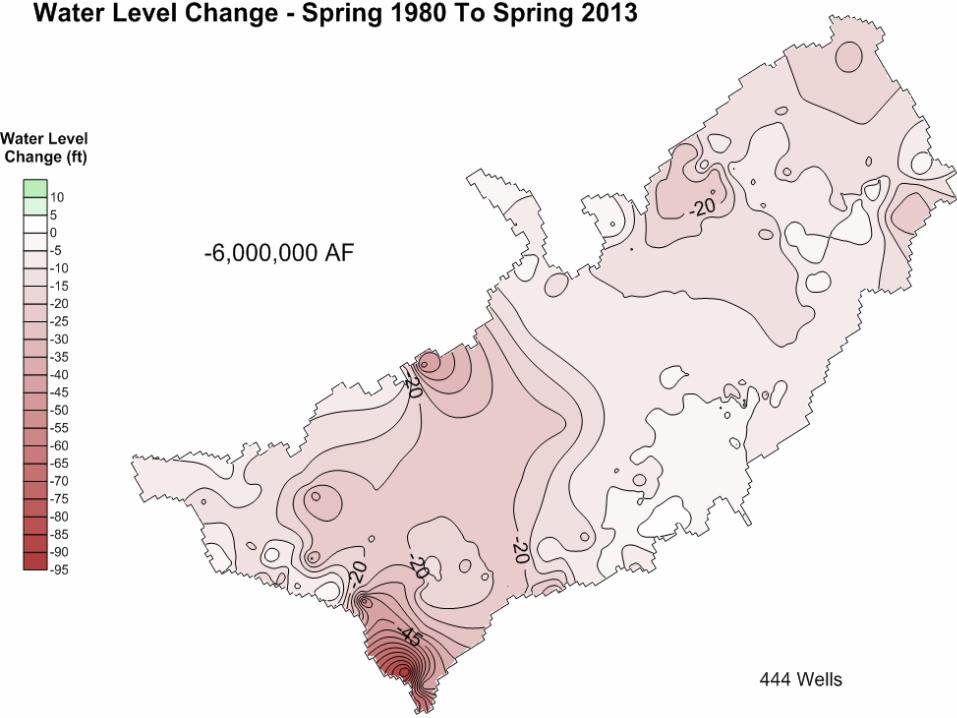
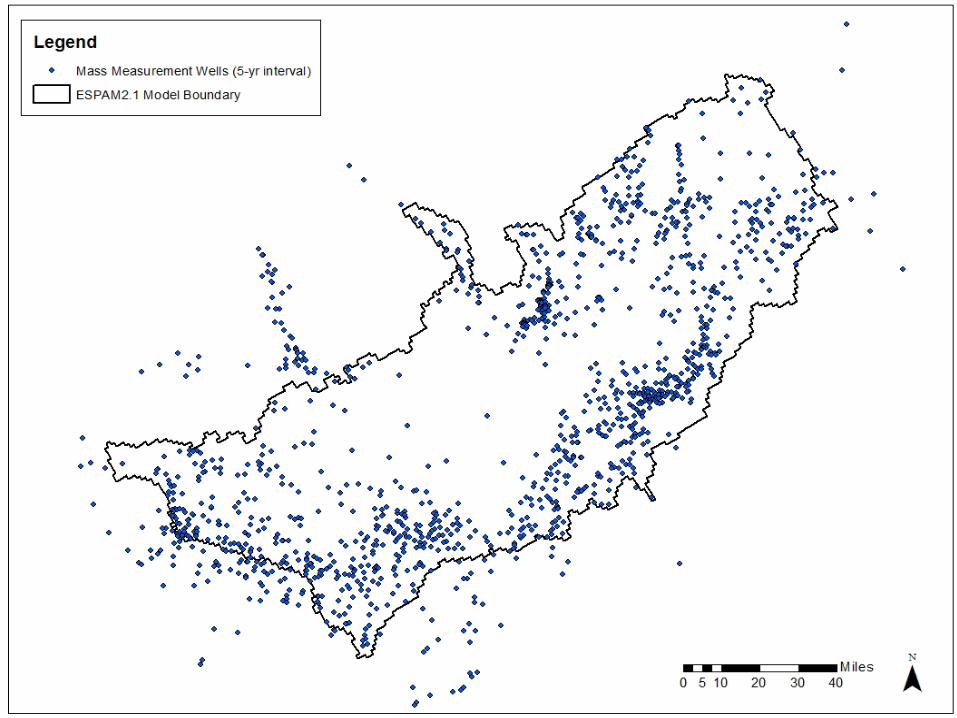
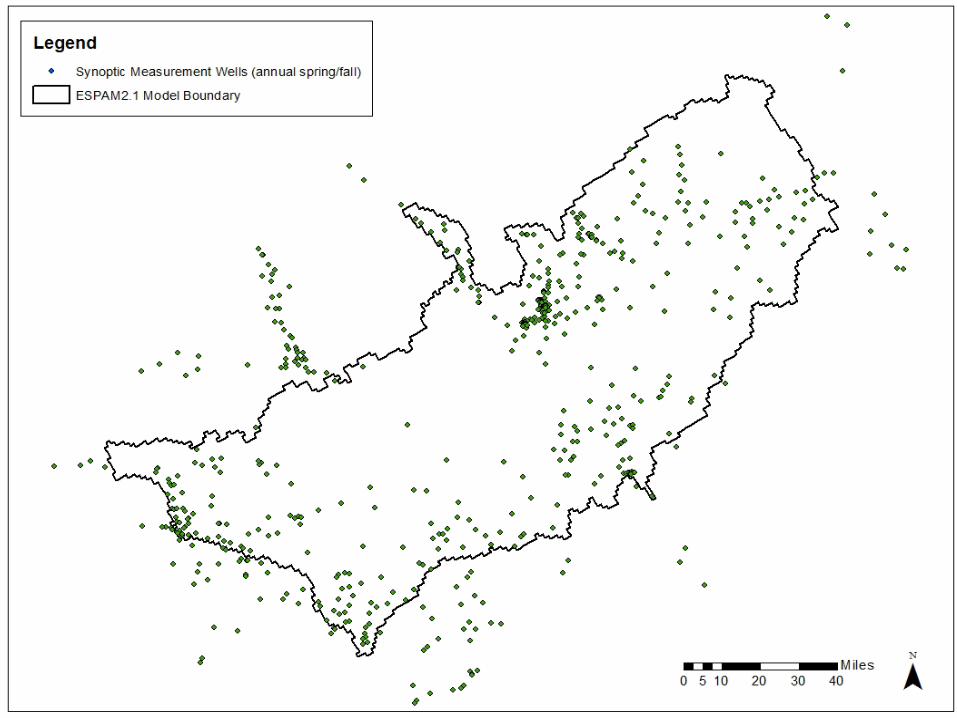
ESPA and Tributary BasinsWell Monitoring Network
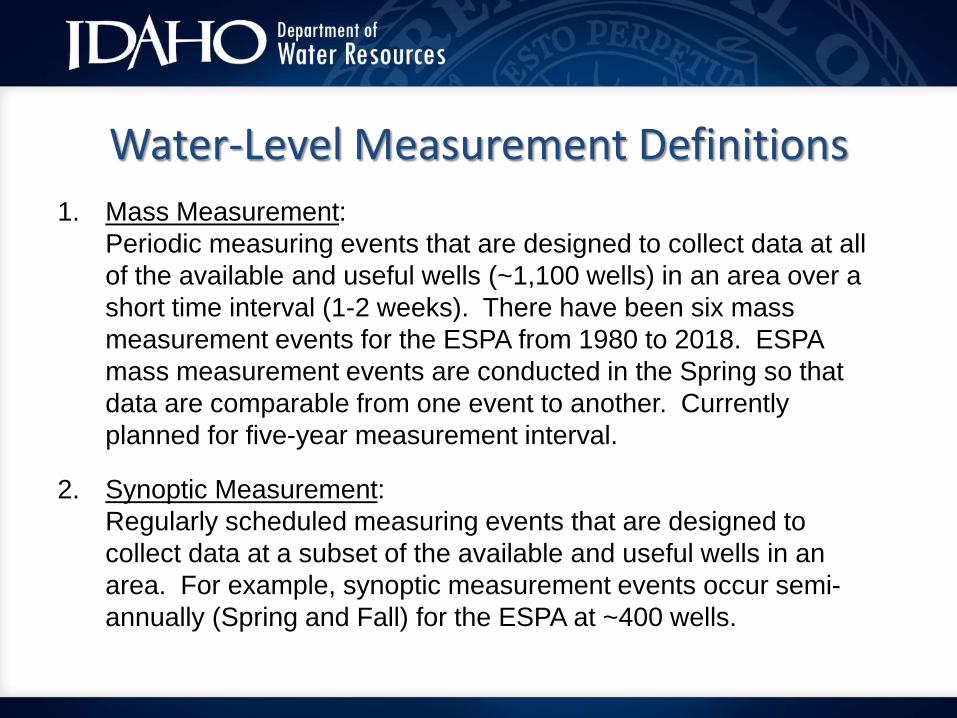
1. Mass Measurement:Periodic measuring events that are designed to collect data at all of the available and useful wells (~1,100 wells) in an area over a short time interval (1-2 weeks). There have been six mass measurement events for the ESPA from 1980 to 2018. ESPA mass measurement events are conducted in the Spring so that data are comparable from one event to another. Currently planned for five-year measurement interval.
2. Synoptic Measurement:Regularly scheduled measuring events that are designed to collect data at a subset of the available and useful wells in an area. For example, synoptic measurement events occur semi-annually (Spring and Fall) for the ESPA at ~400 wells.
Water-Level Measurement Definitions
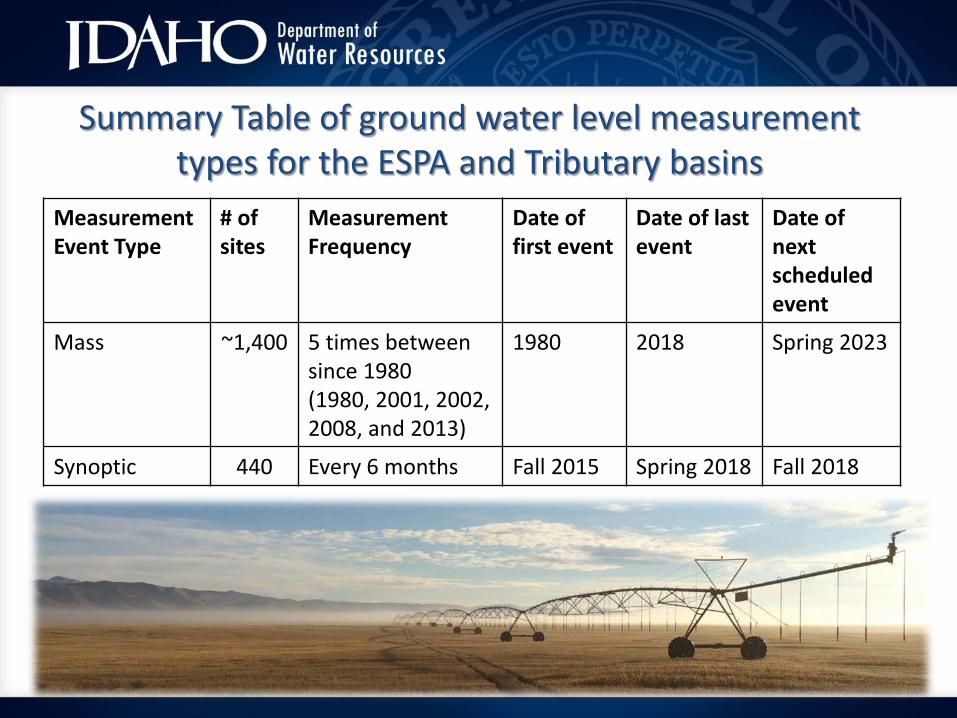
MeasurementEvent Type
# of sites
Measurement Frequency
Date of first event
Date of last event
Date of next scheduled event
Mass ~1,400 5 times betweensince 1980(1980, 2001, 2002, 2008, and 2013)
1980 2018 Spring 2023
Synoptic 440 Every 6 months Fall 2015 Spring 2018 Fall 2018
Summary Table of ground water level measurement types for the ESPA and Tributary basins

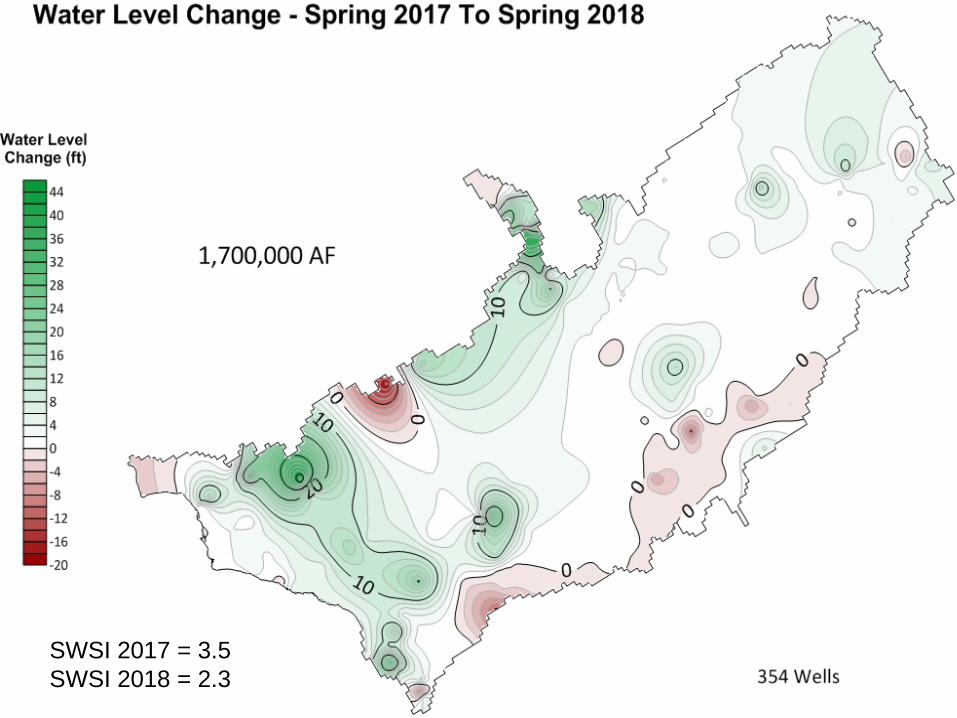
SWSI 2017 = 3.5SWSI 2018 = 2.3
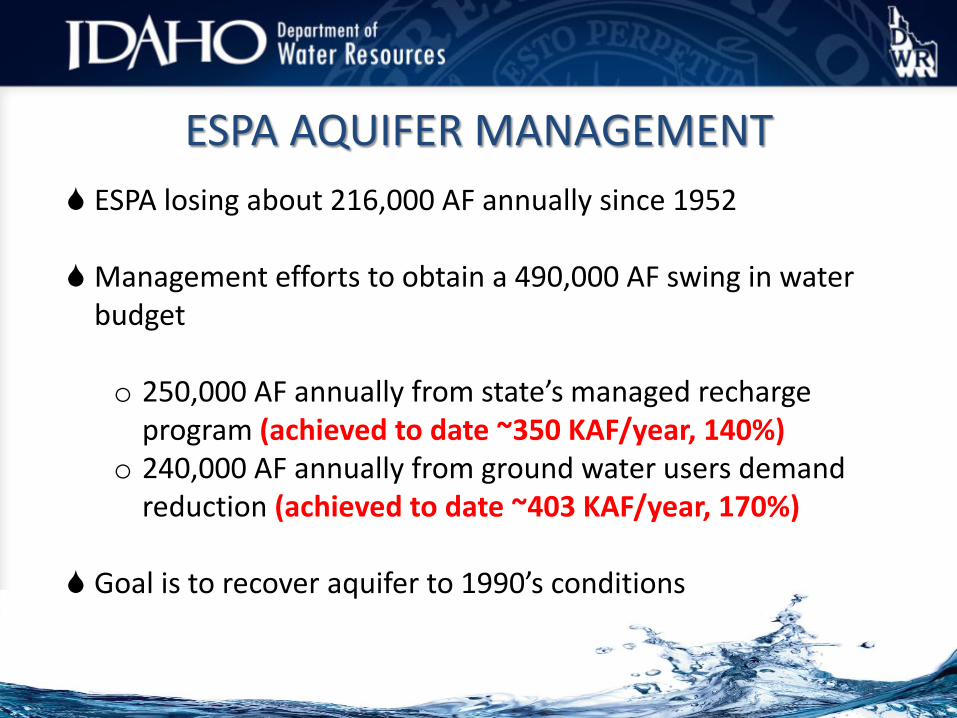
ESPA AQUIFER MANAGEMENT ESPA losing about 216,000 AF annually since 1952
Management efforts to obtain a 490,000 AF swing in water budget
o 250,000 AF annually from state’s managed recharge program (achieved to date ~350 KAF/year, 140%)
o 240,000 AF annually from ground water users demand reduction (achieved to date ~403 KAF/year, 170%)
Goal is to recover aquifer to 1990’s conditions
Unique Qualities of Municipal Pumping and Implications of
Curtailment
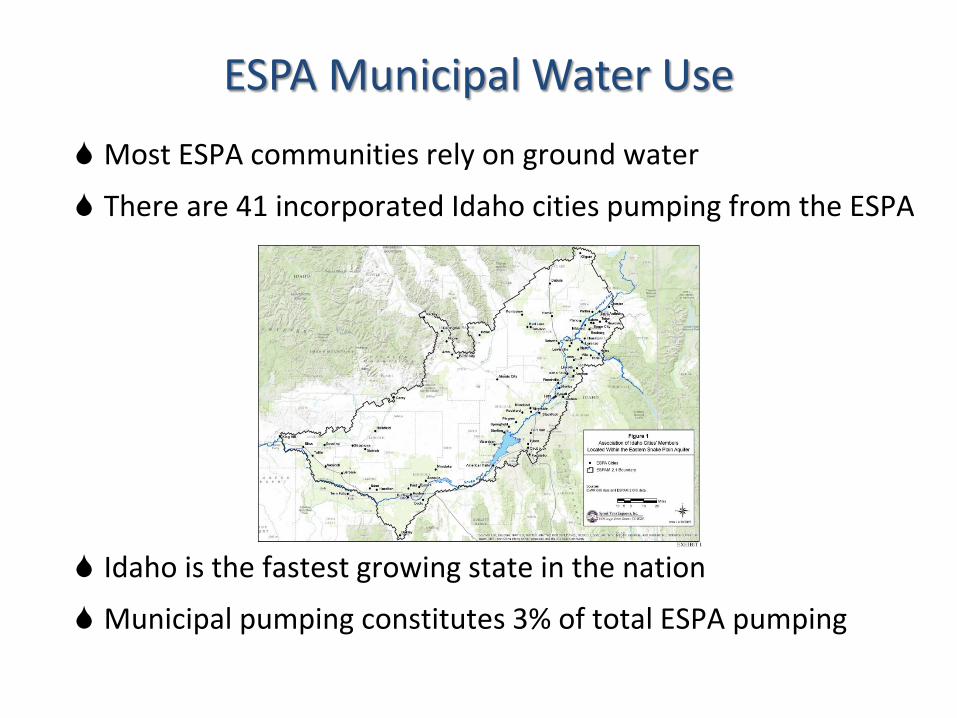
ESPA Municipal Water Use Most ESPA communities rely on ground water
There are 41 incorporated Idaho cities pumping from the ESPA
Idaho is the fastest growing state in the nation
Municipal pumping constitutes 3% of total ESPA pumping
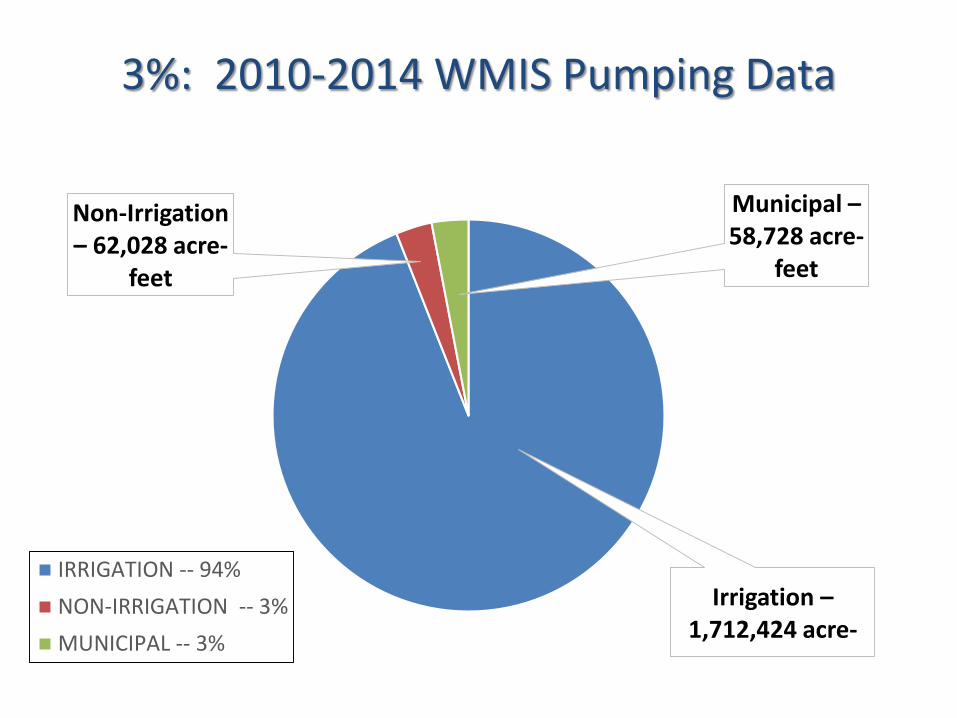
3%: 2010-2014 WMIS Pumping Data
Irrigation –1,712,424 acre-
Non-Irrigation – 62,028 acre-
feet
Municipal –58,728 acre-
feet
IRRIGATION -- 94%NON-IRRIGATION -- 3%MUNICIPAL -- 3%
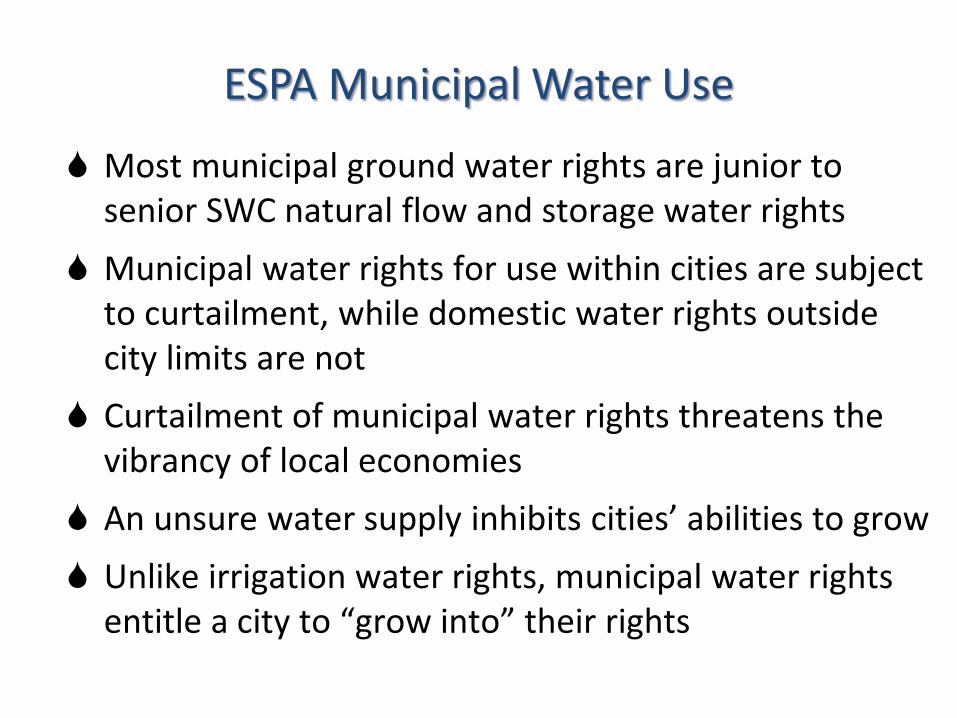
ESPA Municipal Water Use
Most municipal ground water rights are junior to senior SWC natural flow and storage water rights
Municipal water rights for use within cities are subject to curtailment, while domestic water rights outside city limits are not
Curtailment of municipal water rights threatens the vibrancy of local economies
An unsure water supply inhibits cities’ abilities to grow Unlike irrigation water rights, municipal water rights
entitle a city to “grow into” their rights
The Cities/IGWA/SWCSettlement Agreement
Cities/IGWA/SWC Settlement Agreement Background
Prior to designation of the ESPA GWMA, cities were in compliance with IDWR’s conjunctive management orders and associated statutory and court decisions “Coalition of Cities” were mitigating in the Rangen,
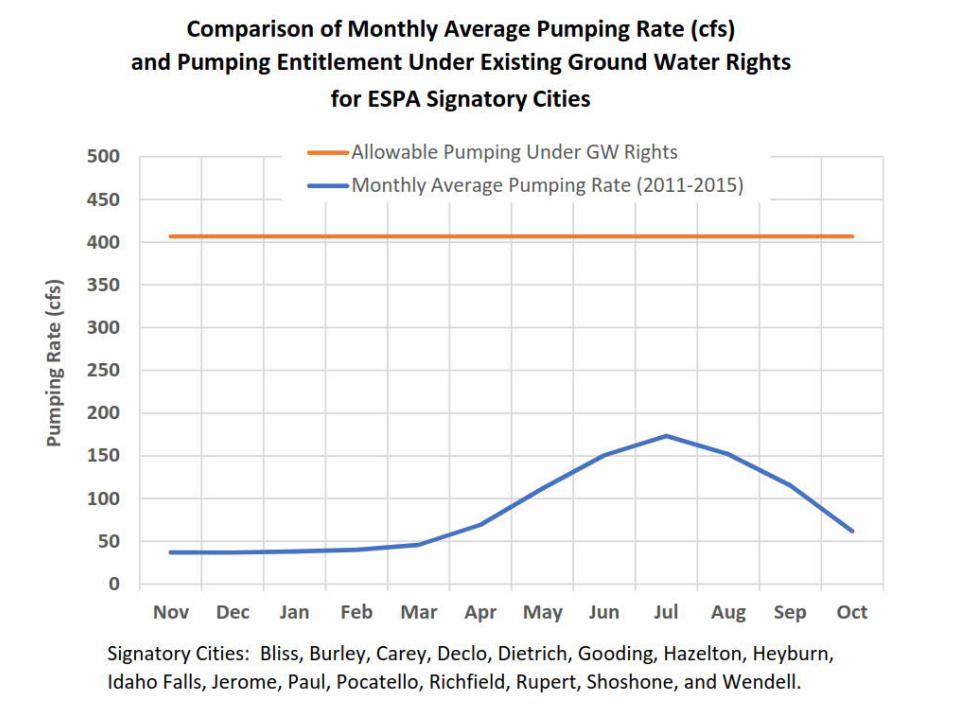
Inc. delivery call through rechargeoBliss, Burley, Carey, Declo, Dietrich, Gooding, Hazelton,
Heyburn, Jerome, Paul, Richfield, Rupert, Shoshone, and Wendell
Coalition of Cities, City of Idaho Falls, and the City of Pocatello (collectively the “Cities”) were entering into annual mitigation agreements with the SWC for storage water
In 2015, IGWA and SWC entered into their Final Settlement Agreement
Among other things, the IGWA/SWC agreement required permanent reduction in pumping and benchmark water levels in the 19 “sentinel wells”
The IGWA/SWC framework was unworkable for ESPA cities, and IGWA and SWC acknowledged as much
Combined with designation of the ESPA GWMA, the Cities began negotiations with IGWA and SWC to resolve the delivery call and GWMA disputes
Cities/IGWA/SWC Settlement Agreement Background
Cities/IGWA/SWC Settlement Agreement – Key Provisions
Cities will provide 7,650 af/y through aquifer enhancement activities
oAgreed upon “aquifer enhancements” receive a 1:1 credit Delivery of water to IWRB for recharge
Recharge of ESPA by the Cities – 50% above Great Rift
Ground water to surface water conversions, temporary or permanent dry ups, or other activities agreed to by the parties
Cities’ obligation will increase to 9,640 af/y if IGWA’s obligation increases from 240,000 af/y to 340,000 af/y
Volumes are based on a 5-year rolling average
Cities will annually provide a minimum of 1,000 acre-feet
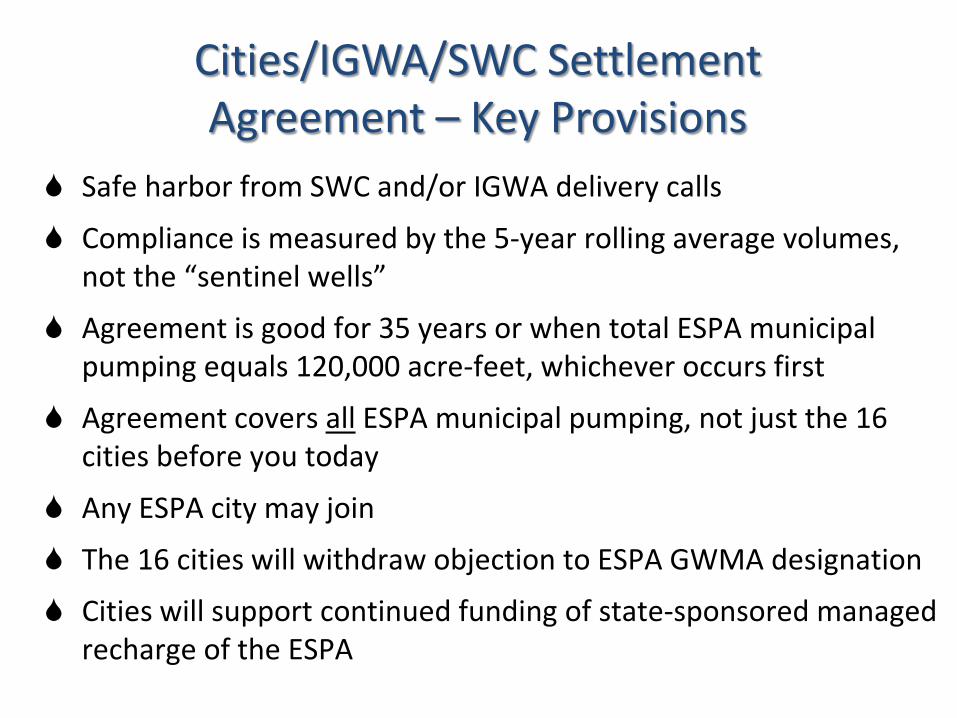
Cities/IGWA/SWC Settlement Agreement – Key Provisions
Safe harbor from SWC and/or IGWA delivery calls
Compliance is measured by the 5-year rolling average volumes, not the “sentinel wells”
Agreement is good for 35 years or when total ESPA municipal pumping equals 120,000 acre-feet, whichever occurs first
Agreement covers all ESPA municipal pumping, not just the 16 cities before you today
Any ESPA city may join
The 16 cities will withdraw objection to ESPA GWMA designation
Cities will support continued funding of state-sponsored managed recharge of the ESPA
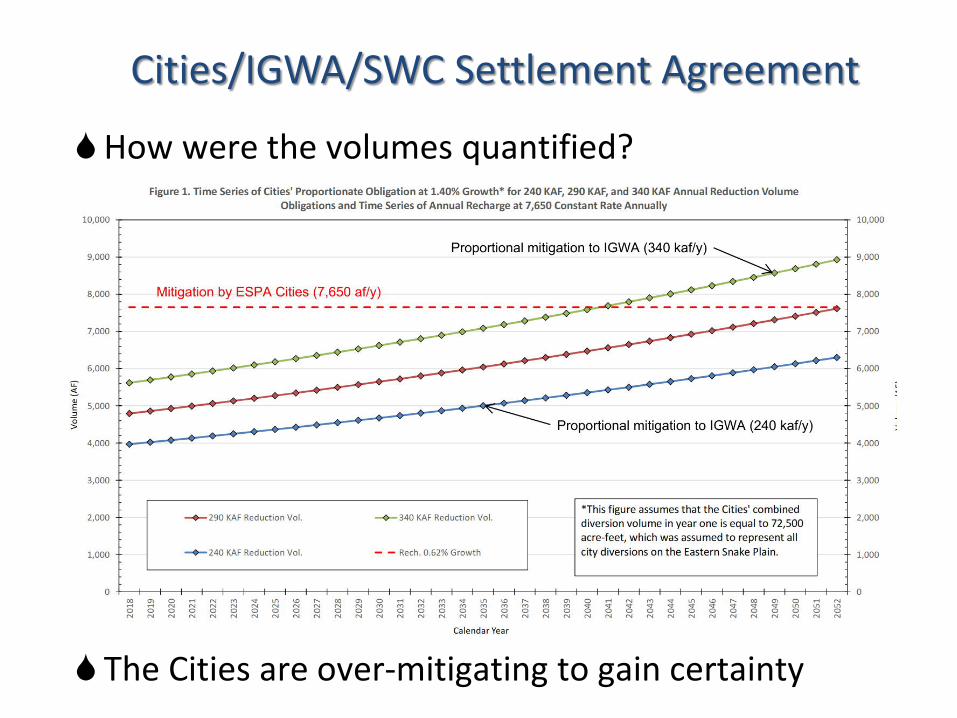
Cities/IGWA/SWC Settlement Agreement
How were the volumes quantified?
The Cities are over-mitigating to gain certainty

Legislative Support for the Cities/IGWA/SWC Settlement
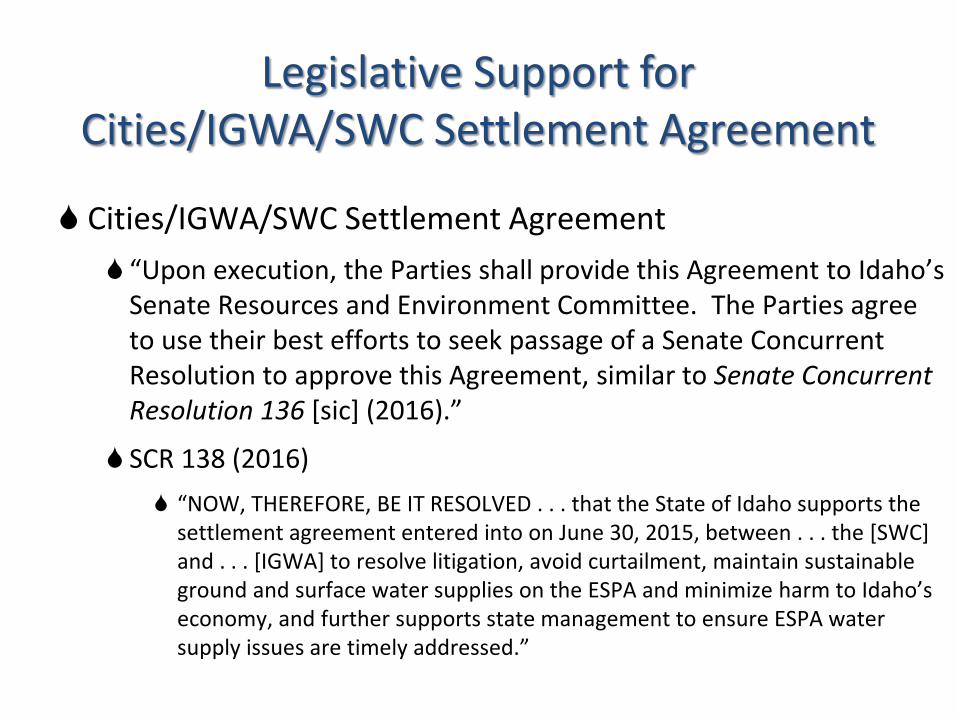
Legislative Support for Cities/IGWA/SWC Settlement Agreement
Cities/IGWA/SWC Settlement Agreement “Upon execution, the Parties shall provide this Agreement to Idaho’s
Senate Resources and Environment Committee. The Parties agree to use their best efforts to seek passage of a Senate Concurrent Resolution to approve this Agreement, similar to Senate Concurrent Resolution 136 [sic] (2016).”
SCR 138 (2016) “NOW, THEREFORE, BE IT RESOLVED . . . that the State of Idaho supports the
settlement agreement entered into on June 30, 2015, between . . . the [SWC] and . . . [IGWA] to resolve litigation, avoid curtailment, maintain sustainable ground and surface water supplies on the ESPA and minimize harm to Idaho’s economy, and further supports state management to ensure ESPA water supply issues are timely addressed.”
ESPA Water Administration Update
1. Expand and support existing Water Districts (e.g. WD 100)o Enforce current measurement orders
2. Create new Water Districts (e.g. WD29D, WD29H)
3. Administer existing delivery calls (e.g. SWC, Rangen)
4. Manage and administer existing GWMAs and CGWAs
5. Finalize the designation of the ESPA GWMAo Status Conference January 2019
o Advisory Committee
o Ground Water Management Plan (“GWMP”)
Our Work is Not Done
1. A Ground Water Management Area (“GWMA”) designation changes the administrative focus from injury determinations for individual water users (symptoms) to the ground water resource as a whole (illness)
2. GWMA tools: (1) comprehensive management plans; (2) required measurement and reporting; and (3) restriction on new applications when there is “insufficient water”
3. GWMA’s require participation by all ground water users
4. No more year-to-year curtailment uncertainty w/ the SWC Delivery Call
5. The designation of a GWMA and the adoption of a GWMP will: (1) lesson the likelihood of future delivery calls; and (2) support the achievement of the water resource goals identified by the ESPA CAMP, the State Water Plan, and the Settlements discussed here today
Why Do We Need an ESPA GWMA?
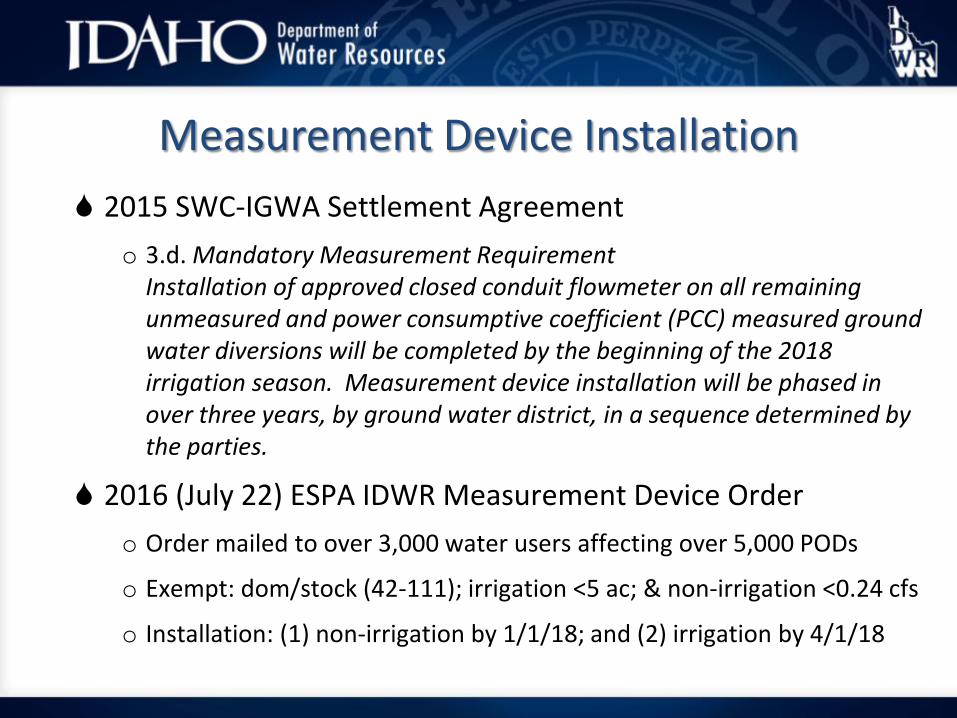
Measurement Device Installation 2015 SWC-IGWA Settlement Agreement
o 3.d. Mandatory Measurement RequirementInstallation of approved closed conduit flowmeter on all remaining unmeasured and power consumptive coefficient (PCC) measured ground water diversions will be completed by the beginning of the 2018 irrigation season. Measurement device installation will be phased in over three years, by ground water district, in a sequence determined by the parties.
2016 (July 22) ESPA IDWR Measurement Device Ordero Order mailed to over 3,000 water users affecting over 5,000 PODs
o Exempt: dom/stock (42-111); irrigation <5 ac; & non-irrigation <0.24 cfs
o Installation: (1) non-irrigation by 1/1/18; and (2) irrigation by 4/1/18
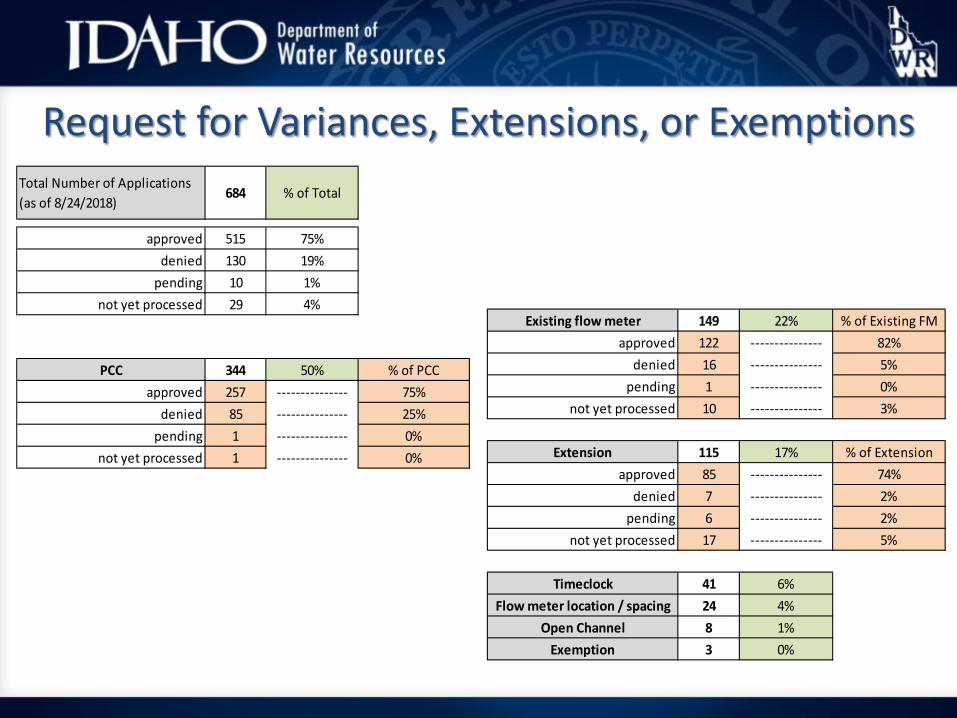
Request for Variances, Extensions, or Exemptions
Existing flow meter 149 22% % of Existing FMapproved 122 --------------- 82%
denied 16 --------------- 5%pending 1 --------------- 0%
not yet processed 10 --------------- 3%
Extension 115 17% % of Extensionapproved 85 --------------- 74%
denied 7 --------------- 2%pending 6 --------------- 2%
not yet processed 17 --------------- 5%
Timeclock 41 6%Flow meter location / spacing 24 4%
Open Channel 8 1%Exemption 3 0%
Total Number of Applications (as of 8/24/2018)
684 % of Total
approved 515 75%denied 130 19%
pending 10 1%not yet processed 29 4%
PCC 344 50% % of PCCapproved 257 --------------- 75%
denied 85 --------------- 25%pending 1 --------------- 0%
not yet processed 1 --------------- 0%
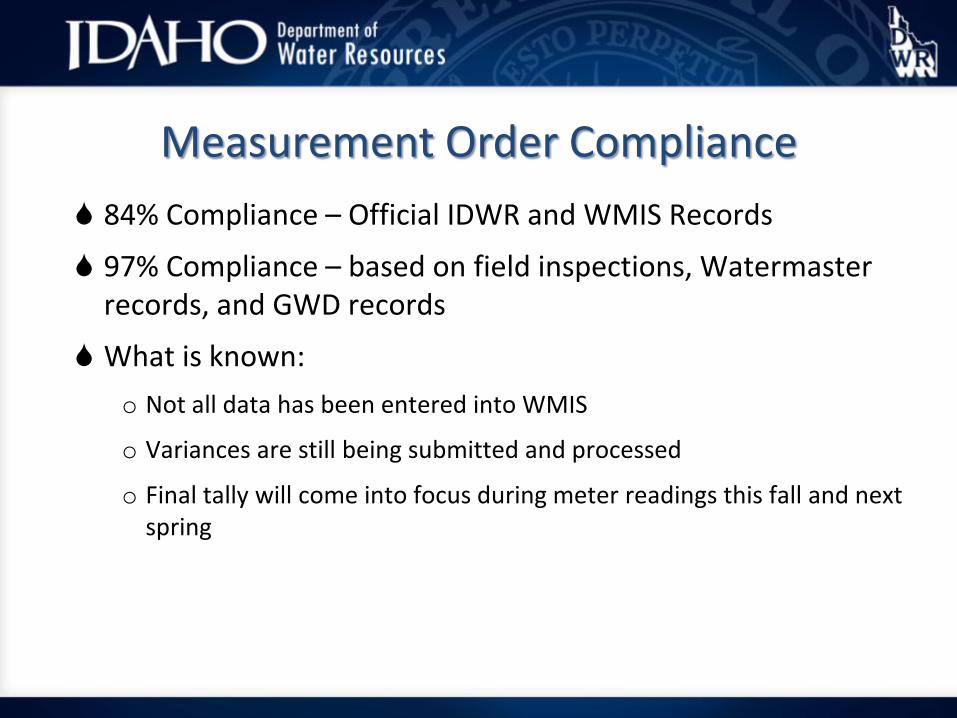
Measurement Order Compliance 84% Compliance – Official IDWR and WMIS Records
97% Compliance – based on field inspections, Watermaster records, and GWD records
What is known:o Not all data has been entered into WMIS
o Variances are still being submitted and processed
o Final tally will come into focus during meter readings this fall and next spring
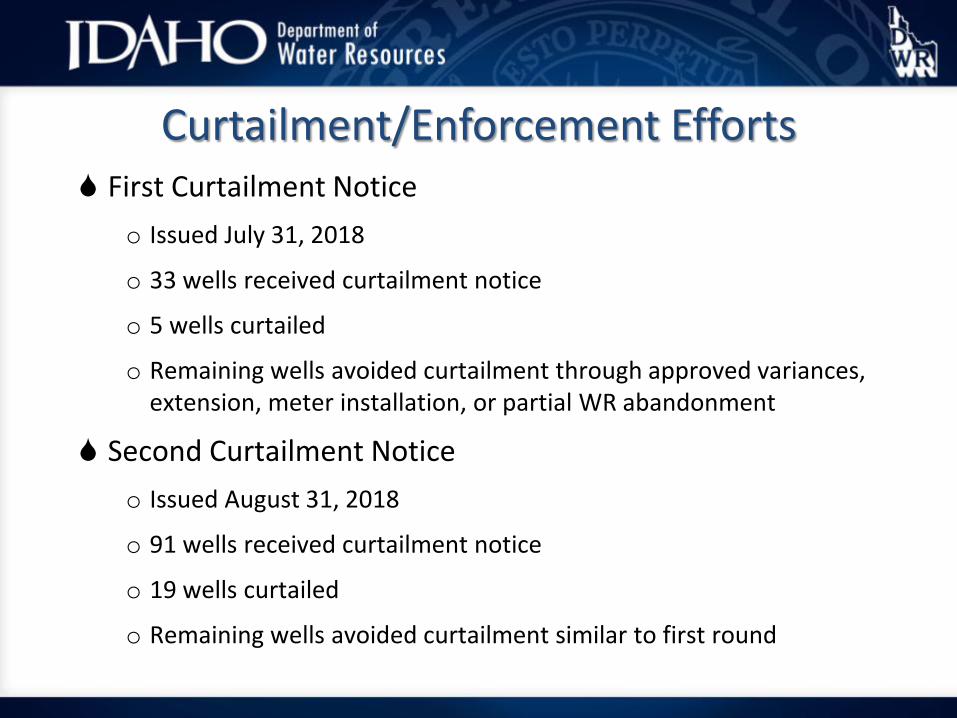
Curtailment/Enforcement Efforts First Curtailment Notice
o Issued July 31, 2018
o 33 wells received curtailment notice
o 5 wells curtailed
o Remaining wells avoided curtailment through approved variances, extension, meter installation, or partial WR abandonment
Second Curtailment Noticeo Issued August 31, 2018
o 91 wells received curtailment notice
o 19 wells curtailed
o Remaining wells avoided curtailment similar to first round
63
Questions and/or Discussion?
Shoshone Fall, March 2017.