Embed Size (px)
Citation preview
21 MARCH 2011
FINAL VERSION – NON-CONFIDENTIAL
REVIEW OF THE BT DUCT VALUATION 2009/10 REPORT
This report has been prepared on the basis of the limitations
set out in the engagement letter and the matters noted in the
Important Notice From BDO LLP on page 3.
This version is non-confidential. Confidential redactions are indicated by [%].
1
CONTENTS
01. TERMS OF REFERENCE 2
02. EXECUTIVE SUMMARY 5
03. OBSERVATIONS 11
APPENDICES
A DATES OF MEETINGS WITH BT STAKEHOLDERS 18
B THE SOURCE OF THE VOLUME AND PRICING DATA 20
C ADJUSTMENTS TO THE VOLUME AND PRICING DATA 29
D THE SAMPLE VALUATION 39
E THE NATIONAL VALUATION 51
FINAL VERSION – NON-CONFIDENTIAL

01. TERMS OF REFERENCE
FINAL VERSION – NON-CONFIDENTIAL
3
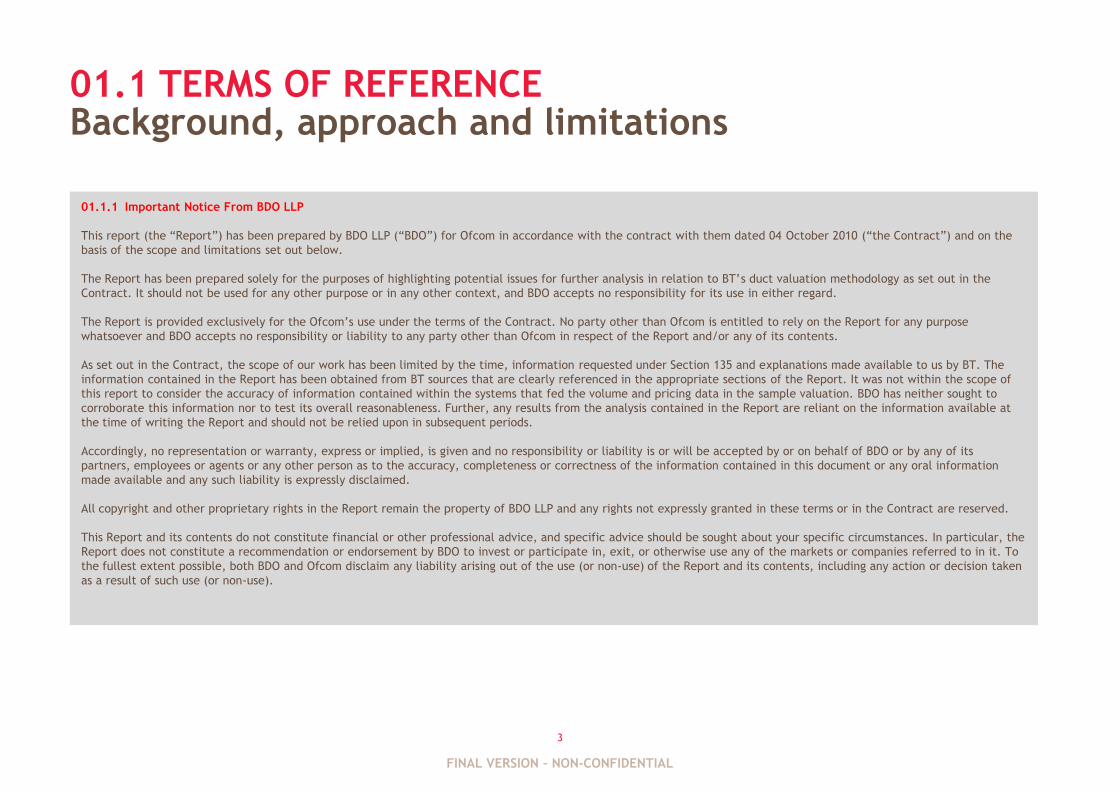
01.1 TERMS OF REFERENCEBackground, approach and limitations
01.1.1 Important Notice From BDO LLP
This report (the “Report”) has been prepared by BDO LLP (“BDO”) for Ofcom in accordance with the contract with them dated 04 October 2010 (“the Contract”) and on the
basis of the scope and limitations set out below.
The Report has been prepared solely for the purposes of highlighting potential issues for further analysis in relation to BT‟s duct valuation methodology as set out in the
Contract. It should not be used for any other purpose or in any other context, and BDO accepts no responsibility for its use in either regard.
The Report is provided exclusively for the Ofcom‟s use under the terms of the Contract. No party other than Ofcom is entitled to rely on the Report for any purpose
whatsoever and BDO accepts no responsibility or liability to any party other than Ofcom in respect of the Report and/or any of its contents.
As set out in the Contract, the scope of our work has been limited by the time, information requested under Section 135 and explanations made available to us by BT. The
information contained in the Report has been obtained from BT sources that are clearly referenced in the appropriate sections of the Report. It was not within the scope of
this report to consider the accuracy of information contained within the systems that fed the volume and pricing data in the sample valuation. BDO has neither sought to
corroborate this information nor to test its overall reasonableness. Further, any results from the analysis contained in the Report are reliant on the information available at
the time of writing the Report and should not be relied upon in subsequent periods.
Accordingly, no representation or warranty, express or implied, is given and no responsibility or liability is or will be accepted by or on behalf of BDO or by any of its
partners, employees or agents or any other person as to the accuracy, completeness or correctness of the information contained in this document or any oral information
made available and any such liability is expressly disclaimed.
All copyright and other proprietary rights in the Report remain the property of BDO LLP and any rights not expressly granted in these terms or in the Contract are reserved.
This Report and its contents do not constitute financial or other professional advice, and specific advice should be sought about your specific circumstances. In particular, the
Report does not constitute a recommendation or endorsement by BDO to invest or participate in, exit, or otherwise use any of the markets or companies referred to in it. To
the fullest extent possible, both BDO and Ofcom disclaim any liability arising out of the use (or non-use) of the Report and its contents, including any action or decision taken
as a result of such use (or non-use).
FINAL VERSION – NON-CONFIDENTIAL
4
01.1 TERMS OF REFERENCE
01.1.2 Background
BT are required to provide an annual valuation of the known and proven assets that
make up BT‟s duct network to Ofcom. In 2009/10 the estimated gross replacement cost
(“GRC”) of the BT duct network was £[%]. This was an increase of 37% from the
2008/09 valuation of the network of £[%].
As part of its review of BT‟s 2009/10 Regulatory Financial Statements and in preparation
for future charge control projects, Ofcom engaged BDO in October 2010 to assess BT‟s
2009/10 duct revaluation calculations and to identify and critique the key estimates and
judgements used to prepare the valuation.
The scope of the engagement required BDO to undertake a detailed review to consider:
• The checks and controls operated by BT over the 2009/10 valuation process and any
difference in approach compared to the process used by BT in 2008/09
• The main sensitivities, estimates and judgements used in preparing the duct Current
Cost Accounting (“CCA”) values for 2009/10 and an assessment of the reasonableness
of these estimates and judgements and how this differed from BT‟s approach in
2008/09
• How BT interpreted and applied CCA concepts, principles, policies and guidance in its
methodologies, methods and calculations (for example, how BT has selected
different valuation methods (absolute, indexed, other) for different asset types)
• The statistical sampling technique used in the process including an assessment of the
reliability of sampling procedures.
BT‟s/Openreach‟s 2009/10 valuation and the methodology are referred to in this report
as the “2009/10 Duct Valuation”. We do not distinguish in this report between
Openreach and BT.
01.1.3 Project Approach
When the 2009/10 Duct Valuation data was compiled, only 769 out of the total 5,592 of
the total exchanges in the network had been transformed onto BT‟s Physical Inventory
for Planning and eRecords (“PIPeR “) system. These exchanges formed the volume data
in the sample.
Background, approach and limitations
Adjustments were made to these exchanges to categorise assets in the „known‟ and
„found‟ network and to remove non-BT assets and errors which have been identified in
the system. The adjusted exchange data was then extrapolated to provide a national
valuation. Further adjustments were made at a national level for indexation, writeout
and accumulated depreciation.
Our approach considered four distinct stages in the sampling process. These stages form
the structure of this report as follows:
1. The source of volume and pricing data
2. Adjustments to the volume and pricing data
3. The sample valuation
4. The national valuation.
These phases are considered in further detail in 03. Observations.
01.1.4 Meeting and documentation
This report is based on documentation provided by BT under two s135 requests dated 1
November 2010 and 23 November 2010 and six meetings or conference calls of
approximately one hour duration with representatives from the following BT
departments:
• Group Regulatory Finance
• Internal audit
• Network Engineering Journey
• Network Engineering Programmers.
A full list of meetings is set out in Appendix A.1.
FINAL VERSION – NON-CONFIDENTIAL

02. EXECUTIVE SUMMARY
FINAL VERSION – NON-CONFIDENTIAL
6
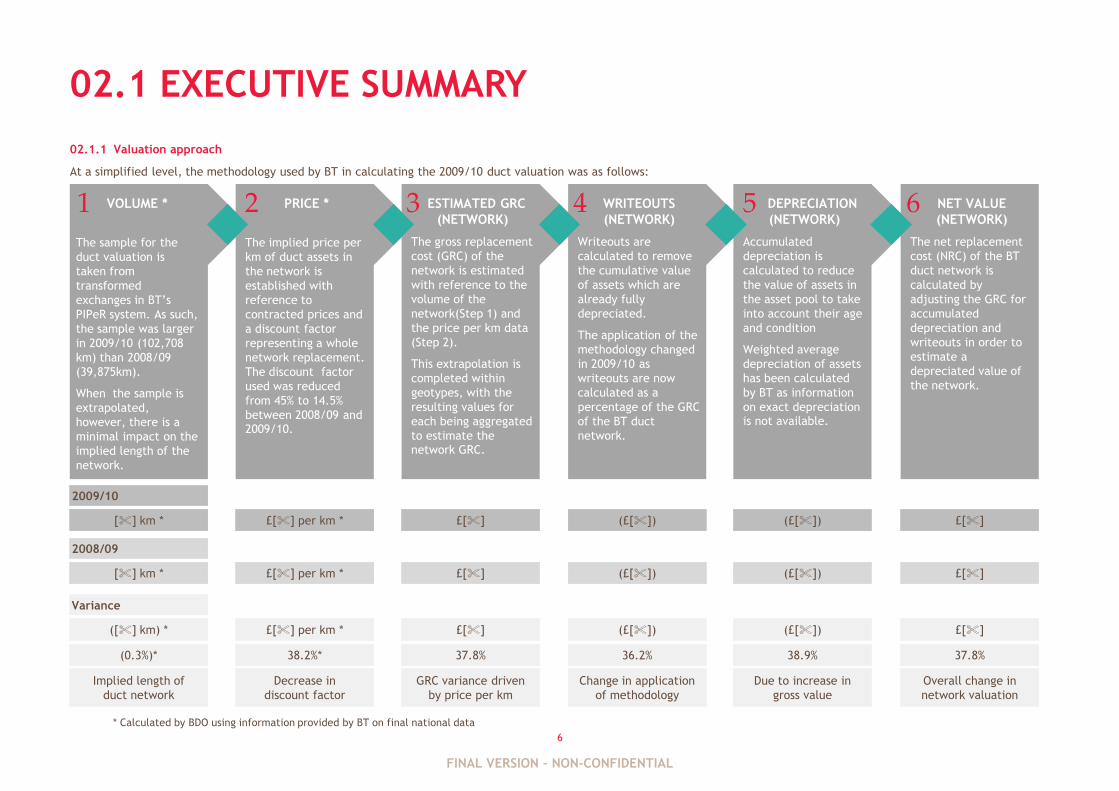
NET VALUE
(NETWORK)
The net replacement
cost (NRC) of the BT
duct network is
calculated by
adjusting the GRC for
accumulated
depreciation and
writeouts in order to
estimate a
depreciated value of
the network.
DEPRECIATION
(NETWORK)
Accumulated
depreciation is
calculated to reduce
the value of assets in
the asset pool to take
into account their age
and condition
Weighted average
depreciation of assets
has been calculated
by BT as information
on exact depreciation is not available.
WRITEOUTS
(NETWORK)
Writeouts are
calculated to remove
the cumulative value
of assets which are
already fully
depreciated.
The application of the
methodology changed
in 2009/10 as
writeouts are now
calculated as a
percentage of the GRC
of the BT duct
network.
ESTIMATED GRC
(NETWORK)
The gross replacement
cost (GRC) of the
network is estimated
with reference to the
volume of the
network(Step 1) and
the price per km data
(Step 2).
This extrapolation is
completed within
geotypes, with the
resulting values for
each being aggregated
to estimate the network GRC.
02.1 EXECUTIVE SUMMARY
02.1.1 Valuation approach
At a simplified level, the methodology used by BT in calculating the 2009/10 duct valuation was as follows:
VOLUME *
The sample for the
duct valuation is
taken from
transformed
exchanges in BT‟s
PIPeR system. As such,
the sample was larger
in 2009/10 (102,708
km) than 2008/09
(39,875km).
When the sample is
extrapolated,
however, there is a
minimal impact on the
implied length of the
network.
PRICE *
The implied price per
km of duct assets in
the network is
established with
reference to
contracted prices and
a discount factor
representing a whole
network replacement.
The discount factor
used was reduced
from 45% to 14.5%
between 2008/09 and 2009/10.
1 2 3 4 5 6
£[%](£[%])(£[%])£[%]£[%] per km *[%] km *
2009/10
£[%](£[%])(£[%])£[%]£[%] per km *[%] km *
2008/09
£[%](£[%])(£[%])£[%]£[%] per km *([%] km) *
Variance
37.8%38.9%36.2%37.8%38.2%*(0.3%)*
* Calculated by BDO using information provided by BT on final national data
Overall change in
network valuation
Due to increase in
gross value
Change in application
of methodology
GRC variance driven
by price per km
Decrease in
discount factor
Implied length of
duct network
FINAL VERSION – NON-CONFIDENTIAL
7
02.1 EXECUTIVE SUMMARY
02.1.2 The checks and controls operated by BT over the 2009/10 valuation process and
any difference in approach compared to the process used by BT in 2008/09
Checks and controls
At each step in the duct valuation methodology we looked at the supervisory checks and
controls which were in operation. We noted that the conversion process had several levels
of supervision and that BT‟s Internal Audit function has taken a proactive role with an
annual review of the key systems which provided the volume data for the 2009/10 Duct
Valuation.
Valuation best practice includes using alternative valuation methodologies as a formal
reasonableness test to sense check the results of the main valuation methodology. We
understand from our discussions with BT and from analysis of documentation provided, that
the duct network is valued through one methodology and are not aware that BT has
conducted a formal reasonableness test.
We did not, however, have visibility of any comparative methodologies that BT might have
used but not commented on within the documentation provided to us. This is an area in
which Ofcom may wish to seek additional information.
Valuation approach
During our review, a number of differences were identified between the 2008/09 and
2009/10 valuations. These included the source of pricing data and adjustments at both the
sample and national valuation stage.
The change considered to have had the largest material effect, when comparing the
2008/09 and 2009/10 valuations, was to determine the replacement cost of assets. This
change was comprised of two elements:
1. In 2008/09, component costs for individual assets were established on an average cost
of replacing each asset basis, with reference to the multiple regional contracts in force
at the time. In 2009/10, BT had entered into a single, national contract with Carillion-
Telent, so component costs were established with reference to this single contract only.
2. In 2008/09, the Discount Factor of 45% was based on the opinion of various expert
stakeholders in BT. In 2009/10, the lower Discount Factor of 14.5% was determined with
reference to current costs in the Carillion-Telent contract and a jointly analysed and
agreed assessment of overhead efficiencies by BT and Carillion-Telent.
02.1.3 The main sensitivities, estimates and judgements used in preparing the duct
CCA values for 2009/10 and an assessment of the reasonableness of these estimates and
judgements and how this differed from BT‟s approach in 2008/09
Sensitivities
The number of exchanges in the sample grew by 168% from 286 in 2008/09 to 769 in
2009/10. However, the total value of the sample grew by 244% from £[%] in 2008/09 to £
[%] in 2009/10. This change derives from the combination of two effects: the increase in
sample size and the decrease in discount. We note that the sample is made of a high
proportion of DPs of asset rich geotypes.
The main valuation drivers are the adjustments made at a national level after the sample
has been extrapolated. These include indexation, writeout and accumulated depreciation.
Estimates and judgements
In preparing its duct CCA values for 2008/09 and 2009/10, BT has been required to use a
number of estimates and judgements. The main estimates and judgements that BDO has
identified as part of this review are outlined as follows:
• Volume data: Whilst considered by BT to be appropriate for network planning purposes,
we do not consider the transformed data in PIPeR to be as reliable for the purposes of
the duct valuation, as there is no date information associated with the assets and, as
such, it is not possible to determine the age of the assets from PIPeR.
Although the lack of a detailed historic asset register is an inherited problem for BT and
is not a criticism of the duct valuation methodology itself, there is however, uncertainty
as to the completeness and accuracy of PIPeR‟s records of assets in the selected
exchanges. Areas of uncertainty include:
– Updating of unknown attributes
– Stitching of asset data
– Measured v calculated lengths.
The sample methodology is reliant on conversion rules and macros to migrate volume
data from the previous system to PIPeR and to cleanse the data. Examples include
adjustments for unknown attributes, measured and calculated lengths, removal of
planned work and post Distribution Point (“DP”), as well as pricing macros which are
used when the data is extracted from PIPeR.
FINAL VERSION – NON-CONFIDENTIAL
8
02.1 EXECUTIVE SUMMARY
BT has reported that, with the exception of the application of one specific rule which
was updated as a result of work performed by BT, the conversion rules and macros were
applied consistently in 2008/09 and 2009/10.
Without conducting our own audit testing, it is not possible for us to confirm this,
however, as the number of adjustments made makes it difficult to identify and quantify
the effect of any changes which may have been made.
• Indexation: This is used to align the historical cost of assets in the network with current
price levels for the purpose of calculating accumulated depreciation and writeouts. We
noted the following elements in BT‟s approach:
– The historic indexation figures in 2008/09 are partially not the same with the
2009/10 figures as BT estimates ONS inflation data not yet published. This data is
then amended to match the official ONS data in subsequent years. We have noted a
change in the calculation of post 1989 figures as it appears that these are not
calculated with the same weights used from 2007. This change could have an effect
on the comparability of the index between the various years.
– BT has communicated to us that the methodology for calculating indexation has
never changed. However, the calculations used for the duct valuation are based on
pre 1989 index values disclosed on the basis of a single value and post 1989
indexation values calculated as a weighted average of several other indices.
With historical assets in the sample, even small changes in indexation could have a
material effect. Due to the high inflation period in 1971-1980, any change on the
calculation methodology and on indexation inputs can amplify the effect on the current
calculation level of depreciation and writeouts.
• Accumulated depreciation: The total duct weighted average accumulated depreciation
is heavily dependent on the indexation factor, as many assets in the duct network have
been acquired during a high inflation period (1971-80) and indexation determines the
weight that older assets have with regards to the total asset pool. Any change in the
indexation approach can have a strong effect on the calculation of total duct network
depreciation as, for example, a 6% increase in accumulated depreciation is equivalent
to almost £900m absolute increase in depreciation for the 2009/10 valuation.
The value of the network is driven in part by the accounting depreciation percentage of
the total asset pool. As the age of the asset pool cannot be calculated directly, given
the lack of information regarding dates on PIPeR, it is calculated on the basis of
financial records as weighted average accumulated depreciation of indexed assets in the
fixed assets records.
• Writeouts: The Indexed Historic Cost Accounting (“HCA”) cumulative writeout
adjustment for 2008/09 was £[%]. The writeout methodology changed in 2009/10 to a
cumulative process, which BT considers to be more accurate. This was comprised of an
Indexed HCA writeout of £[%]and a proportionate adjustment of £[%].
The £[%] proportionate adjustment has been calculated as the difference between
indexed HCA and the cumulative proportion written out from the Gross Replacement
Cost. This value actually reduced the value of the duct network by £[%] in 2009/10 but
highlights the effect that a discretionary change in the calculation approach can have on
the valuation.
• Duct length: Extrapolating the length of the network using average length per DP gives a
distance of [%]m for 2008/09 and [%]m for 2009/10, a 0.3% reduction.
Whilst we are aware that BT maintains records of its network on its PRM and PIPeR
systems, for the purposes of network planning, it has not been confirmed whether these
or other systems provide details of the total length of the network. Should this be
available, assessment of information from BT‟s systems on total duct length in
comparison to the extrapolated duct lengths outlined above, may help to validate or
otherwise BT‟s 2009/10 duct valuation.
Knowing the total length of the network will enable BT to calculate a value of the
network through a top down approach, that could represent an alternative valuation
methodology and a possible formal reasonableness test.
FINAL VERSION – NON-CONFIDENTIAL
9
02.1 EXECUTIVE SUMMARY
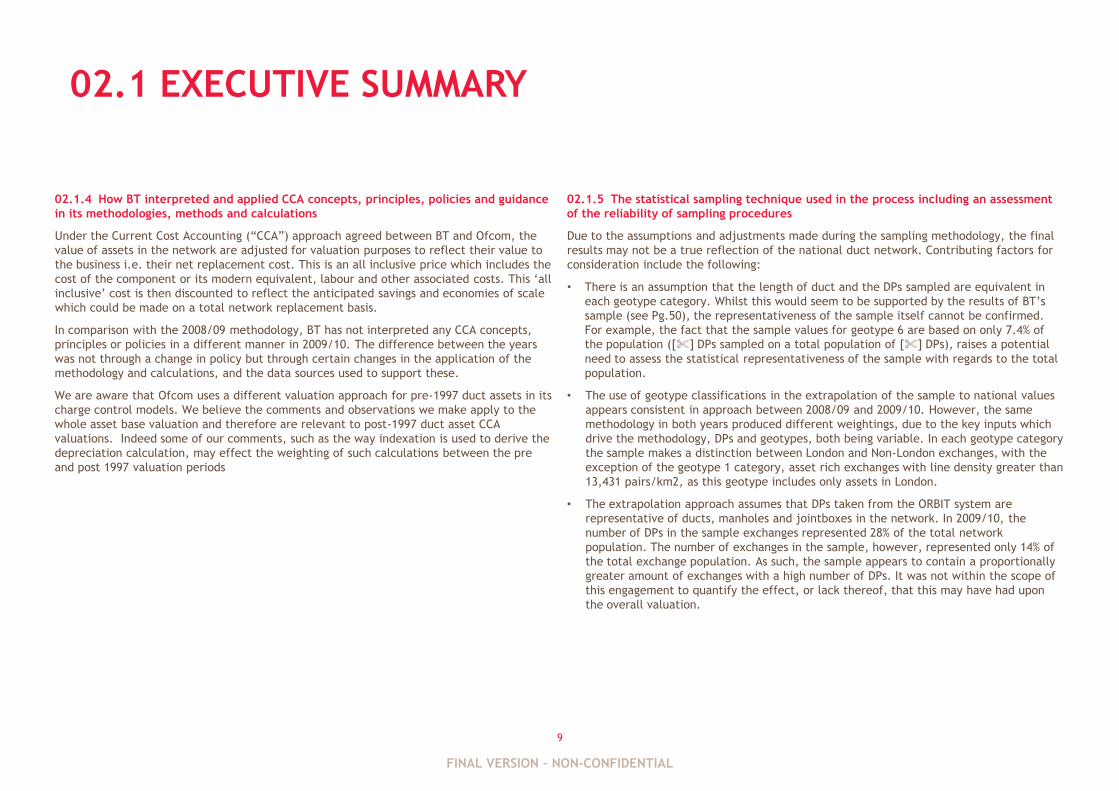
02.1.4 How BT interpreted and applied CCA concepts, principles, policies and guidance
in its methodologies, methods and calculations
Under the Current Cost Accounting (“CCA”) approach agreed between BT and Ofcom, the
value of assets in the network are adjusted for valuation purposes to reflect their value to
the business i.e. their net replacement cost. This is an all inclusive price which includes the
cost of the component or its modern equivalent, labour and other associated costs. This „all
inclusive‟ cost is then discounted to reflect the anticipated savings and economies of scale
which could be made on a total network replacement basis.
In comparison with the 2008/09 methodology, BT has not interpreted any CCA concepts,
principles or policies in a different manner in 2009/10. The difference between the years
was not through a change in policy but through certain changes in the application of the
methodology and calculations, and the data sources used to support these.
We are aware that Ofcom uses a different valuation approach for pre-1997 duct assets in its
charge control models. We believe the comments and observations we make apply to the
whole asset base valuation and therefore are relevant to post-1997 duct asset CCA
valuations. Indeed some of our comments, such as the way indexation is used to derive the
depreciation calculation, may effect the weighting of such calculations between the pre
and post 1997 valuation periods
02.1.5 The statistical sampling technique used in the process including an assessment
of the reliability of sampling procedures
Due to the assumptions and adjustments made during the sampling methodology, the final
results may not be a true reflection of the national duct network. Contributing factors for
consideration include the following:
• There is an assumption that the length of duct and the DPs sampled are equivalent in
each geotype category. Whilst this would seem to be supported by the results of BT‟s
sample (see Pg.50), the representativeness of the sample itself cannot be confirmed.
For example, the fact that the sample values for geotype 6 are based on only 7.4% of
the population ([%] DPs sampled on a total population of [%] DPs), raises a potential
need to assess the statistical representativeness of the sample with regards to the total
population.
• The use of geotype classifications in the extrapolation of the sample to national values
appears consistent in approach between 2008/09 and 2009/10. However, the same
methodology in both years produced different weightings, due to the key inputs which
drive the methodology, DPs and geotypes, both being variable. In each geotype category
the sample makes a distinction between London and Non-London exchanges, with the
exception of the geotype 1 category, asset rich exchanges with line density greater than
13,431 pairs/km2, as this geotype includes only assets in London.
• The extrapolation approach assumes that DPs taken from the ORBIT system are
representative of ducts, manholes and jointboxes in the network. In 2009/10, the
number of DPs in the sample exchanges represented 28% of the total network
population. The number of exchanges in the sample, however, represented only 14% of
the total exchange population. As such, the sample appears to contain a proportionally
greater amount of exchanges with a high number of DPs. It was not within the scope of
this engagement to quantify the effect, or lack thereof, that this may have had upon
the overall valuation.
FINAL VERSION – NON-CONFIDENTIAL
10
02.1 EXECUTIVE SUMMARY
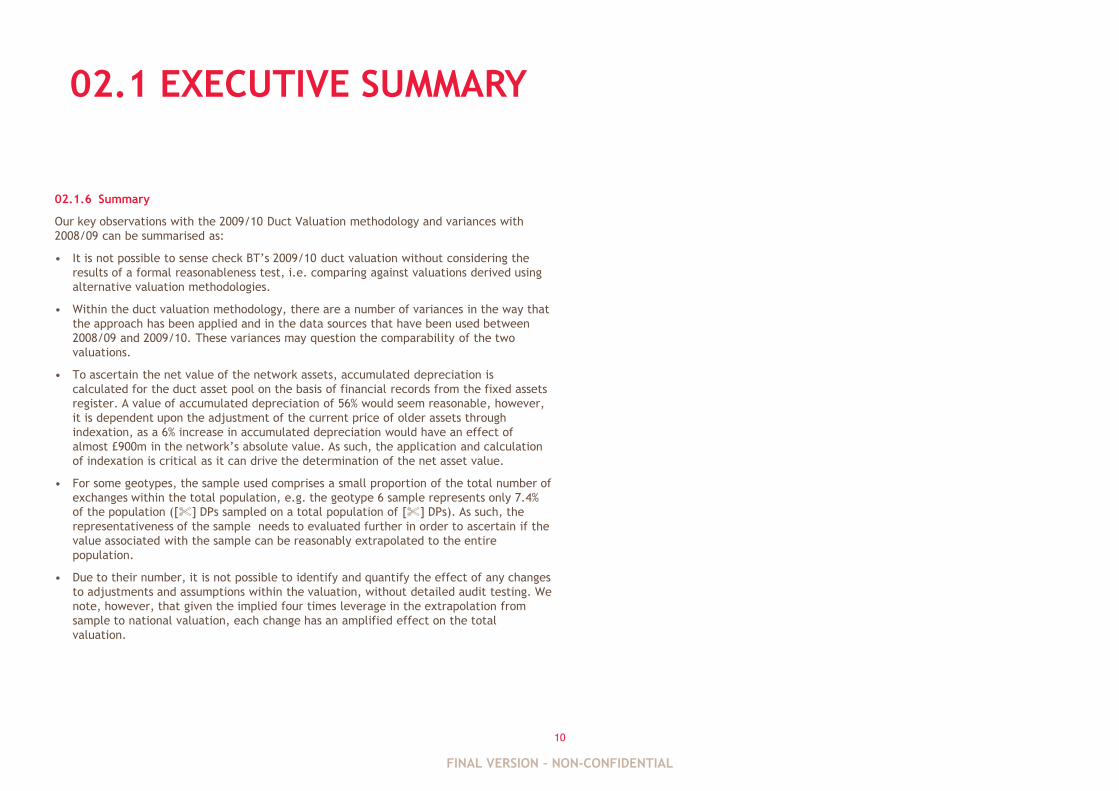
02.1.6 Summary
Our key observations with the 2009/10 Duct Valuation methodology and variances with
2008/09 can be summarised as:
• It is not possible to sense check BT‟s 2009/10 duct valuation without considering the
results of a formal reasonableness test, i.e. comparing against valuations derived using
alternative valuation methodologies.
• Within the duct valuation methodology, there are a number of variances in the way that
the approach has been applied and in the data sources that have been used between
2008/09 and 2009/10. These variances may question the comparability of the two
valuations.
• To ascertain the net value of the network assets, accumulated depreciation is
calculated for the duct asset pool on the basis of financial records from the fixed assets
register. A value of accumulated depreciation of 56% would seem reasonable, however,
it is dependent upon the adjustment of the current price of older assets through
indexation, as a 6% increase in accumulated depreciation would have an effect of
almost £900m in the network‟s absolute value. As such, the application and calculation
of indexation is critical as it can drive the determination of the net asset value.
• For some geotypes, the sample used comprises a small proportion of the total number of
exchanges within the total population, e.g. the geotype 6 sample represents only 7.4%
of the population ([%] DPs sampled on a total population of [%] DPs). As such, the
representativeness of the sample needs to evaluated further in order to ascertain if the
value associated with the sample can be reasonably extrapolated to the entire
population.
• Due to their number, it is not possible to identify and quantify the effect of any changes
to adjustments and assumptions within the valuation, without detailed audit testing. We
note, however, that given the implied four times leverage in the extrapolation from
sample to national valuation, each change has an amplified effect on the total
valuation.
FINAL VERSION – NON-CONFIDENTIAL

03. OBSERVATIONS
FINAL VERSION – NON-CONFIDENTIAL
12
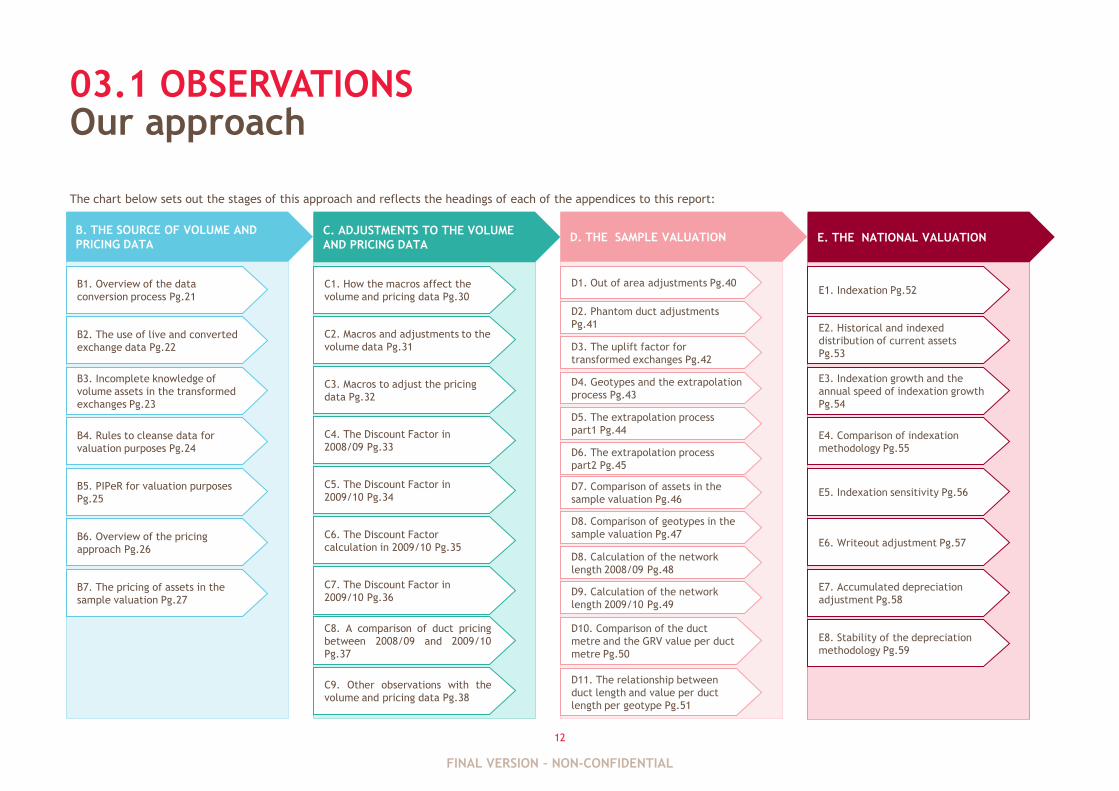
The chart below sets out the stages of this approach and reflects the headings of each of the appendices to this report:
03.1 OBSERVATIONSOur approach
C1. How the macros affect the
volume and pricing data Pg.30
C2. Macros and adjustments to the
volume data Pg.31
C3. Macros to adjust the pricing
data Pg.32
B1. Overview of the data
conversion process Pg.21
B2. The use of live and converted
exchange data Pg.22
B3. Incomplete knowledge of
volume assets in the transformed
exchanges Pg.23
B4. Rules to cleanse data for
valuation purposes Pg.24
B5. PIPeR for valuation purposes
Pg.25
B6. Overview of the pricing
approach Pg.26
B7. The pricing of assets in the
sample valuation Pg.27
B. THE SOURCE OF VOLUME AND
PRICING DATA C. ADJUSTMENTS TO THE VOLUME
AND PRICING DATA
C4. The Discount Factor in
2008/09 Pg.33
C5. The Discount Factor in
2009/10 Pg.34
C7. The Discount Factor in
2009/10 Pg.36
C8. A comparison of duct pricing
between 2008/09 and 2009/10
Pg.37
C9. Other observations with the
volume and pricing data Pg.38
D. THE SAMPLE VALUATION E. THE NATIONAL VALUATION
D5. The extrapolation process
part1 Pg.44
D1. Out of area adjustments Pg.40
D2. Phantom duct adjustments
Pg.41
D3. The uplift factor for
transformed exchanges Pg.42
D4. Geotypes and the extrapolation
process Pg.43
D7. Comparison of assets in the
sample valuation Pg.46
D8. Comparison of geotypes in the
sample valuation Pg.47
D8. Calculation of the network
length 2008/09 Pg.48
E1. Indexation Pg.52
E2. Historical and indexed
distribution of current assets
Pg.53
E3. Indexation growth and the
annual speed of indexation growth
Pg.54
E4. Comparison of indexation
methodology Pg.55
E5. Indexation sensitivity Pg.56
E6. Writeout adjustment Pg.57
E7. Accumulated depreciation
adjustment Pg.58
E8. Stability of the depreciation
methodology Pg.59
C6. The Discount Factor
calculation in 2009/10 Pg.35
D9. Calculation of the network
length 2009/10 Pg.49
D10. Comparison of the duct
metre and the GRV value per duct
metre Pg.50
D11. The relationship between
duct length and value per duct
length per geotype Pg.51
D6. The extrapolation process
part2 Pg.45
FINAL VERSION – NON-CONFIDENTIAL
13
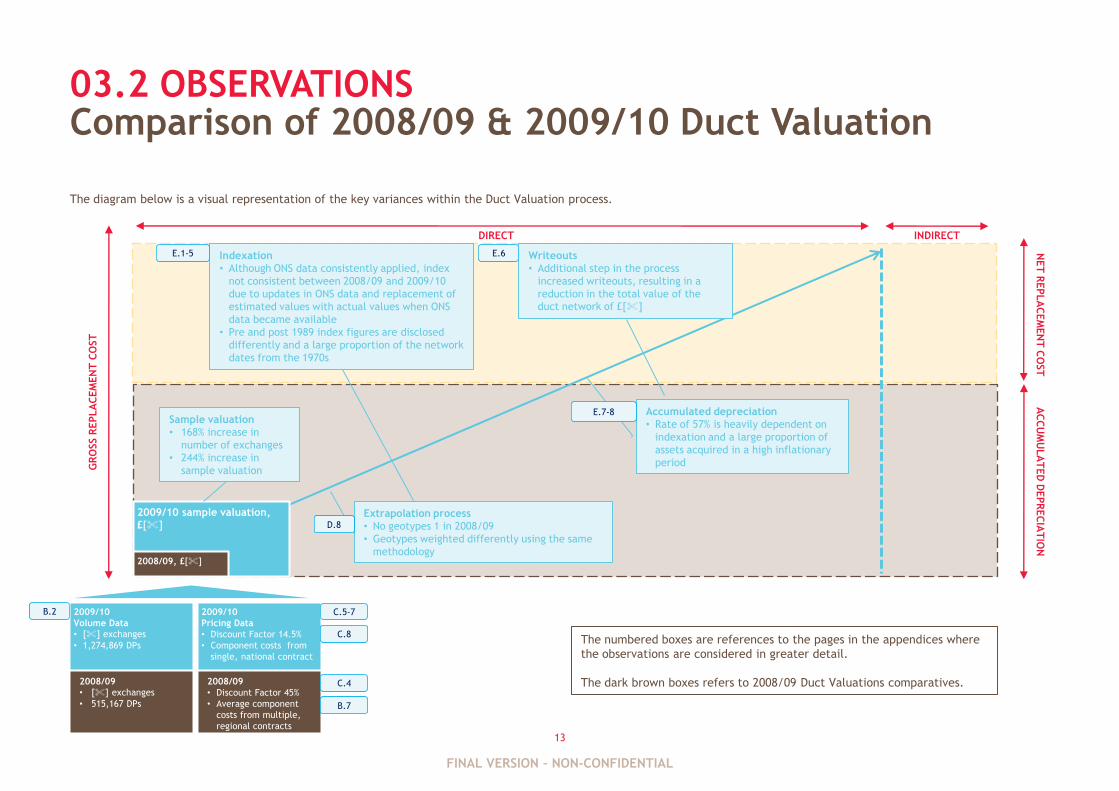
The diagram below is a visual representation of the key variances within the Duct Valuation process.
03.2 OBSERVATIONSComparison of 2008/09 & 2009/10 Duct Valuation
Indexation
• Although ONS data consistently applied, index
not consistent between 2008/09 and 2009/10
due to updates in ONS data and replacement of
estimated values with actual values when ONS
data became available
• Pre and post 1989 index figures are disclosed
differently and a large proportion of the network
dates from the 1970s
Writeouts
• Additional step in the process
increased writeouts, resulting in a
reduction in the total value of the
duct network of £[%]
Accumulated depreciation
• Rate of 57% is heavily dependent on
indexation and a large proportion of
assets acquired in a high inflationary
periodGR
OSS R
EPLA
CEM
EN
T C
OST
AC
CU
MU
LA
TED
DEPR
EC
IAT
ION
NET
REPLA
CEM
EN
T C
OST
2009/10 sample valuation,
£[%]
2008/09, £[%]
2009/10
Pricing Data
• Discount Factor 14.5%
• Component costs from
single, national contract
2008/09
• Discount Factor 45%
• Average component
costs from multiple,
regional contracts
2009/10
Volume Data
• [%] exchanges
• 1,274,869 DPs
2008/09
• [%] exchanges
• 515,167 DPs
DIRECT INDIRECT
The numbered boxes are references to the pages in the appendices where
the observations are considered in greater detail.
The dark brown boxes refers to 2008/09 Duct Valuations comparatives.
C.5-7B.2
B.7
C.4
C.8
E.1-5 E.6
E.7-8Sample valuation
• 168% increase in
number of exchanges
• 244% increase in
sample valuation
Extrapolation process
• No geotypes 1 in 2008/09
• Geotypes weighted differently using the same
methodology
D.8
FINAL VERSION – NON-CONFIDENTIAL
14
03.3 OBSERVATIONS
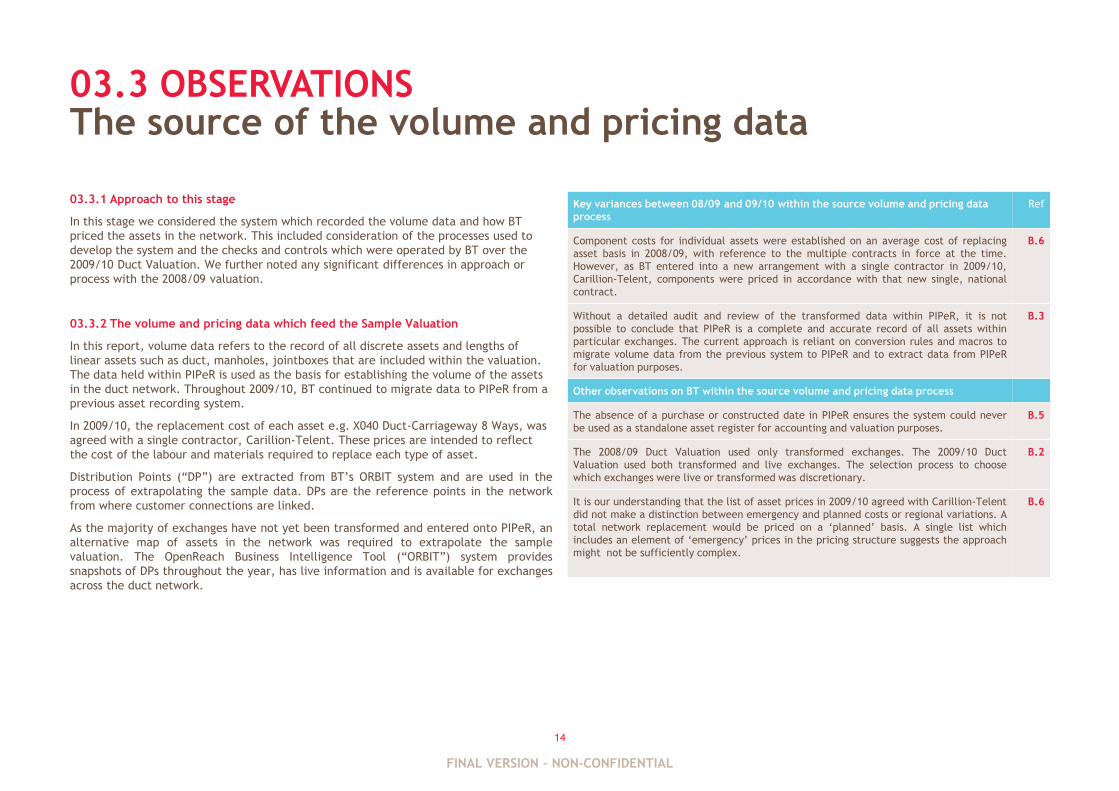
03.3.1 Approach to this stage
In this stage we considered the system which recorded the volume data and how BT
priced the assets in the network. This included consideration of the processes used to
develop the system and the checks and controls which were operated by BT over the
2009/10 Duct Valuation. We further noted any significant differences in approach or
process with the 2008/09 valuation.
03.3.2 The volume and pricing data which feed the Sample Valuation
In this report, volume data refers to the record of all discrete assets and lengths of
linear assets such as duct, manholes, jointboxes that are included within the valuation.
The data held within PIPeR is used as the basis for establishing the volume of the assets
in the duct network. Throughout 2009/10, BT continued to migrate data to PIPeR from a
previous asset recording system.
In 2009/10, the replacement cost of each asset e.g. X040 Duct-Carriageway 8 Ways, was
agreed with a single contractor, Carillion-Telent. These prices are intended to reflect
the cost of the labour and materials required to replace each type of asset.
Distribution Points (“DP”) are extracted from BT‟s ORBIT system and are used in the
process of extrapolating the sample data. DPs are the reference points in the network
from where customer connections are linked.
As the majority of exchanges have not yet been transformed and entered onto PIPeR, an
alternative map of assets in the network was required to extrapolate the sample
valuation. The OpenReach Business Intelligence Tool (“ORBIT”) system provides
snapshots of DPs throughout the year, has live information and is available for exchanges
across the duct network.
The source of the volume and pricing data
Key variances between 08/09 and 09/10 within the source volume and pricing data
process
Ref
Component costs for individual assets were established on an average cost of replacing
asset basis in 2008/09, with reference to the multiple contracts in force at the time.
However, as BT entered into a new arrangement with a single contractor in 2009/10,
Carillion-Telent, components were priced in accordance with that new single, national
contract.
B.6
Without a detailed audit and review of the transformed data within PIPeR, it is not
possible to conclude that PIPeR is a complete and accurate record of all assets within
particular exchanges. The current approach is reliant on conversion rules and macros to
migrate volume data from the previous system to PIPeR and to extract data from PIPeR
for valuation purposes.
B.3
Other observations on BT within the source volume and pricing data process
The absence of a purchase or constructed date in PIPeR ensures the system could never
be used as a standalone asset register for accounting and valuation purposes.
B.5
The 2008/09 Duct Valuation used only transformed exchanges. The 2009/10 Duct
Valuation used both transformed and live exchanges. The selection process to choose
which exchanges were live or transformed was discretionary.
B.2
It is our understanding that the list of asset prices in 2009/10 agreed with Carillion-Telent
did not make a distinction between emergency and planned costs or regional variations. A
total network replacement would be priced on a „planned‟ basis. A single list which
includes an element of „emergency‟ prices in the pricing structure suggests the approach
might not be sufficiently complex.
B.6
FINAL VERSION – NON-CONFIDENTIAL
15
03.4 OBSERVATIONS
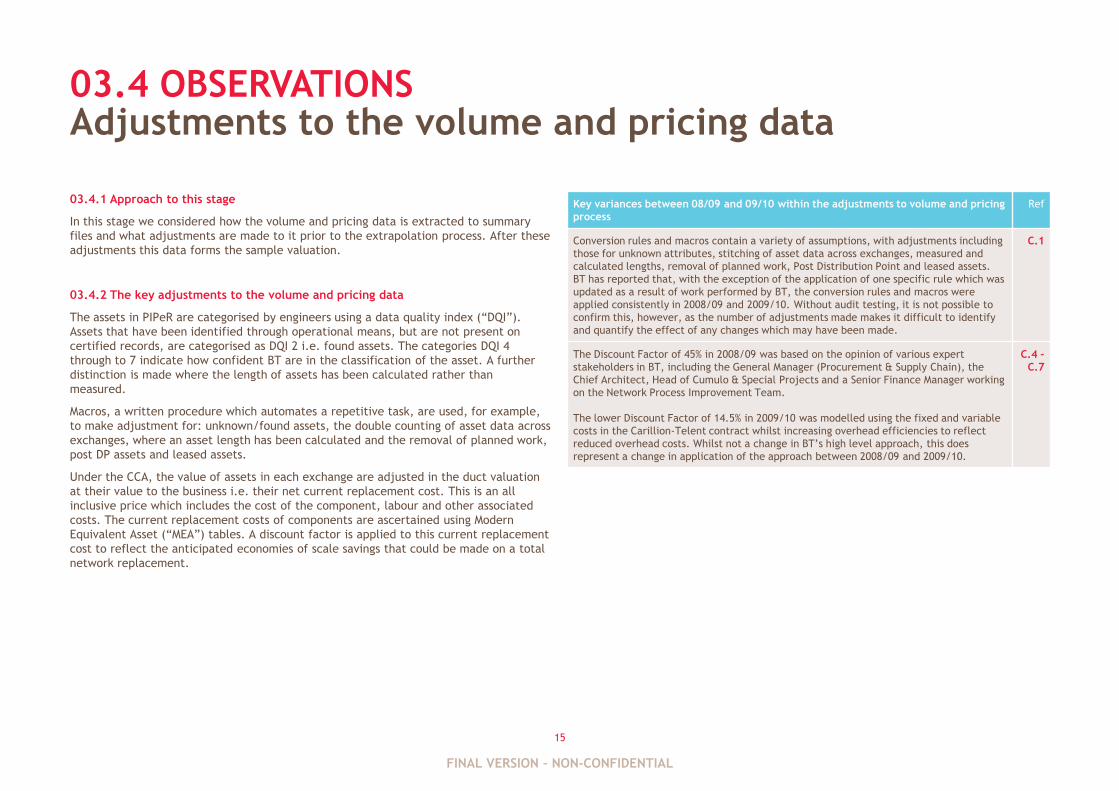
03.4.1 Approach to this stage
In this stage we considered how the volume and pricing data is extracted to summary
files and what adjustments are made to it prior to the extrapolation process. After these
adjustments this data forms the sample valuation.
03.4.2 The key adjustments to the volume and pricing data
The assets in PIPeR are categorised by engineers using a data quality index (“DQI”).
Assets that have been identified through operational means, but are not present on
certified records, are categorised as DQI 2 i.e. found assets. The categories DQI 4
through to 7 indicate how confident BT are in the classification of the asset. A further
distinction is made where the length of assets has been calculated rather than
measured.
Macros, a written procedure which automates a repetitive task, are used, for example,
to make adjustment for: unknown/found assets, the double counting of asset data across
exchanges, where an asset length has been calculated and the removal of planned work,
post DP assets and leased assets.
Under the CCA, the value of assets in each exchange are adjusted in the duct valuation
at their value to the business i.e. their net current replacement cost. This is an all
inclusive price which includes the cost of the component, labour and other associated
costs. The current replacement costs of components are ascertained using Modern
Equivalent Asset (“MEA”) tables. A discount factor is applied to this current replacement
cost to reflect the anticipated economies of scale savings that could be made on a total
network replacement.
Adjustments to the volume and pricing data
Key variances between 08/09 and 09/10 within the adjustments to volume and pricing
process
Ref
Conversion rules and macros contain a variety of assumptions, with adjustments including
those for unknown attributes, stitching of asset data across exchanges, measured and
calculated lengths, removal of planned work, Post Distribution Point and leased assets.
BT has reported that, with the exception of the application of one specific rule which was
updated as a result of work performed by BT, the conversion rules and macros were
applied consistently in 2008/09 and 2009/10. Without audit testing, it is not possible to
confirm this, however, as the number of adjustments made makes it difficult to identify
and quantify the effect of any changes which may have been made.
C.1
The Discount Factor of 45% in 2008/09 was based on the opinion of various expert
stakeholders in BT, including the General Manager (Procurement & Supply Chain), the
Chief Architect, Head of Cumulo & Special Projects and a Senior Finance Manager working
on the Network Process Improvement Team.
The lower Discount Factor of 14.5% in 2009/10 was modelled using the fixed and variable
costs in the Carillion-Telent contract whilst increasing overhead efficiencies to reflect
reduced overhead costs. Whilst not a change in BT‟s high level approach, this does
represent a change in application of the approach between 2008/09 and 2009/10.
C.4 –
C.7
FINAL VERSION – NON-CONFIDENTIAL
16
03.5 OBSERVATIONS
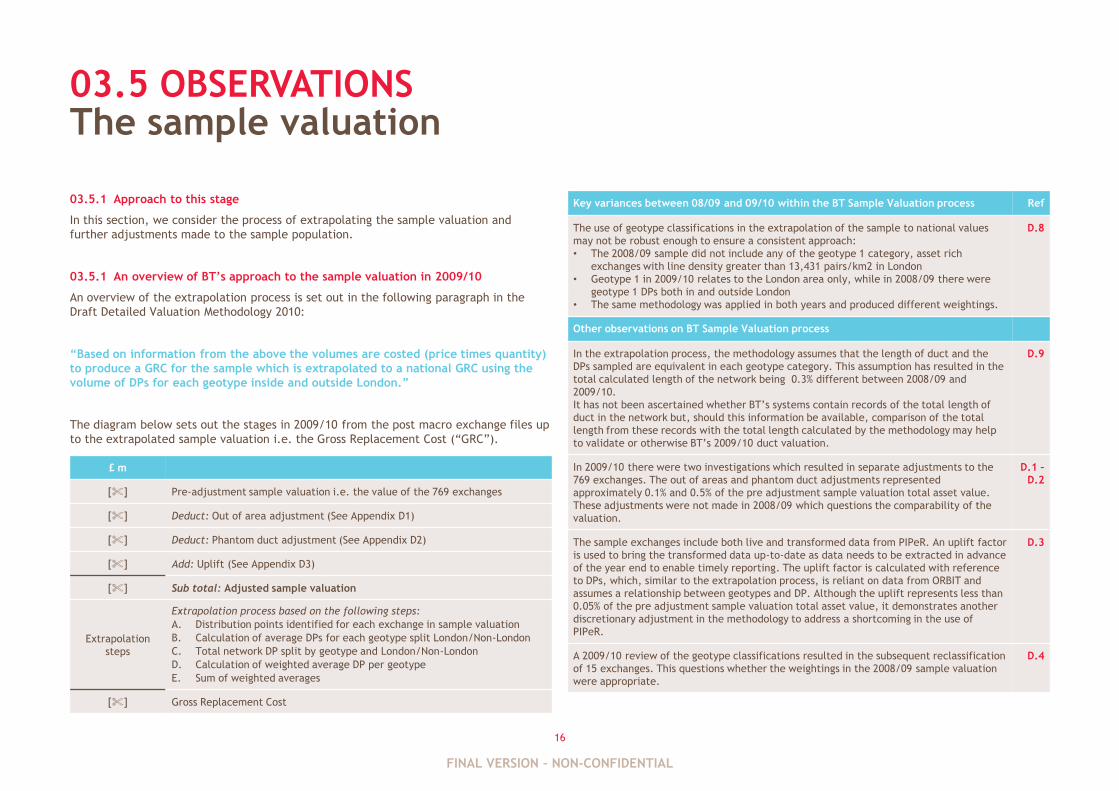
03.5.1 Approach to this stage
In this section, we consider the process of extrapolating the sample valuation and
further adjustments made to the sample population.
03.5.1 An overview of BT‟s approach to the sample valuation in 2009/10
An overview of the extrapolation process is set out in the following paragraph in the
Draft Detailed Valuation Methodology 2010:
“Based on information from the above the volumes are costed (price times quantity)
to produce a GRC for the sample which is extrapolated to a national GRC using the
volume of DPs for each geotype inside and outside London.”
The diagram below sets out the stages in 2009/10 from the post macro exchange files up
to the extrapolated sample valuation i.e. the Gross Replacement Cost (“GRC”).
The sample valuation
Key variances between 08/09 and 09/10 within the BT Sample Valuation process Ref
The use of geotype classifications in the extrapolation of the sample to national values
may not be robust enough to ensure a consistent approach:
• The 2008/09 sample did not include any of the geotype 1 category, asset rich
exchanges with line density greater than 13,431 pairs/km2 in London
• Geotype 1 in 2009/10 relates to the London area only, while in 2008/09 there were
geotype 1 DPs both in and outside London
• The same methodology was applied in both years and produced different weightings.
D.8
Other observations on BT Sample Valuation process
In the extrapolation process, the methodology assumes that the length of duct and the
DPs sampled are equivalent in each geotype category. This assumption has resulted in the
total calculated length of the network being 0.3% different between 2008/09 and
2009/10.
It has not been ascertained whether BT‟s systems contain records of the total length of
duct in the network but, should this information be available, comparison of the total
length from these records with the total length calculated by the methodology may help
to validate or otherwise BT‟s 2009/10 duct valuation.
D.9
In 2009/10 there were two investigations which resulted in separate adjustments to the
769 exchanges. The out of areas and phantom duct adjustments represented
approximately 0.1% and 0.5% of the pre adjustment sample valuation total asset value.
These adjustments were not made in 2008/09 which questions the comparability of the
valuation.
D.1 –
D.2
The sample exchanges include both live and transformed data from PIPeR. An uplift factor
is used to bring the transformed data up-to-date as data needs to be extracted in advance
of the year end to enable timely reporting. The uplift factor is calculated with reference
to DPs, which, similar to the extrapolation process, is reliant on data from ORBIT and
assumes a relationship between geotypes and DP. Although the uplift represents less than
0.05% of the pre adjustment sample valuation total asset value, it demonstrates another
discretionary adjustment in the methodology to address a shortcoming in the use of
PIPeR.
D.3
A 2009/10 review of the geotype classifications resulted in the subsequent reclassification
of 15 exchanges. This questions whether the weightings in the 2008/09 sample valuation
were appropriate.
D.4
£ m
[%] Pre-adjustment sample valuation i.e. the value of the 769 exchanges
[%] Deduct: Out of area adjustment (See Appendix D1)
[%] Deduct: Phantom duct adjustment (See Appendix D2)
[%] Add: Uplift (See Appendix D3)
[%] Sub total: Adjusted sample valuation
Extrapolation
steps
Extrapolation process based on the following steps:
A. Distribution points identified for each exchange in sample valuation
B. Calculation of average DPs for each geotype split London/Non-London
C. Total network DP split by geotype and London/Non-London
D. Calculation of weighted average DP per geotype
E. Sum of weighted averages
[%] Gross Replacement Cost
FINAL VERSION – NON-CONFIDENTIAL
17
03.6 OBSERVATIONS
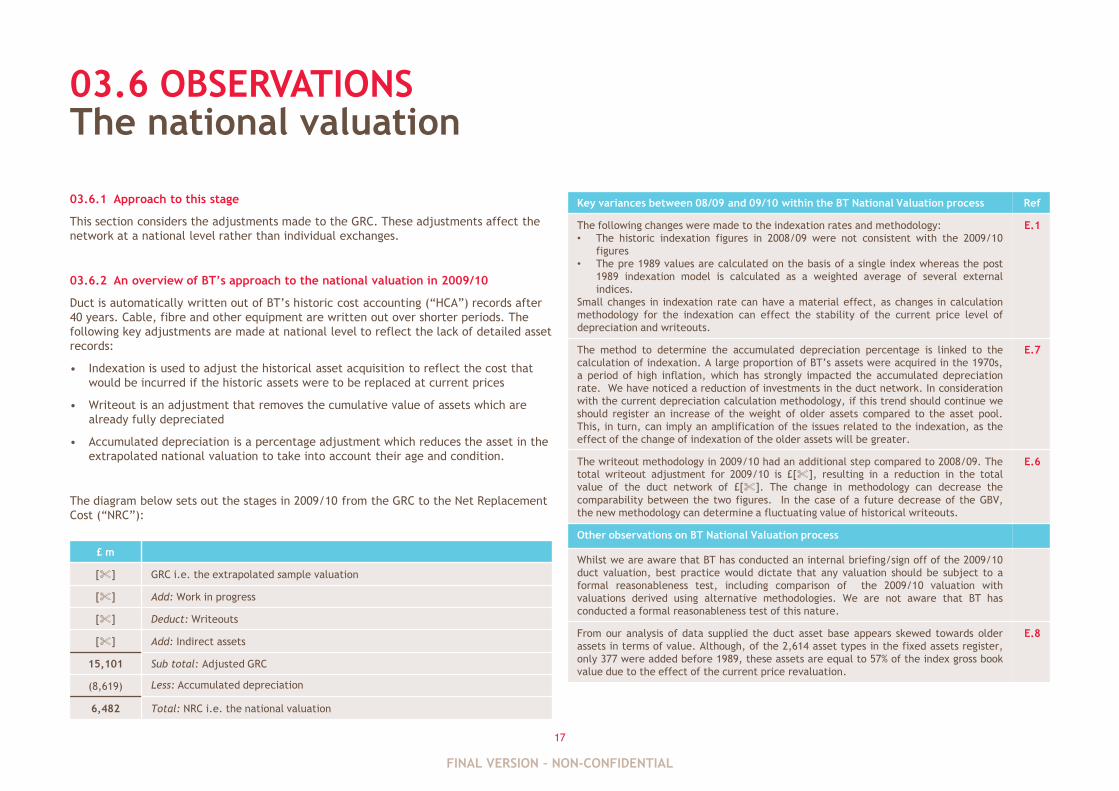
03.6.1 Approach to this stage
This section considers the adjustments made to the GRC. These adjustments affect the
network at a national level rather than individual exchanges.
03.6.2 An overview of BT‟s approach to the national valuation in 2009/10
Duct is automatically written out of BT‟s historic cost accounting (“HCA”) records after
40 years. Cable, fibre and other equipment are written out over shorter periods. The
following key adjustments are made at national level to reflect the lack of detailed asset
records:
• Indexation is used to adjust the historical asset acquisition to reflect the cost that
would be incurred if the historic assets were to be replaced at current prices
• Writeout is an adjustment that removes the cumulative value of assets which are
already fully depreciated
• Accumulated depreciation is a percentage adjustment which reduces the asset in the
extrapolated national valuation to take into account their age and condition.
The diagram below sets out the stages in 2009/10 from the GRC to the Net Replacement
Cost (“NRC”):
The national valuation
Key variances between 08/09 and 09/10 within the BT National Valuation process Ref
The following changes were made to the indexation rates and methodology:
• The historic indexation figures in 2008/09 were not consistent with the 2009/10
figures
• The pre 1989 values are calculated on the basis of a single index whereas the post
1989 indexation model is calculated as a weighted average of several external
indices.
Small changes in indexation rate can have a material effect, as changes in calculation
methodology for the indexation can effect the stability of the current price level of
depreciation and writeouts.
E.1
The method to determine the accumulated depreciation percentage is linked to the
calculation of indexation. A large proportion of BT‟s assets were acquired in the 1970s,
a period of high inflation, which has strongly impacted the accumulated depreciation
rate. We have noticed a reduction of investments in the duct network. In consideration
with the current depreciation calculation methodology, if this trend should continue we
should register an increase of the weight of older assets compared to the asset pool.
This, in turn, can imply an amplification of the issues related to the indexation, as the
effect of the change of indexation of the older assets will be greater.
E.7
The writeout methodology in 2009/10 had an additional step compared to 2008/09. The
total writeout adjustment for 2009/10 is £[%], resulting in a reduction in the total
value of the duct network of £[%]. The change in methodology can decrease the
comparability between the two figures. In the case of a future decrease of the GBV,
the new methodology can determine a fluctuating value of historical writeouts.
E.6
Other observations on BT National Valuation process
Whilst we are aware that BT has conducted an internal briefing/sign off of the 2009/10
duct valuation, best practice would dictate that any valuation should be subject to a
formal reasonableness test, including comparison of the 2009/10 valuation with
valuations derived using alternative methodologies. We are not aware that BT has
conducted a formal reasonableness test of this nature.
From our analysis of data supplied the duct asset base appears skewed towards older
assets in terms of value. Although, of the 2,614 asset types in the fixed assets register,
only 377 were added before 1989, these assets are equal to 57% of the index gross book
value due to the effect of the current price revaluation.
E.8
£ m
[%] GRC i.e. the extrapolated sample valuation
[%] Add: Work in progress
[%] Deduct: Writeouts
[%] Add: Indirect assets
15,101 Sub total: Adjusted GRC
(8,619) Less: Accumulated depreciation
6,482 Total: NRC i.e. the national valuation
FINAL VERSION – NON-CONFIDENTIAL
APPENDIX ADATES OF MEETINGS WITH BT STAKEHOLDERS
FINAL VERSION – NON-CONFIDENTIAL

19
A.1 MEETINGS
A.1.1 Meetings
During the course of this engagement, BDO conducted six fact finding meetings or
conference calls of approximately one hour duration with representatives from a number
of BT departments. The following table sets out the dates and names of the BT
stakeholders interviewed during the course of this project:
In addition to the above, a number of additional conference calls were held with BT to
confirm the factual accuracy of a number of points within this report.
Meetings with BT stakeholders
Name Department Date of meeting
[%] Group Regulatory Finance 2 November 2010
12 November 2010
11 November 2010
15 November 2010
3 December 2010
[%] and
[%]
Network Engineering Journey 11 November 2010
[%] Internal Audit 12 November 2010
[%] and
[%]
Network Engineering
Programmers
10 November 2010
FINAL VERSION – NON-CONFIDENTIAL

APPENDIX BTHE SOURCE OF THE VOLUME AND PRICING DATA
FINAL VERSION – NON-CONFIDENTIAL
21
B.1 THE SOURCE OF THE VOLUME AND PRICING DATA
B.1.1 Overview of the data conversion process and systems
The previous system which recorded exchange assets and attributes was Planned Record
Maintenance (“PRM”). In 2007/08 BT commenced a migration process to a new system to
enable „live‟ reporting from the duct network. The new system Physical Inventory for
Planning and eRecords system (“PIPeR“) enables the latest network configuration to be
used as the basis of reporting.
B.1.2 The process of migration data
The transformation work has been outsourced to a number of suppliers, all based in
India, known as a Data Conversion Vendors (“DCVs”).
The DCVs use information from PRM and from Ordnance Survey to create detailed
Exchange maps. A set of controlled conversion rules were agreed between BT and the
DCVs, to regulate quality and consistency in the data transformation process.
All the data held within PIPeR, and used in the sample valuation, has been through the
data transformation process. The transformation process occurred on an exchange by
exchange basis which meant that by the time the 2009/10 Duct Valuation was run only
13.7% of the exchanges in the duct network had been transformed.
B.1.3 Changes between 2008/09 and 2009/10
We understand that the rules to convert the PRM records to the format accepted by
PIPeR did not change from 2008/09 to 2009/10.
We further understand that the number of DCVs has reduced to two, having previously
been four. The reduction in the number of DCVs has been due to change in BT‟s
operational strategy and budget and not deficiencies in particular DCVs output.
B.1.4 Timetable for conversion
There is currently no timetable to convert all of the exchanges from PRM to PIPeR.
Overview of the data conversion process
B.1.5 Quality control procedures in the conversion process
Once the exchange data has been converted by a DCV, a BT team in Aylesbury, UK
undertake both validation and acceptance procedures on the data. At this time the data
is not „live‟ on PIPeR but is held in a „Pre-production environment‟
We understand that supplementary quality control procedures are also undertaken by
the DCV themselves and BT‟s eRecords team.
B.1.6 Exchanges loaded within a certain time
We understand that on average it takes approximately 4 to 6 weeks to fully undertake
the validation and acceptance procedures for each exchange. The time taken to convert
data from PRM to PIPeR depends on the number of DPs.
We understand that there have been delays in the conversion process for certain
exchanges. The main reasons for the transformation delays include:
• If an exchange was being converted in a new region which had not previously been
reviewed, there may have been regional variations in the way assets had been
recorded. To convert the data, new macros and/or conversion rules would need to be
written and reviewed; and
• If a new DCV had been instructed by BT there would be operational, reporting and
quality procedures to be established.
B.1.7 The volume of exchanges converted in 2008/09 and 2009/10
At the year end 2008/09 there were 286 completely converted exchanges.
We understand that the conversion of exchanges from PRM to PIPeR was accelerated in
2009/10 due to the roll out of the Next Generation Access programme (“NGA”).
The effect of this programme in 2009/10 was to focus the order in which exchanges
were transformed. We understand that the exchanges where NGA was being rolled out
tended to be asset rich urban areas, however, several rural areas such as Cornwall were
also converted.
At the year end 2009/10 there were 769 completely converted exchanges out of a total
of 5,592 exchanges in the total duct network.
FINAL VERSION – NON-CONFIDENTIAL
22
B.2 THE SOURCE OF THE VOLUME AND PRICING DATA
B.2.1 The data conversion process in 2008/09
The sample valuation in 2008/09 only used data from transformed exchanges. Transformed data, is data held in a pre-production environment within PIPeR but not live i.e.
available for planners and eRecords staff to use on a daily basis to plan and maintain the network. The 2008/09 duct valuation did not include any „live‟ information from PIPeR.
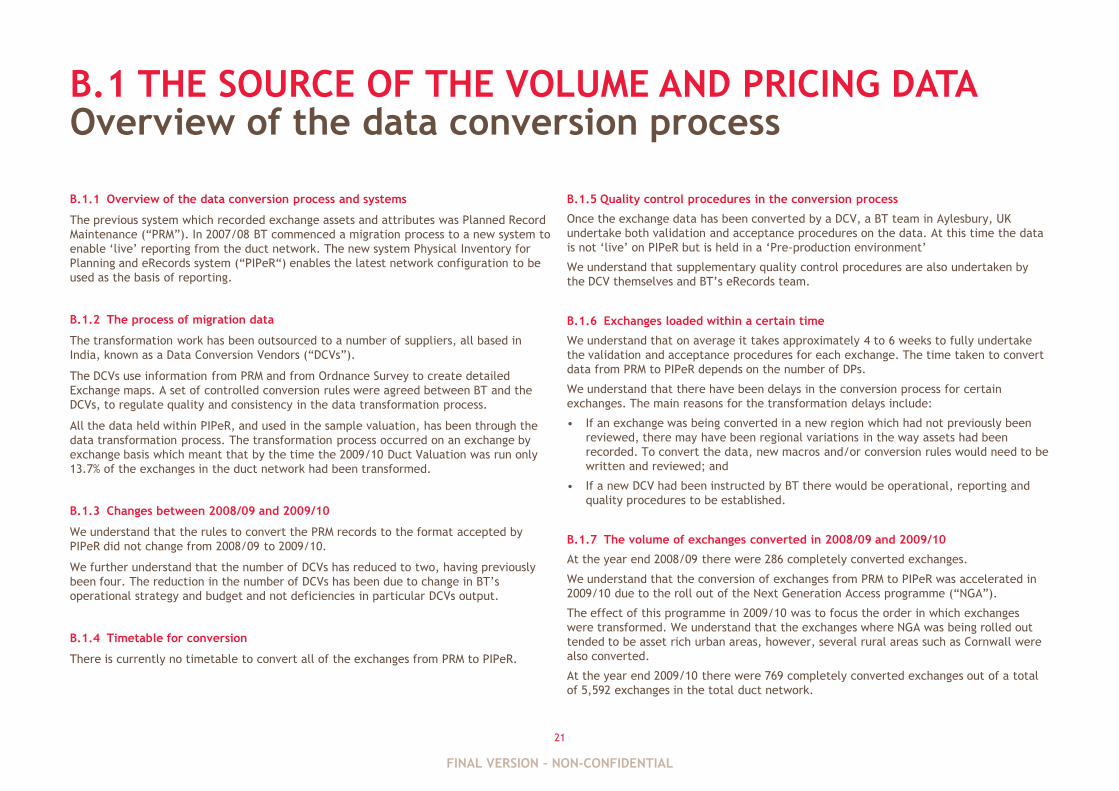
B.2.2 The data conversion process in 2009/10
The 2009/10 Duct Valuation used a combination of transformed data, held in a pre-production environment, and live data extracted from PIPeR. The simplified process is set out
below:
B.2.3 Explanation for the combined approach in 2009/10
For each converted exchange a „transformed‟ and „live‟ file exists. We understand that to extract a live file from PIPeR takes considerable time and computing power. We
understand that it takes approximately 15 minutes to process each exchange. However, due to the volume of exchanges to be run, a pragmatic decision was made to use a mixture
of recently transformed exchanges and live exchanges.
The use of live and converted exchange data
PLANNED RECORD MAINTENANCE
DATA CONVERSION VENDORS
439 TRANSFORMED
EXCHANGES
330 LIVE
EXCHANGES
2009/10 SAMPLE
TOTAL 769 EXCHANGES
PRE 2007/08 RECORDS SYSTEM CONVERSION PROCESS
PRE PRODUCTION ENVIRONMENT
(NOT LIVE DATA) LIVE DATA
B.2.4 Effect on the 2009/10 Duct Valuation
The selection process in 2009/10 to determine which exchange data was from live or transformed exchanges in the 2009/10 sample valuation was discretionary.
We understand that there would be minor differences in the sample exchanges if they were run using live or transformed exchanges. We further understand that if the sample
valuation was run using only live exchanges it would eliminate the out of area adjustment but increase the magnitude of the Phantom Duct adjustment and vice versa.
This report has not determined the effect on the sample valuation of using 100% live or transformed exchanges.
FINAL VERSION – NON-CONFIDENTIAL
23
B.3 THE SOURCE OF THE VOLUME AND PRICING DATA
B.3.1 Incomplete knowledge in the transformed exchanges
The transformed data recorded in PIPeR is not a complete and accurate register of all
assets in the particular exchanges. We accept that the lack of a detailed historic asset
register is an inherited problem for BT and is not a criticism of the duct valuation
methodology.
The following paragraphs from the Draft Asset Valuation Reporting Approach report note
significant areas of uncertainty in the individual transformed exchanges:
“Updating of unknown attributes
Separate from new network growth, existing assets will be updated as and when field
surveys visit an area and may either (a) confirm or correct attributes (b) verify
inferred assets changing them from DQI 4-6 to DQI 1 or 2. These subtle changes may
result in fewer “median average” values being applied to JBs and MHs, counts or
lengths being adjusted etc.
Stitching of asset data
As Data Transformation is performed on an exchange by exchange “mosaic” basis,
some assets belonging to a neighbouring exchange appear “over the border”. The
reasons why such situations arise is often due to operational necessities. A final part
of the data transformation process is to stitch together such assets. This can typically
involve the repositioning of an item of equipment and the possible removal of a
duplicate item. Minor adjustments in lengths and asset counts can create minor
distortions in the subsequent valuation.
Measured v calculated lengths
On some records the measured lengths of assets (duct) are stated. If these were
present they will be captured as part of the data transformation process. Where this
information is not present the system will automatically calculate a length. As part of
the build process any deviations from plan should be returned as part of the certified
record and the system updated accordingly. Such situations can extend as well as
reduce the length of assets recorded.”
Incomplete knowledge of volume assets in the transformed exchanges
B.3.2 Effect on the 2009/10 Duct Valuation
It is BT‟s core assumption that the transformed exchange information in PIPeR is
representative of the assets across the entire network. However, as the example
paragraphs set out, within each exchange in the sample valuation there may be
uncertainty and assumptions of its actual asset position.
It was not within the scope of this report to quantify the effect of these uncertainties
on the exchanges in the sample valuation.
The scale of assumptions and adjustments which affect the sample data, such as the
examples opposite, make minor changes in the approach difficult to identify.
However, the effect of small scale incomplete or estimated volumes in individual
transformed exchanges may have a more material effect when the sample valuation is
extrapolated.
FINAL VERSION – NON-CONFIDENTIAL
24
B.4 THE SOURCE OF THE VOLUME AND PRICING DATA
B.4.1 Overview of the cleansing process
We understand that at the outset of the conversion process it was identified that the
exchange data from the previous system, PRM, had not been recorded on a consistent
basis. For example, the same type of assets may have been recorded differently in
different regions across the country. To ensure the integrity of the data extracted from
PIPeR for valuation purposes, a cleansing process was implemented which applied a set
of logical rules to joint boxes, manholes, duct and metallic cables.
B.4.2 Example of the cleansing process rules
The „Draft Asset Valuation Reporting Approach‟ report sets out the following examples of
rules to cleanse data used for the valuation:
“Rules used to cleanse data take several forms, including but not limited to:
• The standardisation of variations found in key attributes (e.g. JBF26, J26,
JF26 = JB26).
• The removal of white space, standardisation of punctuation & capitalisation.
• Correction of transposition (e.g. JCR = JRC) and legibility errors (BO = B0).
• Excessive lengths of duct.
• Excessive number of bores preent [sic] within a duct section.
• Knowledge of materials and components used in the network at different
times in the past to safely substitute correct attribute values.
The result of these cleansing activities improves the accuracy of stated values as well
as adding a high degree of certainty to values that are currently missing or have an
“unknown” substitution.”
B.4.3 Issue with the implementation of a certain rule in the 2008/09
As set out in the „Draft Asset Valuation Reporting Approach‟, assets such as manholes
and duct should logically not be post DP:
“Only assets that are located between the Main Distribution Frame within the
exchange building and the customer serving Distribution Point (DP) are to be
valued.”
Rules to cleanse data for valuation purposes
We understand that a problem arose with the implementation of this rule, or macro, in
the exchanges transformed in 2008/09. Where duct had been incorrectly recorded as
post DP, a conversion macro should have ensured these assets were re-categorised as pre
DP in PIPeR.
We understand that the macro had not been written with the correct logic and therefore
assets in PIPeR were not being treated appropriately in the 2008/09 Duct Valuation
process. We understand that when it was identified there was an issue with logic in the
macro, it was too late to apply it to all of the transformed exchange records. The
2008/09 sample valuation therefore includes exchanges where these post DP assets have
been omitted. We did not request quantification information from BT as to the effect
this issue has had on the 2008/09 valuation.
B.4.4 Review of PIPeR by Internal Audit
We understand that PIPeR information is audited annually for the testing of the
valuation process. The scope of Internal Audit includes:
• The capture of volume data and sample testing back to source records
• The procedures of the DCVs to ensure the integrity of the data in the conversion
process
• Whether the DCVs are using the latest version of the testing tools.
We further understand that over the last two years there has been significant
substantive testing to ensure the integrity of PIPeR data. The approach in the last two
years has been for Internal Audit to select a cluster of 25 to 28 exchanges and perform
substantial testing on these exchanges. The Internal Audit review examines the original
data capture file and compares this to the information held in PIPeR and output files
extracted from PIPeR.
B.4.5 Effect on the 2009/10 Duct Valuation
In 2009/10 we understand that the corrected post DP conversion rule/macro was
applied to all the exchanges in the sample valuation. We further understand that
Internal Audit focused on this issue in their 2009/10 programme of testing and that no
further problems were noted with the application of this macro.
FINAL VERSION – NON-CONFIDENTIAL
25
B.5 THE SOURCE OF THE VOLUME AND PRICING DATA
B.5.1 Overview of PIPeR
PIPeR is an internally produced and supported data recording and monitoring system. We
understand the system was implemented to enable BT stakeholders to obtain a better
understanding of the current assets in the duct network. We understand that there has
been no material changes to the type of evidence which is recorded in PIPeR since its
inception.
The Current Cost Accounting Detailed Valuation Methodology 2009/10 (“CCA
Methodology”) includes the following describes of PIPeR:
“The system provides accurate data including the length of duct, type of duct,
number of duct bores and other duct-related information such as manholes, joint
boxes and other constructions at the end of duct sections e.g. Primary Cross
Connection Points and Distribution Points. Similarly for Cable details of the cable
type, length, joints, poles and DP equipment are available.”
B.5.2 The lack of dates in PIPeR
We understand that PIPeR does not record the dates that assets are purchased or
constructed.
B.5.3 The implication for the duct valuation of the lack of dates
The date the asset was acquired or constructed is a key attribute of an asset register.
This date will enable a straightforward calculation of depreciation and net book value
and can be used to ensure that assets are recorded in accordance with generally
accepted accounting practices.
Without assets having an acquisition or constructed date, PIPeR could never be a stand
alone asset register. PIPeR will contain an absolute record of assets but could never be
used to ascertain the net book value of assets and be reconciled to Financial
Statements.
PIPeR for valuation purposes
B.5.4 Issue with leased asset entered into PIPeR in 2009/10
There are certain assets within the network i.e. duct, boxes etc. which are leased to BT.
For all assets, the ownership field in PIPeR should be completed by Planners to record
whether an assets is owned or leased by BT. BT has informed us that there was a period
during 2009/10 when new assets could be created in PIPeR and the ownership field could
be left blank as it was not a mandatory field but, in reality, that there are no records for
which this information was not completed. It was not within the scope of this review to
audit the PIPeR records, however, so we are unable to confirm this.
B.5.5 The implication for the duct valuation
This highlights an issue with using PIPeR for valuation purposes. The implementation of
PIPeR and the approach to recording assets is still in its development and there does not
appear to be consistency in the recording of assets across the duct network.
Out of the 5,592 exchanges, only 769 exchanges were converted for the 2009/10. These
exchanges were in certain geographical areas such as Newcastle and Birmingham. There
are significant regions where the exchanges have not been converted and the
planners/engineers who work in these areas may be unfamiliar with the use of PIPeR.
Although Internal Audit and extensive training would reduce the risk of systematic
errors, until PIPeR has been rolled out to all exchanges and procedures are established,
there may be a continuing risk of errors.
B.5.6 Effect on the 2009/10 Duct Valuation
The absence of a date field in PIPeR ensures that BT will continue to determine
accumulated depreciation using a mixture of asset records and assumptions over the
fully written down assets rather than a system which matches assets to their actual
economic life.
Leased assets should not be included in the duct valuation, as these would have
increased the value of certain assets in the exchanges and hence the sample
valuation. It was not within the scope of this report to quantify the effect of this
issue on the 2009/10 Duct Valuation. However, we understand from discussions with
BT that Internal Audit focused on this issue in their 2009/10 programme of testing and
that no leased assets were actually included in the valuation.
FINAL VERSION – NON-CONFIDENTIAL
26
B.6 THE SOURCE OF THE VOLUME AND PRICING DATA
B.6.1 Basis of preparation of the Current Cost Financial Statements
BT prepares their Financial Statements on the basis of „Current Cost‟ accounting. The
CCA Methodology states the following on how assets are valued:
“… current cost profit is arrived at by adjusting the historical cost profit to take
account of changes in asset values… Asset values are adjusted to their value to the
business, usually equivalent to their net current replacement cost.”
Assets are not solely valued in the duct valuation on the basis of component cost. The
„Draft Asset Valuation Reporting Approach‟ sets out the approach:
“Civils pricing components are an “all inclusive” value incorporating a labour
component, environmental taxes and equipment component costs.”
For each asset, the cost to replace the asset is taken from contract prices applied by the
external contractor. This cost is taken to represent the cost of the labour and materials
required to replace the asset. The cost has been reduced by a discount to reflect
economies of scale for labour rates which would be obtained if a hypothetical total
network replacement was undertaken, (the “Discount Factor”).
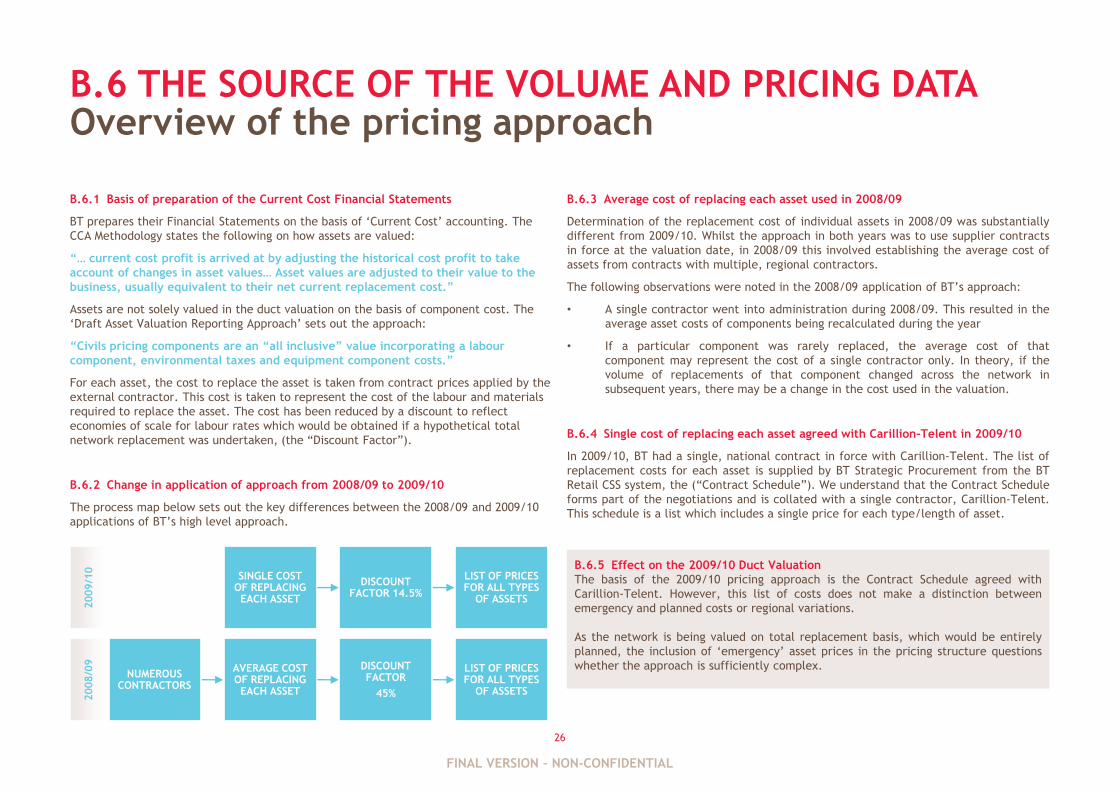
B.6.2 Change in application of approach from 2008/09 to 2009/10
The process map below sets out the key differences between the 2008/09 and 2009/10
applications of BT‟s high level approach.
Overview of the pricing approach
B.6.3 Average cost of replacing each asset used in 2008/09
Determination of the replacement cost of individual assets in 2008/09 was substantially
different from 2009/10. Whilst the approach in both years was to use supplier contracts
in force at the valuation date, in 2008/09 this involved establishing the average cost of
assets from contracts with multiple, regional contractors.
The following observations were noted in the 2008/09 application of BT‟s approach:
• A single contractor went into administration during 2008/09. This resulted in the
average asset costs of components being recalculated during the year
• If a particular component was rarely replaced, the average cost of that
component may represent the cost of a single contractor only. In theory, if the
volume of replacements of that component changed across the network in
subsequent years, there may be a change in the cost used in the valuation.
B.6.4 Single cost of replacing each asset agreed with Carillion-Telent in 2009/10
In 2009/10, BT had a single, national contract in force with Carillion-Telent. The list of
replacement costs for each asset is supplied by BT Strategic Procurement from the BT
Retail CSS system, the (“Contract Schedule”). We understand that the Contract Schedule
forms part of the negotiations and is collated with a single contractor, Carillion-Telent.
This schedule is a list which includes a single price for each type/length of asset.
B.6.5 Effect on the 2009/10 Duct Valuation
The basis of the 2009/10 pricing approach is the Contract Schedule agreed with
Carillion-Telent. However, this list of costs does not make a distinction between
emergency and planned costs or regional variations.
As the network is being valued on total replacement basis, which would be entirely
planned, the inclusion of „emergency‟ asset prices in the pricing structure questions
whether the approach is sufficiently complex.
SINGLE COST OF REPLACING EACH ASSET
DISCOUNT FACTOR 14.5%
LIST OF PRICES FOR ALL TYPES
OF ASSETS
NUMEROUS CONTRACTORS
AVERAGE COST OF REPLACING EACH ASSET
DISCOUNT FACTOR
45%
LIST OF PRICES FOR ALL TYPES
OF ASSETS
2008/0
92009/1
0
FINAL VERSION – NON-CONFIDENTIAL
27
B.7 THE SOURCE OF THE VOLUME AND PRICING DATA
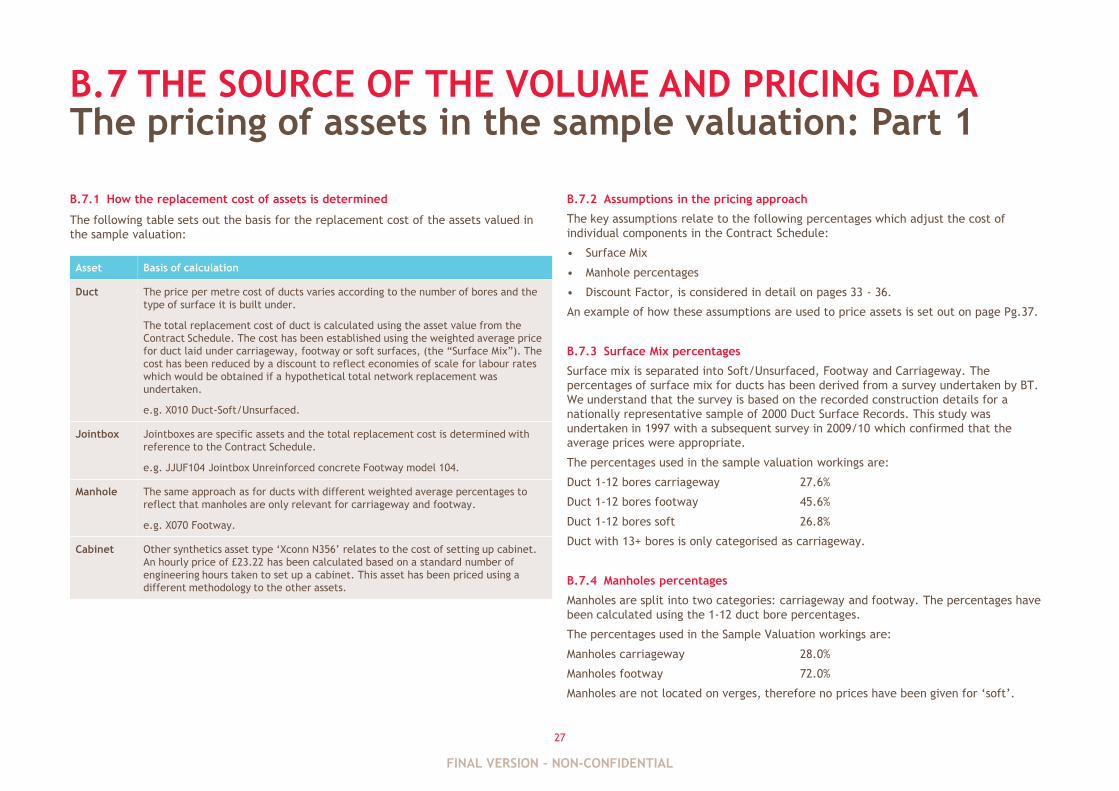
B.7.1 How the replacement cost of assets is determined
The following table sets out the basis for the replacement cost of the assets valued in
the sample valuation:
The pricing of assets in the sample valuation: Part 1
B.7.2 Assumptions in the pricing approach
The key assumptions relate to the following percentages which adjust the cost of
individual components in the Contract Schedule:
• Surface Mix
• Manhole percentages
• Discount Factor, is considered in detail on pages 33 - 36.
An example of how these assumptions are used to price assets is set out on page Pg.37.
B.7.3 Surface Mix percentages
Surface mix is separated into Soft/Unsurfaced, Footway and Carriageway. The
percentages of surface mix for ducts has been derived from a survey undertaken by BT.
We understand that the survey is based on the recorded construction details for a
nationally representative sample of 2000 Duct Surface Records. This study was
undertaken in 1997 with a subsequent survey in 2009/10 which confirmed that the
average prices were appropriate.
The percentages used in the sample valuation workings are:
Duct 1-12 bores carriageway 27.6%
Duct 1-12 bores footway 45.6%
Duct 1-12 bores soft 26.8%
Duct with 13+ bores is only categorised as carriageway.
B.7.4 Manholes percentages
Manholes are split into two categories: carriageway and footway. The percentages have
been calculated using the 1-12 duct bore percentages.
The percentages used in the Sample Valuation workings are:
Manholes carriageway 28.0%
Manholes footway 72.0%
Manholes are not located on verges, therefore no prices have been given for „soft‟.
Asset Basis of calculation
Duct The price per metre cost of ducts varies according to the number of bores and the
type of surface it is built under.
The total replacement cost of duct is calculated using the asset value from the
Contract Schedule. The cost has been established using the weighted average price
for duct laid under carriageway, footway or soft surfaces, (the “Surface Mix”). The
cost has been reduced by a discount to reflect economies of scale for labour rates
which would be obtained if a hypothetical total network replacement was
undertaken.
e.g. X010 Duct-Soft/Unsurfaced.
Jointbox Jointboxes are specific assets and the total replacement cost is determined with
reference to the Contract Schedule.
e.g. JJUF104 Jointbox Unreinforced concrete Footway model 104.
Manhole The same approach as for ducts with different weighted average percentages to
reflect that manholes are only relevant for carriageway and footway.
e.g. X070 Footway.
Cabinet Other synthetics asset type „Xconn N356‟ relates to the cost of setting up cabinet.
An hourly price of £23.22 has been calculated based on a standard number of
engineering hours taken to set up a cabinet. This asset has been priced using a
different methodology to the other assets.
FINAL VERSION – NON-CONFIDENTIAL
28
B.8 THE SOURCE OF THE VOLUME AND PRICING DATA
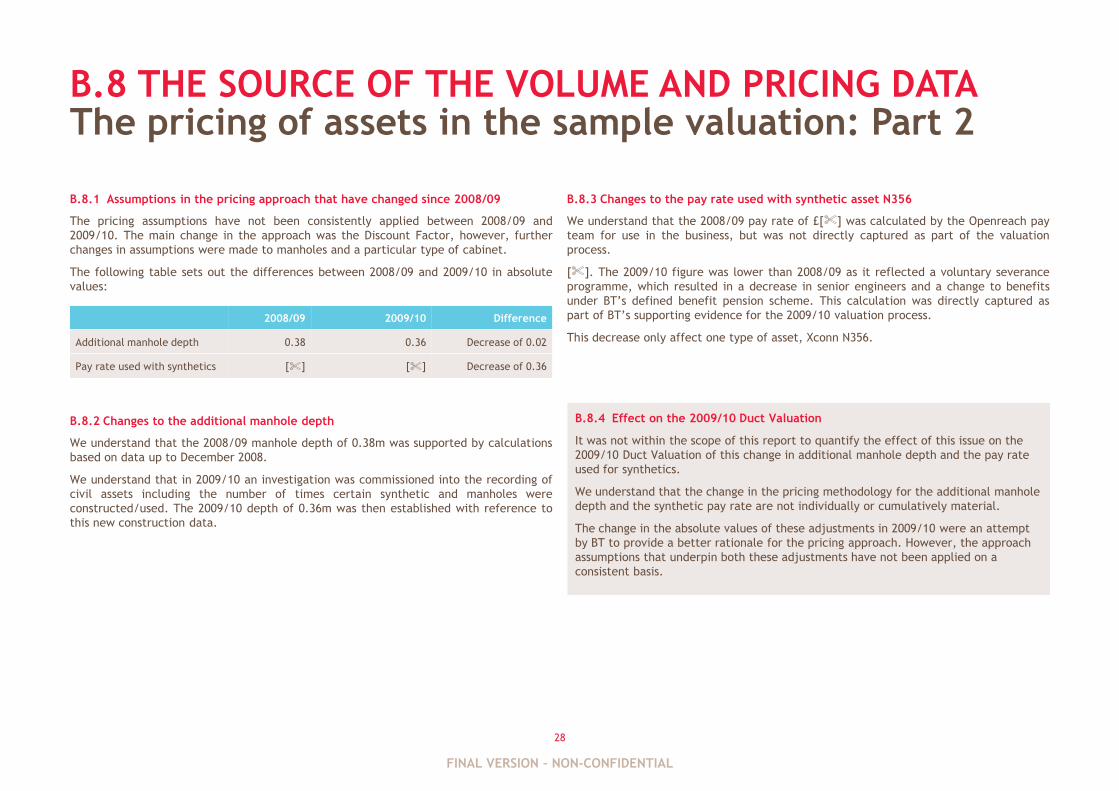
B.8.1 Assumptions in the pricing approach that have changed since 2008/09
The pricing assumptions have not been consistently applied between 2008/09 and
2009/10. The main change in the approach was the Discount Factor, however, further
changes in assumptions were made to manholes and a particular type of cabinet.
The following table sets out the differences between 2008/09 and 2009/10 in absolute
values:
B.8.2 Changes to the additional manhole depth
We understand that the 2008/09 manhole depth of 0.38m was supported by calculations
based on data up to December 2008.
We understand that in 2009/10 an investigation was commissioned into the recording of
civil assets including the number of times certain synthetic and manholes were
constructed/used. The 2009/10 depth of 0.36m was then established with reference to
this new construction data.
The pricing of assets in the sample valuation: Part 2
B.8.3 Changes to the pay rate used with synthetic asset N356
We understand that the 2008/09 pay rate of £[%] was calculated by the Openreach pay
team for use in the business, but was not directly captured as part of the valuation
process.
[%]. The 2009/10 figure was lower than 2008/09 as it reflected a voluntary severance
programme, which resulted in a decrease in senior engineers and a change to benefits
under BT‟s defined benefit pension scheme. This calculation was directly captured as
part of BT‟s supporting evidence for the 2009/10 valuation process.
This decrease only affect one type of asset, Xconn N356.
2008/09 2009/10 Difference
Additional manhole depth 0.38 0.36 Decrease of 0.02
Pay rate used with synthetics [%] [%] Decrease of 0.36
B.8.4 Effect on the 2009/10 Duct Valuation
It was not within the scope of this report to quantify the effect of this issue on the
2009/10 Duct Valuation of this change in additional manhole depth and the pay rate
used for synthetics.
We understand that the change in the pricing methodology for the additional manhole
depth and the synthetic pay rate are not individually or cumulatively material.
The change in the absolute values of these adjustments in 2009/10 were an attempt
by BT to provide a better rationale for the pricing approach. However, the approach
assumptions that underpin both these adjustments have not been applied on a
consistent basis.
FINAL VERSION – NON-CONFIDENTIAL
APPENIDIX CADJUSTMENTS TO THE VOLUME AND PRICING DATA
FINAL VERSION – NON-CONFIDENTIAL
30
C.1 ADJUSTMENTS TO THE VOLUME AND PRICING DATA
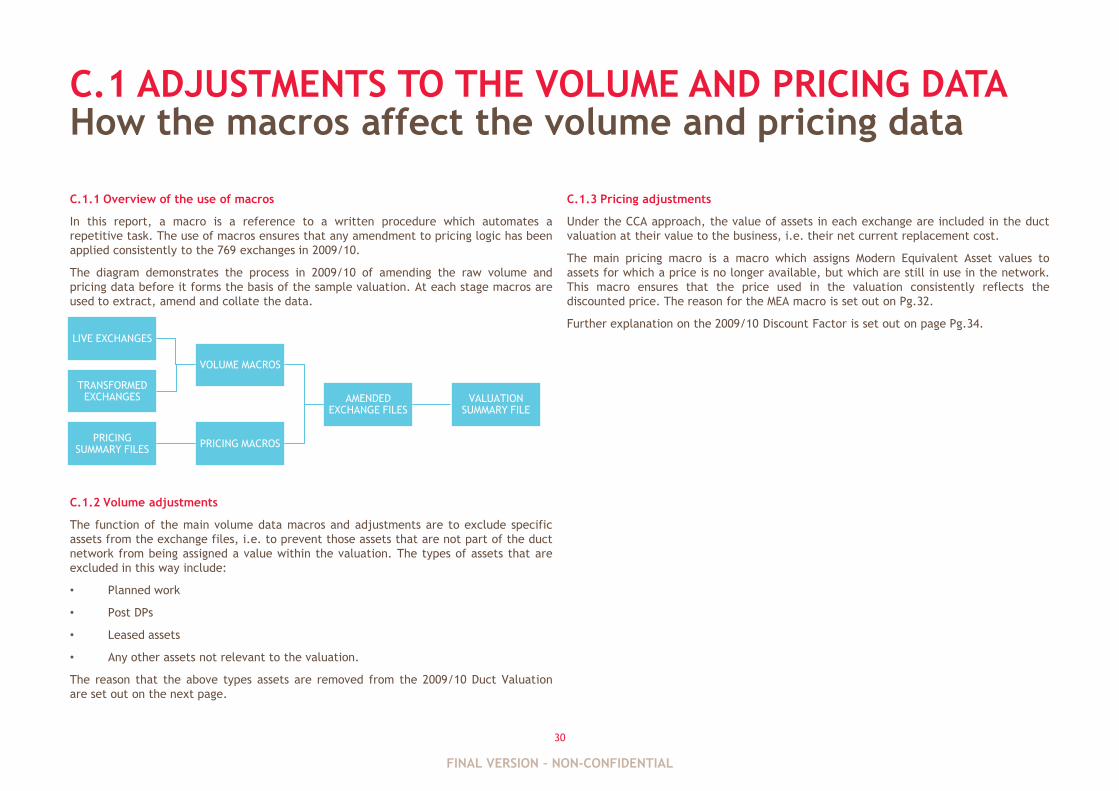
C.1.1 Overview of the use of macros
In this report, a macro is a reference to a written procedure which automates a
repetitive task. The use of macros ensures that any amendment to pricing logic has been
applied consistently to the 769 exchanges in 2009/10.
The diagram demonstrates the process in 2009/10 of amending the raw volume and
pricing data before it forms the basis of the sample valuation. At each stage macros are
used to extract, amend and collate the data.
C.1.2 Volume adjustments
The function of the main volume data macros and adjustments are to exclude specific
assets from the exchange files, i.e. to prevent those assets that are not part of the duct
network from being assigned a value within the valuation. The types of assets that are
excluded in this way include:
• Planned work
• Post DPs
• Leased assets
• Any other assets not relevant to the valuation.
The reason that the above types assets are removed from the 2009/10 Duct Valuation
are set out on the next page.
How the macros affect the volume and pricing data
C.1.3 Pricing adjustments
Under the CCA approach, the value of assets in each exchange are included in the duct
valuation at their value to the business, i.e. their net current replacement cost.
The main pricing macro is a macro which assigns Modern Equivalent Asset values to
assets for which a price is no longer available, but which are still in use in the network.
This macro ensures that the price used in the valuation consistently reflects the
discounted price. The reason for the MEA macro is set out on Pg.32.
Further explanation on the 2009/10 Discount Factor is set out on page Pg.34.
VALUATION SUMMARY FILE
AMENDED EXCHANGE FILES
VOLUME MACROS
LIVE EXCHANGES
TRANSFORMED EXCHANGES
PRICING MACROSPRICING
SUMMARY FILES
FINAL VERSION – NON-CONFIDENTIAL
31
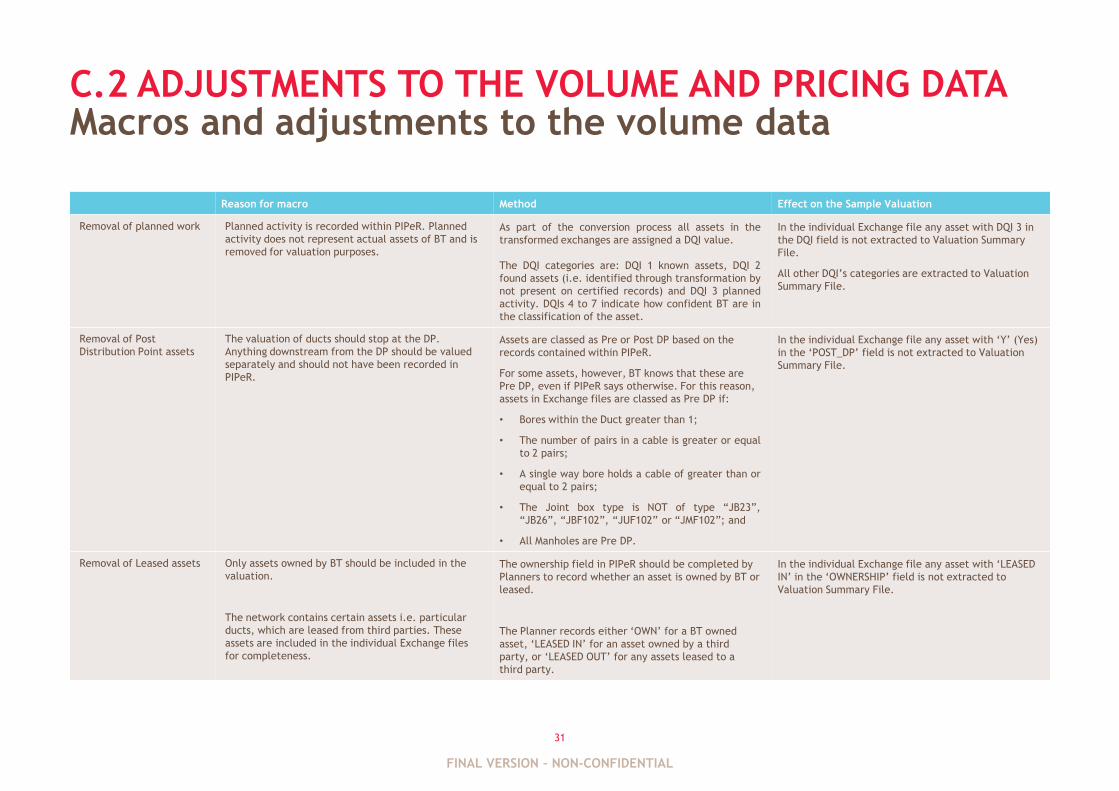
C.2 ADJUSTMENTS TO THE VOLUME AND PRICING DATAMacros and adjustments to the volume data
Reason for macro Method Effect on the Sample Valuation
Removal of planned work Planned activity is recorded within PIPeR. Planned
activity does not represent actual assets of BT and is
removed for valuation purposes.
As part of the conversion process all assets in the
transformed exchanges are assigned a DQI value.
The DQI categories are: DQI 1 known assets, DQI 2
found assets (i.e. identified through transformation by
not present on certified records) and DQI 3 planned
activity. DQIs 4 to 7 indicate how confident BT are in
the classification of the asset.
In the individual Exchange file any asset with DQI 3 in
the DQI field is not extracted to Valuation Summary
File.
All other DQI‟s categories are extracted to Valuation
Summary File.
Removal of Post
Distribution Point assets
The valuation of ducts should stop at the DP.
Anything downstream from the DP should be valued
separately and should not have been recorded in
PIPeR.
Assets are classed as Pre or Post DP based on the
records contained within PIPeR.
For some assets, however, BT knows that these are
Pre DP, even if PIPeR says otherwise. For this reason,
assets in Exchange files are classed as Pre DP if:
• Bores within the Duct greater than 1;
• The number of pairs in a cable is greater or equal
to 2 pairs;
• A single way bore holds a cable of greater than or
equal to 2 pairs;
• The Joint box type is NOT of type “JB23”,
“JB26”, “JBF102”, “JUF102” or “JMF102”; and
• All Manholes are Pre DP.
In the individual Exchange file any asset with „Y‟ (Yes)
in the „POST_DP‟ field is not extracted to Valuation
Summary File.
Removal of Leased assets Only assets owned by BT should be included in the
valuation.
The network contains certain assets i.e. particular
ducts, which are leased from third parties. These
assets are included in the individual Exchange files
for completeness.
The ownership field in PIPeR should be completed by
Planners to record whether an asset is owned by BT or
leased.
The Planner records either „OWN‟ for a BT owned
asset, „LEASED IN‟ for an asset owned by a third
party, or „LEASED OUT‟ for any assets leased to a
third party.
In the individual Exchange file any asset with „LEASED
IN‟ in the „OWNERSHIP‟ field is not extracted to
Valuation Summary File.
FINAL VERSION – NON-CONFIDENTIAL
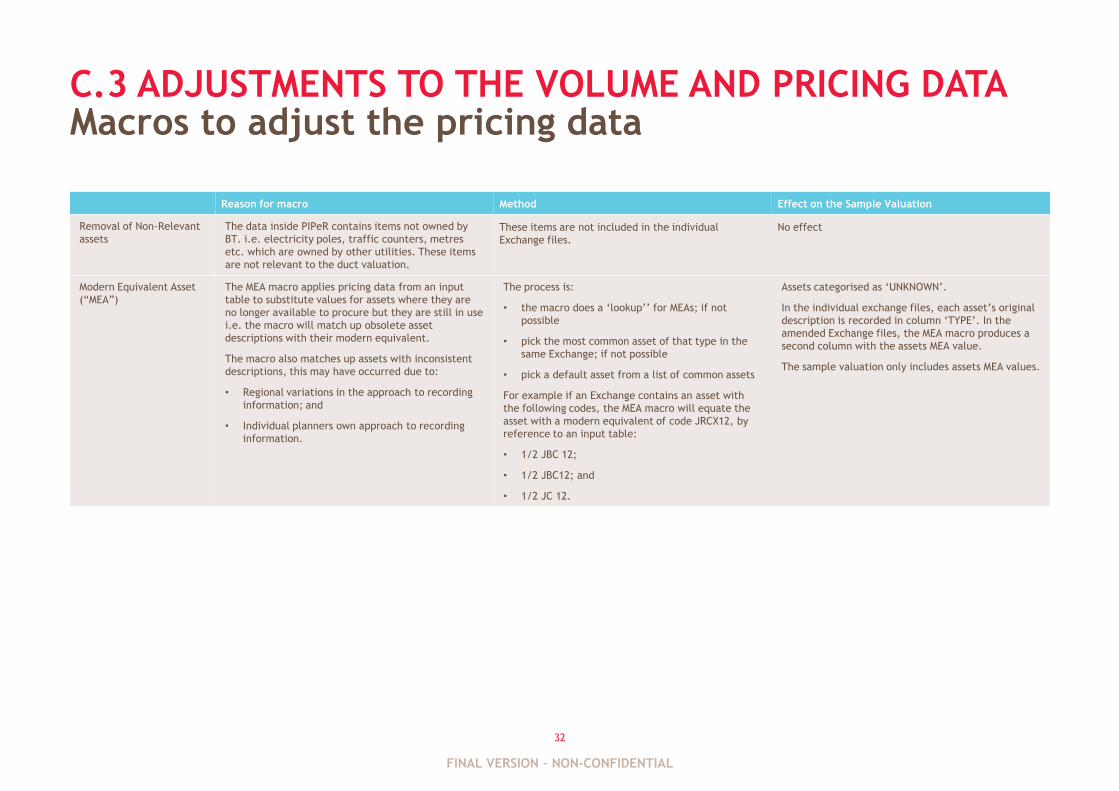
32
Macros to adjust the pricing dataC.3 ADJUSTMENTS TO THE VOLUME AND PRICING DATA
Reason for macro Method Effect on the Sample Valuation
Removal of Non-Relevant
assets
The data inside PIPeR contains items not owned by
BT. i.e. electricity poles, traffic counters, metres
etc. which are owned by other utilities. These items
are not relevant to the duct valuation.
These items are not included in the individual
Exchange files.
No effect
Modern Equivalent Asset
(“MEA”)
The MEA macro applies pricing data from an input
table to substitute values for assets where they are
no longer available to procure but they are still in use
i.e. the macro will match up obsolete asset
descriptions with their modern equivalent.
The macro also matches up assets with inconsistent
descriptions, this may have occurred due to:
• Regional variations in the approach to recording
information; and
• Individual planners own approach to recording
information.
The process is:
• the macro does a „lookup‟‟ for MEAs; if not
possible
• pick the most common asset of that type in the
same Exchange; if not possible
• pick a default asset from a list of common assets
For example if an Exchange contains an asset with
the following codes, the MEA macro will equate the
asset with a modern equivalent of code JRCX12, by
reference to an input table:
• 1/2 JBC 12;
• 1/2 JBC12; and
• 1/2 JC 12.
Assets categorised as „UNKNOWN‟.
In the individual exchange files, each asset‟s original
description is recorded in column „TYPE‟. In the
amended Exchange files, the MEA macro produces a
second column with the assets MEA value.
The sample valuation only includes assets MEA values.
FINAL VERSION – NON-CONFIDENTIAL
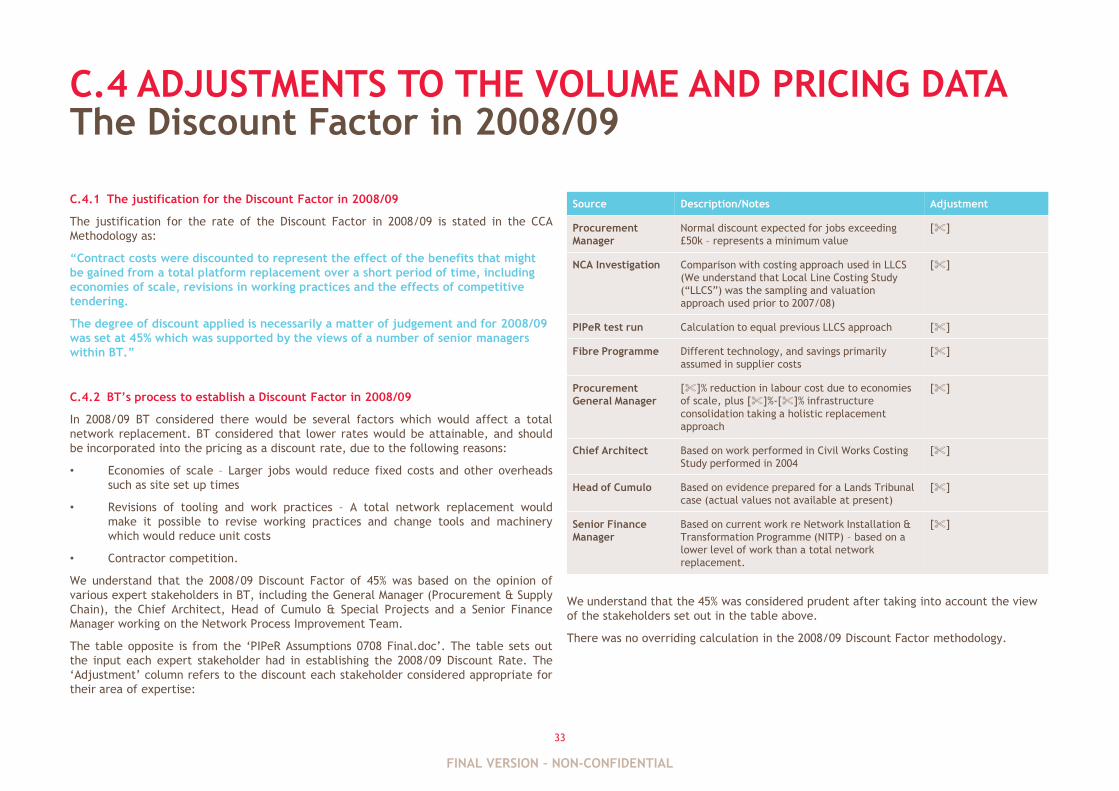
33
C.4 ADJUSTMENTS TO THE VOLUME AND PRICING DATA
C.4.1 The justification for the Discount Factor in 2008/09
The justification for the rate of the Discount Factor in 2008/09 is stated in the CCA
Methodology as:
“Contract costs were discounted to represent the effect of the benefits that might
be gained from a total platform replacement over a short period of time, including
economies of scale, revisions in working practices and the effects of competitive
tendering.
The degree of discount applied is necessarily a matter of judgement and for 2008/09
was set at 45% which was supported by the views of a number of senior managers
within BT.”
C.4.2 BT‟s process to establish a Discount Factor in 2008/09
In 2008/09 BT considered there would be several factors which would affect a total
network replacement. BT considered that lower rates would be attainable, and should
be incorporated into the pricing as a discount rate, due to the following reasons:
• Economies of scale – Larger jobs would reduce fixed costs and other overheads
such as site set up times
• Revisions of tooling and work practices – A total network replacement would
make it possible to revise working practices and change tools and machinery
which would reduce unit costs
• Contractor competition.
We understand that the 2008/09 Discount Factor of 45% was based on the opinion of
various expert stakeholders in BT, including the General Manager (Procurement & Supply
Chain), the Chief Architect, Head of Cumulo & Special Projects and a Senior Finance
Manager working on the Network Process Improvement Team.
The table opposite is from the „PIPeR Assumptions 0708 Final.doc‟. The table sets out
the input each expert stakeholder had in establishing the 2008/09 Discount Rate. The
„Adjustment‟ column refers to the discount each stakeholder considered appropriate for
their area of expertise:
The Discount Factor in 2008/09
We understand that the 45% was considered prudent after taking into account the view
of the stakeholders set out in the table above.
There was no overriding calculation in the 2008/09 Discount Factor methodology.
Source Description/Notes Adjustment
Procurement
Manager
Normal discount expected for jobs exceeding
£50k – represents a minimum value
[%]
NCA Investigation Comparison with costing approach used in LLCS
(We understand that Local Line Costing Study
(“LLCS”) was the sampling and valuation
approach used prior to 2007/08)
[%]
PIPeR test run Calculation to equal previous LLCS approach [%]
Fibre Programme Different technology, and savings primarily
assumed in supplier costs
[%]
Procurement
General Manager
[%]% reduction in labour cost due to economies
of scale, plus [%]%-[%]% infrastructure
consolidation taking a holistic replacement
approach
[%]
Chief Architect Based on work performed in Civil Works Costing
Study performed in 2004
[%]
Head of Cumulo Based on evidence prepared for a Lands Tribunal
case (actual values not available at present)
[%]
Senior Finance
Manager
Based on current work re Network Installation &
Transformation Programme (NITP) – based on a
lower level of work than a total network
replacement.
[%]
FINAL VERSION – NON-CONFIDENTIAL
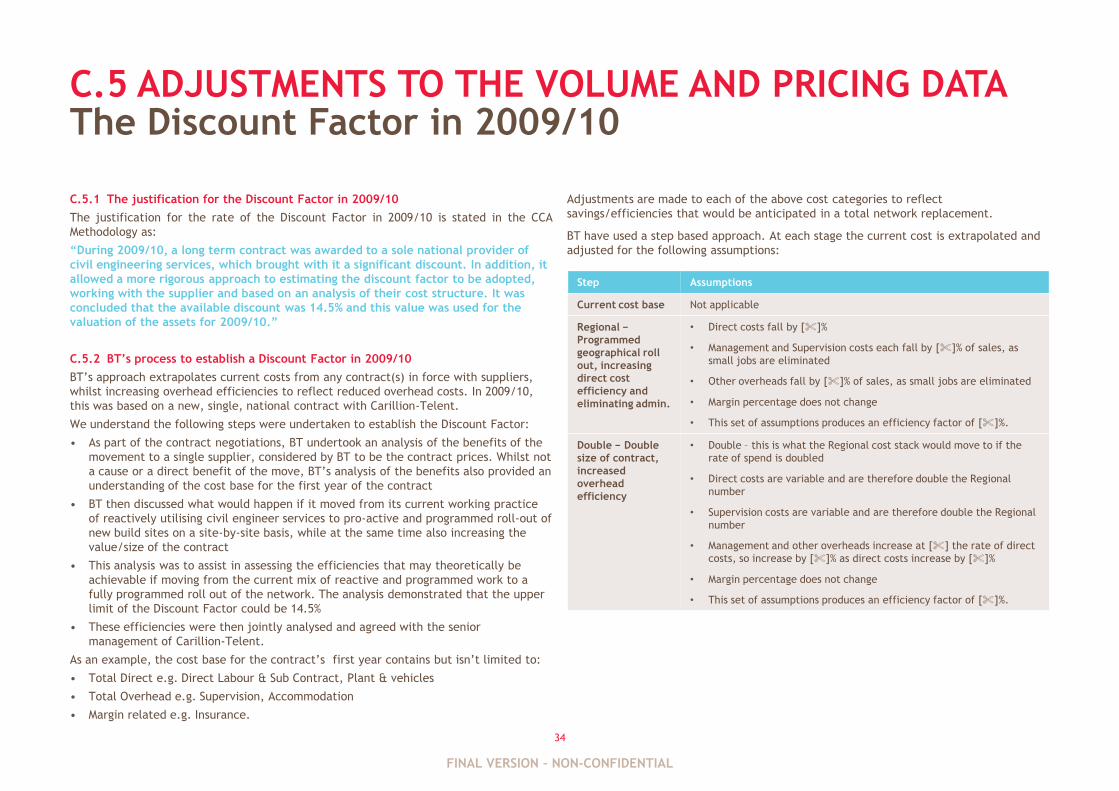
34
C.5 ADJUSTMENTS TO THE VOLUME AND PRICING DATA
C.5.1 The justification for the Discount Factor in 2009/10
The justification for the rate of the Discount Factor in 2009/10 is stated in the CCA
Methodology as:
“During 2009/10, a long term contract was awarded to a sole national provider of
civil engineering services, which brought with it a significant discount. In addition, it
allowed a more rigorous approach to estimating the discount factor to be adopted,
working with the supplier and based on an analysis of their cost structure. It was
concluded that the available discount was 14.5% and this value was used for the
valuation of the assets for 2009/10.”
C.5.2 BT‟s process to establish a Discount Factor in 2009/10
BT‟s approach extrapolates current costs from any contract(s) in force with suppliers,
whilst increasing overhead efficiencies to reflect reduced overhead costs. In 2009/10,
this was based on a new, single, national contract with Carillion-Telent.
We understand the following steps were undertaken to establish the Discount Factor:
• As part of the contract negotiations, BT undertook an analysis of the benefits of the
movement to a single supplier, considered by BT to be the contract prices. Whilst not
a cause or a direct benefit of the move, BT‟s analysis of the benefits also provided an
understanding of the cost base for the first year of the contract
• BT then discussed what would happen if it moved from its current working practice
of reactively utilising civil engineer services to pro-active and programmed roll-out of
new build sites on a site-by-site basis, while at the same time also increasing the
value/size of the contract
• This analysis was to assist in assessing the efficiencies that may theoretically be
achievable if moving from the current mix of reactive and programmed work to a
fully programmed roll out of the network. The analysis demonstrated that the upper
limit of the Discount Factor could be 14.5%
• These efficiencies were then jointly analysed and agreed with the senior
management of Carillion-Telent.
As an example, the cost base for the contract‟s first year contains but isn‟t limited to:
• Total Direct e.g. Direct Labour & Sub Contract, Plant & vehicles
• Total Overhead e.g. Supervision, Accommodation
• Margin related e.g. Insurance.
The Discount Factor in 2009/10
Adjustments are made to each of the above cost categories to reflect
savings/efficiencies that would be anticipated in a total network replacement.
BT have used a step based approach. At each stage the current cost is extrapolated and
adjusted for the following assumptions:
Step Assumptions
Current cost base Not applicable
Regional −
Programmed
geographical roll
out, increasing
direct cost
efficiency and
eliminating admin.
• Direct costs fall by [%]%
• Management and Supervision costs each fall by [%]% of sales, as
small jobs are eliminated
• Other overheads fall by [%]% of sales, as small jobs are eliminated
• Margin percentage does not change
• This set of assumptions produces an efficiency factor of [%]%.
Double − Double
size of contract,
increased
overhead
efficiency
• Double – this is what the Regional cost stack would move to if the
rate of spend is doubled
• Direct costs are variable and are therefore double the Regional
number
• Supervision costs are variable and are therefore double the Regional
number
• Management and other overheads increase at [%] the rate of direct
costs, so increase by [%]% as direct costs increase by [%]%
• Margin percentage does not change
• This set of assumptions produces an efficiency factor of [%]%.
FINAL VERSION – NON-CONFIDENTIAL
35
C.6 ADJUSTMENTS TO THE VOLUME AND PRICING DATAThe Discount Factor calculation in 2009/10
C.6.1 The 2009/10 Discount Factor calculation
The calculation below is an illustrative example setting out how an efficiency factor is calculated using BT‟s model. BT arrived at the discount factor of 14.5% in 2009/10 by using
the highest efficiency factor suggested by its model as the size of the contract increases.
[%]
FINAL VERSION – NON-CONFIDENTIAL
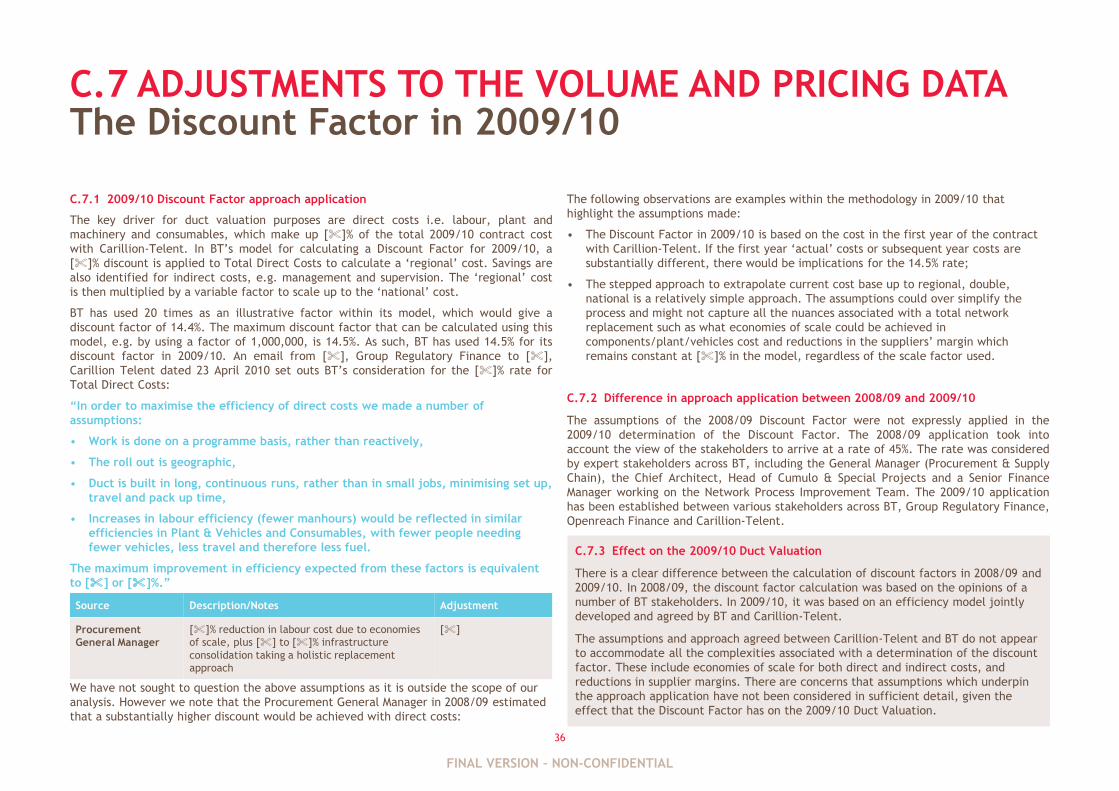
36
C.7 ADJUSTMENTS TO THE VOLUME AND PRICING DATA
C.7.1 2009/10 Discount Factor approach application
The key driver for duct valuation purposes are direct costs i.e. labour, plant and
machinery and consumables, which make up [%]% of the total 2009/10 contract cost
with Carillion-Telent. In BT‟s model for calculating a Discount Factor for 2009/10, a
[%]% discount is applied to Total Direct Costs to calculate a „regional‟ cost. Savings are
also identified for indirect costs, e.g. management and supervision. The „regional‟ cost
is then multiplied by a variable factor to scale up to the „national‟ cost.
BT has used 20 times as an illustrative factor within its model, which would give a
discount factor of 14.4%. The maximum discount factor that can be calculated using this
model, e.g. by using a factor of 1,000,000, is 14.5%. As such, BT has used 14.5% for its
discount factor in 2009/10. An email from [%], Group Regulatory Finance to [%],
Carillion Telent dated 23 April 2010 set outs BT‟s consideration for the [%]% rate for
Total Direct Costs:
“In order to maximise the efficiency of direct costs we made a number of
assumptions:
• Work is done on a programme basis, rather than reactively,
• The roll out is geographic,
• Duct is built in long, continuous runs, rather than in small jobs, minimising set up,
travel and pack up time,
• Increases in labour efficiency (fewer manhours) would be reflected in similar
efficiencies in Plant & Vehicles and Consumables, with fewer people needing
fewer vehicles, less travel and therefore less fuel.
The maximum improvement in efficiency expected from these factors is equivalent
to [%] or [%]%.”
We have not sought to question the above assumptions as it is outside the scope of our
analysis. However we note that the Procurement General Manager in 2008/09 estimated
that a substantially higher discount would be achieved with direct costs:
The Discount Factor in 2009/10
The following observations are examples within the methodology in 2009/10 that
highlight the assumptions made:
• The Discount Factor in 2009/10 is based on the cost in the first year of the contract
with Carillion-Telent. If the first year „actual‟ costs or subsequent year costs are
substantially different, there would be implications for the 14.5% rate;
• The stepped approach to extrapolate current cost base up to regional, double,
national is a relatively simple approach. The assumptions could over simplify the
process and might not capture all the nuances associated with a total network
replacement such as what economies of scale could be achieved in
components/plant/vehicles cost and reductions in the suppliers‟ margin which
remains constant at [%]% in the model, regardless of the scale factor used.
C.7.2 Difference in approach application between 2008/09 and 2009/10
The assumptions of the 2008/09 Discount Factor were not expressly applied in the
2009/10 determination of the Discount Factor. The 2008/09 application took into
account the view of the stakeholders to arrive at a rate of 45%. The rate was considered
by expert stakeholders across BT, including the General Manager (Procurement & Supply
Chain), the Chief Architect, Head of Cumulo & Special Projects and a Senior Finance
Manager working on the Network Process Improvement Team. The 2009/10 application
has been established between various stakeholders across BT, Group Regulatory Finance,
Openreach Finance and Carillion-Telent.
Source Description/Notes Adjustment
Procurement
General Manager
[%]% reduction in labour cost due to economies
of scale, plus [%] to [%]% infrastructure
consolidation taking a holistic replacement
approach
[%]
C.7.3 Effect on the 2009/10 Duct Valuation
There is a clear difference between the calculation of discount factors in 2008/09 and
2009/10. In 2008/09, the discount factor calculation was based on the opinions of a
number of BT stakeholders. In 2009/10, it was based on an efficiency model jointly
developed and agreed by BT and Carillion-Telent.
The assumptions and approach agreed between Carillion-Telent and BT do not appear
to accommodate all the complexities associated with a determination of the discount
factor. These include economies of scale for both direct and indirect costs, and
reductions in supplier margins. There are concerns that assumptions which underpin
the approach application have not been considered in sufficient detail, given the
effect that the Discount Factor has on the 2009/10 Duct Valuation.
FINAL VERSION – NON-CONFIDENTIAL
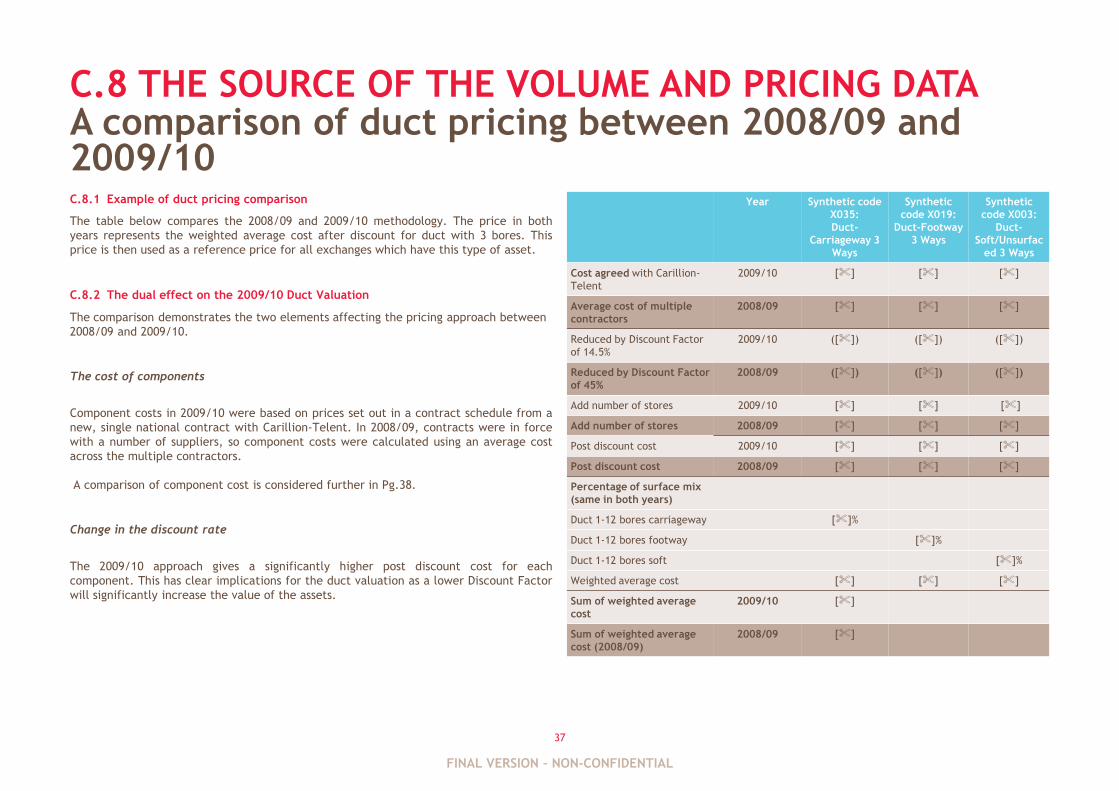
37
C.8 THE SOURCE OF THE VOLUME AND PRICING DATA
C.8.1 Example of duct pricing comparison
The table below compares the 2008/09 and 2009/10 methodology. The price in both
years represents the weighted average cost after discount for duct with 3 bores. This
price is then used as a reference price for all exchanges which have this type of asset.
C.8.2 The dual effect on the 2009/10 Duct Valuation
The comparison demonstrates the two elements affecting the pricing approach between
2008/09 and 2009/10.
The cost of components
Component costs in 2009/10 were based on prices set out in a contract schedule from a
new, single national contract with Carillion-Telent. In 2008/09, contracts were in force
with a number of suppliers, so component costs were calculated using an average cost
across the multiple contractors.
A comparison of component cost is considered further in Pg.38.
Change in the discount rate
The 2009/10 approach gives a significantly higher post discount cost for each
component. This has clear implications for the duct valuation as a lower Discount Factor
will significantly increase the value of the assets.
A comparison of duct pricing between 2008/09 and 2009/10
Year Synthetic code
X035:
Duct-
Carriageway 3
Ways
Synthetic
code X019:
Duct-Footway
3 Ways
Synthetic
code X003:
Duct-
Soft/Unsurfac
ed 3 Ways
Cost agreed with Carillion-
Telent
2009/10 [%] [%] [%]
Average cost of multiple
contractors
2008/09 [%] [%] [%]
Reduced by Discount Factor
of 14.5%
2009/10 ([%]) ([%]) ([%])
Reduced by Discount Factor
of 45%
2008/09 ([%]) ([%]) ([%])
Add number of stores 2009/10 [%] [%] [%]
Add number of stores 2008/09 [%] [%] [%]
Post discount cost 2009/10 [%] [%] [%]
Post discount cost 2008/09 [%] [%] [%]
Percentage of surface mix
(same in both years)
Duct 1-12 bores carriageway [%]%
Duct 1-12 bores footway [%]%
Duct 1-12 bores soft [%]%
Weighted average cost [%] [%] [%]
Sum of weighted average
cost
2009/10 [%]
Sum of weighted average
cost (2008/09)
2008/09 [%]
FINAL VERSION – NON-CONFIDENTIAL
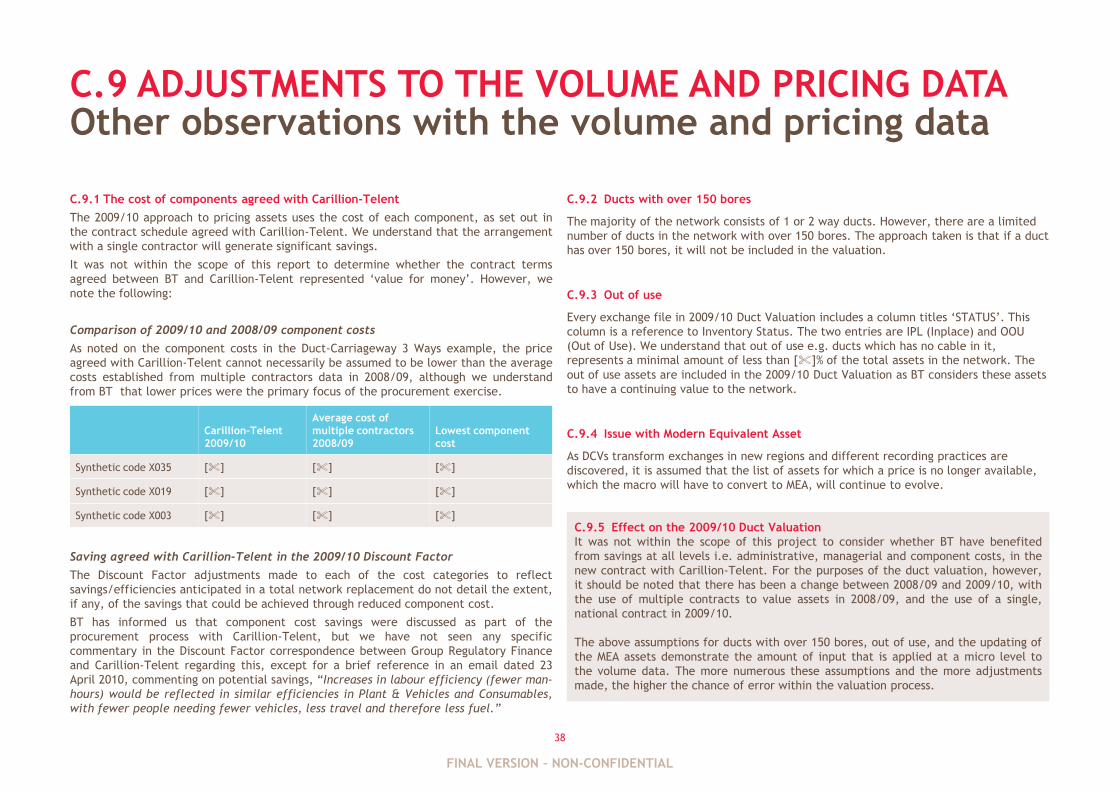
38
C.9 ADJUSTMENTS TO THE VOLUME AND PRICING DATA
C.9.1 The cost of components agreed with Carillion-Telent
The 2009/10 approach to pricing assets uses the cost of each component, as set out in
the contract schedule agreed with Carillion-Telent. We understand that the arrangement
with a single contractor will generate significant savings.
It was not within the scope of this report to determine whether the contract terms
agreed between BT and Carillion-Telent represented „value for money‟. However, we
note the following:
Comparison of 2009/10 and 2008/09 component costs
As noted on the component costs in the Duct-Carriageway 3 Ways example, the price
agreed with Carillion-Telent cannot necessarily be assumed to be lower than the average
costs established from multiple contractors data in 2008/09, although we understand
from BT that lower prices were the primary focus of the procurement exercise.
Saving agreed with Carillion-Telent in the 2009/10 Discount Factor
The Discount Factor adjustments made to each of the cost categories to reflect
savings/efficiencies anticipated in a total network replacement do not detail the extent,
if any, of the savings that could be achieved through reduced component cost.
BT has informed us that component cost savings were discussed as part of the
procurement process with Carillion-Telent, but we have not seen any specific
commentary in the Discount Factor correspondence between Group Regulatory Finance
and Carillion-Telent regarding this, except for a brief reference in an email dated 23
April 2010, commenting on potential savings, “Increases in labour efficiency (fewer man-
hours) would be reflected in similar efficiencies in Plant & Vehicles and Consumables,
with fewer people needing fewer vehicles, less travel and therefore less fuel.”
Other observations with the volume and pricing data
C.9.2 Ducts with over 150 bores
The majority of the network consists of 1 or 2 way ducts. However, there are a limited
number of ducts in the network with over 150 bores. The approach taken is that if a duct
has over 150 bores, it will not be included in the valuation.
C.9.3 Out of use
Every exchange file in 2009/10 Duct Valuation includes a column titles „STATUS‟. This
column is a reference to Inventory Status. The two entries are IPL (Inplace) and OOU
(Out of Use). We understand that out of use e.g. ducts which has no cable in it,
represents a minimal amount of less than [%]% of the total assets in the network. The
out of use assets are included in the 2009/10 Duct Valuation as BT considers these assets
to have a continuing value to the network.
C.9.4 Issue with Modern Equivalent Asset
As DCVs transform exchanges in new regions and different recording practices are
discovered, it is assumed that the list of assets for which a price is no longer available,
which the macro will have to convert to MEA, will continue to evolve.
Carillion-Telent
2009/10
Average cost of
multiple contractors
2008/09
Lowest component
cost
Synthetic code X035 [%] [%] [%]
Synthetic code X019 [%] [%] [%]
Synthetic code X003 [%] [%] [%]C.9.5 Effect on the 2009/10 Duct Valuation
It was not within the scope of this project to consider whether BT have benefited
from savings at all levels i.e. administrative, managerial and component costs, in the
new contract with Carillion-Telent. For the purposes of the duct valuation, however,
it should be noted that there has been a change between 2008/09 and 2009/10, with
the use of multiple contracts to value assets in 2008/09, and the use of a single,
national contract in 2009/10.
The above assumptions for ducts with over 150 bores, out of use, and the updating of
the MEA assets demonstrate the amount of input that is applied at a micro level to
the volume data. The more numerous these assumptions and the more adjustments
made, the higher the chance of error within the valuation process.
FINAL VERSION – NON-CONFIDENTIAL

APPENIDIX DTHE SAMPLE VALUATION
FINAL VERSION – NON-CONFIDENTIAL

40
D.1 THE SAMPLE VALUATION
D.1.1 Out of area adjustment overview
The Out of Area adjustments (“OOA adjustments“) remove assets belonging to or
recorded against a neighbouring exchange. This ensures that assets are not double
counted.
We understand that the OOA adjustment for each exchange has been calculated
following analysis of volumes extracted from PIPeR.
The adjustment considered the relevant assets, being:
• Duct
• Manhole
• Jointbox
• PCP
The OOA adjustment is made before the exchanges are categorised into geotypes. As this
adjustment only reduces the asset value of exchanges, this adjustment would not inflate
the value of an exchange in the sample valuation.
The OOA adjustments relate to exchanges outside London only.
No adjustments have been made for OOA for geotype 1 exchanges, as these are only
based in London and OOA adjustments are not relevant for London exchanges.
D.1.2 Review of the OOA adjustment by Internal Audit
We understand that Internal Audit reviewed the OOA adjustment and the methodology
used to identify the adjustment in 2009/10.
Out of area adjustments
D.1.3 Effect on the geotypes of the adjustment
The effect of the adjustment on the geotypes in the sample valuation is shown in the
table below:
Geotype Adjustment
1 [%]
2 [%]
3 [%]
4 [%]
5 [%]
6 [%]
Total [%]
D.1.4 Effect on the 2009/10 Duct Valuation
The effect on the 2009/10 sample valuation is set out below:
• Sample valuation before OOA adjustments [%]
• Sample valuation after OOA adjustments [%]
• Difference [%]
The OOA adjustments represent approximately 0.1% of the pre adjustment sample
valuation total asset value.
FINAL VERSION – NON-CONFIDENTIAL
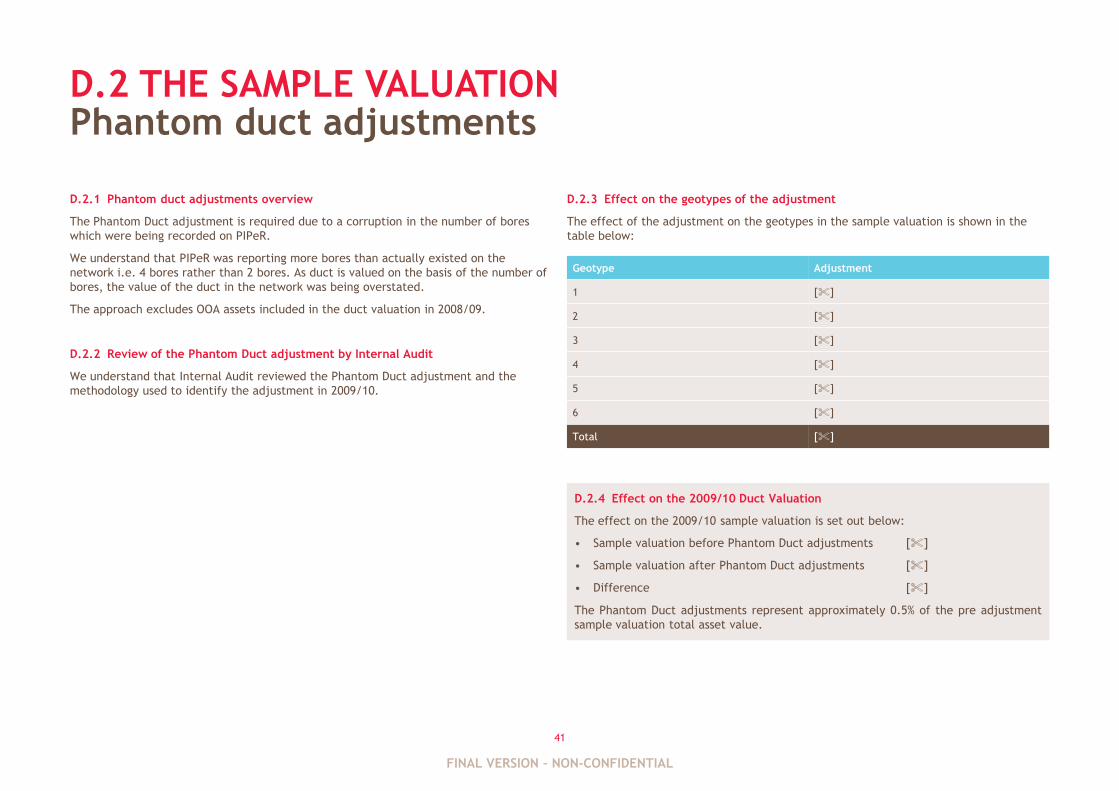
41
D.2 THE SAMPLE VALUATION
D.2.1 Phantom duct adjustments overview
The Phantom Duct adjustment is required due to a corruption in the number of bores
which were being recorded on PIPeR.
We understand that PIPeR was reporting more bores than actually existed on the
network i.e. 4 bores rather than 2 bores. As duct is valued on the basis of the number of
bores, the value of the duct in the network was being overstated.
The approach excludes OOA assets included in the duct valuation in 2008/09.
D.2.2 Review of the Phantom Duct adjustment by Internal Audit
We understand that Internal Audit reviewed the Phantom Duct adjustment and the
methodology used to identify the adjustment in 2009/10.
Phantom duct adjustments
D.2.3 Effect on the geotypes of the adjustment
The effect of the adjustment on the geotypes in the sample valuation is shown in the
table below:
Geotype Adjustment
1 [%]
2 [%]
3 [%]
4 [%]
5 [%]
6 [%]
Total [%]
D.2.4 Effect on the 2009/10 Duct Valuation
The effect on the 2009/10 sample valuation is set out below:
• Sample valuation before Phantom Duct adjustments [%]
• Sample valuation after Phantom Duct adjustments [%]
• Difference [%]
The Phantom Duct adjustments represent approximately 0.5% of the pre adjustment
sample valuation total asset value.
FINAL VERSION – NON-CONFIDENTIAL
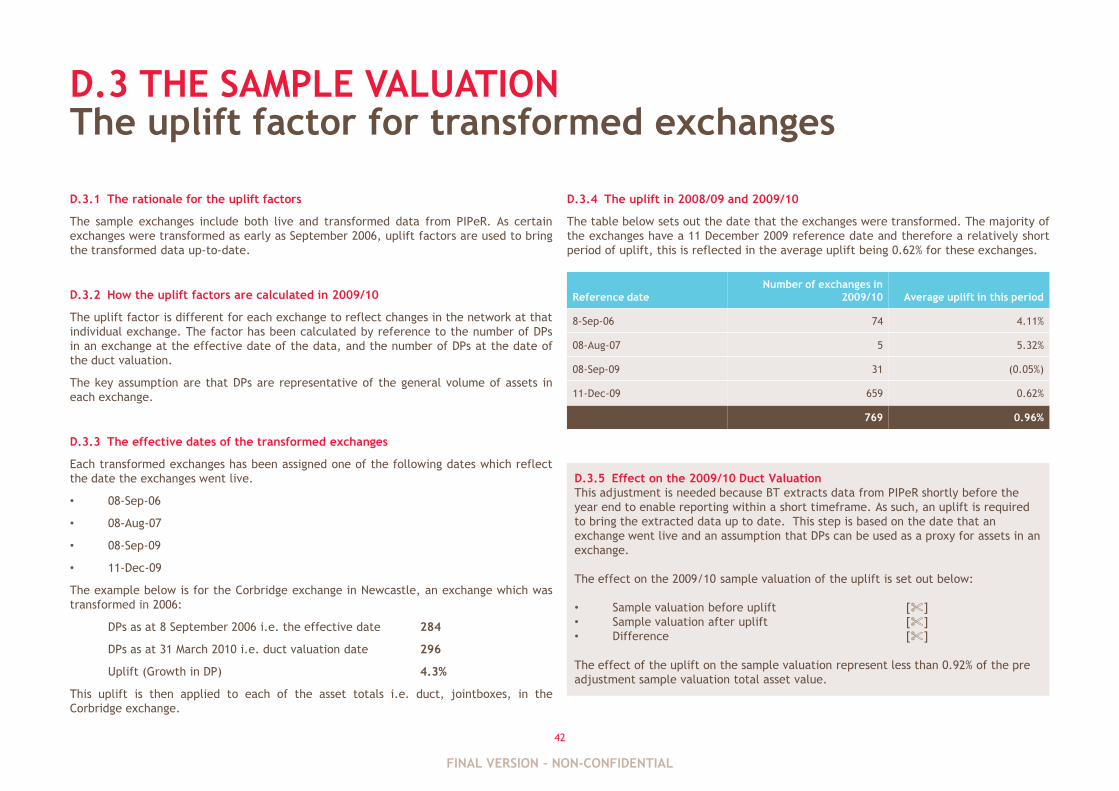
42
D.3 THE SAMPLE VALUATION
D.3.1 The rationale for the uplift factors
The sample exchanges include both live and transformed data from PIPeR. As certain
exchanges were transformed as early as September 2006, uplift factors are used to bring
the transformed data up-to-date.
D.3.2 How the uplift factors are calculated in 2009/10
The uplift factor is different for each exchange to reflect changes in the network at that
individual exchange. The factor has been calculated by reference to the number of DPs
in an exchange at the effective date of the data, and the number of DPs at the date of
the duct valuation.
The key assumption are that DPs are representative of the general volume of assets in
each exchange.
D.3.3 The effective dates of the transformed exchanges
Each transformed exchanges has been assigned one of the following dates which reflect
the date the exchanges went live.
• 08-Sep-06
• 08-Aug-07
• 08-Sep-09
• 11-Dec-09
The example below is for the Corbridge exchange in Newcastle, an exchange which was
transformed in 2006:
DPs as at 8 September 2006 i.e. the effective date 284
DPs as at 31 March 2010 i.e. duct valuation date 296
Uplift (Growth in DP) 4.3%
This uplift is then applied to each of the asset totals i.e. duct, jointboxes, in the
Corbridge exchange.
The uplift factor for transformed exchanges
D.3.4 The uplift in 2008/09 and 2009/10
The table below sets out the date that the exchanges were transformed. The majority of
the exchanges have a 11 December 2009 reference date and therefore a relatively short
period of uplift, this is reflected in the average uplift being 0.62% for these exchanges.
Reference date
Number of exchanges in
2009/10 Average uplift in this period
8-Sep-06 74 4.11%
08-Aug-07 5 5.32%
08-Sep-09 31 (0.05%)
11-Dec-09 659 0.62%
769 0.96%
D.3.5 Effect on the 2009/10 Duct Valuation
This adjustment is needed because BT extracts data from PIPeR shortly before the
year end to enable reporting within a short timeframe. As such, an uplift is required
to bring the extracted data up to date. This step is based on the date that an
exchange went live and an assumption that DPs can be used as a proxy for assets in an
exchange.
The effect on the 2009/10 sample valuation of the uplift is set out below:
• Sample valuation before uplift [%]
• Sample valuation after uplift [%]
• Difference [%]
The effect of the uplift on the sample valuation represent less than 0.92% of the pre
adjustment sample valuation total asset value.
FINAL VERSION – NON-CONFIDENTIAL
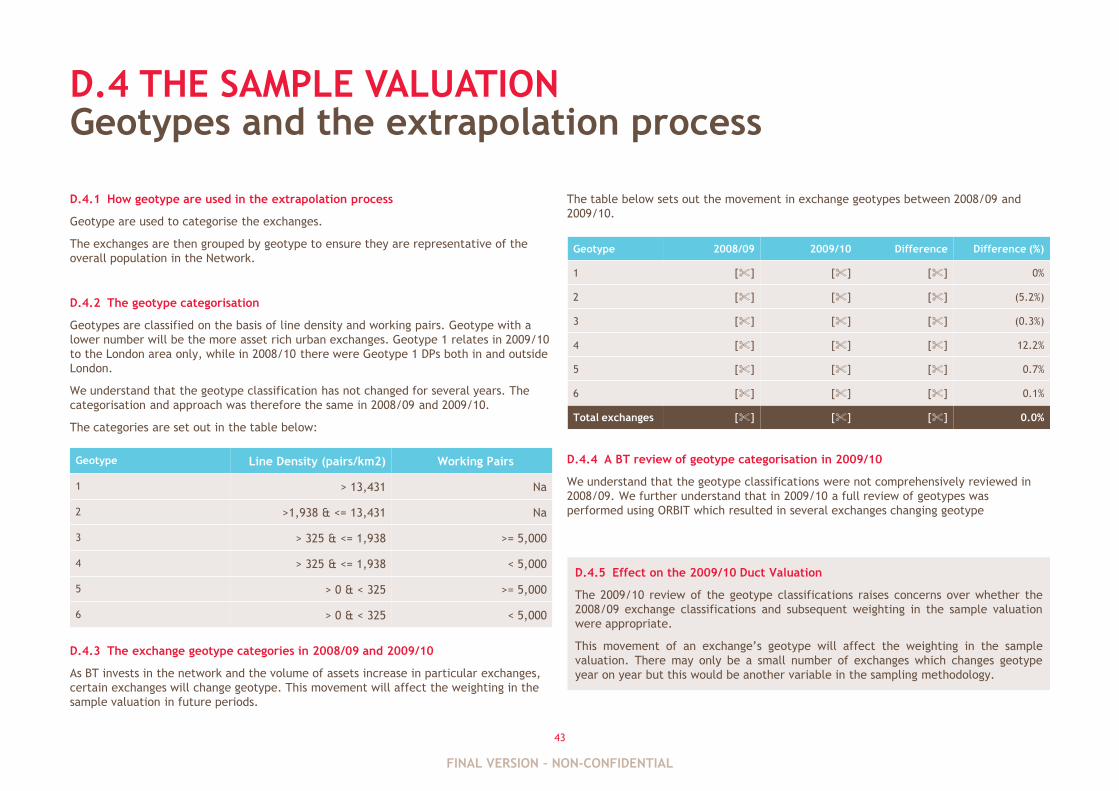
43
D.4 THE SAMPLE VALUATION
D.4.1 How geotype are used in the extrapolation process
Geotype are used to categorise the exchanges.
The exchanges are then grouped by geotype to ensure they are representative of the
overall population in the Network.
D.4.2 The geotype categorisation
Geotypes are classified on the basis of line density and working pairs. Geotype with a
lower number will be the more asset rich urban exchanges. Geotype 1 relates in 2009/10
to the London area only, while in 2008/10 there were Geotype 1 DPs both in and outside
London.
We understand that the geotype classification has not changed for several years. The
categorisation and approach was therefore the same in 2008/09 and 2009/10.
The categories are set out in the table below:
D.4.3 The exchange geotype categories in 2008/09 and 2009/10
As BT invests in the network and the volume of assets increase in particular exchanges,
certain exchanges will change geotype. This movement will affect the weighting in the
sample valuation in future periods.
Geotypes and the extrapolation process
The table below sets out the movement in exchange geotypes between 2008/09 and
2009/10.
D.4.4 A BT review of geotype categorisation in 2009/10
We understand that the geotype classifications were not comprehensively reviewed in
2008/09. We further understand that in 2009/10 a full review of geotypes was
performed using ORBIT which resulted in several exchanges changing geotype
Geotype Line Density (pairs/km2) Working Pairs
1 > 13,431 Na
2 >1,938 & <= 13,431 Na
3 > 325 & <= 1,938 >= 5,000
4 > 325 & <= 1,938 < 5,000
5 > 0 & < 325 >= 5,000
6 > 0 & < 325 < 5,000
Geotype 2008/09 2009/10 Difference Difference (%)
1 [%] [%] [%] 0%
2 [%] [%] [%] (5.2%)
3 [%] [%] [%] (0.3%)
4 [%] [%] [%] 12.2%
5 [%] [%] [%] 0.7%
6 [%] [%] [%] 0.1%
Total exchanges [%] [%] [%] 0.0%
D.4.5 Effect on the 2009/10 Duct Valuation
The 2009/10 review of the geotype classifications raises concerns over whether the
2008/09 exchange classifications and subsequent weighting in the sample valuation
were appropriate.
This movement of an exchange‟s geotype will affect the weighting in the sample
valuation. There may only be a small number of exchanges which changes geotype
year on year but this would be another variable in the sampling methodology.
FINAL VERSION – NON-CONFIDENTIAL
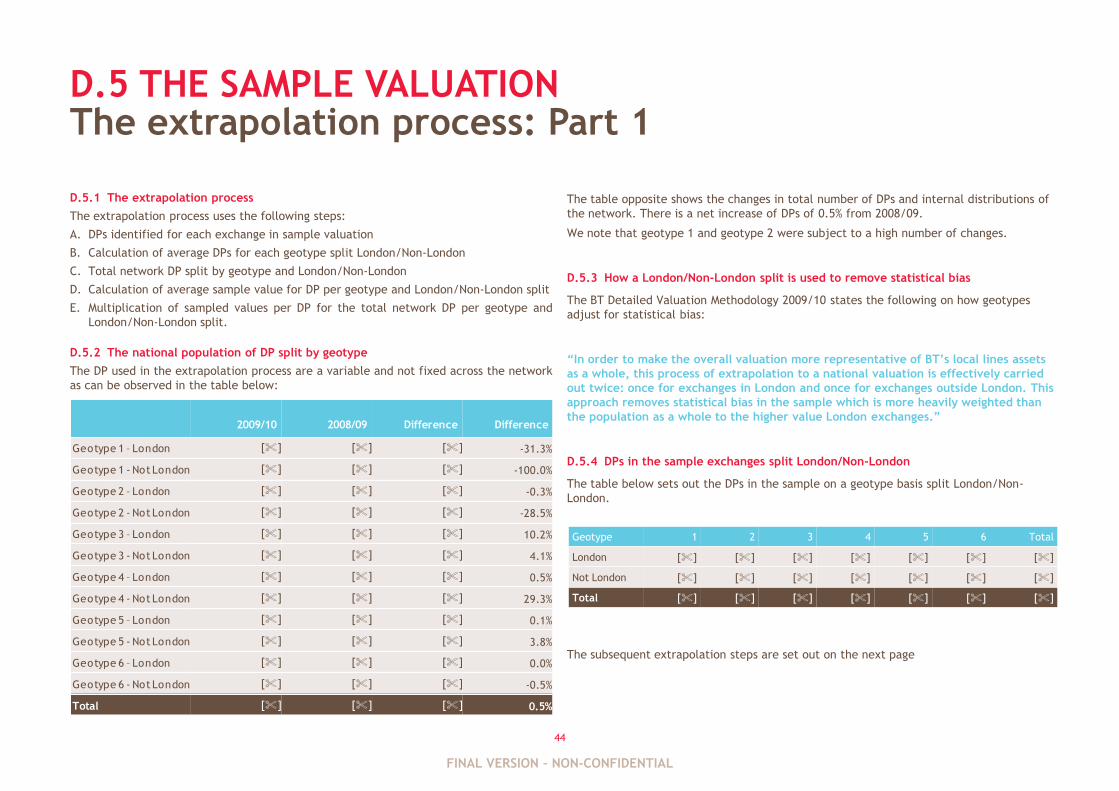
44
D.5 THE SAMPLE VALUATION
D.5.1 The extrapolation process
The extrapolation process uses the following steps:
A. DPs identified for each exchange in sample valuation
B. Calculation of average DPs for each geotype split London/Non-London
C. Total network DP split by geotype and London/Non-London
D. Calculation of average sample value for DP per geotype and London/Non-London split
E. Multiplication of sampled values per DP for the total network DP per geotype and
London/Non-London split.
D.5.2 The national population of DP split by geotype
The DP used in the extrapolation process are a variable and not fixed across the network
as can be observed in the table below:
The table opposite shows the changes in total number of DPs and internal distributions of
the network. There is a net increase of DPs of 0.5% from 2008/09.
We note that geotype 1 and geotype 2 were subject to a high number of changes.
D.5.3 How a London/Non-London split is used to remove statistical bias
The BT Detailed Valuation Methodology 2009/10 states the following on how geotypes
adjust for statistical bias:
“In order to make the overall valuation more representative of BT‟s local lines assets
as a whole, this process of extrapolation to a national valuation is effectively carried
out twice: once for exchanges in London and once for exchanges outside London. This
approach removes statistical bias in the sample which is more heavily weighted than
the population as a whole to the higher value London exchanges.”
D.5.4 DPs in the sample exchanges split London/Non-London
The table below sets out the DPs in the sample on a geotype basis split London/Non-
London.
The subsequent extrapolation steps are set out on the next page
The extrapolation process: Part 1
Geotype 1 2 3 4 5 6 Total
London [%] [%] [%] [%] [%] [%] [%]
Not London [%] [%] [%] [%] [%] [%] [%]
Total [%] [%] [%] [%] [%] [%] [%]
2009/10 2008/09 Difference Difference
Geotype 1 – London [%] [%] [%] -31.3%
Geotype 1 - Not London [%] [%] [%] -100.0%
Geotype 2 – London [%] [%] [%] -0.3%
Geotype 2 - Not London [%] [%] [%] -28.5%
Geotype 3 – London [%] [%] [%] 10.2%
Geotype 3 - Not London [%] [%] [%] 4.1%
Geotype 4 – London [%] [%] [%] 0.5%
Geotype 4 - Not London [%] [%] [%] 29.3%
Geotype 5 – London [%] [%] [%] 0.1%
Geotype 5 - Not London [%] [%] [%] 3.8%
Geotype 6 – London [%] [%] [%] 0.0%
Geotype 6 - Not London [%] [%] [%] -0.5%
Total [%] [%] [%] 0.5%
FINAL VERSION – NON-CONFIDENTIAL
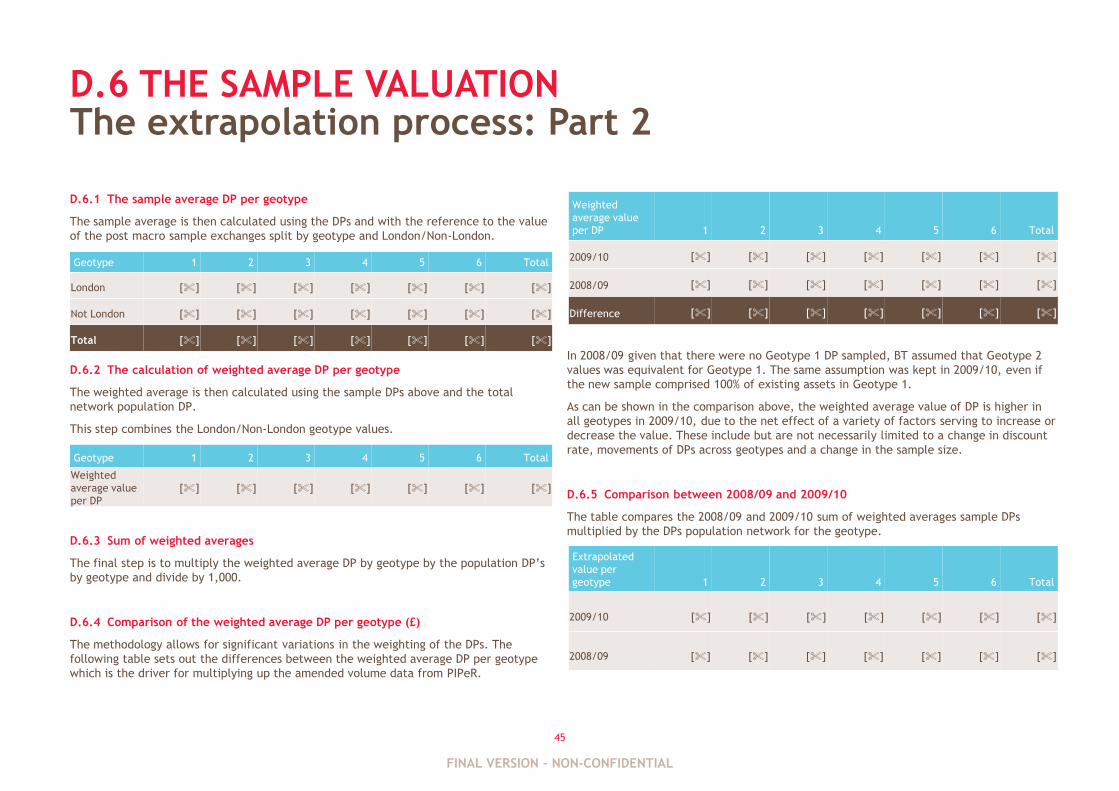
45
D.6 THE SAMPLE VALUATION
D.6.1 The sample average DP per geotype
The sample average is then calculated using the DPs and with the reference to the value
of the post macro sample exchanges split by geotype and London/Non-London.
D.6.2 The calculation of weighted average DP per geotype
The weighted average is then calculated using the sample DPs above and the total
network population DP.
This step combines the London/Non-London geotype values.
D.6.3 Sum of weighted averages
The final step is to multiply the weighted average DP by geotype by the population DP‟s
by geotype and divide by 1,000.
D.6.4 Comparison of the weighted average DP per geotype (£)
The methodology allows for significant variations in the weighting of the DPs. The
following table sets out the differences between the weighted average DP per geotype
which is the driver for multiplying up the amended volume data from PIPeR.
In 2008/09 given that there were no Geotype 1 DP sampled, BT assumed that Geotype 2
values was equivalent for Geotype 1. The same assumption was kept in 2009/10, even if
the new sample comprised 100% of existing assets in Geotype 1.
As can be shown in the comparison above, the weighted average value of DP is higher in
all geotypes in 2009/10, due to the net effect of a variety of factors serving to increase or
decrease the value. These include but are not necessarily limited to a change in discount
rate, movements of DPs across geotypes and a change in the sample size.
D.6.5 Comparison between 2008/09 and 2009/10
The table compares the 2008/09 and 2009/10 sum of weighted averages sample DPs
multiplied by the DPs population network for the geotype.
The extrapolation process: Part 2
Geotype 1 2 3 4 5 6 Total
London [%] [%] [%] [%] [%] [%] [%]
Not London [%] [%] [%] [%] [%] [%] [%]
Total [%] [%] [%] [%] [%] [%] [%]
Geotype 1 2 3 4 5 6 Total
Weighted
average value
per DP
[%] [%] [%] [%] [%] [%] [%]
Extrapolated
value per
geotype 1 2 3 4 5 6 Total
2009/10 [%] [%] [%] [%] [%] [%] [%]
2008/09 [%] [%] [%] [%] [%] [%] [%]
Weighted
average value
per DP 1 2 3 4 5 6 Total
2009/10 [%] [%] [%] [%] [%] [%] [%]
2008/09 [%] [%] [%] [%] [%] [%] [%]
Difference [%] [%] [%] [%] [%] [%] [%]
FINAL VERSION – NON-CONFIDENTIAL
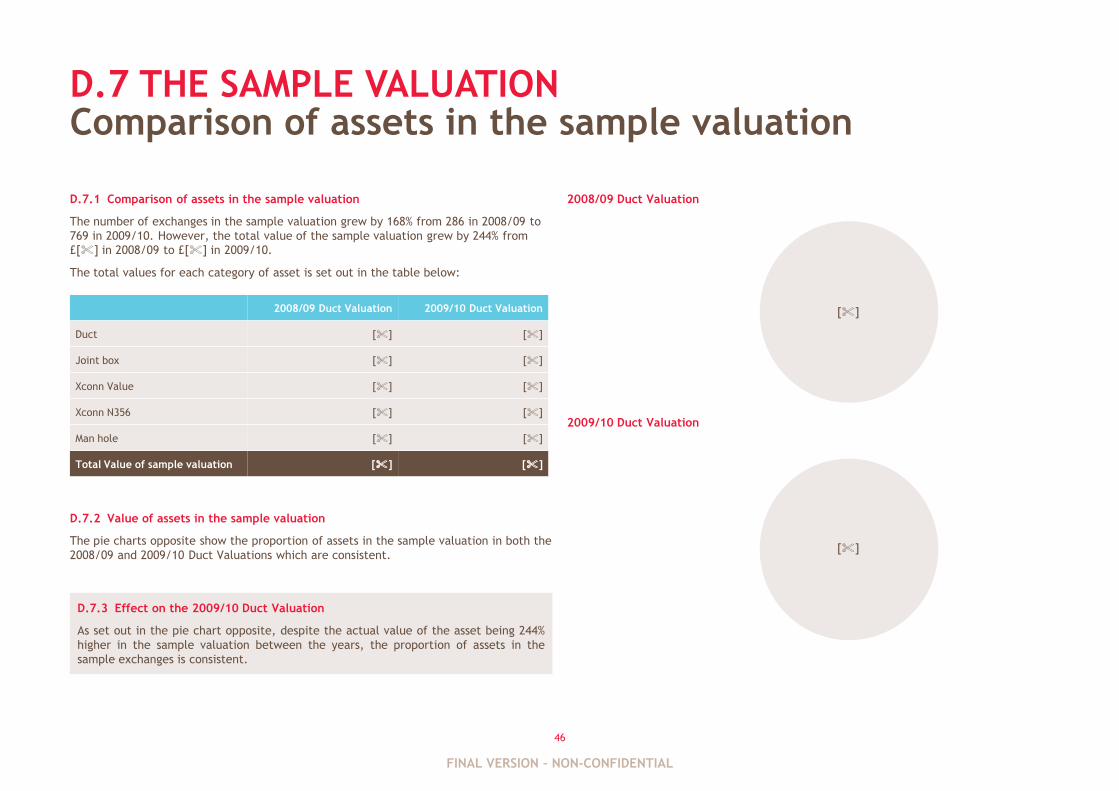
46
D.7 THE SAMPLE VALUATION
D.7.1 Comparison of assets in the sample valuation
The number of exchanges in the sample valuation grew by 168% from 286 in 2008/09 to
769 in 2009/10. However, the total value of the sample valuation grew by 244% from
£[%] in 2008/09 to £[%] in 2009/10.
The total values for each category of asset is set out in the table below:
D.7.2 Value of assets in the sample valuation
The pie charts opposite show the proportion of assets in the sample valuation in both the
2008/09 and 2009/10 Duct Valuations which are consistent.
Comparison of assets in the sample valuation
2008/09 Duct Valuation
2009/10 Duct Valuation
2008/09 Duct Valuation 2009/10 Duct Valuation
Duct [%] [%]
Joint box [%] [%]
Xconn Value [%] [%]
Xconn N356 [%] [%]
Man hole [%] [%]
Total Value of sample valuation [%] [%]
D.7.3 Effect on the 2009/10 Duct Valuation
As set out in the pie chart opposite, despite the actual value of the asset being 244%
higher in the sample valuation between the years, the proportion of assets in the
sample exchanges is consistent.
[%]
[%]
FINAL VERSION – NON-CONFIDENTIAL
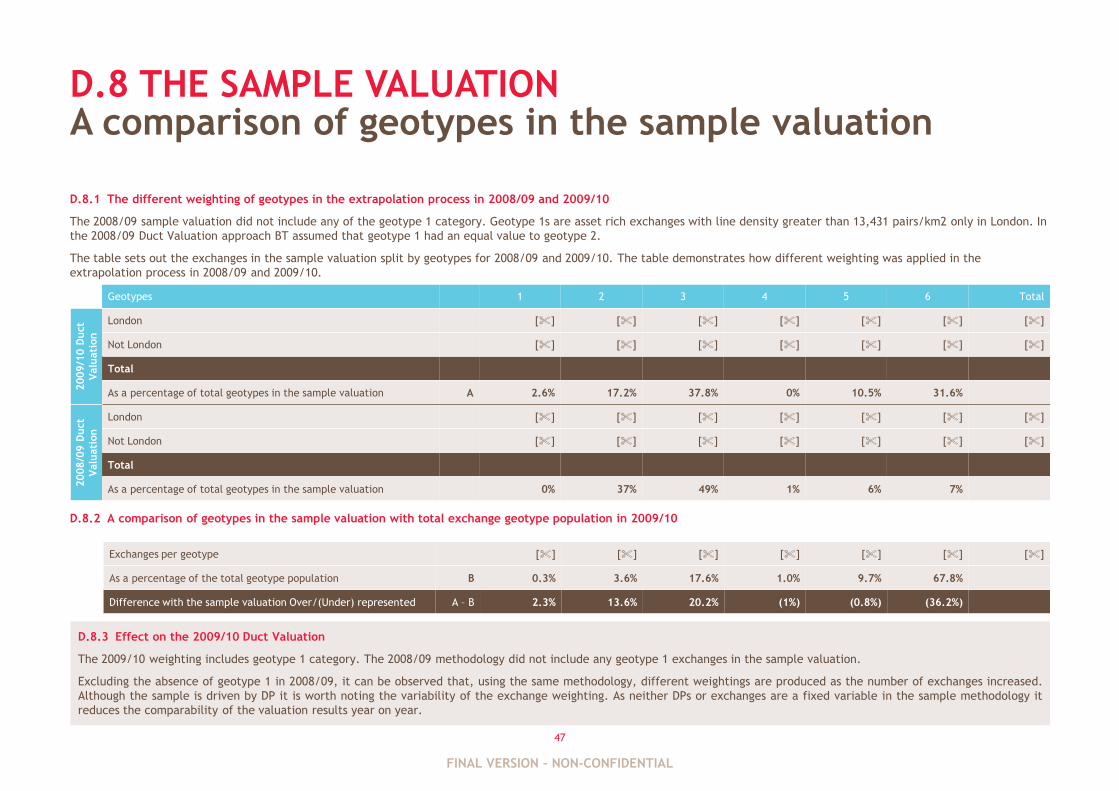
47
D.8 THE SAMPLE VALUATION
D.8.1 The different weighting of geotypes in the extrapolation process in 2008/09 and 2009/10
The 2008/09 sample valuation did not include any of the geotype 1 category. Geotype 1s are asset rich exchanges with line density greater than 13,431 pairs/km2 only in London. In
the 2008/09 Duct Valuation approach BT assumed that geotype 1 had an equal value to geotype 2.
The table sets out the exchanges in the sample valuation split by geotypes for 2008/09 and 2009/10. The table demonstrates how different weighting was applied in the
extrapolation process in 2008/09 and 2009/10.
D.8.2 A comparison of geotypes in the sample valuation with total exchange geotype population in 2009/10
A comparison of geotypes in the sample valuation
Geotypes 1 2 3 4 5 6 Total
2009/1
0D
uct
Valu
ati
on
London [%] [%] [%] [%] [%] [%] [%]
Not London [%] [%] [%] [%] [%] [%] [%]
Total [%] [%] [%] [%] [%] [%] [%]
As a percentage of total geotypes in the sample valuation A 2.6% 17.2% 37.8% 0% 10.5% 31.6%
2008/0
9D
uct
Valu
ati
on
London [%] [%] [%] [%] [%] [%] [%]
Not London [%] [%] [%] [%] [%] [%] [%]
Total [%] [%] [%] [%] [%] [%] [%]
As a percentage of total geotypes in the sample valuation 0% 37% 49% 1% 6% 7%
D.8.3 Effect on the 2009/10 Duct Valuation
The 2009/10 weighting includes geotype 1 category. The 2008/09 methodology did not include any geotype 1 exchanges in the sample valuation.
Excluding the absence of geotype 1 in 2008/09, it can be observed that, using the same methodology, different weightings are produced as the number of exchanges increased.
Although the sample is driven by DP it is worth noting the variability of the exchange weighting. As neither DPs or exchanges are a fixed variable in the sample methodology it
reduces the comparability of the valuation results year on year.
Exchanges per geotype [%] [%] [%] [%] [%] [%] [%]
As a percentage of the total geotype population B 0.3% 3.6% 17.6% 1.0% 9.7% 67.8%
Difference with the sample valuation Over/(Under) represented A – B 2.3% 13.6% 20.2% (1%) (0.8%) (36.2%)
FINAL VERSION – NON-CONFIDENTIAL
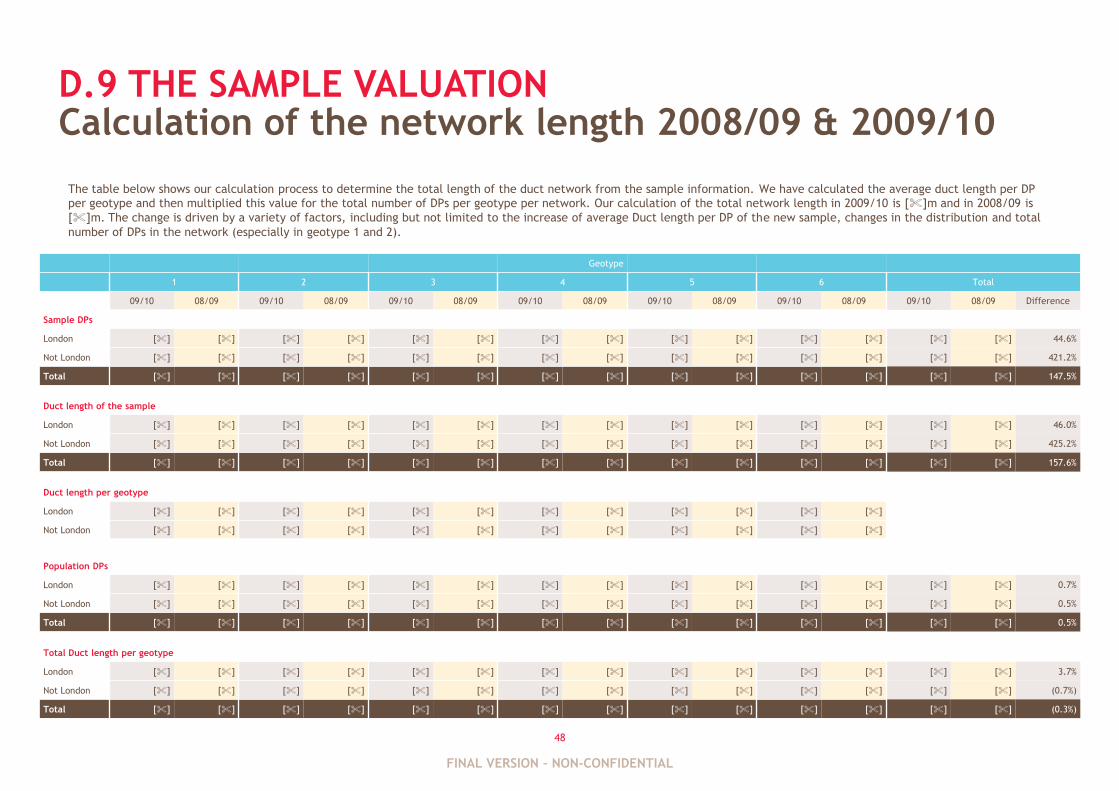
48
Calculation of the network length 2008/09 & 2009/10D.9 THE SAMPLE VALUATION
Geotype
1 2 3 4 5 6 Total
09/10 08/09 09/10 08/09 09/10 08/09 09/10 08/09 09/10 08/09 09/10 08/09 09/10 08/09 Difference
Sample DPs
London [%] [%] [%] [%] [%] [%] [%] [%] [%] [%] [%] [%] [%] [%] 44.6%
Not London [%] [%] [%] [%] [%] [%] [%] [%] [%] [%] [%] [%] [%] [%] 421.2%
Total [%] [%] [%] [%] [%] [%] [%] [%] [%] [%] [%] [%] [%] [%] 147.5%
Duct length of the sample
London [%] [%] [%] [%] [%] [%] [%] [%] [%] [%] [%] [%] [%] [%] 46.0%
Not London [%] [%] [%] [%] [%] [%] [%] [%] [%] [%] [%] [%] [%] [%] 425.2%
Total [%] [%] [%] [%] [%] [%] [%] [%] [%] [%] [%] [%] [%] [%] 157.6%
Duct length per geotype
London [%] [%] [%] [%] [%] [%] [%] [%] [%] [%] [%] [%]
Not London [%] [%] [%] [%] [%] [%] [%] [%] [%] [%] [%] [%]
Population DPs
London [%] [%] [%] [%] [%] [%] [%] [%] [%] [%] [%] [%] [%] [%] 0.7%
Not London [%] [%] [%] [%] [%] [%] [%] [%] [%] [%] [%] [%] [%] [%] 0.5%
Total [%] [%] [%] [%] [%] [%] [%] [%] [%] [%] [%] [%] [%] [%] 0.5%
Total Duct length per geotype
London [%] [%] [%] [%] [%] [%] [%] [%] [%] [%] [%] [%] [%] [%] 3.7%
Not London [%] [%] [%] [%] [%] [%] [%] [%] [%] [%] [%] [%] [%] [%] (0.7%)
Total [%] [%] [%] [%] [%] [%] [%] [%] [%] [%] [%] [%] [%] [%] (0.3%)
The table below shows our calculation process to determine the total length of the duct network from the sample information. We have calculated the average duct length per DP
per geotype and then multiplied this value for the total number of DPs per geotype per network. Our calculation of the total network length in 2009/10 is [%]m and in 2008/09 is
[%]m. The change is driven by a variety of factors, including but not limited to the increase of average Duct length per DP of the new sample, changes in the distribution and total
number of DPs in the network (especially in geotype 1 and 2).
FINAL VERSION – NON-CONFIDENTIAL
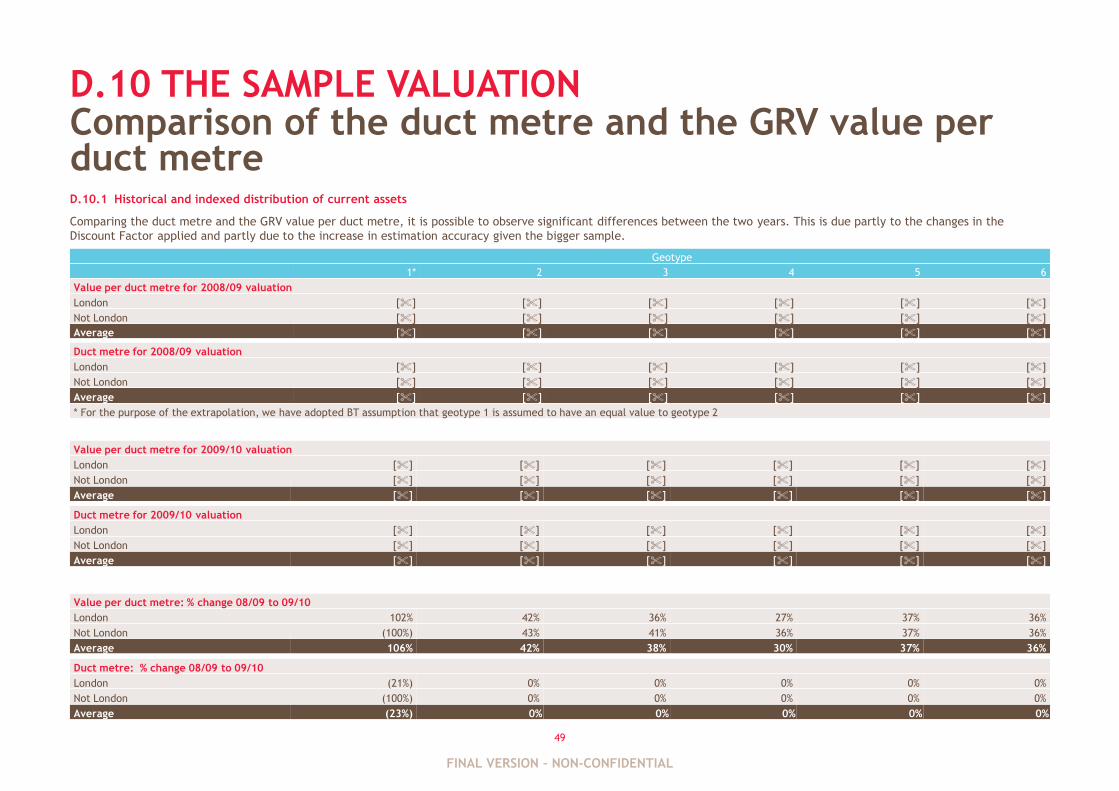
49
D.10 THE SAMPLE VALUATION
D.10.1 Historical and indexed distribution of current assets
Comparing the duct metre and the GRV value per duct metre, it is possible to observe significant differences between the two years. This is due partly to the changes in the
Discount Factor applied and partly due to the increase in estimation accuracy given the bigger sample.
Comparison of the duct metre and the GRV value per duct metre
Value per duct metre for 2009/10 valuation
London [%] [%] [%] [%] [%] [%]
Not London [%] [%] [%] [%] [%] [%]
Average [%] [%] [%] [%] [%] [%]
Duct metre for 2009/10 valuation
London [%] [%] [%] [%] [%] [%]
Not London [%] [%] [%] [%] [%] [%]
Average [%] [%] [%] [%] [%] [%]
Geotype
1* 2 3 4 5 6
Value per duct metre for 2008/09 valuation
London [%] [%] [%] [%] [%] [%]
Not London [%] [%] [%] [%] [%] [%]
Average [%] [%] [%] [%] [%] [%]
Duct metre for 2008/09 valuation
London [%] [%] [%] [%] [%] [%]
Not London [%] [%] [%] [%] [%] [%]
Average [%] [%] [%] [%] [%] [%]
* For the purpose of the extrapolation, we have adopted BT assumption that geotype 1 is assumed to have an equal value to geotype 2
Value per duct metre: % change 08/09 to 09/10
London 102% 42% 36% 27% 37% 36%
Not London (100%) 43% 41% 36% 37% 36%
Average 106% 42% 38% 30% 37% 36%
Duct metre: % change 08/09 to 09/10
London (21%) 0% 0% 0% 0% 0%
Not London (100%) 0% 0% 0% 0% 0%
Average (23%) 0% 0% 0% 0% 0%
FINAL VERSION – NON-CONFIDENTIAL
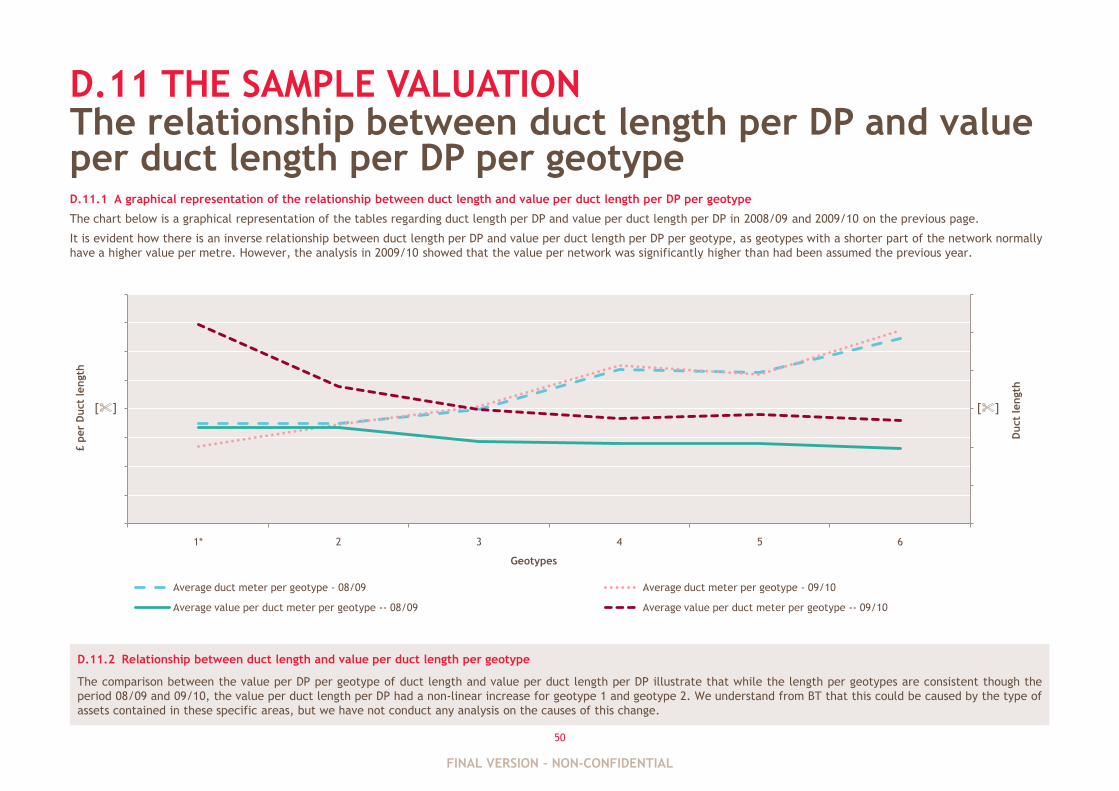
50
D.11 THE SAMPLE VALUATION
D.11.1 A graphical representation of the relationship between duct length and value per duct length per DP per geotype
The chart below is a graphical representation of the tables regarding duct length per DP and value per duct length per DP in 2008/09 and 2009/10 on the previous page.
It is evident how there is an inverse relationship between duct length per DP and value per duct length per DP per geotype, as geotypes with a shorter part of the network normally
have a higher value per metre. However, the analysis in 2009/10 showed that the value per network was significantly higher than had been assumed the previous year.
The relationship between duct length per DP and value per duct length per DP per geotype
D.11.2 Relationship between duct length and value per duct length per geotype
The comparison between the value per DP per geotype of duct length and value per duct length per DP illustrate that while the length per geotypes are consistent though the
period 08/09 and 09/10, the value per duct length per DP had a non-linear increase for geotype 1 and geotype 2. We understand from BT that this could be caused by the type of
assets contained in these specific areas, but we have not conduct any analysis on the causes of this change.
1* 2 3 4 5 6
Duct
length
£ p
er
Duct
length
Geotypes
Average duct meter per geotype - 08/09 Average duct meter per geotype - 09/10
Average value per duct meter per geotype -- 08/09 Average value per duct meter per geotype -- 09/10
[%] [%]
FINAL VERSION – NON-CONFIDENTIAL

APPENIDIX ETHE NATIONAL VALUATION
FINAL VERSION – NON-CONFIDENTIAL
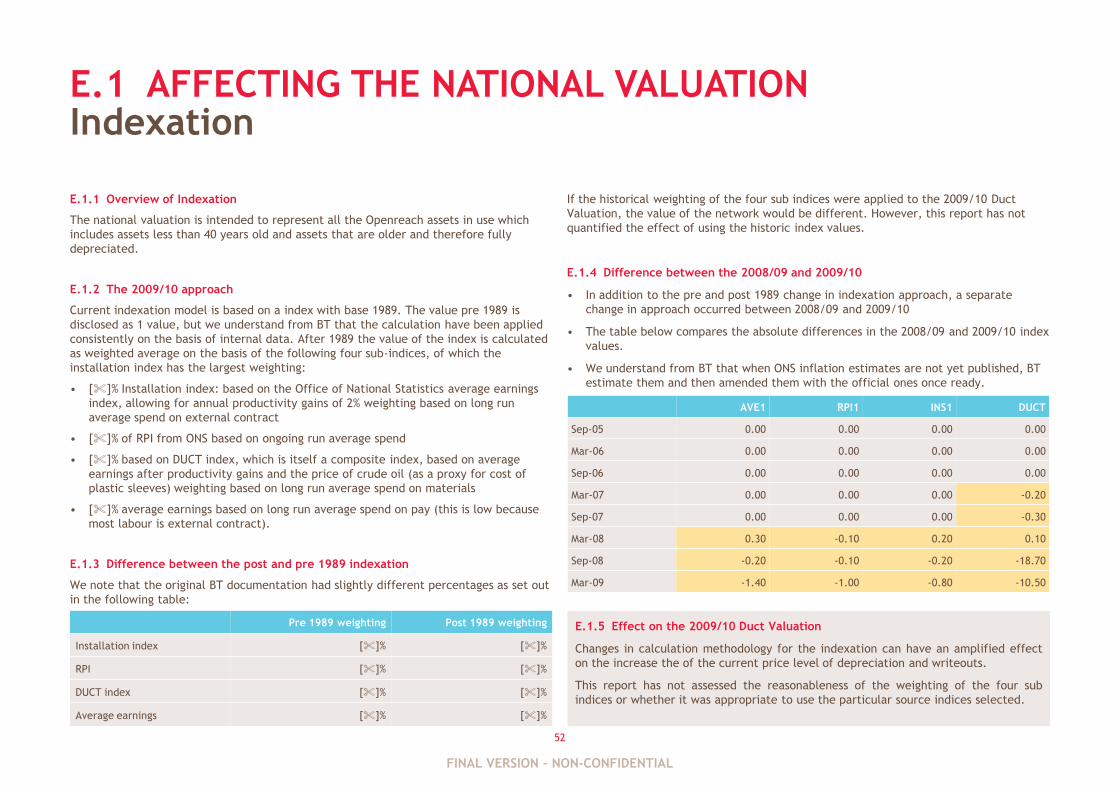
52
E.1 AFFECTING THE NATIONAL VALUATION
E.1.1 Overview of Indexation
The national valuation is intended to represent all the Openreach assets in use which
includes assets less than 40 years old and assets that are older and therefore fully
depreciated.
E.1.2 The 2009/10 approach
Current indexation model is based on a index with base 1989. The value pre 1989 is
disclosed as 1 value, but we understand from BT that the calculation have been applied
consistently on the basis of internal data. After 1989 the value of the index is calculated
as weighted average on the basis of the following four sub-indices, of which the
installation index has the largest weighting:
• [%]% Installation index: based on the Office of National Statistics average earnings
index, allowing for annual productivity gains of 2% weighting based on long run
average spend on external contract
• [%]% of RPI from ONS based on ongoing run average spend
• [%]% based on DUCT index, which is itself a composite index, based on average
earnings after productivity gains and the price of crude oil (as a proxy for cost of
plastic sleeves) weighting based on long run average spend on materials
• [%]% average earnings based on long run average spend on pay (this is low because
most labour is external contract).
E.1.3 Difference between the post and pre 1989 indexation
We note that the original BT documentation had slightly different percentages as set out
in the following table:
Indexation
If the historical weighting of the four sub indices were applied to the 2009/10 Duct
Valuation, the value of the network would be different. However, this report has not
quantified the effect of using the historic index values.
E.1.4 Difference between the 2008/09 and 2009/10
• In addition to the pre and post 1989 change in indexation approach, a separate
change in approach occurred between 2008/09 and 2009/10
• The table below compares the absolute differences in the 2008/09 and 2009/10 index
values.
• We understand from BT that when ONS inflation estimates are not yet published, BT
estimate them and then amended them with the official ones once ready.
Pre 1989 weighting Post 1989 weighting
Installation index [%]% [%]%
RPI [%]% [%]%
DUCT index [%]% [%]%
Average earnings [%]% [%]%
E.1.5 Effect on the 2009/10 Duct Valuation
Changes in calculation methodology for the indexation can have an amplified effect
on the increase the of the current price level of depreciation and writeouts.
This report has not assessed the reasonableness of the weighting of the four sub
indices or whether it was appropriate to use the particular source indices selected.
AVE1 RPI1 INS1 DUCT
Sep-05 0.00 0.00 0.00 0.00
Mar-06 0.00 0.00 0.00 0.00
Sep-06 0.00 0.00 0.00 0.00
Mar-07 0.00 0.00 0.00 -0.20
Sep-07 0.00 0.00 0.00 -0.30
Mar-08 0.30 -0.10 0.20 0.10
Sep-08 -0.20 -0.10 -0.20 -18.70
Mar-09 -1.40 -1.00 -0.80 -10.50
FINAL VERSION – NON-CONFIDENTIAL
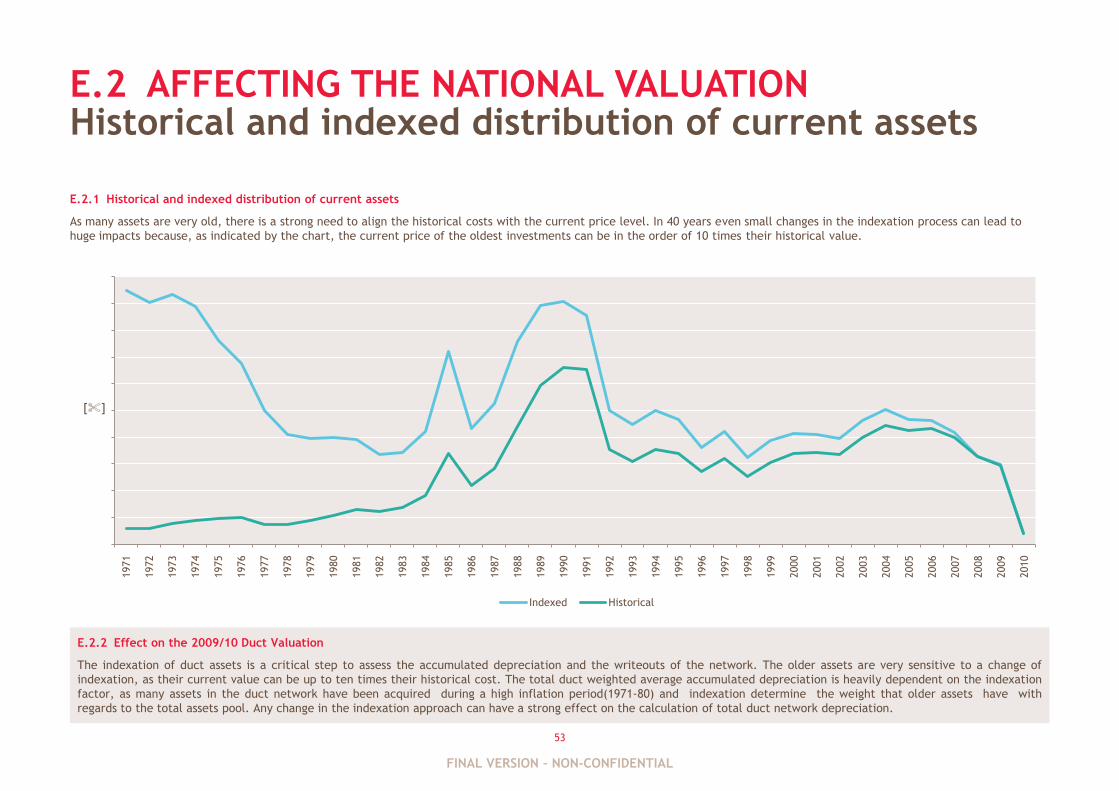
53
E.2 AFFECTING THE NATIONAL VALUATION
E.2.1 Historical and indexed distribution of current assets
As many assets are very old, there is a strong need to align the historical costs with the current price level. In 40 years even small changes in the indexation process can lead to
huge impacts because, as indicated by the chart, the current price of the oldest investments can be in the order of 10 times their historical value.
Historical and indexed distribution of current assets
E.2.2 Effect on the 2009/10 Duct Valuation
The indexation of duct assets is a critical step to assess the accumulated depreciation and the writeouts of the network. The older assets are very sensitive to a change of
indexation, as their current value can be up to ten times their historical cost. The total duct weighted average accumulated depreciation is heavily dependent on the indexation
factor, as many assets in the duct network have been acquired during a high inflation period(1971-80) and indexation determine the weight that older assets have with
regards to the total assets pool. Any change in the indexation approach can have a strong effect on the calculation of total duct network depreciation.
1971
1972
1973
1974
1975
1976
1977
1978
1979
1980
1981
1982
1983
1984
1985
1986
1987
1988
1989
1990
1991
1992
1993
1994
1995
1996
1997
1998
1999
2000
2001
2002
2003
2004
2005
2006
2007
2008
2009
2010
Indexed Historical
[%]
FINAL VERSION – NON-CONFIDENTIAL
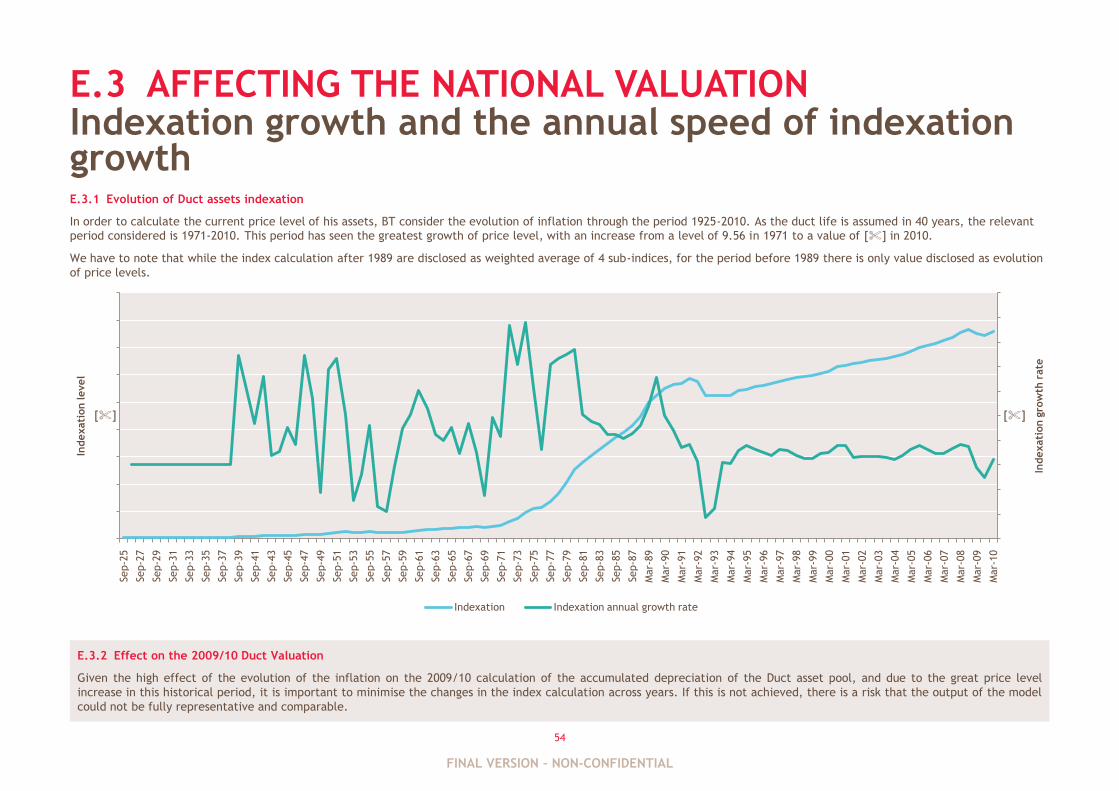
54
E.3 AFFECTING THE NATIONAL VALUATION
E.3.1 Evolution of Duct assets indexation
In order to calculate the current price level of his assets, BT consider the evolution of inflation through the period 1925-2010. As the duct life is assumed in 40 years, the relevant
period considered is 1971-2010. This period has seen the greatest growth of price level, with an increase from a level of 9.56 in 1971 to a value of [%] in 2010.
We have to note that while the index calculation after 1989 are disclosed as weighted average of 4 sub-indices, for the period before 1989 there is only value disclosed as evolution
of price levels.
Indexation growth and the annual speed of indexation growth
E.3.2 Effect on the 2009/10 Duct Valuation
Given the high effect of the evolution of the inflation on the 2009/10 calculation of the accumulated depreciation of the Duct asset pool, and due to the great price level
increase in this historical period, it is important to minimise the changes in the index calculation across years. If this is not achieved, there is a risk that the output of the model
could not be fully representative and comparable.
Sep-2
5
Sep-2
7
Sep-2
9
Sep-3
1
Sep-3
3
Sep-3
5
Sep-3
7
Sep-3
9
Sep-4
1
Sep-4
3
Sep-4
5
Sep-4
7
Sep-4
9
Sep-5
1
Sep-5
3
Sep-5
5
Sep-5
7
Sep-5
9
Sep-6
1
Sep-6
3
Sep-6
5
Sep-6
7
Sep-6
9
Sep-7
1
Sep-7
3
Sep-7
5
Sep-7
7
Sep-7
9
Sep-8
1
Sep-8
3
Sep-8
5
Sep-8
7
Mar-
89
Mar-
90
Mar-
91
Mar-
92
Mar-
93
Mar-
94
Mar-
95
Mar-
96
Mar-
97
Mar-
98
Mar-
99
Mar-
00
Mar-
01
Mar-
02
Mar-
03
Mar-
04
Mar-
05
Mar-
06
Mar-
07
Mar-
08
Mar-
09
Mar-
10
Indexati
on g
row
th r
ate
Indexati
on level
Indexation Indexation annual growth rate
[%] [%]
FINAL VERSION – NON-CONFIDENTIAL
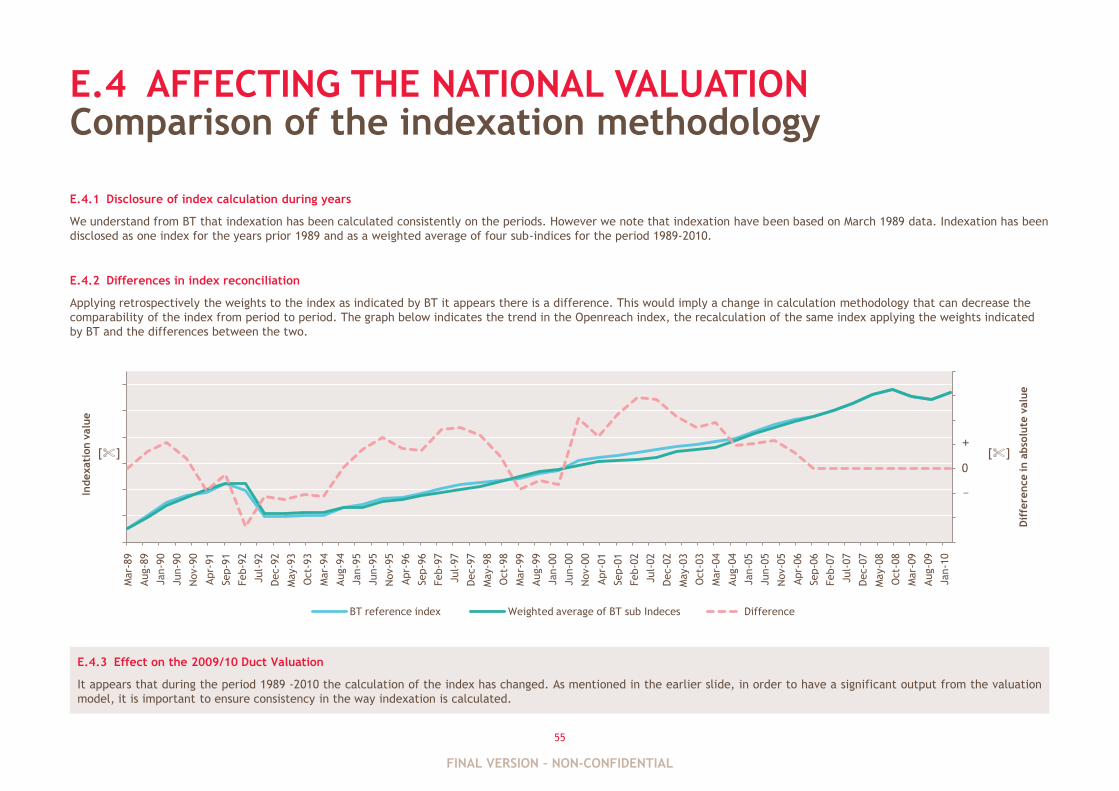
55
E.4 AFFECTING THE NATIONAL VALUATION
E.4.1 Disclosure of index calculation during years
We understand from BT that indexation has been calculated consistently on the periods. However we note that indexation have been based on March 1989 data. Indexation has been
disclosed as one index for the years prior 1989 and as a weighted average of four sub-indices for the period 1989-2010.
E.4.2 Differences in index reconciliation
Applying retrospectively the weights to the index as indicated by BT it appears there is a difference. This would imply a change in calculation methodology that can decrease the
comparability of the index from period to period. The graph below indicates the trend in the Openreach index, the recalculation of the same index applying the weights indicated
by BT and the differences between the two.
Comparison of the indexation methodology
E.4.3 Effect on the 2009/10 Duct Valuation
It appears that during the period 1989 -2010 the calculation of the index has changed. As mentioned in the earlier slide, in order to have a significant output from the valuation
model, it is important to ensure consistency in the way indexation is calculated.
Mar-
89
Aug-8
9
Jan-9
0
Jun-9
0
Nov-9
0
Apr-
91
Sep-9
1
Feb-9
2
Jul-
92
Dec-9
2
May-9
3
Oct-
93
Mar-
94
Aug-9
4
Jan-9
5
Jun-9
5
Nov-9
5
Apr-
96
Sep-9
6
Feb-9
7
Jul-
97
Dec-9
7
May-9
8
Oct-
98
Mar-
99
Aug-9
9
Jan-0
0
Jun-0
0
Nov-0
0
Apr-
01
Sep-0
1
Feb-0
2
Jul-
02
Dec-0
2
May-0
3
Oct-
03
Mar-
04
Aug-0
4
Jan-0
5
Jun-0
5
Nov-0
5
Apr-
06
Sep-0
6
Feb-0
7
Jul-
07
Dec-0
7
May-0
8
Oct-
08
Mar-
09
Aug-0
9
Jan-1
0
Dif
fere
nce in a
bso
lute
valu
e
Indexati
on v
alu
e
BT reference index Weighted average of BT sub Indeces Difference
[%] [%]
0
+
_
FINAL VERSION – NON-CONFIDENTIAL
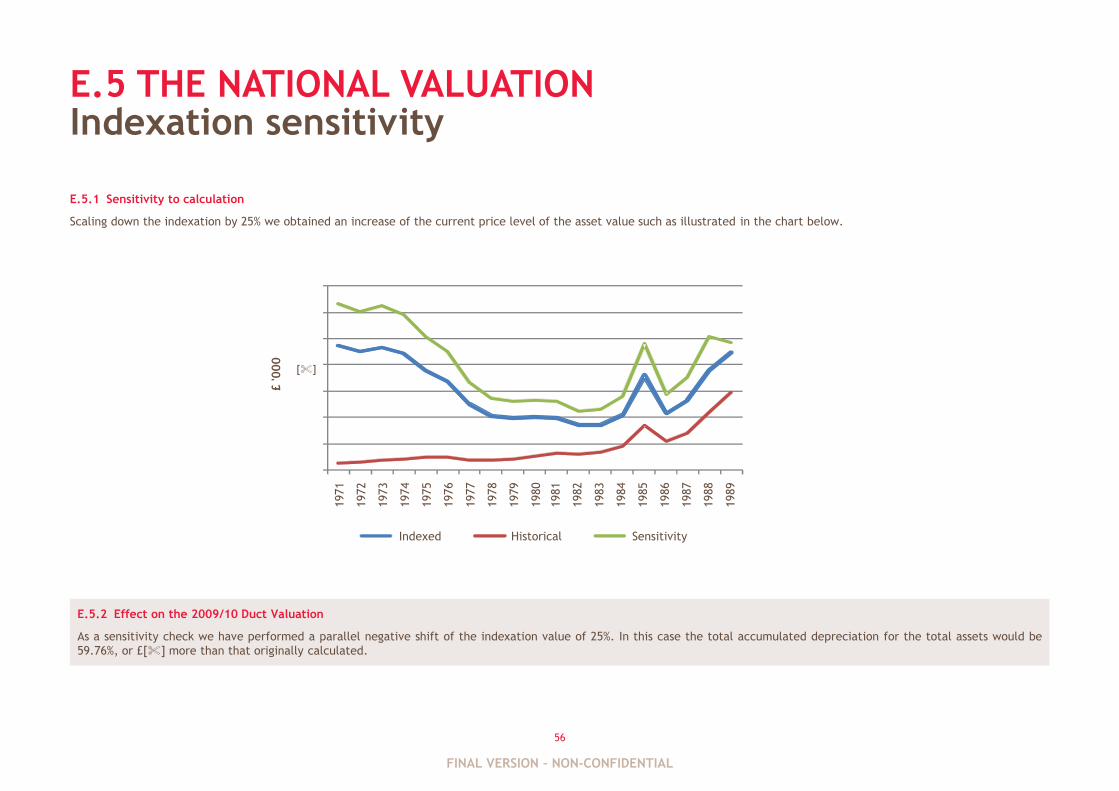
56
E.5 THE NATIONAL VALUATION
E.5.1 Sensitivity to calculation
Scaling down the indexation by 25% we obtained an increase of the current price level of the asset value such as illustrated in the chart below.
Indexation sensitivity
E.5.2 Effect on the 2009/10 Duct Valuation
As a sensitivity check we have performed a parallel negative shift of the indexation value of 25%. In this case the total accumulated depreciation for the total assets would be
59.76%, or £[%] more than that originally calculated.
[%]
1971
1972
1973
1974
1975
1976
1977
1978
1979
1980
1981
1982
1983
1984
1985
1986
1987
1988
1989
£ '000
Indexed Historical Sensitivity
FINAL VERSION – NON-CONFIDENTIAL
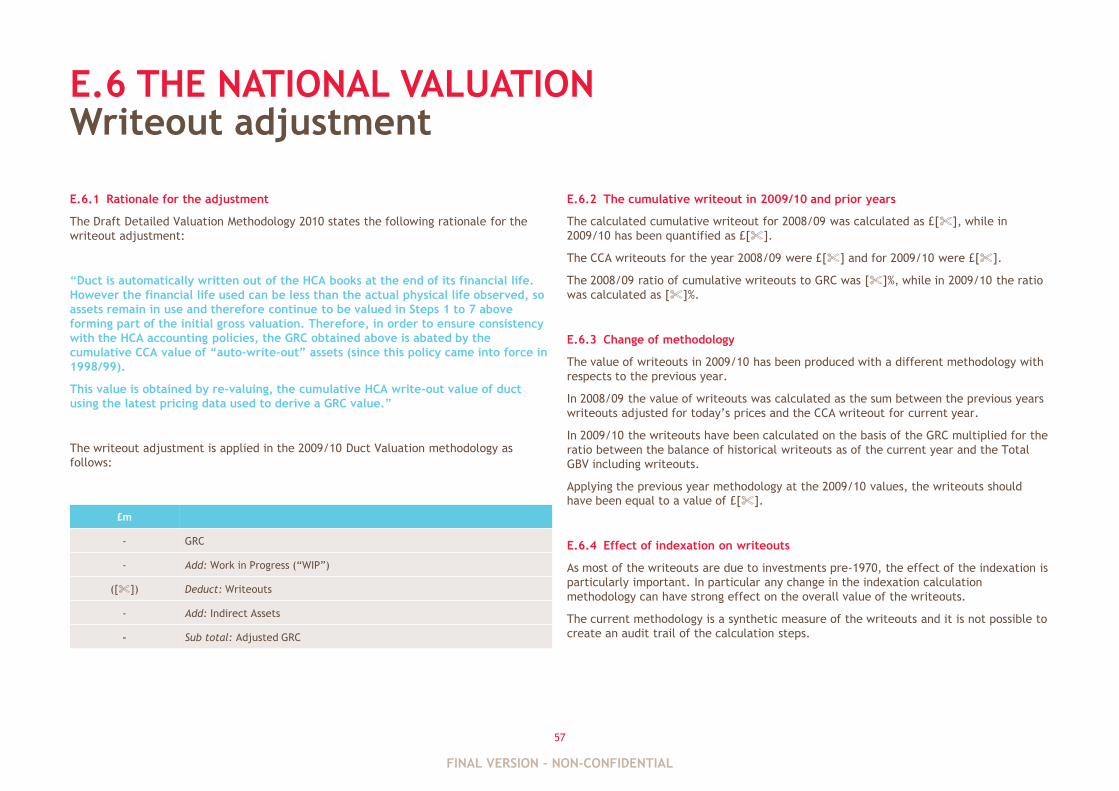
57
E.6 THE NATIONAL VALUATION
E.6.1 Rationale for the adjustment
The Draft Detailed Valuation Methodology 2010 states the following rationale for the
writeout adjustment:
“Duct is automatically written out of the HCA books at the end of its financial life.
However the financial life used can be less than the actual physical life observed, so
assets remain in use and therefore continue to be valued in Steps 1 to 7 above
forming part of the initial gross valuation. Therefore, in order to ensure consistency
with the HCA accounting policies, the GRC obtained above is abated by the
cumulative CCA value of “auto-write-out” assets (since this policy came into force in
1998/99).
This value is obtained by re-valuing, the cumulative HCA write-out value of duct
using the latest pricing data used to derive a GRC value.”
The writeout adjustment is applied in the 2009/10 Duct Valuation methodology as
follows:
Writeout adjustment
E.6.2 The cumulative writeout in 2009/10 and prior years
The calculated cumulative writeout for 2008/09 was calculated as £[%], while in
2009/10 has been quantified as £[%].
The CCA writeouts for the year 2008/09 were £[%] and for 2009/10 were £[%].
The 2008/09 ratio of cumulative writeouts to GRC was [%]%, while in 2009/10 the ratio
was calculated as [%]%.
E.6.3 Change of methodology
The value of writeouts in 2009/10 has been produced with a different methodology with
respects to the previous year.
In 2008/09 the value of writeouts was calculated as the sum between the previous years
writeouts adjusted for today‟s prices and the CCA writeout for current year.
In 2009/10 the writeouts have been calculated on the basis of the GRC multiplied for the
ratio between the balance of historical writeouts as of the current year and the Total
GBV including writeouts.
Applying the previous year methodology at the 2009/10 values, the writeouts should
have been equal to a value of £[%].
E.6.4 Effect of indexation on writeouts
As most of the writeouts are due to investments pre-1970, the effect of the indexation is
particularly important. In particular any change in the indexation calculation
methodology can have strong effect on the overall value of the writeouts.
The current methodology is a synthetic measure of the writeouts and it is not possible to
create an audit trail of the calculation steps.
£m
- GRC
- Add: Work in Progress (“WIP”)
([%]) Deduct: Writeouts
- Add: Indirect Assets
- Sub total: Adjusted GRC
FINAL VERSION – NON-CONFIDENTIAL
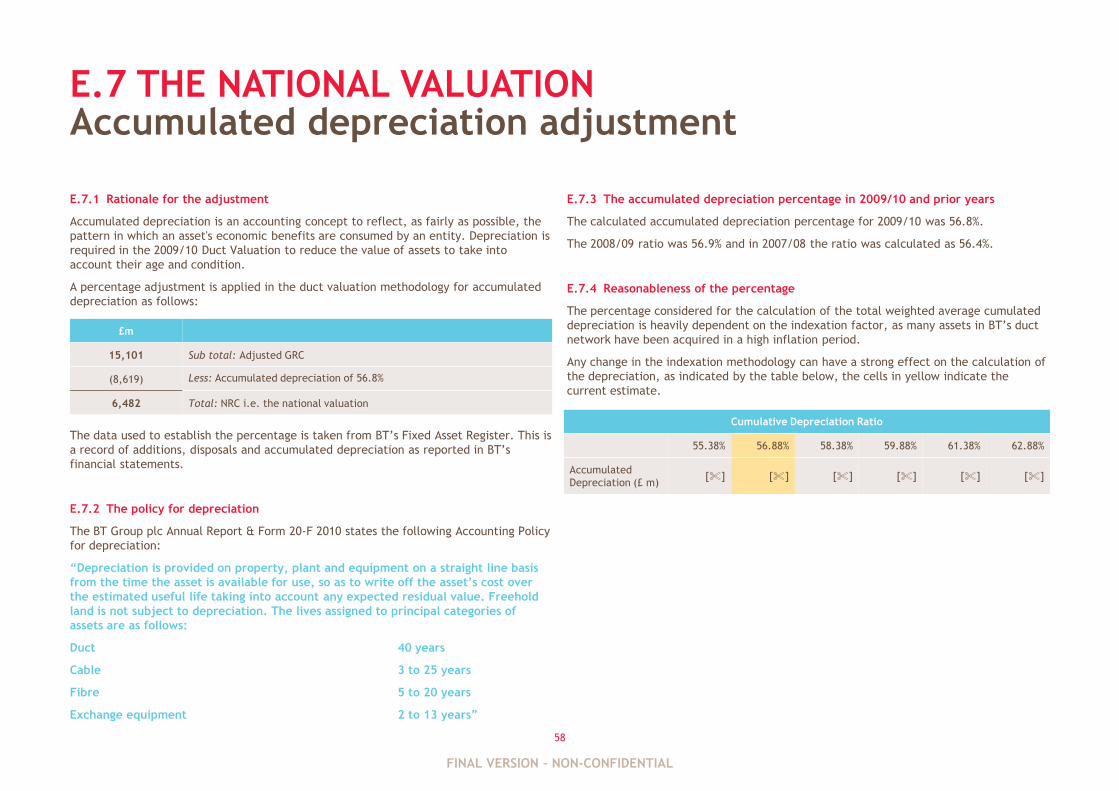
58
E.7 THE NATIONAL VALUATION
E.7.1 Rationale for the adjustment
Accumulated depreciation is an accounting concept to reflect, as fairly as possible, the
pattern in which an asset's economic benefits are consumed by an entity. Depreciation is
required in the 2009/10 Duct Valuation to reduce the value of assets to take into
account their age and condition.
A percentage adjustment is applied in the duct valuation methodology for accumulated
depreciation as follows:
The data used to establish the percentage is taken from BT‟s Fixed Asset Register. This is
a record of additions, disposals and accumulated depreciation as reported in BT‟s
financial statements.
E.7.2 The policy for depreciation
The BT Group plc Annual Report & Form 20-F 2010 states the following Accounting Policy
for depreciation:
“Depreciation is provided on property, plant and equipment on a straight line basis
from the time the asset is available for use, so as to write off the asset‟s cost over
the estimated useful life taking into account any expected residual value. Freehold
land is not subject to depreciation. The lives assigned to principal categories of
assets are as follows:
Duct 40 years
Cable 3 to 25 years
Fibre 5 to 20 years
Exchange equipment 2 to 13 years”
Accumulated depreciation adjustment
E.7.3 The accumulated depreciation percentage in 2009/10 and prior years
The calculated accumulated depreciation percentage for 2009/10 was 56.8%.
The 2008/09 ratio was 56.9% and in 2007/08 the ratio was calculated as 56.4%.
E.7.4 Reasonableness of the percentage
The percentage considered for the calculation of the total weighted average cumulated
depreciation is heavily dependent on the indexation factor, as many assets in BT‟s duct
network have been acquired in a high inflation period.
Any change in the indexation methodology can have a strong effect on the calculation of
the depreciation, as indicated by the table below, the cells in yellow indicate the
current estimate.
£m
15,101 Sub total: Adjusted GRC
(8,619) Less: Accumulated depreciation of 56.8%
6,482 Total: NRC i.e. the national valuation
Cumulative Depreciation Ratio
55.38% 56.88% 58.38% 59.88% 61.38% 62.88%
Accumulated
Depreciation (£ m)[%] [%] [%] [%] [%] [%]
FINAL VERSION – NON-CONFIDENTIAL
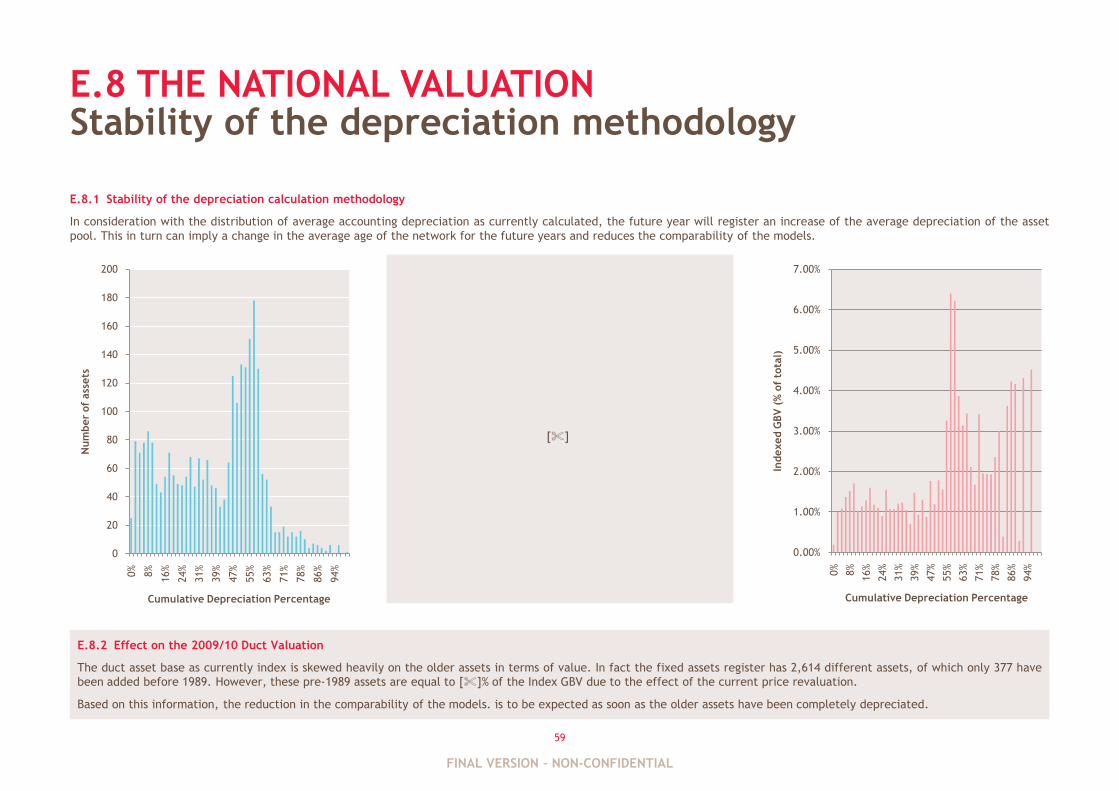
59
E.8 THE NATIONAL VALUATIONStability of the depreciation methodology
E.8.1 Stability of the depreciation calculation methodology
In consideration with the distribution of average accounting depreciation as currently calculated, the future year will register an increase of the average depreciation of the asset
pool. This in turn can imply a change in the average age of the network for the future years and reduces the comparability of the models.
E.8.2 Effect on the 2009/10 Duct Valuation
The duct asset base as currently index is skewed heavily on the older assets in terms of value. In fact the fixed assets register has 2,614 different assets, of which only 377 have
been added before 1989. However, these pre-1989 assets are equal to [%]% of the Index GBV due to the effect of the current price revaluation.
Based on this information, the reduction in the comparability of the models. is to be expected as soon as the older assets have been completely depreciated.
0
20
40
60
80
100
120
140
160
180
200
0%
8%
16%
24%
31%
39%
47%
55%
63%
71%
78%
86%
94%
Num
ber
of
ass
ets
Cumulative Depreciation Percentage
0.00%
1.00%
2.00%
3.00%
4.00%
5.00%
6.00%
7.00%
0%
8%
16%
24%
31%
39%
47%
55%
63%
71%
78%
86%
94%
Indexed G
BV
(%
of
tota
l)
Cumulative Depreciation Percentage
[%]
FINAL VERSION – NON-CONFIDENTIAL

BDO LLP, a UK limited liability partnership registered in England and Wales under number OC305127, is a member of BDO
International Limited, a UK company limited by guarantee, and forms part of the international BDO network of independent
member firms. A list of members' names is open to inspection at our registered office, 55 Baker Street, London W1U 7EU. BDO
LLP is authorised and regulated by the Financial Services Authority to conduct investment business.
BDO is the brand name of the BDO network and for each of the BDO Member Firms.
BDO Northern Ireland, a partnership formed in and under the laws of Northern Ireland, is licensed to operate within the
international BDO network of independent member firms.
Copyright ©2010 BDO LLP. All rights reserved.
www.bdo.co.uk
„Tax Team of the Year‟ 2009 and 2008
„Audit Team of the Year‟ 2008
„Corporate Finance Deal of the Year‟ 2008
FINAL VERSION – NON-CONFIDENTIAL