Embed Size (px)
Citation preview
Review of Survey TechniquesUsed in Urban Freight Studies
November 2008
Allen, J. and Browne, M.
[email protected]@westminster.ac.uk
www.westminster.ac.uk/transport
Transport Studies GroupUniversity of WestminsterLondon
Review of Survey Techniques in Urban Freight Studies
Report produced as part of the Green Logistics Project: Work Module 9 (Urban Freight Transport)
Allen, J. and Browne, M.
University of Westminster
Final version
November 2008

Acknowledgement:
The research reported in this document was funded by the Engineering and Physical
Science Research Council as part of the University of Westminster’s contribution to the
Green Logistics project. Further details of this project can be found at:
http://www.greenlogistics.org
CONTENTS
Page No.
1. Introduction
1
2. Urban freight data collection efforts
2
3. A review of urban freight data collection, survey techniques and methods
4
4. Aspects of urban freight activity subject to data collection
6
5. Survey techniques used to collect urban freight data
9
6. Other aspects of the urban freight studies reviewed 18 6.1 Focus of data collection 18 6.2 Purpose of urban freight studies 19 6.3 Means of carrying out urban freight surveys 20 6.4 Number of respondents 21 6.5 Response rates 22 6.6 Geographical and business coverage
23
7. Comparison of different urban freight survey techniques and methods
24
8. Concluding thoughts and observations
30
References
33
Appendix 1: Details of individual studies reviewed that collected urban freight data (part I)
42
Appendix 2: Details of individual studies reviewed that collected urban freight data (part II)
52
Appendix 3: Details of individual studies reviewed that collected urban freight data (part III)
63

1
1. Introduction This report is based on a review of survey techniques used in studies in which data has been collected to obtain an understanding of road-based urban freight transport activities and patterns of operation. Studies from the UK and other countries have been included in this literature review. While it may be thought that relatively few such studies have been conducted, approximately 60 such studies have been identified as taking place in the UK and approximately 100 elsewhere since the 1960s. In addition, other studies have been carried out in order to assess industry and policy maker opinions about urban freight transport (Lawson and Strathman, 2002), however this type of study and survey work is not the focus of this report. Gaining an understanding of road-based urban freight transport activities is an important element in determining the current sustainability of such activity (in economic, social and environmental terms) and how best to go about enhancing its sustainability. By reviewing the existing survey work in this subject it has been possible to draw together the methodologies developed and implemented. This should therefore be of help in understanding which techniques are most commonly used, the strengths and limitations of the various techniques, and in assessing the most suitable urban freight survey techniques for a given study (depending on the type of information required). Section 2 provides a brief discussion of freight data collection efforts, especially in urban areas. Section 3 explains the approach taken in the literature review. It provides details of the countries and decades in which the studies reviewed were carried out. Section 4 considers the various urban freight transport topics have been subject to data collection via survey work. Section 5 presents the survey techniques and methods that can be used to study urban freight activities. It includes details of the survey techniques used in the studies reviewed (by country and by decade). Section 6 provides details of the focus of the studies reviewed, together with the purpose of the studies, the means by which the survey work was carried out, the sample sizes and response rates, as well as the geographical areas and business types included. Section 7 presents an assessment of the advantages and disadvantages of the various methods by which urban freight survey techniques can be conducted, together with an evaluation of merits of the various types of urban freight surveys. Section 8 provides some concluding thoughts and observations based on the research presented in this report. The appendices provide further details about each of the individual urban freight studies reviewed. A separate report as part of this same Green Logistics project has reviewed the results of 30 UK urban freight studies carried out in the last decade in order to attempt to provide insight into urban freight activities in our towns and cities. The results of 7 UK urban freight studies carried out in the 1970s (between 1970 and 1975) are also presented and compared with the recent UK studies. This provides insight into the extent of similarity and difference in urban freight operations over this 25-35 year period (Allen et al, 2008).

2
We intend to produce an additional report that contains all the urban freight survey forms that we have obtained during the course of carrying out this research. Another report offering guidance and recommendations in carrying out urban freight survey work is planned for 2009 as part of the Green Logistics project.
3
2. Urban freight data collection efforts Many urban policy makers are reliant on vehicle traffic counts to form opinions and determine policy approaches for urban freight transport on a day-to-day basis. This provides little insight into factors including: • the goods and service flows that such vehicle activity supports, • the specific purpose of these vehicle trips, • the establishments that are generating the demand for these trips and their goods and
service requirements, • the supply chain decisions that results in these trips happening in these vehicles, at
these times and days, • the routes taken by these vehicles • the types of trip patterns performed (e.g. multi-drop as opposed to single drop), • details about the loading, unloading and parking activities associated with these trips. Urban freight transport is made up of numerous activities and parties, resulting in a complex subject area to study in order to obtain an understanding of such issues. One of the major complications of studying freight as opposed to passenger transport is that it comprises both i) goods and services that are produced and consumed in an urban system and ii) transport vehicle activity that supports the flow of these goods and services. In a small number of cases, goods and services will travel on the same vehicle from the point of production to the point of consumption but usually goods and services are associated with several different vehicle trips, and vice versa, goods vehicles are used to carry a wide range of different goods and service. Although much urban freight transport research is focused on vehicle activity (as it is vehicles that cause traffic and environmental impacts), it is important to bear in mind that the demand for urban freight transport activity is derived from the demand for goods and service flows. In many urban freight transport studies that attempt to go beyond vehicle traffic counts, the focus is limited to goods vehicle activity (and sometimes this is further limited to either just core goods delivery trips, or core goods delivery and collection trips, ignoring ancillary goods delivery trips, goods transfers between establishments, money delivery and collection trips, waste collection trips and other collection trips for reverse goods flows). However, urban freight transport also includes vehicle trips made in order to carry out a wide range of servicing tasks (concerned with issues such as public utilities, telecommunications, cleaning services, equipment maintenance, and electrical and plumbing services). These service tasks are carried out in a range of vehicle types from motorcycles and cars to light and heavy goods vehicles. Relatively few urban freight studies have concerned themselves with the study of these service activities and the associated vehicle activity. National surveys of freight transport operations are conducted in many countries (such as the Continuing Survey of Road Goods Transport in Britain, and commodity flow studies in the USA). Although these surveys do collect data about urban freight activities in the urban area they are usually not very useful for gaining a better understanding of freight transport in particular urban areas for several reasons: i) the sample size in any particular urban area is likely to be small, ii) it is often difficult to disaggregate the data from the overall dataset, and iii) the type of data collected about in these surveys does not provide the detailed information often required for urban freight analysis. Therefore, specific data collection exercises are usually required to gain the necessary insight into urban freight transport. In terms of the availability of previous urban freight data efforts, it is worth noting that despite the fact that relatively little such data has been collected (in relation to personal travel, and
4
traffic data in general), that this data is normally not publicly available for use in other studies. This is due to the fact that the data is not archived in a single location, and ownership and confidentiality issues surrounding the data are often complex. The majority of the urban freight transport data collection efforts that have taken place have been funded by the public sector (including local, regional and national government departments, research bodies and other public sector agencies. However these bodies often commission the work from consultants and/or academics and do not usually retain the data at the end of the study. The only output that is often available from such work is usually a report or paper which only provides summary statistics and results. In some cases, especially for older studies even such reports are difficult to locate and in some cases copies no longer seem to exist. As Ogden (1992) has noted it is not possible to make definitive comments about the data needs when studying urban freight transport. These will vary depending on the issue/s concerned, the planning and policy framework in which the issue arises, established practice in data collection, and the availability of previously collected data.
5
3. Review of urban freight data collection, survey techniques and methods An international literature review of previous studies that collected urban freight data was carried out. At the outset the authors expected to find relatively few such studies, however more than 160 such studies worldwide were identified. Difficulties encountered during this literature review included: i) that no previous such international reviews appear to have been attempted (only a few reviews that mention studies in one or a few countries seem to exist), ii) that publications of many urban freight studies are not publicly available (as they were commissioned by local, regional or national governments and were never published), iii) among the older studies, even those that were published as a paper or report are not always still available, iv) such studies are written in the national language resulting in comprehension difficulties for the authors, v) the only mention of some studies is a brief overview of the study in another report or paper – therefore only summary details of the study are available in such cases. Several reports and papers obtained that have summarised selected urban freight studies in one or more countries were identified in the literature review. However as noted above these studies tend to only summarise a small number of studies rather than attempting to provide a comprehensive listing of all such surveys carried out within the country. These publications cover studies in the following countries: America (Victoria and Walton, 2004); Canada and America (Jessup, Casavant and Lawson, 2004; McCabe, Roorda, and Kwan, 2008), Canada, America and Australia (Kriger, Tan and Clavelle, 2007; Woudsma, 2001), and France, Germany, the Netherlands and Italy (Patier and Routhier, 2008). However these publications tend to be more focused on discussing urban freight data needs rather than reviewing previous urban freight data collection efforts. In addition, work carried out in data collection in eleven European countries as part of the BESTUFS project also provided details of further urban freight studies (Browne and Allen, 2006) as did the BESTUFS report on urban freight (Schoemaker et al., 2006).. Table 3.1 shows the number of studies that collected urban freight data identified during the literature review by country and by the decade in which they were carried out. It is not possible to present details about each of the 162 studies reviewed in the main report. However Appendices 1-3 provide details about each individual study.
6
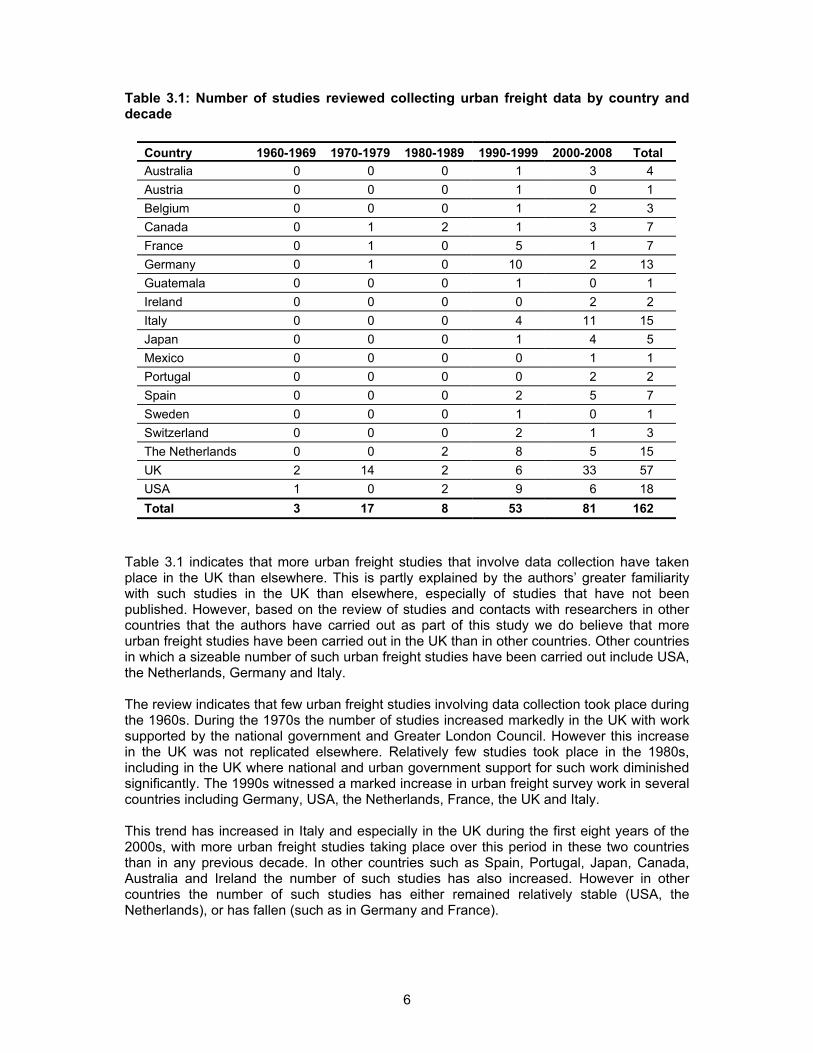
Table 3.1: Number of studies reviewed collecting urban freight data by country and decade
Country 1960-1969 1970-1979 1980-1989 1990-1999 2000-2008 Total Australia 0 0 0 1 3 4 Austria 0 0 0 1 0 1 Belgium 0 0 0 1 2 3 Canada 0 1 2 1 3 7 France 0 1 0 5 1 7 Germany 0 1 0 10 2 13 Guatemala 0 0 0 1 0 1 Ireland 0 0 0 0 2 2 Italy 0 0 0 4 11 15 Japan 0 0 0 1 4 5 Mexico 0 0 0 0 1 1 Portugal 0 0 0 0 2 2 Spain 0 0 0 2 5 7 Sweden 0 0 0 1 0 1 Switzerland 0 0 0 2 1 3 The Netherlands 0 0 2 8 5 15 UK 2 14 2 6 33 57 USA 1 0 2 9 6 18 Total 3 17 8 53 81 162
Table 3.1 indicates that more urban freight studies that involve data collection have taken place in the UK than elsewhere. This is partly explained by the authors’ greater familiarity with such studies in the UK than elsewhere, especially of studies that have not been published. However, based on the review of studies and contacts with researchers in other countries that the authors have carried out as part of this study we do believe that more urban freight studies have been carried out in the UK than in other countries. Other countries in which a sizeable number of such urban freight studies have been carried out include USA, the Netherlands, Germany and Italy. The review indicates that few urban freight studies involving data collection took place during the 1960s. During the 1970s the number of studies increased markedly in the UK with work supported by the national government and Greater London Council. However this increase in the UK was not replicated elsewhere. Relatively few studies took place in the 1980s, including in the UK where national and urban government support for such work diminished significantly. The 1990s witnessed a marked increase in urban freight survey work in several countries including Germany, USA, the Netherlands, France, the UK and Italy. This trend has increased in Italy and especially in the UK during the first eight years of the 2000s, with more urban freight studies taking place over this period in these two countries than in any previous decade. In other countries such as Spain, Portugal, Japan, Canada, Australia and Ireland the number of such studies has also increased. However in other countries the number of such studies has either remained relatively stable (USA, the Netherlands), or has fallen (such as in Germany and France).
7
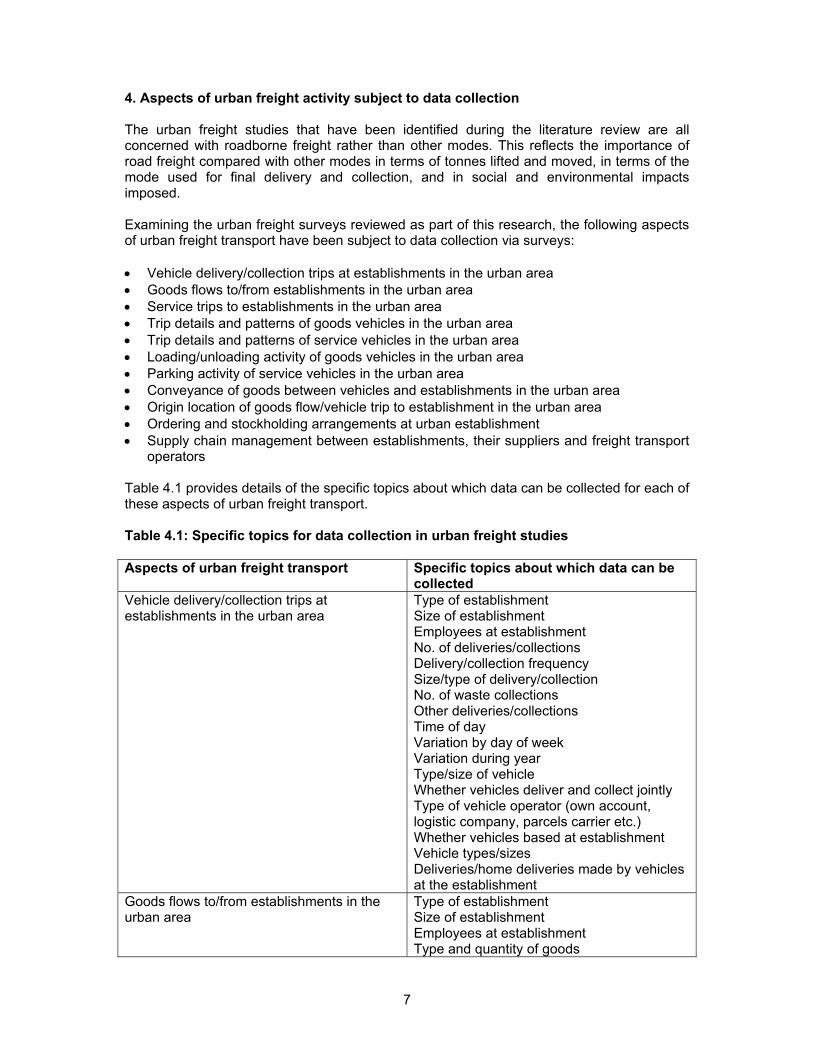
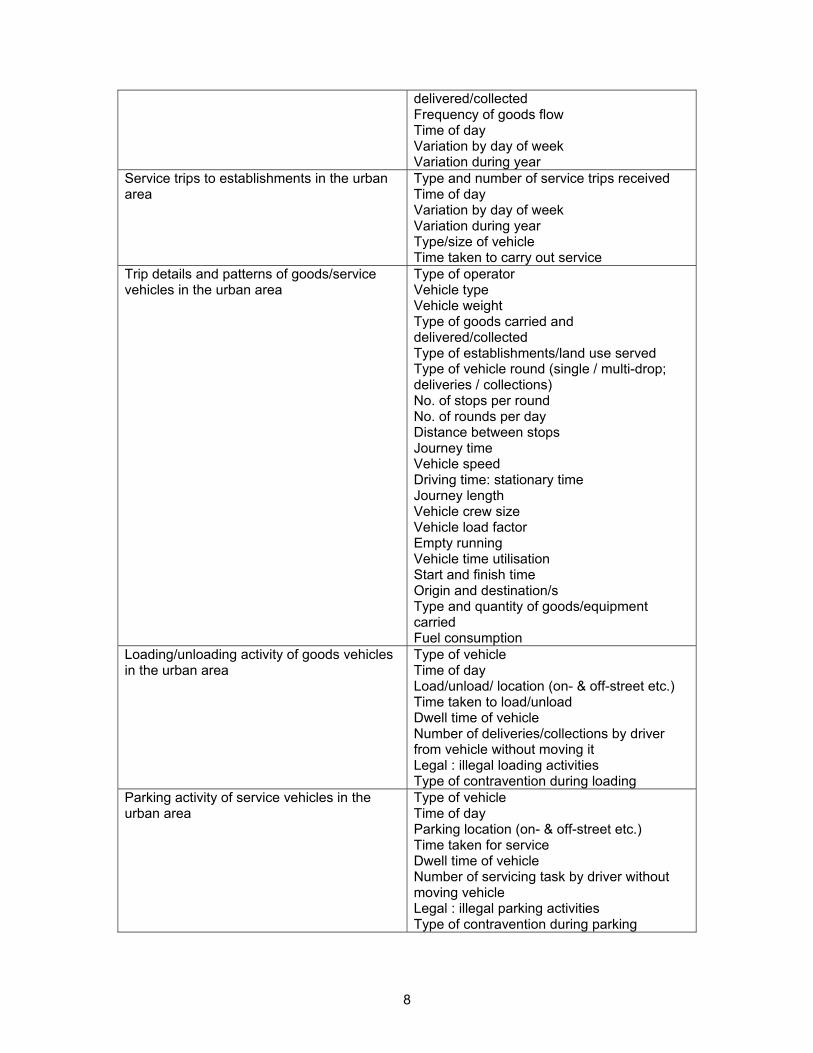
4. Aspects of urban freight activity subject to data collection The urban freight studies that have been identified during the literature review are all concerned with roadborne freight rather than other modes. This reflects the importance of road freight compared with other modes in terms of tonnes lifted and moved, in terms of the mode used for final delivery and collection, and in social and environmental impacts imposed. Examining the urban freight surveys reviewed as part of this research, the following aspects of urban freight transport have been subject to data collection via surveys: • Vehicle delivery/collection trips at establishments in the urban area • Goods flows to/from establishments in the urban area • Service trips to establishments in the urban area • Trip details and patterns of goods vehicles in the urban area • Trip details and patterns of service vehicles in the urban area • Loading/unloading activity of goods vehicles in the urban area • Parking activity of service vehicles in the urban area • Conveyance of goods between vehicles and establishments in the urban area • Origin location of goods flow/vehicle trip to establishment in the urban area • Ordering and stockholding arrangements at urban establishment • Supply chain management between establishments, their suppliers and freight transport
operators Table 4.1 provides details of the specific topics about which data can be collected for each of these aspects of urban freight transport. Table 4.1: Specific topics for data collection in urban freight studies Aspects of urban freight transport Specific topics about which data can be
collected Vehicle delivery/collection trips at establishments in the urban area
Type of establishment Size of establishment Employees at establishment No. of deliveries/collections Delivery/collection frequency Size/type of delivery/collection No. of waste collections Other deliveries/collections Time of day Variation by day of week Variation during year Type/size of vehicle Whether vehicles deliver and collect jointly Type of vehicle operator (own account, logistic company, parcels carrier etc.) Whether vehicles based at establishment Vehicle types/sizes Deliveries/home deliveries made by vehicles at the establishment
Goods flows to/from establishments in the urban area
Type of establishment Size of establishment Employees at establishment Type and quantity of goods
8
delivered/collected Frequency of goods flow Time of day Variation by day of week Variation during year
Service trips to establishments in the urban area
Type and number of service trips received Time of day Variation by day of week Variation during year Type/size of vehicle Time taken to carry out service
Trip details and patterns of goods/service vehicles in the urban area
Type of operator Vehicle type Vehicle weight Type of goods carried and delivered/collected Type of establishments/land use served Type of vehicle round (single / multi-drop; deliveries / collections) No. of stops per round No. of rounds per day Distance between stops Journey time Vehicle speed Driving time: stationary time Journey length Vehicle crew size Vehicle load factor Empty running Vehicle time utilisation Start and finish time Origin and destination/s Type and quantity of goods/equipment carried Fuel consumption
Loading/unloading activity of goods vehicles in the urban area
Type of vehicle Time of day Load/unload/ location (on- & off-street etc.) Time taken to load/unload Dwell time of vehicle Number of deliveries/collections by driver from vehicle without moving it Legal : illegal loading activities Type of contravention during loading
Parking activity of service vehicles in the urban area
Type of vehicle Time of day Parking location (on- & off-street etc.) Time taken for service Dwell time of vehicle Number of servicing task by driver without moving vehicle Legal : illegal parking activities Type of contravention during parking
9
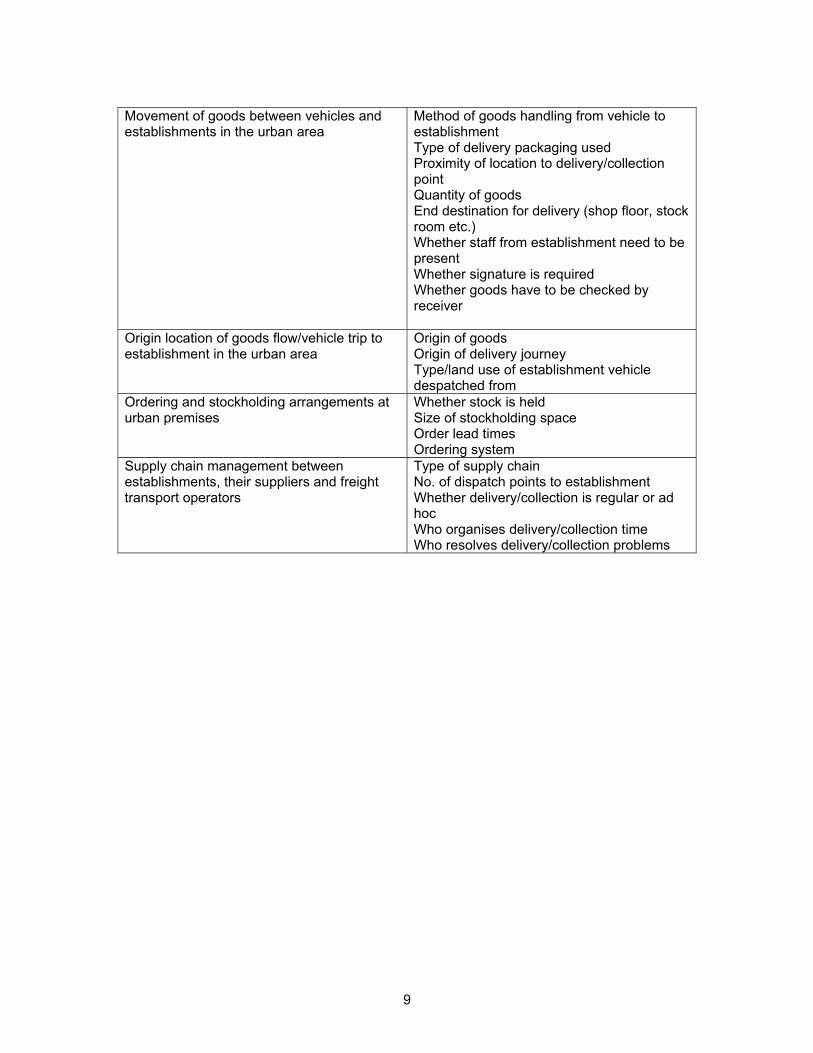
Movement of goods between vehicles and establishments in the urban area
Method of goods handling from vehicle to establishment Type of delivery packaging used Proximity of location to delivery/collection point Quantity of goods End destination for delivery (shop floor, stock room etc.) Whether staff from establishment need to be present Whether signature is required Whether goods have to be checked by receiver
Origin location of goods flow/vehicle trip to establishment in the urban area
Origin of goods Origin of delivery journey Type/land use of establishment vehicle despatched from
Ordering and stockholding arrangements at urban premises
Whether stock is held Size of stockholding space Order lead times Ordering system
Supply chain management between establishments, their suppliers and freight transport operators
Type of supply chain No. of dispatch points to establishment Whether delivery/collection is regular or ad hoc Who organises delivery/collection time Who resolves delivery/collection problems

10
5. Survey techniques used to collect urban freight data The urban freight data outlined in Table 4.1 has been collected using several different survey techniques in the surveyed reviewed. These can be summarised into the following list of data collection techniques: • Establishment survey • Commodity flow survey • Freight operator survey • Driver survey • Roadside interview survey • Vehicle observation survey • Parking survey • Vehicle trip diaries • GPS survey • Suppliers survey • Service provider survey In addition, vehicle traffic counts are commonly used in conjunction with the above techniques as a means of understanding the proportion of all road traffic accounted for by commercial vehicles by time of day and day of week. A brief summary of each of these urban freight survey techniques is provided below. Survey technique Establishment survey Explanation Main method used in studies to collect data about total goods
vehicle trips to/from particular establishments, and variation by time, day and month. Can also be used to capture data about type of goods delivered/collected. Also allows collection of information about the delivery/collection process but some respondents not very sure about issues including: vehicle types, time taken to load/unload, where vehicle stopped, method of goods movement from vehicle, and origin of vehicle/goods.
How it is conducted Face-to-face, telephone or self-completion Which aspects of urban freight it is most suited to addressing
• Vehicle delivery/collection trips at establishments in the urban area
• Goods flows to/from establishments in the urban area • Service trips to establishments in the urban area • Loading/unloading activity of goods vehicles in the urban
area • Movement of goods between vehicles and establishments in
the urban area • Origin location of goods flow/vehicle trip to establishment in
the urban area • Ordering and stockholding arrangements at urban
establishment • Supply chain management between establishments, their
suppliers and freight transport operators
11
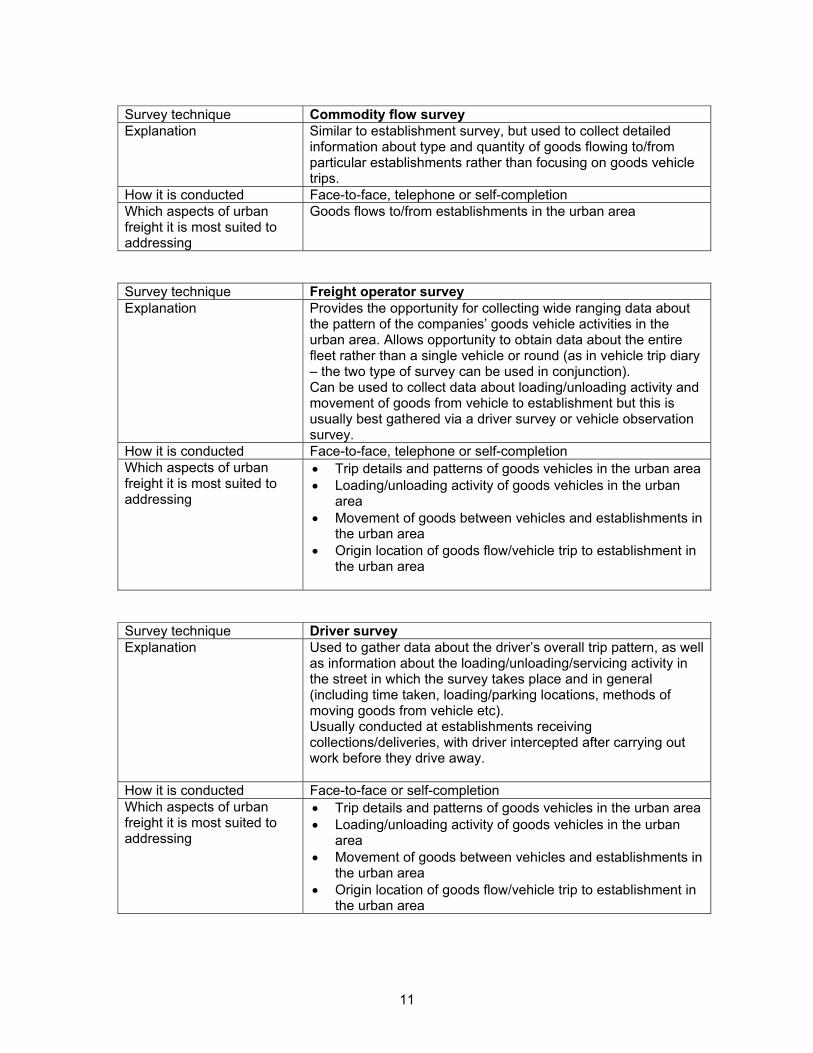
Survey technique Commodity flow survey Explanation Similar to establishment survey, but used to collect detailed
information about type and quantity of goods flowing to/from particular establishments rather than focusing on goods vehicle trips.
How it is conducted Face-to-face, telephone or self-completion Which aspects of urban freight it is most suited to addressing
Goods flows to/from establishments in the urban area
Survey technique Freight operator survey Explanation Provides the opportunity for collecting wide ranging data about
the pattern of the companies’ goods vehicle activities in the urban area. Allows opportunity to obtain data about the entire fleet rather than a single vehicle or round (as in vehicle trip diary – the two type of survey can be used in conjunction). Can be used to collect data about loading/unloading activity and movement of goods from vehicle to establishment but this is usually best gathered via a driver survey or vehicle observation survey.
How it is conducted Face-to-face, telephone or self-completion Which aspects of urban freight it is most suited to addressing
• Trip details and patterns of goods vehicles in the urban area • Loading/unloading activity of goods vehicles in the urban
area • Movement of goods between vehicles and establishments in
the urban area • Origin location of goods flow/vehicle trip to establishment in
the urban area
Survey technique Driver survey Explanation Used to gather data about the driver’s overall trip pattern, as well
as information about the loading/unloading/servicing activity in the street in which the survey takes place and in general (including time taken, loading/parking locations, methods of moving goods from vehicle etc). Usually conducted at establishments receiving collections/deliveries, with driver intercepted after carrying out work before they drive away.
How it is conducted Face-to-face or self-completion Which aspects of urban freight it is most suited to addressing
• Trip details and patterns of goods vehicles in the urban area • Loading/unloading activity of goods vehicles in the urban
area • Movement of goods between vehicles and establishments in
the urban area • Origin location of goods flow/vehicle trip to establishment in
the urban area
12
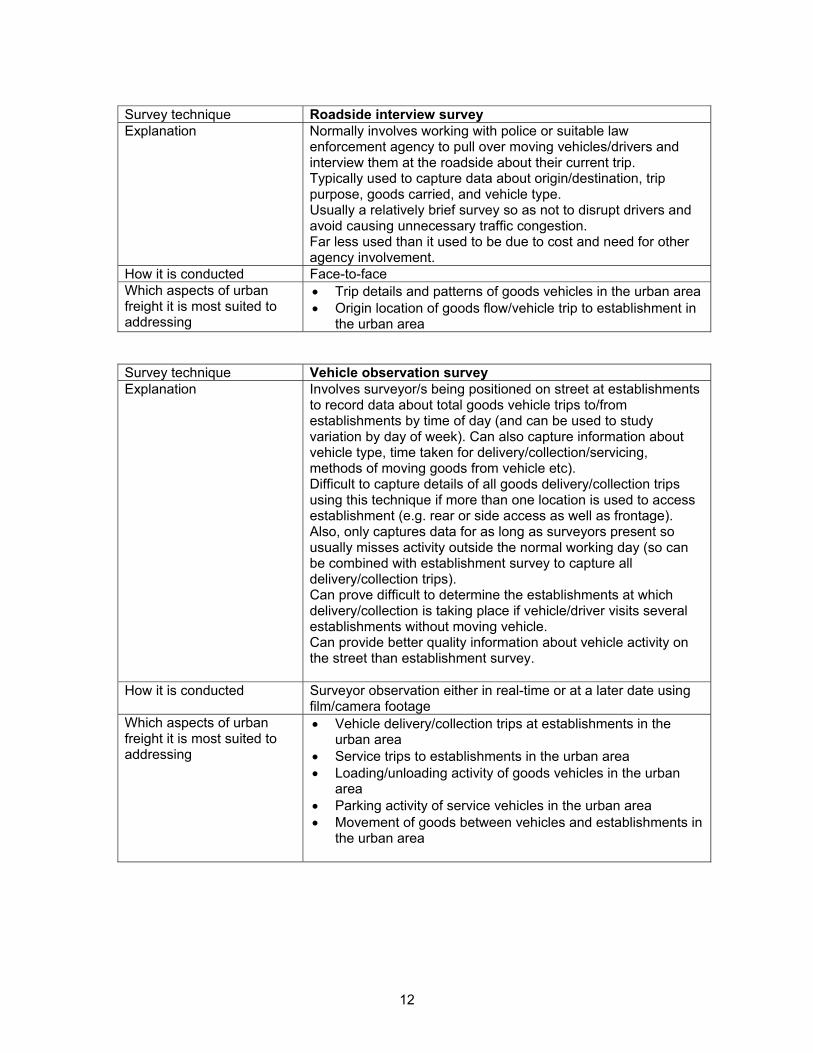
Survey technique Roadside interview survey Explanation Normally involves working with police or suitable law
enforcement agency to pull over moving vehicles/drivers and interview them at the roadside about their current trip. Typically used to capture data about origin/destination, trip purpose, goods carried, and vehicle type. Usually a relatively brief survey so as not to disrupt drivers and avoid causing unnecessary traffic congestion. Far less used than it used to be due to cost and need for other agency involvement.
How it is conducted Face-to-face Which aspects of urban freight it is most suited to addressing
• Trip details and patterns of goods vehicles in the urban area • Origin location of goods flow/vehicle trip to establishment in
the urban area Survey technique Vehicle observation survey Explanation Involves surveyor/s being positioned on street at establishments
to record data about total goods vehicle trips to/from establishments by time of day (and can be used to study variation by day of week). Can also capture information about vehicle type, time taken for delivery/collection/servicing, methods of moving goods from vehicle etc). Difficult to capture details of all goods delivery/collection trips using this technique if more than one location is used to access establishment (e.g. rear or side access as well as frontage). Also, only captures data for as long as surveyors present so usually misses activity outside the normal working day (so can be combined with establishment survey to capture all delivery/collection trips). Can prove difficult to determine the establishments at which delivery/collection is taking place if vehicle/driver visits several establishments without moving vehicle. Can provide better quality information about vehicle activity on the street than establishment survey.
How it is conducted Surveyor observation either in real-time or at a later date using film/camera footage
Which aspects of urban freight it is most suited to addressing
• Vehicle delivery/collection trips at establishments in the urban area
• Service trips to establishments in the urban area • Loading/unloading activity of goods vehicles in the urban
area • Parking activity of service vehicles in the urban area • Movement of goods between vehicles and establishments in
the urban area
13
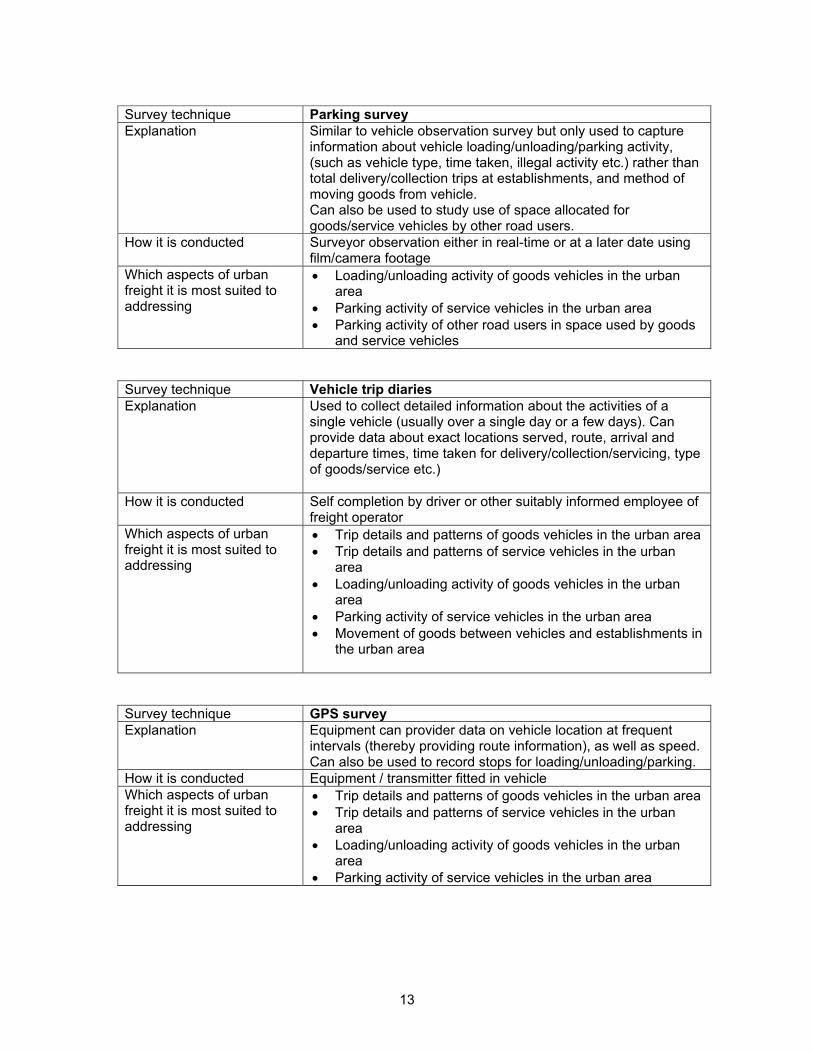
Survey technique Parking survey Explanation Similar to vehicle observation survey but only used to capture
information about vehicle loading/unloading/parking activity, (such as vehicle type, time taken, illegal activity etc.) rather than total delivery/collection trips at establishments, and method of moving goods from vehicle. Can also be used to study use of space allocated for goods/service vehicles by other road users.
How it is conducted Surveyor observation either in real-time or at a later date using film/camera footage
Which aspects of urban freight it is most suited to addressing
• Loading/unloading activity of goods vehicles in the urban area
• Parking activity of service vehicles in the urban area • Parking activity of other road users in space used by goods
and service vehicles Survey technique Vehicle trip diaries Explanation Used to collect detailed information about the activities of a
single vehicle (usually over a single day or a few days). Can provide data about exact locations served, route, arrival and departure times, time taken for delivery/collection/servicing, type of goods/service etc.)
How it is conducted Self completion by driver or other suitably informed employee of freight operator
Which aspects of urban freight it is most suited to addressing
• Trip details and patterns of goods vehicles in the urban area • Trip details and patterns of service vehicles in the urban
area • Loading/unloading activity of goods vehicles in the urban
area • Parking activity of service vehicles in the urban area • Movement of goods between vehicles and establishments in
the urban area
Survey technique GPS survey Explanation Equipment can provider data on vehicle location at frequent
intervals (thereby providing route information), as well as speed. Can also be used to record stops for loading/unloading/parking.
How it is conducted Equipment / transmitter fitted in vehicle Which aspects of urban freight it is most suited to addressing
• Trip details and patterns of goods vehicles in the urban area • Trip details and patterns of service vehicles in the urban
area • Loading/unloading activity of goods vehicles in the urban
area • Parking activity of service vehicles in the urban area
14
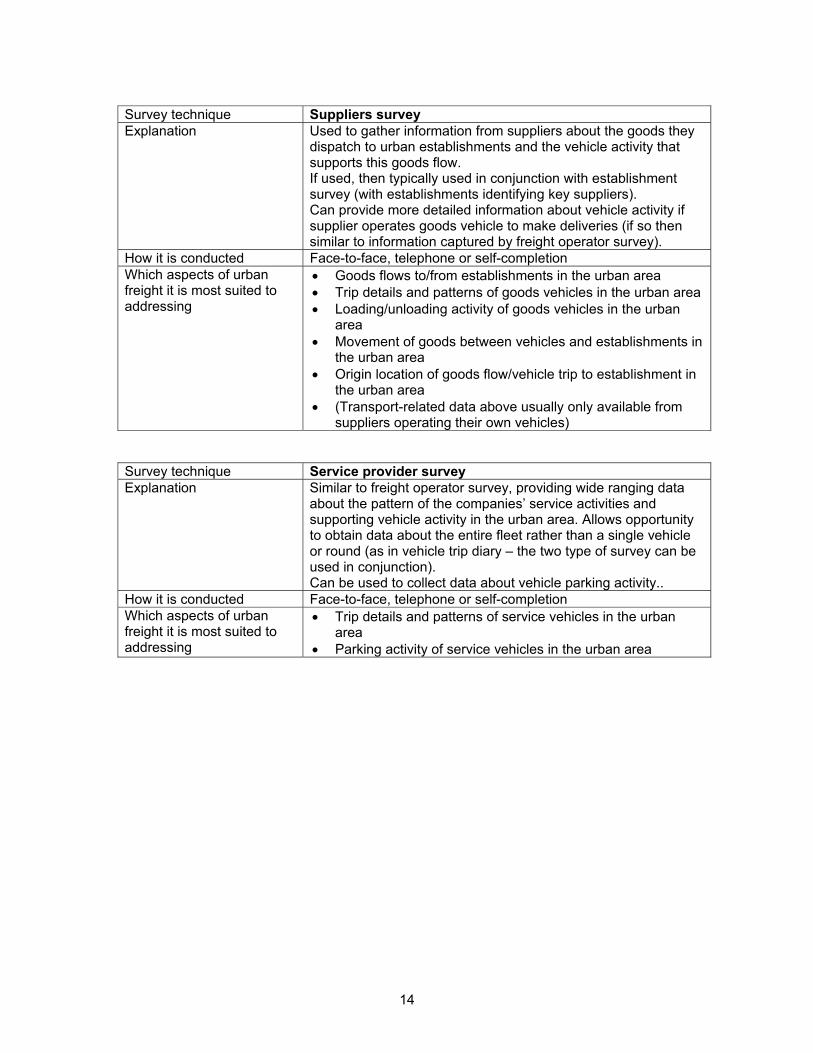
Survey technique Suppliers survey Explanation Used to gather information from suppliers about the goods they
dispatch to urban establishments and the vehicle activity that supports this goods flow. If used, then typically used in conjunction with establishment survey (with establishments identifying key suppliers). Can provide more detailed information about vehicle activity if supplier operates goods vehicle to make deliveries (if so then similar to information captured by freight operator survey).
How it is conducted Face-to-face, telephone or self-completion Which aspects of urban freight it is most suited to addressing
• Goods flows to/from establishments in the urban area • Trip details and patterns of goods vehicles in the urban area • Loading/unloading activity of goods vehicles in the urban
area • Movement of goods between vehicles and establishments in
the urban area • Origin location of goods flow/vehicle trip to establishment in
the urban area • (Transport-related data above usually only available from
suppliers operating their own vehicles) Survey technique Service provider survey Explanation Similar to freight operator survey, providing wide ranging data
about the pattern of the companies’ service activities and supporting vehicle activity in the urban area. Allows opportunity to obtain data about the entire fleet rather than a single vehicle or round (as in vehicle trip diary – the two type of survey can be used in conjunction). Can be used to collect data about vehicle parking activity..
How it is conducted Face-to-face, telephone or self-completion Which aspects of urban freight it is most suited to addressing
• Trip details and patterns of service vehicles in the urban area
• Parking activity of service vehicles in the urban area
15
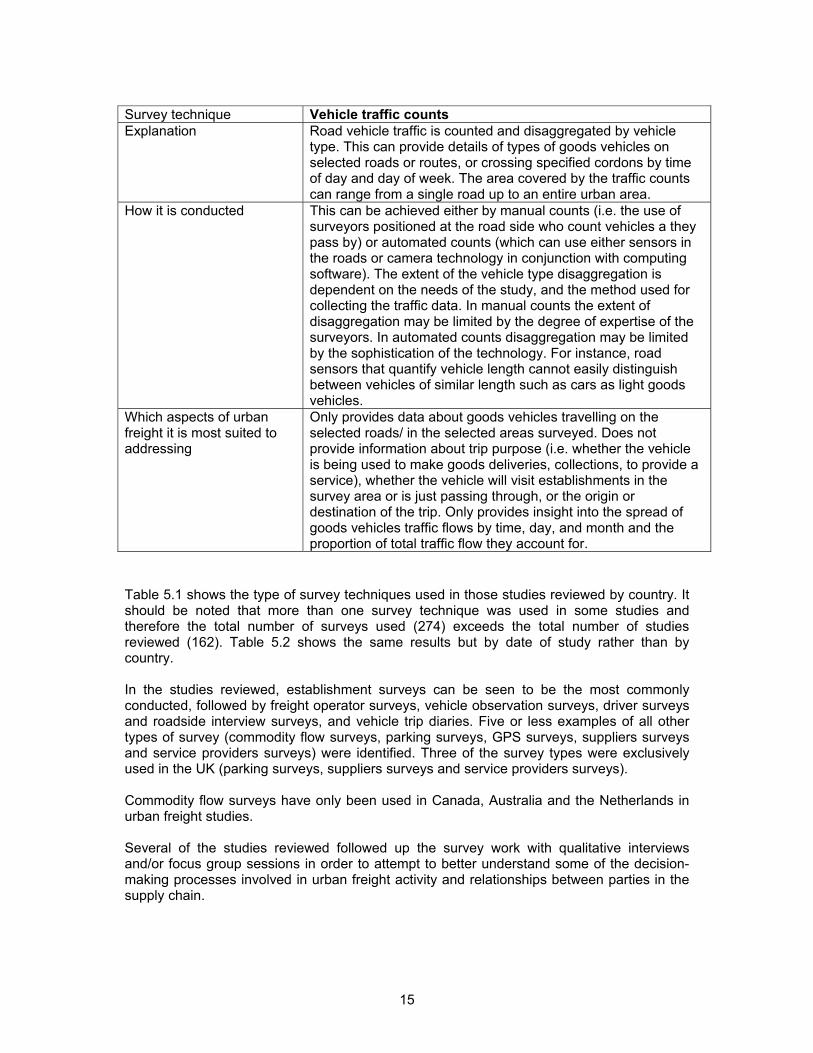
Survey technique Vehicle traffic counts Explanation Road vehicle traffic is counted and disaggregated by vehicle
type. This can provide details of types of goods vehicles on selected roads or routes, or crossing specified cordons by time of day and day of week. The area covered by the traffic counts can range from a single road up to an entire urban area.
How it is conducted This can be achieved either by manual counts (i.e. the use of surveyors positioned at the road side who count vehicles a they pass by) or automated counts (which can use either sensors in the roads or camera technology in conjunction with computing software). The extent of the vehicle type disaggregation is dependent on the needs of the study, and the method used for collecting the traffic data. In manual counts the extent of disaggregation may be limited by the degree of expertise of the surveyors. In automated counts disaggregation may be limited by the sophistication of the technology. For instance, road sensors that quantify vehicle length cannot easily distinguish between vehicles of similar length such as cars as light goods vehicles.
Which aspects of urban freight it is most suited to addressing
Only provides data about goods vehicles travelling on the selected roads/ in the selected areas surveyed. Does not provide information about trip purpose (i.e. whether the vehicle is being used to make goods deliveries, collections, to provide a service), whether the vehicle will visit establishments in the survey area or is just passing through, or the origin or destination of the trip. Only provides insight into the spread of goods vehicles traffic flows by time, day, and month and the proportion of total traffic flow they account for.
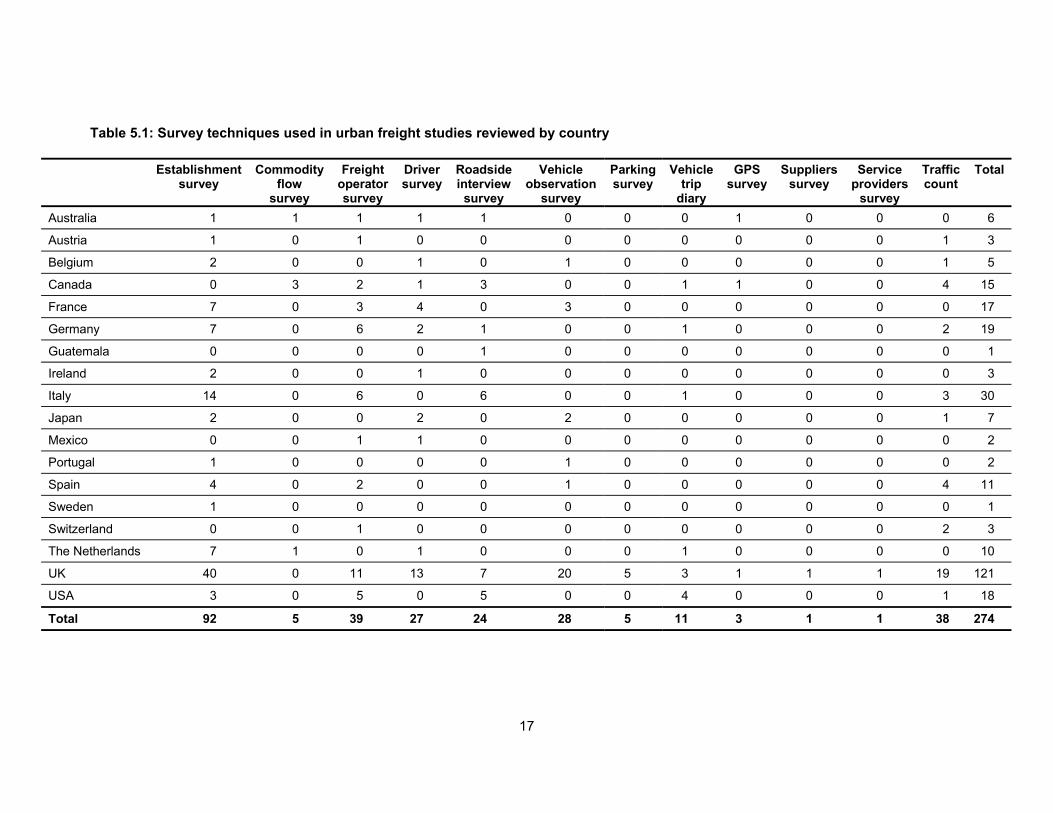
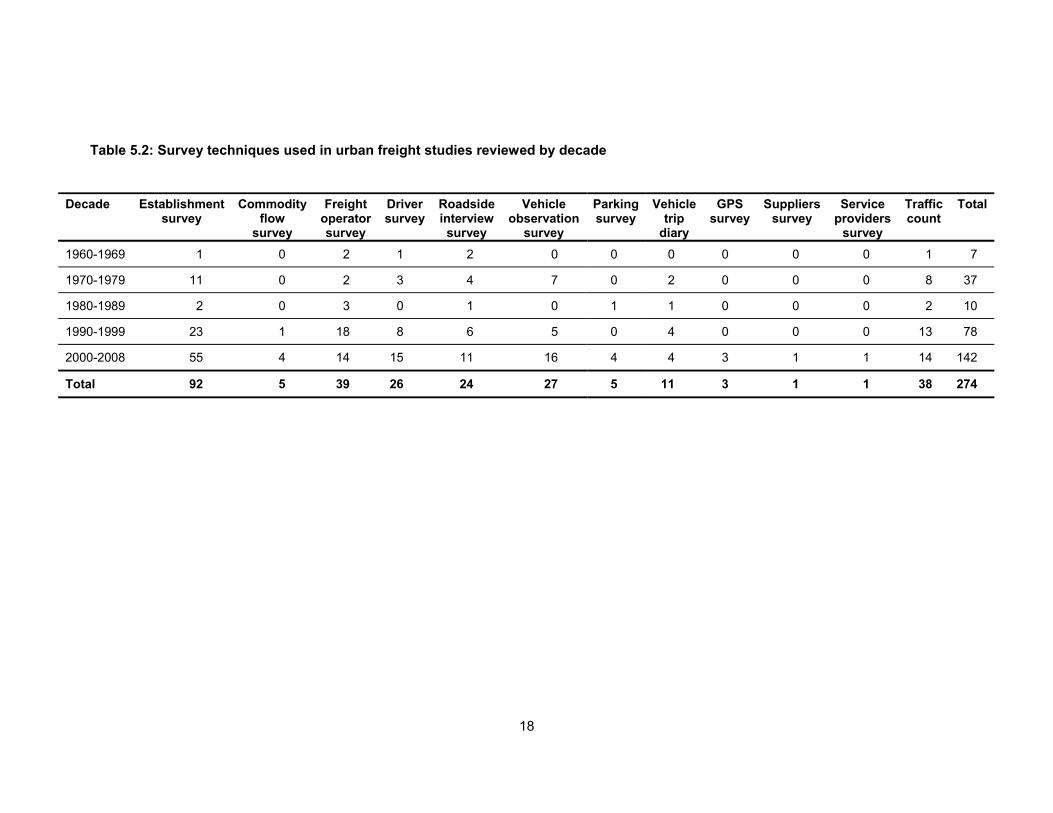
Table 5.1 shows the type of survey techniques used in those studies reviewed by country. It should be noted that more than one survey technique was used in some studies and therefore the total number of surveys used (274) exceeds the total number of studies reviewed (162). Table 5.2 shows the same results but by date of study rather than by country. In the studies reviewed, establishment surveys can be seen to be the most commonly conducted, followed by freight operator surveys, vehicle observation surveys, driver surveys and roadside interview surveys, and vehicle trip diaries. Five or less examples of all other types of survey (commodity flow surveys, parking surveys, GPS surveys, suppliers surveys and service providers surveys) were identified. Three of the survey types were exclusively used in the UK (parking surveys, suppliers surveys and service providers surveys). Commodity flow surveys have only been used in Canada, Australia and the Netherlands in urban freight studies. Several of the studies reviewed followed up the survey work with qualitative interviews and/or focus group sessions in order to attempt to better understand some of the decision-making processes involved in urban freight activity and relationships between parties in the supply chain.

16
The vast majority of the 162 studies reviewed that used surveys to collect urban freight data were one-off studies. Only five of the studies reviewed carried out survey work on a regular basis.
17
Table 5.1: Survey techniques used in urban freight studies reviewed by country
Establishment survey
Commodity flow
survey
Freight operator survey
Driver survey
Roadside interview
survey
Vehicle observation
survey
Parking survey
Vehicle trip
diary
GPS survey
Suppliers survey
Service providers
survey
Traffic count
Total
Australia 1 1 1 1 1 0 0 0 1 0 0 0 6
Austria 1 0 1 0 0 0 0 0 0 0 0 1 3
Belgium 2 0 0 1 0 1 0 0 0 0 0 1 5
Canada 0 3 2 1 3 0 0 1 1 0 0 4 15
France 7 0 3 4 0 3 0 0 0 0 0 0 17
Germany 7 0 6 2 1 0 0 1 0 0 0 2 19
Guatemala 0 0 0 0 1 0 0 0 0 0 0 0 1
Ireland 2 0 0 1 0 0 0 0 0 0 0 0 3
Italy 14 0 6 0 6 0 0 1 0 0 0 3 30
Japan 2 0 0 2 0 2 0 0 0 0 0 1 7
Mexico 0 0 1 1 0 0 0 0 0 0 0 0 2
Portugal 1 0 0 0 0 1 0 0 0 0 0 0 2
Spain 4 0 2 0 0 1 0 0 0 0 0 4 11
Sweden 1 0 0 0 0 0 0 0 0 0 0 0 1
Switzerland 0 0 1 0 0 0 0 0 0 0 0 2 3
The Netherlands 7 1 0 1 0 0 0 1 0 0 0 0 10
UK 40 0 11 13 7 20 5 3 1 1 1 19 121
USA 3 0 5 0 5 0 0 4 0 0 0 1 18
Total 92 5 39 27 24 28 5 11 3 1 1 38 274
18
Table 5.2: Survey techniques used in urban freight studies reviewed by decade
Decade Establishment survey
Commodity flow
survey
Freight operator survey
Driver survey
Roadside interview survey
Vehicle observation
survey
Parking survey
Vehicle trip
diary
GPS survey
Suppliers survey
Service providers
survey
Traffic count
Total
1960-1969 1 0 2 1 2 0 0 0 0 0 0 1 7
1970-1979 11 0 2 3 4 7 0 2 0 0 0 8 37
1980-1989 2 0 3 0 1 0 1 1 0 0 0 2 10
1990-1999 23 1 18 8 6 5 0 4 0 0 0 13 78
2000-2008 55 4 14 15 11 16 4 4 3 1 1 14 142
Total 92 5 39 26 24 27 5 11 3 1 1 38 274
19
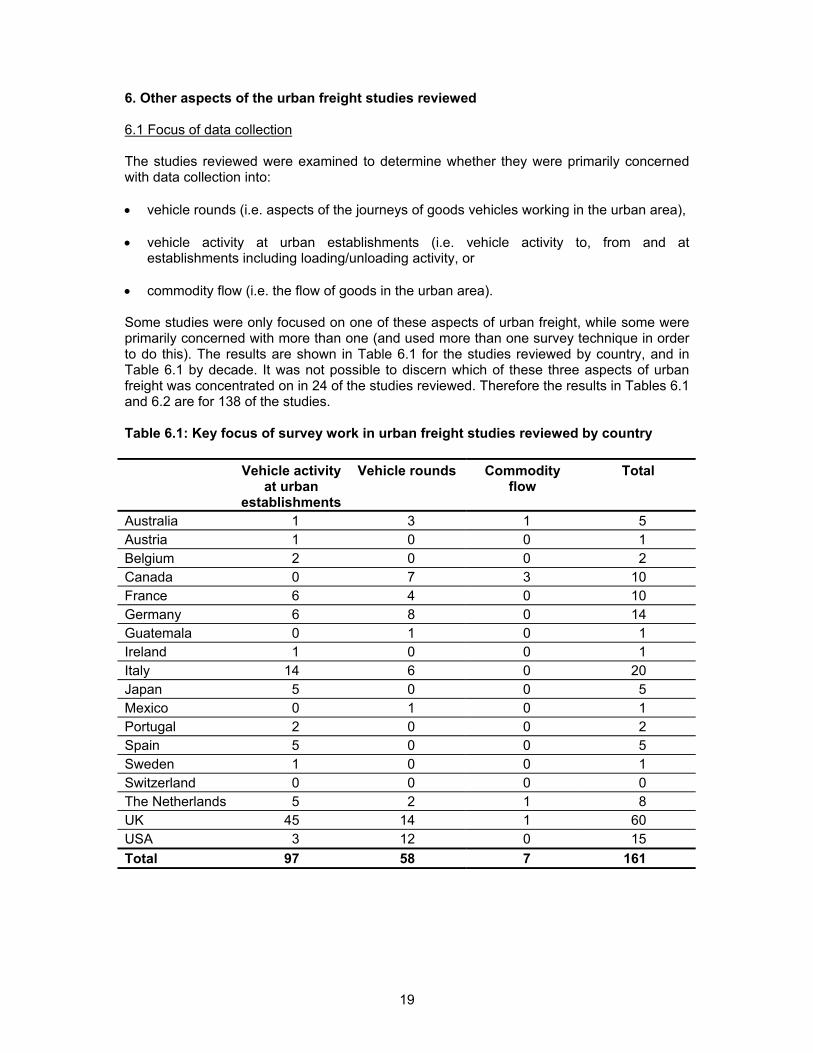
6. Other aspects of the urban freight studies reviewed 6.1 Focus of data collection The studies reviewed were examined to determine whether they were primarily concerned with data collection into: • vehicle rounds (i.e. aspects of the journeys of goods vehicles working in the urban area), • vehicle activity at urban establishments (i.e. vehicle activity to, from and at
establishments including loading/unloading activity, or • commodity flow (i.e. the flow of goods in the urban area). Some studies were only focused on one of these aspects of urban freight, while some were primarily concerned with more than one (and used more than one survey technique in order to do this). The results are shown in Table 6.1 for the studies reviewed by country, and in Table 6.1 by decade. It was not possible to discern which of these three aspects of urban freight was concentrated on in 24 of the studies reviewed. Therefore the results in Tables 6.1 and 6.2 are for 138 of the studies. Table 6.1: Key focus of survey work in urban freight studies reviewed by country Vehicle activity
at urban establishments
Vehicle rounds Commodity flow
Total
Australia 1 3 1 5 Austria 1 0 0 1 Belgium 2 0 0 2 Canada 0 7 3 10 France 6 4 0 10 Germany 6 8 0 14 Guatemala 0 1 0 1 Ireland 1 0 0 1 Italy 14 6 0 20 Japan 5 0 0 5 Mexico 0 1 0 1 Portugal 2 0 0 2 Spain 5 0 0 5 Sweden 1 0 0 1 Switzerland 0 0 0 0 The Netherlands 5 2 1 8 UK 45 14 1 60 USA 3 12 0 15 Total 97 58 7 161
20
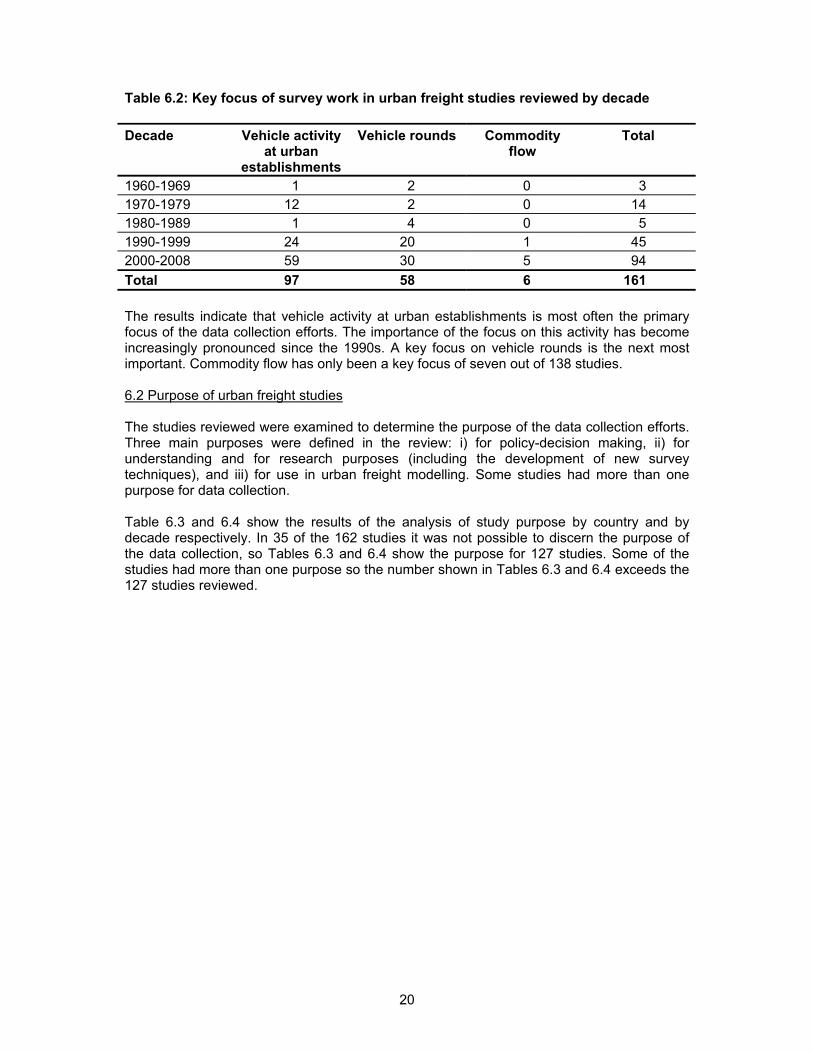
Table 6.2: Key focus of survey work in urban freight studies reviewed by decade Decade Vehicle activity
at urban establishments
Vehicle rounds Commodity flow
Total
1960-1969 1 2 0 3 1970-1979 12 2 0 14 1980-1989 1 4 0 5 1990-1999 24 20 1 45 2000-2008 59 30 5 94 Total 97 58 6 161 The results indicate that vehicle activity at urban establishments is most often the primary focus of the data collection efforts. The importance of the focus on this activity has become increasingly pronounced since the 1990s. A key focus on vehicle rounds is the next most important. Commodity flow has only been a key focus of seven out of 138 studies. 6.2 Purpose of urban freight studies The studies reviewed were examined to determine the purpose of the data collection efforts. Three main purposes were defined in the review: i) for policy-decision making, ii) for understanding and for research purposes (including the development of new survey techniques), and iii) for use in urban freight modelling. Some studies had more than one purpose for data collection. Table 6.3 and 6.4 show the results of the analysis of study purpose by country and by decade respectively. In 35 of the 162 studies it was not possible to discern the purpose of the data collection, so Tables 6.3 and 6.4 show the purpose for 127 studies. Some of the studies had more than one purpose so the number shown in Tables 6.3 and 6.4 exceeds the 127 studies reviewed.
21
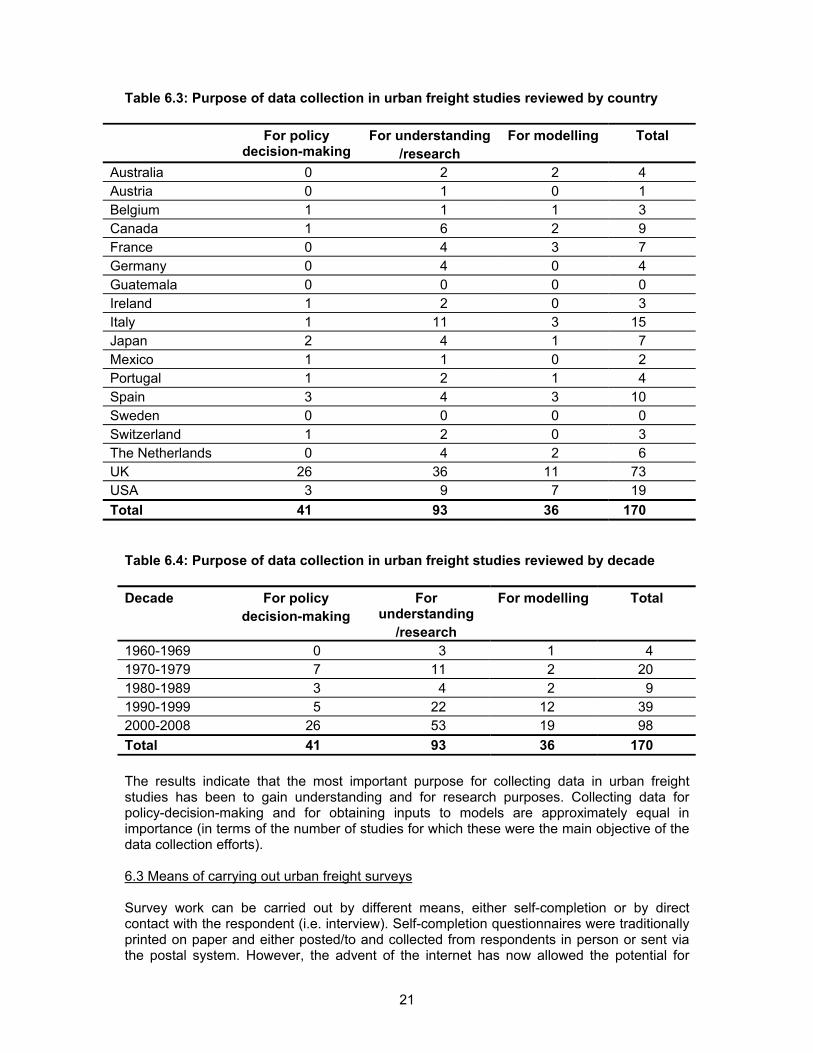
Table 6.3: Purpose of data collection in urban freight studies reviewed by country
For policy decision-making
For understanding/research
For modelling Total
Australia 0 2 2 4 Austria 0 1 0 1 Belgium 1 1 1 3 Canada 1 6 2 9 France 0 4 3 7 Germany 0 4 0 4 Guatemala 0 0 0 0 Ireland 1 2 0 3 Italy 1 11 3 15 Japan 2 4 1 7 Mexico 1 1 0 2 Portugal 1 2 1 4 Spain 3 4 3 10 Sweden 0 0 0 0 Switzerland 1 2 0 3 The Netherlands 0 4 2 6 UK 26 36 11 73 USA 3 9 7 19 Total 41 93 36 170
Table 6.4: Purpose of data collection in urban freight studies reviewed by decade Decade For policy
decision-making For
understanding /research
For modelling Total
1960-1969 0 3 1 4 1970-1979 7 11 2 20 1980-1989 3 4 2 9 1990-1999 5 22 12 39 2000-2008 26 53 19 98 Total 41 93 36 170 The results indicate that the most important purpose for collecting data in urban freight studies has been to gain understanding and for research purposes. Collecting data for policy-decision-making and for obtaining inputs to models are approximately equal in importance (in terms of the number of studies for which these were the main objective of the data collection efforts). 6.3 Means of carrying out urban freight surveys Survey work can be carried out by different means, either self-completion or by direct contact with the respondent (i.e. interview). Self-completion questionnaires were traditionally printed on paper and either posted/to and collected from respondents in person or sent via the postal system. However, the advent of the internet has now allowed the potential for
22
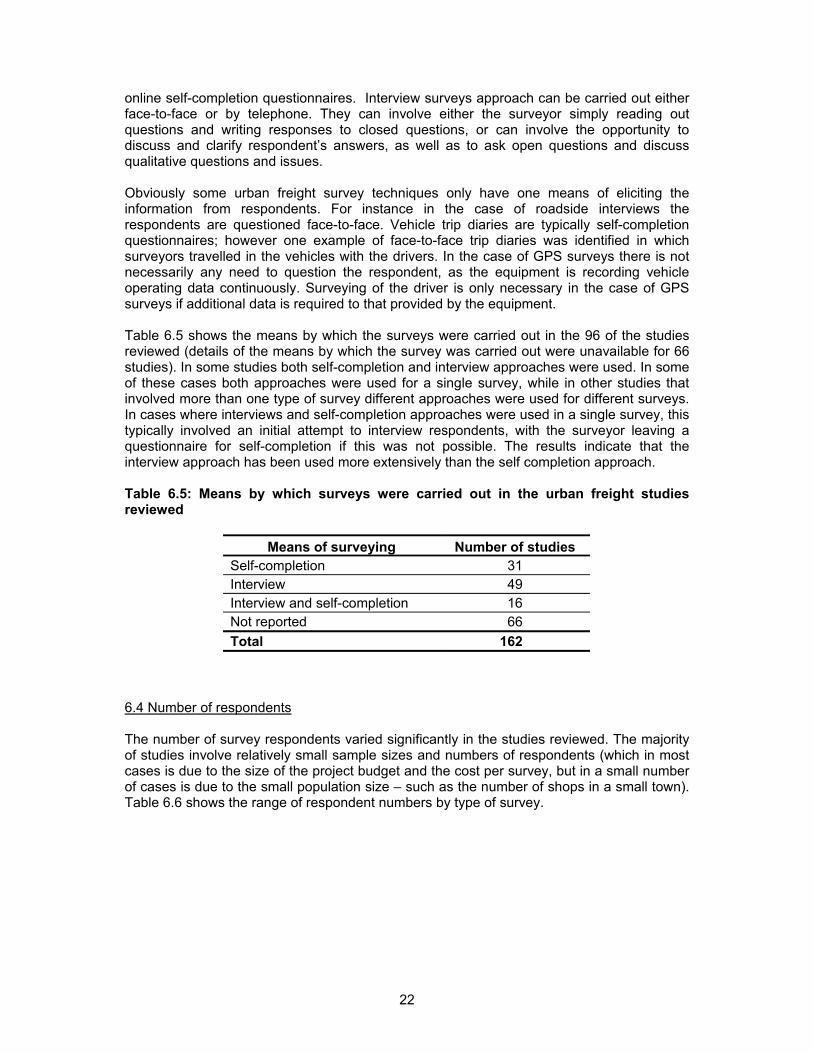
online self-completion questionnaires. Interview surveys approach can be carried out either face-to-face or by telephone. They can involve either the surveyor simply reading out questions and writing responses to closed questions, or can involve the opportunity to discuss and clarify respondent’s answers, as well as to ask open questions and discuss qualitative questions and issues. Obviously some urban freight survey techniques only have one means of eliciting the information from respondents. For instance in the case of roadside interviews the respondents are questioned face-to-face. Vehicle trip diaries are typically self-completion questionnaires; however one example of face-to-face trip diaries was identified in which surveyors travelled in the vehicles with the drivers. In the case of GPS surveys there is not necessarily any need to question the respondent, as the equipment is recording vehicle operating data continuously. Surveying of the driver is only necessary in the case of GPS surveys if additional data is required to that provided by the equipment. Table 6.5 shows the means by which the surveys were carried out in the 96 of the studies reviewed (details of the means by which the survey was carried out were unavailable for 66 studies). In some studies both self-completion and interview approaches were used. In some of these cases both approaches were used for a single survey, while in other studies that involved more than one type of survey different approaches were used for different surveys. In cases where interviews and self-completion approaches were used in a single survey, this typically involved an initial attempt to interview respondents, with the surveyor leaving a questionnaire for self-completion if this was not possible. The results indicate that the interview approach has been used more extensively than the self completion approach. Table 6.5: Means by which surveys were carried out in the urban freight studies reviewed
Means of surveying Number of studies Self-completion 31 Interview 49 Interview and self-completion 16 Not reported 66 Total 162
6.4 Number of respondents The number of survey respondents varied significantly in the studies reviewed. The majority of studies involve relatively small sample sizes and numbers of respondents (which in most cases is due to the size of the project budget and the cost per survey, but in a small number of cases is due to the small population size – such as the number of shops in a small town). Table 6.6 shows the range of respondent numbers by type of survey.
23
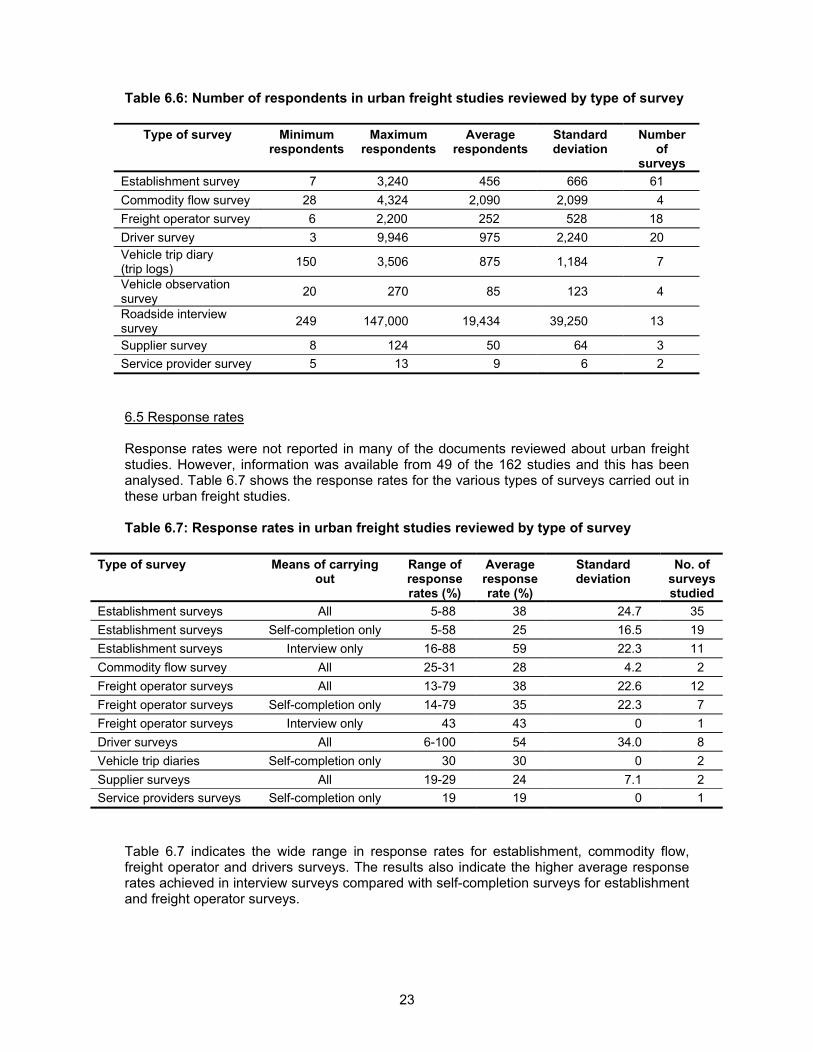
Table 6.6: Number of respondents in urban freight studies reviewed by type of survey
Type of survey Minimum respondents
Maximum respondents
Average respondents
Standard deviation
Number of
surveys Establishment survey 7 3,240 456 666 61 Commodity flow survey 28 4,324 2,090 2,099 4 Freight operator survey 6 2,200 252 528 18 Driver survey 3 9,946 975 2,240 20 Vehicle trip diary (trip logs) 150 3,506 875 1,184 7
Vehicle observation survey 20 270 85 123 4
Roadside interview survey 249 147,000 19,434 39,250 13
Supplier survey 8 124 50 64 3 Service provider survey 5 13 9 6 2 6.5 Response rates Response rates were not reported in many of the documents reviewed about urban freight studies. However, information was available from 49 of the 162 studies and this has been analysed. Table 6.7 shows the response rates for the various types of surveys carried out in these urban freight studies. Table 6.7: Response rates in urban freight studies reviewed by type of survey
Type of survey Means of carrying out
Range of response rates (%)
Average response rate (%)
Standard deviation
No. of surveys studied
Establishment surveys All 5-88 38 24.7 35 Establishment surveys Self-completion only 5-58 25 16.5 19 Establishment surveys Interview only 16-88 59 22.3 11 Commodity flow survey All 25-31 28 4.2 2 Freight operator surveys All 13-79 38 22.6 12 Freight operator surveys Self-completion only 14-79 35 22.3 7 Freight operator surveys Interview only 43 43 0 1 Driver surveys All 6-100 54 34.0 8 Vehicle trip diaries Self-completion only 30 30 0 2 Supplier surveys All 19-29 24 7.1 2 Service providers surveys Self-completion only 19 19 0 1
Table 6.7 indicates the wide range in response rates for establishment, commodity flow, freight operator and drivers surveys. The results also indicate the higher average response rates achieved in interview surveys compared with self-completion surveys for establishment and freight operator surveys.
24
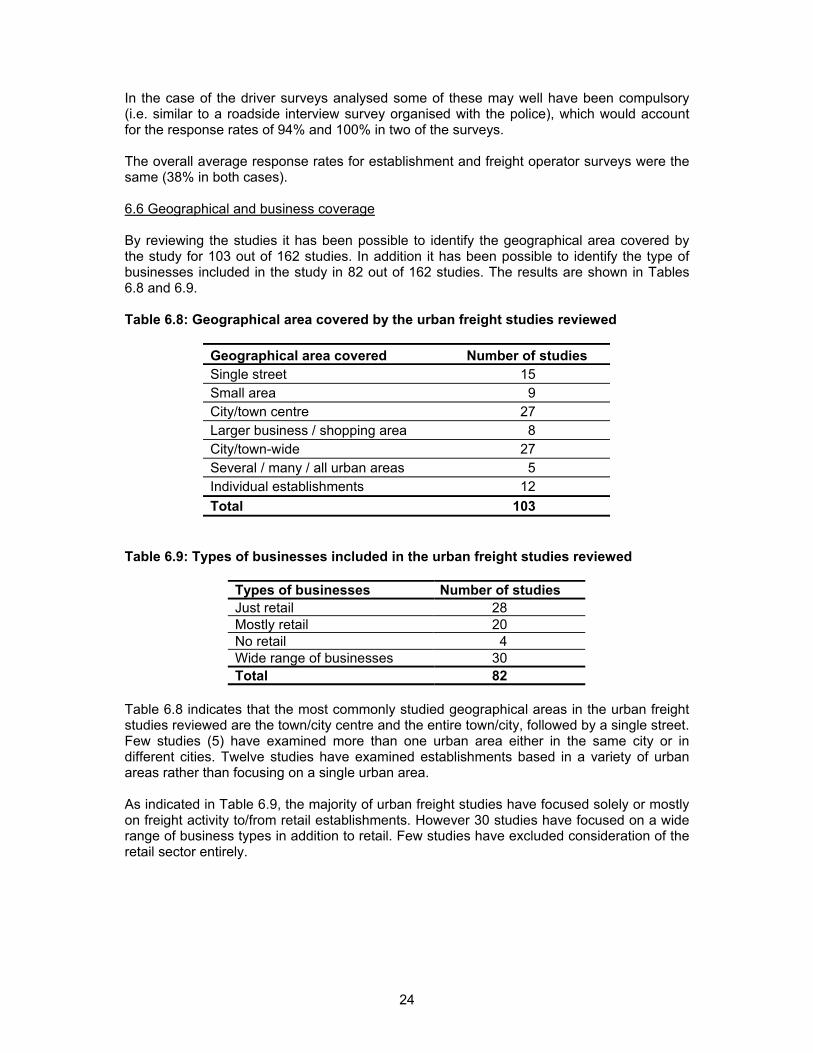
In the case of the driver surveys analysed some of these may well have been compulsory (i.e. similar to a roadside interview survey organised with the police), which would account for the response rates of 94% and 100% in two of the surveys. The overall average response rates for establishment and freight operator surveys were the same (38% in both cases). 6.6 Geographical and business coverage By reviewing the studies it has been possible to identify the geographical area covered by the study for 103 out of 162 studies. In addition it has been possible to identify the type of businesses included in the study in 82 out of 162 studies. The results are shown in Tables 6.8 and 6.9. Table 6.8: Geographical area covered by the urban freight studies reviewed
Geographical area covered Number of studies Single street 15 Small area 9 City/town centre 27 Larger business / shopping area 8 City/town-wide 27 Several / many / all urban areas 5 Individual establishments 12 Total 103
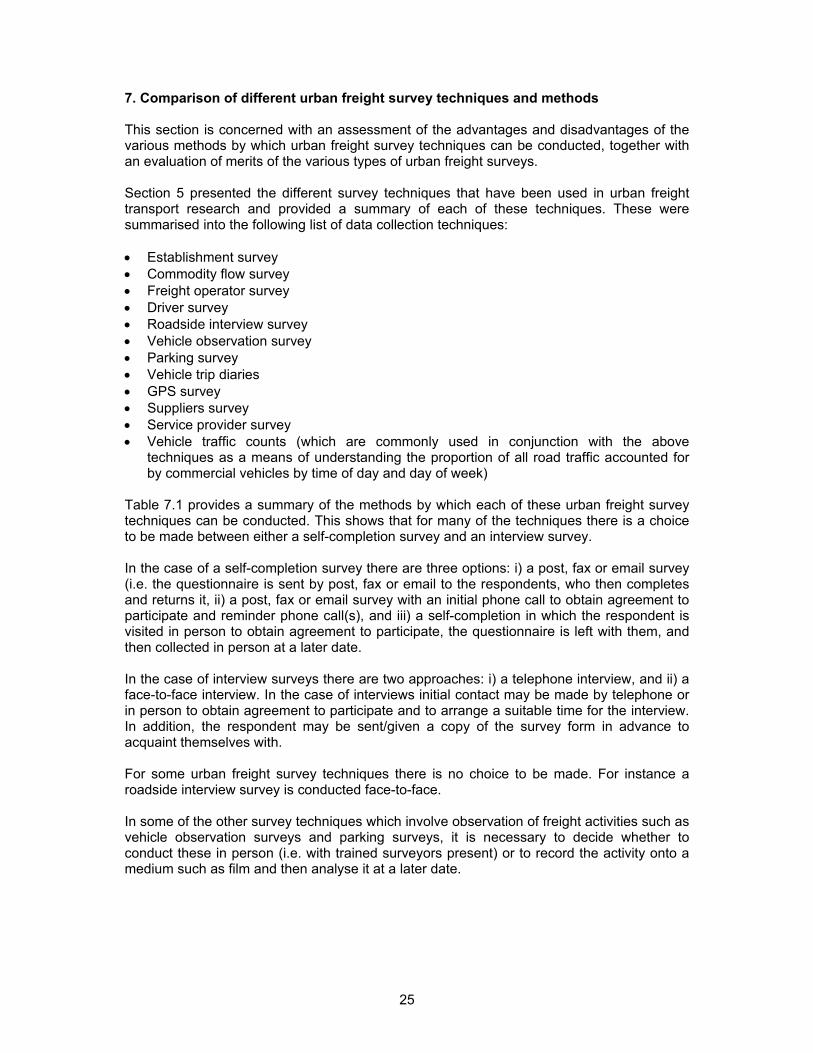
Table 6.9: Types of businesses included in the urban freight studies reviewed
Types of businesses Number of studies Just retail 28 Mostly retail 20 No retail 4 Wide range of businesses 30 Total 82
Table 6.8 indicates that the most commonly studied geographical areas in the urban freight studies reviewed are the town/city centre and the entire town/city, followed by a single street. Few studies (5) have examined more than one urban area either in the same city or in different cities. Twelve studies have examined establishments based in a variety of urban areas rather than focusing on a single urban area. As indicated in Table 6.9, the majority of urban freight studies have focused solely or mostly on freight activity to/from retail establishments. However 30 studies have focused on a wide range of business types in addition to retail. Few studies have excluded consideration of the retail sector entirely.
25
7. Comparison of different urban freight survey techniques and methods This section is concerned with an assessment of the advantages and disadvantages of the various methods by which urban freight survey techniques can be conducted, together with an evaluation of merits of the various types of urban freight surveys. Section 5 presented the different survey techniques that have been used in urban freight transport research and provided a summary of each of these techniques. These were summarised into the following list of data collection techniques: • Establishment survey • Commodity flow survey • Freight operator survey • Driver survey • Roadside interview survey • Vehicle observation survey • Parking survey • Vehicle trip diaries • GPS survey • Suppliers survey • Service provider survey • Vehicle traffic counts (which are commonly used in conjunction with the above
techniques as a means of understanding the proportion of all road traffic accounted for by commercial vehicles by time of day and day of week)
Table 7.1 provides a summary of the methods by which each of these urban freight survey techniques can be conducted. This shows that for many of the techniques there is a choice to be made between either a self-completion survey and an interview survey. In the case of a self-completion survey there are three options: i) a post, fax or email survey (i.e. the questionnaire is sent by post, fax or email to the respondents, who then completes and returns it, ii) a post, fax or email survey with an initial phone call to obtain agreement to participate and reminder phone call(s), and iii) a self-completion in which the respondent is visited in person to obtain agreement to participate, the questionnaire is left with them, and then collected in person at a later date. In the case of interview surveys there are two approaches: i) a telephone interview, and ii) a face-to-face interview. In the case of interviews initial contact may be made by telephone or in person to obtain agreement to participate and to arrange a suitable time for the interview. In addition, the respondent may be sent/given a copy of the survey form in advance to acquaint themselves with. For some urban freight survey techniques there is no choice to be made. For instance a roadside interview survey is conducted face-to-face. In some of the other survey techniques which involve observation of freight activities such as vehicle observation surveys and parking surveys, it is necessary to decide whether to conduct these in person (i.e. with trained surveyors present) or to record the activity onto a medium such as film and then analyse it at a later date.
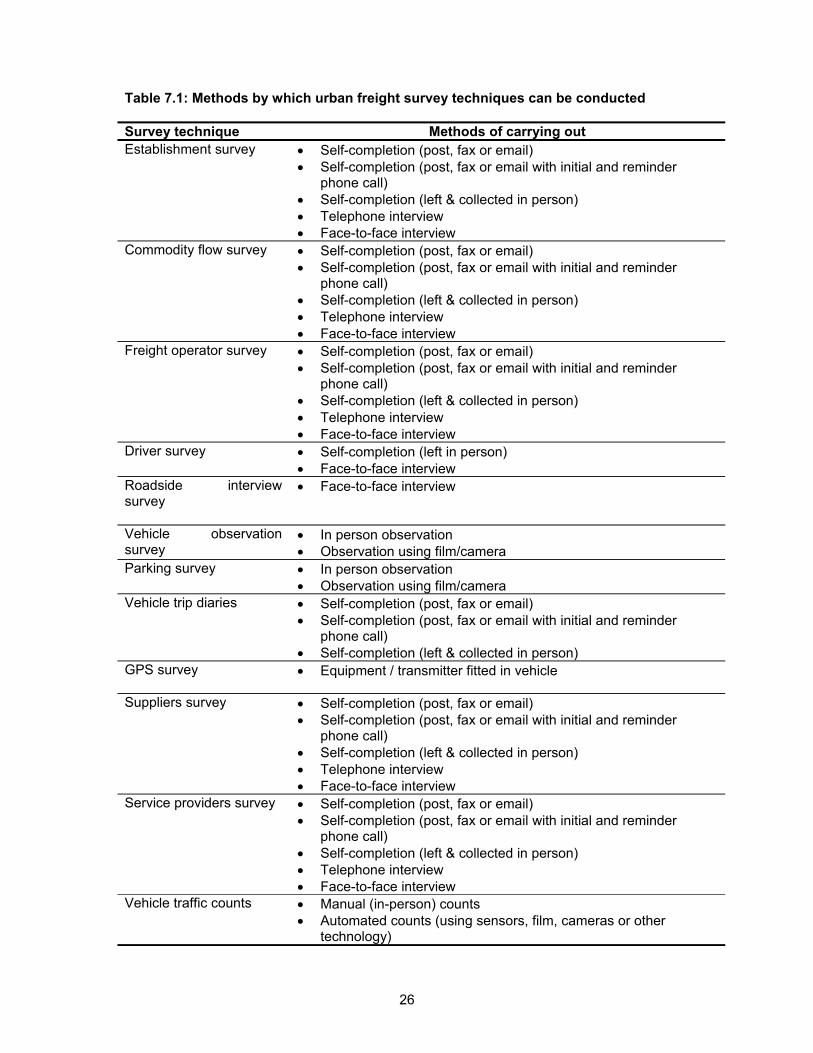
26
Table 7.1: Methods by which urban freight survey techniques can be conducted Survey technique Methods of carrying out Establishment survey • Self-completion (post, fax or email)
• Self-completion (post, fax or email with initial and reminder phone call)
• Self-completion (left & collected in person) • Telephone interview • Face-to-face interview
Commodity flow survey • Self-completion (post, fax or email) • Self-completion (post, fax or email with initial and reminder
phone call) • Self-completion (left & collected in person) • Telephone interview • Face-to-face interview
Freight operator survey • Self-completion (post, fax or email) • Self-completion (post, fax or email with initial and reminder
phone call) • Self-completion (left & collected in person) • Telephone interview • Face-to-face interview
Driver survey • Self-completion (left in person) • Face-to-face interview
Roadside interview survey
• Face-to-face interview
Vehicle observation survey
• In person observation • Observation using film/camera
Parking survey • In person observation • Observation using film/camera
Vehicle trip diaries • Self-completion (post, fax or email) • Self-completion (post, fax or email with initial and reminder
phone call) • Self-completion (left & collected in person)
GPS survey
• Equipment / transmitter fitted in vehicle
Suppliers survey • Self-completion (post, fax or email) • Self-completion (post, fax or email with initial and reminder
phone call) • Self-completion (left & collected in person) • Telephone interview • Face-to-face interview
Service providers survey • Self-completion (post, fax or email) • Self-completion (post, fax or email with initial and reminder
phone call) • Self-completion (left & collected in person) • Telephone interview • Face-to-face interview
Vehicle traffic counts • Manual (in-person) counts • Automated counts (using sensors, film, cameras or other
technology)

27
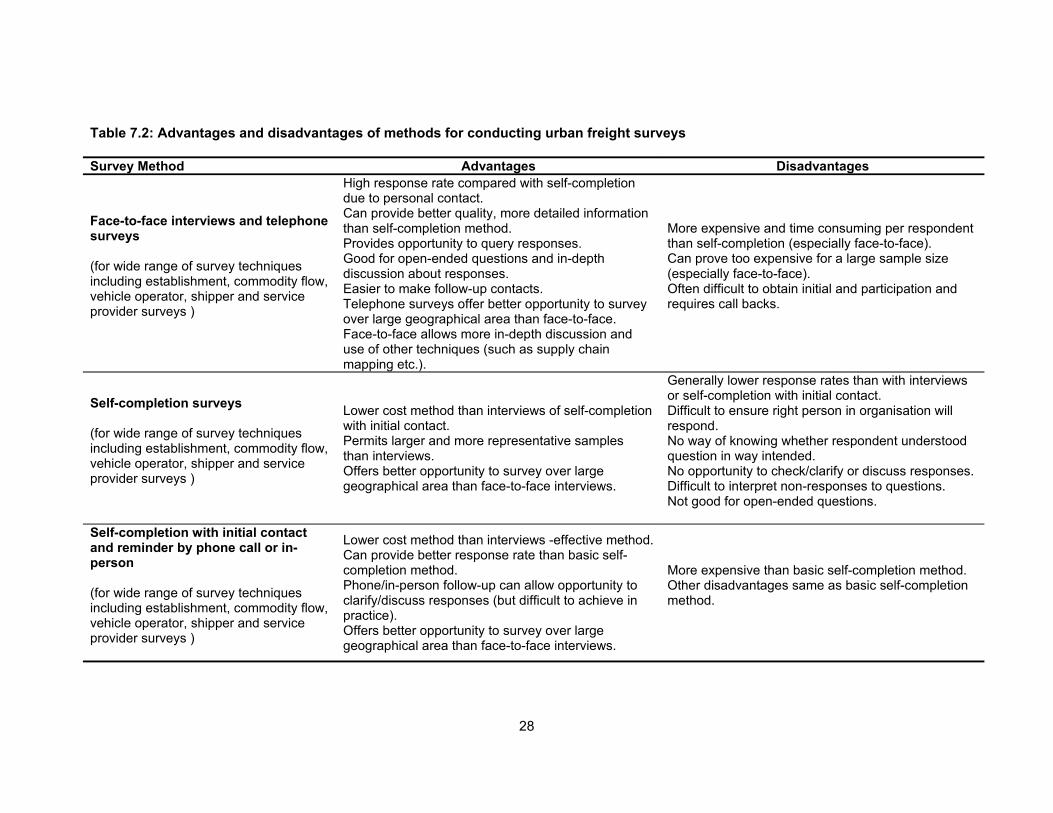
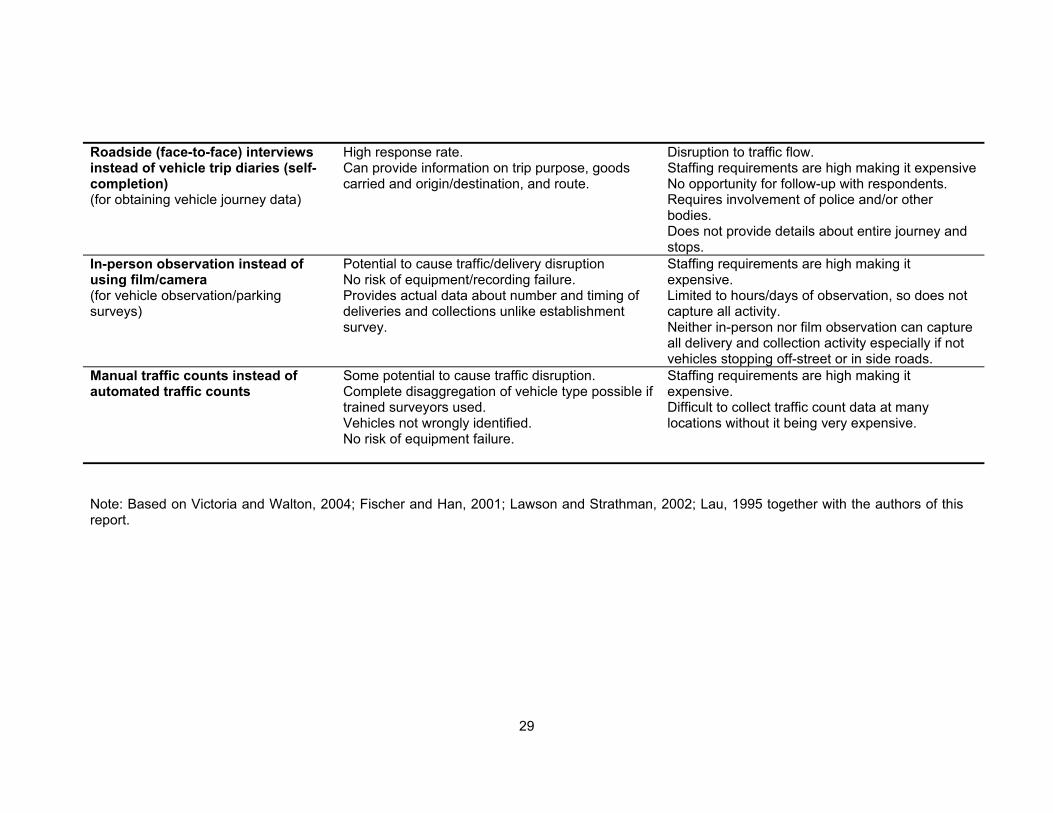
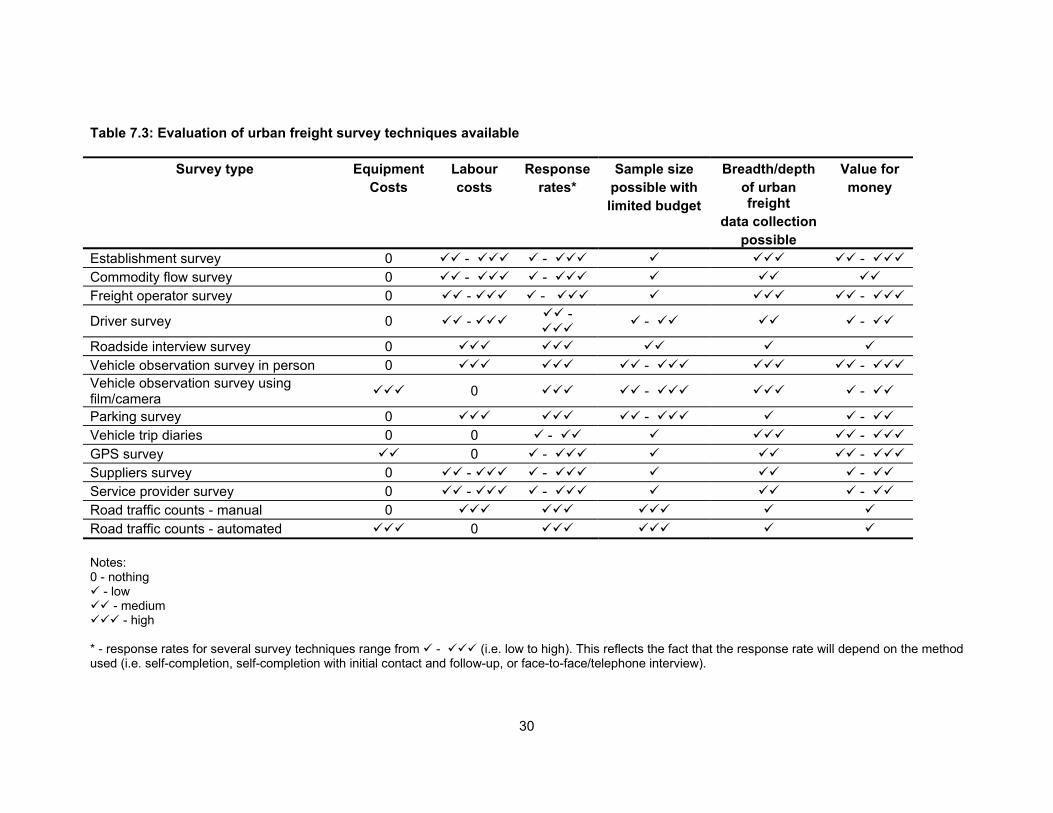
Table 7.2 provides an overview of the advantages and disadvantages of the various methods by which urban freight survey techniques can be conduced. This is based on advantages and disadvantages of methods identified in other studies (Victoria and Walton, 2004; Fischer and Han, 2001; Lawson and Strathman, 2002; Lau, 1995) together with the additional fields and comments by the authors of this report. Table 7.3 provides an overall evaluation of the urban freight survey techniques available to researchers, attempting to indicate resource requirements (for data collection not analysis), breadth/depth of data collection potential, sample size possible with a limited budget, and value for money.
28
Table 7.2: Advantages and disadvantages of methods for conducting urban freight surveys Survey Method Advantages Disadvantages
Face-to-face interviews and telephone surveys (for wide range of survey techniques including establishment, commodity flow, vehicle operator, shipper and service provider surveys )
High response rate compared with self-completion due to personal contact. Can provide better quality, more detailed information than self-completion method. Provides opportunity to query responses. Good for open-ended questions and in-depth discussion about responses. Easier to make follow-up contacts. Telephone surveys offer better opportunity to survey over large geographical area than face-to-face. Face-to-face allows more in-depth discussion and use of other techniques (such as supply chain mapping etc.).
More expensive and time consuming per respondent than self-completion (especially face-to-face). Can prove too expensive for a large sample size (especially face-to-face). Often difficult to obtain initial and participation and requires call backs.
Self-completion surveys (for wide range of survey techniques including establishment, commodity flow, vehicle operator, shipper and service provider surveys )
Lower cost method than interviews of self-completion with initial contact. Permits larger and more representative samples than interviews. Offers better opportunity to survey over large geographical area than face-to-face interviews.
Generally lower response rates than with interviews or self-completion with initial contact. Difficult to ensure right person in organisation will respond. No way of knowing whether respondent understood question in way intended. No opportunity to check/clarify or discuss responses. Difficult to interpret non-responses to questions. Not good for open-ended questions.
Self-completion with initial contact and reminder by phone call or in-person (for wide range of survey techniques including establishment, commodity flow, vehicle operator, shipper and service provider surveys )
Lower cost method than interviews -effective method. Can provide better response rate than basic self-completion method. Phone/in-person follow-up can allow opportunity to clarify/discuss responses (but difficult to achieve in practice). Offers better opportunity to survey over large geographical area than face-to-face interviews.
More expensive than basic self-completion method. Other disadvantages same as basic self-completion method.
29
Roadside (face-to-face) interviews instead of vehicle trip diaries (self-completion) (for obtaining vehicle journey data)
High response rate. Can provide information on trip purpose, goods carried and origin/destination, and route.
Disruption to traffic flow. Staffing requirements are high making it expensive No opportunity for follow-up with respondents. Requires involvement of police and/or other bodies. Does not provide details about entire journey and stops.
In-person observation instead of using film/camera (for vehicle observation/parking surveys)
Potential to cause traffic/delivery disruption No risk of equipment/recording failure. Provides actual data about number and timing of deliveries and collections unlike establishment survey.
Staffing requirements are high making it expensive. Limited to hours/days of observation, so does not capture all activity. Neither in-person nor film observation can capture all delivery and collection activity especially if not vehicles stopping off-street or in side roads.
Manual traffic counts instead of automated traffic counts
Some potential to cause traffic disruption. Complete disaggregation of vehicle type possible if trained surveyors used. Vehicles not wrongly identified. No risk of equipment failure.
Staffing requirements are high making it expensive. Difficult to collect traffic count data at many locations without it being very expensive.
Note: Based on Victoria and Walton, 2004; Fischer and Han, 2001; Lawson and Strathman, 2002; Lau, 1995 together with the authors of this report.
30
Table 7.3: Evaluation of urban freight survey techniques available
Survey type EquipmentCosts
Labour costs
Responserates*
Sample size possible with limited budget
Breadth/depth of urban freight
data collection possible
Value for money
Establishment survey 0 - - - Commodity flow survey 0 - - Freight operator survey 0 - - -
Driver survey 0 - - - -
Roadside interview survey 0 Vehicle observation survey in person 0 - - Vehicle observation survey using film/camera 0 - -
Parking survey 0 - - Vehicle trip diaries 0 0 - - GPS survey 0 - - Suppliers survey 0 - - - Service provider survey 0 - - - Road traffic counts - manual 0 Road traffic counts - automated 0 Notes: 0 - nothing
- low - medium
- high * - response rates for several survey techniques range from - (i.e. low to high). This reflects the fact that the response rate will depend on the method used (i.e. self-completion, self-completion with initial contact and follow-up, or face-to-face/telephone interview).
31
8. Concluding thoughts and observations Urban freight transport studies have only been taking place for approximately 50 years and in relatively small numbers internationally according to the results of this literature review (although more studies are likely to have taken place than have been identified in the review). To date, many urban freight study reports are not publicly available (many have not been formally published as they were commissioned by a client and were only ever provided to that client), and none of the raw data from these studies is publicly available. Trying to locate urban freight study reports for the purposes of producing this review has been time consuming. Trying to obtain publications and data after the completion of such studies is currently extremely complicated and difficult as often both the individual managing the project in the commissioning body as well as the personnel in the body carrying out the survey are no longer working in these organisations (and often they are the only people able to locate such documents and data). As most urban freight studies are commissioned using public funding it would seem sensible: i) to ensure that reports and other publications (as well as datasets) from urban freight studies are made publicly available, and ii) that these reports and other publications are pooled in an accessible place so that they can be referred to by researchers and policy makers now and in the future. A repository should be established to house both publications related to these studies and data sets (in a similar manner to American traffic count data and reports that are now made available online). The research and consultancy community that is engaged in carrying out urban freight studies that involve urban freight data collection is still relatively small and is still learning how to make improvements to survey techniques. There is major scope to learn from previous studies, and the data collection techniques of others. For instance, making available survey forms and methodologies from previous studies will assist current and future researchers in determining a suitable survey design for their studies and in appropriate phrasing for questions. We intend to produce another study to accompany this study that contains all the urban freight survey forms that we have obtained during the course of this work as a starting point. The review indicates that more urban freight studies involving data collection have taken place in the UK than in any other country. This is partly due to the authors’ greater familiarity with such studies in the UK than elsewhere, especially in the case of studies that have not been formally published. Other countries in which a sizeable number of such urban freight studies have been carried out include USA, the Netherlands, Germany and Italy. Urban freight studies involving data collection seem to have commenced during the 1960s in the UK and USA. During the 1970s the number of studies increased markedly in the UK. However this increase in the UK was not replicated elsewhere. Relatively few studies took place in the 1980s, including in the UK where national and urban government support for such work appears to have diminished significantly. The 1990s witnessed a marked increase in urban freight survey work in several countries including Germany, USA, the Netherlands, France, the UK and Italy. This trend has continued and even increased in Italy and especially in the UK during the first eight years of the 2000s, with more urban freight studies taking place over this period in these two countries than in any previous decade. In other countries including Spain, Portugal, Japan, Canada, Australia and Ireland the number of such studies has also increased. However in other countries the number of such studies has either remained relatively stable (USA, the Netherlands), or has fallen (such as in Germany and France).
32
Only five of the 162 studies reviewed carried out survey work on a regular basis, all the rest were one-off studies. This reduces the opportunity and ability to track trends in urban freight activity over time. The most important purpose for collecting data in urban freight studies appears to have been to gain understanding and for research purposes. Collecting data for policy-decision-making and for obtaining inputs to models seem to be approximately equal in importance (in terms of the number of studies for which these were the main objective of the data collection efforts). The results indicate that vehicle activity at urban establishments is most often the primary focus of the data collection efforts in urban freight studies. The importance of the focus on this activity has become increasingly pronounced since the 1990s. A primary focus on vehicle rounds is the next most important. Commodity flow has only been the primary focus of seven out of 138 studies for which this information was available. In the studies reviewed, establishment surveys have been the most commonly used survey technique, followed by freight operator surveys, vehicle observation surveys, driver surveys and roadside interview surveys, and vehicle trip diaries. Few examples (five or less) of all other types of survey technique (commodity flow surveys, parking surveys, GPS surveys, suppliers surveys and service providers surveys) were identified. Three of the survey types were exclusively used in the UK (parking surveys, suppliers surveys and service providers surveys). Commodity flow surveys have only been used in Canada, Australia and the Netherlands in urban freight studies. Several of the studies reviewed followed up the survey work with qualitative interviews and/or focus group sessions in order to attempt to better understand some of the decision-making processes involved in urban freight activity and relationships between parties in the supply chain. Some studies have used self-completion approaches (postal, fax and email) to collect data while other have used interview approaches (face-to-face and telephone). In some studies both self-completion and interview approaches were used (sometimes for a single survey, while in other cases for different types of survey). The results indicate that the interview approach has been used more extensively than the self completion approach. The sample sizes for the surveys carried out in the studies reviewed varies, both between studies (presumably determined by the size of the budget) and between survey techniques (as some techniques can yield a larger sample for the same cost than another technique – but often with a less detailed response). The majority of studies involve relatively small sample sizes There is a wide variation in response rates for establishment, commodity flow, freight operator and drivers surveys among the studies reviewed. The results indicate a higher average response rates achieved in interview surveys compared with self-completion surveys for establishment and freight operator surveys. The overall average response rates for establishment and freight operator surveys were the same (38% in both cases). The geographical area examined varies between studies from an entire town/city to a single street. The majority of these urban freight studies have focused solely or mostly on freight activity to/from retail establishments. When discussing vehicle movements to and from urban establishments, many of the studies reviewed are rather unclear about what is included and not included (in terms of whether all types of deliveries and collections are included or not). Relatively few of the studies reviewed have collected data about service trips to urban establishments despite the growing importance of these trips in terms of sustaining the establishments, traffic flow, and parking issues (only 17 out of the 162 studies).
33
Establishment and vehicle observation surveys offer the most efficient and cost-effective methods for obtaining understanding of a wide range of issues associated with urban freight deliveries and collections from the perspective of establishments in a specific urban area. These techniques can provide insight into the frequency of goods vehicles deliveries and collections by time of day and day of week, the activities involved in the loading/unloading process, and the freight requirements of individual establishments. As mentioned, in the studies reviewed, there has been less research into vehicle rounds compared to goods vehicle activity at urban establishments. Current understanding of vehicle rounds and operating patterns associated with different types of goods and servicing activity in urban areas is relatively poor. Although government-led national data collection efforts (such as vehicle trip diaries collected as part of the CSRGT) can provide insight into these vehicle operating patterns at a national scale, disaggregation of urban operations from this national data is often not possible due to small sample sizes and the lack of data collection about rounds involving five or more stops. This information could be best collected through the use of driver surveys, vehicle trip diaries and the possibilities offered by GPS equipment. Road traffic counts can provide insight into the scale of goods vehicle flows in a given area by time of day and day of week, but not about the trip purpose, and origin/destination. Roadside interview surveys can provide insight into the trip purpose and often into the previous and next destination, but often due to time limitations not into vehicle operating pattern and ultimate origin/destination and all intermediate stops. These two survey approaches appear to offer less value for money in terms of providing insight into urban freight activities (and the purpose and detail of these activities including loading/unloading operations) than the other survey techniques reviewed. Where there are two survey techniques that can be used to collect the same urban freight data (such as establishment surveys and vehicle observation surveys) there is a need to compare and validate these techniques to determine the accuracy of each, and to investigate how both can potentially be enhanced to make up for any shortcomings they have.
34
References Abel, H., 2006, Report on urban freight data collection in Switzerland, BESTUFS WP 3.1 National Report, BESTUFS. Aiura, N. and Taniguchi, E., 2006, Planning on-street loading-unloading spaces considering the behaviour of pick-up delivery vehicles and parking enforcement, Taniguchi, E. and Thompson, R. (eds.), Recent Advances in City Logistics, Proceedings of 4th International Conference on City Logistics, 12-14 July 2005, Malysia, pp.107-116. Akker, P. van den, Visser, J., & E. Wieme, 1992, Stedelijke distributie in Tilburg, NHTV, Tilburg, (in Dutch). Allen, J., Browne, M., Cherrett, T. And McLeod, F., 2008, Review of UK Urban Freight Studies, Green Logistics project, Universities of Westminster an Southampton. Allen, J., Tanner, G., Browne, M., Anderson, S., Christodoulou, G. and Jones, P., 2003, Modelling policy measures and company initiatives for sustainable urban distribution – Final Technical Report, project carried out as part of the EPSRC/DfT Future Integrated Transport Programme, University of Westminster. Allen, J., Anderson, S., Browne, M., and Jones, P., 2000, A Framework for Considering Policies to Encourage Sustainable Urban Freight Traffic and Goods/Service Flows: Summary Report, University of Westminster. Baker, R., 1970, Understanding the Present Goods System, in: The Urban Movement of Goods, Consultative Group on Transportation Research, OECD. Bartlett, R. and Christie, A., 1978, The Hull Freight Study, Traffic Engineering and Control, November 1978, pp.498-502. Bartlett, R. and Newton, W., 1982, Goods vehicle trip generation and attraction by industrial and commercial premises, TRRL Laboratory Report 1059. BESTUFS, 2006, Report on urban freight data collection in Sweden, BESTUFS WP 3.1 National Report, BESTUFS. Binnenbruck, H. H., 2006, Report on urban freight data collection in Germany, BESTUFS WP 3.1 National Report, BESTUFS. Binsbergen, A.J. van, and Visser, J., 1999, Innovation Steps Towards Efficient Goods Distribution Systems for Urban Areas, TRAIL Thesis Series nr. T2001/5, The Netherlands TRAIL Research School. Boerkamps, J. and Oosterhout, B van., 2003, Dataverzameling Stedelijke Distributie: Eindrapporte Fase A: Deel 1 – Methodologie Bevoorradingsproefiel, Connekt (in Dutch). Boerkamps, J., 2002, State of the Art of City Logistics in the Netherlands: Research Framework and Research Activities, Taniguchi, E., and Thompson, R. (eds.) City Logistics II, p.241-253 Bowyer, D., Thompson, R. and Spiridonos, F., 2007, Melbourne Freight Movement Model, Taniguchi, E. and Thompson, R. (eds.), Proceedings of 5th International Conference on City Logistics, 11-13 July, Crete, Greece, pp.205-219.
35
Browne, M. and Allen, J. 2006, Urban freight data collection - synthesis report, Deliverable 3.1 Best Practice in data collection, modelling approaches and application fields for urban commercial transport models I, BESTUFS project. Browne, M., Allen, J. and Anderson, S., 2005, Freight Transport Project in Southwark and Lewisham: Final Report, University of Westminster. Cherrett, T.J. and Hickford, A.J., 2005, Freight and the economy. The effects of freight movements associated with retailers common to Chichester, Horsham, Worthing and Crawley. Final report in response to the brief set out by West Sussex County Council as part of their second Local Transport Plan. Cherrett, T. and Smyth, K., 2003, Freight Vehicle Movements in Winchester: Issues affecting supplier, courier and service providers, Final Report, University of Southampton. Cherrett, T., McLay, G. and McDonald, M., 2002, Effects of Freight Movements in Winchester, Final Report, University of Southampton. Christie, A., Bartlett, R., Cundill, M. and Prudhoe, J., 1973, Urban freight distribution: studies of operations in shopping streets at Newbury and Camberley, TRRL Report LR603. Christie, A., Prudhoe, J. and Cundill, M., 1973, Urban freight distribution: a study of operations in High Street Putney, TRRL Report LR556. City of Edmonton & and Alberta Transportation, 2003, Edmonton Region Commodity Flow Study Project Report. City of Edmonton & and Alberta Transportation, 2003, Edmonton Region External Truck/Commodity Survey. Colon, P., 2007, BESTUFS, presentation at 3rd Roundtable WP 3.1, Brussels. Coopers & Lybrand Management Consultants, 1991a, Plaatsen definitiestudie. Coopers & Lybrand, Rotterdam (in Dutch). Coopers & Lybrand Management Consultants, 1991b, Plaatsen van stadsdistributiecentra: naar een bereikbare en leefbare binnenstad van Maastricht, plan van aanpak, Coopers & Lybrand, Rotterdam (in Dutch). COST 321, 1998, Urban Goods Transport: Final Report of the Action,European Commission; Abel, H., 2006, Report on urban freight data collection in Switzerland, BESTUFS WP 3.1 National Report, BESTUFS. CSST, 1998, Indagine conoscitiva sulla raccolta e distribuzione delle merci nella città di Palermo, Centro Studi sui Sistemi di Trasporto S.p.A., Napoli. Debauche, W. and Decock, D., 2006, Report on urban freight data collection in Belgium, BESTUFS WP 3.1 National Report, BESTUFS. Debauche, W., 2007, An investigation into the delivery of goods to the city centre of Liege, paper presented at the 5th International Conference on City Logistics, p.247-261. Devon County Council, 2004, Torbay Freight Quality Partnership: Business and Driver Survey, private communication.
36
DHV, 1982, Goederenvervoer in binnensteden een onderzoek in vijf Nederlandse steden Den Haag, DHV. DHV, 1999, Pilot OLS Utrecht, Inventarisatie goederenstromen, DHV, Amersfoort (in Dutch). DHV, CIMK, Ministerie van Verkeer en Waterstaat en Ministerie van Economische Zaken, 1987, Onderzoek relatie verkeersmaatregelen-effecten op het goederenvervoer, Hoofdonderzoek, DHV, Amersfoort,(in Dutch). Edwards, S., 1997, Distribution in City Centres: Investigating the Logistics Impacts of City Centre Retail Strategies, paper presented at Universities Transport Studies Group annual conference, Bournemouth, 1997. Figliozzi, M., Kingdon, L. and Wilkitzki, A., 2006, Freight Distribution Tours in Congested Urban Areas: Characteristics and Implications for Carriers’ Operations and Data Collection Efforts, Fischer, M.J., and Han, M., 2001, Truck Trip Generation Data, NCHRP Synthesis 298, Transportation Research Board. Friedrich, M., Haupt, T., Noekel, K.., 2003, Freight Modelling: Data Issues, Survey Methods, Demand and Network Models, Proceedings of 10th International Conference on Travel Behaviour Research, Lucerne. Galaverna, S., Migliaccio, E., Musso, E., 1995, Goods distribution in historical city areas by electric vehicles. Case study, Urban Transportation I, 'Transactions on the Built Environment vol 16, WIT Press. P.11-18. Gentile, G. and Vigo, D., 2006, Movement generation and trip distribution for freight modelling applied to city logistics, paper submitted to Transportation Science. Govera Stedinet, 2006, Kilometerbesparing door bundeling, April 2006. Greater London Council (GLC), 1975, Greater London Transportation Survey, Vol. III: Goods Vehicle Survey Report. Greater London Council (GLC), 1981, GLTS 1981: Transport Data for London, GLC. Greaves, S. and Figliozzi, M., 2007, Commercial Vehicle Tour Data Collection Using Passive GPS Technology: Issues and Potential Applications, Paper Submitted to Transportation Research Board 87th Annual Meeting, January 2008 Hasell, B. and Christie, A., 1978, The Greenwich-Lewisham Freight Study, TRRL Supplementary Report 407 Heidemij Advies, 1995, Marktverkenning Encilog Haarlem, rapportage fase 1 en 2, Heidemij, Arnhem (in Dutch) . Hitchcock, A., Christie, A. and Cundill, M., 1974, Urban Freight: Preliminary results from the Swindon freight survey, TRRL Supplementary report 126UC, Transport and Road Research Laboratory. Holguin-Veras, J. and Patil, G., 2005, Observed Trip Chain Behavior of Commercial Vehicles. Transportation Research Record 1906, 74-80.
37
Holguin-Veras, J. and Thorson, E., 2000, Trip Length Distributions in Commodity-Based and Trip-Based Freight Demand Modeling: Investigation of Relationships, Transportation Research Record, No.1707, pp.37-48. Holguín-Veras, J., Pérez, N., Cruz, B. and Polimeni, J., 2006, Effectiveness of Financial Incentives for Off-Peak Deliveries to Restaurants in Manhattan, New York, Transportation Research Record, No.1966, pp51-59. Holguín-Veras, J. and Polimeni, J., 2006, Potential for off-peak freight deliveries to congested urban areas (TIRC project c-02-15), Final Report. Hoofdbedrijfschap Detailhandel (HBD), 1992, Bevoorrading van detailhandel in binnensteden. Een studie naar de haalbaarheid en effecten van stadsdistributiecentra, HBD, Den Haag (in Dutch). Hoofdbedrijfschap Detailhandel (HBD), 1995, Mag het ook een kilometertje minder zijn? Kwantificering van de vervoerbelasting naar de achterdeur van de detailhandel en beschrijving van de (on)mogelijkheden om deze te beinvloeden, HBD, Den Haag (in Dutch). Hunt, J., Stefan, K. and Brownlee, A., 2006, Establishment-based survey of urban commercial vehicle movements in Alberta, Canada, Transportation Research Record, Vol.1957, p.75-83 Iding, M., Meester, W. and Tavasszy, L., 2002, Freight trip generation by firms, Paper for the 42nd European Congress of the Regional Science Association, Dortmund. Intermodality, 2004 IMT J0015 Business Survey Report International Results Group, 2001, 2000 Commodity Flow Survey report, report to the City of Calgary, International Results Group. International Results Group, 2001, External Truck Survey Study: Calgary region, report to the City of Calgary. Iwao, E., Kuse, H. and Castro, J., 2001, Estimating parking spaces due to improvements in the physical distribution system at commercial districts, paper presented at WCTR 2001, paper 2515 James, J., 2005, Managing Freight in the City of Cork, presentation at BESTUFS workshop, 29-30 September 2005, Kaposvar, Hungary. Jennings, A., Sharp, C. and Whibley, D., 1972, Delivering the Goods: A study of the Watford service-only precinct, Research Report No.2, Freight Transport Association, Croydon. Jessep, E., Casavant, K. and Lawson, C, 2004, Truck Trip Data Collection Methods, Final Report SP343, for Oregon Department of Transport and Federal Highway Administration. Kohler, U., 1999, City Logistics in Kassel, Taniguchi, E. and Thompson, R. (eds) City Logistics I, Proceedings of 1st International Conference on City Logistics, 12-14 July 1999, Cairns, Australia, p261- 271. Kriger, D., Tan, E. and Clavelle, A., 2007, Results of the TAC Project on the Framework for the Collection of High-Quality Data on Urban Goods Movement (Phase 1), Resource paper prepared for the Panel Session on Framework for the Collection of High-Quality Data on

38
Goods Movement, 2007 Annual Conference of the Transportation Association of Canada, Saskatoon, Saskatchewan. Lawson, C. and Strathman J.D., 2002, Survey Methods for Assessing Freight Industry Opinions, Final Report, SPR 328, prepared for Oregon DOT and FHWA, Lau, S.W., 1995, Truck Travel Surveys: A Review of the Literature and State of the Art, prepared for the Metropolitan Transportation Commission, Oakland, California. London County Council, 1964, London Traffic Survey, Volume I, London County Council. London Councils, 2008, Latest version of TRAVL (Trip Rate Assessment Valid for London) survey form provided by London Councils. London Research Centre and Department of Transport, 1994, Travel in London: London Area Transport Survey 1991, HMSO, London. Lozano, A., Antun, J., Santos, C., Alarcon, R., Granados, F. and Hernandez, R., 2006, Bases for a policy for the development of logistics platforms in the Metropolitan Zone of Mexico City, Taniguchi, E. and Thompson, R. (eds.), Recent Advances in City Logistics, Proceedings of 4th International Conference on City Logistics, 12-14 July 2005, Malysia, pp.375-388. Macario, R., Filipe, L., Reis, V. and Martins, P., 2007, Elements for a Master Plan for Logistics, Taniguchi, E. and Thompson, R. (eds.), Proceedings of 5th International Conference on City Logistics, 11-13 July, Crete, Greece, pp.493-512. Macário, R., Filipe, L., Martins, P. and Reis, V., 2007, Urban mobility management: what about distribution of urban goods?, paper presented at WCTR, 2007 - paper 1611. Masson, M., 1970, Study of Goods Movement in Urban Areas in Aix-en-Provence and Metz-Thionville, in The Urban Movement of Goods, Consultative Group on Transportation Research, OECD. McCabe, S., Roorda, M. and Kwan, H., 2008, Comparing GPS and non-GPS Survey Methods for Collecting Urban Goods and Service Movements, ICSTC, Annecy, 25-31 May. McKinnon, A., 2002, Freight transport and logistics in west central Scotland, Report to West of Scotland Transport Partnership. McKinnon, A., 1999, Vehicle utilization and energy efficiency in the food supply chain. Full Report of the Key Performance Indicator Survey. Melo, S. and Costa, A., 2007, Effects of collaborative systems on urban goods distribution, paper presented at WCTR 2007, paper 1524. Metra Consulting Group, 1973a, Supplying Shopping Areas: The Operation and Cost of a Transhipment Depot Serving a Pedestrian Shopping Area, Volumes 1-2, London. Metra Consulting Group, 1973b, Supplying Shopping Areas: The Operation and Cost of a Transhipment Depot Serving a Pedestrian Shopping Area, Volumes 3-4, London. Mizutani, 1999, Measures to enhance the efficiency of urban freight transportation in Hiroshima City, Taniguchi, E. and Thompson, R. (eds) City Logistics I, Proceedings of 1st International Conference on City Logistics, 12-14 July 1999, Cairns, Australia, p289-302.
39
Monticelli, M., 1997, City Logistics and Traffic Planning: Experiences from the City of Bologna Morris, A. and Kornhauser, A., 2000, Relationship of Freight Facilities in Central Business District Office Buildings to Truck Traffic, Transportation Research Record, Vol.1707, p.56-63. Morris, A. 2004, The impact of inadequate off-loading facilities in commercial office buildings upon freight efficiency and security in urban areas, European Transport \ Trasporti Europei n. 28 (2004): 85-93. Morris, A., Kornhauser, A. and Kay, M., 1999, Getting the Goods Delivered in Dense Urban Areas: A Snapshot of the Last Link of the Supply Chain , Transportation Research Record, Vol.1653, p.34-41. Morris, A., Kornhauser, A. and Kay, M., 1998, Urban Freight Mobility: Collection of data on time, costs, and business related to moving product into the Central Business District, Transportation Research Record, Vol.1613, p.27-32. Muñuzuri, J., 2006, Report on urban freight data collection in Spain, BESTUFS WP 3.1 National Report, BESTUFS. Musso, A., 2006, Report on urban freight data collection in Italy, BESTUFS WP 3.1 National Report, BESTUFS. MVA and Preston Solutions, 2007, London Wholesale Markets Freight Study: Final Report. MVA, 2002, Park Royal Freight Survey, MVA. MVA, 2004, West London FQP - Ealing Town Centre Detailed Freight Survey, MVA. MVA, 2005, Freight Quality Partnership Studies at Wallington Town Centre, MVA. Nathaniel Lichfield and Partners, 1975, Chichester Central Area Servicing System: Local Interchange Depot Study, London. O’Mahony, M., Finlay, H. and Finnegan, C., 2004, Sustainable Freight Distribution in a Historic Urban Centre: Final Report, Centre for Transport Research, Trinity College Dublin. Ogden, K., 1992, Urban Goods Movement: A Guide to Policy and Planning, Ashgate, Kent. Oranjewoud, 2000, Effectmeting Stedelijke Distributie Amsterdam, Ministerie van Verkeer en Waterstaat. Oranjewoud, 1993, Effecten van stadsdistributie op het gebied van vervoer, verkeer, energie en milieu, onderzoek naar goederenvervoer en -verkeer in Maastricht, Oranjewoud, Rotterdam, (in Dutch). Oscar Faber TPA, 1994, Freight Transfer and Transhipment Study, Hampshire County Council, 1994. Parsons, K., & Cleckley, E., 2006, New Orleans Intra-City Truck Freight Study, New Orleans Regional Planning Commission and Wilber Smith Associates, presentation at USDOT Talking Freight seminar on Small MPOs and Innovative Freight Projects, 19 April 2006.
40
Patier, D. and Routhier, J.L., 2006, Report on urban freight data collection in France, BESTUFS WP 3.1 National Report, BESTUFS. Patier, D. and Routhier, J.L., 2008, How to improve the capture of urban goods movement data?, 8th International Conference on Survey Methods In Transport, Annecy, France 25 -31 May 2008. Peter Brett Associates, 2006, Catford Freight Delivery Study. Peter Brett Associates, 2003, Reading Town Centre Freight Access Plan: Market Place Freight Accessibility Study. Platform Stedelijke Distributie (PSD), 2000, Effectmeting Groningen, Ministerie van Verkeer en Waterstaat. Polytechnic of Central London & Alastair Dick & Associates, 1985, Servicing of Premises in Oxford Street: Interim Report on Surveys Protopapas, A, Chatterjee, A., Miller, T., and Everett, J., 2005, Travel Characteristics of Urban Freight Vehicles and their Effects on Emission Factors, Transportation Research Record, no.1941, p.89-98 Quak, H. and de Koster, R., 2006, Exploring retailers' sensitivity to local sustainability policies, Erasmus University. Rand Europe, 2002, Review of Freight Modelling, Report B2 – Review of Models in Continental Europe and Elsewhere, DfT. Regione Emilia-Romagna, 2005, City Ports Project: Interim Report, City Ports. Ross, C., Guensler, R. and Stevens, P., 1998, Spatial and statistical analysis of commercial vehicle activity in Metropolitan Atlanta, Transportation Research Record, Vol.1625, pp.165-172. Ruesch, M. and Glücker, C., 2000, Best Practice Handbook Year 1, Deliverable D2.1, BESTUFS. Ruiter, R. J., 1992, Development of an urban truck travel model for the Phoenix Metropolitan Area. Report No. FHWA-AZ92–314, Arizona Department of Transportation, Phoenix. Russo, F., Comi, A. and Polimeni, A., 2007, A macro-model to analyze shops’ restocking services, paper presented at WCTR 2007 - paper 1044 Salgado, R., 2005, Is there room for improvement in the management of loading/unloading bays in the Seven Dials Area, MSc dissertation, University of Westminster. Schoemaker, J, Allen. J, Huschebeck, M. And Monigl, J., 2006, Quantification of Urban Freight Transport Effects I, BESTUFS Deliverable report 5.1, BESTUFS project. Schwerdtfeger, W., 1976, Stadtischer Lieferverkehr Bestimmingsgrunde, Umfang und Ablauf des Lieferverkehrs von Einzelhandels- und Dienstleistungbetrieben, Braunschweig. Shimuzu, M., Hyodo, T., Takebayashi, H., Kuse, H. and Hagino, Y., 2007, Study of delivery distribution in the central area by Tokyo Metropolitan Freight Survey, Taniguchi, E. and
41
Thompson, R. (eds.), Proceedings of 5th International Conference on City Logistics, 11-13 July, Crete, Greece, pp.393-407. Sinarimbo, N., Takahashi, Y. and Hyodo, T., 2004, Freight demand management in CBD: A Simulation Analysis of Cooperative Delivery System in Marunouchi, paper presented at WCTR, 2004, paper116 STA, Studio per la mobilità delle merci nel Centro storico di Roma 1999-2000 (Study on the goods movements in Rome’s historical centre 1999-2000), Rome 2001. Steer Davies Gleave, 2005, Freight in Colchester Town Centre: Outputs of Town Centre Business Survey, SDG. Stefan, K., Brownlee, A., McMillan and Hunt, J., 2005, The Nature of Urban Commercial Movements in Alberta, paper presented at Computers in Urban Planning and Urban Management Conference, London, UK, June 2005. Steinmeyer, I., 2003, Kenndaten der Verkehrsentstehung im Personenwirtschaftsverkehr – Analyse der voranschreitenden Ausdifferenzierung der Mobilitätsmuster in der enstleistungsgesellschaft, Dissertation an der Technischen Universität Hamburg-Harburg, Hamburg. Stiller, Schoner en Zuiniger (SSZ), 2000, Effectmeting stedelijke distributie Groningen, SSZ Sustrate, V., 1999, Germany, in Freight Transport and the City, Round Table 109, ECMT, Paris, pp.5-28. Synovate, 2006, Business Van Usage in Croydon & Westminster: Quantitative Research Report, Synovate. Taylor, S. and Ogden, K., 1998, The utilization of commercial vehicles in urban areas, Transport Logistics, Vol.1, No.4, pp.265-277 Teas Wood, R., 1970, Measuring Urban Freight in the Tri-State Region, in The Urban Movement of Goods, Consultative Group on Transportation Research, OECD. Thompson, R., 2006, Data collection for modelling urban freight transport, presentation at BESTUFS Annual Conference, May 2006 Malta.. TTR, 2001, West Midlands Transportation Surveys 2001: Freight Transport Survey Scoping Study, TTR. TTR, 2004, VIVALDI Freight Consolidation Centre - Survey Responses, Report, TTR. TTR, 2007, Out-of-hours Deliveries in Central London, TTR TTR, 2007, Site survey analysis: Deptford High Street - London Borough of Lewisham, TTR. TTR, 2007, Site survey analysis: London Road - London Borough of Merton, TTR. TTR, 2007, Site survey analysis: High Street - London Borough of Croydon, TTR. TTR, 2007, Site survey analysis: Market Square - London Borough of Kingston, TTR. TTR, 2007, Site survey analysis: Northcote Road - London Borough of Wandsworth, TTR.
42
TTR, 2007, South London Freight Consolidation Centre Feasibility Study, Final Report, TTR. TTR, 2007, South London Freight Consolidation Centre Feasibility Study, Final Report, TTR. Tyler, A., 2001, Sustainable Goods Distribution: The Possibilities for Clear Zones, MSc dissertation, University of Westminster. Urquhart, G.B., 1976, Transhipment of Goods to Shops, Unpublished PhD Thesis, University of Leeds. US Department Of Transportation, 1995, Characteristics of urban freight systems, Report DOT-T-96–22, Office of Environment and Planning, Federal Highway Administration, Washington DC. Victoria, I. and Walton, C.M., 2004, Freight Data Needs at the Metropolitan Level and the Suitability of Intelligent Transportation Systems in Supplying MPOs with the Needed Freight Data, Center for Transportation Research, The University of Texas at Austin. Vleugel, J., 2006, Report on urban freight data collection in the Netherlands, BESTUFS WP 3.1 National Report, BESTUFS. Vleugel, J., 2004, Modelling goods city distribution in the Netherlands, European Transport \ Trasporti Europei no.28, pp. 20-33 Wermuth, M., Neef, C. and Steinmeyer, I., 2004, Goods and Business Traffic in Germany, paper presented at the 7th International Conference on Survey Methods in Transport, Playa Herradura, Costa Rica. Westminster City Council, 2008, Church Street Freight Study, Brief 7583, Feasibility Report Wilbur Smith and Associates and P-E Consulting, 1977, Hull freight study: collection of data and construction of computer model, TRRL Supplementary report 315, Transport and Road Research Laboratory. Woudsma, C., 2001, Understanding the Movement of Goods, Not People: Issues, Evidence and Potential, Urban Studies, Vol.38, No.13, pp.2439-2455 WSP and Katalysis, 2002, Review of Freight Modelling B4, DfT. Wytconsult, 1975, Retail Deliveries in Urban Areas and the Relevance of Transhipment, Doc. 602, Wakefield.
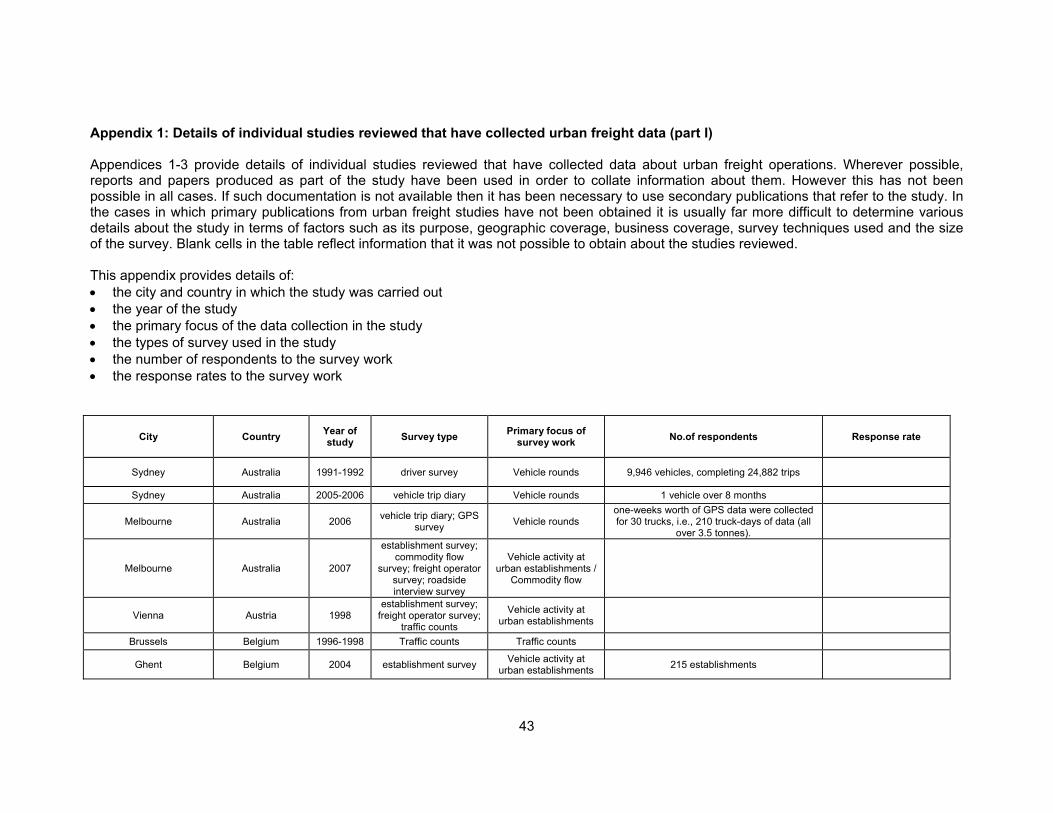
43
Appendix 1: Details of individual studies reviewed that have collected urban freight data (part I) Appendices 1-3 provide details of individual studies reviewed that have collected data about urban freight operations. Wherever possible, reports and papers produced as part of the study have been used in order to collate information about them. However this has not been possible in all cases. If such documentation is not available then it has been necessary to use secondary publications that refer to the study. In the cases in which primary publications from urban freight studies have not been obtained it is usually far more difficult to determine various details about the study in terms of factors such as its purpose, geographic coverage, business coverage, survey techniques used and the size of the survey. Blank cells in the table reflect information that it was not possible to obtain about the studies reviewed. This appendix provides details of: • the city and country in which the study was carried out • the year of the study • the primary focus of the data collection in the study • the types of survey used in the study • the number of respondents to the survey work • the response rates to the survey work
City Country Year of study Survey type Primary focus of
survey work No.of respondents Response rate
Sydney Australia 1991-1992 driver survey Vehicle rounds 9,946 vehicles, completing 24,882 trips
Sydney Australia 2005-2006 vehicle trip diary Vehicle rounds 1 vehicle over 8 months
Melbourne Australia 2006 vehicle trip diary; GPS survey Vehicle rounds
one-weeks worth of GPS data were collected for 30 trucks, i.e., 210 truck-days of data (all
over 3.5 tonnes).
Melbourne Australia 2007
establishment survey; commodity flow
survey; freight operator survey; roadside interview survey
Vehicle activity at urban establishments /
Commodity flow
Vienna Austria 1998 establishment survey;
freight operator survey; traffic counts
Vehicle activity at urban establishments
Brussels Belgium 1996-1998 Traffic counts Traffic counts
Ghent Belgium 2004 establishment survey Vehicle activity at urban establishments 215 establishments
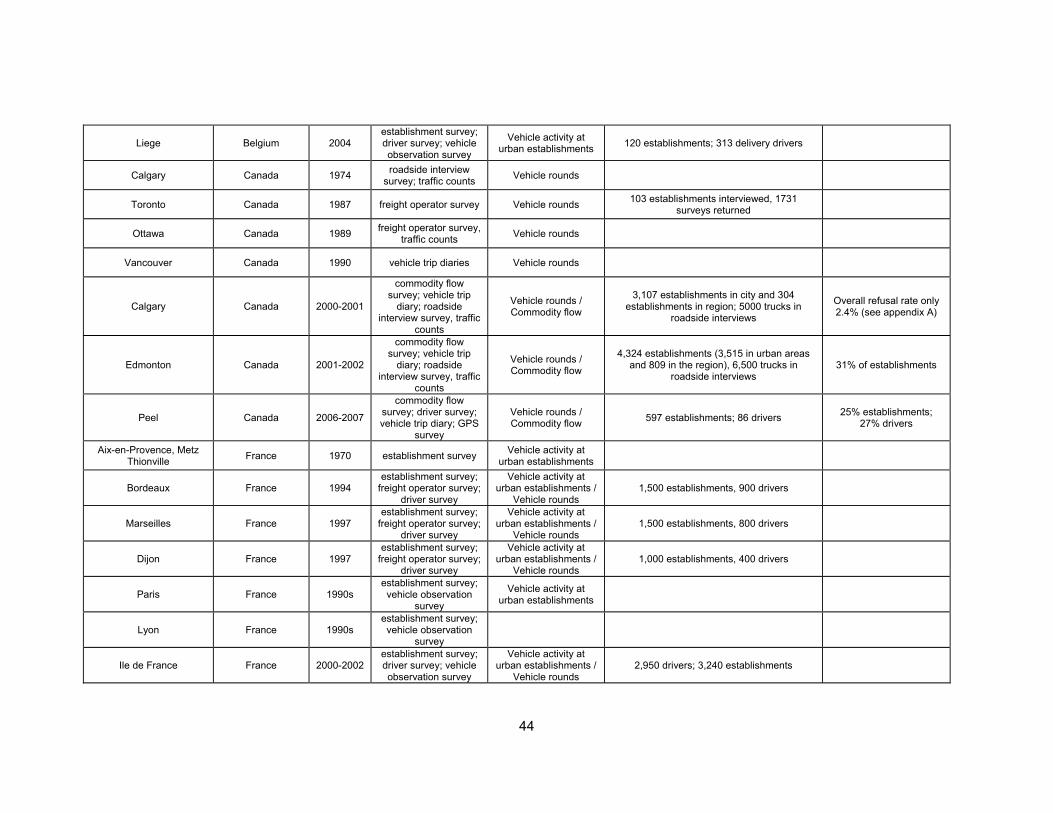
44
Liege Belgium 2004 establishment survey; driver survey; vehicle observation survey
Vehicle activity at urban establishments 120 establishments; 313 delivery drivers
Calgary Canada 1974 roadside interview survey; traffic counts Vehicle rounds
Toronto Canada 1987 freight operator survey Vehicle rounds 103 establishments interviewed, 1731 surveys returned
Ottawa Canada 1989 freight operator survey, traffic counts Vehicle rounds
Vancouver Canada 1990 vehicle trip diaries Vehicle rounds
Calgary Canada 2000-2001
commodity flow survey; vehicle trip
diary; roadside interview survey, traffic
counts
Vehicle rounds / Commodity flow
3,107 establishments in city and 304 establishments in region; 5000 trucks in
roadside interviews
Overall refusal rate only 2.4% (see appendix A)
Edmonton Canada 2001-2002
commodity flow survey; vehicle trip
diary; roadside interview survey, traffic
counts
Vehicle rounds / Commodity flow
4,324 establishments (3,515 in urban areas and 809 in the region), 6,500 trucks in
roadside interviews 31% of establishments
Peel Canada 2006-2007
commodity flow survey; driver survey; vehicle trip diary; GPS
survey
Vehicle rounds / Commodity flow 597 establishments; 86 drivers 25% establishments;
27% drivers
Aix-en-Provence, Metz Thionville France 1970 establishment survey Vehicle activity at
urban establishments
Bordeaux France 1994 establishment survey;
freight operator survey; driver survey
Vehicle activity at urban establishments /
Vehicle rounds 1,500 establishments, 900 drivers
Marseilles France 1997 establishment survey;
freight operator survey; driver survey
Vehicle activity at urban establishments /
Vehicle rounds 1,500 establishments, 800 drivers
Dijon France 1997 establishment survey;
freight operator survey; driver survey
Vehicle activity at urban establishments /
Vehicle rounds 1,000 establishments, 400 drivers
Paris France 1990s establishment survey; vehicle observation
survey
Vehicle activity at urban establishments
Lyon France 1990s establishment survey; vehicle observation
survey
Ile de France France 2000-2002 establishment survey; driver survey; vehicle observation survey
Vehicle activity at urban establishments /
Vehicle rounds 2,950 drivers; 3,240 establishments
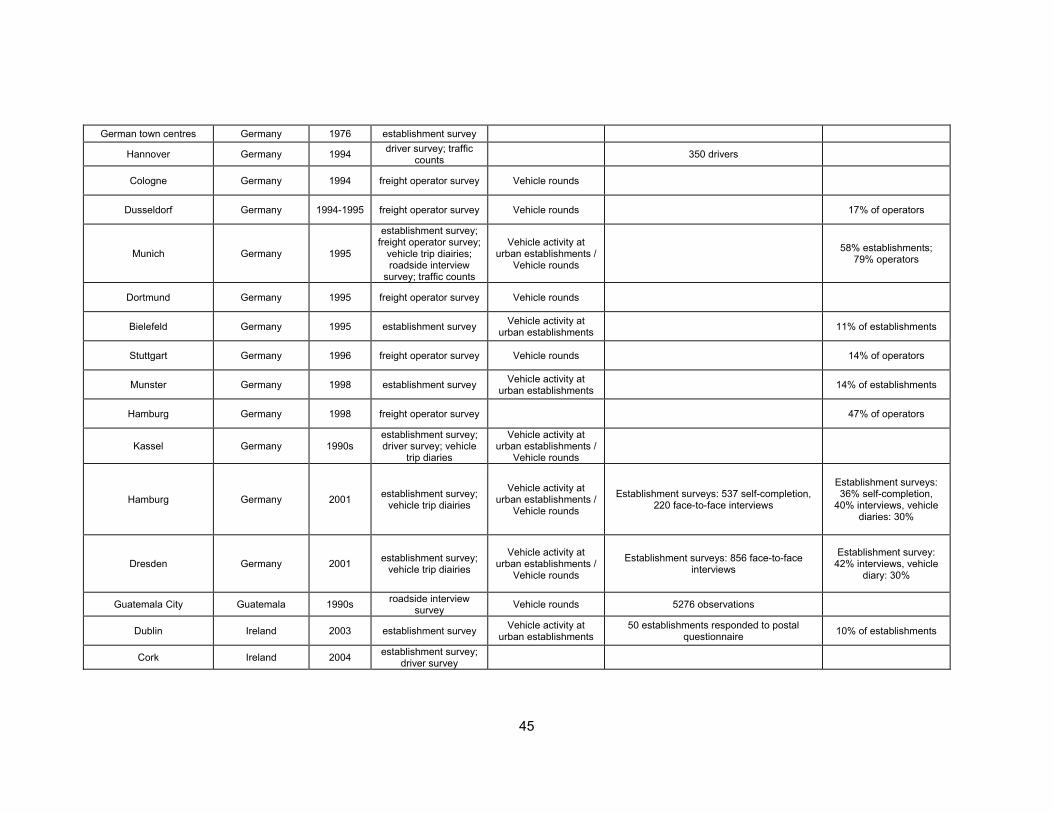
45
German town centres Germany 1976 establishment survey
Hannover Germany 1994 driver survey; traffic counts 350 drivers
Cologne Germany 1994 freight operator survey Vehicle rounds
Dusseldorf Germany 1994-1995 freight operator survey Vehicle rounds 17% of operators
Munich Germany 1995
establishment survey; freight operator survey;
vehicle trip diairies; roadside interview
survey; traffic counts
Vehicle activity at urban establishments /
Vehicle rounds 58% establishments;
79% operators
Dortmund Germany 1995 freight operator survey Vehicle rounds
Bielefeld Germany 1995 establishment survey Vehicle activity at urban establishments 11% of establishments
Stuttgart Germany 1996 freight operator survey Vehicle rounds 14% of operators
Munster Germany 1998 establishment survey Vehicle activity at urban establishments 14% of establishments
Hamburg Germany 1998 freight operator survey 47% of operators
Kassel Germany 1990s establishment survey; driver survey; vehicle
trip diaries
Vehicle activity at urban establishments /
Vehicle rounds
Hamburg Germany 2001 establishment survey; vehicle trip diairies
Vehicle activity at urban establishments /
Vehicle rounds
Establishment surveys: 537 self-completion, 220 face-to-face interviews
Establishment surveys: 36% self-completion,
40% interviews, vehicle diaries: 30%
Dresden Germany 2001 establishment survey; vehicle trip diairies
Vehicle activity at urban establishments /
Vehicle rounds
Establishment surveys: 856 face-to-face interviews
Establishment survey: 42% interviews, vehicle
diary: 30%
Guatemala City Guatemala 1990s roadside interview survey Vehicle rounds 5276 observations
Dublin Ireland 2003 establishment survey Vehicle activity at urban establishments
50 establishments responded to postal questionnaire 10% of establishments
Cork Ireland 2004 establishment survey; driver survey
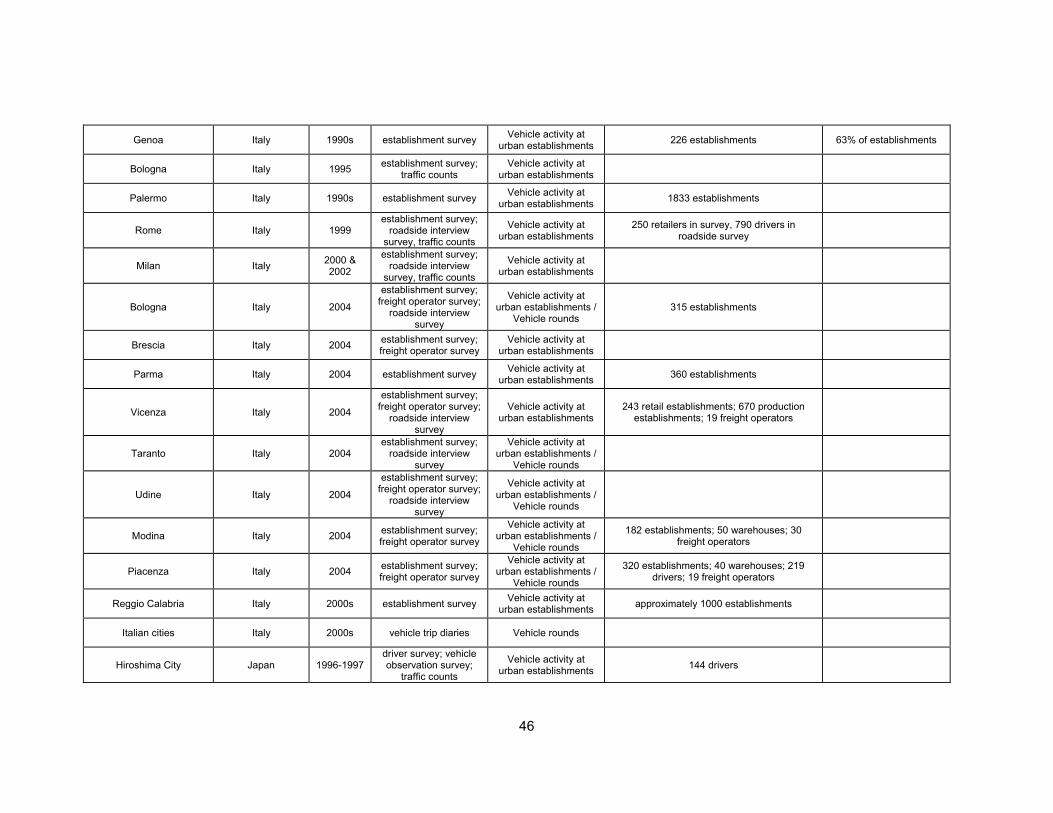
46
Genoa Italy 1990s establishment survey Vehicle activity at urban establishments 226 establishments 63% of establishments
Bologna Italy 1995 establishment survey; traffic counts
Vehicle activity at urban establishments
Palermo Italy 1990s establishment survey Vehicle activity at urban establishments 1833 establishments
Rome Italy 1999 establishment survey;
roadside interview survey, traffic counts
Vehicle activity at urban establishments
250 retailers in survey, 790 drivers in roadside survey
Milan Italy 2000 & 2002
establishment survey; roadside interview
survey, traffic counts
Vehicle activity at urban establishments
Bologna Italy 2004
establishment survey; freight operator survey;
roadside interview survey
Vehicle activity at urban establishments /
Vehicle rounds 315 establishments
Brescia Italy 2004 establishment survey; freight operator survey
Vehicle activity at urban establishments
Parma Italy 2004 establishment survey Vehicle activity at urban establishments 360 establishments
Vicenza Italy 2004
establishment survey; freight operator survey;
roadside interview survey
Vehicle activity at urban establishments
243 retail establishments; 670 production establishments; 19 freight operators
Taranto Italy 2004 establishment survey;
roadside interview survey
Vehicle activity at urban establishments /
Vehicle rounds
Udine Italy 2004
establishment survey; freight operator survey;
roadside interview survey
Vehicle activity at urban establishments /
Vehicle rounds
Modina Italy 2004 establishment survey; freight operator survey
Vehicle activity at urban establishments /
Vehicle rounds
182 establishments; 50 warehouses; 30 freight operators
Piacenza Italy 2004 establishment survey; freight operator survey
Vehicle activity at urban establishments /
Vehicle rounds
320 establishments; 40 warehouses; 219 drivers; 19 freight operators
Reggio Calabria Italy 2000s establishment survey Vehicle activity at urban establishments approximately 1000 establishments
Italian cities Italy 2000s vehicle trip diaries Vehicle rounds
Hiroshima City Japan 1996-1997 driver survey; vehicle observation survey;
traffic counts
Vehicle activity at urban establishments 144 drivers
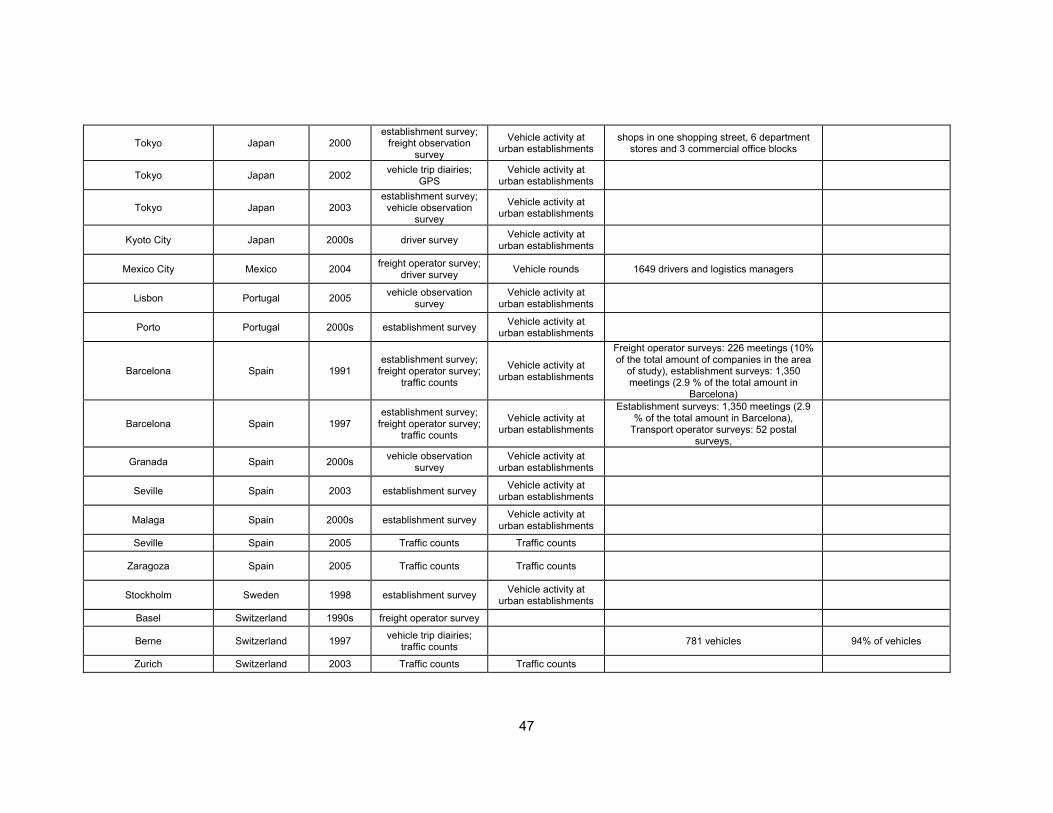
47
Tokyo Japan 2000 establishment survey;
freight observation survey
Vehicle activity at urban establishments
shops in one shopping street, 6 department stores and 3 commercial office blocks
Tokyo Japan 2002 vehicle trip diairies; GPS
Vehicle activity at urban establishments
Tokyo Japan 2003 establishment survey; vehicle observation
survey
Vehicle activity at urban establishments
Kyoto City Japan 2000s driver survey Vehicle activity at urban establishments
Mexico City Mexico 2004 freight operator survey; driver survey Vehicle rounds 1649 drivers and logistics managers
Lisbon Portugal 2005 vehicle observation survey
Vehicle activity at urban establishments
Porto Portugal 2000s establishment survey Vehicle activity at urban establishments
Barcelona Spain 1991 establishment survey;
freight operator survey; traffic counts
Vehicle activity at urban establishments
Freight operator surveys: 226 meetings (10% of the total amount of companies in the area
of study), establishment surveys: 1,350 meetings (2.9 % of the total amount in
Barcelona)
Barcelona Spain 1997 establishment survey;
freight operator survey; traffic counts
Vehicle activity at urban establishments
Establishment surveys: 1,350 meetings (2.9 % of the total amount in Barcelona),
Transport operator surveys: 52 postal surveys,
Granada Spain 2000s vehicle observation survey
Vehicle activity at urban establishments
Seville Spain 2003 establishment survey Vehicle activity at urban establishments
Malaga Spain 2000s establishment survey Vehicle activity at urban establishments
Seville Spain 2005 Traffic counts Traffic counts
Zaragoza Spain 2005 Traffic counts Traffic counts
Stockholm Sweden 1998 establishment survey Vehicle activity at urban establishments
Basel Switzerland 1990s freight operator survey
Berne Switzerland 1997 vehicle trip diairies; traffic counts 781 vehicles 94% of vehicles
Zurich Switzerland 2003 Traffic counts Traffic counts
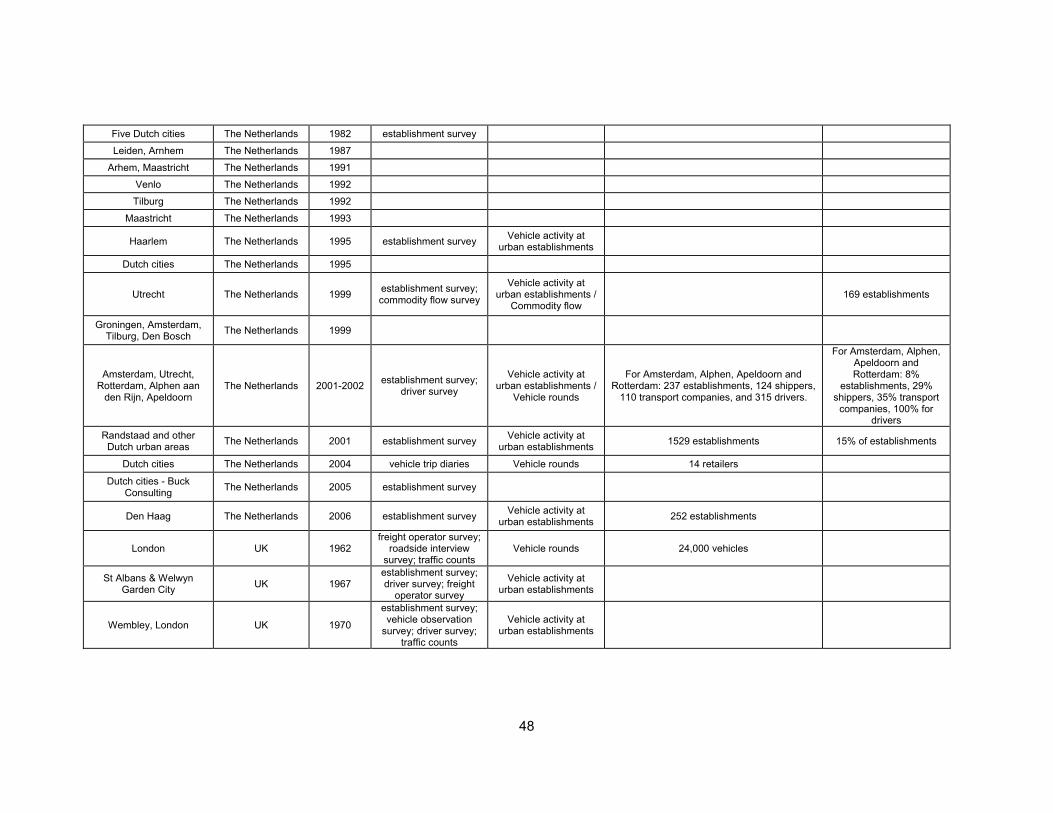
48
Five Dutch cities The Netherlands 1982 establishment survey
Leiden, Arnhem The Netherlands 1987
Arhem, Maastricht The Netherlands 1991
Venlo The Netherlands 1992
Tilburg The Netherlands 1992
Maastricht The Netherlands 1993
Haarlem The Netherlands 1995 establishment survey Vehicle activity at urban establishments
Dutch cities The Netherlands 1995
Utrecht The Netherlands 1999 establishment survey; commodity flow survey
Vehicle activity at urban establishments /
Commodity flow 169 establishments
Groningen, Amsterdam, Tilburg, Den Bosch The Netherlands 1999
Amsterdam, Utrecht, Rotterdam, Alphen aan
den Rijn, Apeldoorn The Netherlands 2001-2002 establishment survey;
driver survey
Vehicle activity at urban establishments /
Vehicle rounds
For Amsterdam, Alphen, Apeldoorn and Rotterdam: 237 establishments, 124 shippers,
110 transport companies, and 315 drivers.
For Amsterdam, Alphen, Apeldoorn and Rotterdam: 8%
establishments, 29% shippers, 35% transport
companies, 100% for drivers
Randstaad and other Dutch urban areas The Netherlands 2001 establishment survey Vehicle activity at
urban establishments 1529 establishments 15% of establishments
Dutch cities The Netherlands 2004 vehicle trip diaries Vehicle rounds 14 retailers
Dutch cities - Buck Consulting The Netherlands 2005 establishment survey
Den Haag The Netherlands 2006 establishment survey Vehicle activity at urban establishments 252 establishments
London UK 1962 freight operator survey;
roadside interview survey; traffic counts
Vehicle rounds 24,000 vehicles
St Albans & Welwyn Garden City UK 1967
establishment survey; driver survey; freight
operator survey
Vehicle activity at urban establishments
Wembley, London UK 1970
establishment survey; vehicle observation
survey; driver survey; traffic counts
Vehicle activity at urban establishments
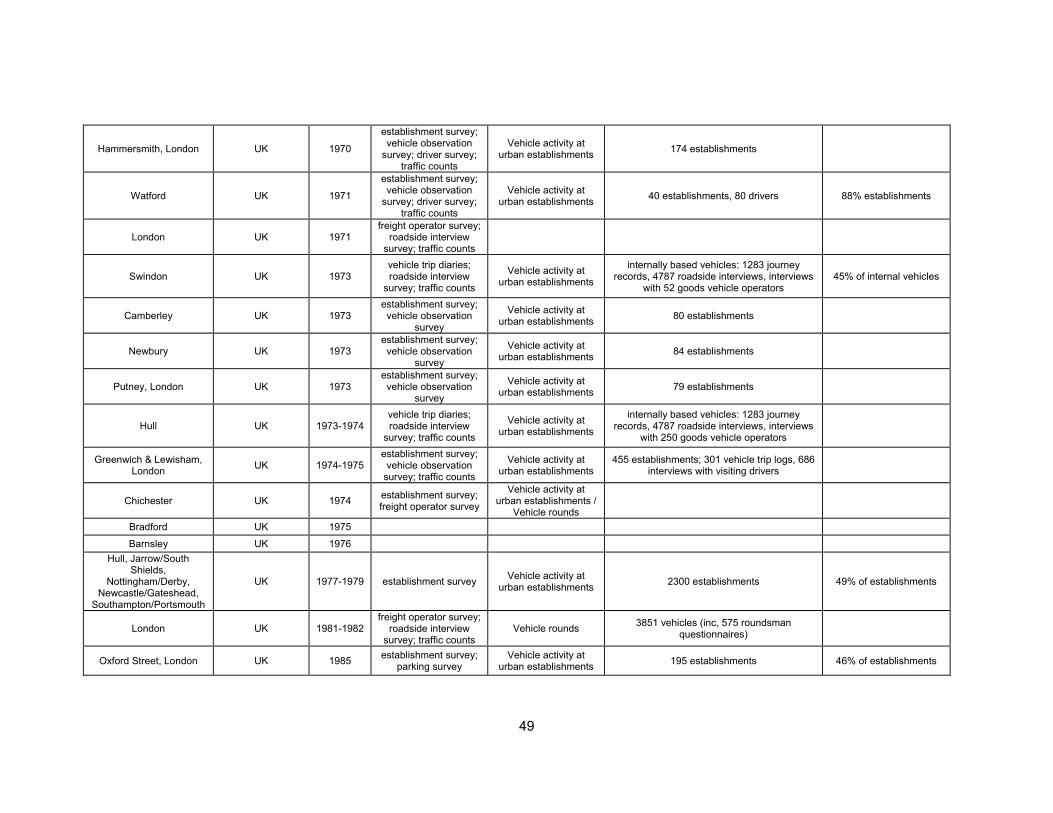
49
Hammersmith, London UK 1970
establishment survey; vehicle observation
survey; driver survey; traffic counts
Vehicle activity at urban establishments 174 establishments
Watford UK 1971
establishment survey; vehicle observation
survey; driver survey; traffic counts
Vehicle activity at urban establishments 40 establishments, 80 drivers 88% establishments
London UK 1971 freight operator survey;
roadside interview survey; traffic counts
Swindon UK 1973 vehicle trip diaries; roadside interview
survey; traffic counts
Vehicle activity at urban establishments
internally based vehicles: 1283 journey records, 4787 roadside interviews, interviews
with 52 goods vehicle operators 45% of internal vehicles
Camberley UK 1973 establishment survey; vehicle observation
survey
Vehicle activity at urban establishments 80 establishments
Newbury UK 1973 establishment survey; vehicle observation
survey
Vehicle activity at urban establishments 84 establishments
Putney, London UK 1973 establishment survey; vehicle observation
survey
Vehicle activity at urban establishments 79 establishments
Hull UK 1973-1974 vehicle trip diaries; roadside interview
survey; traffic counts
Vehicle activity at urban establishments
internally based vehicles: 1283 journey records, 4787 roadside interviews, interviews
with 250 goods vehicle operators
Greenwich & Lewisham, London UK 1974-1975
establishment survey; vehicle observation
survey; traffic counts
Vehicle activity at urban establishments
455 establishments; 301 vehicle trip logs, 686 interviews with visiting drivers
Chichester UK 1974 establishment survey; freight operator survey
Vehicle activity at urban establishments /
Vehicle rounds
Bradford UK 1975
Barnsley UK 1976 Hull, Jarrow/South
Shields, Nottingham/Derby,
Newcastle/Gateshead, Southampton/Portsmouth
UK 1977-1979 establishment survey Vehicle activity at urban establishments 2300 establishments 49% of establishments
London UK 1981-1982 freight operator survey;
roadside interview survey; traffic counts
Vehicle rounds 3851 vehicles (inc, 575 roundsman questionnaires)
Oxford Street, London UK 1985 establishment survey; parking survey
Vehicle activity at urban establishments 195 establishments 46% of establishments
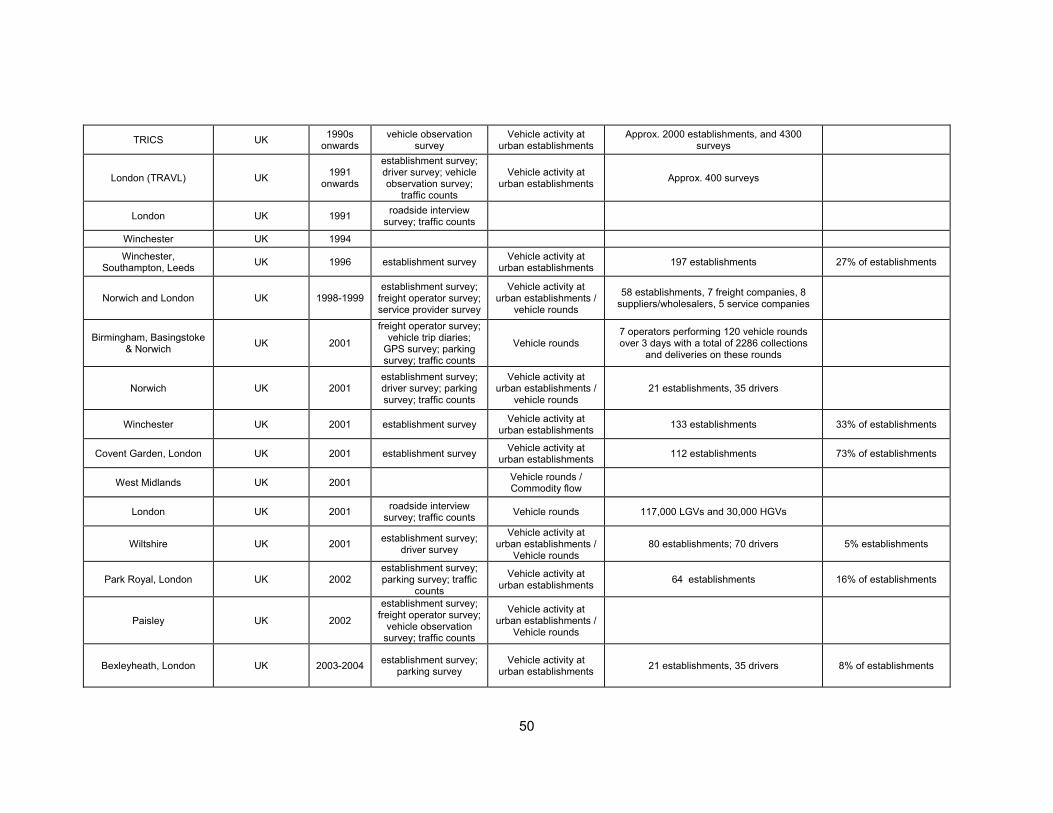
50
TRICS UK 1990s onwards
vehicle observation survey
Vehicle activity at urban establishments
Approx. 2000 establishments, and 4300 surveys
London (TRAVL) UK 1991 onwards
establishment survey; driver survey; vehicle observation survey;
traffic counts
Vehicle activity at urban establishments Approx. 400 surveys
London UK 1991 roadside interview survey; traffic counts
Winchester UK 1994
Winchester, Southampton, Leeds UK 1996 establishment survey Vehicle activity at
urban establishments 197 establishments 27% of establishments
Norwich and London UK 1998-1999 establishment survey;
freight operator survey; service provider survey
Vehicle activity at urban establishments /
vehicle rounds
58 establishments, 7 freight companies, 8 suppliers/wholesalers, 5 service companies
Birmingham, Basingstoke & Norwich UK 2001
freight operator survey; vehicle trip diaries;
GPS survey; parking survey; traffic counts
Vehicle rounds 7 operators performing 120 vehicle rounds over 3 days with a total of 2286 collections
and deliveries on these rounds
Norwich UK 2001 establishment survey; driver survey; parking survey; traffic counts
Vehicle activity at urban establishments /
vehicle rounds 21 establishments, 35 drivers
Winchester UK 2001 establishment survey Vehicle activity at urban establishments 133 establishments 33% of establishments
Covent Garden, London UK 2001 establishment survey Vehicle activity at urban establishments 112 establishments 73% of establishments
West Midlands UK 2001 Vehicle rounds / Commodity flow
London UK 2001 roadside interview survey; traffic counts Vehicle rounds 117,000 LGVs and 30,000 HGVs
Wiltshire UK 2001 establishment survey; driver survey
Vehicle activity at urban establishments /
Vehicle rounds 80 establishments; 70 drivers 5% establishments
Park Royal, London UK 2002 establishment survey; parking survey; traffic
counts
Vehicle activity at urban establishments 64 establishments 16% of establishments
Paisley UK 2002
establishment survey; freight operator survey;
vehicle observation survey; traffic counts
Vehicle activity at urban establishments /
Vehicle rounds
Bexleyheath, London UK 2003-2004 establishment survey; parking survey
Vehicle activity at urban establishments 21 establishments, 35 drivers 8% of establishments
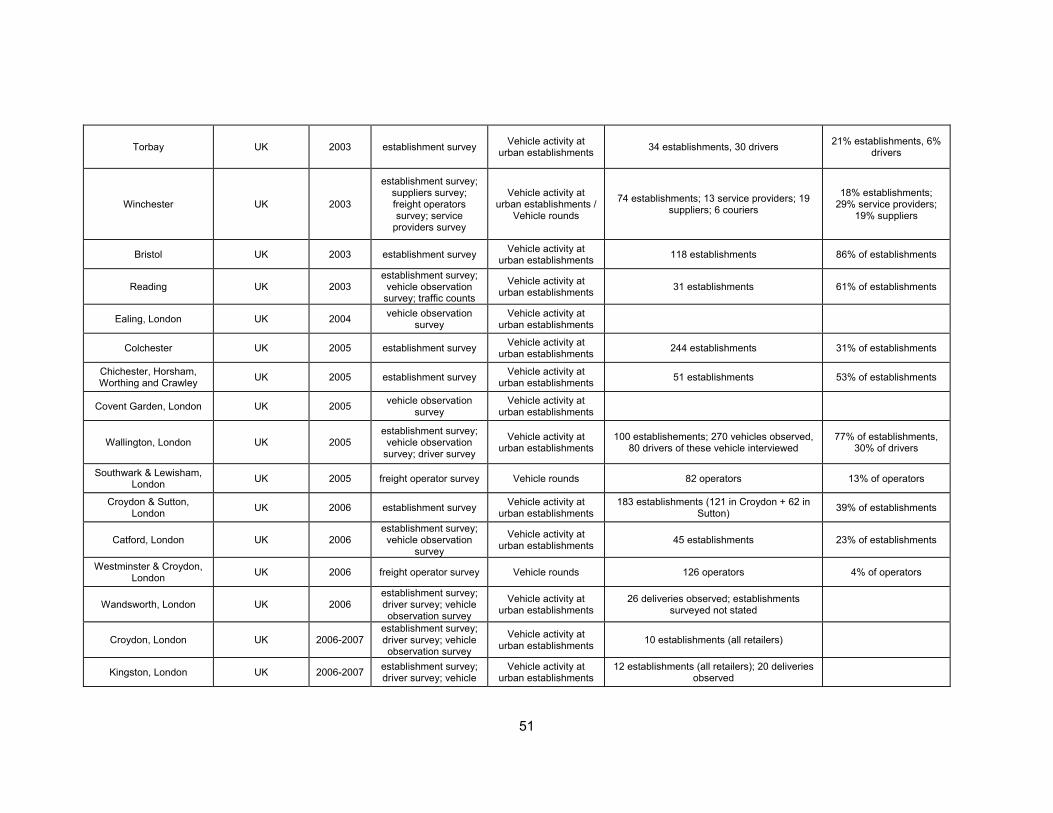
51
Torbay UK 2003 establishment survey Vehicle activity at urban establishments 34 establishments, 30 drivers 21% establishments, 6%
drivers
Winchester UK 2003
establishment survey; suppliers survey; freight operators survey; service
providers survey
Vehicle activity at urban establishments /
Vehicle rounds
74 establishments; 13 service providers; 19 suppliers; 6 couriers
18% establishments; 29% service providers;
19% suppliers
Bristol UK 2003 establishment survey Vehicle activity at urban establishments 118 establishments 86% of establishments
Reading UK 2003 establishment survey; vehicle observation
survey; traffic counts
Vehicle activity at urban establishments 31 establishments 61% of establishments
Ealing, London UK 2004 vehicle observation survey
Vehicle activity at urban establishments
Colchester UK 2005 establishment survey Vehicle activity at urban establishments 244 establishments 31% of establishments
Chichester, Horsham, Worthing and Crawley UK 2005 establishment survey Vehicle activity at
urban establishments 51 establishments 53% of establishments
Covent Garden, London UK 2005 vehicle observation survey
Vehicle activity at urban establishments
Wallington, London UK 2005 establishment survey; vehicle observation
survey; driver survey
Vehicle activity at urban establishments
100 establishements; 270 vehicles observed, 80 drivers of these vehicle interviewed
77% of establishments, 30% of drivers
Southwark & Lewisham, London UK 2005 freight operator survey Vehicle rounds 82 operators 13% of operators
Croydon & Sutton, London UK 2006 establishment survey Vehicle activity at
urban establishments 183 establishments (121 in Croydon + 62 in
Sutton) 39% of establishments
Catford, London UK 2006 establishment survey; vehicle observation
survey
Vehicle activity at urban establishments 45 establishments 23% of establishments
Westminster & Croydon, London UK 2006 freight operator survey Vehicle rounds 126 operators 4% of operators
Wandsworth, London UK 2006 establishment survey; driver survey; vehicle observation survey
Vehicle activity at urban establishments
26 deliveries observed; establishments surveyed not stated
Croydon, London UK 2006-2007 establishment survey; driver survey; vehicle observation survey
Vehicle activity at urban establishments 10 establishments (all retailers)
Kingston, London UK 2006-2007 establishment survey; driver survey; vehicle
Vehicle activity at urban establishments
12 establishments (all retailers); 20 deliveries observed
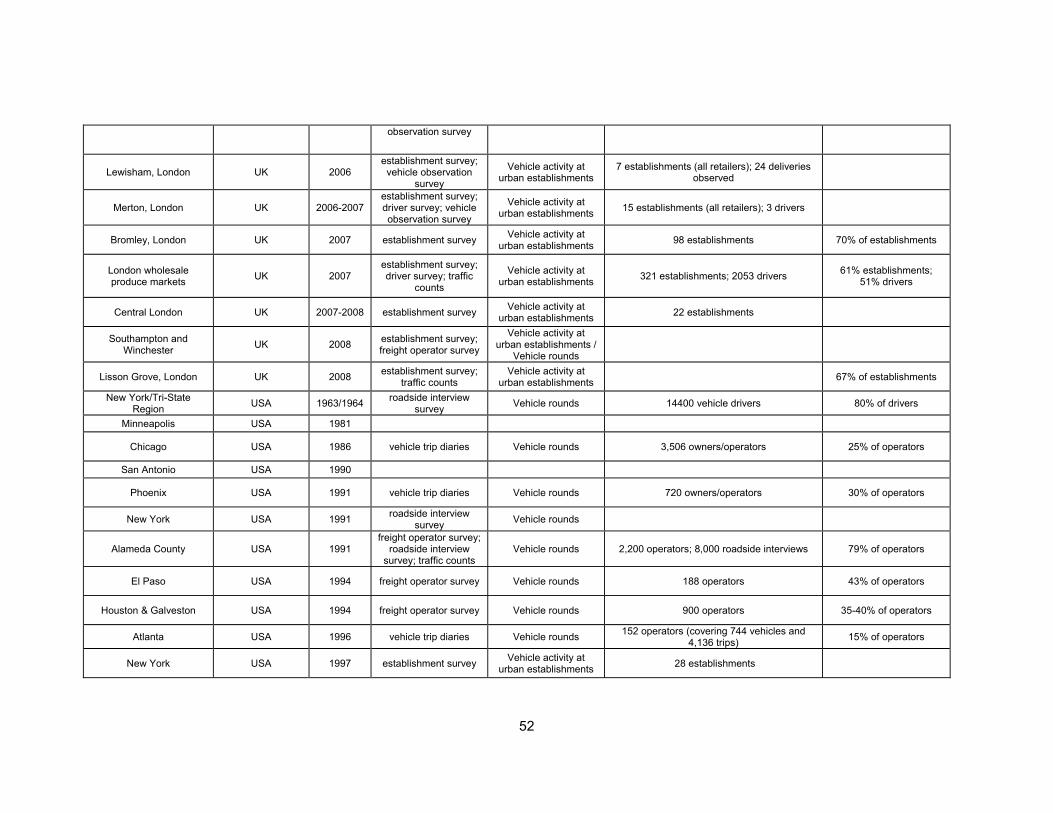
52
observation survey
Lewisham, London UK 2006 establishment survey; vehicle observation
survey
Vehicle activity at urban establishments
7 establishments (all retailers); 24 deliveries observed
Merton, London UK 2006-2007 establishment survey; driver survey; vehicle observation survey
Vehicle activity at urban establishments 15 establishments (all retailers); 3 drivers
Bromley, London UK 2007 establishment survey Vehicle activity at urban establishments 98 establishments 70% of establishments
London wholesale produce markets UK 2007
establishment survey; driver survey; traffic
counts
Vehicle activity at urban establishments 321 establishments; 2053 drivers 61% establishments;
51% drivers
Central London UK 2007-2008 establishment survey Vehicle activity at urban establishments 22 establishments
Southampton and Winchester UK 2008 establishment survey;
freight operator survey
Vehicle activity at urban establishments /
Vehicle rounds
Lisson Grove, London UK 2008 establishment survey; traffic counts
Vehicle activity at urban establishments 67% of establishments
New York/Tri-State Region USA 1963/1964 roadside interview
survey Vehicle rounds 14400 vehicle drivers 80% of drivers
Minneapolis USA 1981
Chicago USA 1986 vehicle trip diaries Vehicle rounds 3,506 owners/operators 25% of operators
San Antonio USA 1990
Phoenix USA 1991 vehicle trip diaries Vehicle rounds 720 owners/operators 30% of operators
New York USA 1991 roadside interview survey Vehicle rounds
Alameda County USA 1991 freight operator survey;
roadside interview survey; traffic counts
Vehicle rounds 2,200 operators; 8,000 roadside interviews 79% of operators
El Paso USA 1994 freight operator survey Vehicle rounds 188 operators 43% of operators
Houston & Galveston USA 1994 freight operator survey Vehicle rounds 900 operators 35-40% of operators
Atlanta USA 1996 vehicle trip diaries Vehicle rounds 152 operators (covering 744 vehicles and 4,136 trips) 15% of operators
New York USA 1997 establishment survey Vehicle activity at urban establishments 28 establishments
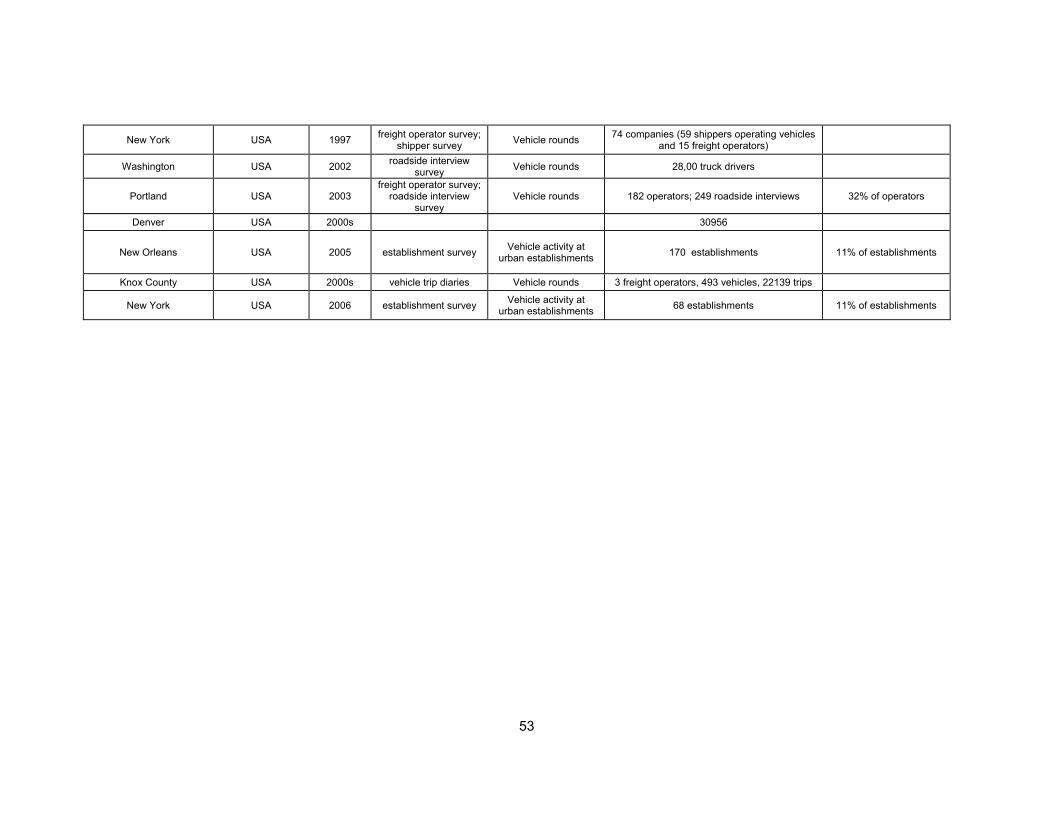
53
New York USA 1997 freight operator survey; shipper survey Vehicle rounds 74 companies (59 shippers operating vehicles
and 15 freight operators)
Washington USA 2002 roadside interview survey Vehicle rounds 28,00 truck drivers
Portland USA 2003 freight operator survey;
roadside interview survey
Vehicle rounds 182 operators; 249 roadside interviews 32% of operators
Denver USA 2000s 30956
New Orleans USA 2005 establishment survey Vehicle activity at urban establishments 170 establishments 11% of establishments
Knox County USA 2000s vehicle trip diaries Vehicle rounds 3 freight operators, 493 vehicles, 22139 trips
New York USA 2006 establishment survey Vehicle activity at urban establishments 68 establishments 11% of establishments
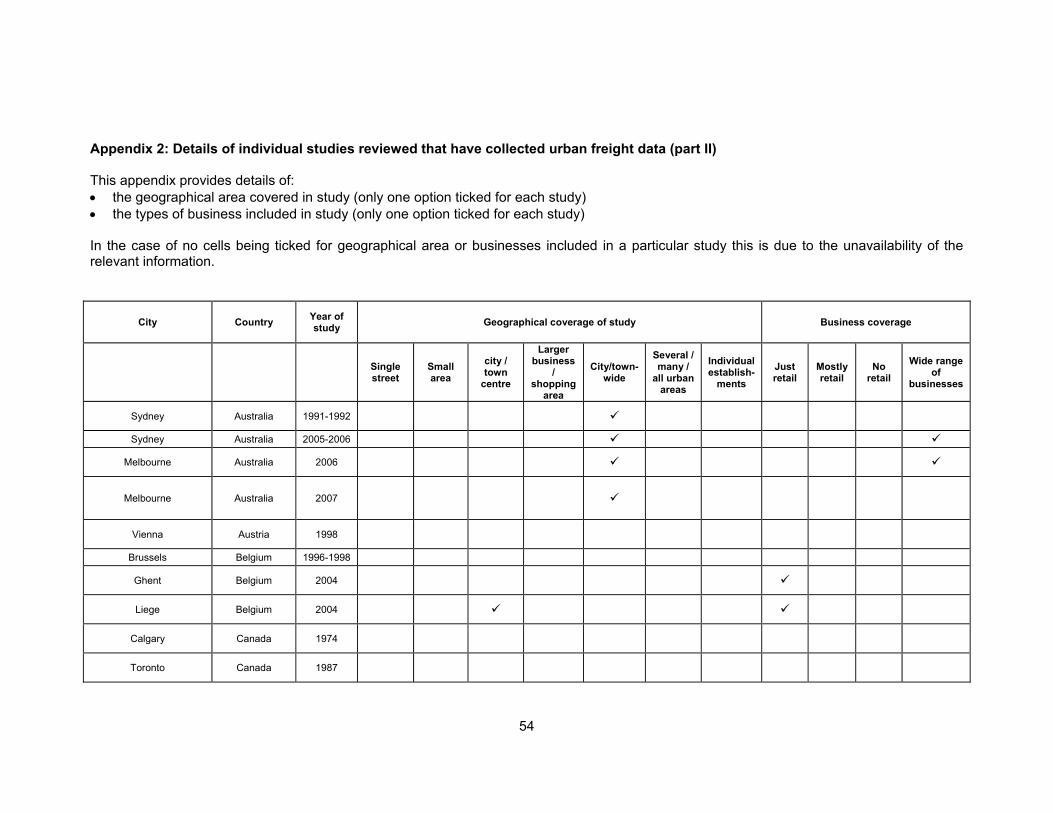
54
Appendix 2: Details of individual studies reviewed that have collected urban freight data (part II) This appendix provides details of: • the geographical area covered in study (only one option ticked for each study) • the types of business included in study (only one option ticked for each study) In the case of no cells being ticked for geographical area or businesses included in a particular study this is due to the unavailability of the relevant information.
City Country Year of study Geographical coverage of study Business coverage
Single street
Small area
city / town
centre
Larger business
/ shopping
area
City/town-wide
Several / many /
all urban areas
Individual establish-
ments
Just retail
Mostly retail
No retail
Wide range of
businesses
Sydney Australia 1991-1992
Sydney Australia 2005-2006
Melbourne Australia 2006
Melbourne Australia 2007
Vienna Austria 1998
Brussels Belgium 1996-1998
Ghent Belgium 2004
Liege Belgium 2004
Calgary Canada 1974
Toronto Canada 1987
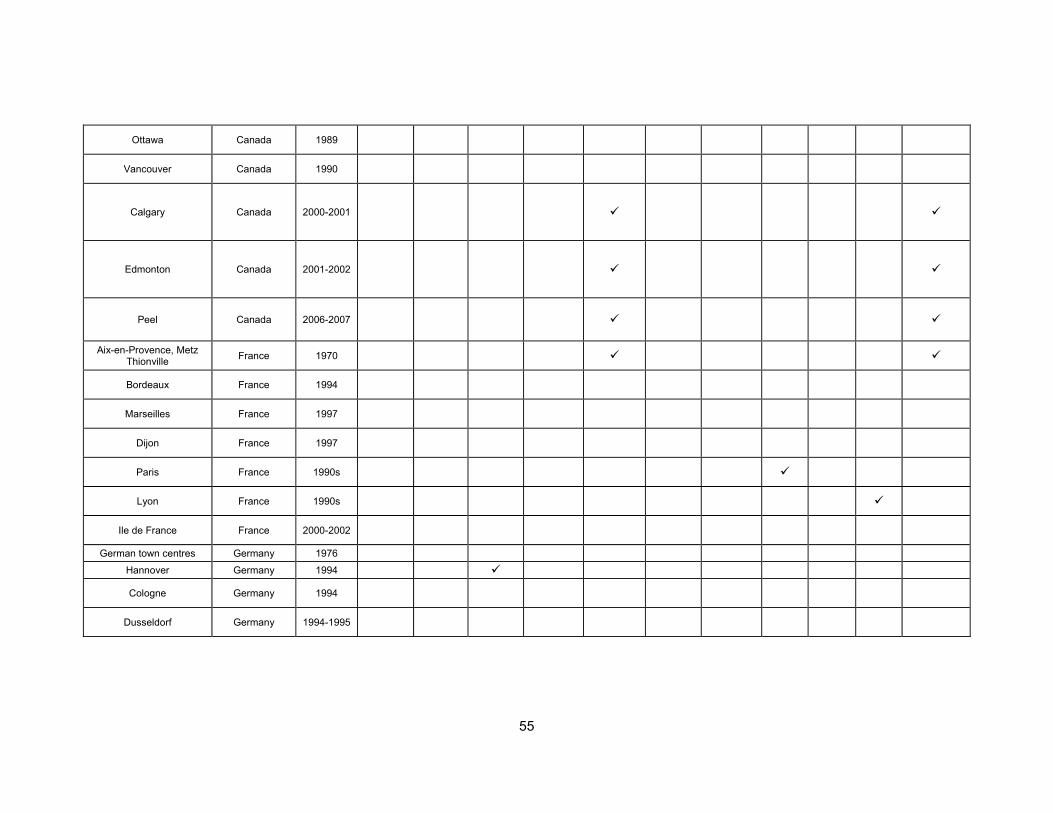
55
Ottawa Canada 1989
Vancouver Canada 1990
Calgary Canada 2000-2001
Edmonton Canada 2001-2002
Peel Canada 2006-2007
Aix-en-Provence, Metz Thionville France 1970
Bordeaux France 1994
Marseilles France 1997
Dijon France 1997
Paris France 1990s
Lyon France 1990s
Ile de France France 2000-2002
German town centres Germany 1976 Hannover Germany 1994
Cologne Germany 1994
Dusseldorf Germany 1994-1995
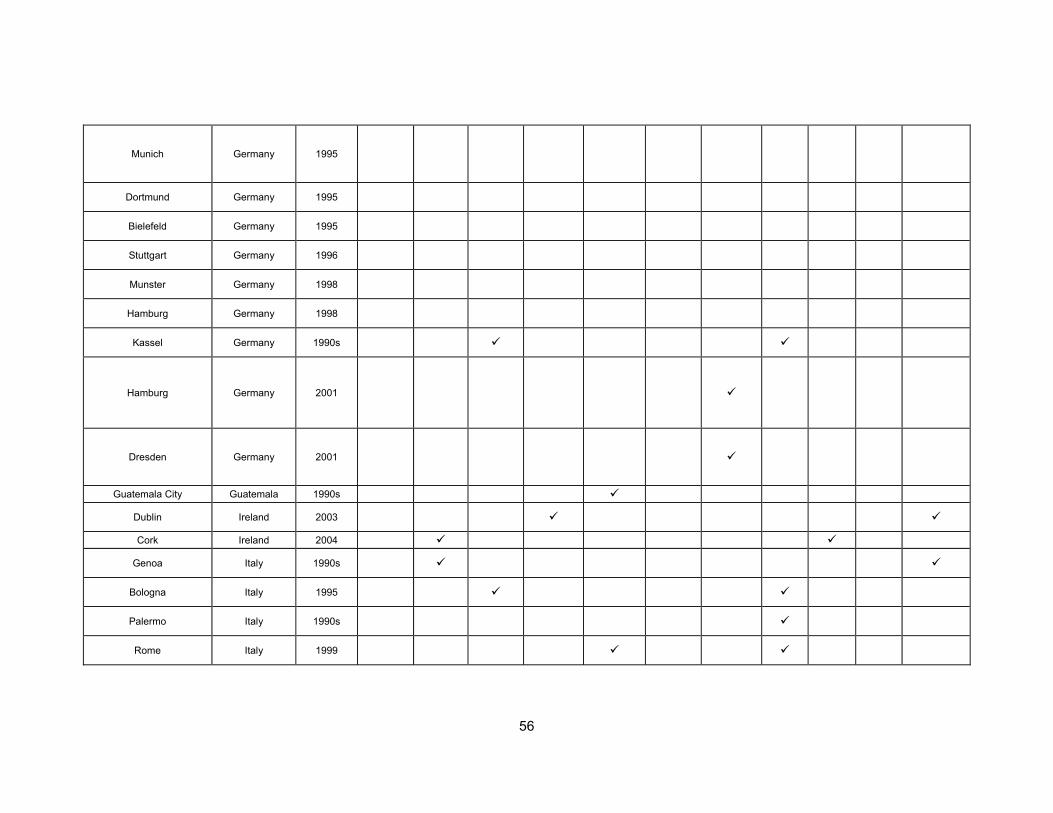
56
Munich Germany 1995
Dortmund Germany 1995
Bielefeld Germany 1995
Stuttgart Germany 1996
Munster Germany 1998
Hamburg Germany 1998
Kassel Germany 1990s
Hamburg Germany 2001
Dresden Germany 2001
Guatemala City Guatemala 1990s
Dublin Ireland 2003
Cork Ireland 2004
Genoa Italy 1990s
Bologna Italy 1995
Palermo Italy 1990s
Rome Italy 1999
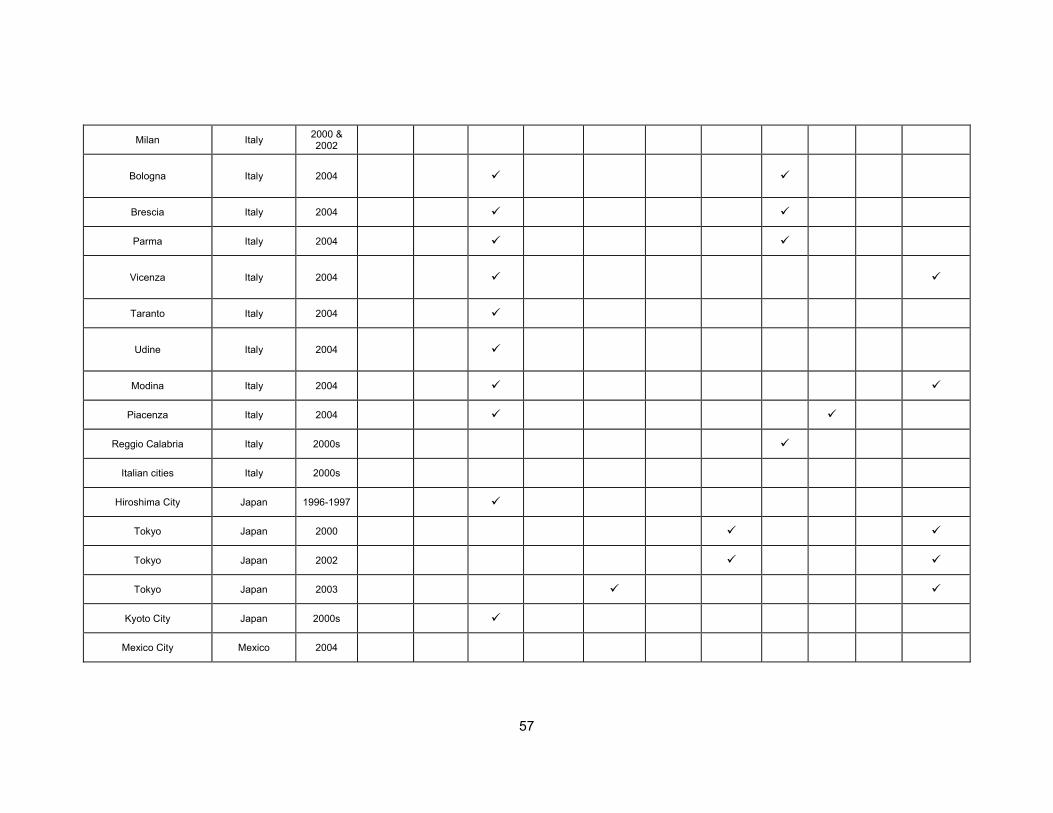
57
Milan Italy 2000 & 2002
Bologna Italy 2004
Brescia Italy 2004
Parma Italy 2004
Vicenza Italy 2004
Taranto Italy 2004
Udine Italy 2004
Modina Italy 2004
Piacenza Italy 2004
Reggio Calabria Italy 2000s
Italian cities Italy 2000s
Hiroshima City Japan 1996-1997
Tokyo Japan 2000
Tokyo Japan 2002
Tokyo Japan 2003
Kyoto City Japan 2000s
Mexico City Mexico 2004

58
Lisbon Portugal 2005
Porto Portugal 2000s
Barcelona Spain 1991
Barcelona Spain 1997
Granada Spain 2000s
Seville Spain 2003
Malaga Spain 2000s
Seville Spain 2005
Zaragoza Spain 2005
Stockholm Sweden 1998
Basel Switzerland 1990s
Berne Switzerland 1997
Zurich Switzerland 2003
Five Dutch cities The Netherlands 1982
Leiden, Arnhem The Netherlands 1987
Arhem, Maastricht The Netherlands 1991
Venlo The Netherlands 1992
Tilburg The Netherlands 1992
Maastricht The Netherlands 1993
Haarlem The Netherlands 1995
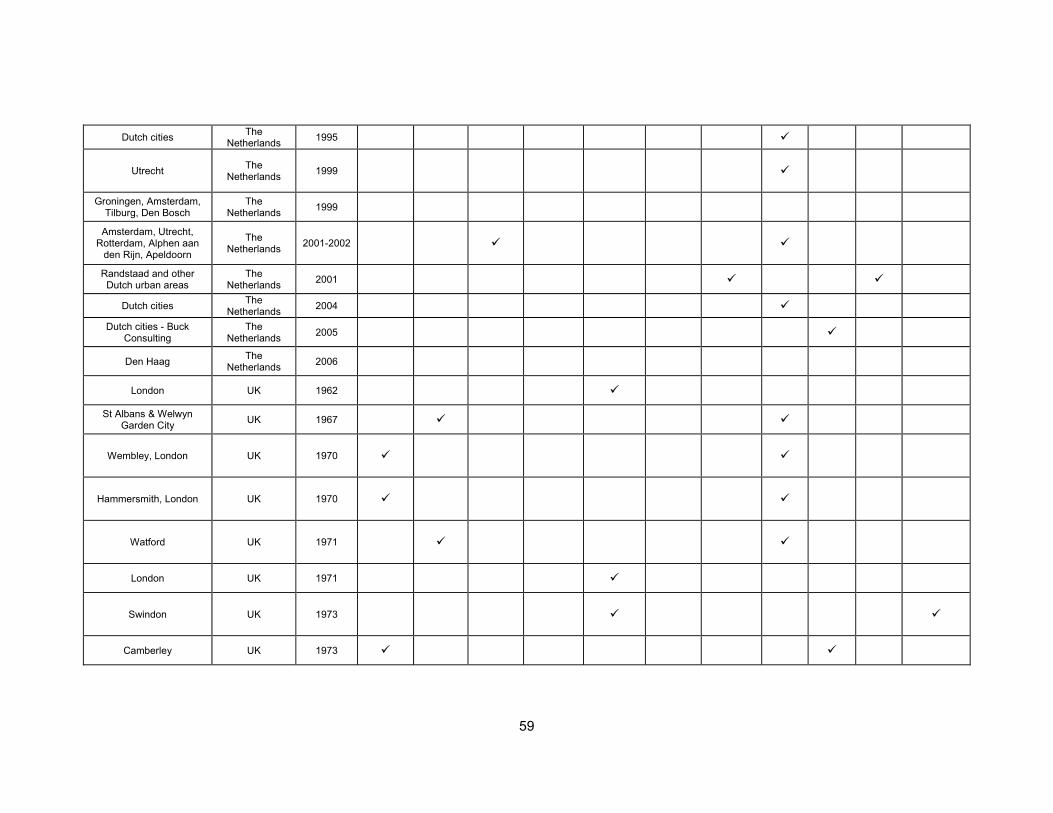
59
Dutch cities The Netherlands 1995
Utrecht The Netherlands 1999
Groningen, Amsterdam, Tilburg, Den Bosch
The Netherlands 1999
Amsterdam, Utrecht, Rotterdam, Alphen aan
den Rijn, Apeldoorn
The Netherlands 2001-2002
Randstaad and other Dutch urban areas
The Netherlands 2001
Dutch cities The Netherlands 2004
Dutch cities - Buck Consulting
The Netherlands 2005
Den Haag The Netherlands 2006
London UK 1962
St Albans & Welwyn Garden City UK 1967
Wembley, London UK 1970
Hammersmith, London UK 1970
Watford UK 1971
London UK 1971
Swindon UK 1973
Camberley UK 1973
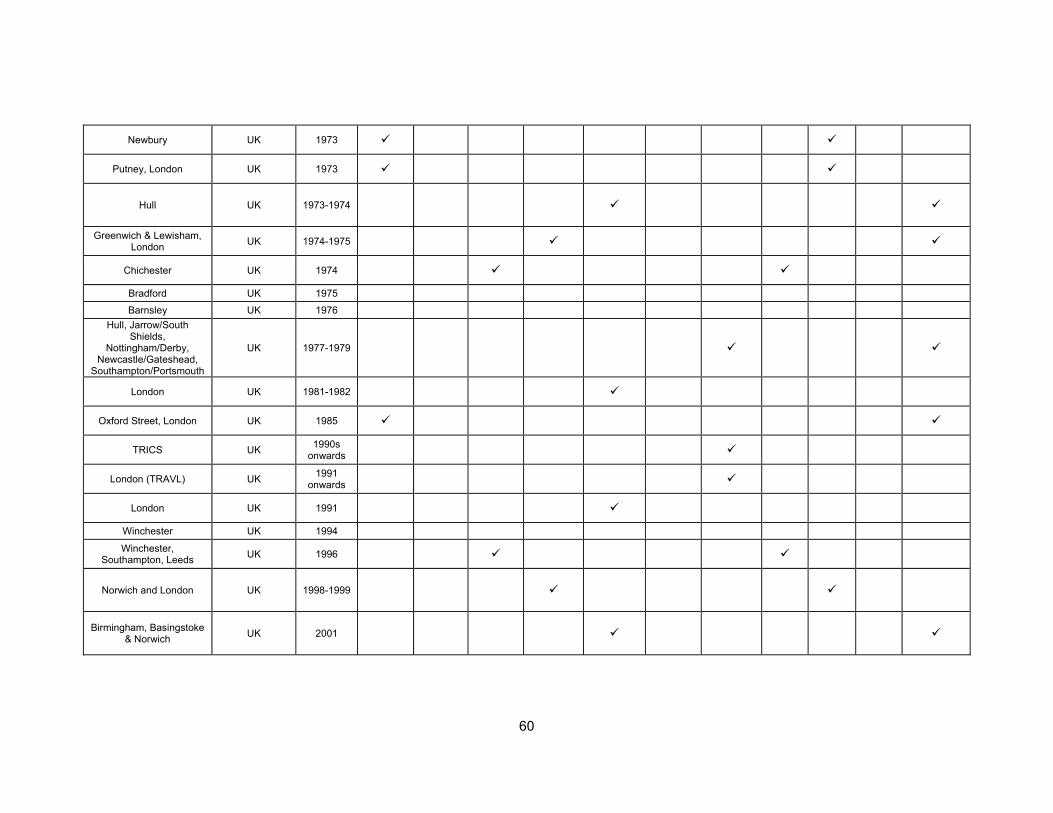
60
Newbury UK 1973
Putney, London UK 1973
Hull UK 1973-1974
Greenwich & Lewisham, London UK 1974-1975
Chichester UK 1974
Bradford UK 1975 Barnsley UK 1976
Hull, Jarrow/South Shields,
Nottingham/Derby, Newcastle/Gateshead,
Southampton/Portsmouth
UK 1977-1979
London UK 1981-1982
Oxford Street, London UK 1985
TRICS UK 1990s onwards
London (TRAVL) UK 1991 onwards
London UK 1991
Winchester UK 1994 Winchester,
Southampton, Leeds UK 1996
Norwich and London UK 1998-1999
Birmingham, Basingstoke & Norwich UK 2001
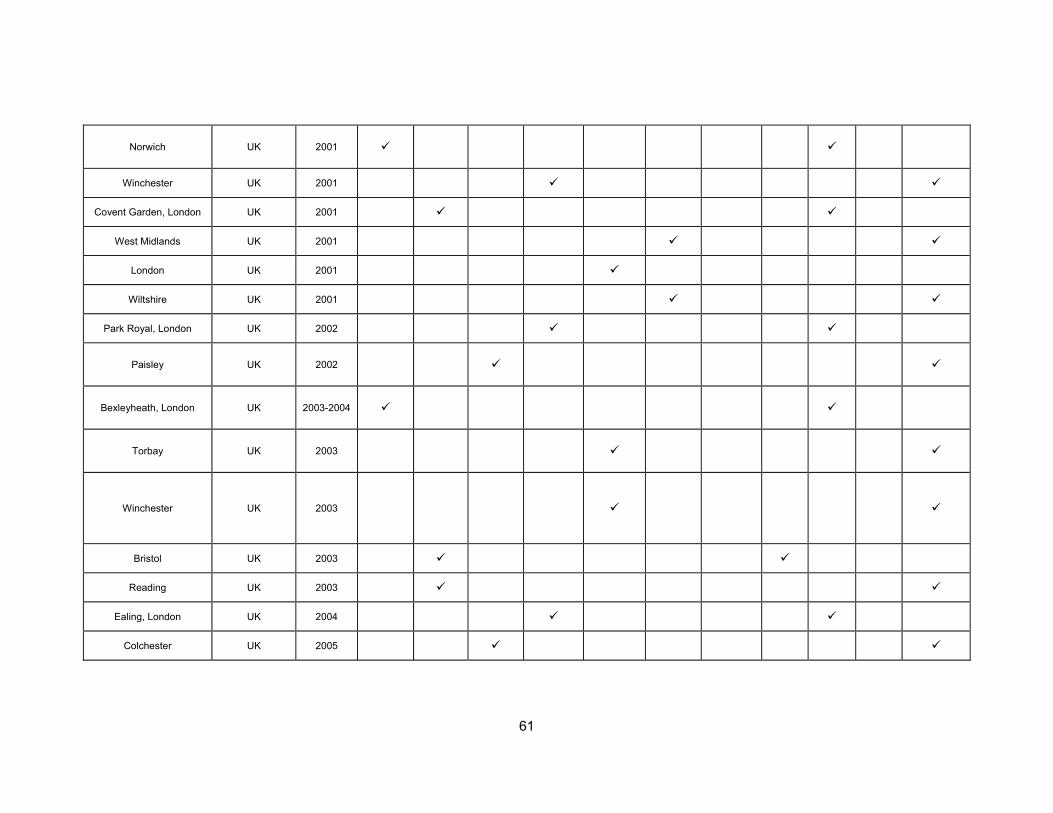
61
Norwich UK 2001
Winchester UK 2001
Covent Garden, London UK 2001
West Midlands UK 2001
London UK 2001
Wiltshire UK 2001
Park Royal, London UK 2002
Paisley UK 2002
Bexleyheath, London UK 2003-2004
Torbay UK 2003
Winchester UK 2003
Bristol UK 2003
Reading UK 2003
Ealing, London UK 2004
Colchester UK 2005
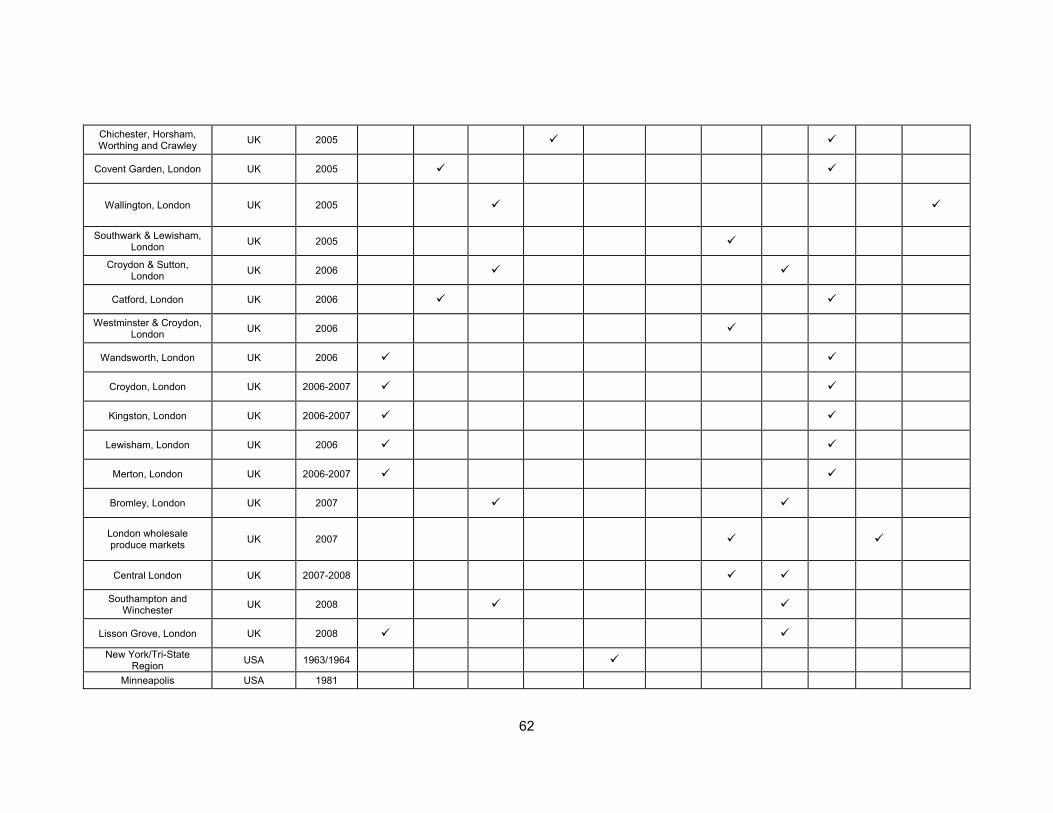
62
Chichester, Horsham, Worthing and Crawley UK 2005
Covent Garden, London UK 2005
Wallington, London UK 2005
Southwark & Lewisham, London UK 2005
Croydon & Sutton, London UK 2006
Catford, London UK 2006
Westminster & Croydon, London UK 2006
Wandsworth, London UK 2006
Croydon, London UK 2006-2007
Kingston, London UK 2006-2007
Lewisham, London UK 2006
Merton, London UK 2006-2007
Bromley, London UK 2007
London wholesale produce markets UK 2007
Central London UK 2007-2008
Southampton and Winchester UK 2008
Lisson Grove, London UK 2008
New York/Tri-State Region USA 1963/1964
Minneapolis USA 1981
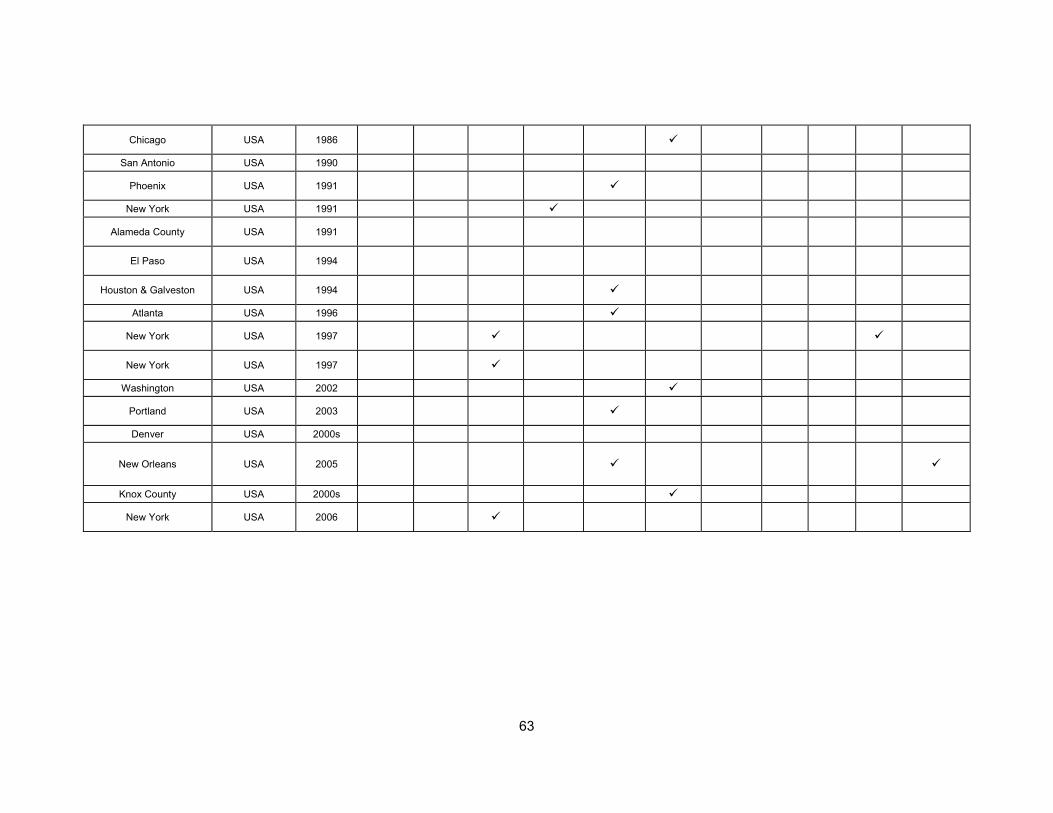
63
Chicago USA 1986
San Antonio USA 1990
Phoenix USA 1991
New York USA 1991
Alameda County USA 1991
El Paso USA 1994
Houston & Galveston USA 1994
Atlanta USA 1996
New York USA 1997
New York USA 1997
Washington USA 2002
Portland USA 2003
Denver USA 2000s
New Orleans USA 2005
Knox County USA 2000s
New York USA 2006
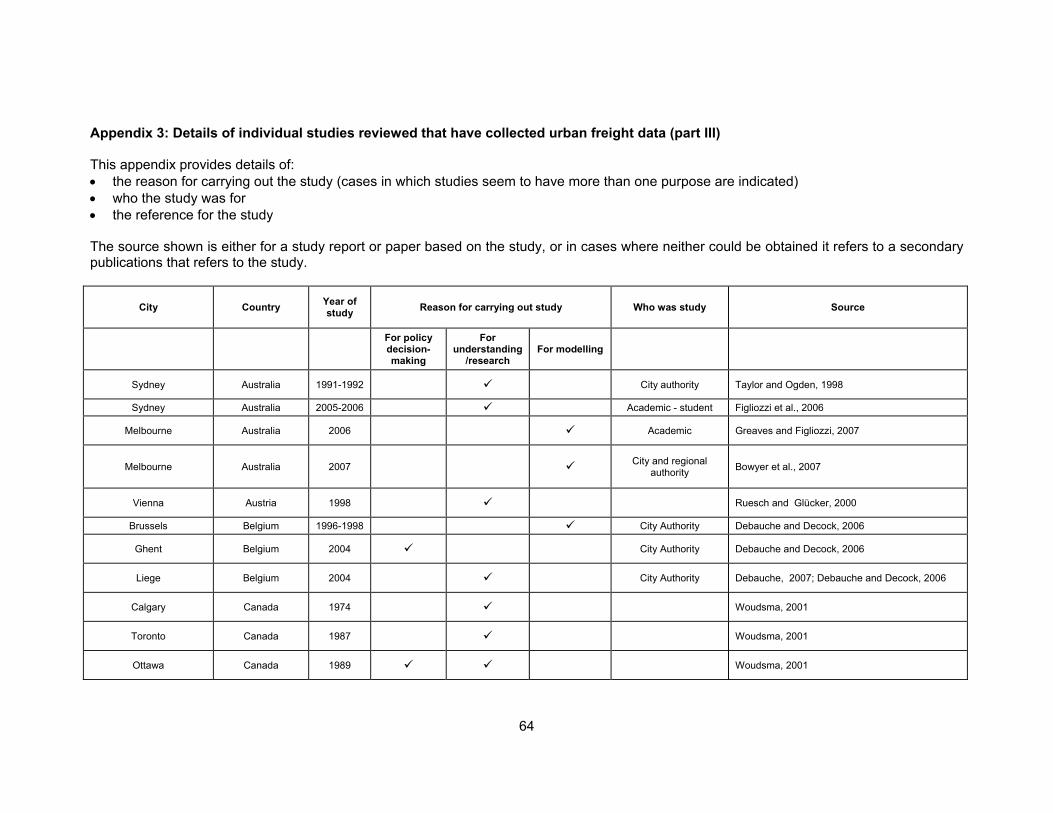
64
Appendix 3: Details of individual studies reviewed that have collected urban freight data (part III) This appendix provides details of: • the reason for carrying out the study (cases in which studies seem to have more than one purpose are indicated) • who the study was for • the reference for the study The source shown is either for a study report or paper based on the study, or in cases where neither could be obtained it refers to a secondary publications that refers to the study.
City Country Year of study Reason for carrying out study Who was study Source
For policy decision-making
For understanding
/research For modelling
Sydney Australia 1991-1992 City authority Taylor and Ogden, 1998
Sydney Australia 2005-2006 Academic - student Figliozzi et al., 2006
Melbourne Australia 2006 Academic Greaves and Figliozzi, 2007
Melbourne Australia 2007 City and regional authority Bowyer et al., 2007
Vienna Austria 1998 Ruesch and Glücker, 2000
Brussels Belgium 1996-1998 City Authority Debauche and Decock, 2006
Ghent Belgium 2004 City Authority Debauche and Decock, 2006
Liege Belgium 2004 City Authority Debauche, 2007; Debauche and Decock, 2006
Calgary Canada 1974 Woudsma, 2001
Toronto Canada 1987 Woudsma, 2001
Ottawa Canada 1989 Woudsma, 2001
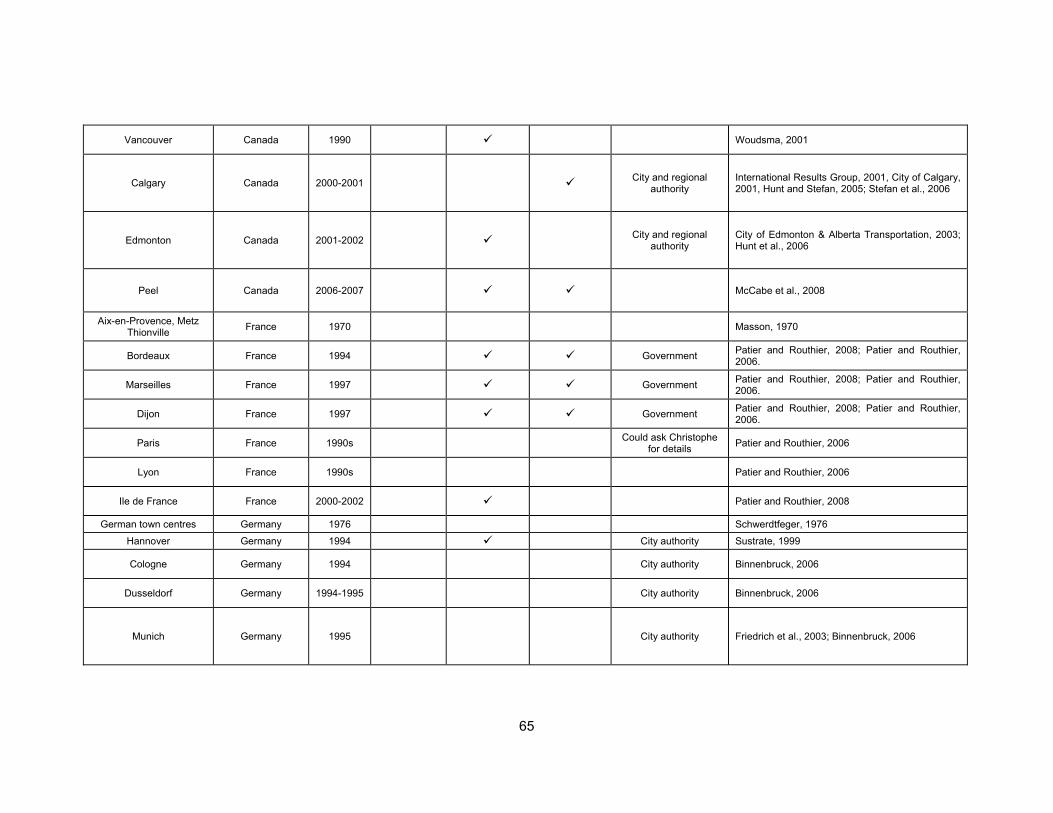
65
Vancouver Canada 1990 Woudsma, 2001
Calgary Canada 2000-2001 City and regional authority
International Results Group, 2001, City of Calgary, 2001, Hunt and Stefan, 2005; Stefan et al., 2006
Edmonton Canada 2001-2002 City and regional authority
City of Edmonton & Alberta Transportation, 2003; Hunt et al., 2006
Peel Canada 2006-2007 McCabe et al., 2008
Aix-en-Provence, Metz Thionville France 1970 Masson, 1970
Bordeaux France 1994 Government Patier and Routhier, 2008; Patier and Routhier, 2006.
Marseilles France 1997 Government Patier and Routhier, 2008; Patier and Routhier, 2006.
Dijon France 1997 Government Patier and Routhier, 2008; Patier and Routhier, 2006.
Paris France 1990s Could ask Christophe for details Patier and Routhier, 2006
Lyon France 1990s Patier and Routhier, 2006
Ile de France France 2000-2002 Patier and Routhier, 2008
German town centres Germany 1976 Schwerdtfeger, 1976
Hannover Germany 1994 City authority Sustrate, 1999
Cologne Germany 1994 City authority Binnenbruck, 2006
Dusseldorf Germany 1994-1995 City authority Binnenbruck, 2006
Munich Germany 1995 City authority Friedrich et al., 2003; Binnenbruck, 2006
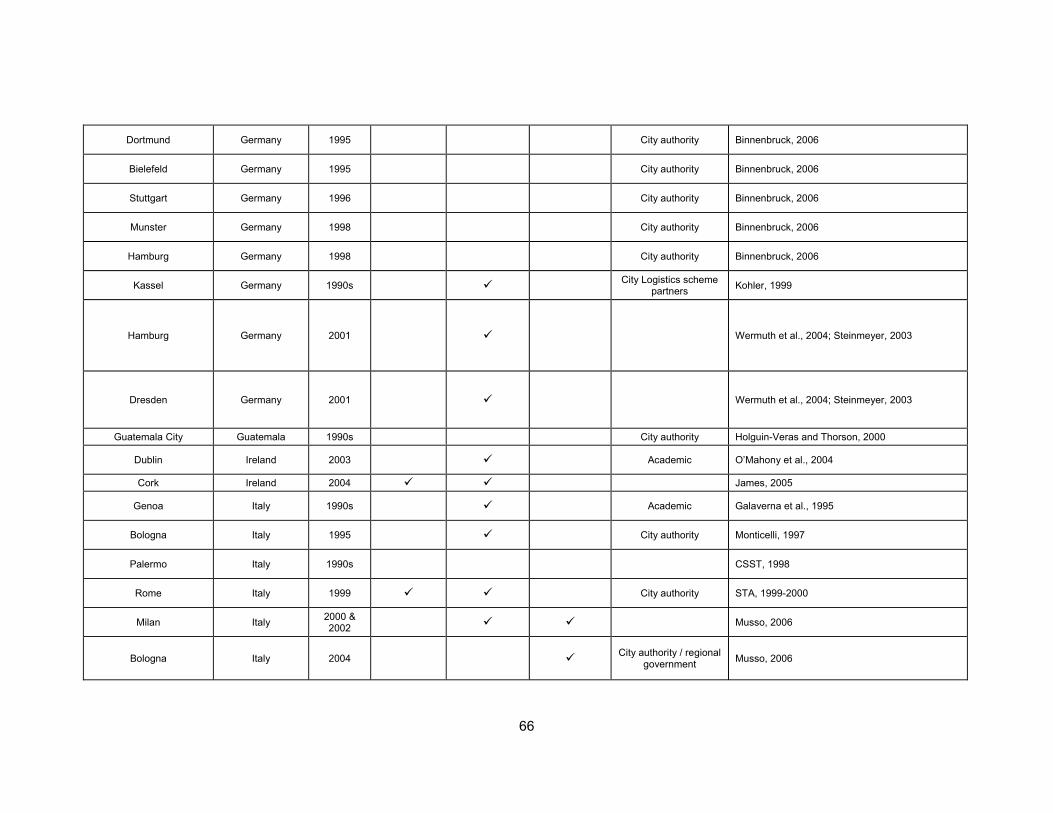
66
Dortmund Germany 1995 City authority Binnenbruck, 2006
Bielefeld Germany 1995 City authority Binnenbruck, 2006
Stuttgart Germany 1996 City authority Binnenbruck, 2006
Munster Germany 1998 City authority Binnenbruck, 2006
Hamburg Germany 1998 City authority Binnenbruck, 2006
Kassel Germany 1990s City Logistics scheme partners Kohler, 1999
Hamburg Germany 2001 Wermuth et al., 2004; Steinmeyer, 2003
Dresden Germany 2001 Wermuth et al., 2004; Steinmeyer, 2003
Guatemala City Guatemala 1990s City authority Holguin-Veras and Thorson, 2000
Dublin Ireland 2003 Academic O’Mahony et al., 2004
Cork Ireland 2004 James, 2005
Genoa Italy 1990s Academic Galaverna et al., 1995
Bologna Italy 1995 City authority Monticelli, 1997
Palermo Italy 1990s CSST, 1998
Rome Italy 1999 City authority STA, 1999-2000
Milan Italy 2000 & 2002 Musso, 2006
Bologna Italy 2004 City authority / regional government Musso, 2006
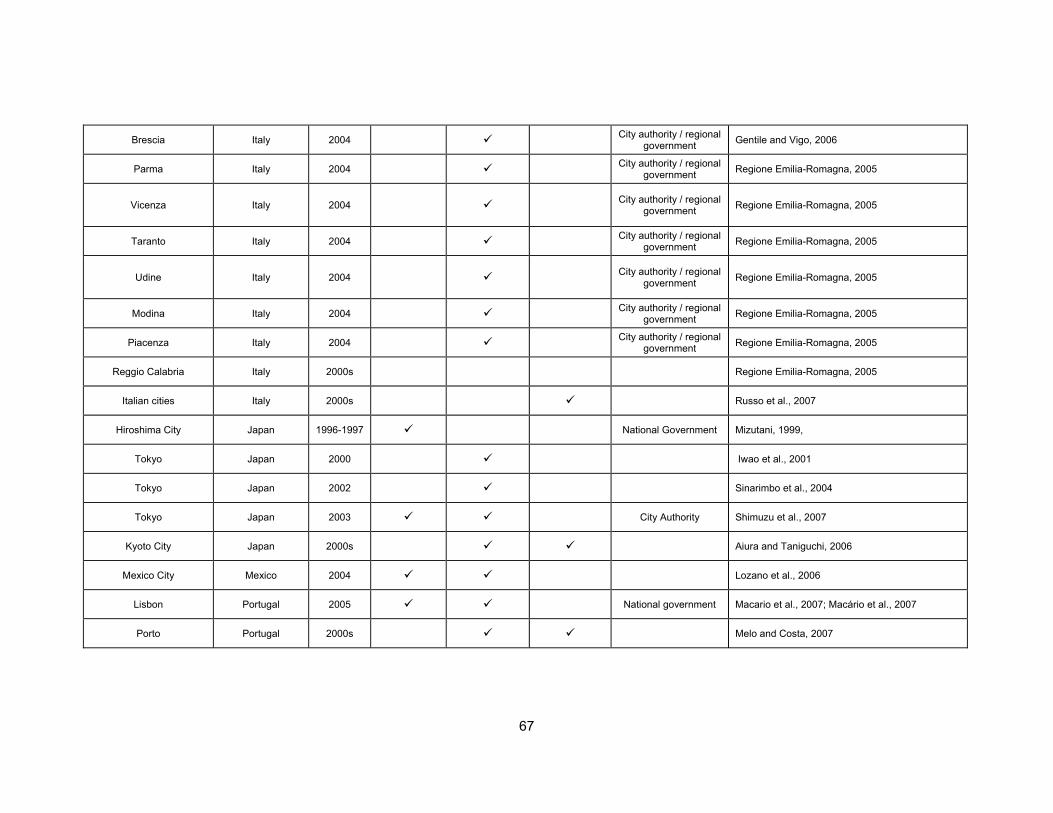
67
Brescia Italy 2004 City authority / regional government Gentile and Vigo, 2006
Parma Italy 2004 City authority / regional government Regione Emilia-Romagna, 2005
Vicenza Italy 2004 City authority / regional government Regione Emilia-Romagna, 2005
Taranto Italy 2004 City authority / regional government Regione Emilia-Romagna, 2005
Udine Italy 2004 City authority / regional government Regione Emilia-Romagna, 2005
Modina Italy 2004 City authority / regional government Regione Emilia-Romagna, 2005
Piacenza Italy 2004 City authority / regional government Regione Emilia-Romagna, 2005
Reggio Calabria Italy 2000s Regione Emilia-Romagna, 2005
Italian cities Italy 2000s Russo et al., 2007
Hiroshima City Japan 1996-1997 National Government Mizutani, 1999,
Tokyo Japan 2000 Iwao et al., 2001
Tokyo Japan 2002 Sinarimbo et al., 2004
Tokyo Japan 2003 City Authority Shimuzu et al., 2007
Kyoto City Japan 2000s Aiura and Taniguchi, 2006
Mexico City Mexico 2004 Lozano et al., 2006
Lisbon Portugal 2005 National government Macario et al., 2007; Macário et al., 2007
Porto Portugal 2000s Melo and Costa, 2007

68
Barcelona Spain 1991 City authority Muñuzuri, 2006
Barcelona Spain 1997 City authority Muñuzuri, 2006
Granada Spain 2000s City authority Muñuzuri, 2006
Seville Spain 2003 Academic Muñuzuri, 2006
Malaga Spain 2000s City authority Muñuzuri, 2006
Seville Spain 2005 Academic Muñuzuri, 2006
Zaragoza Spain 2005 Academic Muñuzuri, 2006
Stockholm Sweden 1998 City Authority BESTUFS, 2006; Rand Europe, 2002
Basel Switzerland 1990s Abel, 2006
Berne Switzerland 1997 City Authority COST 321, 1998; Abel, 2006
Zurich Switzerland 2003 City Authority Abel, 2006
Five Dutch cities The Netherlands 1982 DHV, 1982
Leiden, Arnhem The Netherlands 1987 DHV et al., 1987
Arhem, Maastricht The Netherlands 1991 Coopers & Lybrand, 1991a and 1991b
Venlo The Netherlands 1992 Hoofdbedrijfschap Detailhandel (HBD), 1992.
Tilburg The Netherlands 1992 Akker et al., 1992
Maastricht The Netherlands 1993 Oranjewoud, 1993
Haarlem The Netherlands 1995 Heidemij Advies, 1995
Dutch cities The Netherlands 1995 Hoofdbedrijfschap Detailhandel (HBD), 1995
Utrecht The Netherlands 1999 DHV, 1999; Boerkamps, 2002
Groningen, Amsterdam, Tilburg, Den Bosch The Netherlands 1999 SSZ, 2000; PSD, 2000; Oranjewoud, 2000.
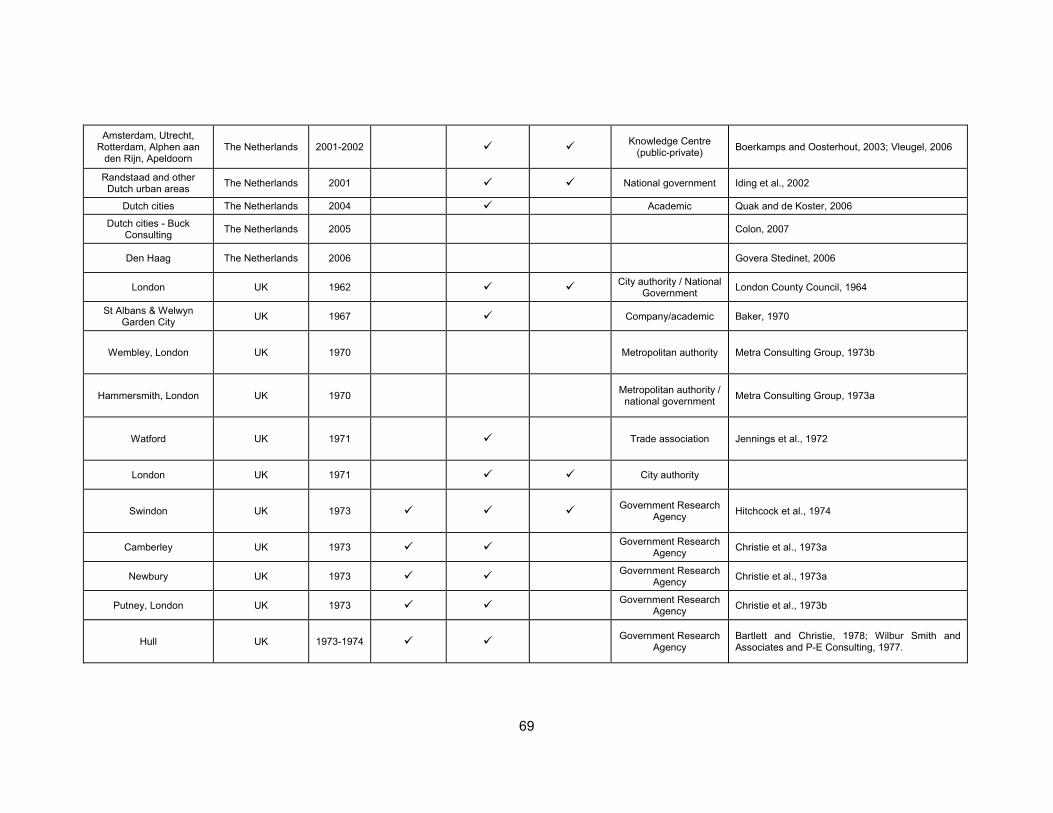
69
Amsterdam, Utrecht, Rotterdam, Alphen aan
den Rijn, Apeldoorn The Netherlands 2001-2002 Knowledge Centre
(public-private) Boerkamps and Oosterhout, 2003; Vleugel, 2006
Randstaad and other Dutch urban areas The Netherlands 2001 National government Iding et al., 2002
Dutch cities The Netherlands 2004 Academic Quak and de Koster, 2006
Dutch cities - Buck Consulting The Netherlands 2005 Colon, 2007
Den Haag The Netherlands 2006 Govera Stedinet, 2006
London UK 1962 City authority / National Government London County Council, 1964
St Albans & Welwyn Garden City UK 1967 Company/academic Baker, 1970
Wembley, London UK 1970 Metropolitan authority Metra Consulting Group, 1973b
Hammersmith, London UK 1970 Metropolitan authority / national government Metra Consulting Group, 1973a
Watford UK 1971 Trade association Jennings et al., 1972
London UK 1971 City authority
Swindon UK 1973 Government Research Agency Hitchcock et al., 1974
Camberley UK 1973 Government Research Agency Christie et al., 1973a
Newbury UK 1973 Government Research Agency Christie et al., 1973a
Putney, London UK 1973 Government Research Agency Christie et al., 1973b
Hull UK 1973-1974 Government Research Agency
Bartlett and Christie, 1978; Wilbur Smith and Associates and P-E Consulting, 1977.
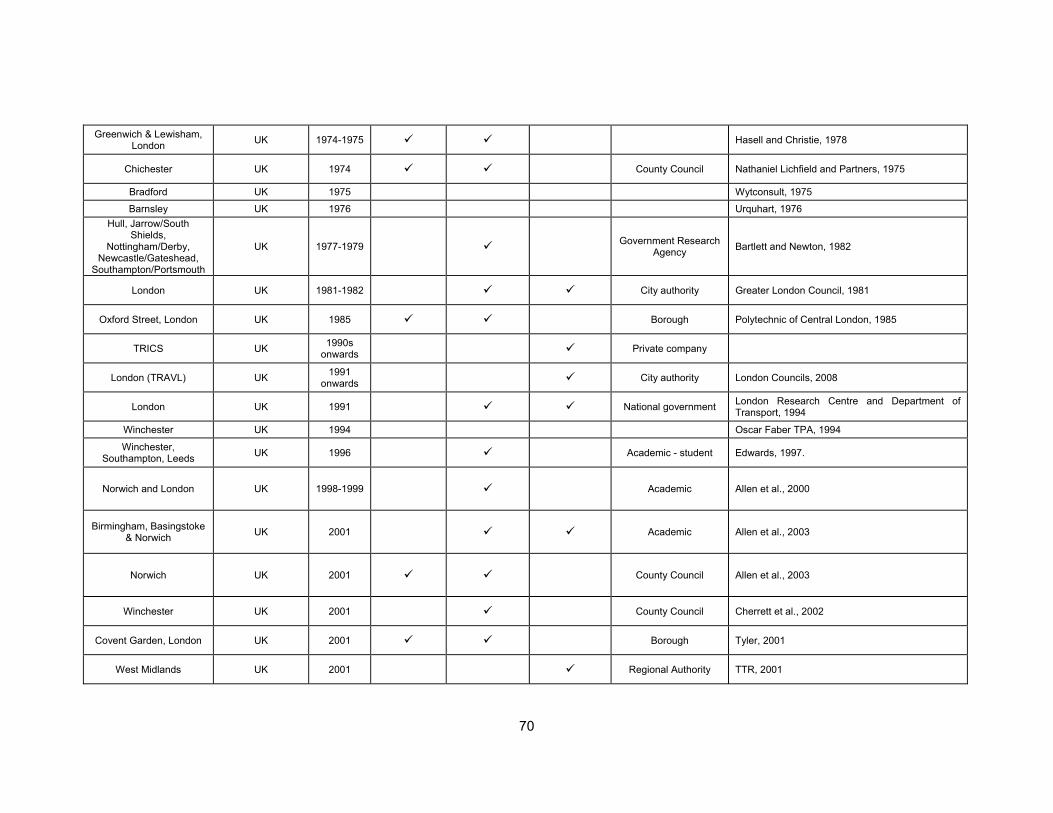
70
Greenwich & Lewisham, London UK 1974-1975 Hasell and Christie, 1978
Chichester UK 1974 County Council Nathaniel Lichfield and Partners, 1975
Bradford UK 1975 Wytconsult, 1975
Barnsley UK 1976 Urquhart, 1976 Hull, Jarrow/South
Shields, Nottingham/Derby,
Newcastle/Gateshead, Southampton/Portsmouth
UK 1977-1979 Government Research Agency Bartlett and Newton, 1982
London UK 1981-1982 City authority Greater London Council, 1981
Oxford Street, London UK 1985 Borough Polytechnic of Central London, 1985
TRICS UK 1990s onwards Private company
London (TRAVL) UK 1991 onwards City authority London Councils, 2008
London UK 1991 National government London Research Centre and Department of Transport, 1994
Winchester UK 1994 Oscar Faber TPA, 1994
Winchester, Southampton, Leeds UK 1996 Academic - student Edwards, 1997.
Norwich and London UK 1998-1999 Academic Allen et al., 2000
Birmingham, Basingstoke & Norwich UK 2001 Academic Allen et al., 2003
Norwich UK 2001 County Council Allen et al., 2003
Winchester UK 2001 County Council Cherrett et al., 2002
Covent Garden, London UK 2001 Borough Tyler, 2001
West Midlands UK 2001 Regional Authority TTR, 2001
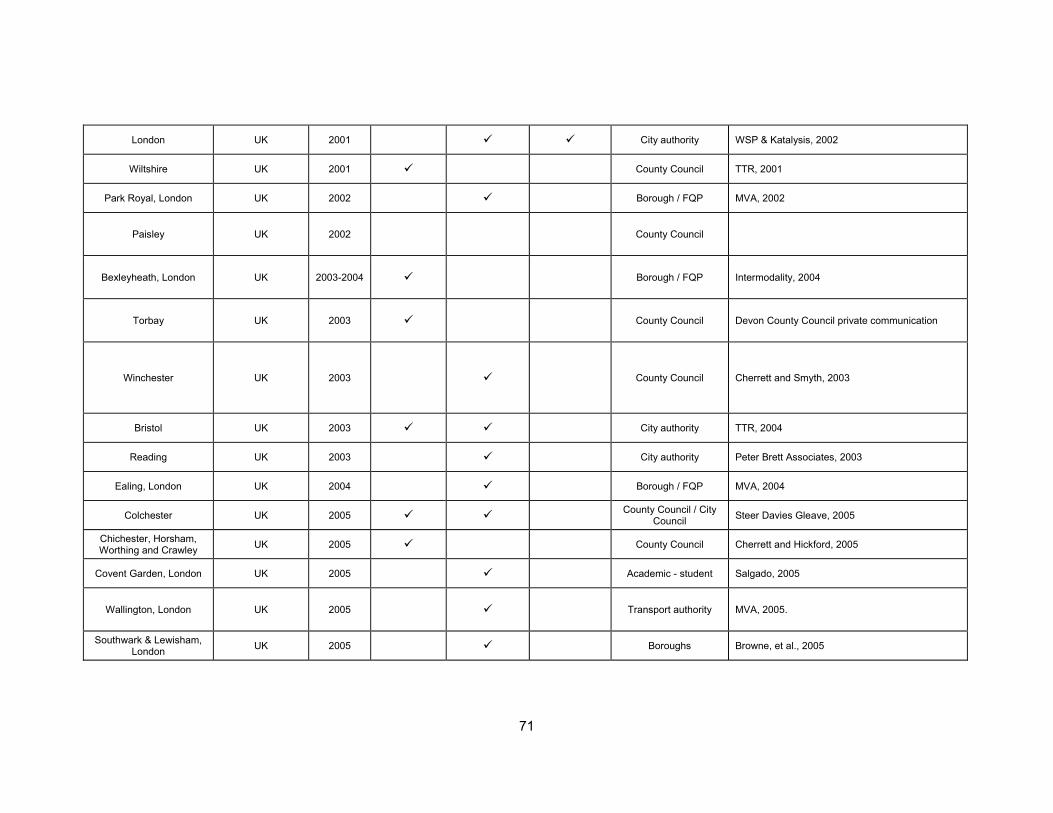
71
London UK 2001 City authority WSP & Katalysis, 2002
Wiltshire UK 2001 County Council TTR, 2001
Park Royal, London UK 2002 Borough / FQP MVA, 2002
Paisley UK 2002 County Council
Bexleyheath, London UK 2003-2004 Borough / FQP Intermodality, 2004
Torbay UK 2003 County Council Devon County Council private communication
Winchester UK 2003 County Council Cherrett and Smyth, 2003
Bristol UK 2003 City authority TTR, 2004
Reading UK 2003 City authority Peter Brett Associates, 2003
Ealing, London UK 2004 Borough / FQP MVA, 2004
Colchester UK 2005 County Council / City Council Steer Davies Gleave, 2005
Chichester, Horsham, Worthing and Crawley UK 2005 County Council Cherrett and Hickford, 2005
Covent Garden, London UK 2005 Academic - student Salgado, 2005
Wallington, London UK 2005 Transport authority MVA, 2005.
Southwark & Lewisham, London UK 2005 Boroughs Browne, et al., 2005
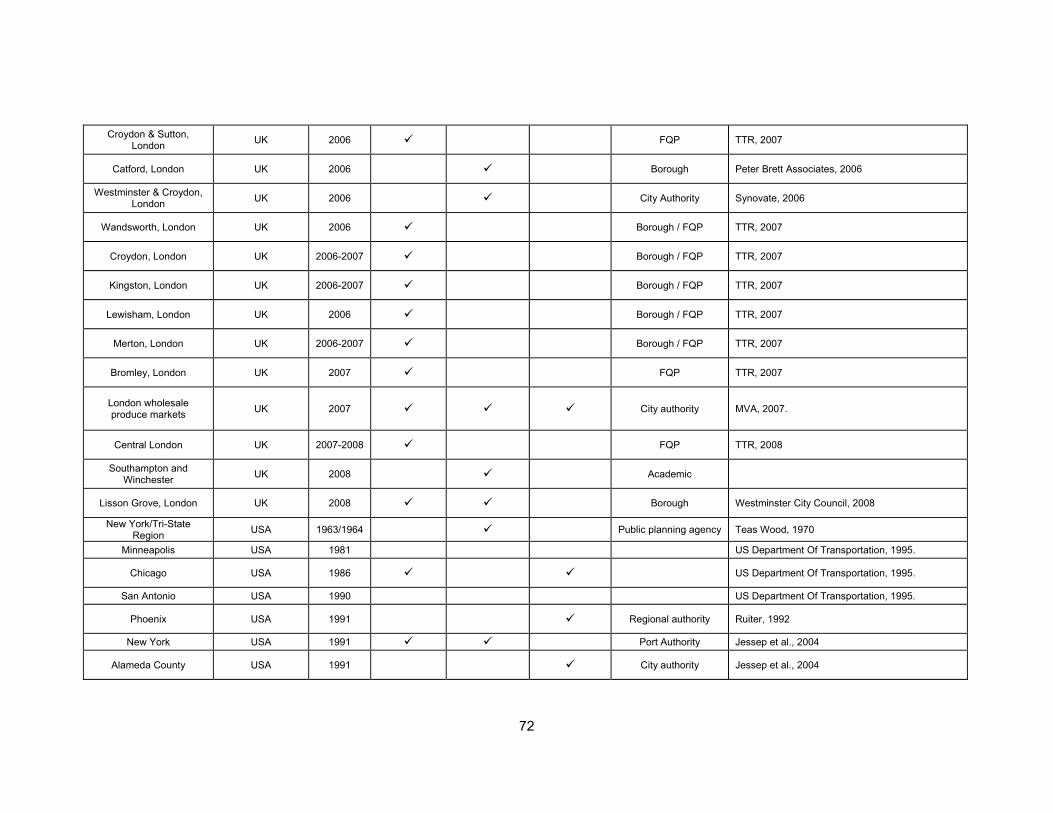
72
Croydon & Sutton, London UK 2006 FQP TTR, 2007
Catford, London UK 2006 Borough Peter Brett Associates, 2006
Westminster & Croydon, London UK 2006 City Authority Synovate, 2006
Wandsworth, London UK 2006 Borough / FQP TTR, 2007
Croydon, London UK 2006-2007 Borough / FQP TTR, 2007
Kingston, London UK 2006-2007 Borough / FQP TTR, 2007
Lewisham, London UK 2006 Borough / FQP TTR, 2007
Merton, London UK 2006-2007 Borough / FQP TTR, 2007
Bromley, London UK 2007 FQP TTR, 2007
London wholesale produce markets UK 2007 City authority MVA, 2007.
Central London UK 2007-2008 FQP TTR, 2008
Southampton and Winchester UK 2008 Academic
Lisson Grove, London UK 2008 Borough Westminster City Council, 2008
New York/Tri-State Region USA 1963/1964 Public planning agency Teas Wood, 1970
Minneapolis USA 1981 US Department Of Transportation, 1995.
Chicago USA 1986 US Department Of Transportation, 1995.
San Antonio USA 1990 US Department Of Transportation, 1995.
Phoenix USA 1991 Regional authority Ruiter, 1992
New York USA 1991 Port Authority Jessep et al., 2004
Alameda County USA 1991 City authority Jessep et al., 2004
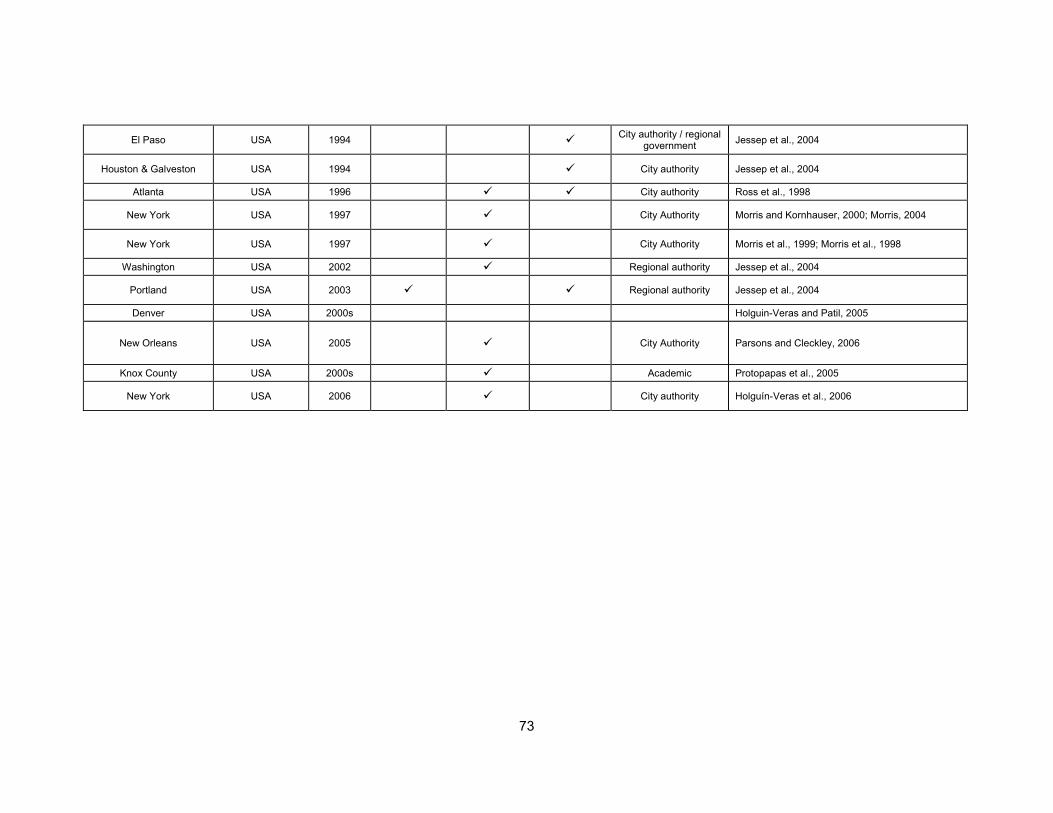
73
El Paso USA 1994 City authority / regional government Jessep et al., 2004
Houston & Galveston USA 1994 City authority Jessep et al., 2004
Atlanta USA 1996 City authority Ross et al., 1998
New York USA 1997 City Authority Morris and Kornhauser, 2000; Morris, 2004
New York USA 1997 City Authority Morris et al., 1999; Morris et al., 1998
Washington USA 2002 Regional authority Jessep et al., 2004
Portland USA 2003 Regional authority Jessep et al., 2004
Denver USA 2000s Holguin-Veras and Patil, 2005
New Orleans USA 2005 City Authority Parsons and Cleckley, 2006
Knox County USA 2000s Academic Protopapas et al., 2005
New York USA 2006 City authority Holguín-Veras et al., 2006