Embed Size (px)
Citation preview

Review of Standard and Remaining Lives of Assets Networks NSW
12 January 2015

Review of Standard and Remaining Lives of Assets Advisian 1
Table of Contents
1 Executive Summary ..................................................................................... 4
2 Introduction .................................................................................................. 7
2.1 Report Structure ....................................................................................... 7
3 Background .................................................................................................. 9
3.1 Regulatory Context ................................................................................... 9
4 Current Regulatory Approach ................................................................... 11
4.1 NER Requirements .................................................................................. 11
4.2 Objective of the Depreciation Building Block Allowance ....................... 14
4.3 Key Assumptions ...................................................................................... 15
4.3.1 Standard Lives ......................................................................................................... 16
4.3.2 Remaining Lives ...................................................................................................... 17
4.3.3 Asset Classes ............................................................................................................ 19
4.3.4 Nominal Regulatory Depreciation ........................................................................ 20
4.3.5 Benchmark Tax Lives .............................................................................................. 21
5 Networks NSW Data ................................................................................... 23
5.1 Existing Sources of Asset Life Information ............................................ 23
5.2 Key Issues Identification and Evaluation ............................................... 25
5.2.1 Economic Life ......................................................................................................... 25
5.2.2 Standard Life as a proxy for Economic Life .......................................................... 26
5.2.3 Calculation of Remaining Life ............................................................................... 28
5.2.4 Categorisation of Assets ......................................................................................... 30
6 Alternative Approach Assessment ........................................................... 32
6.1 Network Data Determination of Asset Lives .......................................... 32
6.2 Weighted Average Calculation of Asset Lives ......................................... 32
6.3 Consistency across Networks NSW businesses ...................................... 34
6.4 Treatment of Asset Categories ................................................................ 35
7 Conclusion .................................................................................................. 36

Review of Standard and Remaining Lives of Assets Advisian 2
7.1 Calculation of Asset Lives ....................................................................... 36
7.1.1 Standard Asset Lives .............................................................................................. 36
7.1.2 Remaining Asset Lives ........................................................................................... 38
7.1.3 Regulatory Asset Class Aggregation ....................................................................... 41
7.2 Regulatory Impact ................................................................................... 41
7.3 Conclusion on Ausgrid Transmission Asset Lives .................................. 43
List of Appendices Appendix A Terms of Reference
Appendix B Reference Documents
Appendix C Curriculum Vitae – Evan Mudge

Review of Standard and Remaining Lives of Assets Advisian 3
Copyright
Unless otherwise agreed in writing, this report is the intellectual property of Advisian Pty Ltd. The
report is designed to be used exclusively by the person that commissioned it. Permission must be
sought prior to the reproduction of any portion of this document and every effort made to ensure
proper referencing of this document.
Disclaimer
This report has been prepared in accordance with the instructions of Networks New South Wales (the
client), as set out in the attached Terms of Reference.
This report has been prepared with the assistance of the client’s officers, employees, agents and other
authorised representatives on the basis of the information provided to Advisian and in reliance on the
information as being complete, true and correct at the time the report was prepared, without further
investigation, verification or inquiry being undertaken by Advisian as to the accuracy or completeness
of the information. Advisian does not warrant or assume any legal liability or responsibility for the
accuracy or completeness of the client’s information contained in this report. No warranties or
guarantees other than those expressly provided in our agreement with the client may be implied or
intended, other than those which cannot be excluded under law.
This report is only valid as of the date issued by Advisian to the client. Advisian does not accept any
responsibility for any information, made available after the date of issue of the report, or for any
change in circumstances after the date of issue, including but not limited to changes in the legal,
regulatory or economic environment, or general information in the public domain.
This report must only be read in its entirety and excerpts from the report may not be taken as
representative of the general findings of the report.
Declaration
I have read, understood and complied with the Federal Court of Australia’s Practice Note CM 7 –
Expert Witness in Proceedings in the Federal Court of Australia.
The opinions contained in this report are based wholly or substantially on the specialised
knowledge gained through the training, study and experience outlined in the Curriculum Vitae that
is attached in Appendix C.
Signature:
Evan Mudge, Associate, Advisian Pty Ltd
Qualifications of persons assisting in preparation of this report:
Oliver Jones, BEng, CPEng, Senior Consultant, Advisian Pty Ltd

Review of Standard and Remaining Lives of Assets Advisian 4
1 Executive Summary
Advisian (formerly Evans & Peck) was engaged by Ausgrid on behalf of Networks New South Wales
(NSW) to provide an independent expert opinion on the standard and remaining asset lives employed
in each of the businesses Roll Forward Model and Post-Tax Revenue Model for the calculation of each
respective regulatory depreciation revenue building block.
In response to the Terms of Reference for this report, Advisian has reviewed the current AEMC rules,
and objectives of the regulatory depreciation building block allowance, as well as the principles and
assessment approach taken by the AER, with respect to determination of standard and remaining
asset lives and the regulatory depreciation building block within the PTRM.
In identifying the basis for the current standard and remaining lives applied by each of the Networks
NSW DNSP businesses, Advisian has identified that the asset lives in the RFM and PTRM have been
continuously rolled forward from the historical optimised depreciated replacement value calculations
conducted using Standard Lives from the 2004 NSW Treasury Guidelines on the Valuation of
Electricity Network Assets, within which the standard lives had “been derived from industry
experience including an ESAA Member Survey in 2000”. Consequently with the advancement of
network investment, both in the types of network assets installed, as well as the network data systems
which support the capture and analysis of real network activity, the standard lives in the Networks
NSW businesses RFM and PTRM are not aligned to the lives that are being experienced in practice.
In assessing the current AEMC rules, and evaluating the regulatory guidance documentation for an
assets economic life, Advisian considers that using actual network data to inform the calculation of
the useful economic life over which an asset should be depreciated, is reasonable on the basis that the
approach outlined in this report:
Is in accordance with the National Electricity Rules;
More accurately reflects actual network activity1; and
Minimises asset write-down risks to future network customers2.
As detailed in Sections 6 and 7 of this report, calculation of standard and remaining asset class lives
on the basis of a capital weighted average of the mean economic lives within Ausgrid’s Category
Analysis RIN, will result in the following amended standard and remaining asset class lives for each
of the asset classes as highlighted in gold, across the Networks NSW businesses.
Standard Asset Lives (Years) Remaining Asset Lives (Years)
Regulatory Asset Classes Ausgrid Endeavour Energy
Essential Energy
Ausgrid Endeavour Energy
Essential Energy
Sub-transmission lines and cables
41.2 45.6 40.5 30.6 30.7 29.4
Cable tunnel (dx) 70 n/a n/a 67.4 n/a n/a
Distribution lines and cables 41.6 40.1 40.6 40.4 33.2 35.6
1 this aligns the timing of the Return of Asset building block revenue closer to the point at which the investment was required to
meet network demand.
2 Asset write-downs as a result of asset replacements/retirements/disposals at lives much shorter than accounted for in
depreciation terms.

Review of Standard and Remaining Lives of Assets Advisian 5
Standard Asset Lives (Years) Remaining Asset Lives (Years)
Substations 46.8 40 40.2 34.8 28.2 25.2
Transformers 37.4 40.6 36.35 27.2 23.5 23.2
Low voltage lines and cables 40.76 41.1 39.4 34.2 25.2 24.5
Customer metering
and load control 25 25 25.9 14.5 23.1 19.9
Communications (digital) - dx 10 n/a n/a 5.6 n/a n/a
Total communications 10.2 8.4 7 3.1 6.9 5.6
Systems IT (dx) 7 n/a n/a 4.9 n/a n/a
Ancillary substation equipment (dx)
15 n/a n/a 12.4 n/a n/a
Land and easements n/a n/a n/a n/a n/a n/a
Furniture, fittings, plant and equipment
17.4 13 13 12.5 8.1 8.4
Land (non-system) n/a n/a n/a n/a n/a n/a
Other non-system assets 29.4 n/a 15 7.7 n/a 13.4
IT systems 5 5 5 3.3 3.5 3.6
Motor vehicles 10.2 8 8 6.3 5.7 5.1
Buildings 35.9 50 50 30 44.8 47.6
Equity raising costs 47.4 42.4 46.3 43.4 37 44.7
Emergency spares (major plant, excludes inventory)
n/a 23.6 n/a n/a 12.9 n/a
This report details Advisian’s findings and its recommended approach for the determination of
standard and remaining asset lives on the basis of a capital weighted average of the economic lives as
reported in Ausgrid’s Category Analysis RIN. The following table illustrates Advisian’s calculation of
the resultant impact to each Networks NSW 2014/15-2018/19 regulatory control PTRM’s, based upon
the data in each business’ original proposal for determination of the respective regulatory revenue
allowance.
Networks NSW Business
Regulatory Building Block
Regulatory Control Period (Year)
($m nominal change on Original Proposal)
Year 1 Year 2 Year 3 Year 4 Year 5
Ausgrid
RAB 0.00 -24.27 -52.08 -83.63 -119.21
Return of Asset 24.27 27.81 31.55 35.58 39.59
Return on Asset (Equity) 0.00 -0.98 -2.11 -3.38 -4.82
Annual Revenue 31.31 33.45 35.46 37.49 39.08
Endeavour Energy
RAB 0.00 -8.23 -17.75 -28.61 -40.92
Return of Asset 8.23 9.52 10.86 12.31 13.89
Return on Asset (Equity) 0.00 -0.33 -0.72 -1.16 -1.65
Annual Revenue 10.62 11.46 12.23 13.00 13.81

Review of Standard and Remaining Lives of Assets Advisian 6
Networks NSW Business
Regulatory Building Block
Regulatory Control Period (Year)
($m nominal change on Original Proposal)
Essential Energy
RAB 0.00 -24.90 -53.43 -85.93 -122.59
Return of Asset 24.90 28.53 32.50 36.66 41.26
Return on Asset (Equity) 0.00 -1.01 -2.16 -3.47 -4.96
Annual Revenue 32.13 34.31 36.55 38.66 40.89
Review of Standard and Remaining Lives of Assets Advisian 7
2 Introduction
Advisian (formerly Evans & Peck) was engaged by Ausgrid on behalf of Networks New South Wales
(NSW) to provide an independent expert opinion in response to the following questions:
1) What are the fundamental principles and approach adopted by the Australian Energy
Regulator (AER) in assessing and endorsing asset class standard and remaining lives for
inclusion in the distribution determination Roll Forward Model (RFM) and Post-Tax Revenue
Model (PTRM)? Do the practices adopted by the Networks NSW businesses align to the
Australian Energy Market Commission (AEMC) rules and AER principles? Do the practices
align with the fundamental driver for asset depreciation?
2) What are the existing commonalities/differences across each Networks NSW business and the
National Electricity Market (NEM) Distribution Network Service Provider’s (DNSP) for the
calculation of asset class standard and remaining lives? Is there scope for common practices
between Networks NSW businesses in the adoption of asset class lives and what impact might
a change in practice have on each businesses regulatory submission?
3) What are the existing commonalities/differences across each Networks NSW business in
alignment between the engineering, regulatory and accounting lives of asset classes? Is there
scope for commonality of asset class lives across engineering, regulatory and accounting lives
and what impact might a change in practice have on each businesses practices and regulatory
submission?
4) On what basis might the Networks NSW businesses adopt different asset class standard and
remaining lives which more closely align depreciation revenue to the expenditure quantum and
timing requirements of the businesses? And what business/network/customer impact might
this have on the regulated revenue requirement for each business?
In responding to these questions Advisian has:
(a) Reviewed the current processes for determining standard and remaining asset lives across each
of the three Networks NSW businesses, and identified any differences between each;
(b) Assessed and outlined alternative approaches to the determination of standard and remaining
asset lives, and the likely impact each alternative may have on regulatory, customer and
business objectives; and
(c) Recommended an approach to the determination of standard and remaining assets lives and
how the approach may be implemented within both the RFM and the PTRM.
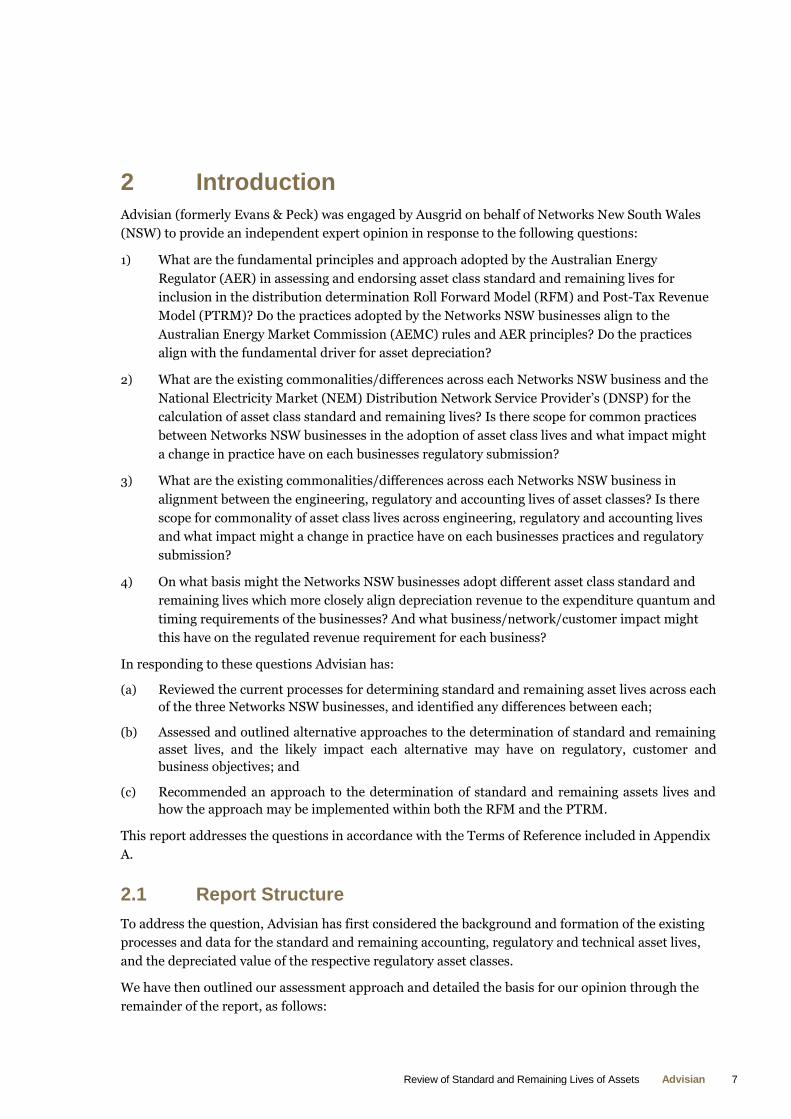
This report addresses the questions in accordance with the Terms of Reference included in Appendix
A.
2.1 Report Structure
To address the question, Advisian has first considered the background and formation of the existing
processes and data for the standard and remaining accounting, regulatory and technical asset lives,
and the depreciated value of the respective regulatory asset classes.
We have then outlined our assessment approach and detailed the basis for our opinion through the
remainder of the report, as follows:

Review of Standard and Remaining Lives of Assets Advisian 8
Section 4: Reviews the current AEMC rules and the principles and assessment approach taken by
the AER with respect to determination of standard and remaining asset lives and the depreciation
component of the PTRM.
Section 5: Outlines the background and current state of standard asset lives and depreciated asset
value, and identifies key issues within the current regulatory model and reporting context.
Section 6: Assesses alternative approaches and details Advisian’s opinion on the determination of
standard and remaining asset lives, and the likely impact each alternative may have on the
depreciation component of the Maximum Allowable Revenue (MAR) for each of the Networks
NSW businesses.
Section 7: Details Advisian’s recommendation of the application of the proposed amended
standard and remaining assets lives and concludes the report.

Review of Standard and Remaining Lives of Assets Advisian 9
3 Background
Networks NSW has identified concerns with the calculation of the Return of Assets component of its
revenue, which represents the depreciation expense that is recovered from customers. As a result, the
depreciation profile and timing of depreciation cash flow is not well aligned to the actual asset lives
experienced by the network businesses.
The depreciation component of revenue acts to expense existing assets. However, high level financial
and asset management indicators frequently use depreciation as a proxy for the expected level of
replacement capital expenditure to sustain existing assets. In this regard, the use of shorter asset lives
in the calculation of depreciation revenue allowance may allow for a more cost reflective recovery of
capital expenditure closer to the period in time at which customer and demand growth generated the
requirement for network augmentation and replacement activity, providing an inherent benefit to a
network business in maintaining capital recovery, and reducing risk to future customers of asset
write-downs on assets replaced or disposed significantly earlier than the respective depreciation
schedules had accounted for.
Networks NSW considers that it may be possible to amend the asset lives that are used for the
calculation of the regulatory depreciation expense so that the timing and quantum better aligns to the
asset lives reflected in the captured network data and the data used for asset replacement forecasting.
This report provides Advisian’s independent opinion on reasonable approaches to the application of
standard asset lives, remaining asset lives and weighting processes in the PTRM for each of the
Networks NSW businesses as they prepare their amended proposal to the AER.
3.1 Regulatory Context
The AER applies asset life information provided by DNSP’s in two areas of its regulatory
determinations. These are:
(a) The calculation of the Return of Assets (Depreciation) building block and Regulatory Asset
Base (RAB) value in the RFM and the PTRM;
(b) The Repex model which is used to inform the AER’s assessment of the businesses’ proposed
replacement capex.
Indirectly, the asset life information also influences:
(a) The Return on Assets (WACC x RAB) building block due to the centrality of depreciation
assumptions to the value of the RAB; and
(b) The Benchmark Tax Expense Building Block to the extent which the tax and regulatory
depreciation lives are aligned.
Therefore the asset life information provided by the Networks NSW businesses is fundamental to the
determination of allowable revenue. Notwithstanding this, the statements on the requirements and
usage of asset life information contained in the National Electricity Rules Clause 6.5.5. Depreciation3,
and the AER’s handbooks for both the PTRM4 and RFM5, do not explicitly detail the requirements for
3 AEMC, National Electricity Rules, Version 65, 1 October 2014, pp. 659-660
4 Electricity distribution network service providers Post-tax revenue model handbook June 2008

Review of Standard and Remaining Lives of Assets Advisian 10
determination of standard and remaining asset lives. In addition the terminology differences
referring to asset lives between the NERs, regulatory reporting requirements and the regulatory
models introduce inconsistencies in the reporting of asset life information between businesses.
Therefore the methodologies and reported information remains inconsistent between different NEM
DNSPs.
Whilst this report is primarily focused on the standard and remaining lives used for the
determination of the regulatory depreciation revenue building block, where relevant, we have also
considered the economic lives that have been presented at a more granular level in the technical
portion of the RIN information.
5Electricity distribution network service providers Roll forward model handbook June 2008

Review of Standard and Remaining Lives of Assets Advisian 11
4 Current Regulatory Approach
The AER’s fundamental principles and approach to the assessment and determination of the
regulatory depreciation building block relies on the standard and remaining lives that have been
provided for the purpose of calculating the value of the RAB using the RFM and PTRM. This section
summarises the AER’s approach to assessing and determining the regulatory depreciation schedules
forming the regulatory depreciation building block revenue, in accordance with the AEMC rules and
AER principles, and describes the key assumptions that underlie the application in the RFM and
PTRM of each of the Networks NSW businesses.
4.1 NER Requirements
The AER currently assess the benchmark efficient depreciation costs of each of the Networks NSW
businesses in accordance with Clause 6.5.56 of the National Electricity Rules as follows:
“6.5.5 Depreciation
a) The depreciation for each regulatory year:
1) must be calculated on the value of the assets as included in the regulatory asset base, as at the beginning of that regulatory year, for the relevant distribution system; and
2) must be calculated:
i. providing such depreciation schedules conform with the requirements set out in paragraph (b), using the depreciation schedules for each asset or category of assets that are nominated in the relevant Distribution Network Service Provider's building block proposal; or
ii. to the extent the depreciation schedules nominated in the Distribution Network Service Provider's building block proposal do not so conform, using the depreciation schedules determined for that purpose by the AER.
b) The depreciation schedules referred to in paragraph (a) must conform to the following requirements:
1) the schedules must depreciate using a profile that reflects the nature of the assets or category of assets over the economic life of that asset or category of assets;
2) the sum of the real value of the depreciation that is attributable to any asset or category of assets over the economic life of that asset or category of assets (such real value being calculated as at the time the value of that asset or category of assets was first included in the regulatory asset base for the relevant distribution system) must be equivalent to the value at which that asset or category of assets was first included in the regulatory asset base for the relevant distribution system;
3) the economic life of the relevant assets and the depreciation methods and rates underpinning the calculation of depreciation for a given regulatory control period must be consistent with those determined for the same assets on a prospective basis in the distribution determination for that period.”7
Essentially the NERs require that the AER make a determination for each regulatory control period
on the value of the opening RAB and the forecast depreciation. The opening RAB is calculated in the
6 AEMC, National Electricity Rules, Version 65, 1 October 2014, pp. 659-660
7 AEMC, National Electricity Rules, Version 65, 1 October 2014, pp. 659-660

Review of Standard and Remaining Lives of Assets Advisian 12
RFM which requires the approved opening RAB of the prior regulatory control period to form the
basis for the calculation of the opening RAB for the next regulatory control period, with the following
adjustments applied.
(a) actual8 capital expenditure;
(b) actual9 depreciation; and
(c) actual10 CPI.
The roll forward mechanism to determine the opening asset base in the RFM, and ex-ante
determination of the regulatory depreciation component of revenue is illustrated in Figure 4-1 below.
Figure 4-1 - RFM Model Depreciation Deduction and Capital Expenditure Addition (Illustrative Only)
Source: Advisian
Once the opening RAB is calculated, the year on year depreciation revenue building block for the next
regulatory control period is calculated in the AER’s PTRM. As depicted in Figure 4-2, this model
effectively:
(a) Calculates a straight line depreciation component on the remaining lives of each asset class
within the existing opening RAB11; and
8 In accordance with AEMC, National Electricity Rules, Version 65, 1 October 2014, Clause 6.12.3. pp. 711-712Advisian notes that
the AER retains some discretion to approve either actual or forecast depreciation for regulatory purposes. Historically actual
regulatory depreciation has been used in the majority of cases.
9 ibid
10 ibid
11 Electricity distribution network service providers Post-tax revenue model handbook June 2008

Review of Standard and Remaining Lives of Assets Advisian 13
(b) Adds the depreciation associated with the forecast capex at the beginning of each regulatory
year within the control period as estimated at the installation date of the asset.12
Within the PTRM, adjustments are made to the regulatory depreciation allowance for new capex to:
(a) Apply a half-real vanilla WACC to compensate for the six-month period before capex is
included in the RAB13;
(b) Increase the RAB by CPI to maintain the real value of the RAB; and
(c) Reduce the nominal value of the RAB to reflect return of capital through the regulatory
depreciation building block allowance14.
The key assumptions that underlie these operations are discussed in the following section.
Figure 4-2 - Return of Asset PTRM Building Block (Illustrative Only)
Source: Advisian
In addition to the requirements of the NER rule 6.5.515, under Schedule S6.1.3 Additional
Information and Matters (12)16 the NERs also require the following additional information regarding
its proposed depreciation profiles in submission of its building block proposal:
12 ibid
13 Electricity distribution network service providers Post-tax revenue model handbook June 2008 - Rolling forward the RAB and
depreciation p11-12
14 ibid
15 AEMC, National Electricity Rules, Version 65, 1 October 2014, pp. 659-660
16 AEMC, National Electricity Rules, Version 65, 1 October 2014, pp. 745-746

Review of Standard and Remaining Lives of Assets Advisian 14
“S6.1.3 Additional information and matters
12) the depreciation schedules nominated by the Distribution Network Service Provider for the
purposes of clause 6.5.5 , which categorise the relevant assets for these purposes by
reference to well accepted categories such as:
(i.) asset class (e.g. distribution lines and substations); or
(ii.) category driver (e.g. regulatory obligation or requirement, replacement, reliability,
net market benefit, and business support), together with:
(iii.) details of all amounts, values and other inputs used by the Distribution Network
Service Provider to compile those depreciation schedules;
(iv.) a demonstration that those depreciation schedules conform with the requirements
set out in clause 6.5.5(b); and
(v.) an explanation of the calculation of the amounts, values and inputs referred to in
subparagraph (iii);
This effectively requires all data and qualifications to be provided with the regulatory submission
PTRM in support of the calculation of asset lives and aggregated asset categories, for determination
of the regulatory depreciation schedules and allowances.
4.2 Objective of the Depreciation Building Block Allowance
The depreciation building block allowance enables the DNSPs to recover, over the life of the assets,
the cost of the capital expenditure employed in engineering and constructing the transmission and
distribution power networks. The calculation of the standard life over which capital expenditure is
depreciated, in accordance with the NERs 6.5.5 (b) (1), (2) & (3)17, requires that the determination of
the depreciation schedule of any particular asset or class of assets must conform to the following:
1) Must depreciate using a profile that reflects the nature of the assets or category of assets over
their economic life;
2) Must be equivalent to the real value at which that asset or category of assets was first included
in the regulatory asset base;
3) The economic life and the depreciation rates must be consistent with those determined for the
same assets on a prospective basis in the distribution determination for that period.
Each clause of the above rules allow the DNSPs to expense the assets over a period reflective of the
life for which the asset provides economic value to the network and customers, as well as ensuring
protection of network consumers from over recovery of asset value or significant step changes in
17 AEMC, National Electricity Rules, Version 65, 1 October 2014, pp. 659-660

Review of Standard and Remaining Lives of Assets Advisian 15
depreciation expense as a result of disposal or devaluation of assets with significant residual value in
the RAB.
Advisian’s interpretation of the rule requirements and its intended purpose is that an asset or
category of assets depreciation schedule should be aligned closely to the period of time that:
(a) The DNSPs can accurately account that the assets are providing economic value to network
consumers;
(b) The assets were installed to meet a particular network demand or economic activity; and
(c) Minimises asset stranding risk in which future customers may be charged for current network
investment.
On this basis, Advisian considers that the rules recognise the need for, and accommodate the
adjustment to standard and remaining lives over the life of network assets. This is subject to
submission of appropriate supporting information in accordance with Schedule 6.1.318 and the AER’s
approval as part of its regulatory determination.
4.3 Key Assumptions
The following section discusses the key assumptions which underpin the AER’s processes embedded
in the RFM and PTRM calculations. Figure 4-3 below illustrates the regulatory revenue building
blocks calculated in the PTRM, for which each DNSP must provide evidence to substantiate its
annual revenue requirement for each regulatory year of the regulatory control period in accordance
with NER 6.3 Building block determinations19.
18 AEMC, National Electricity Rules, Version 65, 1 October 2014, pp. 745-746
19 AEMC, National Electricity Rules, Version 65, 1 October 2014, Part C Building Block Determinations for Standard Control
Services pp. 650-690

Review of Standard and Remaining Lives of Assets Advisian 16
Figure 4-3 - PTRM Building Block Annual Revenue Requirement (Illustrative Only)
Source: Advisian summary of Electricity distribution network service provider’s Post-tax revenue model
As highlighted in Figure 4-3 the standard life and remaining life assumptions directly impact the
Return of Assets building block, and indirectly affect the Return on Assets building block through the
effect of regulatory depreciation on the RAB. The following key assumptions form the basis for
calculation of the regulatory depreciation, and the impact each has on the building blocks within a
DNSPs annual revenue allowance.
4.3.1 Standard Lives
The RFM and PTRM require the input of standard lives20 for each high level asset class used by the
business (e.g. sub-transmission lines and cables, substations, transformers). These are fixed for a
regulatory control period and used to calculate the depreciation allowance attributable to historical
actual (RFM) and forecast (PTRM) capital expenditure over the period.
The PTRM Handbook 2008 defines an asset class’ standard life as “how long the infrastructure
would physically last had it just been built”21. The RFM handbook requires that standard lives “must
accord with those used in the previous distribution determination”22, furthermore, any changes to
the standard lives (or remaining lives) that is proposed by the DNSP’s is subject to AER review and
acceptance23. Table 4-1 details the standard lives of each of the Networks NSW businesses as set in
the AER draft decision.
20 Electricity distribution network service providers Post-tax revenue model handbook June 2008 2.1 Input Sheet- Standard Life
p7
21 ibid
22 Electricity distribution network service providers Roll forward model handbook June 2008 – Standard Life p5
23 Final decision New South Wales distribution determination 2009–10 to 2013–14 28 April 2009 10.4.2 Updating input data
p214-215
Review of Standard and Remaining Lives of Assets Advisian 17
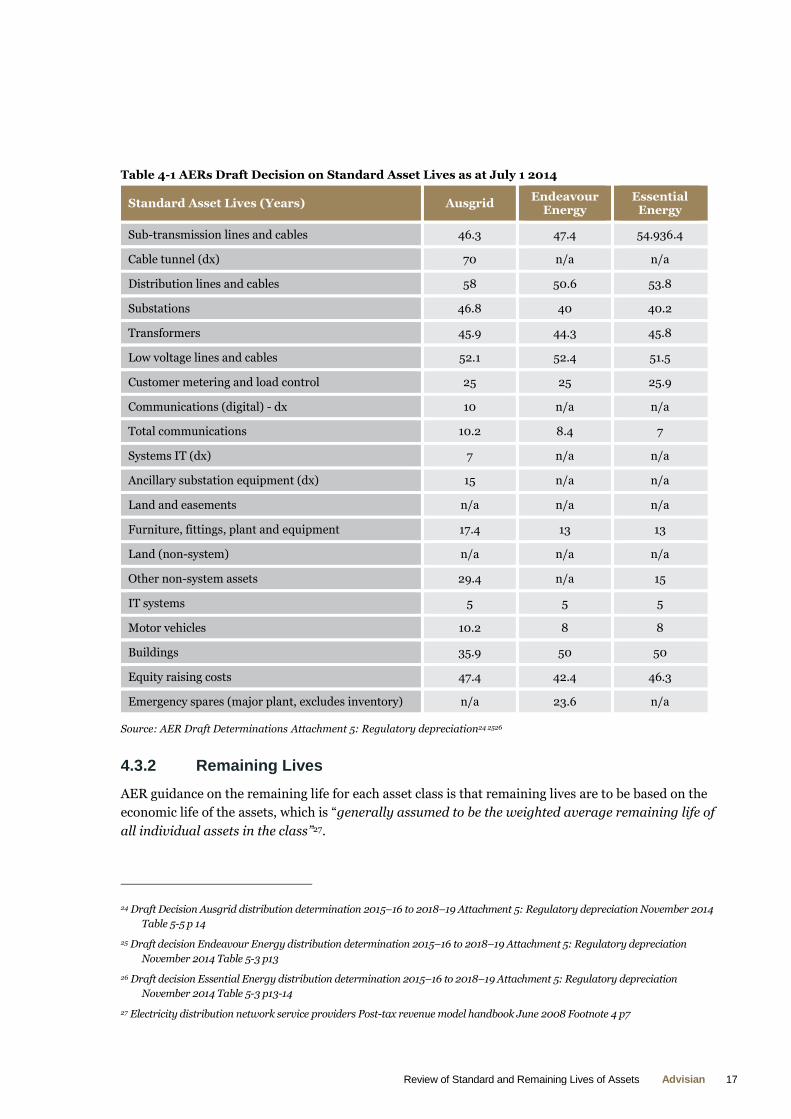
Table 4-1 AERs Draft Decision on Standard Asset Lives as at July 1 2014
Standard Asset Lives (Years) Ausgrid Endeavour
Energy Essential
Energy
Sub-transmission lines and cables 46.3 47.4 54.936.4
Cable tunnel (dx) 70 n/a n/a
Distribution lines and cables 58 50.6 53.8
Substations 46.8 40 40.2
Transformers 45.9 44.3 45.8
Low voltage lines and cables 52.1 52.4 51.5
Customer metering and load control 25 25 25.9
Communications (digital) - dx 10 n/a n/a
Total communications 10.2 8.4 7
Systems IT (dx) 7 n/a n/a
Ancillary substation equipment (dx) 15 n/a n/a
Land and easements n/a n/a n/a
Furniture, fittings, plant and equipment 17.4 13 13
Land (non-system) n/a n/a n/a
Other non-system assets 29.4 n/a 15
IT systems 5 5 5
Motor vehicles 10.2 8 8
Buildings 35.9 50 50
Equity raising costs 47.4 42.4 46.3
Emergency spares (major plant, excludes inventory) n/a 23.6 n/a
Source: AER Draft Determinations Attachment 5: Regulatory depreciation24 2526
4.3.2 Remaining Lives
AER guidance on the remaining life for each asset class is that remaining lives are to be based on the
economic life of the assets, which is “generally assumed to be the weighted average remaining life of
all individual assets in the class”27.
24 Draft Decision Ausgrid distribution determination 2015–16 to 2018–19 Attachment 5: Regulatory depreciation November 2014
Table 5-5 p 14
25 Draft decision Endeavour Energy distribution determination 2015–16 to 2018–19 Attachment 5: Regulatory depreciation
November 2014 Table 5-3 p13
26 Draft decision Essential Energy distribution determination 2015–16 to 2018–19 Attachment 5: Regulatory depreciation
November 2014 Table 5-3 p13-14
27 Electricity distribution network service providers Post-tax revenue model handbook June 2008 Footnote 4 p7

Review of Standard and Remaining Lives of Assets Advisian 18
As depicted in Figure 4-4, current regulatory RFM treatment calculates remaining asset lives based
on the depreciated value of assets forming the RAB. The value weighted average of the opening RAB
remaining life and the actual annual capex multiplied by the respective asset class standard life result
in a roll forward remaining life for each asset class to be included in the PTRM. In accordance with
the Distribution Roll Forward Model Handbook the standard life for each asset class “must accord
with those used in the previous distribution determination”28.
Figure 4-4 - RFM Remaining Life Calculation (Illustrative Only)
Source: Advisian
Table 4-2 details the remaining lives of each of the Networks NSW businesses as set in the AER draft
decision.
Table 4-2 - AERs Draft Decision on Remaining Asset Lives as at July 1 2014
Remaining Asset Lives (Years) Ausgrid Endeavour
Energy Essential
Energy
Sub-transmission lines and cables 32.9 31.7 36.4
Cable tunnel (dx) 67.4 n/a n/a
Distribution lines and cables 46.8 38.3 42.3
Substations 34.8 28.2 25.2
Transformers 30.5 24.6 26.7
Low voltage lines and cables 40 27 28.9
28 Electricity distribution network service providers Roll forward model handbook June 2008 Standard Life p5

Review of Standard and Remaining Lives of Assets Advisian 19
Remaining Asset Lives (Years) Ausgrid Endeavour
Energy Essential
Energy
Customer metering and load control 14.5 23.1 19.9
Communications (digital) - dx 5.6 n/a n/a
Total communications 3.1 6.9 5.6
Systems IT (dx) 4.9 n/a n/a
Ancillary substation equipment (dx) 12.4 n/a n/a
Land and easements n/a n/a n/a
Furniture, fittings, plant and equipment 12.5 8.1 8.4
Land (non-system) n/a n/a n/a
Other non-system assets 7.7 n/a 13.4
IT systems 3.3 3.5 3.6
Motor vehicles 6.3 5.7 5.1
Buildings 30 44.8 47.6
Equity raising costs 43.4 37 44.7
Emergency spares (major plant, excludes inventory) n/a 12.9 n/a
Source: AER Draft Determinations Attachment 5: Regulatory depreciation293031
4.3.3 Asset Classes
The PTRM is structured based on asset categorisations which are presented at a more aggregated
level than the asset categories used for internal asset management purposes and as required to
populate the AER’s annual RIN, Category Analysis RIN, Economic Benchmarking RIN and Repex
models. Whilst there is facility in the PTRM to accommodate a larger number of asset classes, in
practice a substantial change to asset categorisations would be difficult due to the need to reconcile
historical asset categories and revise internal systems to report on a different basis.
As the asset classes used for calculation of regulatory depreciation allowance are not consistent with
the discrete asset classes used for other regulatory expenditure assessment or asset management
purposes, there is an inherent inconsistency across NEM DNSPs in the aggregation of asset classes,
as well as the correlation between how assets are expensed for regulatory purposes and the actual end
of life at which an asset will be replaced or disposed.
In accordance with the capital weighted average calculation of remaining asset lives for regulatory
depreciation purposes as depicted in Figure 4-4, the aggregated regulatory asset classes on both a
29 Draft Decision Ausgrid distribution determination 2015–16 to 2018–19 Attachment 5: Regulatory depreciation November 2014
Table 5-5 p 14
30 Draft decision Endeavour Energy distribution determination 2015–16 to 2018–19 Attachment 5: Regulatory depreciation
November 2014 Table 5-3 p13
31 Draft decision Essential Energy distribution determination 2015–16 to 2018–19 Attachment 5: Regulatory depreciation
November 2014 Table 5-3 p13-14
Review of Standard and Remaining Lives of Assets Advisian 20
regulatory and accounting perspective should align such that by calculating the remaining life by
multiplying regulatory standard asset lives and capital expenditure, the weightings within each
regulatory category are matched, and remain consistent as a result of capital additions or disposals,
essentially ensuring that the regulatory treatment can be reconciled to accounting treatment.
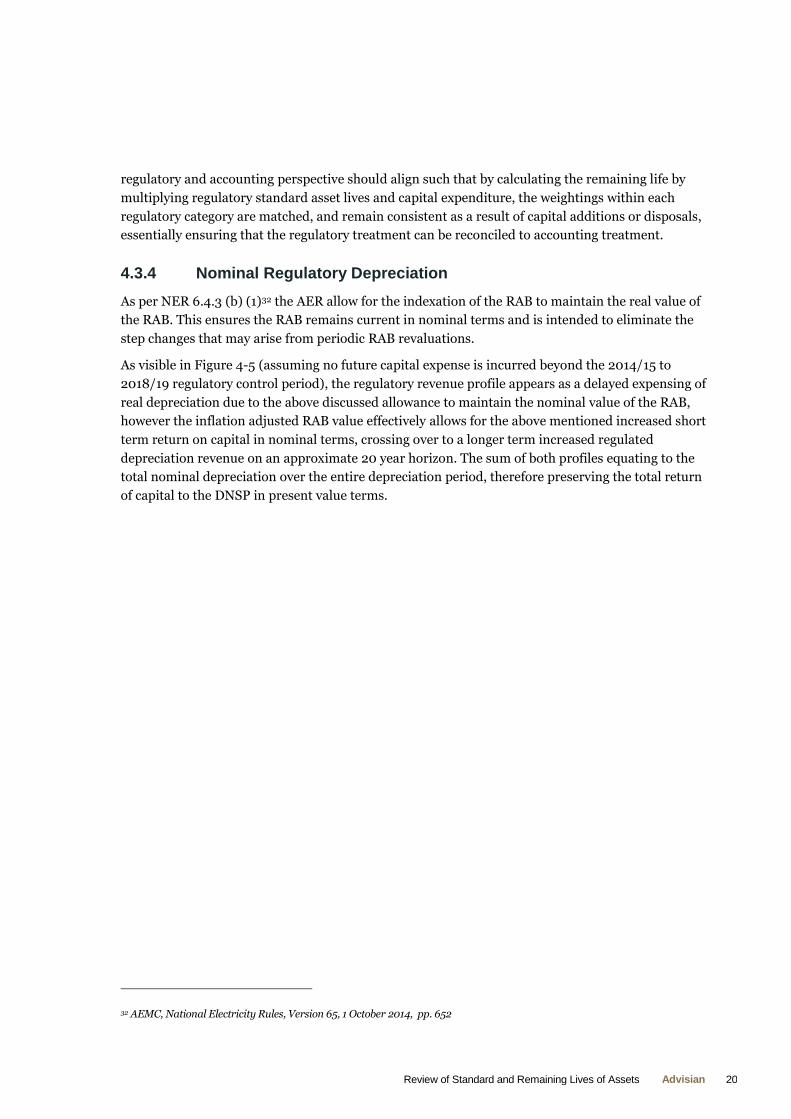
4.3.4 Nominal Regulatory Depreciation
As per NER 6.4.3 (b) (1)32 the AER allow for the indexation of the RAB to maintain the real value of
the RAB. This ensures the RAB remains current in nominal terms and is intended to eliminate the
step changes that may arise from periodic RAB revaluations.
As visible in Figure 4-5 (assuming no future capital expense is incurred beyond the 2014/15 to
2018/19 regulatory control period), the regulatory revenue profile appears as a delayed expensing of
real depreciation due to the above discussed allowance to maintain the nominal value of the RAB,
however the inflation adjusted RAB value effectively allows for the above mentioned increased short
term return on capital in nominal terms, crossing over to a longer term increased regulated
depreciation revenue on an approximate 20 year horizon. The sum of both profiles equating to the
total nominal depreciation over the entire depreciation period, therefore preserving the total return
of capital to the DNSP in present value terms.
32 AEMC, National Electricity Rules, Version 65, 1 October 2014, pp. 652

Review of Standard and Remaining Lives of Assets Advisian 21
Figure 4-5 - Regulatory Depreciation Profile
Source: Advisian analysis of Ausgrid PTRM
The AER’s explanation in each of the Draft Decision’s333435, is that the above described methodology
enables the NEM DNSPs to share in the benefit of an increasing RAB value over time, whilst
preventing over compensation via the depreciation building block in accordance with NER 6.5.5. (b)
(2)36. This approach however, results in the ‘back-ending’ of nominal cash flows in relation to asset
depreciation expense. This further exposes future customers to increased prices as a result of the
sharp increase in nominal regulatory depreciation revenue that is visible in Figure 4-5 (noting that no
allowance for future investment has been made in the analysis).
4.3.5 Benchmark Tax Lives
The PTRM recognises that assets may be depreciated over a different life for the purpose of
calculating tax depreciation. Due to this distinction, the RFM and PTRM also calculate the value of
33 Draft Decision Ausgrid distribution determination 2015–16 to 2018–19 Attachment 5: Regulatory depreciation November 2014
5.4.1 Depreciation approach p11
34 Draft Decision Endeavour Energy distribution determination 2015–16 to 2018–19 Attachment 5: Regulatory depreciation
November 2014 5.4.1 Depreciation approach p11
35 Draft Decision Essential Energy distribution determination 2015–16 to 2018–19 Attachment 5: Regulatory depreciation
November 2014 5.4.1 Depreciation approach p11
36 AEMC, National Electricity Rules, Version 65, 1 October 2014, pp. 660

Review of Standard and Remaining Lives of Assets Advisian 22
the tax asset base and tax depreciation37. The tax lives for each asset class are “based on the tax life
specified by the Australian Tax Office (ATO) for the category of assets and commissioning date”38.
As tax depreciation affects the benchmark tax building block of a DNSP’s revenue but not the Return
of Assets (regulatory depreciation) building block Advisian has not considered tax lives further.
37 Electricity distribution network service providers Post-tax revenue model handbook June 2008 2.1 Input Sheet- Opening Tax
Value, Tax Remaining Life, Tax Standard Life p7
38 ibid

Review of Standard and Remaining Lives of Assets Advisian 23
5 Networks NSW Data
This section considers the asset life data provided by the Networks NSW businesses in response to
the following questions in the Terms of Reference.
2) What are the existing commonalities/differences across each Networks NSW business and the
NEM DNSPs for the calculation of asset class standard and remaining useful lives? Is there
scope for common practices between Networks NSW businesses in the adoption of asset class
lives and what impact might a change in practice have on each businesses regulatory
submission?
3) What are the existing commonalities/differences across each Networks NSW business in
alignment between the engineering, regulatory and accounting lives of asset classes? Is there
scope for commonality of asset class lives across engineering, regulatory and accounting lives
and what impact might a change in practice have on each businesses practices and regulatory
submission?
The following Section 5.1 summarises the sources of asset life information used by the businesses.
Section 5.2 describes the key issues identified by Advisian, with respect to each of the key
assumptions which underpin the calculation of the regulatory depreciation building block allowance
within both the RFM and PTRM.
5.1 Existing Sources of Asset Life Information
The Networks NSW businesses necessarily use a number of sources of asset lives used in the
operation of their businesses. As these are used for different purposes, they are typically categorised
differently to align with accounting, tax and business reporting requirements as well as to respond to
different regulatory functions39. Table 5-1 summarises the sources of asset life information that are
used for regulatory purposes.
Table 5-1 – Sources of Asset Life Data
Ausgrid Endeavour Energy Essential Energy
Statutory Accounts Remaining Lives calculated on written down value weighted average of standard
lives from 2004 Optimised Depreciated Replacement Cost (ODRC) treasury
guidelines40.
Standard Lives brought forward from previous regulatory approved values as per
New South Wales Treasury Guidelines on Valuation of Electricity Network
Assets41.
Categories recorded in Fixed Assets Register and aggregated to regulatory
39 For example, RAB v capex/Opex/ forecasting purposes
40 Networks NSW provided data
41 Valuation of Electricity Network Assets A Policy Guideline for New South Wales Distribution Network Service Providers July
2001February 2004 Table 1 Table of Standard Replacement Costs and Effective Lives

Review of Standard and Remaining Lives of Assets Advisian 24
Ausgrid Endeavour Energy Essential Energy
categories.
Regulatory Asset Base Remaining Useful Lives calculated in RFM.
Standard Lives brought forward from previous approved PTRM.
Categories aligned to categories historically reported to the AER.
Regulatory Tax Asset
Value
Remaining Tax Lives calculated in RFM.
Weighted average of ATO Standard Tax Lives.42
Categories aligned to categories recorded in Fixed Assets Register and aggregated
to regulatory categories.
Engineering and
Expenditure Planning
Maintenance and Asset
Management from business
database/GIS/ Historical Registers.
Economic Lives for annual
regulatory reporting from business
database/GIS/ Historical Registers
including replacements, failures,
augmentation.
Categories aligned to business
structure and role responsibilities.
Standard Lives (Planning).
Economic Lives (Maintenance and Asset
Management).
Categories aligned to business structure and
role responsibilities.
Source: Advisian, Networks NSW
For clarity, Advisian has outlined the purpose that each of the asset life information plays in the
calculation of a DNSP’s regulated revenue.
Table 5-2 - Regulatory Purpose of Asset Life Information
Remaining Useful Lives Standard Lives
Statutory Accounts Calculation of the remaining
depreciation for existing assets.
Calculate the value of depreciation
associated with new assets.
Regulatory Accounts Calculation of the remaining regulatory
depreciation for the opening RAB in the
PTRM.
Calculate the value of regulatory
depreciation associated with new
assets.
42 Electricity distribution network service providers Post-tax revenue model handbook June 2008 2.1 Input Sheet- Opening Tax
Value, Tax Remaining Life, Tax Standard Life p7

Review of Standard and Remaining Lives of Assets Advisian 25
Remaining Useful Lives Standard Lives
Benchmark Tax Calculation of the remaining tax
depreciation for the benchmark tax
building block.
Calculation of tax depreciation
associated with new assets for the
benchmark tax building block.
Engineering Planning and managing asset replacement, maintenance and augmentation
requirements.
Source: Advisian
Advisian notes that our analysis is limited to the regulatory treatment of asset lives for the purpose of
calculating the return of assets building block. We have not considered, and do not provide an expert
opinion, on taxation treatment or statutory accounting matters.
5.2 Key Issues Identification and Evaluation
Based on Advisian’s review and evaluation of the AER methodologies and information provided by
the Networks NSW businesses, we have identified four key issues relating to the application of asset
lives and the regulatory treatment of remaining asset lives for the purpose of calculating the
regulatory depreciation allowance building block. These are:
1) Definition of economic life;
2) Use of standard life as a proxy for economic life;
3) Calculation of remaining life; and
4) Categorisation of assets.
The following sections discuss the impact of each of these issues on the calculation of the regulatory
depreciation expense that is included in the networks NSW businesses revenue allowance.
5.2.1 Economic Life
Advisian notes that NER 6.5.543 requires that regulatory depreciation is calculated such that:
1) The schedules must depreciate using a profile that reflects the nature of the assets or category
of assets over the economic life of that asset or category of assets44;
2) The sum of the real value of the depreciation that is attributable to any asset or category of
assets over the economic life must be equivalent to the value at which that asset or category of
assets was first included in the regulatory asset base45; and
43 AEMC, National Electricity Rules, Version 65, 1 October 2014, pp. 659-660
44 AEMC, National Electricity Rules, Version 65, 1 October 2014, 6.5.5 (b)(1) p.660
45 AEMC, National Electricity Rules, Version 65, 1 October 2014, 6.5.5 (b)(2) p.660

Review of Standard and Remaining Lives of Assets Advisian 26
3) The economic life of the relevant assets and the depreciation methods and rates must be
consistent with those determined for the same assets on a prospective basis in the distribution
determination for that period46.
The reliance of the rules on the use of the economic life rather than standard life acknowledges the
difficulty in estimating a single standard life for electricity distribution assets. For instance, a
substation can be comprised of several assets which have separate discrete lives when viewed in
isolation. These include transformers, civil works, switchgear, secondary systems, conductors,
structures and buildings, yet as a group, ‘substations’ are assigned a standard life of approximately
40-50 years across NEM DNSPs for regulatory depreciation purposes.
Consequently the aggregation of asset classes for regulatory depreciation purposes must adequately
weight the capital value and standard lives of all subset assets, such that the depreciation schedule of
a category represents the overall economic life and provides an appropriately timed expensing of the
capital invested.
5.2.2 Standard Life as a proxy for Economic Life
In accordance with the detail in Section 4.3.1 of the current regulatory treatment of standard asset
lives, Advisian understands that the NER 6.5.5 (b) (1) & (2), and the PTRM and RFM handbooks,
requires that the calculation of standard lives reflects the nature of the assets, and how long the
infrastructure would be expected to last had it just been built47. Standard lives are used as an
approximation of installed asset life for the calculation of the depreciation of forecast capex over the
forecast regulatory control period, and calculation of the roll-forward remaining lives within the
RFM.
In accordance with the following definition of economic life within the AERs Explanatory Statement
–Final Category Analysis RINs:
“An asset’s economic life is the estimated period after installation of the asset during which the asset
will be capable of delivering the same effective service as it could at its installation date”48
In addition to the following statement of the requirements for AER annual RIN reporting:
We note the term ‘standard life’ is interchangeable with the term ‘economic life’. In the final RINs we
have replaced references to ‘standard life’ with ‘economic life’49.
Given the AER’s clarification for RIN purposes that economic life and standard life should be read
interchangeably, the application of an asset’s useful economic life based on network data collected
annually by each of the DNSPs represents a reasonable approach for forecasting the period of time
that a category of assets can be expected to provide useful economic benefit to customers.
46 AEMC, National Electricity Rules, Version 65, 1 October 2014, 6.5.5 (b)(3) p.660
47 Electricity distribution network service providers Post-tax revenue model handbook June 2008 2.1 Input Sheet- Standard Life
p7
48 Better regulation Explanatory statement Final regulatory information notices to collect information for category analysis
March 2014 p56
49 ibid

Review of Standard and Remaining Lives of Assets Advisian 27
The standard and remaining lives in the RFM and PTRM have been continuously rolled forward from
the historical depreciated value weighted average calculations conducted using Standard Lives from
the 2004 NSW Treasury Guidelines on the Valuation of Electricity Network Assets, within which the
Standard Lives had “been derived from industry experience including an ESAA Member Survey in
2000”50. Consequently the standard lives in the Networks NSW businesses RFM and PTRM are not
aligned to the lives that are being experienced in practice, as captured in the DNSPs’ asset
management information systems.
Figure 5-1 - RAB Standard Lives across NEM DNSPs
Source: Advisian mapping of DNSP RIN Submission data
50 New South Wales Treasury Valuation of Electricity Network Assets A Policy Guideline for New South Wales Distribution
Network Service Providers February 2004 3.5.1 Standard Effective Lives
AusgridEndeavour
Energy
Essential
EnergyErgon Energex Jemena SPAusNet CitiPower PowerCor
United
Energy
SA Power
NetworksAurora ActewAGL
TABLE 3.3.4 - ASSET LIVESService Life
(Years)
Service Life
(Years)
Service Life
(Years)
Service Life
(Years)
Service Life
(Years)
Service Life
(Years)
Service Life
(Years)
Service Life
(Years)
Service Life
(Years)
Service Life
(Years)
Service Life
(Years)
Service Life
(Years)
Service Life
(Years)
Table 3.3.4.1 Asset Lives –
estimated service life of
new assets
2013-14 2012-13 2013-14 2012-13 2012-13 2012-13 2012-13 2012-13 2012-13 2012-13 2012-13 2012-13 2012-13
Overhead network
assets less than 33kV
(wires and poles) 55.327 49.397 53.000 48.200 45.000 64.130 47.000 49.100 50.900 35.600 55.000 35.000 62.600
Underground network
assets less than 33kV
(cables) 57.278 60.000 54.000 58.500 60.000 46.670 55.000 49.100 50.900 35.600 55.000 60.000 48.000
Distribution substations
including transformers46.696 41.474 45.000 44.900 40.100 45.580 62.000 49.100 50.900 35.600 45.000 40.000 72.800
Overhead network
assets 33kV and above
(wires and towers / poles
etc) 47.501 56.673 55.000 52.800 50.500 62.470 54.000 49.100 50.900 60.000 55.000 50.000
Underground network
assets 33kV and
above(cables, ducts etc) 45.899 45.000 54.000 45.000 45.000 40.000 55.000 49.100 50.900 60.000 55.000 60.000
Zone substations and
transformers 46.244 45.491 46.000 39.800 49.900 39.270 57.000 49.100 50.900 60.000 45.000 40.000 48.100
Meters 25.000 26.000 16.300 5.000
“Other” assets with long
lives 17.809 49.771 24.000 29.100 24.700 65.929 11.700 14.900 7.500 18.902 40.000
“Other” assets with
short lives 6.421 6.595 7.000 6.800 7.800 11.692 5.000 6.000 6.000 5.000 5.000 5.028
Table 3.3.4.2 Asset Lives –
estimated residual service
life
2013-14 2012-13 2013-14 2012-13 2012-13 2012-13 2012-13 2012-13 2012-13 2012-13 2012-13 2012-13 2012-13
Overhead network
assets less than 33kV
(wires and poles) 43.501 41.130 21.412 25.200 27.300 32.610 23.000 22.850 26.925 21.500 15.645 15.300 20.400
Underground network
assets less than 33kV
(cables) 46.133 52.601 33.139 48.000 45.900 34.500 43.000 22.850 26.925 21.500 12.884 38.783 26.000
Distribution substations
including transformers33.942 34.880 20.209 29.200 30.400 27.550 39.000 22.850 26.925 21.500 18.981 18.763 33.400
Overhead network
assets 33kV and above
(wires and towers / poles
etc) 33.750 47.201 21.677 27.200 37.400 39.550 29.000 22.850 26.925 24.000 21.210 31.038 26.900
Underground network
assets 33kV and above
(cables, ducts etc) 34.741 35.252 34.017 36.900 32.700 30.000 43.000 22.850 26.925 24.000 21.210 37.908 49.300
Zone substations and
transformers 34.657 39.513 15.242 26.100 37.100 18.330 29.000 22.850 26.925 24.000 18.981 12.967 27.200
Meters 14.196 1.883 10.800 4.189 3.935 5.000 19.000
“Other” assets with long
lives 10.673 40.093 19.465 17.400 19.000 46.243 6.110 8.286 7.500 7.080 24.064
“Other” assets with
short lives 4.444 3.435 1.001 3.300 5.100 7.439 2.764 5.613 3.934 5.000 1.893 1.000
Network services

Review of Standard and Remaining Lives of Assets Advisian 28
Similarly, as depicted in Figure 5-1 the standard lives as included in the current RAB asset lives tend
to materially overstate the lives for similar assets when compared to other NEM DNSP’s.
Therefore Advisian considers that the Network NSW businesses should move to align the standard
lives used for depreciation purposes with the actual asset life data captured for recent regulatory
reporting purposes.
5.2.3 Calculation of Remaining Life
As discussed in Section 4.3.2, the remaining life for each asset class forms the basis for calculation of
the regulatory depreciation of the existing asset base in the PTRM. The calculation of the remaining
lives as depicted in Figure 4-4 is conducted in the RFM using the weighted average of the opening
RAB value multiplied by the remaining opening asset life and the standard lives of each asset class51
multiplied by the capital installed during the respective regulatory period.
Advisian understands that the requirements of NER 6.5.5 (b) (1) & (2), and the PTRM and RFM
handbooks, requires that the calculation of remaining asset lives reflects the distribution of
remaining life of existing and new assets and the depreciated value of those assets.
Additionally the requirement that the standard lives applied in the calculation of remaining lives for
each asset class “must accord with those used in the previous distribution determination”52,
essentially represents a forecast of standard life as at the beginning of the previous period.
The AER roll-forward model should ensure that on a regulatory control period timeframe, each
DNSP RAB and the remaining life of the assets which comprise the RAB, are maintained such that
network revaluations or write-downs do not occur as a result of the regulatory determination process.
Furthermore, the application of standard lives that were determined at the commencement of the
previous 5 year period is inconsistent with:
(a) historical AER review and acceptance53 of the inclusion of actual capital expenditure rather
than forecast capital expenditure in the weighted calculation of remaining asset class lives; and
(b) the AER’s recent Better Regulation program 54 guidance to DNSPs to align practices and
incorporate real world data, as a “deeper data set 55 ”, to more accurately determine
replacement capex and report network activity.
As shown in Figure 5-2, the effect of applying the legacy standard lives, which are greater than those
reported in the category analysis RIN data, to the actual capital expenditure is a significant increase
in the remaining asset lives calculated in the RFM. Across the 5 most significant asset classes (in
regulatory depreciation terms) the longer legacy standard life assumption increases the remaining
51ibid
52 Electricity distribution network service providers Roll forward model handbook June 2008 - Standard Life p5
53 Final decision New South Wales distribution determination 2009–10 to 2013–14 28 April 2009 10.4.2 Updating input data
p214-215
54 AER Better regulation Explanatory statement Final regulatory information notices to collect information for category analysis
March 2014
55 AER Better regulation Explanatory statement Final regulatory information notices to collect information for category analysis
March 2014 5.2 Reasons for AER position p49

Review of Standard and Remaining Lives of Assets Advisian 29
life substantially (on average of 27% over the prior 5 year period) and creates a significant extension
of asset depreciation schedules.
Figure 5-2 - 2014-19 Roll Forward Model Remaining Life Increase
Source: Ausgrid Proposal – Ausgrid -4.03 Ausgrid RAB – Distribution 2014
The much longer legacy standard lives have been included in the RFM calculation of the opening lives
for the 2014/15 to 2018/19 regulatory control period. Consequently, due to the significant recent
investment in the network, this results in a depreciation profile that does not align with the
businesses actual experience, and spreads costs primarily caused by current customers recent
augmentation requirements to be borne by future customers, over a time period where it is unlikely
that they will still be receiving an economic benefit as retaining longer lives will ultimately result in
future asset write-downs.
Therefore Advisian has identified that:
(a) the scale of investment in the network during the previous regulatory control period; and
(b) the misalignment between the Networks NSW businesses standard life assumptions
is such that the use of legacy standard life assumptions is likely to have a material and long term
impact on the calculation of remaining life. As a result, it is preferable (subject to AER acceptance) to
apply an adjustment to the remaining life of assets installed over the last regulatory control period to
avoid entrenching an excessively long asset life assumption in the remaining life that is carried
forward to subsequent regulatory control periods.
Similarly, as per the inclusion of actual capital expenditure rather than forecast capital expenditure to
inform the weighted average calculation of remaining asset class lives, it is also reasonable that
standard lives as recorded by the Networks NSW businesses during the previous five year regulatory

Review of Standard and Remaining Lives of Assets Advisian 30
period are also used to inform the calculation of remaining lives in the RFM. Representing the actual
standard (economic) lives experienced by the businesses.
5.2.4 Categorisation of Assets
As noted in Section 4.3, there are currently inconsistencies between asset classes used for statutory,
tax, regulatory, management and technical reporting. Whilst this is not unexpected, it arises from the
need for asset life estimates to fulfil a range of business purposes, which may not be aligned to the
categories used in the PTRM and RFM to track the RAB values. The aggregate regulatory
determination asset classes in comparison to those reported in the annual regulatory RINs, which
provide detail at a much more granular level, do not align, consequently this does not support like for
like comparison across DNSPs.
Investigation of the weighted average calculation undertaken by each of the Networks NSW
businesses in calculating standard lives in the ODRC as described in 5.2.2, reveals current accounting
asset classes are aligned to the same discrete asset classes in the ODRC. Documented mapping tables
have also been created to align the accounting asset classes currently used by the businesses to the
regulatory asset categories.
In evaluation of the discrete asset classes utilised in the ODRC to the asset classes of the current
category analysis RIN, as depicted in Figure 5-3 a comparison can be drawn between to two sets of
asset classes such that the adoption of the economic lives within the category analysis RIN could
reasonably replace the standard asset lives adopted at the time of ODRC.
Figure 5-3 - Asset Class Categorisation Example (Illustrative Only)
A mapping of the two data sets demonstrates that the aggregation of the data as captured in the
category analysis RIN will reconcile the same assets from an asset management and engineering
•Pole •Conductor •Cable
ODRC
Distribution Lines & Cables
•Pole Mounted •Kiosk Mounted •Ground Mounted
ODRC
Transformers
•Circuit Breaker •Switch
ODRC
Substations
•22 kV Distribution Overhead Lines
•22kV Underground cable
RIN
Distribution Lines & Cables
•Pole •Kiosk •Ground
RIN
Transformers
• Group/Kiosk/Ground Substations (Excluding Transformers)
RIN
Substations

Review of Standard and Remaining Lives of Assets Advisian 31
perspective to the accounting categories within which capital additions and disposals and currently
captured.
Adoption of the economic lives as reported in the category analysis RIN in replacement of the
standard lives in the ODRC under an equivalent asset class aggregation provides for alignment of
current reported asset data without requirement to conduct a reconciliation of asset value attributed
across different asset classes. The utilisation of RIN categories aggregated to the regulatory categories
will additionally ensure visibility across NEM DNSPs of the economic lives which are forming the
regulatory standard lives.

Review of Standard and Remaining Lives of Assets Advisian 32
6 Alternative Approach Assessment
In response to the following questions in the Terms of Reference, this section considers the alternate
determination of asset life data for inclusion in each of the Networks NSW businesses building block
revenue models for the 2014/15-2018/19 regulatory revenue determination.
4) On what basis might the Networks NSW businesses adopt different asset class standard and
remaining useful lives which more closely align depreciation revenue to the expenditure
quantum and timing requirements of the businesses? And what business/network/customer
impact might this have on the regulated revenue requirement for each business?
As detailed in each of the previous sections of this report, current AER regulatory reporting practices
and Better Regulation program guidance require each of the NEM DNSPs to provide evidence to
substantiate actual and forecast network activity in support of a proposed allowable regulatory
control period revenue, it is therefore reasonable that the utilisation of the captured network data
shall further support revenue profiles more accurately reflecting network activity. The following
section details an assessment of alternate processes and applications in addressing the issues
identified in Section 5.2.
6.1 Network Data Determination of Asset Lives
As detailed in Sections 4 and 5 of this report, as a result of historical industry guidelines and
practices, regulatory arrangements, and incomplete network data, determination and treatment of
both standard and remaining asset lives has been set on industry guidelines and engineering
assumptions56.
Significant recent investments in improving electronic data capture, storage and utilisation, and
increasing regulatory emphasis on accuracy and reliability57 of data to support forecast expenditure
through the better regulation program guidance58, in addition to the AEMC rules which require that
“the schedules must depreciate using a profile that reflects the nature of the assets or category of
assets over the economic life of that asset or category of assets”, provides a case for utilisation of the
network data to inform the calculation of standard and useful remaining lives for the purpose of
calculation of regulatory depreciation.
6.2 Weighted Average Calculation of Asset Lives
As a result of the capital value weighted average calculation of remaining lives within the RFM at an
aggregate asset category level, the greater dollar value of recent capital expenditure extends the
estimated remaining life of existing assets, causing the depreciation schedule of the aging assets
within an aggregated asset class to extend beyond their actual economic useful remaining life.
56 New South Wales Treasury Valuation of Electricity Network Assets A Policy Guideline for New South Wales Distribution
Network Service Providers February 2004 3.5.1 Standard Effective Lives
57 Better Regulation Expenditure Forecast Assessment Guideline for Electricity Distribution November 2013 Accuracy and
reliability p15
58 ibid

Review of Standard and Remaining Lives of Assets Advisian 33
Advisian considered two alternate approaches to the determination of remaining useful asset lives:
1) Weighted average based on the volume of installed assets.
In this case, the aggregate installed asset volumes are input to the weighted average calculation
within the RFM rather than aggregate asset costs.
2) Calculation of remaining asset lives based on the asset age profile.
In this case, economic replacement lives from the annual category analysis RIN data are used
to derive a volume weighted installed asset age (calculated from the age profiles) which is then
subtracted from the respective asset class economic replacement lives to determine the
remaining expected lives of installed asset classes.
Following our analysis, Advisian considers that neither of these approaches is consistent with the
requirements of the NER on the following basis:
1) Weighted average based on the volume of installed assets.
As per the NERs rule 6.5.5. (a) (1) the depreciation for each regulatory year “must be
calculated on the value of the assets as included in the regulatory asset base”59. Therefore
indicating that as a weighted average calculation of remaining lives for depreciation
purposes, the calculation must be based on the asset value as included in the RAB.
Installed asset volumes do not accurately reflect each businesses capitalisation policy or
customer contributions of installed assets, therefore not accurately reconciling with the total
installed RAB value. Asset classes which are not categorised discreetly under an existing asset
category (e.g. pole top structures, cross-arms), or have been deducted from the RAB as
having been funded by customer contributions, will not accurately represent the capital
which should be returned to the DNSP.
Additionally, for non-discrete assets e.g. conductors and cables, total installed asset
quantities are not captured on a consistent basis to enable ‘like for like’ comparison across
businesses.
2) Calculation of remaining asset lives based on the asset age profile
Given historical depreciation schedules, as well as asset characteristics and maintenance
practices, many asset classes are older or nearing the current average economic replacement
age. This is particularly the case for distribution transformers where at a network aggregate
level, significant localised replacement volumes under recent augmentation projects have
seen many transformers replaced years earlier than they otherwise would have been replaced
under condition assessment. This activity can be seen as shortening the expected asset lives,
however, many existing distribution transformers still remain in adequate service in other
areas of the network.
Across multiple asset classes this effect may result in approximate remaining lives being
calculated at less than 5-10years for certain asset classes, effectively calling for significant
value write down on assets which are actually capable of providing network value for a
greater number of years.
59 AEMC, National Electricity Rules, Version 65, 1 October 2014, pp. 659-660

Review of Standard and Remaining Lives of Assets Advisian 34
6.3 Consistency across Networks NSW businesses
Following investigation of Networks NSW regulatory data, in addition to interviews undertaken with
representatives from each of the Networks NSW businesses, Advisian notes that the standard asset
lives as included in each of the respective original regulatory proposal PTRM’s had been calculated in
the 2004 IPART Cost Building Block Revenue Model based on value weighted averages of the 2004
NSW Treasury Guidelines Standard Asset Lives60. This demonstrates that a common set of standard
asset lives was accepted as a basis for all NSW distribution businesses based on shared network
experiences relevant to the period of time and availability of supporting data.
The 2004 Optimised Depreciated Replacement Cost valuation was used as the basis for the initial
valuation, with the remaining lives amended via the roll forward model in subsequent
determinations.
In accordance with the 5 year historical data requirements of the AER explanatory statement – final
category analysis RINs61, the data presented by most NEM DNSPs reflects that standard (economic)
lives have since been revised to reflect actual network data. Following a comparative assessment
against the other NEM DNSPs publicly available Category Analysis RIN data, both Endeavour
Energy62 and Essential Energy63 demonstrate consistently higher economic lives across the majority
of asset classes when compared to other NEM DNSP’s.
Ausgrid has identified in the category analysis basis of preparation64 a number of actual network
system data sources for the determination of economic lives across most of the material asset classes.
In each of their respective basis for preparation documents both Endeavour Energy65 and Essential
Energy66 have not provided detail on the calculation of asset class economic life, and on the basis of
interviews conducted with representatives from each of the business there has been an increasing
focus on utilisation of real network data, however for many of the large volume asset classes a further
number of years may be required prior to managing a data set of substantial size to support
calculation of the required information.
Therefore, Advisian considers that the data as determined by Ausgrid in its most recent category
analysis RIN in accordance with broader industry practice and the guidance provided in the AER’s
explanatory statement 67 provides a reasonable data set for the recalculation of a set of common
standard asset lives. In particular, this will align the Networks NSW businesses standard lives more
60 New South Wales Treasury Valuation of Electricity Network Assets A Policy Guideline for New South Wales Distribution
Network Service Providers February 2004 3.5.1 Standard Effective Lives
61 AER Better regulation Explanatory statement Final regulatory information notices to collect information for category analysis
March 2014
62 Endeavour 2012-13 - RIN response - Appendix 1b - RIN Non-financial templates - 13 December 2013 - PUBLIC.xls
63 Essential 2012-13 - RIN Response - Attachment 9 non-financial information - 13 December 2013 - PUBLIC.xlsx
64 Ausgrid Basis of Preparation Response to Category Analysis Regulatory Information Notice Submission date 31 October 2014
Template 5.2 – Asset age profiles p126-132
65 Basis of Preparation Endeavour Energy Response to AER Determination RIN Submission date: 30 May 2014
66 Essential Energy BASIS OF PREPARATION RESPONSE TO RESET RIN Version updated as at 29 May 2014
67 AER Better regulation Explanatory statement Final regulatory information notices to collect information for category analysis
March 2014

Review of Standard and Remaining Lives of Assets Advisian 35
closely with the approaches adopted by other DNSPs peer and in turn this will tend to reduce
reporting anomalies over time.
6.4 Treatment of Asset Categories
Advisian has investigated the annual Category Analysis RIN data and basis for preparation
documentation submitted to and approved by the AER, in addition to conducting a series of
interviews to determine the basis on which each Networks NSW business is collecting, aggregating
and inputting data into the annual regulatory reports and distribution determination.
As determined within the 2004 ODRC asset category weighted average calculation of standard lives,
on the basis of application of the mean economic lives as reported in the category analysis RIN in
replacement of the ODRC standard lives, with an equivalent asset class aggregation as described in
Section 5.2.4, Advisian considers a common mapping across each of the Networks NSW businesses of
the economic lives within the annual category analysis RIN to the regulatory categories to form the
basis for calculation of ‘Standard Lives’ applicable to each of the Networks NSW businesses for input
to the PTRM, additionally to be used for the calculation of the Remaining Asset Lives.
In accordance with the value weighted average calculation of aggregate standard lives in the ODRC,
and in alignment with application of real network economic replacement data forming the basis for
determining standard asset lives, Advisian considers that the aggregation of the discrete asset classes
in the category analysis RIN, for the purpose of calculating the standard lives for inclusion in the
regulatory models, is calculated via a Capex value weighted average as per the following.
Each of the businesses is required to report on historical and forecast replacement expenditure and
installation quantities, from which a replacement unit cost can be calculated. This unit cost is then
multiplied by the most recent 50 years installed quantities in the Category Analysis Age Profile Sheet,
representing a total installed weighting for each of the Repex asset classes, over the 50 year period for
which the network data is most accurately available. This methodology ensures economic
replacement activity and capital expenditure align, and further enables a weighting of installed
network assets which appropriately proportions the value of each asset class within its respective
aggregate regulatory asset category.

Review of Standard and Remaining Lives of Assets Advisian 36
7 Conclusion
In addressing each of the key issues as detailed in Section 6, the following section concludes
Advisian’s recommendations for amendment of standard and remaining asset lives for the following
four regulatory asset classes as used in the calculation of regulatory depreciation within the PTRM.
This section also concludes Advisian evaluation of the resultant impact the revised asset lives will
have on each of the Networks NSW regulatory revenue requirements.
1) Sub-transmission lines and cables;
2) Distribution lines and cables;
3) Transformers; and
4) Low voltage lines and cables.
7.1 Calculation of Asset Lives
7.1.1 Standard Asset Lives
Following evaluation of the key issues as discussed in Section 5.2, and comparative assessment
against the current regulatory reported economic asset lives of NEM DNSP peers as detailed in Figure
5.1, Advisian considers that a robust and prudent case exists for the calculation of standard asset lives
of the four asset classes listed in Section 7 from a weighted average of the category analysis RIN mean
economic asset lives, on the basis that economic lives as standard lives, represent the nature of the
assets as currently experienced within each of the network businesses.
Advisian recommends that the standard and remaining asset lives of the four asset classes listed
above are to be amended, as the asset lives included in each of the Networks NSW 2014/15-2018/19
original proposals are materially longer than is currently being experienced by the networks as
demonstrated in the category analysis RIN data of the associated asset classes.
Advisian consider that, as per Sections 5.2 & 6.1, and in accordance with significant recent
investment in network data capture and analytics, Ausgrid has sufficiently advanced in the capture,
accuracy and reporting of its network data for the respective asset classes within each of the four
regulatory categories listed above, such that the mean economic lives within Ausgrid’s Category
Analysis RIN reasonably reflect the lives expected by each of the Networks NSW businesses, therefore
applicable to amendment of each of the Networks NSW standard asset lives.
Amendment of each of the Networks NSW standard asset lives in accordance with Ausgrid’s reported
data will additionally enable each of the Networks NSW DNSPs to align closer to the standard lives as
adopted by other NEM DNSPs.
Application of the category analysis RIN mean economic lives in accordance with the asset class
aggregation as described in Section 7.1.3.will result in the standard asset lives as per Table 7-1.

Review of Standard and Remaining Lives of Assets Advisian 37
Table 7-1 - Recommended Standard Lives for inclusion in Amended Proposal for the 2014/15-2018/19 regulatory control period
Standard Asset Lives (Years) Ausgrid Endeavour
Energy
Essential
Energy
Sub-transmission lines and cables (Original Proposal) 46.3 47.4 54.9
Sub-transmission lines and cables (Amended Proposal) 41.2 45.6 40.5
Cable tunnel (dx) 70 n/a n/a
Distribution lines and cables (Original Proposal) 58 50.6 53.8
Distribution lines and cables (Amended Proposal) 41.6 40.1 40.6
Substations 46.8 40 40.2
Transformers (Original Proposal) 45.9 44.3 45.8
Transformers (Amended Proposal) 37.4 40.6 36.35
Low voltage lines and cables (Original Proposal) 52.1 52.4 51.5
Low voltage lines and cables (Amended Proposal) 40.76 41.1 39.4
Customer metering and load control 25 25 25.9
Communications (digital) - dx 10 n/a n/a
Total communications 10.2 8.4 7
Systems IT (dx) 7 n/a n/a
Ancillary substation equipment (dx) 15 n/a n/a
Land and easements n/a n/a n/a
Furniture, fittings, plant and equipment 17.4 13 13
Land (non-system) n/a n/a n/a
Other non-system assets 29.4 n/a 15
IT systems 5 5 5
Motor vehicles 10.2 8 8
Buildings 35.9 50 50
Equity raising costs 47.4 42.4 44.7
Emergency spares (major plant, excludes inventory) n/a 23.6 17.9
Although the regulatory asset class “Substations” represents a significant percentage of each of the
Networks NSW regulatory asset bases, the corresponding assets classes within the category analysis

Review of Standard and Remaining Lives of Assets Advisian 38
RIN assets, as a source of mean economic life data, does not provide a representative weighting of the
sub asset classes which would typically form the “Substations” asset class (e.g. switchyard assets,
earthing and earth grid assets, buildings and control room equipment). Therefore as the mean
economic life data required to revise the determination of standard asset class lives for the
“Substations” asset class is not available for the asset’s applicable to the class, Advisian does not
consider that amendment can be supported at this point in time.
Advisian also noted that the economic life of “concrete poles” across all voltage categories in the
Category Analysis RIN data, at 24.61 years, was not consistent with other experiences and
unrepresentative of a reasonable expectation of asset life on a comparative analysis of the “concrete
poles” mean economic lives of each of the NEM DNSP’s. In consultation with Ausgrid network
representatives, we found that the sample size of concrete poles in the available network data against
each of the voltage categories in the Category Analysis RIN was small due to categorisation issues and
therefore insufficient to determine an accurate estimate of useful asset life. As a result we extended
the sample size to include “street-lighting” concrete poles, which for the purpose of determining a
standard asset life for depreciation purposes reasonably represents the same engineering
characteristics of a concrete power pole, a resultant mean economic life of 40.81 years is calculated.
For the inclusion of concrete poles in the weighted average calculation of each of the:
Low voltage lines and cables;
Distribution lines and cables; and
Sub-transmission lines and cables
regulatory asset classes, a mean economic life of 40.81 has been utilised. This economic life, which
contributes to the weighted average calculation of each of the regulatory asset classes, more
accurately represents a reasonable engineering expectation of the standard life of concrete poles, and
aligns with current comparable industry data.
7.1.2 Remaining Asset Lives
Following evaluation of the calculation of remaining asset lives as discussed in Section 5.2.3 for
inclusion in the regulatory PTRM, Advisian advises that a robust and prudent case exists for the
calculation of remaining asset lives of the four asset classes listed in Section 7, via the application of
the standard lives determined from the methodology described in Section 7.1.1, on the basis that the
actual installed capital weighted average calculation of remaining asset lives should incorporate the
actual standard lives experienced throughout the respective period, in place of the implied forecast
standard lives, as per inclusion of the lives from the previous approved PTRM model.
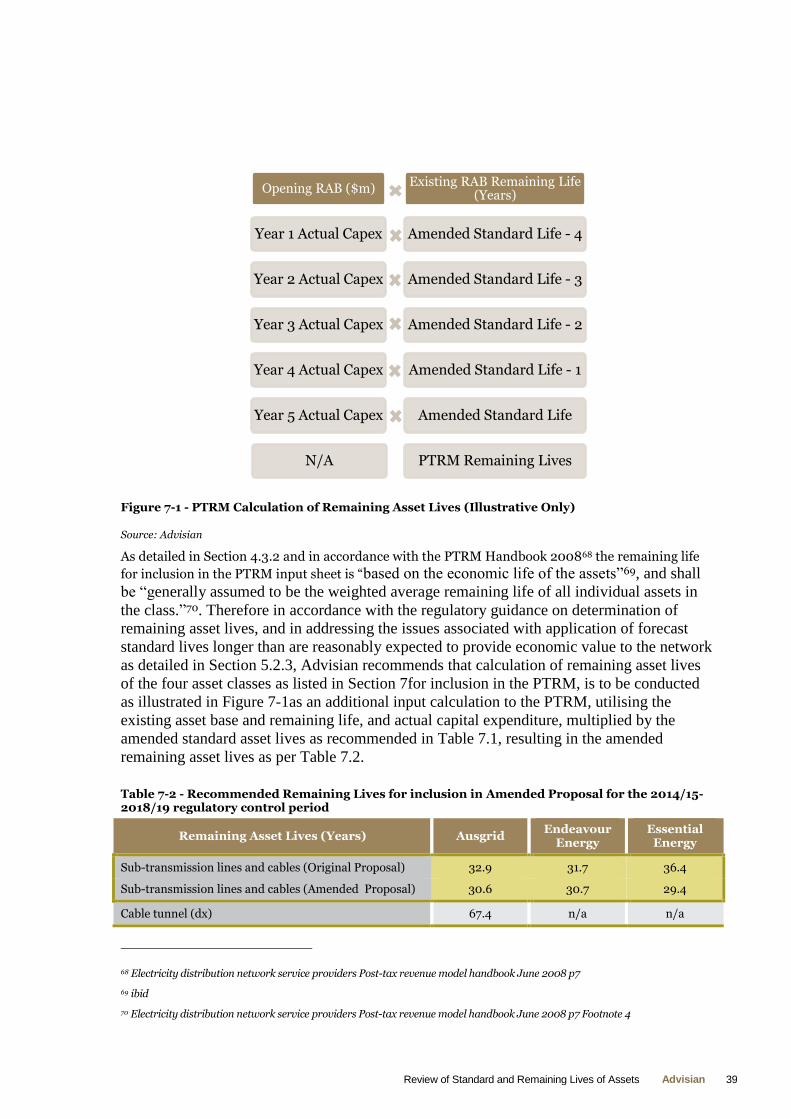
Review of Standard and Remaining Lives of Assets Advisian 39
Figure 7-1 - PTRM Calculation of Remaining Asset Lives (Illustrative Only)
Source: Advisian
As detailed in Section 4.3.2 and in accordance with the PTRM Handbook 200868 the remaining life
for inclusion in the PTRM input sheet is “based on the economic life of the assets”69, and shall
be “generally assumed to be the weighted average remaining life of all individual assets in
the class.”70. Therefore in accordance with the regulatory guidance on determination of
remaining asset lives, and in addressing the issues associated with application of forecast
standard lives longer than are reasonably expected to provide economic value to the network
as detailed in Section 5.2.3, Advisian recommends that calculation of remaining asset lives
of the four asset classes as listed in Section 7for inclusion in the PTRM, is to be conducted
as illustrated in Figure 7-1as an additional input calculation to the PTRM, utilising the
existing asset base and remaining life, and actual capital expenditure, multiplied by the
amended standard asset lives as recommended in Table 7.1, resulting in the amended
remaining asset lives as per Table 7.2.
Table 7-2 - Recommended Remaining Lives for inclusion in Amended Proposal for the 2014/15-2018/19 regulatory control period
Remaining Asset Lives (Years) Ausgrid Endeavour
Energy Essential
Energy
Sub-transmission lines and cables (Original Proposal) 32.9 31.7 36.4
Sub-transmission lines and cables (Amended Proposal) 30.6 30.7 29.4
Cable tunnel (dx) 67.4 n/a n/a
68 Electricity distribution network service providers Post-tax revenue model handbook June 2008 p7
69 ibid
70 Electricity distribution network service providers Post-tax revenue model handbook June 2008 p7 Footnote 4
Opening RAB ($m)
Year 1 Actual Capex
Year 2 Actual Capex
Year 3 Actual Capex
Year 4 Actual Capex
Year 5 Actual Capex
N/A
Existing RAB Remaining Life (Years)
Amended Standard Life - 4
Amended Standard Life - 3
Amended Standard Life - 2
Amended Standard Life - 1
Amended Standard Life
PTRM Remaining Lives

Review of Standard and Remaining Lives of Assets Advisian 40
Remaining Asset Lives (Years) Ausgrid Endeavour
Energy Essential
Energy
Distribution lines and cables (Original Proposal) 46.8 38.3 42.3
Distribution lines and cables (Amended Proposal) 40.4 33.2 35.6
Substations 34.8 28.2 25.2
Transformers (Original Proposal) 30.5 24.6 26.7
Transformers (Amended Proposal) 27.2 23.5 23.2
Low voltage lines and cables (Original Proposal) 40 27 28.9
Low voltage lines and cables (Amended Proposal) 34.2 25.2 24.5
Customer metering and load control 14.5 23.1 19.9
Communications (digital) - dx 5.6 n/a n/a
Total communications 3.1 6.9 5.6
Systems IT (dx) 4.9 n/a n/a
Ancillary substation equipment (dx) 12.4 n/a n/a
Land and easements n/a n/a n/a
Furniture, fittings, plant and equipment 12.5 8.1 8.4
Land (non-system) n/a n/a n/a
Other non-system assets 7.7 n/a 13.4
IT systems 3.3 3.5 3.6
Motor vehicles 6.3 5.7 5.1
Buildings 30 44.8 47.6
Equity raising costs 43.4 37 40.7
Emergency spares (major plant, excludes inventory) n/a 12.9 6.2
As the RFM is essentially a regulatory model for the determination of the opening regulatory asset
base for the upcoming regulatory control period, in order to minimise regulatory asset value write-
down risk, and in accordance with NER 6.5.5 (a)(2)(i)71 to reconcile the actual regulatory depreciation
accrued during the prior regulatory period and the depreciation deducted from the RAB, Advisian
recommends that the RFM is not amended and the standard asset lives applied in the RFM remain
unchanged from the lives as determined in the PTRM of the prior period. This will ensure that all
implementation of the recommendations to the asset lives as per this report will maintain the roll
forward valuation of the RAB.
Calculation of the remaining asset lives for determination of the 2014/15-2018/19 regulatory control
period depreciation building block within the PTRM, will therefore address only the future
depreciation schedule of the closing asset base from the prior regulatory control period.
71 AEMC, National Electricity Rules, Version 65, 1 October 2014, 6.5.5 Depreciation (a)(2)(i) p660

Review of Standard and Remaining Lives of Assets Advisian 41
7.1.3 Regulatory Asset Class Aggregation
As discussed in Section 5.2.2 and 6.4, aggregation of the Category Analysis RIN mean economic lives
to the regulatory asset classes via a capital expenditure weighted average calculation, provides for an
equitable weighting of each asset value within the respective regulatory asset categories, therefore
representing the respective end of useful life at which assets are currently being replaced or retired,
and the alignment of the return of capital investment across each of the regulatory asset classes.
In addition to the detail in Sections 6 and 7, on the utilisation of category analysis RIN data to inform
the calculation of standard and remaining asset lives, and in acknowledging that there are
fundamental differences in the asset class lives used for regulatory and taxation purposes, the
aggregation of RIN asset lives to the regulatory asset categories, and the categorisation of statutory
accounting lives to the regulatory asset categories should align such that in the weighting of capex
installations and disposals in calculating remaining asset lives, additional installed or disposed asset
value is correctly accounted against the corresponding asset life depreciation schedule.
Advisian recommends that although there may be benefit in regulatory principle, there is no
fundamental requirement for the further alignment of the asset class lives across the differing
business requirements (e.g. asset management, statutory and taxation lives). However it is strongly
recommended that for the purposes of accurate regulatory and accounting depreciation of capital
additions and disposals, a consistent mapping of asset categorisations is undertaken and
implemented for determination of standard lives across each of the three Networks NSW businesses.
7.2 Regulatory Impact
The recommended application of the above described adjustment to standard and remaining lives
within each of the Networks NSW DNSP’s regulatory submission PTRM’s and the impact the
recommendations would have on the amended regulatory proposal building blocks, including
regulatory depreciation allowance, are presented in Tables 7-3, 7-4, 7-5 and 7-6.
Advisian notes that for all regulatory building block calculations purposes, the calculations have been
conducted on the publicly available data in each of the Networks NSW Original Proposals.
Table 7-3 - PTRM Regulatory Asset Base
Networks NSW Business
Regulatory Building Block
Regulatory Asset Base ($m nominal)
Year 1 Year 2 Year 3 Year 4 Year 5
Ausgrid (distribution)
Original Proposal 12,279.8 13,035.9 13,797.1 14,466.4 15,139.6
Amended Proposal 12,279.8 13,011.7 13,744.9 14,382.8 15,020.4
% Change 0% -0.19% -0.38% -0.58% -0.79%
Endeavour Energy
Original Proposal 5592.9 5982.4 6293.3 6554.0 6831.4
Amended Proposal 5592.9 5974.1 6275.6 6525.4 6790.5
% Change 0% -0.14% -0.28% -0.44% -0.6%
Essential Energy
Original Proposal 6770.3 7243.9 7680.9 8124.1 8562.0
Amended Proposal 6770.3 7219.1 7627.4 8038.1 8439.4
% Change 0% -0.34% -0.7% -1.06% -1.43%

Review of Standard and Remaining Lives of Assets Advisian 42
As visible in Table 7-3 the adoption of shorter asset class standard and remaining lives for the asset
classes as listed in Section 7 and associated increase of regulatory depreciation allowance
correspondingly accelerates the reduction of the RAB. At a 25 year regulatory forecast the increased
regulatory depreciation results in a reduction of approximately 30% nominal RAB value against the
base case of the current regulatory forecast.
Table 7-4 - PTRM Building Block Regulatory Depreciation Revenue Requirement
Networks NSW Business
Regulatory Building Block
Regulatory Depreciation ($m nominal)
Year 1 Year 2 Year 3 Year 4 Year 5
Ausgrid
Original Proposal 123.3 144.1 165.1 150.4 164.0
Amended Proposal 147.6 171.9 196.7 185.9 203.6
% Change 19.69% 19.30% 19.11% 23.66% 24.14%
Endeavour Energy
Original Proposal 62.6 72.3 83.1 88.0 93.3
Amended Proposal 70.8 81.8 93.9 100.3 107.1
% Change 13.16% 13.18% 13.08% 13.98% 14.90%
Essential Energy
Original Proposal 98.4 116.3 131.7 135.9 129.8
Amended Proposal 123.3 144.9 164.2 172.6 171.0
% Change 25.32% 24.52% 24.67% 26.98% 31.79%
As visible in Table 7-4 the application of amended standard asset lives to the calculation of asset
remaining lives for inclusion in the PTRM, results in a step change increase to the regulatory
depreciation allowance in accordance with the increased depreciation component on the existing
opening asset base. The application of shorter standard asset class lives of the four asset categories as
listed in Section 7 results in an incremental increase in the regulatory depreciation component
proportional to the quantity of new capex in each of the respective regulatory asset categories.
Table 7-5 - PTRM Building Block Return on Equity Revenue Requirement
Networks NSW
Business
Regulatory Building Block
Return on Equity ($m nominal)
Year 1 Year 2 Year 3 Year 4 Year 5
Ausgrid
Original Proposal 496.6 527.2 557.9 585.0 612.3
Amended Proposal 496.6 526.2 555.9 581.6 607.4
% Change 0% -0.19% -.38% -0.58% -0.79%
Endeavour Energy
Original Proposal 226.2 241.9 254.5 265.0 276.3
Amended Proposal 226.2 241.6 253.8 263.9 274.6
% Change 0% -0.14% -0.28% -0.44% -0.6%
Essential Energy
Original Proposal 273.79 292.95 310.61 328.54 346.25
Amended Proposal 273.79 291.94 308.45 325.06 341.29
% Change 0% -0.34% -0.7% -1.06% -1.43%
As a result of the proportional relationship to the quantum of the RAB, the accelerated regulatory
depreciation as a result of shorter asset class lives will result in lower total returns on equity.

Review of Standard and Remaining Lives of Assets Advisian 43
Table 7-6 - PTRM Annual Revenue Requirement
Networks NSW
Business
Regulatory Building Block
Annual Revenue Requirement ($m nominal)
Year 1 Year 2 Year 3 Year 4 Year 5
Ausgrid
Original Proposal 1957.1 2079.1 2187.1 2293.5 2246.4
Amended Proposal 1988.4 2112.6 2222.5 2331.0 2285.4
% Change 1.60% 1.61% 1.62% 1.63% 1.74%
Endeavour Energy
Original Proposal 988.2 982.8 1053.1 1078.8 1090.3
Amended Proposal 998.8 994.2 1065.3 1091.8 1104.1
% Change 1.07% 1.17% 1.16% 1.21% 1.27%
Essential Energy
Original Proposal 1225.9 1260.0 1339.6 1490.5 1508.0
Amended Proposal 1258.0 1294.3 1376.1 1529.1 1548.9
% Change 2.62% 2.72% 2.73% 2.59% 2.71%
Commensurate to changes in each of the PTRM revenue building block components as detailed in
Tables 7-3, 7-4 and 7-5, the annual revenue requirement for each of the Networks NSW businesses as
visible in Table 7-6 will increase relative to the original regulatory proposal and the AER’s draft
decision.
Application of the recommendations of this report for the amendment of standard asset class lives
and the calculation of remaining asset lives will result in a short term increase in annual regulatory
revenue for each of the Networks NSW DNSPs as a result of the increased return of regulatory
depreciation revenue building block. Over time however, under the assumption of no capex beyond
the 5 year period as per the regulatory revenue model, this will result in reduced regulatory revenue
as a result of the faster reduction of the regulated asset base and associated decrease of the return on
asset revenue. This inherently benefits each of the Networks NSW businesses in maintaining capital
recovery, and future customers in reducing risk of asset write-downs on assets replaced or disposed
significantly earlier than the respective depreciation schedules had accounted for.
In supporting the assessment by the AER of the principles and supporting evidence for the Networks
NSW businesses proposed increase in regulatory depreciation building block revenue, in accordance
with the AEMC rules and regulatory guidance as detailed throughout this report, the increase in
annual revenue allowance for the 2014/15-2018/19 is significantly influenced by the depreciation
expense on the substantial recent investment in network growth and replacement activity. The long
term benefit to current and future Networks NSW customers of increased Return of Asset building
block revenue on historical and recent network investment will be borne through both a more rapidly
reduced RAB and corresponding Return on Asset revenue, and reduction of residual value asset
write-down risk.
7.3 Conclusion on Ausgrid Transmission Asset Lives
The current regulatory treatment of depreciation schedule calculation for transmission network
assets, in accordance with AEMC rules 6A.6.372, is directly comparable to the regulatory
72 AEMC, National Electricity Rules, Version 65, 1 October 2014, pp. 774-775

Review of Standard and Remaining Lives of Assets Advisian 44
requirements for NEM DNSPs. Therefore in accordance with the Terms of Reference for assessment
of the standard and remaining lives of Ausgrid’s transmission network assets in addition to its
distribution networks assets, Advisian has undertaken a review of the standard and remaining lives of
Ausgrid’s transmission assets within the regulatory RFM and PTRM, and category analysis RIN, in
accordance with the same methodology applied throughout this report for each of the Networks NSW
distribution businesses.
Following evaluation of the standard regulatory asset lives in Ausgrid’s 2014/15-2018/19 regulatory
control period proposed RFM and PTRM’s, against the comparable mean economic lives of the
category analysis RIN asset classes, Advisian have identified that the current lives employed in the
calculation of the regulatory depreciation building block allowance do not materially differ from the
lives Ausgrid have determined in calculating economic lives on actual network data.
Additionally Ausgrid’s current transmission regulatory asset class lives are in close alignment to the
comparable category analysis RIN asset classes as reported by each of the NEM DNSP’s.
Following evaluation of the application of real network data to the inform the calculation of amended
standard asset class lives, Advisian does not recommend amendment to Ausgrid’s transmission
network regulatory standard asset class lives on the basis that the current standard asset lives applied
in each of the RFM and PTRM regulatory models, reflect an accurate estimation of the reasonably
expected useful economic lives of the regulatory asset classes.
The calculation of remaining asset lives for transmission network assets applies the same installed
capital weighted average calculation as per the distribution roll-forward model calculation. Advisian
does not recommend amendment of the remaining lives as per the methodology recommended for
Networks NSW distribution businesses, on the basis that the standard lives applied in the weighted
average calculation for the assets installed during the prior 5 year regulatory control period, reflect an
accurate estimation of the reasonably expected useful economic lives of the installed assets.
Advisian has made all the enquiries that Advisian believes are desirable and appropriate and that
no matters of significance that Advisian regards as relevant have to Advisian’s knowledge been
withheld from the Court

Review of Standard and Remaining Lives of Assets Advisian 45
Appendix A Terms of Reference
Advisian (formerly Evans & Peck) was engaged by Ausgrid on behalf of Networks NSW to provide an
independent expert opinion in response to the following terms of reference:
1) What are the fundamental principles and approach adopted by the AER in assessing and
endorsing asset class standard and remaining lives for inclusion in the distribution
determination RFM and PTRM? Do the practices adopted by the Networks NSW businesses
align to the AEMC rules and AER principles? Do the practices align with the fundamental
driver for asset depreciation?
2) What are the existing commonalities/differences across each Networks NSW business and the
NEM DNSPs for the calculation of asset class standard and remaining lives? Is there scope for
common practices between Networks NSW businesses in the adoption of asset class lives and
what impact might a change in practice have on each businesses regulatory submission?
3) What are the existing commonalities/differences across each Networks NSW business in
alignment between the engineering, regulatory and accounting lives of asset classes? Is there
scope for commonality of asset class lives across engineering, regulatory and accounting lives
and what impact might a change in practice have on each businesses practices and regulatory
submission?
4) On what basis might the Networks NSW businesses adopt different asset class standard and
remaining lives which more closely align depreciation revenue to the expenditure quantum and
timing requirements of the businesses? And what business/network/customer impact might
this have on the regulated revenue requirement for each business?

Review of Standard and Remaining Lives of Assets Advisian 46
Appendix B Reference Documents
The following documents have been referenced and relied upon in the preparation of this report. A
copy of these documents has been provided in electronic format to Networks NSW to accompany this
report.
No. Reference Document
1. AEMC, National Electricity Rules, Version 65, 1 October 2014, pp. 659-660
2. AER, Better Regulation Expenditure Forecast Assessment Guideline for Electricity Distribution
November 2013 Accuracy and reliability p15
3. AER, Better regulation Explanatory statement Final regulatory information notices to collect
information for category analysis March 2014
4. AER, Draft Decision Ausgrid distribution determination 2015–16 to 2018–19 Attachment 5:
Regulatory depreciation November 2014 Table 5-5 p 14
5. AER, Draft decision Endeavour Energy distribution determination 2015–16 to 2018–19 Attachment
5: Regulatory depreciation November 2014 Table 5-3 p13
6. AER, Draft decision Essential Energy distribution determination 2015–16 to 2018–19 Attachment 5:
Regulatory depreciation November 2014 Table 5-3 p13-14
7. AER, Final decision New South Wales distribution determination 2009–10 to 2013–14 28 April 2009
10.4.2 Updating input data p214-215
8. Ausgrid Basis of Preparation Response to Category Analysis Regulatory Information Notice
Submission date 31 October 2014 Template 5.2 – Asset age profiles p126-132
9. Electricity distribution network service providers Post-tax revenue model handbook June 2008
10. Electricity distribution network service providers Roll forward model handbook June 2008
11. Endeavour 2012-13 - RIN response - Appendix 1b - RIN Non-financial templates - 13 December 2013
- PUBLIC.xls
12. Endeavour Energy Basis of Preparation Response to AER Determination RIN Submission date: 30
May 2014
13. Essential 2012-13 - RIN Response - Attachment 9 non-financial information - 13 December 2013 -
PUBLIC.xlsx

Review of Standard and Remaining Lives of Assets Advisian 47
14. Essential Energy BASIS OF PREPARATION RESPONSE TO RESET RIN Version updated as at 29
May 2014
15. New South Wales Treasury Valuation of Electricity Network Assets A Policy Guideline for New South
Wales Distribution Network Service Providers February 2004 3.5.1 Standard Effective Lives

Review of Standard and Remaining Lives of Assets Advisian 48
Appendix C Curriculum Vitae – Evan Mudge

Curriculum Vitae Evan Mudge Advisian Page 1 of 2 Commercial in Confidence
Evan Mudge
Associate
Overview
Evan has provided strategic consulting services to infrastructure clients across the Australia-Pacific
region relating to major project investments, economic regulation, strategic asset management, risk
management and project/capital governance frameworks.
With over 10 years of experience spanning over 25 Australian regulatory determinations, Evan has
personally reviewed over $10b in capital expenditure on energy infrastructure and identified scope and
cost efficiencies of over $2b. He has also assisted network businesses to prepare and optimise business
cases for major ($100m+) and strategic infrastructure projects. His broad experience across project,
contract and commercial management, engineering design, environmental approvals, pricing and
economic regulation enables him to bring a unique combination of strategic thinking, commercial focus
and pragmatism to his engagements.
Areas of Expertise
� Regulatory Advice
� Asset Strategy
� Cost Advisory
� Capital Program Review
� Risk Analysis
� Project Analysis & Evaluation
� Business Case Preparation
� Planning & Scheduling
Relevant Experience
Associate │ Advisian │ 2012 - Present
� Manage the preparation of TransGrid’s response to the Economic Benchmarking and Revenue
Reset Regulatory Information Notices that are required to support TransGrid’s Revenue Proposal
for the 2014/15 to 2018/19 period.
� Expert regulatory advice to regulated networks in NSW, Tasmania, Victoria, Queensland and ACT
relating to cost estimation methodologies, replacement capex modelling, advanced metering
infrastructure and regulatory submissions.
� Assessment of relative expenditure performance, asset intensity and the infrastructure burden
placed on customers for each network serving the national electricity market.
� Explanation of the relative reliability performance trends of Australian electricity networks.
Included comparison of different policy drivers and jurisdictional influences on reliability.
� Development of solar thermal commercialisation strategy and risk management plan for an
Australian renewable energy technology developer.
� Development of contract management tools and performance incentive scheme for the primary coal
haulage contract for a major coal-fired power station in NSW.
Consultant │Asset & Regulatory Strategy │ Parsons Brinckerhoff │ 2008 – 2012
� Evaluate capital investment in energy network assets including reviewing over $10b in forward
expenditure portfolios for the Australian Energy Regulator, Economic Regulation Authority of WA
and network businesses (including Jemena, ActewAGL, United Energy, CitiPower/Powercor and
ETSA Utilities) across all states of Australia, New Zealand and the Pacific. Recommended
investment program adjustments totalling over $2b.
� Expert regulatory advice to energy networks including an independent assessment of the AER’s
Repex model as part of the Victorian Electricity Distribution Price Review.
� Provide business case advice and analysis to support strategic initiatives such as Ausgrid’s
successful bid for the $100m Federal Smart Grid Smart City program funding, investigating the

Evan Mudge
Associate
Curriculum Vitae Evan Mudge Advisian Page 2 of 2 Commercial in Confidence
optimal ownership model for electricity network communications assets in the NBN and providing
an independent review of project costs for the largest transmission line project in WA ($300m).
� Due diligence evaluation of generation assets and associated contractual arrangements to support
potential acquisition, including review of fuel supply arrangements for the NSW governments
Gentrader divestment for a top tier energy generator-retailer.
� Advise Papua New Guinean Independent Public Business Corporation on a remedial strategy to
address generation and transmission reliability issues affecting the economic development of the
Lae, Madang and Highlands regions of the country.
� Energy (electricity, gas, carbon, network) procurement advice for major infrastructure operations
such as Sydney Airport, Fremantle Ports, Sydney Metro Authority and major generation facilities.
Business Analyst and Commercial Manager │Gridx Power │ 2007 – 2008
� Provide technical and commercial analysis of innovative energy generation projects and
communicating business/project risks and opportunities to executive management, client
representatives, project finance partners and potential equity investors, including:
� Negotiate fuel pricing arrangements, power purchase agreements, capital contributions, tariffs,
equipment procurement and financing arrangements for innovative cogeneration/trigeneration
(heat/power/cooling) projects.
� Quantify the financial, carbon and energy efficiency benefits and development of business case to
facilitate investment decision making for the business/finance partners and clients.
� Optimise plant operation and equipment sizing (electricity/thermal and export sales) for optimal
commercial and risk management outcomes.
� Develop pricing and contract terms in conjunction with the client’s consultants to facilitate
acceptable trade-offs between technical efficiency and commercial viability.
� Monitor wholesale and retail gas and electricity markets to ensure tariffs, operating schedules and
business model remained viable in increasingly volatile markets.
� Provide commercial input to regulatory matters, including changes to the National Electricity Rules.
Research Engineer │ Sustainable Energy │ Bassett Applied Research (AECOM)│ 2006 – 2007
Conducted industry leading analysis of energy and carbon efficient building design initiatives using
advanced numerical modelling techniques. Also undertook complex acoustical and vibration analysis to
facilitate environmental planning and assessment requirements for major infrastructure projects.
Qualifications & Affiliations
� Bachelor of Engineering (Hons), University of Technology Sydney
� Master of Applied Finance, Macquarie University
Work History
2012 - Present Associate, Advisian (formerly Evans & Peck)
2008 - 2012 Consultant – Asset & Regulatory Strategy, Parsons Brinckerhoff
2007 - 2008 Business Analyst and Commercial Manager, Gridx Power
2006 – 2007 Research Engineer – Sustainable Energy, Bassett Applied Research (AECOM)
2004 - 2005 Mechanical Engineer, GHD Mining & Industry