Embed Size (px)
Citation preview

Review of Recent Study Findings
October 12, 2011
Presented by
© Copyright 2011 The Sales Management Association.
Quota Setting Best Practices for Sales
Operations

About the Sales Management Association
A global, cross-industry professional association for sales
operations and sales management.
Focused in providing research, case studies, training, peer
networking, and professional development to our membership.
Fostering a community of thought-leaders, service providers,
academics, and practitioners.
1
© 2011 The Sales Management Association. All rights reserved.
Learn More: www.salesmanagement.org
OCT
17
Join Us for this upcoming SMA event
Slide 2

Today’s Presenter
3 Slide 3
© 2011 The Sales Management Association . All rights reserved
Ted Briggs
• Has over 20 years of sales effectiveness and sales compensation
experience in working with clients in the technology,
telecommunications, financial services, consumer products,
medical products and pharmaceutical industries
• Led the development of numerous industry sales compensation
and sales operations roundtables and forums nationally
• Served as a business and practice leader in national/global firms
including Alexander Group, Sibson, and Watson Wyatt before
starting Better Sales Comp Consultants
• Previous positions include training and development as well as
CPA for Deloitte
• Certified Meeting Facilitator – Center for Effective Meetings
• An author of WorldatWork publication, Sales Compensation
Essentials, as well as numerous articles and newsletters.
• Member of WorldatWork Sales Compensation Teaching Cadre
• Frequent speaker at national and global conferences on topics
related to sales compensation, sales productivity and sales
performance management

Today’s Presenter
4 Slide 4
© 2011 The Sales Management Association . All rights reserved
Clinton Gott
• Has over 12 years of consulting experience working across a range
of industries including software, hardware, consumer
products/DSD, medical products, and financial services.
• Enjoys a particular emphasis on helping small or medium sized
businesses evolve the sales organization and compensation
program toward greater maturity, effectiveness, and sophistication.
• Formerly served as the Western Region Sales Effectiveness
Practice Leader at Watson Wyatt (now Towers Watson).
• Held human capital and process consulting roles at Sibson
Consulting and Accenture.
• Frequent conference speaker and author — Workspan,
WorldatWork, and other events.
• Earned an MBA with distinction from UCLA Anderson School of
Management.

Today’s Presenter
5 Slide 5
© 2011 The Sales Management Association . All rights reserved
Fred Sass
• Over 20 years of experience in technology companies – AT&T,
ConceptWave Software, Tira Wireless, Casero, Varicent Software
• Responsible for product marketing strategy and execution for the
Varicent Sales Performance Management (SPM) software solution
• MBA from McMaster University

Review of Recent Study Findings
October 12, 2011
Presented by
© Copyright 2011 The Sales Management Association.
Quota Setting Best Practices for Sales
Operations

Webinar Agenda
• Speaker Introduction
• Views on Quota Setting
• Introduction to BSC‟s 2011 Quota Study
• Highlights of Findings and Best Practices Alignment
7

Webinar Agenda
• Speaker Introduction
• Views on Quota Setting
• Introduction to BSC‟s 2011 Quota Study
• Highlights of Findings and Best Practices Alignment
8

Quota Setting, at Its Essence…
9
Quota Setting = Growth Planning
There is a secondary benefit – setting goals allows a more fair
and motivational sales compensation program.
Goal-based plans = maximize results and drive true and
equitable pay-for-performance results.

Why Using Sales Goals are Important
1. Links an employee’s activities to the corporation’s mission and
financial objectives and results
2. Promotes dialogue between sales management and representatives
about the most effective way to execute the sales and service
strategies
3. A way to set priorities and to define achievement
4. Helps provides focus on the right accounts/segments with highest
sales potential
Sales goals drive company results. They also help ensure an
appropriate calibration of individual expected and superior
performance – with resulting pay implications
10
Good Quota Setting Is A Difficult but Necessary
Discipline
At best…
• Effective performance
management tool
• Basis for differentiation between
high and low performers
• Places sales reps on an level
playing field
• Motivates sustained
performance year after year
• Helps ensure you meet your
overall goals
At worst…
• Manages pay instead of
performance
• Creates misalignment between
real and perceived performance
• Misleads companies into believing
the pay and performance
relationship is sound
• Penalizes high performers by
continually assigning unreasonable
growth expectations
11

Characteristics of Effective Quotas
• Fair, equitable and credible
– Fair: The number is achievable with a reasonable degree of effort
– Equitable: The degree of difficulty is consistent across sales reps
– Credible: Salespeople and managers understand basis for quotas and
have some degree of confidence their quota is fair and equitable
• Highly align with overall business requirements
• Motivates sustained performance year-in year-out
• Accounts for differences in territories, market characteristics and sales
potential
12
It is critical that the sales organization perceive the quotas as fair,
equitable and credible

―Top 10‖ Key Challenges of Setting Goals
1. Setting realistic goals at an individual territory level
2. Setting goals for shared accounts and crediting individuals on sales by
multiple resources
3. Managing the influence of large, one-time deals or inconsistent
business trends/fluctuations
4. Developing a process that allocates flexible and credible goals
5. Accurately estimating the impact of corporate enhancements,
investments, initiatives, new product introductions and pricing structures
6. Capturing relevant and reliable data
7. Estimating final results before fiscal period ends
8. Getting market comparisons that help evaluate relative performance of
your company and sellers (market/account share)
9. Buy-in at the sales representative level
10. Recognizing there are no ―accurate‖ quotas – as performance is not a
constant
13

Webinar Agenda
• Speaker Introduction
• Views on Quota Setting
• Introduction to BSC‟s 2011 Quota Study
• Highlights of Findings and Best Practices Alignment
14

BSC 2011 Quota Study – Participating Companies
15
• ACI Worldwide • Alcatel-Lucent • Allergan • AMD • Analog Devices • Applied Materials • Atmel • Autodesk, Inc. • Avery Dennison • BMC Software • Broadcom • Canada Post Corporation • Citrix Systems • Commscope • Dimension Data
• Kraft Foods • Kronos Incorporated • LSI Corporation • McAfee, Inc. • Mercuri • NCR • Novell • Nuance • Oakwood • Pfizer Animal Health • Rockwell Automation • San Disk Corporation • Slaud Total Eps • Spansion
The 52 participating companies in BSC’s 2011 General Industry Quota Practices Study:
• Dr Pepper Snapple Group
• EMC • Experian • Frito Lay • Garden View • Ger-Eck, LLC • Great West Life &
Annuity • Hewlett-Packard • Hospira Worldwide • i365 • IBM • Intel Corporation • Juniper Networks
• Stanley Security Solutions
• SuccessFactors • Syngenta • Technology Learning
Group • Tellabs Operations,
Inc. • Teranet • Unisys Corporation • Verigy • Xerox • Zebra Technologies
Corporation
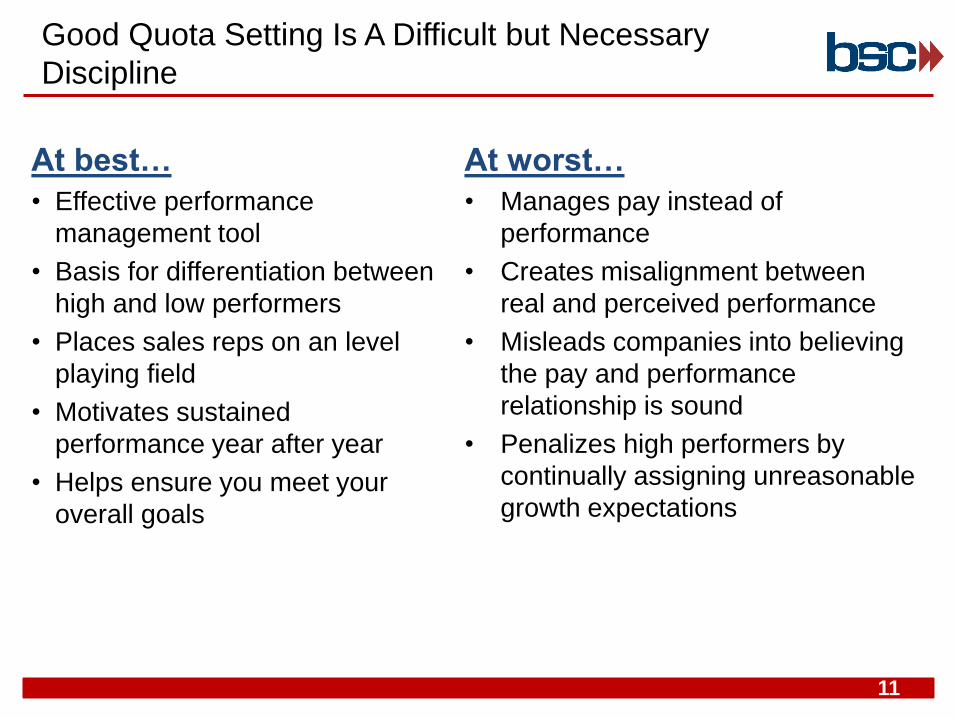
31%
4%
4%
4%
6%
6%
8%
8%
13%
17%
0% 5% 10% 15% 20% 25% 30% 35%
Other
Consumer Products
Hardware
Services
Manufacturing
Semiconductor Equipment/Software/Services
Healthcare
Network/Telecom Equipment/Solutions
Semi-Conductor
Software
Industries Represented
16
62% self-selected having “higher performance” vs. competitors.

Topics Included in This session
17
Achievement distributions – targeted and actual
Overall quota setting effectiveness
Factors and data utilized
Tools utilized
Clarity of ownership and level of centralization
Timing – setting and communication
Key practices
Use of quota adjustments
A
B
C
D
E
F
G
H

Webinar Agenda
• Speaker Introduction
• Views on Quota Setting
• Introduction to BSC‟s 2011 Quota Study
• Highlights of Findings and Best Practices Alignment
18

Overview – Times are Getting Better… ?
• 62% reported performing ―better than industry‖
• Only 33% responded positively when we asked the same question in
our 2010 sales operations survey
19
It would be interesting to ask this question as 2011 winds down.
Macroeconomic exuberance seems to be waning. We expect to see more
struggles than successes over the near term.

Whether overall times are better or not, salespeople
often continue to perform below goal…
20
0%
8%
11%12%
23%
12% 12%
10%
8%
4%
0%
5%
10%
15%
20%
25%
<10% 10% to 20% 20% to 30% 30% to 40% 40% to 50% 50% to 60% 60% to 70% 70% to 80% 80% to 90% 90% to 100%
PERCENT OF SALES FORCE REACHING OR EXCEEDING QUOTA IN MOST RECENT FISCAL YEAR
54% had more reps below goal 46% had more reps
above goal
A

… even though companies continue to target more
to be above goal than not
21
25%
0%
6%
2%
6%
8%
14%
25%
8%
2%
4%
0%
5%
10%
15%
20%
25%
30%
No Target Set <10% 10% to 20% 20% to 30% 30% to 40% 40% to 50% 50% to 60% 60% to 70% 70% to 80% 80% to 90% 90% to 100%
PERCENT OF SALES FORCE TARGETED TO REACH QUOTA
30% target more reps below goal
70% target more reps above goal

Market Practices:
Different Quota Setting Philosophies
Quota
“Extreme Stretch”
Quotas
Achievable Quotas
“Best Practice”
Symbolic Quotas
<30% Achieve
55% - 70% Achieve
80% + Achieve
Demoralizing Culture of “Winners” Can breed
entitlement; poor CCOS
22

Overall, there are favorable perceptions of the
quota-setting process effectiveness
23
56% of companies felt their quota-setting process was at least somewhat effective while 25% felt their process was somewhat ineffective or worse.
EFFECTIVENESS OF QUOTA SETTING PROCESS
2%
2%
21%
19%
37%
17%
2%
0% 5% 10% 15% 20% 25% 30% 35% 40%
Very ineffective
Ineffective
Somewhat ineffective
Neither ineffective or effective
Somewhat effective
Effective
Very effective
B
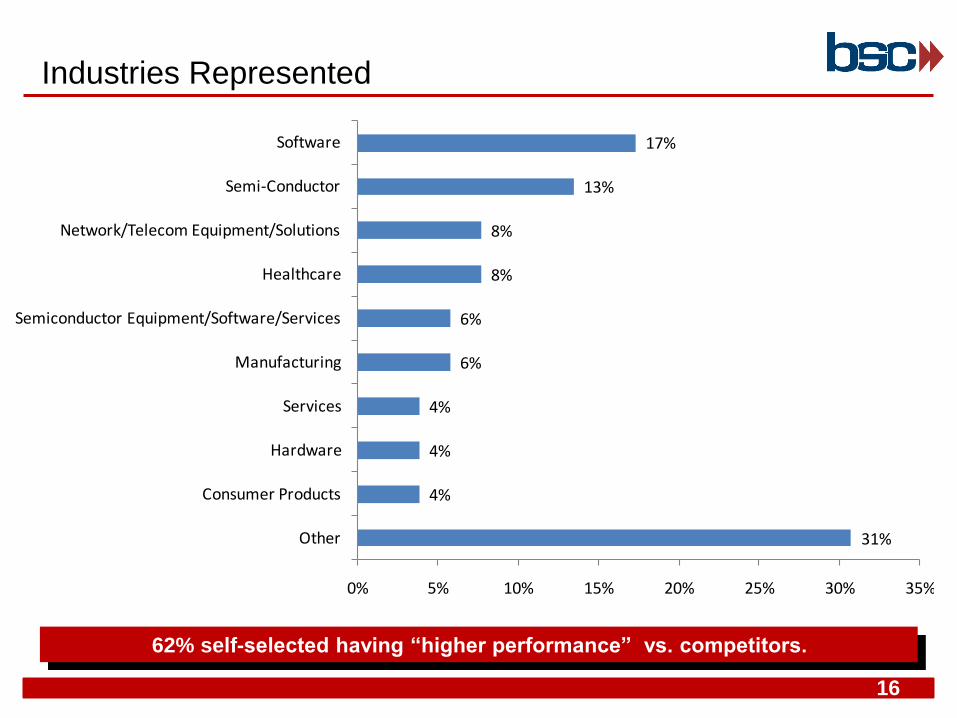
To measure effectiveness, a couple of approaches
had predominant usage
24
MEASURING EFFECTIVENESS OF QUOTA SETTING PROCESS
0%
15%
25%
75%
45%
19%
22%
25%
66%
66%
0% 10% 20% 30% 40% 50% 60% 70% 80%
Other
We do not measure the effectiveness
Assessing prevalence of quota corrections/adjustments during
year
Number of people reaching or exceeding goal
Compare comp spend versus budget and results
Higher Performance Co's Med/Avg/Low Performance Co's
• Responses to „Other‟: 'Nearness' by Rep to 100% Attainment, Assessing market share, Driven by National result, Fairness
and equity, Looking at goal versus growth, and Forecast accuracy

Overall, there are also favorable perceptions of quota
accuracy
25
73% of companies state they were at least somewhat accurate in setting quotas this year.
ACCURACY IN SETTING QUOTA THIS YEAR
3%
0%
8%
18%
45%
25%
3%
0% 5% 10% 15% 20% 25% 30% 35% 40% 45% 50%
Very inaccurate
Inaccurate
Somewhat inaccurate
Neutral
Somewhat accurate
Accurate
Very accurate 73% better than “neutral”
11% below “neutral”
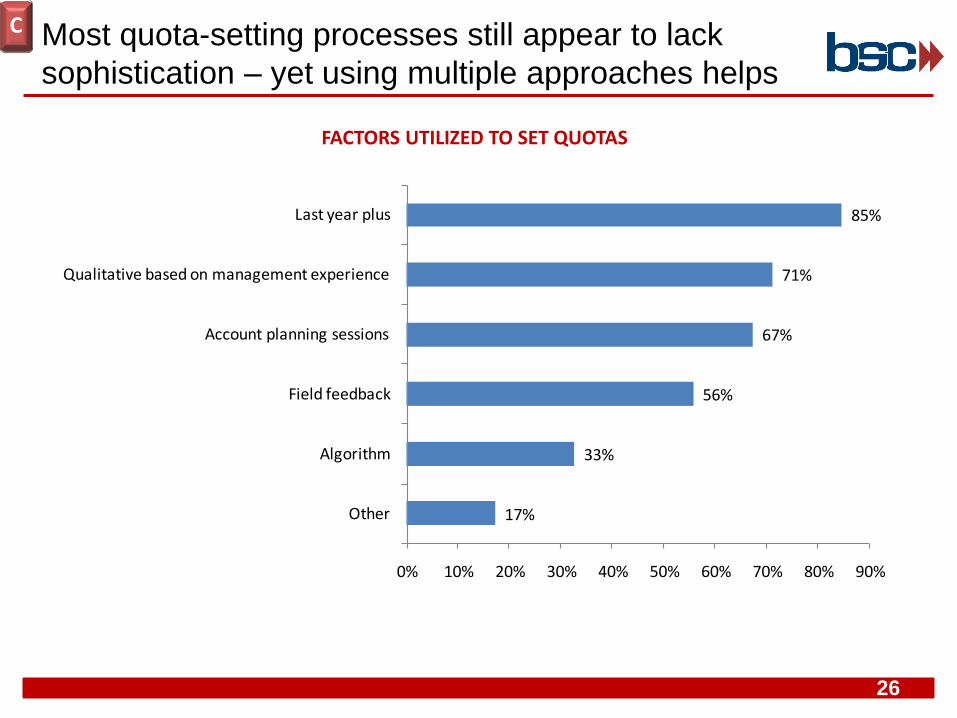
Most quota-setting processes still appear to lack
sophistication – yet using multiple approaches helps
26
17%
33%
56%
67%
71%
85%
0% 10% 20% 30% 40% 50% 60% 70% 80% 90%
Other
Algorithm
Field feedback
Account planning sessions
Qualitative based on management experience
Last year plus
FACTORS UTILIZED TO SET QUOTAS
C

10
5
5
5
0 2 4 6 8 10 12
Other
D&B
Gartner
IDC
The survey showed a limited usage of 3rd party
data…
27
3rd Party Data. We were surprised to find that only 35% stated they used a 3rd party (e.g., D&B, IDC, Gartner, etc.) when setting quotas.
UTILIZATION OF 3rd PARTY DATA
Responses to „Other‟: Equifax,
Fenalco, Cerulli, Project
Monitor/Project Today, CRN,
OneSource, Puget Sound
Business Journal, IMS, and
Numerous 3rd Party Forecasts

0%
2%
2%
20%
51%
22%
4%
0% 10% 20% 30% 40% 50% 60%
Very unreliable/accurate
Unreliable/inaccurate
Somewhat unreliable/inaccurate
Neither unreliable/inaccurate or reliable/accurate
Somewhat reliable/accurate
Reliable/accurate
Very reliable/accurate
… but in general, the accuracy and reliability of data
being used was more positive than negative
28
77% of respondents cited data as being at least somewhat reliable/accurate to very reliable/accurate.
ACCURACY AND RELIABILITY OF DATA
77% positive
Only 4% negative

And companies are using the ―same old‖ tools…
29
2%
2%
2%
4%
4%
18%
18%
22%
24%
76%
0% 10% 20% 30% 40% 50% 60% 70% 80% 90%
Consulting firm software solution
Salesforce.com
Salient application
SPM/EIM solution
Workflow management solution
Access or similar application
Module within another internal application
Business Intelligence/Analytics tool
Internally developed planning application
Excel or similar tool
TOOLS UTILIZED FOR QUOTA SETTING
In terms of “effectiveness”, Excel and internally developed tools stand out
D

3%
11%
22%
22%
24%
24%
32%
38%
0% 5% 10% 15% 20% 25% 30% 35% 40%
Access or similar application
Module within another internal application
Excel or similar tool
Internally developed planning application
Other
Workflow management solution
SPM/EIM solution
Business Intelligence/Analytics tool
… while looking for a better solution
30
71% of companies plan to make changes or upgrades to the tools they currently use.
PLANNED CHANGES/UPGRADES TO TOOLS

Quota Requirements for SPM Technology
31
Plan by individuals, teams, regions, channels, products
Top down & bottom up
Management reporting on quota attainment
Sales staff, management, channel partners
Visibility
Electronic distribution and approval
For “what if Analysis” – Integration with past period data
Integration Planning
Territory fairness

Requirements at a Recent Deployment
32
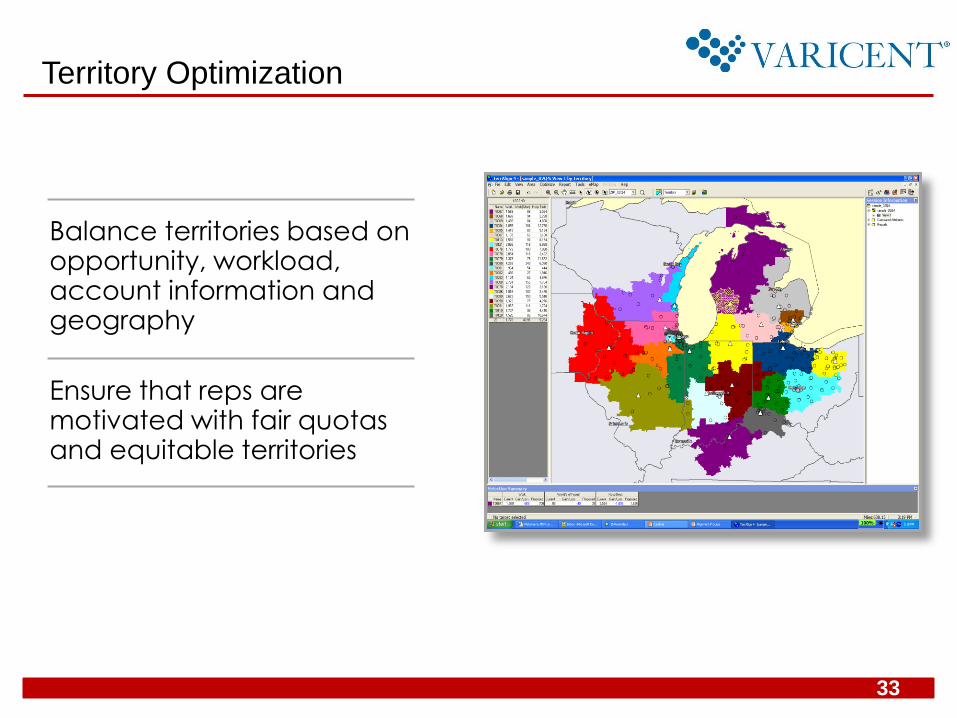
Territory Optimization
Balance territories based on opportunity, workload, account information and geography
Ensure that reps are motivated with fair quotas and equitable territories
33

Scenario Modeling
34

Quota Management
35

Management Reporting
Pay For Performance Analysis Quota Distribution
36

Clarity of ownership is important – most identified
ownership within a sales-related group
37
13%
6%
8%
10%
12%
13%
38%
0% 5% 10% 15% 20% 25% 30% 35% 40% 45%
Other
Reporting to another functional area
Reporting to Finance
Reporting to Sales
Reporting to Sales Finance
No, but there is a sales planning team
Reporting to Sales Operations
73% of respondents stated quota process owner reports to sales, sales planning, sales ops or sales finance.
QUOTA PROCESS OWNERSHIP
E

A ―balanced‖ approach or a bias toward more
centralization was found in the preferred process
38
Overall, companies tended to favor a balance between centralization and decentralization – and clearly more centralization than decentralization
46%
38%
10%
2% 2% 2% Balance between centralization and decentralization
More centralization than decentralization
More decentralization than centralization
Complete decentralization
Global process, BU ownership to execute within common process
Process/Broader expectations. Should be centralised and #s finalised; how they arrive at is decentralised
56% of high performers sought a globally consistent approach vs. only
37% of average/lower performers

Quota process timing results were not surprising –
early start…
39
10%
13%
25%
17%
15%
15%
4%
0% 5% 10% 15% 20% 25% 30%
After fiscal year start
<1 month prior to fiscal year start
2 months prior to fiscal year start
3 months prior to fiscal year start
4 months prior to fiscal year start
5 months prior to fiscal year start
>6 months prior to fiscal year start
Most companies (76%) begin the quota setting process at least two months prior to the beginning of the fiscal year.
INCEPTION OF QUOTA SETTING PROCESS
F

… that typically requires several months to complete
40
51% of companies spend two to three months (from start to finish) on their quota setting process.
6%
10%
29%
22%
18%
16%
0% 5% 10% 15% 20% 25% 30% 35%
2 to 4 weeks
1 months
2 months
3 months
4 months
5 months
DURATION OF QUOTA SETTING PROCESS

In terms of communication, companies aligned well
to best practice, first as to ―when‖ to communicate…
41
8%
29%
40%
8%
12%
4%
0% 5% 10% 15% 20% 25% 30% 35% 40% 45%
>8 weeks after fiscal year start
5 - 8 weeks after fiscal year start
2 - 4 weeks after fiscal year start
<2 weeks after fiscal year start
<1 month before fiscal year start
>1 month before fiscal year start
48% of companies communicate new quotas to field within the first four weeks of the fiscal year, while 37% communicate later…
48% do so within first four weeks of FY
16% do so before new FY (?)
8% do so 8+ weeks after FY start
There is a “too early” and a “too late” for communicating quotas. Ideally,
“just right” equals within first month but only with “high confidence”.
TIMING OF QUOTA COMMUNICATION
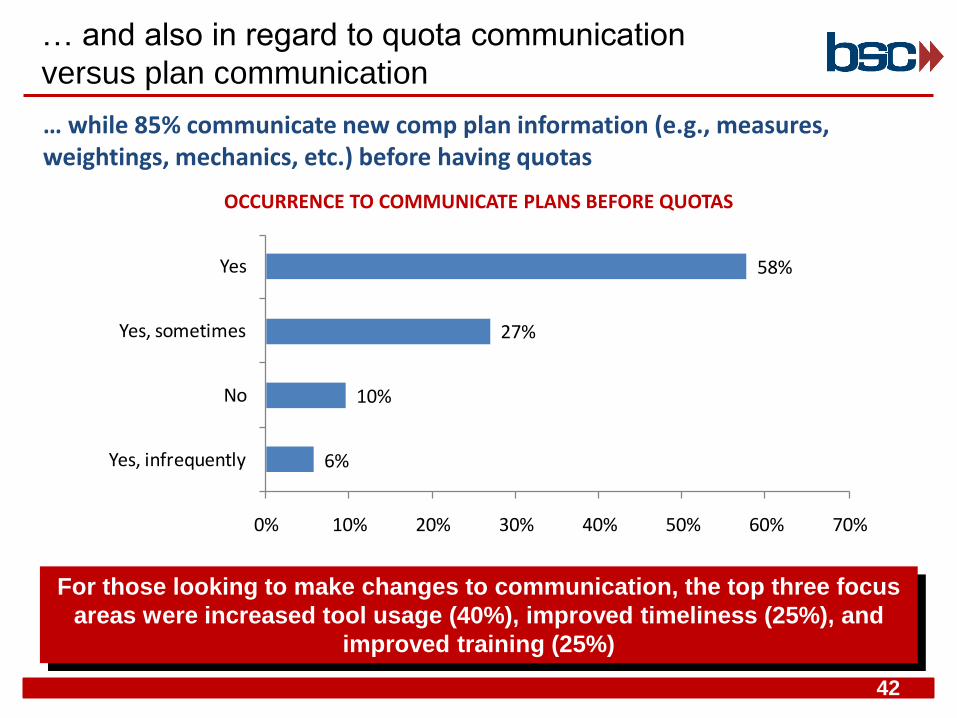
… and also in regard to quota communication
versus plan communication
42
For those looking to make changes to communication, the top three focus
areas were increased tool usage (40%), improved timeliness (25%), and
improved training (25%)
6%
10%
27%
58%
0% 10% 20% 30% 40% 50% 60% 70%
Yes, infrequently
No
Yes, sometimes
Yes
… while 85% communicate new comp plan information (e.g., measures, weightings, mechanics, etc.) before having quotas
OCCURRENCE TO COMMUNICATE PLANS BEFORE QUOTAS

Good Alignment to Four Important Practices
43
4%
6%
21%
19%
50%
0% 10% 20% 30% 40% 50% 60%
Other
Yes (10% to 15%)
Yes (5% to 10%)
Yes (0% to 5%)
No
Practice 1. Minimal use of quota over-allocations.
OVER-ALLOCATION (DIRECT REPORT TO 1st LINE MANAGER)
Only half over-allocate. When done, most do less than 10%
Excessive over-allocation can be dangerous to morale and culture.
G

Practice 2. Strong preference to allocate quotas at the individual opportunity level.
2%
2%
2%
2%
17%
75%
0% 10% 20% 30% 40% 50% 60% 70% 80%
First territory then ROI minimum
Individual and customer and/or team
Mix of both above
Utilize both
Role based
Individual Opportunity (territory/account) based
Good Alignment to Four Important Practices cont
44
QUOTA SETTING METHODOLOGY
True “opportunity-based” quotas are a clear best practice. Role-based can
work effectively when opportunities are relatively equal.
4 times as many use individual opportunity versus role-based goals

0%
0%
6%
4%
50%
23%
17%
0% 10% 20% 30% 40% 50% 60%
0% top down/100% bottom up
10% top down/90% bottom up
25% top down/75% bottom up
50% top down/50% bottom up
75% top down/25% bottom up
90% top down/10% bottom up
100% top down/0% bottom up
Good Alignment to Four Important Practices cont
45
TOP DOWN VERSUS BOTTOM UP
Practice 3. Some balance of top-down and bottom-up quota setting.
Reality check: top-down triumphs but hopefully bottom-up opportunity is
considered
60% factor in bottom-up analysis as a 25%+ factor

2%2%2%2%2%
4%12%
13%33%
81%
0% 10% 20% 30% 40% 50% 60% 70% 80% 90%
Annual with quarterly seasonalityDaily
Multi-yearQtrly bonuses
KPIs vary (monthly, some quarterly, etc.)weekly
MonthlySemi-annually
QuarterlyAnnually
Good Alignment to Four Important Practices cont
46
DISCRETE MEASUREMENT PERIOD
Practice 4. “Appropriate” measurement period = annual.
While the recent economic uncertainty led some to consider shortened
goal periods, annual still dominates as a market and best practice.
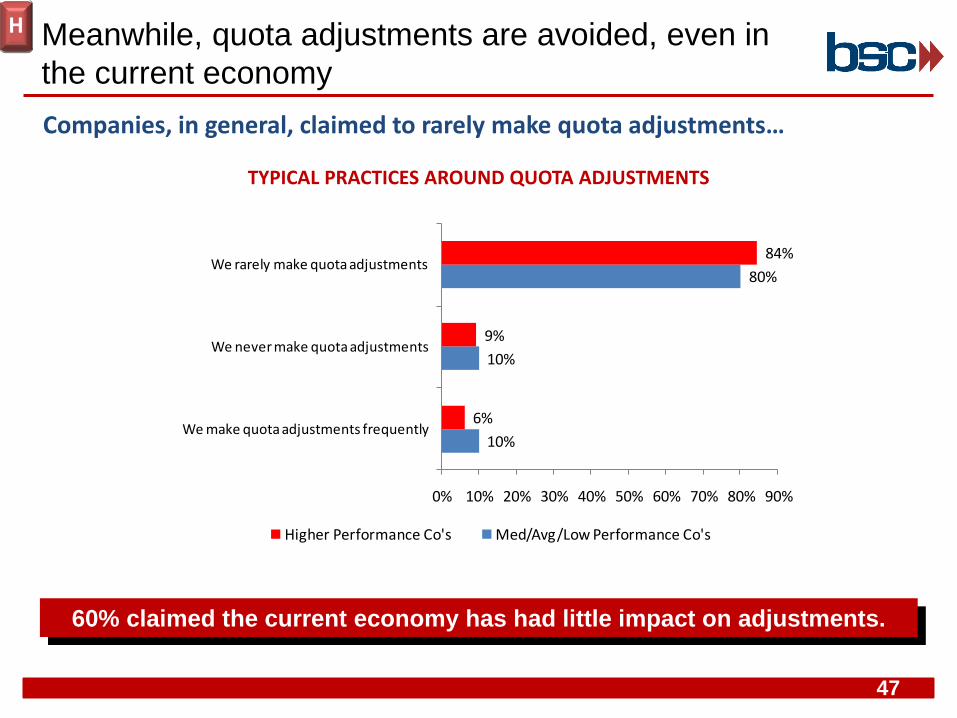
Meanwhile, quota adjustments are avoided, even in
the current economy
47
10%
10%
80%
6%
9%
84%
0% 10% 20% 30% 40% 50% 60% 70% 80% 90%
We make quota adjustments frequently
We never make quota adjustments
We rarely make quota adjustments
Higher Performance Co's Med/Avg/Low Performance Co's
TYPICAL PRACTICES AROUND QUOTA ADJUSTMENTS
Companies, in general, claimed to rarely make quota adjustments…
60% claimed the current economy has had little impact on adjustments.
H

When used, quota adjustments usually do not
impact a large number of quotas
48
6%
2%
0%
2%
4%
4%
0%
14%
10%
58%
0% 10% 20% 30% 40% 50% 60% 70%
91% to 100%
81% to 90%
71% to 80%
61% to 70%
51% to 60%
41% to 50%
31% to 40%
21% to 30%
10% to 20%
<10%
When used, most adjust less than 10% of quotas, typically stemming from changes to coverage model (59%), disruptive changes to market (59%), and errors in quota setting (41%).
PERCENT OF QUOTAS ADJUSTED – MOST POPULATED DIRECT SALES ROLE
58% adjust fewer than 10% of quotas
A surprising 8% adjusted more than 80% of quotas

Conclusion
• Effective quota setting continues to be the backbone of success in
both growth planning and impactful sales compensation programs
• Quota setting is an area prime for continuous improvement
– There is no ―end game‖ in your quota setting process – but there is
continual improvement and increased confidence over time
• The future should include:
– Improved tools
– More sophisticated modeling and calculations
– Greater rigor
• But as quotas are a prediction of the future, and confounding variables
were always arise, the main goals should be reasoned quotas, well-
communicated processes, and ideals of truly ―fair‖ targets
• Having the right process is essential – communicating that process to
the field is a smart strategy – avoid the ―black box‖ complaints
49

Ted Briggs Principal Phone: (310) 245-4686 Email: [email protected]
Fred Sass Director, Product Marketing Phone: (416) 987-0130 Email: [email protected]
Clinton Gott Principal Phone: (310) 968-3408 Email: [email protected]
www.bettersalescomp.com www.varicent.com
Questions and Contact Information
50

© Copyright 2011 The Sales Management Association
Thank You.

About Better Sales Comp Consultants
• Create better sales compensation programs and sales effectiveness programs
• Having held leadership roles within national and global firms, BSC consultants
offer large-firm capability with small-firm flexibility and cost-effectiveness
• Feature senior level delivery, collaboration, and partnership with our clients
• Industry experience includes high tech, consumer products, medical devices,
pharmaceuticals, financial services, retail and other verticals
52
Ted Briggs Clinton Gott Features over 70 years of
combined industry
experience, with team
members:
• Per Torgersen
• Datta Davé
• Larry Novacich
BSC Consultants
Detailed biographies at www.bettersalescomp.com

About Varicent
53
A global software company focused on variable compensation programs
#1 fastest growing Software Company on Deloitte Fast 500 for all of North America
Sales Performance Management
Fred Sass, Director of Product Marketing
• Over 20 years of experience in technology companies – AT&T, ConceptWave Software, Tira Wireless, Casero, Varicent Software
• Responsible for product marketing strategy and execution for the Varicent Sales Performance Management (SPM) software solution
• MBA from McMaster University


![Configuring the Quota Manager - cisco.com€¦ · † Configuring the Quota Manager—Example, page 3-9 Configuring the Quota Profile Settings The [Quota Profile.QUOTA-PROFILE-NAME]](https://img.pdfslide.us/doc/110x75/5f0783767e708231d41d5b40/configuring-the-quota-manager-ciscocom-a-configuring-the-quota-manageraexample.jpg)