Embed Size (px)
Citation preview
�������� ����� ��
Approaches to quantitative reconstruction of woody vegetation in managedwoodlands from pollen records
M.J. Bunting, M.J. Grant, M. Waller
PII: S0034-6667(15)00199-2DOI: doi: 10.1016/j.revpalbo.2015.10.012Reference: PALBO 3702
To appear in: Review of Palaeobotany and Palynology
Received date: 7 July 2015Revised date: 12 October 2015Accepted date: 13 October 2015
Please cite this article as: Bunting, M.J., Grant, M.J., Waller, M., Approaches to quan-titative reconstruction of woody vegetation in managed woodlands from pollen records,Review of Palaeobotany and Palynology (2015), doi: 10.1016/j.revpalbo.2015.10.012
This is a PDF file of an unedited manuscript that has been accepted for publication.As a service to our customers we are providing this early version of the manuscript.The manuscript will undergo copyediting, typesetting, and review of the resulting proofbefore it is published in its final form. Please note that during the production processerrors may be discovered which could affect the content, and all legal disclaimers thatapply to the journal pertain.

ACC
EPTE
D M
ANU
SCR
IPT
ACCEPTED MANUSCRIPT
1
Approaches to quantitative reconstruction of woody vegetation in
managed woodlands from pollen records
Bunting, M.J.a*, Grant, M.J.b and Waller, M.c
a Department of Geography, Environment and Earth Sciences, University of Hull, Cottingham Road,
Hull, HU6 7RX. E-mail: [email protected]
b Coastal and Offshore Archaeological Research Services (COARS), Ocean and Earth Science, National
Oceanography Centre Southampton, University of Southampton, European Way, Southampton,
SO14 3ZH
C Department of Geography and Geology, Kingston University, Penrhyn Road, Kingston upon Thames,
Surrey, KT1 2EE, UK

ACC
EPTE
D M
ANU
SCR
IPT
ACCEPTED MANUSCRIPT
2
Abstract
There has been increasing interest in developing quantitative methods for reconstructing
the dynamics of cultural landscapes over the last 15 years. This paper adds to this literature
by using various approaches to reconstruct the vegetation of two woodlands subject to
rotational coppicing (the periodic cutting of broadleaved trees and shrubs for wood
products). Pollen deposition at ground level was determined at both sites using 'Tauber'
traps placed near to the centre of 14 compartments of differing age in the coppice rotation.
For the main woody taxa, Relative Pollen Productivity (RPP) estimates were derived using
linear regression for pollen influx data and Extended R-value analysis for percentage data.
The vegetation around three ponds was reconstructed by applying four methods (inverting
the two RPP estimate approaches, the modern analogue technique and correction for pollen
productivity using the linear regression estimated RPP values) to pollen data obtained from
the uppermost sample of sediment from the ponds. To determine whether these methods
gave better estimates of the vegetation composition than the original pollen proportions,
the results were compared with the surveyed vegetation around each pond using the Bray-
Curtis Index. Linear regression of pollen influx produced RPP values which are comparable
with previous European studies, while for some taxa the Extended R-value analysis
produced estimates which are orders of magnitude different both from values derived from
the linear regression and previous work. No single approach performed equally well at
reconstructing the vegetation around the ponds, and at two of the three locations the
uncorrected pollen proportions were most similar to the surveyed vegetation. We conclude
that applying quantitative reconstruction methods to individual small sites is, currently, not
likely to be useful in complex cultural landscapes. In the context of coppiced woodland,

ACC
EPTE
D M
ANU
SCR
IPT
ACCEPTED MANUSCRIPT
3
deficiencies in our understanding of pollen taphonomy and the impact of the practice on
pollen production first need to be rectified, and we identify strategies to address this
situation.

ACC
EPTE
D M
ANU
SCR
IPT
ACCEPTED MANUSCRIPT
4
Keywords: coppicing, modern pollen–vegetation relationships, palaeoecology, pollen dispersal and
deposition models, woodland management
Highlights
RPPQuercus values for 8 tree types in coppiced woodland in England are presented
Values are comparable with other European studies
Four methods of reconstructing vegetation from pollen were tested on surface pond
sediments
No reconstruction approach performed well consistently across the three ponds used
ACC
EPTE
D M
ANU
SCR
IPT
ACCEPTED MANUSCRIPT
5
1. Introduction
Many parts of the world are dominated by cultural landscapes: those where the present day
vegetation cover is the product of both natural environmental factors (such as climate, geology and
local topography) and human activity, both direct and indirect, over long time scales. Pollen analysis
of sediment cores offers evidence of changes in vegetation over time, which can then be translated
into reconstructions of land cover and the impact of processes such as human activity assessed.
Most translation is still qualitative yet questions related to the dynamics of cultural landscapes, such
as the extent of woodland clearance, have driven many recent developments in the interpretation of
pollen data, such as the PolLandCal Network’s activities (reviewed in Gaillard, et al. 2008). More
recently, the LANDCLIM project has demonstrated the potential of using records from large
sedimentary sites (>500-750ha) or combining large numbers of small sites to reconstruct the relative
abundance of the main plant taxa present in regional landscapes, allowing changes in the extent and
distribution of woodland, heathland, pasture and crop land (Marquer, et al. 2014; Trondman, et al.
2015) to be mapped across areas measured in hundreds of square kilometres. Reconstructing
cultural landscape processes at smaller, more ‘human’ scales in quantitative terms remains
challenging, although various strategies have been proposed and are being explored (Sugita, 2007a;
Bunting and Middleton, 2009; Sugita, et al. 2010a, Tipping, et al. 2009).
All these reconstruction methods depend, implicitly or explicitly, on being able to quantify the
amount of pollen contributed to a sedimentary pollen assemblage by different plant taxa. This varies
depending on a range of factors concerning both the producing plant (such as reproductive strategy,
plant height, vegetation structure) and the receiving sedimentary system (e.g. size, system type). In
the vast majority of the literature, pollen productivity is assumed to be a constant, at least for a
given taxon in a given region over a given time period. Estimates of pollen production are usually
expressed as a ratio to a reference taxon, or Relative Pollen Productivity (RPP), and empirical
estimations of abundance of the main taxa recorded in a region’s pollen records, has been a fruitful

ACC
EPTE
D M
ANU
SCR
IPT
ACCEPTED MANUSCRIPT
6
area of recent research in Europe (e.g. Broström, et al. 2008; Mazier, et al. 2012a etc.) and beyond
(e.g. Duffin and Bunting, 2008; Bunting, et al. 2013; Li, et al. 2015).
The assumption that a single RPP can be assigned to a taxon is clearly a simplification. At range
limits, climate conditions are known to affect pollen production (e.g. Sugita, et al. 2010a; Mazier, et
al. 2012b), and many plants vary investment in flowering facultatively in response to environmental
stressors such as grazing or light availability. Using an ecological approach, Waller et al. (2012)
showed that flowering rates, and therefore pollen production, vary over time as a result of the
woodland management practice of coppicing, and used a simulation approach to explore the effect
of those variations on the representation of tree taxa in pollen records from landscapes as the
management practices changed. Similarly Baker (2012) has shown that heavy grazing can have a
suppressive effect on Poaceae pollen production. This may explain some of the differences in pollen
productivity estimated in different studies, for example Broström et al. (2004) report results from
grazed meadows which show common forb pollen types to have higher productivity than grasses,
whereas Hjelle (1998) found the opposite when analysing samples from hay meadows. Grazing
suppression of Poaceae has also been used to support arguments that the pre-farming landscapes of
north-west Europe included extensive grazed grasslands despite producing tree-dominated pollen
records (Vera, 2000; Mitchell, 2005). In this paper, we present estimates of RPP from coppiced
woodlands derived from modern pollen assemblages, rather than ecological methods, and consider
the implications for reconstruction of past vegetation cover around small ponds in tree-rich habitats.
Coppicing was a common form of sustainable woodland management across northern Europe, with
evidence for its practice going back into prehistory. Traditionally a means of controlling and
maximising the production of timber, underwood and wood derivatives (e.g. charcoal) from
woodlands, coppicing is recognised as a key factor in determining the characteristics of ‘heritage’
woodlands such as the extent of spring ground flora like Hyacinthoides non-scripta or provision of
ACC
EPTE
D M
ANU
SCR
IPT
ACCEPTED MANUSCRIPT
7
nesting sites for Luscinia megarhynchos, and is increasingly being reintroduced as a conservation
measure. In coppiced woodland, some trees are allowed to grow to maturity with a single trunk
(standards), but the majority of trees are cut back periodically, leading to regrowth of multiple stems
from a near-ground-level base (the stool). Flowering of these coppiced plants will differ from
standards, at least in the early years of regrowth. Differences will arise from a range of factors,
including variations in the length of time branches of individual species take to reach sexual
maturity, competition between regrowths and changing light conditions in the below-canopy
growing environment related to the canopy type and density of the standards.
Waller et al. (2012) explore the pollen signal from three coppiced woodlands with different species
compositions, using a range of methods. Direct measurement showed that flowering response to
coppicing varied widely by species. For the studied tree species Tilia cordata and Alnus glutinosa, the
overall amount of pollen produced is substantially reduced even when there are long intervals
between cutting events. In contrast, Corylus avellana regrowths flower within 1-2 years of coppicing.
This species therefore produces pollen under the shortest of likely cutting regimes and pollen
production during the early stages of regrowth appears to be higher than in later stages due to the
reduction of competition for light from nearby stools. Records from the sediments of small ponds
within these coppiced woods, sampled contiguously at high (annual to sub-annual thickness)
resolution, showed patterns which could be interpreted in terms of known woodland history, but
determining unambiguous markers of coppice management which could be used in the
interpretation of palaeoecological records was not possible. Zones of sediment inwash associated
with local disturbance during winter cutting were probably the strongest single indicator observed.
The differences between pollen assemblages collected in pollen traps placed in the middle of areas
(compartments) of coppice of different age could not be simply explained as the result of years since
cutting, probably due to local variations in vegetation composition and structure. The background
pollen component, that sourced from beyond the compartment being studied (and therefore
ACC
EPTE
D M
ANU
SCR
IPT
ACCEPTED MANUSCRIPT
8
originating from compartments of different ages), appears to have been substantial. Using the
information about flower production, estimates of relative pollen productivity from Southern
Sweden (Sugita, et al. 1999; Broström, et al. 2008) were adjusted to give multiple values for each of
the key coppiced taxa reflecting pollen production at different regrowth stages. These values were
then used in simulations to explore the effects of landscape-scale changes in woodland management
regime (proportion of landscape under coppicing, duration of coppice cycle) on the pollen
assemblages deposited in small and large lakes and in a wooded peatland. These simulations
supported inferences of coppicing from oscillations seen in Neolithic pollen records, especially in
East Anglia and the northern Alpine Forelands, but the study as a whole suggested that the pollen
signal from these complex cultural landscapes was likely to be highly variable and that simple,
unambiguous signals of management could not be defined, even for pollen records from small
basins with restricted source areas in landscapes which are believed to record woodland dynamics at
the stand scale (Bradshaw, 1981a; Calcote, 1995).
The adjusted values used for modelling assumed that the overall RPP for the taxa in the managed
woodlands, reflecting the pollen production of both canopy trees and coppice stools of all ages, was
comparable to the estimates from southern Sweden presented by Sugita et al. (1999). In this paper
we test that assumption by estimating RPP for the main woody taxa based on both percentage and
influx pollen data from the Tauber trap records presented by Waller et al. (2012). These RPP values
are then used to reconstruct vegetation cover around the small ponds studied by Waller et al. (2012)
from the pollen assemblages in the uppermost year of sedimentation, to investigate whether simple
(and simplistic) reconstruction approaches improve the interpretation of such assemblages
significantly over a narrative interpretation based on the raw pollen assemblage. Comparing the
different approaches and their assumptions with the actual vegetation allows us to identify ways
forward to develop more realistic reconstructions of complex cultural landscapes with a multi-
layered vegetation structure.
ACC
EPTE
D M
ANU
SCR
IPT
ACCEPTED MANUSCRIPT
9
2. Field sites
Three woodlands in East Anglia, UK (Figure 1), currently subject to coppice management, were
selected for investigation by Waller et al. (2012). At Chalkney Wood (51°54’N 0°43’E; Fig 1b) in
central Essex, Tilia cordata is the main coppiced species but in some parts of the wood it is co-
dominant with Castanea sativa and less commonly with Carpinus betulus, Fraxinus excelsior, Acer
campestre or Corylus avellana. Quercus robur is the main standard species, though other species,
including Tilia cordata, were recorded as ‘maidens’ (non-pollarded or coppiced trees) in 2007/8. The
ground vegetation is dominated by Hyacinthoides non-scripta with Rubus spp. and Pteridium
aquilinum. The site is cut on an approximately 25 year rotation.
[INSERT FIGURE 1 HERE]
At Bradfield Woods (52°09’N 0°06’W) in Suffolk (Fig 1c), the coppiced stools consist predominantly
of Corylus avellana and Fraxinus excelsior, with Alnus glutinosa co-dominant over an area of about
40 ha. Primula elatior, Filipendula ulmaria and Mercurialis perennis are common in the ground flora
where the wood overlies boulder clay and Rubus spp., Pteridium aquilinum and Hyacinthoides non-
scripta dominate in areas overlying sand. The standards are largely Quercus robur and Betula spp.,
mostly less than 70 years old. The majority of Bradfield Woods is managed on a 20+ year rotation.
Tree data from the third site studied by Waller et al. (2012), Hayley Wood, were not included in
these analyses because, unlike the other woods, only a small part of Hayley is coppiced.
3. Estimates of relative pollen productivity
3.1. Introduction/background
Estimates of Relative Pollen Productivity (RPP) presented here are based on a widely used model of
the pollen-vegetation relationship which assumes that pollen deposited at a point is proportional to
the vegetation cover around that point, with a taxon-specific correction factor reflecting the amount
ACC
EPTE
D M
ANU
SCR
IPT
ACCEPTED MANUSCRIPT
10
of pollen produced per unit contributing to the pollen dispersal by each taxon. The basic approach
used in much work within this tradition (Andersen, 1970; Prentice, 1985, 1988; Jackson, 1990, 1994;
Sugita, 1993 et seq.) is a simple linear model of the form:
Pollen deposition at point of one type = (amount of pollen produced by those plants) x (proportion
transported from plant to point) summed across all the plants within the source area + background
transport of pollen of that type from beyond the source area
Which can be expressed algebraically as:
Equation 1
where yik = pollen influx from type i at site k, ik = the distance-weighted plant abundance of taxon i
around site k and i and i are constants, the pollen productivity and background pollen component
of taxon i in the studied region respectively. Pollen productivity, which can be thought of as the
amount of pollen produced per vegetation unit (which can be defined in different ways; most
commonly it is conceptualised as the vertical projection coverage of the plant within a vegetation
canopy, but other options such as biomass are also possible), is generally treated as a constant for a
given taxon in a given region (but see e.g. Mazier, et al. 2012). The background component depends
on the abundance of the specific taxon in the sampled region, and can vary in both space and time.
Details of the distance weighting of vegetation models have been discussed in multiple places (e.g.
Prentice, 1988; Jackson, 1994; Nielsen, 2005; Bunting, et al. 2013). In this paper, we use the Sutton-
Prentice distance-weighting algorithm (Sutton, 1953; Prentice, 1985, 1988; Appendix 1), which varies
with plant taxon and involves making the following assumptions:
1) Even wind distribution around the compass during pollen dispersal

ACC
EPTE
D M
ANU
SCR
IPT
ACCEPTED MANUSCRIPT
11
2) Majority of pollen transport takes place above the vegetation canopy (Cc from the Tauber
model dominates; Tauber 1965, 1967)
3) The vegetation canopy is a single, flat layer
4) Pollen deposition occurs within a gap in said canopy (this is important to remove effects of Ct
and Cg).
Assumption 1 is considered to be reasonable. However, assumptions 2-4 are problematic for small
ponds, forest hollows or pollen traps, and for coppiced sites. Figure 2a shows the simplified situation
underlying the Prentice-Sutton pollen dispersal and deposition algorithm (hereafter, P-S model). In
the P-S model, pollen is dispersed in all directions around each source, and the amount of pollen
deposited at the sampling point is calculated by working out the contribution from all pollen sources
in all directions around the basin, and summing the results.
[INSERT FIGURE 2 HERE]
At relatively coarse scales, these assumptions are reasonable: where a basin is large enough, the
variations in pollen deposition associated with the change in height of the vegetation surface and
therefore air flow path at the vegetation edge (see e.g. Raynor, 1971; Caseldine, 1981) are not likely
to have a significant effect on the pollen signal at the sampling point since such ‘edge effects’ seem
to extend only 50-100m at most into the basin (Bunting, et al. 2013). This can be explained using the
Tauber model by arguing that pollen dispersal within the canopy (Ct and Cg in the Tauber model;
Tauber, 1965, 1967) occurs over relatively short distances and therefore makes little contribution to
a bog-centre sample (the ‘edge effect’ is in essence made up of two components: trunk space and
gravitic deposition; and turbulence-related deposition/entrainment processes as the air stream
changes height and the surface roughness also changes).

ACC
EPTE
D M
ANU
SCR
IPT
ACCEPTED MANUSCRIPT
12
The P-S model has been applied with reasonable success to small hollows and ponds (e.g. Calcote,
1995, Sugita, et al., Sugita, et al. 2010b) in woodlands, suggesting that even within the ‘edge effect’
distance, the assumption of above-canopy pollen transport dominance is a reasonable
approximation. Coppiced woodlands present an additional challenge to the P-S model assumptions,
since the canopy roughness and porosity varies through the coppice cycle. Figure 2b below shows a
small hollow in a coppiced woodland. In the mature compartment (left hand side of figure) the
regrowths and standards together form a closed canopy with fairly even surface, but in early stages
(right hand side of figure) standards emerge from lower-growing stools, creating an uneven canopy
layer with greater porosity, suggesting that the boundary layer of turbulent, pollen-carrying air is
thicker, and therefore that the pollen transport situation is more complex.
In this study, we will continue to assume a flat vegetation canopy with pollen release and transport
occurring at/above the uppermost vegetation, although this assumption is clearly stretched to its
limits.
3.2. Pollen data
Contemporary (annual) pollen deposition at ground level was investigated using 'Tauber' traps,
following the design of Hicks and Hyvärinen (1999). Three traps were placed in a cluster (< 1 m
apart) near to the centre of 14 compartments in each wood, a minimum of 20 m from the
compartment edge. The compartments sampled were those coppiced in the previous year and
compartments 'aged' up to 7 years (when available) and thereafter at age intervals of approximately
three years. Traps were set up in October 2006 and collected after a full year. All trap pollen samples
were processed following the methodology of Hicks et al. (1996), including the addition of tablets of
exotic pollen to allow the calculation of pollen influx (Stockmarr, 1971). A minimum of 1000 total
land pollen (TLP) grains were counted from each trap and influx calculated in grains cm-2 yr-1.

ACC
EPTE
D M
ANU
SCR
IPT
ACCEPTED MANUSCRIPT
13
This study used pollen assemblages from Tauber traps which were deployed for a single year,
allowing precise relationships between the stage of the coppice compartment and the pollen
assemblage deposited within it to be studied. Most surface sample studies (see e.g. Broström, et al.
2008) use moss samples which average pollen deposition over an unspecified number of years (e.g.
Räsänen, et al. 2004), or averaged pollen influx from multiple years of Tauber trap deployment (e.g.
Sugita et al. 2010a). Whilst these methods do reduce the effects of climate-related interannual
variability in plant flowering (e.g. Autio and Hicks, 2004; Huusko and Hicks, 2009; Jackson and
Kearsley, 1998), they would have blurred the signal of the coppice cycle which we seek to study.
Three closely grouped traps were deployed at each location, which enabled us to both include some
replication within our analyses and screen our data for possible distortion from non-airborne modes
of pollen deposition, such as from anthers or pollen-bearing insects falling into the trap. Influx data
for a defined taxon from a single trap was removed from analysis if the difference in values between
that trap and the other two traps was greater than an order of magnitude, and that difference in
influx was greater than the difference explained by calculated counting error (Maher, 1972; 1981).
Tauber trap placement was determined by the goals of the broader study (Waller et al. 2012),
therefore the sampling strategy is systematic (trap arrays are in the central area of compartments)
rather than random in order to maximise the likelihood of detecting years since cutting related
changes in the pollen signal. Randomised sampling strategies are considered the most effective for
studies of RPP (Broström et al. 2005) but systematic sampling can still yield meaningful results
(Twiddle et al. 2012).
3.3. Vegetation data
Vegetation data from the compartments in which the traps were set were collected within a
minimum 20m radius area centred on the trap. The position of all woody plants and, for trees, size
(trunk circumference at breast height), was recorded. These data were then translated into
ACC
EPTE
D M
ANU
SCR
IPT
ACCEPTED MANUSCRIPT
14
percentage canopy cover for each taxon (see appendix 1) and used to calculate vegetation
composition for 10m wide rings out to 100m around the trap. These rings were then distance
weighted using the P-S model and summed to give cumulative distance weighted plant abundances
at different distances, which we hereafter refer to as dwpa(z) where z is the distance between the
centre of the trap array and the outer edge of the largest ring included in the summation.
3.4. Data analysis approach
Equation 1 is linear when pollen values for taxon i are independent of each other, for example with
pollen influx data, and an algebraic solution for the value of the constants can be found for each
taxon separately using empirical data. However, where pollen data for taxon i are expressed as
percentages, they become interdependent, and an iterative approach has to be taken to estimate
the constants; the Extended R-Value approach has been developed for this situation (Parsons and
Prentice, 1981; Prentice and Parsons, 1983).
3.4.1. Regression analysis using independent pollen influx data
The pollen data from Tauber traps can be expressed as pollen influx and therefore taxa can be
considered independent. This allows estimates of the relationship between pollen influx (hereafter
‘influx’) and dwpa(z) separately for each taxon via linear regression analysis. Relative Pollen
Productivity can then be calculated by taking the ratio of the slope terms for the taxon of interest
and the reference taxon. Each trap within the trap array was treated as a separate estimate of the
influx, therefore most sample points had multiple influx values for each vegetation value allowing
error estimation. Data pairs with zero values for both pollen and vegetation were removed from the
dataset to avoid these samples having an undue influence on the model fitting process, and a small
number of obvious outliers (values for insect-pollinated taxa lying more than an order of magnitude
above the general trend at that distance weighted vegetation value, assumed to represent

ACC
EPTE
D M
ANU
SCR
IPT
ACCEPTED MANUSCRIPT
15
deposition via insect visit to the trap rather than by aerial transport; see above) were removed from
some scatter plots.
A one-tailed null hypothesis of no positive linear relationship between dwpa and influx was tested
for each dataset using the Pearson correlation coefficient and, where the probability of the null
hypothesis was < 0.05, regression analysis was carried out to estimate the slope term (taxon pollen
productivity) and intercept (background pollen influx of the taxon). This analysis was carried out for
all ten vegetation datasets from dwpa(10) to dwpa(100) for each taxon.
Quercus was chosen as the reference taxon, since it was not found as a coppiced species at either
site, and was widely present in the vegetation, with pollen present in all samples and plants
recorded within 20m of all but five of the trap clusters and within 30m of all trap clusters. Quercus
also showed statistically significant linear correlation (Pearson product-moment correlation: p<0.01)
between cumulative dwpa(z) and influx at all distances. Pollen productivity for all taxa relative to
Quercus – hereafter RPPQuercus - was calculated by taking the ratio of the relevant slope terms, and
the standard errors on the slopes combined using propagation of errors.
As the area of vegetation included in the analysis increases, it is expected that the background influx
will decrease and the estimate of RPP stabilise. The correlation coefficient should be highest at the
distance best approximating the taxon-specific source area. Statistical analyses were carried out
using SPSS v.19.
3.4.2. Extended R-value analysis using pollen percentage data
Most published studies are based on sediment pollen assemblages rather than Tauber traps,
therefore pollen data are only available as percentages, and the Extended R-value approach is used
to estimate RPP (Parsons and Prentice, 1981; Prentice and Parsons, 1983; Sugita, 1993; Broström, et
ACC
EPTE
D M
ANU
SCR
IPT
ACCEPTED MANUSCRIPT
16
al. 2008). For comparison, pollen percentages were calculated for each compartment from the
summed influxes of each taxon in all the traps in the array, and ERV analysis was carried out. Only
those taxa which were present in both the pollen and the vegetation datasets from at least 4 plots
were included in the analysis. Analysis was carried out in PolERV (software written by R. Middleton
based on code developed by S. Sugita) using 200 iterations and running the analysis three times to
check whether a stable solution had been found for both ERV model 1 and ERV model 2. Again
Quercus was used as the reference taxon. Likelihood function score plots were created to estimate
the relevant source area of pollen (RSAP).
3.5. Results
Scatter plots comparing pollen influx and distance-weighted plant abundance to 100m (dwpa(100))
were created for the eleven palynologically distinct taxa for which multiple datapoints were
available: Acer campestre-type, Alnus glutinosa, Betula, Carpinus betulus, Castanea sativa, Corylus
avellana-type, Fraxinus excelsior, Quercus, Salix, Tilia cordata and Ulmus (Appendix 2). Inspection of
the scatters suggested that the taphonomic model assumption of a single abundance-related
dominant model of pollen delivery was not valid for all taxa.
Figure 3 shows the pollen influx plotted against dwpa(100) for Fraxinus excelsior and Quercus. Both
plots show some separation of the samples from the two woods, reflecting differences in the
abundance of the trees (e.g. Chalkney Wood samples generally have low Quercus dwpa(100) whilst
Bradfield Woods has a wider range of values) and possibly differences in pollen taphonomy. The
points outlined with a solid oval show a positive trend of increasing influx with increasing dwpa(100),
the type of pattern the Prentice-Sutton approach aims to model. Both plots also show a small
number of points where plants are highly abundant but pollen influx is low (marked with dashed
ovals on Figure 3). All points for Fraxinus excelsior are derived from Bradfield Woods. For Quercus,
these points came from both woods, and with the exception of the 1991-felled compartment in
ACC
EPTE
D M
ANU
SCR
IPT
ACCEPTED MANUSCRIPT
17
Chalkney Wood, all come from trap arrays where other traps yielded points which fell into the solid
oval. These points could reflect locations where management interventions or environmental
differences have affected the flowering of specific trees, a counting or sampling artefact, a
difference in taphonomy, or in the case of dioecious Fraxinus excelsior a dominance of female rather
than male trees at Bradfield Woods compared with Chalkney Wood. For some taxa such as Fraxinus
excelsior, a third group of points could be identified, marked by the dotted oval on Figure 3, with
high pollen influx at locations with low tree presence. This is interpreted as either showing the
effects of an additional transport mode - one delivering high influx at relatively low tree coverage
(gravity or insect-mediated transport) - or for dioecious species differences in the presence of male
trees at different sites. For this group of taxa it was not considered appropriate to continue with
model fitting assuming a single dominant mode of dispersal and deposition, and on this basis
Fraxinus excelsior, Salix and Ulmus were not analysed further. The scatterplots for Quercus and the
other seven taxa have some unexpectedly low influx points, as discussed above, but most points lie
broadly within the solid oval, suggesting that the single dominant mode of transport approach
assumed by the Prentice-Sutton model was appropriate for these data. All scatters were somewhat
‘messy’, probably due to a combination of sampling error and the contribution of other dispersal
modes in addition to the single dominant mode.
[INSERT FIGURE 3 HERE]
3.5.1. Regression analysis using independent pollen influx data
Correlation coefficients between pollen influx and cumulative dwpa at different distances are shown
in Figure 4 for the remaining 8 taxa, Acer campestre-type, Alnus glutinosa, Betula, Carpinus betulus,
Castanea sativa, Corylus avellana-type, Quercus, and Tilia cordata. Moderate to strong positive
correlations between pollen influx and dwpa were found at all distances. Correlation coefficient
ACC
EPTE
D M
ANU
SCR
IPT
ACCEPTED MANUSCRIPT
18
values are stable beyond about 30m. Where fit decreases (correlation coefficient falls) over the first
three samples (from dwpa(10) to dwpa(30); e.g. Betula, Castanea), this is interpreted as either
showing that the taxon is not effectively recorded in the vegetation beyond the area of direct survey
or as showing a strongly local taphonomic relationship. However, the explanatory power of the
linear models varies widely, with r2 values (proportion of variance in the data explained by the
model) ranging from 0.55 (Tilia) to 0.10 (Acer) (see Table 1); explanatory power is good for taxa
which only occur as plants in Chalkney Wood (Tilia, Castanea and Carpinus) and for Corylus, but
weaker for other taxa.
[INSERT FIGURE 4 HERE]
Relative pollen productivity relative to Quercus (RPPQuercus) is estimated from the slope ratios and
summarised in table 1 and Figure 5.
[INSERT FIGURE 5 HERE]
[INSERT TABLE 1 HERE]
3.5.2. Extended R-value analysis using pollen percentage data
ERV-analysis was carried out as described above. Figure 6 shows the likelihood function scores for
models 1 and 2 for the data from both woods, showing that the trend in likelihood function values
obtained by both models are approaching an asymptote by 100m surveyed area, but have not yet
reached a stable point. RPPQuercus and the relevant background terms was estimated from the final
two ring values. Although model 1 output produced significantly lower likelihood function scores
than model 2, suggesting a better fit to the data, the RPPQuercus values were considered less plausible
than for model 2 for Carpinus, Castanea and Tilia, which are only found in Chalkney Wood (see table

ACC
EPTE
D M
ANU
SCR
IPT
ACCEPTED MANUSCRIPT
19
1). RPPQuercus values are summarised in Table 1, and show marked differences from the values
estimated from influx data using regression analysis for most taxa, with differences in rank order as
well as the actual productivity value. Since some taxa were only recorded in the surveyed
compartments at Bradfield Woods (Alnus) or at Chalkney Wood (Castanea, Carpinus, Tilia), the
dataset was then split according to wood of origin and reanalysed, but small sample size led to
highly variable output suggesting that the algorithm could not find a single preferred solution.
[INSERT FIGURE 6 HERE]
4. Applications in reconstruction
The purpose of estimation of RPP is to estimate vegetation cover from palaeo-pollen assemblages.
The complex multi-layered and managed woodland canopy is clearly not an ideal target, but
woodland is hugely important and interesting to end users of pollen records. Waiting until we have a
perfect method is, we consider, not a good strategy – refining the method has to go hand in hand
with actually applying the imperfect methods we have available in order to test model assumptions
and refine the approaches necessary to permit validated reconstructions to be achieved. Pond
sediment pollen assemblages are available from three ponds in the woods investigated here, and
vegetation surveys were carried out around the ponds when sediments were collected (Waller, et al.
2012). Therefore reconstruction of vegetation can be attempted by comparing the linear regression
derived RPPQuercus values on the one-year pollen samples, with the surveyed vegetation to determine
whether, at this early stage, one or more of these quantitative reconstruction is a worthwhile aid to
interpretation of the pollen assemblages from such ponds.
4.1. The ponds
ACC
EPTE
D M
ANU
SCR
IPT
ACCEPTED MANUSCRIPT
20
A pond at the south-east corner of Bradfield Woods (Figure 1) was cored and is referred to
informally as “Bradfield Pond”. The pond surface area is about 75m2, therefore occupies less than a
third of the inner 10m radius ring (314m2) in area. The pond lies in a compartment last coppiced in
1995 and adjacent to one coppiced in 2000, with the main coppiced species Corylus avellana. The
pond is quite close to the edge of the present-day woodland; all non-woodland land was treated as
non-pollen producing for the purposes of extrapolating vegetation data between 20 and 100m
radius.
Two ponds were investigated at Chalkney Wood (Figure 1), informally named “Alder Pond” (A on
Figure 1) and “Vegetation Pond” (B on figure 1). “Alder Pond” lies close to the boundary between
compartments last cut in 1987 and 1984 respectively, and has a surface area of around 180m2. The
name derives from a single large stool of Alnus glutinosa on the north-east bank of the pond, the
only specimen of that species recorded during vegetation survey in the whole of Chalkney Wood.
The surrounding vegetation is dominated by coppice stools and standards of Tilia cordata and
Castanea sativa. “Vegetation Pond” lies close to the boundary of two compartments last cut in 1999
and 2002 respectively, and to the boundary with a coniferized section of the Chalkney Wood located
north-east of and directly adjacent to the coppiced section studied; this was treated as non-pollen
producing when extrapolating the vegetation data. This pond has an area of about 50m2 and Tilia
cordata is the main species present locally as both coppice stools and maidens.
4.2. Distance-weighted plant abundance
The centre of the surveys carried out was positioned within the centre of each pond. Pond surfaces
were treated as non-pollen producing areas, which has an equivalent effect to setting the basin
radius to a non-zero value in the weighting model, and otherwise the vegetation data to 100m
radius around the centre point were processed as described above (in section 3.3) and in Appendix
ACC
EPTE
D M
ANU
SCR
IPT
ACCEPTED MANUSCRIPT
21
1. For reconstruction purposes tree species composition was expressed as the percentage of the
total dwpa to 100m radius for the eight tree taxa studied – hereafter expressed as %dwpa(100).
4.3. Pollen assemblages
Ponds were cored using a modified Livingston-type corer (Wright, 1967), and a chronology
constructed using SCP profiles, 210Pb and 137Cs profiles (see Waller, et al. 2012, Supplementary data
2, for full details). Cores were sampled contiguously, and sample thickness was chosen to be
equivalent to or less than annual resolution. Age models were consulted to determine how many
samples would be combined to represent the 2007 pollen influx (“Bradfield Pond” 3 samples, “Alder
Pond” 2 samples and “Vegetation Pond” 1 sample). Standard pollen preparation methods were used
(Moore, et al. 1991) and Lycopodium tablets added to enable the concentration of pollen
accumulation rates (PARs). A minimum of 1000 TLP grains were counted per sample.
Since each pond represented a small canopy opening, and the pollen traps were considered to be
under the vegetation canopy, pollen influx (and hence annual PAR) might be expected to be lower in
the ponds, but since nearly all influx values measured in the ponds fell within the range of values
obtained from the pollen traps this was ignored.
4.4. Data analysis
Four reconstruction methods were applied to the three pollen assemblages. Firstly, the inverse of
each of the methods used to estimate RPPQuercus was applied, prediction of dwpa(100) from pollen
influx using the linear model (converted to % dwpa(100) for comparison purposes), and application
of the inverse form of the ERV equations (Prentice and Parsons, 1983). Secondly, two other simple
reconstruction techniques were applied; the Modern Analogue Technique (identifying the most
similar assemblage from the available pollen traps, e.g. Overpeck, et al. 1985); and Correction for
Pollen Productivity using the linear regression estimated RPP values (the approach used by Davis,
ACC
EPTE
D M
ANU
SCR
IPT
ACCEPTED MANUSCRIPT
22
1963 and Bradshaw, 1981b, but applied here to dwpa rather than vegetation cover). All methods are
explained in more detail in Appendix 3. In the first three cases, since the calibration data sets relate
to Tauber traps and the target data sets are from small ponds, there are differences in the pollen
source areas and therefore proportion of background pollen loading between the two situations.
In order to determine whether the reconstruction methods gave a better estimate of the vegetation
composition than the original pollen proportions, results were compared with the measured
vegetation around each pond using the Bray-Curtis Index (Bray and Curtis, 1957; Kindt and Coe,
2006). This metric is widely used in ecology (Clarke, et al. 2006; Kindt and Coe, 2006) and was chosen
for this study because it can be used for proportion or non-proportion data, it is sensitive to both
abundance and composition, and because the output value is not affected by the numerical size of
the input value.
The equation used is:
(Equation 2)
Where IB is the Bray-Curtis Index, xik is the measurement of interest for taxon i in sample k, k and m
are the two samples being compared, and there are a total of j taxa in the combined taxon list of the
two samples taken together.
4.5. Results
4.5.1. The input data
ACC
EPTE
D M
ANU
SCR
IPT
ACCEPTED MANUSCRIPT
23
Figure 7 shows a graphical comparison of vegetation and pollen assemblage data from the three
ponds. The vegetation around “Bradfield Pond” is dominated by C, avellana, mostly as coppice
stools, and since the compartment was last cut 12 years before sampling these stools are expected
to be producing pollen less abundantly compared to the early years after coppicing (Waller, et al.
2012). The pollen assemblage contains substantially more Quercus pollen and less A. campestre and
C. avellana than the vegetation data.
[INSERT FIGURE 7 HERE]
The vegetation around “Vegetation Pond” is dominated by Tilia but much of this is in the form of
coppice stools. The compartment was last cut in 1999, and Waller et al. (2012) showed that T.
cordata flowering is heavily suppressed by coppicing for at least 20 years, so these stools were
treated as non-pollen-producing and the vegetation data recalculated accordingly (figure 7). These
adjusted vegetation data were used for the calculation of Bray-Curtis Indices shown in Figure 8.
Comparing the “Vegetation pond” corrected vegetation with the pollen assemblage, T. cordata and
C. betulus are under-represented and Betula, Quercus and to a small extent C. sativa are over-
represented.
“Alder Pond” has a single large A. glutinosa on the north-east bank, the only specimen of that
species recorded during vegetation survey in the whole of Chalkney Wood, therefore pollen will be
entering the record via gravity input as well as aerial transport. The wider vegetation is dominated
by coppice stools and standards of C. sativa with some T. cordata. In the “Alder Pond” pollen
assemblage, C. sativa and T. cordata are under-represented, and Quercus and A. glutinosa are over-
represented. This might suggest that C. sativa flowering is, like T. cordata, suppressed after
coppicing, although the same effect is not seen at “Vegetation Pond” where regrowths are actually
younger.
ACC
EPTE
D M
ANU
SCR
IPT
ACCEPTED MANUSCRIPT
24
The apparent under-representation of C. sativa in the assemblages from “Alder Pond” and of C.
betulus in “Vegetation Pond”, even though both have estimated overall RPPQuercus values,
comparable to the well- and over-represented Betula and Quercus (see Table 1), suggests that both
may experience suppression of flowering for multiple years after coppicing as observed for T.
cordata.
4.5.2. Comparison of vegetation data with pollen-based reconstructions
Figure 8 shows the Bray-Curtis indices for comparisons between % dwpa(100) at each pond and the
different pollen-derived reconstructions. The horizontal bar shows the value calculated for the
comparison shown in Figure 7, of uncorrected pollen percentages against % dwpa(100m), with other
symbols showing comparisons with the different correction methods (section 3.4 above; Appendix
3). For “Alder Pond”, the uncorrected pollen assemblage was the second-best reconstruction
method. This may be explained by the effects of coppicing suppression on flowering of not just Tilia
cordata (corrected for here) but also C. betulus and C. sativa. At “Vegetation Pond” the Modern
Analogue Technique (MAT) produced the best reconstruction, and for “Bradfield Pond”, applying the
inverse linear regression model, simple correction and MAT all produced statistically more similar
reconstructions of the vegetation than the simple pollen values. The inverse ERV method produced a
substantially less similar reconstruction.
[INSERT FIGURE 8 HERE]
4.5.3. Modern analogue technique reconstructions
The modern analogue technique reconstruction was carried out using squared-chord distances to
compare the pond assemblages with those from the Tauber traps. A distance of less than c. 0.25 is
usually taken as indicating a reasonable reconstruction when considering palaeoecological data,
ACC
EPTE
D M
ANU
SCR
IPT
ACCEPTED MANUSCRIPT
25
although thresholds as low as 0.05 have been suggested where all samples come from the same
biome (Lytle and Wahl, 2005). In this exercise, comparing ponds and traps, the identified best fit trap
analogues had distance scores between 0.09 and 0.21.
The “Bradfield Pond” pollen assemblage had closest matches with two traps placed elsewhere in
Bradfield Woods; one from a compartment felled in 1983 (distance: 0.09) and one from a
compartment felled in 1988 (distance = 0.13). Both compartments abut the edge of Felsham Hall
Wood (see Figure 1b), like the compartment where the pond is situated. Although that
compartment’s vegetation was surveyed, no pollen trap was placed within it, so an assemblage from
the specific compartment was not available as a modern analogue.
The “Vegetation Pond” pollen assemblage’s closest match was with a trap placed in compartment
113 in Chalkney Wood, which was last felled in 1987 (distance: 0.21), ironically the compartment
which actually contains “Alder Pond”. The closest analogue for “Alder Pond” was in Bradfield
Woods, in a compartment felled in 2006 (Distance: 0.158), reflecting the very local distorting effect
of the single stool of Alnus glutinosa – this species is an important coppiced taxon in parts of
Bradfield Woods, but elsewhere absent in Chalkney Wood.
5. Discussion and further work
5.1 Estimates of relative pollen productivity
Using a linear regression of pollen influx against dwpa produced RPPQuercus values which are
comparable with other published European studies (see Figure 5 above: e.g. Sugita, et al. 1999;
Broström, 2008; Mazier, et al. 2012). Whilst statistically significant differences in RPPQuercus are seen
across studies for some taxa such as Alnus, one or more of the known effects of differences in
ACC
EPTE
D M
ANU
SCR
IPT
ACCEPTED MANUSCRIPT
26
vegetation survey methods (e.g. Bunting and Hjelle, 2010), pollen sampling method (mosses versus
one year Tauber traps; Lisitsyna and Hicks, 2014), dominant habitat (Bunting, et al. 2005), climate
regions (Mazier, et al. 2012) and other environmental factors are likely to be sufficient to explain
these differences, rather than the possible data concerns raised within this study (relatively weak
explanatory power of the reference taxon, Quercus, sampling in a not entirely random way in order
to maximise the range of coppice ages represented in the datasets (trap arrays were located >20m
from any compartment edge and not directly beneath a standard, and compartments were selected
on the basis of years since last felling) and the conservative approach to data cleaning taken, only
excluding the most obvious outliers: see section 3.2). These findings support the approach to
modelling the effects of coppicing in the pollen record taken by Waller et al. (2012), where an
empirically derived single value for a taxon was modified to reflect the length of the coppice cycle
and the species-specific effects of coppicing on floral production.
Extended R-value analysis derived RPP estimates for this study were different by orders of
magnitude for some taxa, from both the linear regression estimates and from previous published
values (e.g. Sugita, et al. 1999; Broström, 2008; Mazier, et al. 2012). The sample size was small
(although in excess of the “2 samples per taxon of interest” threshold suggested by S. Sugita pers.
comm.), taxa were not randomly distributed between the woods, sampling location placement was
not purely random (see above) and the additional assumption of constant background pollen rain of
those taxa at all sites required to apply the ERV model (Parsons and Prentice, 1981) may not be
reasonable within and between coppiced woodlands. A larger than usual number of algorithm
repeats was needed to obtain stable solutions (200+ rather than the 50 iterations usually used), and
repeats of the entire analysis produced slight variations in results, suggesting that the model-fitting
process does not have a single best-fit solution. The estimated RPP values obtained using this
method are considered unreliable.

ACC
EPTE
D M
ANU
SCR
IPT
ACCEPTED MANUSCRIPT
27
For Tauber trap data with limited numbers of years available, we conclude that the linear regression
of influx against dwpa(z=estimated RSAP) is a more effective method of estimating RPPs than ERV
analysis and, where vegetation data can be collected for multiple traps in the same region, can
contribute substantially to the growing database of RPP values used for reconstruction studies (e.g.
Broström, et al. 2008; Mazier, et al. 2012).
5.2 Estimates of Pollen Source Area
Estimating RPP requires consideration of pollen source area. The RSAP (Sugita, 1994) is a widely used
estimate of the distance within which changes in both the proportion and position of vegetation
elements are reflected by changes in the pollen assemblage, and is a measurement dependent on
the whole assemblage, affected by vegetation factors such as mosaic patchiness (Bunting, et al.
2004) and evenness (Hellman, et al. 2009a). The likelihood function score plots generated by the ERV
approach (Figure 6) suggest that the RSAP is close to but has not been reached by the 100m
maximum survey distance since the curves appear to be approaching an asymptote but have not
reached it. This is in accord with other published estimates for RSAP in closed canopy woodland
which range from 50m -150m (Sugita, 1994; Calcote, 1995; Bunting, et al. 2005). Constrained
vegetation survey distance is therefore not considered to be the prime cause of the substantial
difference in RPPQuercus estimated using the two different methods.
The linear regression of influx method, on the other hand, allows us to present estimates of Taxon
Specific Source Areas (TSSA) using a similar goodness-of-fit based definition as RSAP (see e.g.
Jackson, 1990, 1994) (as contrasted with the Prentice Percentage source area; e.g. Prentice, et al
1987); the TSSA would be defined as the distance z at which the correlation between pollen influx
and dwpa(z+e) does not improve over the correlation with dwpa (z), where e is the increment of
survey distance (e.g. ring width). These values are expected to vary with taxon, depending on factors
such as grain size and plant growth form. Figure 4 shows correlation coefficients for influx against
ACC
EPTE
D M
ANU
SCR
IPT
ACCEPTED MANUSCRIPT
28
dwpa(z) for this study. All taxa reach a point where the correlation coefficient changes by less than
0.01 with added distance between 10m and 60m radius. For some taxa (Betula, Carpinus and
Castanea) the correlation initially gets worse with increasing distance of vegetation survey, contrary
to the theory. This may be an effect of differences in flowering through the coppice cycle by stools of
these taxa; in the absence of empirical data, these taxa were assumed to produce pollen at all stages
in the cycle, when present as cut stools (see 5.3 below), but the evidence from the pond surface
samples suggests this is not the case. Coupled with the change in detail of vegetation survey beyond
20m, these factors may explain the pattern seen, rather than a problem with the underlying
conceptual model.
5.3 Other coppiced taxa
The detailed ecological study of the effects of coppicing on flowering in Corylus avellana, Alnus
glutinosa and Tilia cordata of Waller et al. (2012) made it possible to calculate dwpa values excluding
non-flowering coppice stools. However, these were not the only species subject to coppicing in the
woodlands; occasional coppice stools of Acer campestre, Betula, Cornus sanguinea, Crataegus
monogyna and Salix were recorded and in places in Bradfield Woods coppiced stools of Fraxinus
excelsior were co-dominant with Corylus and/or Alnus, whilst Carpinus betulus and Castanea sativa
stools were locally co-dominant with Tilia and/or Corylus in Chalkney Wood. It is not clear if mixed-
species would have been the norm in historical and traditional practices, where coppicing was
primarily carried out to obtain materials with specific properties, rather than the modern
conservation-led approach used in many woodlands, where trees are coppiced to create specific
habitat structures. For species which are known to flower early as trees, such as Betula, the
difference in vegetation data created by allowing for flowering suppression may have not been
significant, since only one year of suppression was recorded for Corylus avellana by Waller et al.
(2012). For other taxa, which take longer to reach sexual maturity, the effect could be substantial.
Tilia cordata flowering was found to be still increasing in the oldest sites studied by Waller et al.
ACC
EPTE
D M
ANU
SCR
IPT
ACCEPTED MANUSCRIPT
29
(2012), and the tree is reported to take 60 years to reach flowering maturity from germination
(Pigott, 1991). This could also apply to Castanea (flowering age for young trees 25-30 years; Balkan
Ecology Project, n.d.) and Carpinus (flowering age around 30 years; Matthias, et al. 2012). There is
also some support for this interpretation from the comparison of vegetation and pollen assemblages
in the pond samples (section 4.5.1 above).
Without correction for the effects of coppicing on flower production, these other species are likely
to be over-estimated by the dwpa(z) data used for linear regression estimation of RPP or TSSA (5.2
above), but this over-estimation will also vary widely between sites, since the presence of single
standards close to the traps can have a large effect on the pollen influx. Therefore future work to
determine stages of flowering behaviour in other coppiced taxa, and to determine if the effects are
the same from other management activities such as pollarding, shredding and layering, will enable
better incorporation of woodland management into both simulation studies of pollen signals from
prehistoric landscapes (Hellman, et al. 2009b) and in reconstructions of past vegetation from pollen
assemblages.
5.4 Vegetation survey issues
The vegetation survey methodology, largely dictated by the demands of other parts of the overall
research project (see Waller, et al. 2012), differs markedly from other studies aimed primarily at
determining RPP ( reviewed in Bunting, et al. 2013). Very detailed survey within 20m radius of the
trap focused on stem size and position rather than crown coverage, and composition beyond 20m
was estimated using the compartment map and simplifying assumptions about compartment
composition (see Appendix 1), in addition to vegetation surveys within adjacent compartments. The
transformation of the inner area survey into ring cover data involved the simplification of organising
the data into 10m wide rings, rather than dividing the inner rings more finely as is sometimes
preferred for ERV analysis (see e.g. Broström, et al. 2008; Bunting, et al. 2013). This reduces the

ACC
EPTE
D M
ANU
SCR
IPT
ACCEPTED MANUSCRIPT
30
relative importance of trees, shrubs and stools closest to the traps in comparison to systems with
finer inner ring divisions, and may thus make comparison with other studies problematic. Bunting et
al. (2013) explore the effects of variations in ring width on the relative importance of plants in the
inner area of the survey, and show quite marked differences, which may contribute to the
anomalous results of the ERV analysis. However, translating the data collected in this project into
finer-grained rings is not a trivial proposition, and would involve making more assumptions about
the shape and extent of both tree and shrub canopies and of the growing stools (see Appendix 1 for
description of assumptions made).
All studies of vegetation for comparison with pollen data involve making decisions balancing the
time taken to complete each survey and the number of sampling points that can be surveyed, and
this remains a major limitation in studies of pollen dispersal and deposition. The ‘pollen’s eye view’
of vegetation which the survey seeks to capture is also not well understood. The collective
standardisation process used to develop the ‘Crackles Project methodology’, described by Bunting et
al. (2013), had not begun when this project was undertaken. Recording stem diameter and stool
density made ecological sense and suited the requirements of the wider research project, but the
models used for calibration assume that the ‘pollen’s eye view’ of vegetation are controlled by the
canopy so emphasise recording vegetation cover. The data transformation approach used here was
time-consuming and involved assumptions, but we believe is capable of supporting the inferences
drawn and comparisons made.
Future studies of this type would be improved by
a) using a randomised or stratified-random sample design, coupled with testing the possible
effects of sampling strategy on ERV-analysis results using simulations,
b) including direct recording of the canopy in vegetation survey, especially in the inner parts of
the survey area, to permit finer ring-width intervals for compatibility with other studies and
ACC
EPTE
D M
ANU
SCR
IPT
ACCEPTED MANUSCRIPT
31
for potential assessment using other models of pollen dispersal and deposition (see 5.5
below). Technological advances in remote sensing technologies, such as the development of
LiDAR (including ground-based systems such as portable canopy LiDAR) to record high-
resolution canopy and sub-canopy layers, and availability of unmanned aerial vehicles (UAV)
to take targeted aerial photography linked with ground truthied points and detect the
occurrence of flowering at canopy, potentially make this a less time-consuming task than in
2007.
c) extending the survey of canopy using a lower-intensity recording approach such as the
Crackles Project Methodology zone B to at least 50m around the pollen trap, and
d) recording an empirical estimate of the upper canopy composition of all the main mapped
units in the woodland (compartments not sampled for pollen, larger rides and glades, any
distinct marginal communities) to improve the data available for ring extraction. This would
permit ring data extraction beyond 100m, which would allow inclusion of the full RSAP, an
important means of improving the utility of ERV-analysis in such datasets and therefore
particularly important when only pollen percentage data are available, that is, when pollen
traps are in the form of mosses or sediments rather than Tauber traps.
5.5 Models of pollen dispersal and deposition
The vegetation distance weighting algorithm used in this paper was originally designed on the
assumption that above-canopy aerial transport is the only mode of pollen delivery from plant to
sampling point, and includes atmospheric parameters such as turbulence and wind speed which are
chosen for that transport context. However, several other modes of pollen transport are also
expected to affect the assemblages forming in Tauber traps; trunk space aerial dispersal (where
wind speed is lower and other atmospheric conditions may also differ), gravitic dispersal from
overhanging plants (since the trap arrays were not placed in large canopy openings) and insect-
borne dispersal. Incorporating these elements into a future model requires two components, first

ACC
EPTE
D M
ANU
SCR
IPT
ACCEPTED MANUSCRIPT
32
the identification of a suitable mathematical expression for the transport process and secondly
determining how to combine the different processes. The latter will include some means of
determining the relative importance of each process and confirming whether taxon specific
parameters can be transferred between models (e.g. should fall speed in trunk space and gravitic
components allow for the greater incidence of duads and larger clumps of grains dispersing through
these processes?). Additional factors to be considered might include the variable distribution of
flowering locations between tree species (some flower mostly at the top of the canopy, others
throughout the tree) and the effects of leaf emergence on the trunk space air flow and probability of
removal of grains through physical interception rather than deposition to the ground surface.
Whilst it would be relatively simple in theory to create additive models extending equation (1),
taking the form given in equation 3 below, careful empirical testing would be needed before such an
approach could be formally adopted.
Equation 3
Where yik = pollen influx from type i at site k, ik = the distance-weighted plant abundance of taxon i
around site k using an above-canopy pollen dispersal model derived weighting term, ik = the
distance-weighted plant abundance of taxon i around site k using a trunk-space pollen dispersal
model derived weighting term, ik = the distance-weighted plant abundance of taxon i around site k
using a gravity-dominated pollen dispersal model derived weighting term, and i and i are
constants, the pollen productivity and background pollen component of taxon i in the studied region
respectively.
These physical processes are not the only mode of pollen transport. Zoophilous transport is much
harder to model, and is expected to have different effects on assemblages forming in traps with
ACC
EPTE
D M
ANU
SCR
IPT
ACCEPTED MANUSCRIPT
33
open water present (e.g. Tauber traps or ponds) than terrestrial samples such as moss polsters, since
open water may actively attract animal vectors in comparatively dry habitats.
5.6 Reconstruction methods
The complex, multi-layered vegetation of managed cultural landscapes such as coppiced woodlands,
and the relatively small scale recording properties of Tauber traps and small ponds present
considerable challenges to pollen-based quantitative reconstruction approaches. Recent advances in
reconstruction approaches at the regional scale (considering vegetation composition in areas with
radii 50-100km) show the potential of these methods (Marquer, et al. 2014, Trondman, et al. 2015),
but by averaging a large number of small sites or using large (500ha plus) area sedimentary basins
the pollen signals considered contain very little of the local vegetation component. Handling the
local details recorded by small sedimentary basins is still challenging; the assumption of a single
dominant taphonomic relationship between pollen and vegetation underlying the approaches is
clearly more problematic as the size of the basin used decreases. Given these concerns, we expected
poor results from applying reconstruction approaches to the pond pollen assemblages available, but
since such reconstruction is the long-term purpose of this research programme, the results are
presented here as an indication of the work yet to do.
Figure 8 shows that no single reconstruction approach performed equally well at the three ponds,
and at one of the three ponds the uncorrected pollen proportions were most similar to %
dwpa(100), rather than any of the reconstruction methods. Processes likely to be influencing these
results include:
differences in taphonomy between ponds and Tauber traps
the influence of pond-margin vegetation (e.g. the presence of a single stool of Alnus
glutinosa at “Alder Pond” in Chalkney Wood)

ACC
EPTE
D M
ANU
SCR
IPT
ACCEPTED MANUSCRIPT
34
the possible influence of greater flowering associated with the increase in light availability
along rides and at the woodland edge, and changes in air flow associated with the
interruptions in the vegetation canopy at those locations (e.g. “Bradfield Pond” and
“Vegetation Pond” both include woodland edges and rides within their estimated RSAP,
since pond location is not determined by suitability for pollen work)
lack of knowledge of the flowering behaviour of coppice stools of some of the tree species
present. Our data as suggests that, as with Tilia cordata (Waller, et al. 2012), both Castanea
sativa and Carpinus betulus experience suppression of flowering for multiple years after
coppicing. This may also be the case for other trees frequently managed in the past such as
Fagus sylvatica.
Simulation approaches, allowing comparison of pollen signals generated both by woods of different
composition and by woods subject to different regimes of coppice management, may offer a better
way forward than production of a single numerical representation via quantitative reconstruction.
The approach demonstrated by Waller et al. (2012), where a taxon’s estimated RPP was weighted by
the coppicing stage to model the variation in flowering within the managed woodland, seems
justified by the findings presented here.
The key finding of the reconstruction section of the paper is that we are not yet in a position to apply
reconstruction to individual small sites, but we do have usable tools for using simulations to explore
possibilities and predict patterns. The prospects for quantitative reconstruction of past vegetation
from pollen records from small sites in complex cultural landscapes are not entirely gloomy – there
is clearly a vegetation signal in the pollen datasets obtained (see Figure 7 and appendix 2) - but we
are still some way from understanding that signal well enough to reconstruct past vegetation
composition and management from pollen records.
ACC
EPTE
D M
ANU
SCR
IPT
ACCEPTED MANUSCRIPT
35
6. Conclusions and recommendations for future research
This study demonstrates that palaeoecologists are not yet in a position to effectively reconstruct
vegetation around individual small sites in managed woodlands, and outline the tools needed and
approaches to obtaining them. There is a signal in the pollen data from small sub-canopy traps which
reflects the local vegetation, but that the models developed in larger basins are not sufficient to
capture its main features. The effects of manipulation of different landscape elements through
management, such as the creation of different aged blocks of regrowth within a coppiced woodland,
create variations in the pollen production which are averaged out in sites with large RSAPs. For small
sites, these variations probably need to be explicitly identified and incorporated in reconstruction
approaches, and reconstructions which are probabilistic and multi-scenario are more realistic than
achieving robust single quantifications of past vegetation.
In this paper, we show that linear regression of pollen influx from Tauber traps against distance
weighted plant abundance generates RPPQuercus values for eight tree taxa which are comparable with
previous European studies (e.g. Sugita, et al. 1999; Mazier, et al. 2012), whilst ERV analysis results
were unreliable. For Tauber trap data with limited numbers of years available, we conclude that the
linear regression of influx against dwpa(z=estimated RSAP) is a more effective method of estimating
RPPs than ERV analysis and, where vegetation data can be collected for multiple traps in the same
region, can contribute substantially to the growing database of RPP values used for reconstruction
studies (e.g. Broström, et al. 2008; Mazier, et al. 2012). This could be of particular use in locations
where natural pollen traps such as moss polsters and small ponds are not readily available, such as
semi-arid Mediterranean and grassland communities.
Incorporating the differences in flowering with coppice stage for the three taxa studied by Waller et
al. (2012), Corylus avellana, Alnus glutinosa and Tilia cordata, improved the relationship between
vegetation and pollen signal. An important next step towards the reconstruction of coppiced

ACC
EPTE
D M
ANU
SCR
IPT
ACCEPTED MANUSCRIPT
36
woodlands is to determine the effects of coppicing on flowering in other important taxa such as
Betula, Castanea and Carpinus, and to extend investigation to other types of management such as
pollarding, shredding and layering. Similar effects are likely to affect the dominant taxa of other
habitats subjected to management, such as grazed grassland (Baker, 2012) or moorland subject to
grazing and burning and also merit empirical study. The length of time each species takes to reach
first flowering when growing as a new tree may provide a useful indication of the likely flowering
response (i.e. enhancement or suppression of pollen production) in response to coppicing. The
palynological visibility of some taxa (e.g. Tilia) can be changed substantially by widespread
management, and this has the potential to transform our understanding of Holocene biogeography.
The complexity of pollen-vegetation relationships recorded by Tauber trap for some taxa, such as
Fraxinus excelsior (see Figure 3), clearly does not conform to the assumption of a single dominant
pollen dispersal and deposition mechanism which underlies most model-based reconstruction
approaches. Other taphonomic models can be proposed and tested using empirical approaches, and
are probably needed to achieve robust reconstruction of past vegetation from small sites.
The findings presented here show that applying quantitative reconstruction methods based on the
assumption that above-canopy pollen transport is the dominant taphonomic mode to individual
small sites in the coppiced woodlands studied here (and likely in other complex cultural landscapes)
is not currently a useful activity. Validation of methods using statistical comparisons of surveyed and
reconstructed vegetation data offers a useful check on the effectiveness of reconstruction strategies,
and could be used more widely, especially for sites where the underlying assumptions are only
weakly met such as small canopy openings or non-circular lakes and ponds. At present, there are
too many gaps in our understanding of the effects of management on pollen production of key taxa
and of the pollen taphonomy in sub-canopy settings, especially for taxa with complex flowering and
pollination strategies such as Fraxinus excelsior. This project has taken bold steps in attempting to

ACC
EPTE
D M
ANU
SCR
IPT
ACCEPTED MANUSCRIPT
37
resolve some of these knowledge gaps and has helped to identify methodological considerations
that could be adopted in future studies to test and shed light on understanding pollen-vegetation
relationships within such complex managed landscapes. Given the interaction of factors creating the
pollen signal in such systems, we also argue that a probabilistic, multiple scenario type
reconstruction approach is likely to be more meaningful and appropriate in these systems than
single quantitative representations of past vegetation.
Acknowledgements
We would like to thank the managers and owners of Bradfield Woods (Peter Fordham and the
Suffolk Wildlife Trust) and Chalkney Wood (Dougal Urquhart and Essex County Council) for providing
access to the sites and their collaboration with the project. Claire Ivison (Kingston University) drafted
Figure 1. Anonymous referees provided helpful comments on an earlier version of the manuscript.
The research was funded by the award of a grant from the Leverhulme Trust (F/00 520/E) to the
authors.

ACC
EPTE
D M
ANU
SCR
IPT
ACCEPTED MANUSCRIPT
38
Glossary
PAR: Pollen Accumulation Rate
RPP: Relative Pollen Productivity
RSAP: Relevant Source Area of Pollen
TLP: Total Land Pollen
TSSA: Taxon Specific Source Areas
UAV: Unmanned aerial vehicle
ACC
EPTE
D M
ANU
SCR
IPT
ACCEPTED MANUSCRIPT
39
References
Andersen, S.T., 1970. The relative pollen productivity and pollen representation of North European
trees, and correction factors for tree pollen spectra. Danmarks Geologiske Undersøgelse
Series II 96, 1–99.
Autio, J., Hicks, S., 2004. Annual variations in pollen deposition and meteorological conditions on the
fell Aakenustunturi in northern Finland: potential for using fossil pollen as a climate proxy.
Grana 43, 31-47.
Baker, A., 2012. Does heavily grazed vegetation show up in the pollen record? Quaternary
International 279-80, 34-35.
Balkan Ecology Project n.d. Castanea sativa. Available online at http://www.balkep.org/castanea-
sativa.html [accessed 10th June 2015]
Bradshaw, R.H.W., 1981a. Modern pollen representation factors for woods in southeast England,
U.K. Journal of Ecology 69, 45-70.
Bradshaw, R.H.W., 1981b. Quantitative reconstruction of local woodland vegetation using pollen
analysis from a small basin in Norfolk, England. Journal of Ecology 69, 941-955.
Bray, J.R., Curtis, J.T., 1957. An ordination of the upland forest communities of Southern Wisconsin.
Ecolological Monographs 27, 325-349.
Broström, A., Nielsen, A.B., Gaillard, M.J., Hjelle, K., Mazier, F., Binney, H., Bunting, J., Fyfe, R.,
Meltsov, V., Poska, A., Räsänen, S., Soepboer, W., von Stedingk, H., Suutari, H., Sugita, S.,
2008. Pollen productivity estimates of key European plant taxa for quantitative
reconstruction of past vegetation: a review. Vegetation History and Archaeobotany 17, 461-
468.
Broström, A., Sugita, S., Gaillard, M.J., Pilesio, P., 2005. Estimating the spatial scale of pollen
dispersal in the cultural landscape of southern Sweden. Holocene 15, 252-262.
ACC
EPTE
D M
ANU
SCR
IPT
ACCEPTED MANUSCRIPT
40
Bunting, M.J., Armitage, R., Binney, H.A., Waller, M., 2005. Estimates of Relative Pollen Productivity
and Relevant Source Area of Pollen for major tree taxa in two Norfolk (UK) woodlands. The
Holocene 15, 459-465.
Bunting, M.J., Farrell, M., Broström, A., Hjelle, K.L., Mazier, F., Middleton, R., Nielsen, A.B., Rushton,
E., Shaw, H., Twiddle, C.L., 2013. Palynological perspectives on vegetation survey: a critical
step for model-based reconstruction of Quaternary land cover. Quaternary Science Reviews
82, 41-55.
Bunting, M.J., Gaillard, M.J., Sugita, S., Middleton, R., Broström, A., 2004. Vegetation structure and
pollen source area. The Holocene 14, 651-660.
Bunting, M.J., Hjelle, K.L., 2010. Effect of vegetation data collection strategies on estimates of
Relevant Source Area of Pollen (RSAP) and Relative Pollen Productivity (RPP) for non-
arboreal taxa. Vegetation History and Archaeobotany 19, 365-374.
Bunting, M.J., Middleton, R., 2009. The Multiple Scenario Approach – a pragmatic method for past
vegetation mosaic reconstruction. The Holocene 19, 799-803.
Bunting, M.J., Schofield, J.E., Edwards, K.J., 2013. Estimates of Relative Pollen Productivity (RPP) for
selected taxa from southern Greenland: a pragmatic solution. Review of Palaeobotany and
Palynology 190, 66-74.
Calcote, R., 1995. Pollen source area and pollen productivity: evidence from forest hollows. Journal
of Ecology 83, 951-602.
Caseldine, C.J., 1981. Surface pollen studies across Bankhead Moss, Fife, Scotland. Journal of
Biogeography 8, 7-25.
Clarke, K.R., Somerfield, P.J., Chapman, M.G., 2006. On resemblance measures for ecological studies
including taxonomic dissimilarities and a zero-adjusted Bray-Curtis coefficient for denuded
assemblages. Journal of Experimental Marine Biology and Ecology 330, 55-80.
Davis, M.B., 1963. On the theory of pollen analysis. American Journal of Science 261, 897-912
ACC
EPTE
D M
ANU
SCR
IPT
ACCEPTED MANUSCRIPT
41
Duffin, K.I., Bunting, M.J., 2008. Relative pollen productivity and fall speed estimates or southern
African savanna taxa. Vegetation History and Archaeobotany 17, 507-524.
Gaillard, M-J., Sugita, S., Bunting, M.J., Middleton, R., Broström, A., Caseldine, C., Giesecke, T.,
Hellman, S.E.V., Hicks, S., Hjelle, K., Langdon, C., Nielsen, A.-B., Poska, A., von Stedingk, H.,
Veski, S., PolLandCal members, 2008. The use of modelling and simulation approach in
reconstructing past landscapes from fossil pollen data: a review and results from the
POLLANDCAL network. Vegetation History and Archaeobotany 17, 419-443.
Hellman, S., Bunting, M.J., Gaillard, M-J., 2009a. Relevant Source Area of Pollen in patchy cultural
landscapes and signals of anthropogenic landscape disturbance in the pollen record: A
simulation approach. Review of Palaeobotany and Palynology 153, 245-258.
Hellman, S., Gaillard, M-J., Bunting, M.J. and Mazier, F., 2009b. Estimating the Relevant Source Area
of Pollen in the past cultural landscapes of southern Sweden – a forward modelling
approach. Review of Palaeobotany and Palynology 153, 245-258.
Hicks, S., Hyvärinen, H., 1999. Pollen influx values measured in different sedimentary environments
and their palaeoecological implications. Grana 38, 228-242.
Hicks, S., Ammann, B., Latalowa, M., Pardoe, H., Tinsley, H., 1996. European pollen monitoring
programme: project description and guidelines. Technical Report. University of Oulu, Oulu.
Hjelle, K.L., 1998. Herb pollen representation in surface moss samples from mown meadows and
pastures in western Norway. Vegetation History and Archaeobotany 7, 79–96.
Huusko, A., Hicks, S., 2009. Conifer pollen abundance provides a proxy for summer temperature:
evidence from the latitudinal forest limit in Finland. Journal of Quaternary Science 4, 522-
528.
Jackson, S.T., 1990. Pollen source area and representation in small lakes of the north-eastern United
States. Review of Palaeobotany and Palynology 63, 53-76.
ACC
EPTE
D M
ANU
SCR
IPT
ACCEPTED MANUSCRIPT
42
Jackson, S.T., 1994. Pollen and spores in Quaternary lake sediments as sensors of vegetation
composition: theoretical models and empirical evidence. In: Traverse, A. (Ed.) Sedimentation
of organic particles. Cambridge University Press, Cambridge, pp 253-286.
Jackson, S.T., Kearsley, J.B., 1998. Representation of local forest composition in moss-polster pollen
assemblages. Journal of Ecology 86, 474-490.
Kindt, R., Coe, R., 2006. Tree diversity analysis: a manual and software for common statistical
methods for ecological and biodiversity studies. World Agroforestry Centre, Nairobi.
Li, Y.Y., Nielsen, A.B., Zhao, X.Q., Shan, L.J., Wang, S.Z., Wu, J., Zhou, L.P., 2015. Pollen production
estimates (PPEs) and fall speeds for major tree taxa and relevant source areas of pollen
(RSAP) in Changbai Mountain, northeastern China. Review of Palaeobotany and Palynology
216, 92-100.
Lisitsyna, O.V., Hicks, S., 2014. Estimation of pollen deposition time-span in moss polsters with the
aid of annual pollen accumulation values from pollen traps. Grana 53, 232-248.
Lytle, D.E., Wahl, E.R., 2005. Palaeoenvironmental reconstructions using the modern analogue
technique: the effects of sample size and decision rules. The Holocene 15, 554-566.
Maher, L.J., 1972. Nomograms for computing 0.95 confidence limits for pollen data. Review of
Palaeobotany and Palynology 13, 85-93.
Maher, L.J., 1981. Statistics for microfossil concentration measurements employing samples spiked
with marker grains. Review of Palaeobotany and Palynology 32, 153-191.
Marquer, L., Gaillard, M-J., Sugita, S., Trondman, A.-K., Mazier, F., Nielsen, A. B., Fyfe, R.M., Odgaard,
B.V., Alenius, T., Birks, H.J.B., Bjune, A.E., Christiansen, J., Didson, J., Edwards, K.J., Giesecke,
T., Herzschuh, U., Kangur, M., Poska, A., Schult, M., Seppä, H., 2014. Holocene changes in
vegetation composition in northern Europe: why quantitative pollen-based vegetation
reconstructions matter. Quaternary Science Reviews 90, 199-216.
ACC
EPTE
D M
ANU
SCR
IPT
ACCEPTED MANUSCRIPT
43
Matthias, I., Nielsen, A.B., Giesecke, T., 2012. Evaluating the effect of flowering age and forest
structure on pollen productivity estimates. Vegetation History and Archaeobotany 21, 471-
484.
Mazier, F., Gaillard, M-J., Kunes, P., Sugita, S., Trondman, A.-K., Broström, A., 2012a. Testing the
effect of site selection and parameter setting on REVEALS-model estimates of plant
abundance using the Czech Quaternary Palynological Database. Review of Palaeobotany and
Palynology 187, 38-49
Mazier, F., Nielsen, A.B., Broström, A., Sugita, S., Hicks, S., 2012b. Signals of tree volume and
temperature in a high-resolution record of pollen accumulation rates in northern Finland.
Journal of Quaternary Science 27, 564-574.
Mitchell, F.J.G., 2005. How open were European primeval forests? Hypothesis testing using
palaeoecological data. Journal of Ecology 93, 168-177.
Moore, P.D., Webb, J.A., Collinson, M.E., 1991. Pollen analysis, 2nd edition. Blackwell, Oxford.
Ni, J., Cao, X.Y., Jeltsch, F., Herzschuh, U., 2014. Biome distribution over the last 22,000 yr in China.
Palaeogeography, Palaeoclimatology, Palaeoecology 409, 33-47.
Nielsen, A.B., Odgaard, B.V., 2005. Reconstructing land cover from pollen assemblages from small
lakes in Denmark. Review of Palaeobotany and Palynology 133, 1-21.
Overpeck, J.T., Webb, T., Prentice, I.C., 1985. Quantitative interpretation of fossil pollen spectra –
dissimilarity coefficients and the method of modern analogs. Quaternary Research 23, 87-
108.
Parsons, R.W., Prentice, I.C., 1981. Statistical approaches to R-values and the pollen–vegetation
relationship. Review of Palaeobotany and Palynology 32, 127–152.
Pigott, C.D., 1991. Tilia cordata Miller. Journal of Ecology 79, 1147-1207.
Prentice, I.C., 1985. Pollen representation, source area and basin size: Towards a unified theory of
pollen analysis. Quaternary Research 23, 76-86.
ACC
EPTE
D M
ANU
SCR
IPT
ACCEPTED MANUSCRIPT
44
Prentice, I.C., 1988. Palaeoecology and plant population dynamics. Trends in Ecology and Evolution
3, 343–345.
Prentice, I.C., Parsons, R.W., 1983. Maximum likelihood linear calibration of pollen spectra in terms
of forest composition. Biometrics 39, 1051–1057.
Prentice, I.C., Berglund, B.E., Olsson, T., 1987. Quantitative forest-composition sensing
characteristics of pollen samples from Swedish lakes. Boreas, 43-54.
Rackham, O., 1990. Hayley Wood: its history and ecology. Cambridge Wildlife Trust Ltd, Cambridge.
Räsänen, S., 2001. Tracing and interpreting fine-scale human impact in northern Fennoscandia with
the aid of modern pollen analogues. Vegetation History and Archaeobotany 10, 211-218.
Räsänen, S., Hicks, S., Odgaard, B.V., 2004. Pollen deposition in mosses and in a modified ‘Tauber
trap’ from Hailuoto, Finland: what exactly do the mosses record? Review of Palaeobotany
and Palynology 129, 103-116.
Raynor, G.S., 1971. Wind and temperature structure in a coniferous forest and a contiguous field.
Forest Science 17, 351-363.
Stockmarr, J., 1971. Tablets with spores used in absolute pollen analysis. Pollen et Spores 13, 615-
621.
Sugita S, Hicks S, Sormunen H., 2010a. Absolute pollen productivity and pollen-vegetation
relationships in northern Finland. Journal of Quaternary Science 25, 724-736.
Sugita, S., 1993. A model of pollen source area for an entire lake surface. Quaternary Research 39,
239-244.
Sugita, S., 1994. Pollen Representation of Vegetation in Quaternary Sediments: Theory and Method
in Patchy Vegetation. Journal of Ecology 82, 881-897.
Sugita, S., 2007a. Theory of quantitative reconstruction of vegetation I: pollen from large sites
REVEALS regional vegetation composition. The Holocene 17, 229-241.
Sugita, S., 2007b. Theory of quantitative reconstruction of vegetation II: all you need is LOVE. The
Holocene 17, 243-257.

ACC
EPTE
D M
ANU
SCR
IPT
ACCEPTED MANUSCRIPT
45
Sugita, S., Gaillard, M.-J., Broström, A., 1999. Landscape openness and pollen records: a simulation
approach. The Holocene 9, 409-421.
Sugita, S., Parshall, T., Calcote, R., Walker, K., 2010b. Testing the Landscape Reconstruction
Algorithm for spatially explicit reconstruction of vegetation in northern Michigan and
Wisconsin. Quaternary Research 74, 289-300.
Sutton, O.G., 1953. Micrometeorology. McGraw-Hill, New York.
Tauber, H., 1965. Differential pollen dispersion and the interpretation of pollen diagrams. Danmarks
Geologiske Undersøgelse Series II 89, 1–69.
Tauber, H., 1967. Investigations of the mode of pollen transfer in forested areas. Review of
Palaeobotany and Palynology 3, 277–286.
Tipping, R., Bunting, M.J., Davies, A.L., Murray, H., Fraser, S., McCulloch, R., 2009. Modelling land use
around an early Neolithic timber ‘hall’ in north east Scotland from high spatial resolution
pollen analyses. Journal of Archaeological Science 36, 140–149.
Trondman, A-K., Gaillard, M-J., Mazier, F., Sugita, S., Fyfe, R., Nielsen, A.B., Twiddle, C., Barratt, P.,
Birks, H.J.B., Bjune, A.E., Bjorkman, L., Broström, A., Caseldine, C., David, R., Dodson, J.,
Doerfler, W., Fischer, E., van Geel, B., Giesecke, T., Hultberg, T., Kalnina, L., Kangur, M., van
der Knaap, P., Koff, T., Kunes, P., Lageras, P., Latalowa, M., Lechterbeck, J., Leroyer, C.,
Leydet, M., Lindbladh, M., Marquer, L., Mitchell, F.J.G., Odgaard, B.V., Peglar, S.M., Persson,
T., Poska, A., Roesch, M., Seppa, H., Veski, S., Wick, L., 2015. Pollen-based quantitative
reconstructions of Holocene regional vegetation cover (plant-functional types and land-
cover types) in Europe suitable for climate modelling. Global Change Biology 21, 676-697.
Twiddle, C.L., Jones, R.T., Caseldine, C.J., Sugita, S., 2012. Pollen productivity estimates for a pine
woodland in eastern Scotland: the influence of sampling design and vegetation patterning.
Review of Palaeobotany and Palynology 174, 67-78.
Vera, F.W.M., 2000. Grazing ecology and forest history. CABI Publishing, Wallingford.

ACC
EPTE
D M
ANU
SCR
IPT
ACCEPTED MANUSCRIPT
46
Waller, M., Grant, M.J. and Bunting, M.J., 2012. Modern pollen studies from coppiced woodlands
and their implications for the detection of woodland management in Holocene pollen
records. Review of Palaeobotany and Palynology 187, 11-28.
Wright, H.E., 1967. A square-rod piston sampler for lake sediments. Journal of Sedimentary
Petrology 37, 975-976.
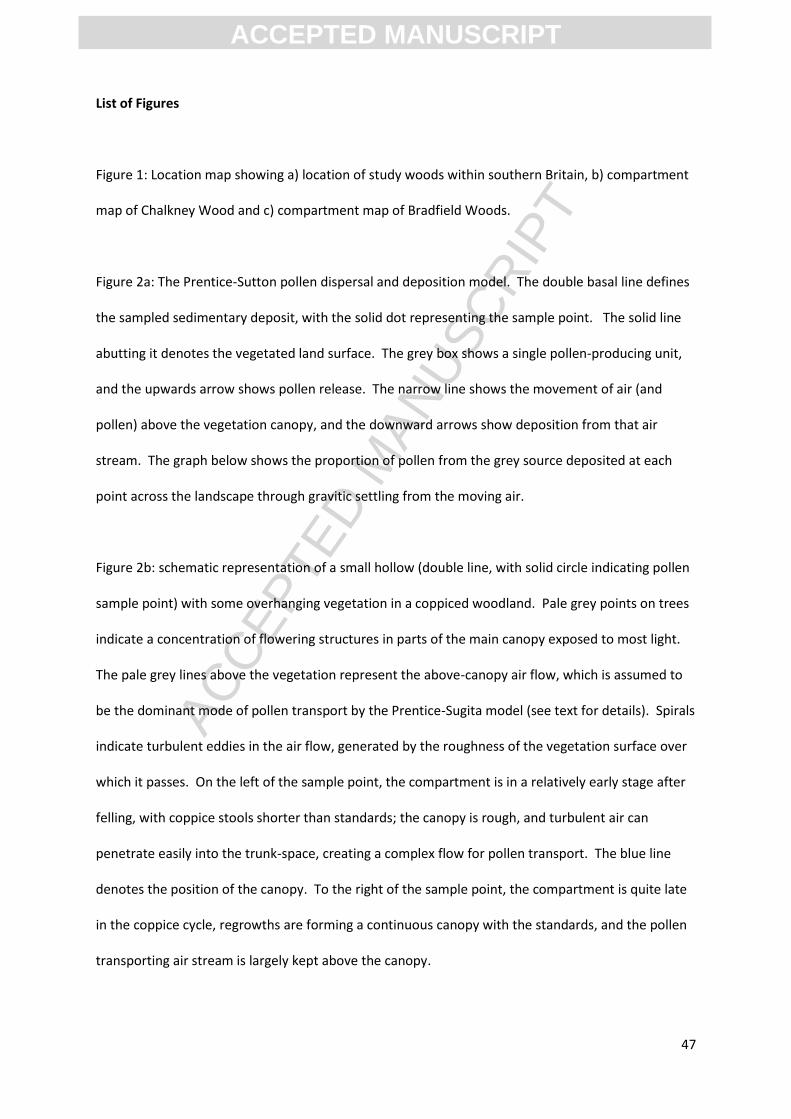
ACC
EPTE
D M
ANU
SCR
IPT
ACCEPTED MANUSCRIPT
47
List of Figures
Figure 1: Location map showing a) location of study woods within southern Britain, b) compartment
map of Chalkney Wood and c) compartment map of Bradfield Woods.
Figure 2a: The Prentice-Sutton pollen dispersal and deposition model. The double basal line defines
the sampled sedimentary deposit, with the solid dot representing the sample point. The solid line
abutting it denotes the vegetated land surface. The grey box shows a single pollen-producing unit,
and the upwards arrow shows pollen release. The narrow line shows the movement of air (and
pollen) above the vegetation canopy, and the downward arrows show deposition from that air
stream. The graph below shows the proportion of pollen from the grey source deposited at each
point across the landscape through gravitic settling from the moving air.
Figure 2b: schematic representation of a small hollow (double line, with solid circle indicating pollen
sample point) with some overhanging vegetation in a coppiced woodland. Pale grey points on trees
indicate a concentration of flowering structures in parts of the main canopy exposed to most light.
The pale grey lines above the vegetation represent the above-canopy air flow, which is assumed to
be the dominant mode of pollen transport by the Prentice-Sugita model (see text for details). Spirals
indicate turbulent eddies in the air flow, generated by the roughness of the vegetation surface over
which it passes. On the left of the sample point, the compartment is in a relatively early stage after
felling, with coppice stools shorter than standards; the canopy is rough, and turbulent air can
penetrate easily into the trunk-space, creating a complex flow for pollen transport. The blue line
denotes the position of the canopy. To the right of the sample point, the compartment is quite late
in the coppice cycle, regrowths are forming a continuous canopy with the standards, and the pollen
transporting air stream is largely kept above the canopy.

ACC
EPTE
D M
ANU
SCR
IPT
ACCEPTED MANUSCRIPT
48
Figure 3: pollen influx against dwpa to 100m: left: Fraxinus, right: Quercus. Open circles show
samples from Bradfield Woods, closed circles from Chalkney Woods. The solid oval outlines data
points which seem to conform to a linear model with a positive relationship with distance and low
slope angle, as predicted by the simple aerial transport model outlined in the text. The dashed oval
outlines points where abundant plants are associated with minimal low pollen influx. The dotted
oval on the Fraxinus excelsior plot outlines data points which show a wide range of pollen influx
values for locations where the tree is relatively uncommon
Figure 4: Pearson Product Moment Correlation Coefficients between pollen influx and cumulated
dwpa at increasing distances around the pollen traps. All values except Acer at dwpa(10) are
statistically significant at the 0.01 level (two-tailed).
Figure 5: comparing the RPPQuercus values for the eight tree taxa for this study with published
estimates derived from ERV methods, recalculated to RPPQuercus where necessary.
Figure 6: likelihood function scores for ERV analysis of the eight tree taxa, as described in the text.
Solid lines show ERV model 1 runs and dashed lines show ERV model 2 runs. Results shown for three
iterations of each model, showing that the results of runs similar but not identical (see text).
Figure 7: graphical comparison of proportions of the 8 tree taxa in terms of %dwpa(100) around
pond centres (black bars) and pollen proportions in 2007 samples (grey bars) (see text for details).
The white bars on the Vegetation Pond plot show %dwpa(100) with all Tilia stools in the survey area
assumed to be non-pollen producing (see text for details).
Figure 8: Bray-Curtis Indices from a comparison of vegetation reconstruction against measured %
dwpa to 100m radius around the pond centre for the eight tree taxa studied in this paper. The

ACC
EPTE
D M
ANU
SCR
IPT
ACCEPTED MANUSCRIPT
49
horizontal bar denotes the value for a simple comparison of pollen proportion and dwpa proportion
with no reconstruction, and other symbols show the results for different reconstruction methods
(see text for details).
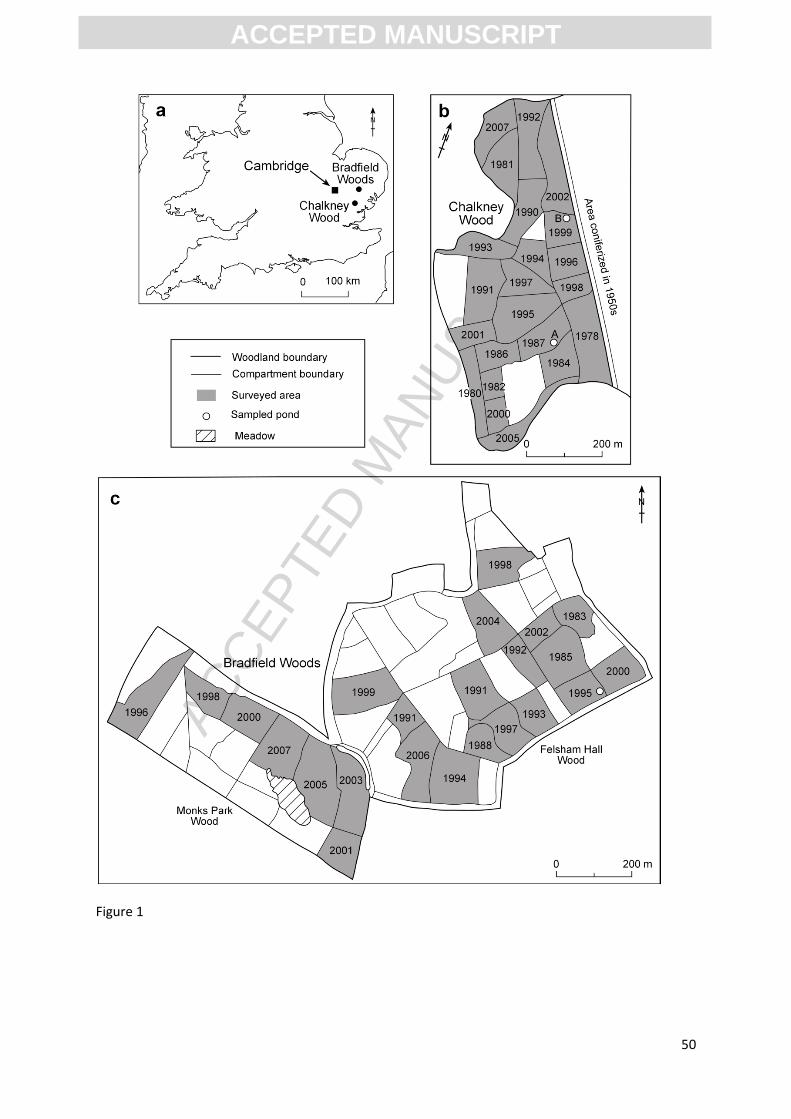
ACC
EPTE
D M
ANU
SCR
IPT
ACCEPTED MANUSCRIPT
50
Figure 1

ACC
EPTE
D M
ANU
SCR
IPT
ACCEPTED MANUSCRIPT
51
A
B Figure 2
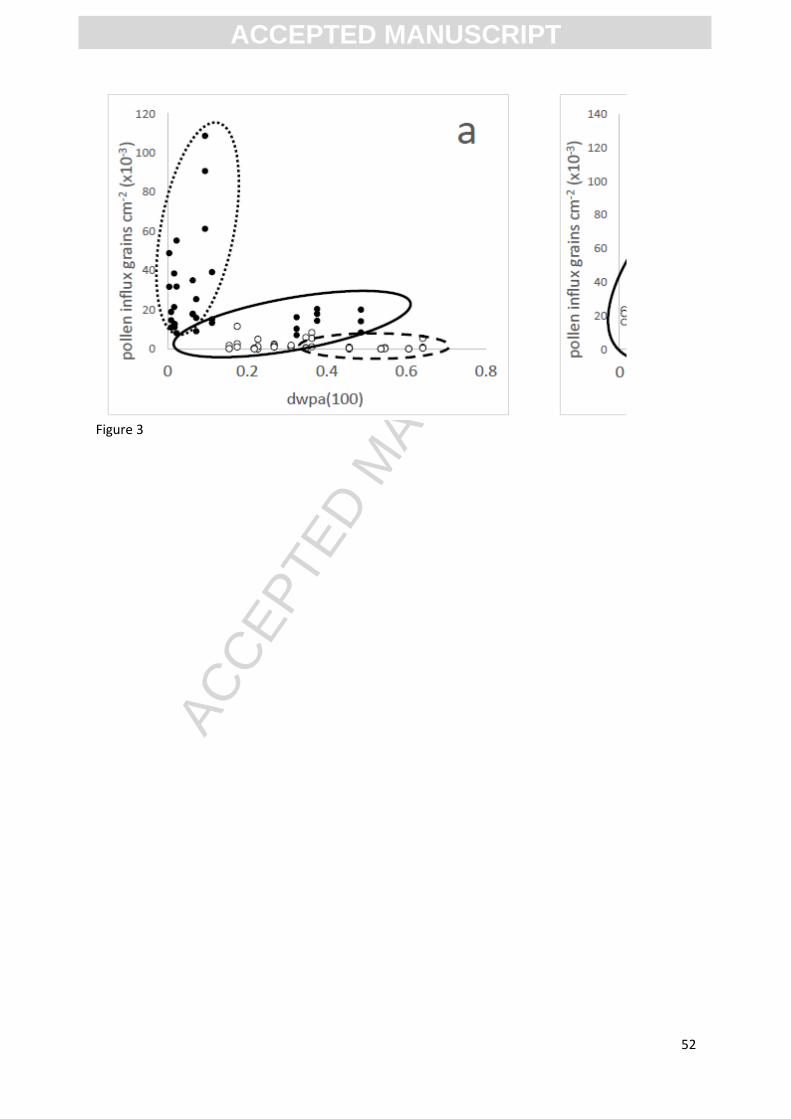
ACC
EPTE
D M
ANU
SCR
IPT
ACCEPTED MANUSCRIPT
52
Figure 3

ACC
EPTE
D M
ANU
SCR
IPT
ACCEPTED MANUSCRIPT
53
Figure 4
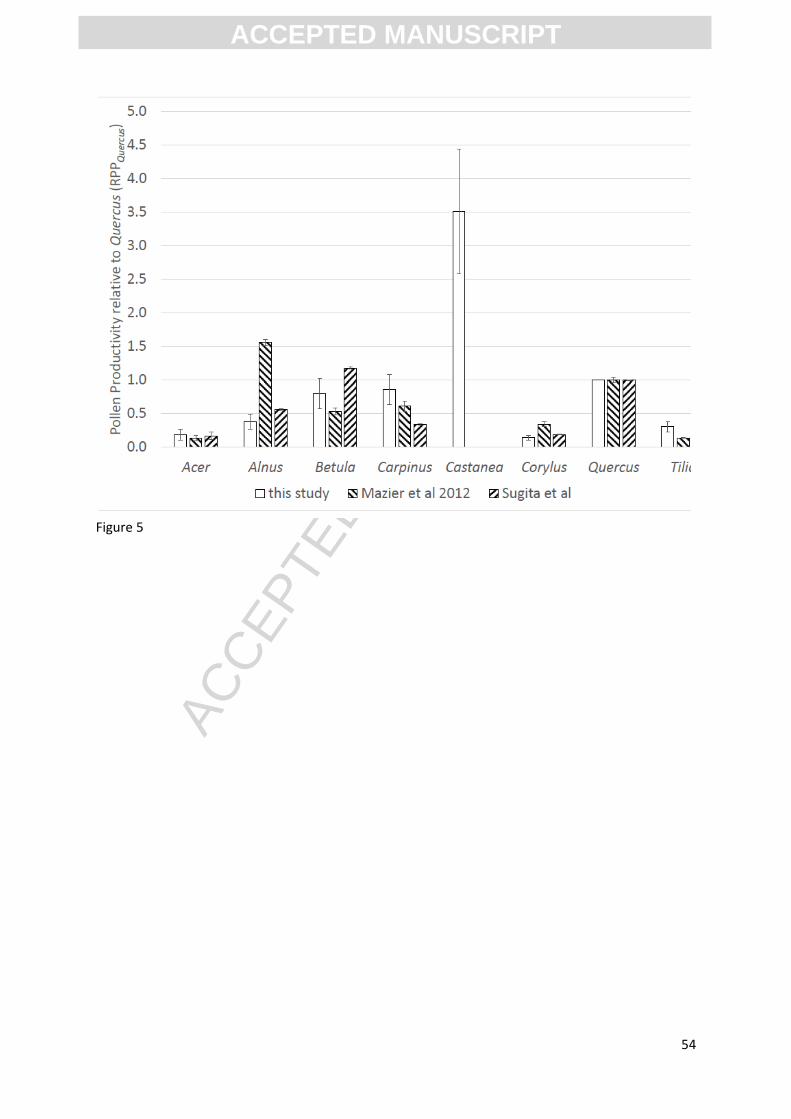
ACC
EPTE
D M
ANU
SCR
IPT
ACCEPTED MANUSCRIPT
54
Figure 5
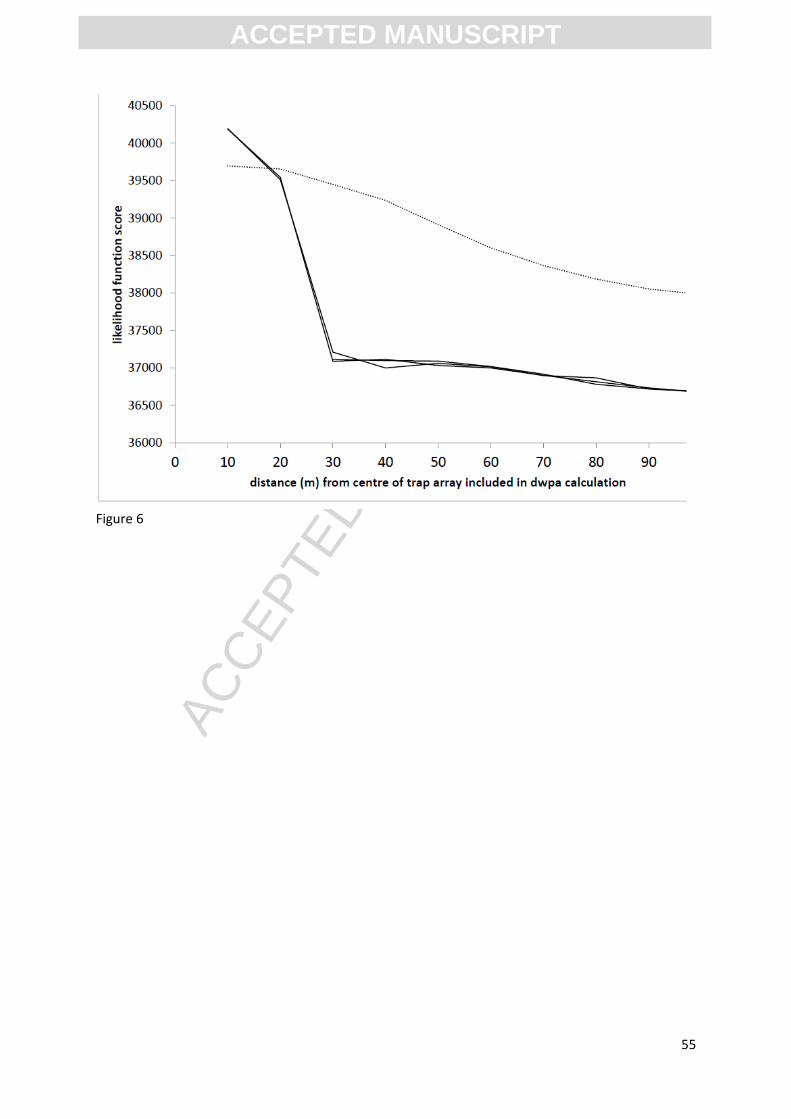
ACC
EPTE
D M
ANU
SCR
IPT
ACCEPTED MANUSCRIPT
55
Figure 6

ACC
EPTE
D M
ANU
SCR
IPT
ACCEPTED MANUSCRIPT
56
Figure 7
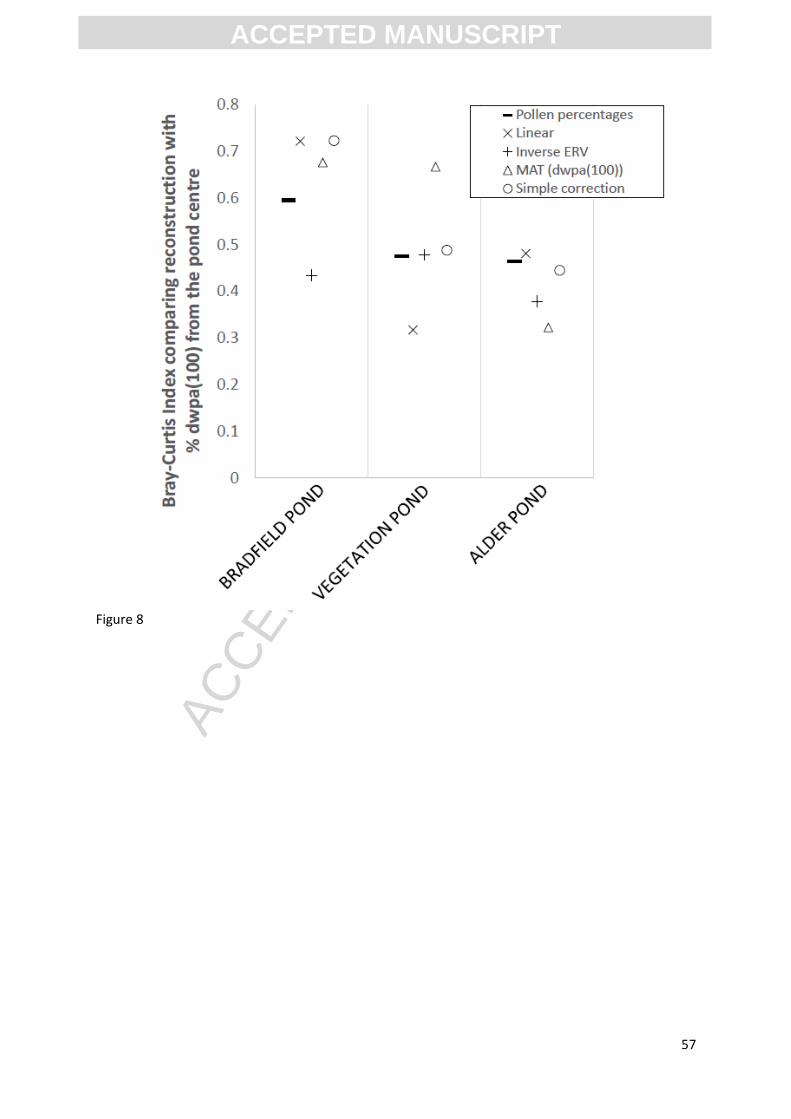
ACC
EPTE
D M
ANU
SCR
IPT
ACCEPTED MANUSCRIPT
57
Figure 8
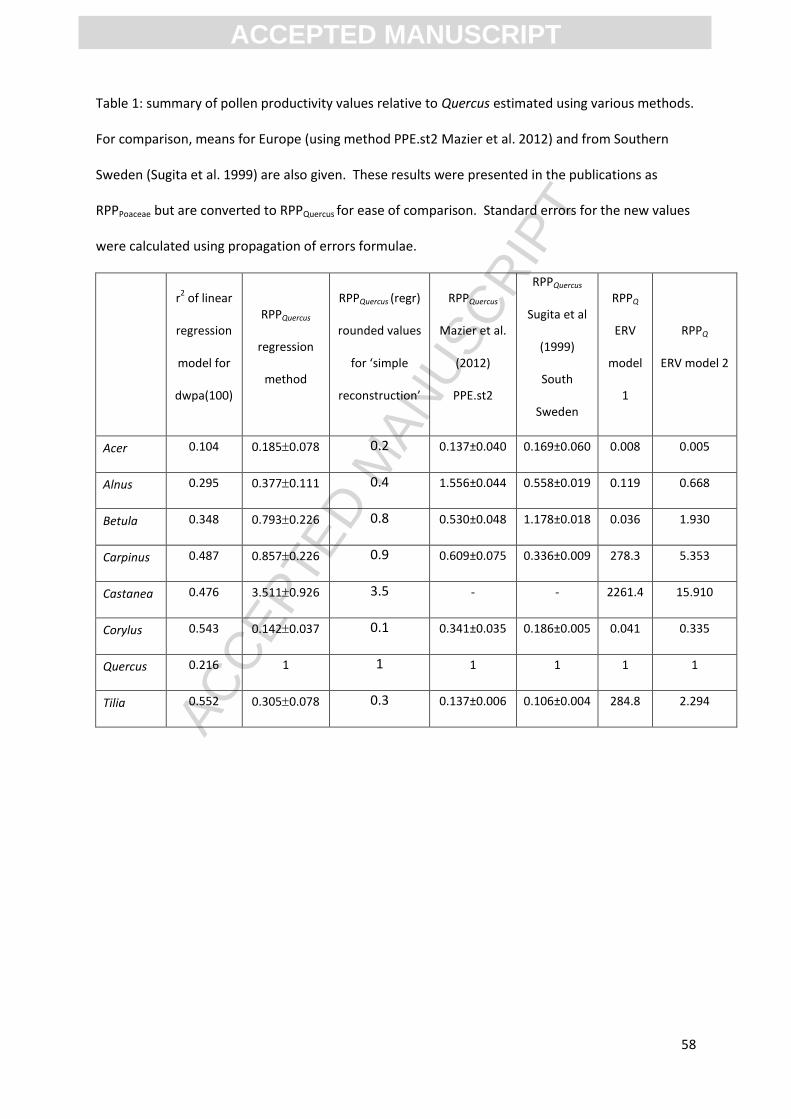
ACC
EPTE
D M
ANU
SCR
IPT
ACCEPTED MANUSCRIPT
58
Table 1: summary of pollen productivity values relative to Quercus estimated using various methods.
For comparison, means for Europe (using method PPE.st2 Mazier et al. 2012) and from Southern
Sweden (Sugita et al. 1999) are also given. These results were presented in the publications as
RPPPoaceae but are converted to RPPQuercus for ease of comparison. Standard errors for the new values
were calculated using propagation of errors formulae.
r
2 of linear
regression
model for
dwpa(100)
RPPQuercus
regression
method
RPPQuercus (regr)
rounded values
for ‘simple
reconstruction’
RPPQuercus
Mazier et al.
(2012)
PPE.st2
RPPQuercus
Sugita et al
(1999)
South
Sweden
RPPQ
ERV
model
1
RPPQ
ERV model 2
Acer 0.104 0.1850.078 0.2 0.137±0.040 0.169±0.060 0.008 0.005
Alnus 0.295 0.3770.111 0.4 1.556±0.044 0.558±0.019 0.119 0.668
Betula 0.348 0.7930.226 0.8 0.530±0.048 1.178±0.018 0.036 1.930
Carpinus 0.487 0.8570.226 0.9 0.609±0.075 0.336±0.009 278.3 5.353
Castanea 0.476 3.5110.926 3.5 - - 2261.4 15.910
Corylus 0.543 0.1420.037 0.1 0.341±0.035 0.186±0.005 0.041 0.335
Quercus 0.216 1 1 1 1 1 1
Tilia 0.552 0.3050.078 0.3 0.137±0.006 0.106±0.004 284.8 2.294