Embed Size (px)
Citation preview
Review of Natural Gas Transmission Compressor Station
Methane Emissions and Mitigation Options
Maryland Department of the Environment Natural Gas Compressor Stations Stakeholder Meeting
Compressor Station Operators Presentation
Presented by: Jim McCarthy, Innovative Environmental Solutions, Inc.
Baltimore, MD June 29, 2017
2
Agenda
Natural gas and U.S. energy use – history and projections
Methane emission estimates for transmission and storage (T&S) facilities » Background on natural gas T&S and other industry segments » Historical methane emission estimates and key emission sources » GHG Reporting Program (GHGRP) and other data
Methane reduction » Transmission pipeline blowdowns » NSPS (Subpart OOOOa) for compressor stations
– Emission sources and mitigation; LDAR implementation » EPA Natural Gas STAR – e.g., Methane Challenge BMPs
Methane from leaks: Additional details on leak emissions, LDAR technologies, and alternatives
Presentation Highlights
Natural gas use in U.S. and MD is growing and growth is projected to continue (e.g., supplant coal) » Although gas production and use has grown, methane emissions from
natural gas systems have decreased
Improved understanding of CH4 sources & emissions in recent years – e.g., from GHG reporting program (GHGRP) data, other studies » Sources and emissions by natural gas segment » GHGRP data is providing insight into emission priorities
Other than distribution systems, there are very few natural gas compression facilities in MD, so T&S methane emissions are very small
Voluntary efforts (e.g., Natural Gas STAR) and recent regulations have identified methane mitigation options
A few large leaks contribute the majority of leak emissions Technology advances (e.g., leak quantification) may be imminent
» Convergence of emissions understanding and technology provide smarter alternatives for methane reduction
3
4
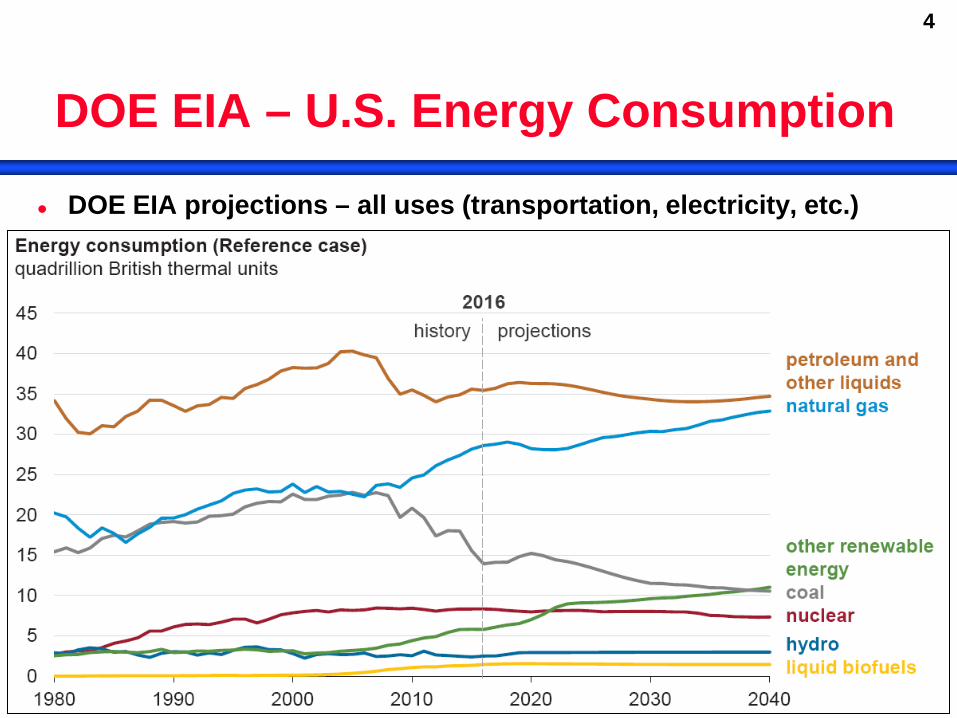
DOE EIA – U.S. Energy Consumption
DOE EIA projections – all uses (transportation, electricity, etc.)
5
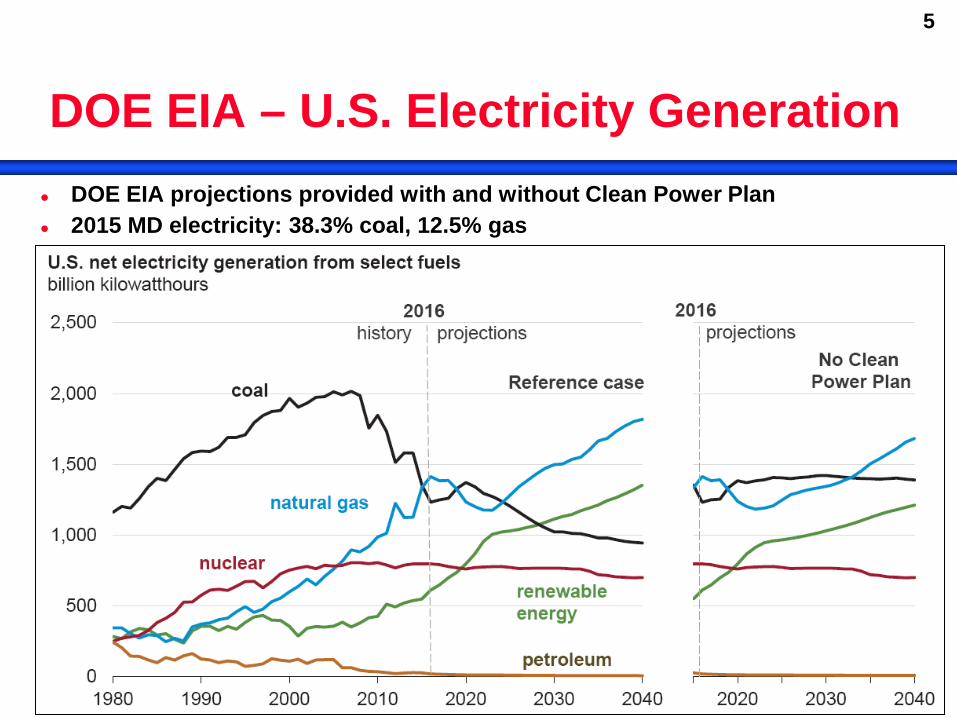
DOE EIA – U.S. Electricity Generation DOE EIA projections provided with and without Clean Power Plan 2015 MD electricity: 38.3% coal, 12.5% gas
»
6
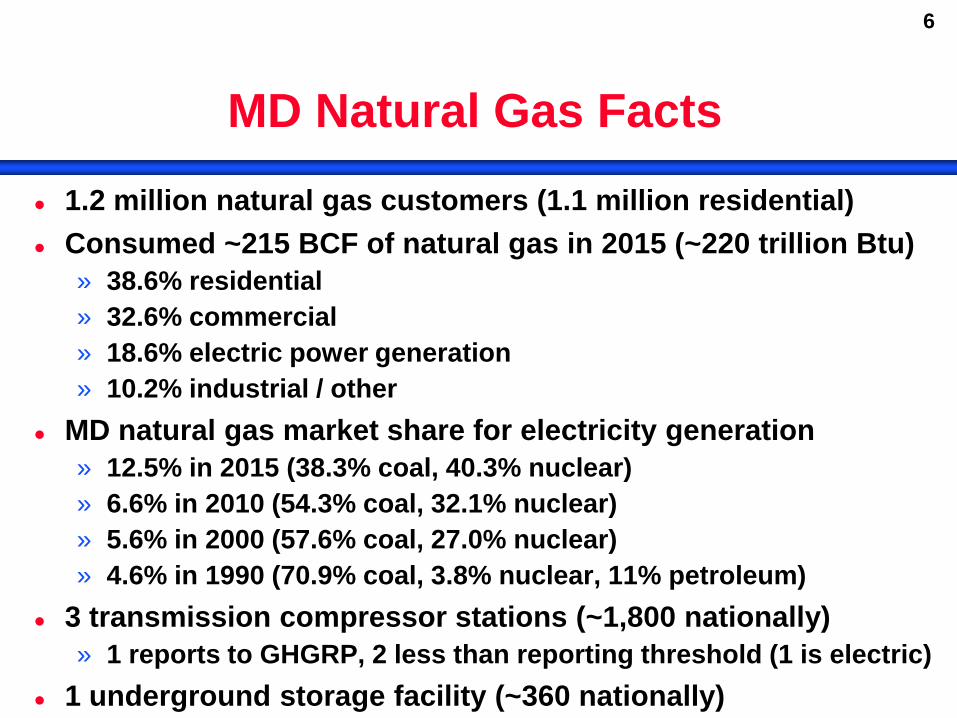
MD Natural Gas Facts 1.2 million natural gas customers (1.1 million residential) Consumed ~215 BCF of natural gas in 2015 (~220 trillion Btu)
» 38.6% residential » 32.6% commercial » 18.6% electric power generation » 10.2% industrial / other
MD natural gas market share for electricity generation » 12.5% in 2015 (38.3% coal, 40.3% nuclear) » 6.6% in 2010 (54.3% coal, 32.1% nuclear) » 5.6% in 2000 (57.6% coal, 27.0% nuclear) » 4.6% in 1990 (70.9% coal, 3.8% nuclear, 11% petroleum)
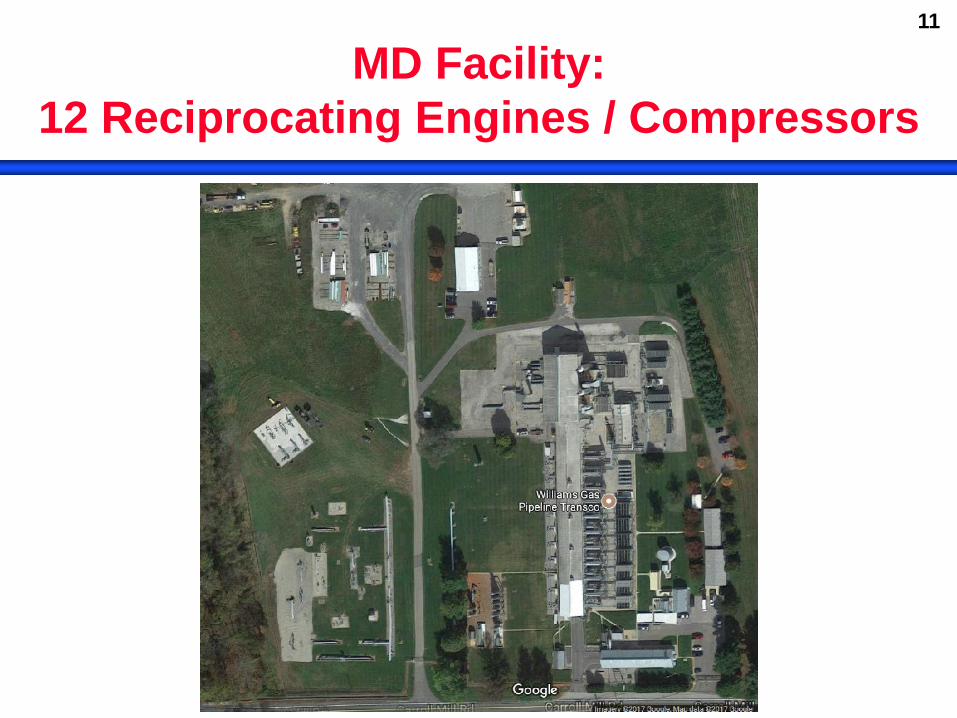
3 transmission compressor stations (~1,800 nationally) » 1 reports to GHGRP, 2 less than reporting threshold (1 is electric)
1 underground storage facility (~360 nationally)
7
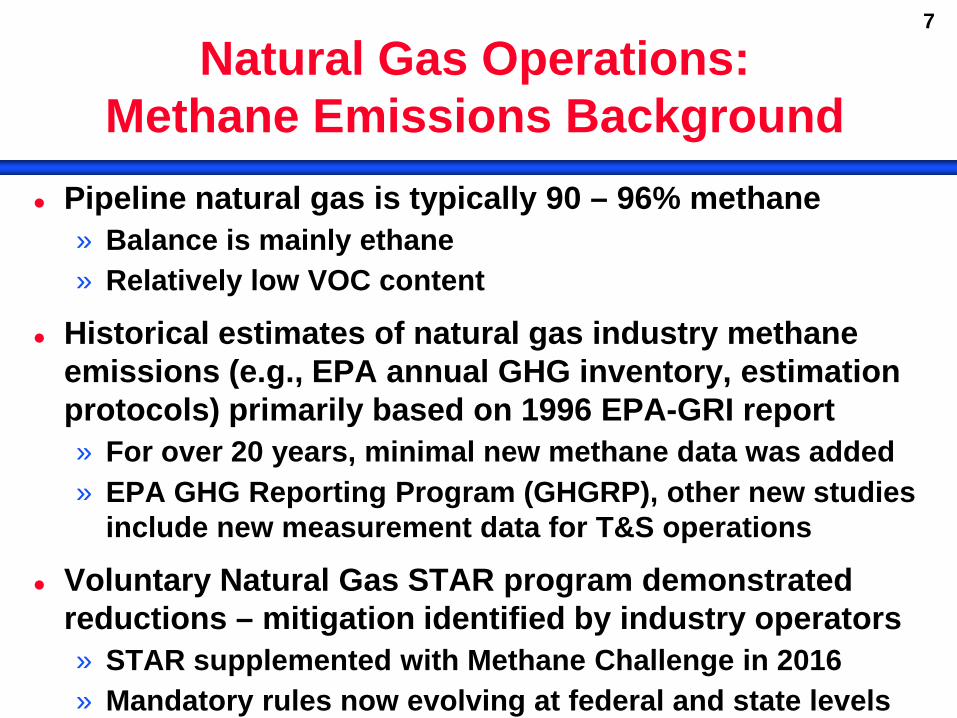
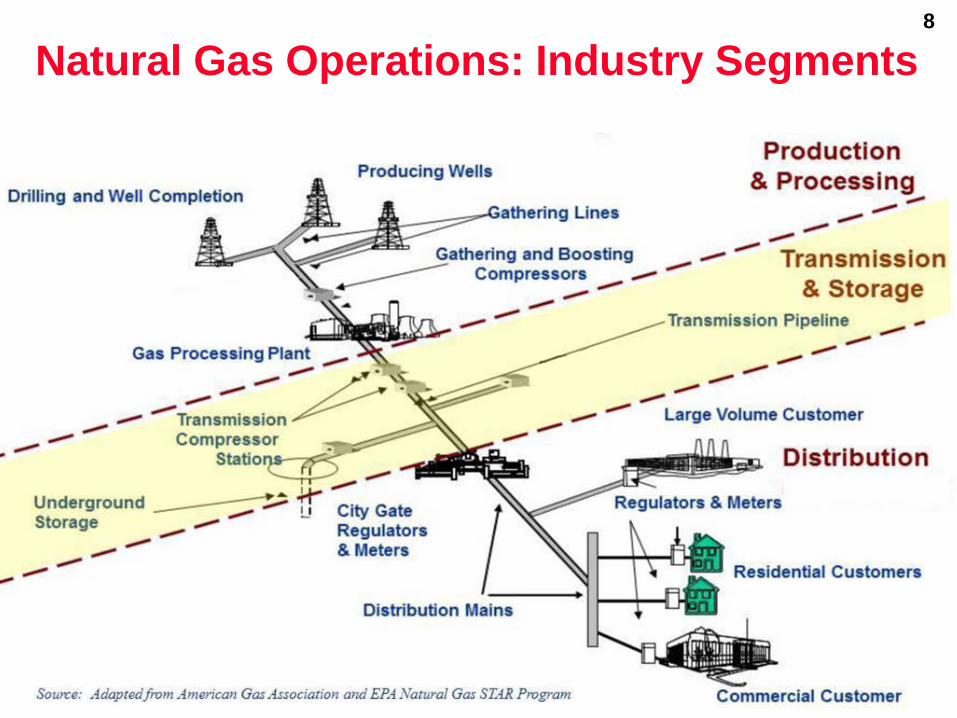
Natural Gas Operations: Methane Emissions Background
Pipeline natural gas is typically 90 – 96% methane » Balance is mainly ethane » Relatively low VOC content
Historical estimates of natural gas industry methane emissions (e.g., EPA annual GHG inventory, estimation protocols) primarily based on 1996 EPA-GRI report » For over 20 years, minimal new methane data was added » EPA GHG Reporting Program (GHGRP), other new studies
include new measurement data for T&S operations
Voluntary Natural Gas STAR program demonstrated reductions – mitigation identified by industry operators » STAR supplemented with Methane Challenge in 2016 » Mandatory rules now evolving at federal and state levels
8
Natural Gas Operations: Industry Segments
9
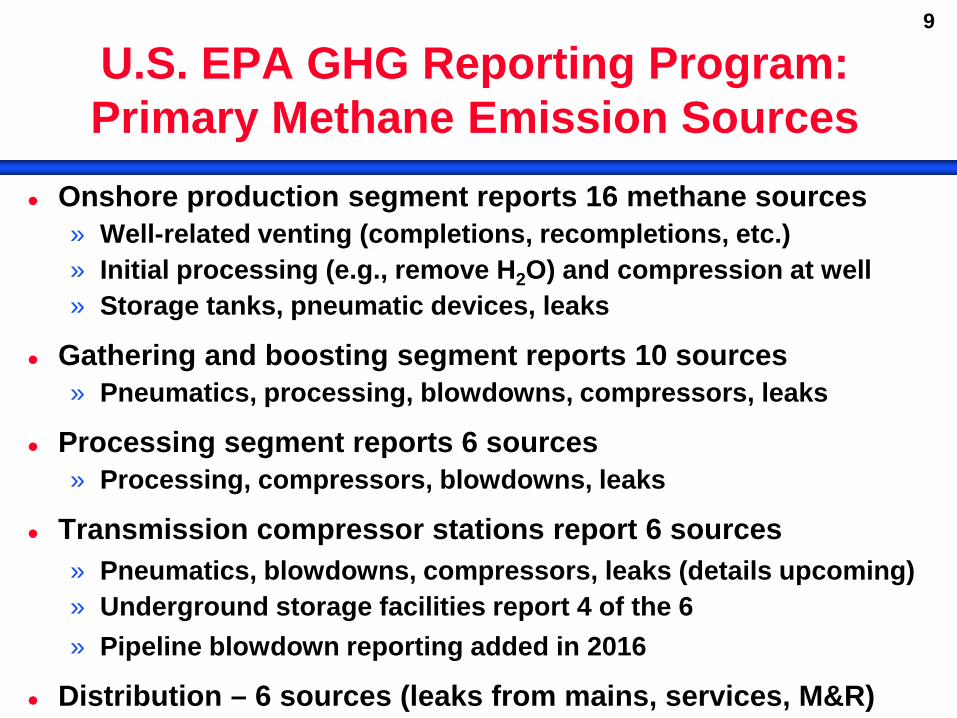
U.S. EPA GHG Reporting Program: Primary Methane Emission Sources
Onshore production segment reports 16 methane sources » Well-related venting (completions, recompletions, etc.) » Initial processing (e.g., remove H2O) and compression at well » Storage tanks, pneumatic devices, leaks
Gathering and boosting segment reports 10 sources » Pneumatics, processing, blowdowns, compressors, leaks
Processing segment reports 6 sources » Processing, compressors, blowdowns, leaks
Transmission compressor stations report 6 sources » Pneumatics, blowdowns, compressors, leaks (details upcoming) » Underground storage facilities report 4 of the 6 » Pipeline blowdown reporting added in 2016
Distribution – 6 sources (leaks from mains, services, M&R)
10
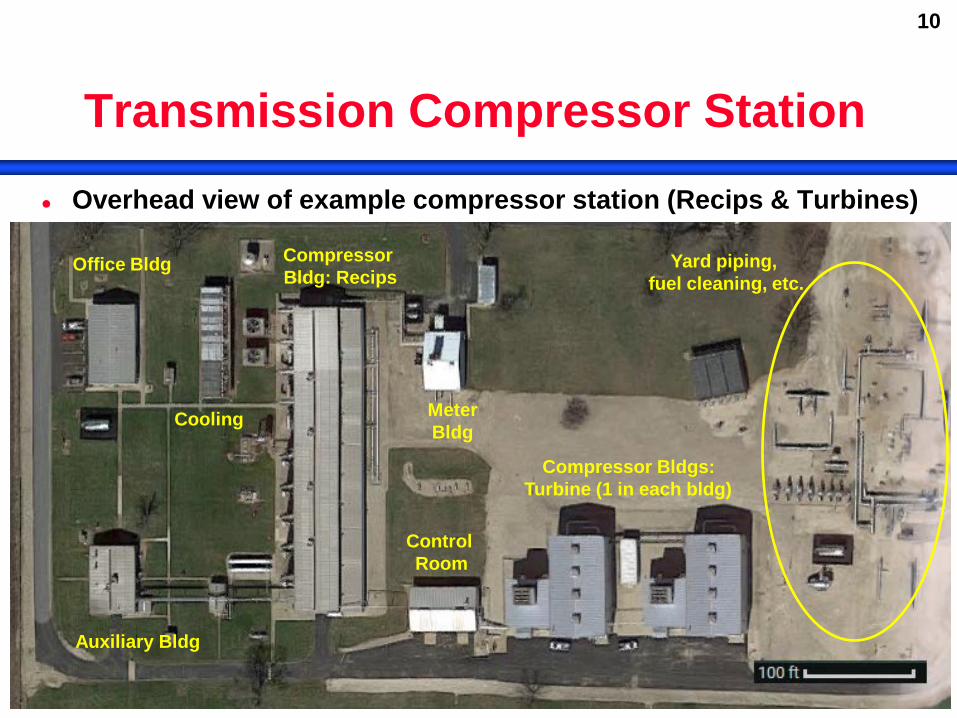
Transmission Compressor Station Overhead view of example compressor station (Recips & Turbines)
Office Bldg
Auxiliary Bldg
Compressor Bldg: Recips
Cooling Meter Bldg
Control Room
Yard piping, fuel cleaning, etc.
Compressor Bldgs: Turbine (1 in each bldg)
11
MD Facility: 12 Reciprocating Engines / Compressors

12
MD Facility: 1 Turbine / Centrifugal Compressor
13
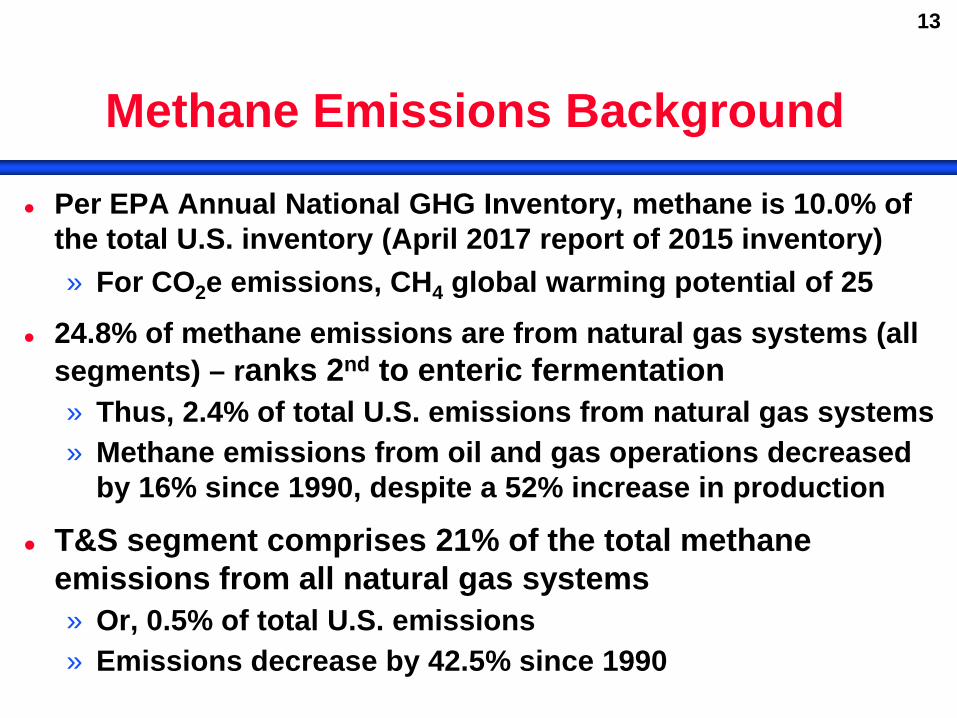
Methane Emissions Background
Per EPA Annual National GHG Inventory, methane is 10.0% of the total U.S. inventory (April 2017 report of 2015 inventory) » For CO2e emissions, CH4 global warming potential of 25
24.8% of methane emissions are from natural gas systems (all segments) – ranks 2nd to enteric fermentation » Thus, 2.4% of total U.S. emissions from natural gas systems » Methane emissions from oil and gas operations decreased
by 16% since 1990, despite a 52% increase in production
T&S segment comprises 21% of the total methane emissions from all natural gas systems » Or, 0.5% of total U.S. emissions » Emissions decrease by 42.5% since 1990
14
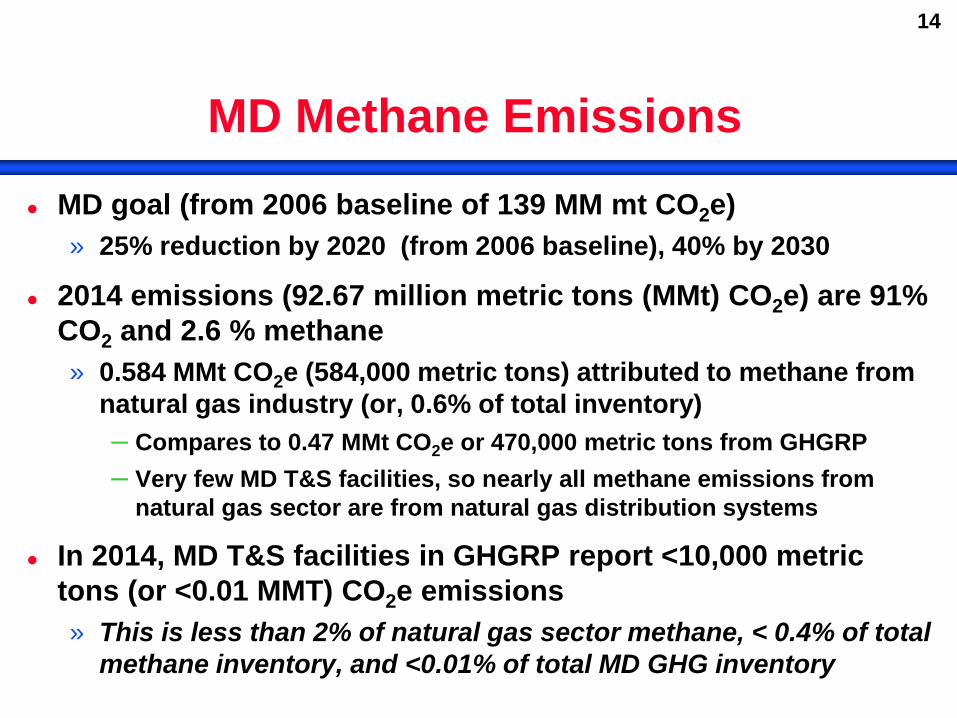
MD Methane Emissions MD goal (from 2006 baseline of 139 MM mt CO2e)
» 25% reduction by 2020 (from 2006 baseline), 40% by 2030
2014 emissions (92.67 million metric tons (MMt) CO2e) are 91% CO2 and 2.6 % methane » 0.584 MMt CO2e (584,000 metric tons) attributed to methane from
natural gas industry (or, 0.6% of total inventory) – Compares to 0.47 MMt CO2e or 470,000 metric tons from GHGRP – Very few MD T&S facilities, so nearly all methane emissions from
natural gas sector are from natural gas distribution systems
In 2014, MD T&S facilities in GHGRP report <10,000 metric tons (or <0.01 MMT) CO2e emissions » This is less than 2% of natural gas sector methane, < 0.4% of total
methane inventory, and <0.01% of total MD GHG inventory
15
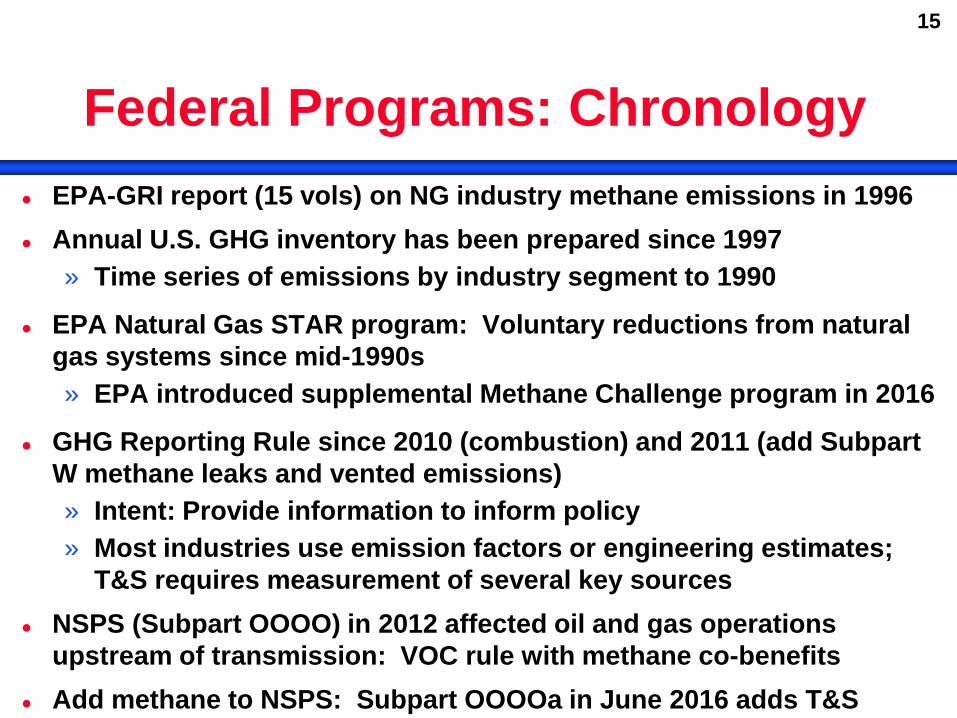
Federal Programs: Chronology EPA-GRI report (15 vols) on NG industry methane emissions in 1996 Annual U.S. GHG inventory has been prepared since 1997
» Time series of emissions by industry segment to 1990
EPA Natural Gas STAR program: Voluntary reductions from natural gas systems since mid-1990s » EPA introduced supplemental Methane Challenge program in 2016
GHG Reporting Rule since 2010 (combustion) and 2011 (add Subpart W methane leaks and vented emissions) » Intent: Provide information to inform policy » Most industries use emission factors or engineering estimates;
T&S requires measurement of several key sources NSPS (Subpart OOOO) in 2012 affected oil and gas operations
upstream of transmission: VOC rule with methane co-benefits Add methane to NSPS: Subpart OOOOa in June 2016 adds T&S
16
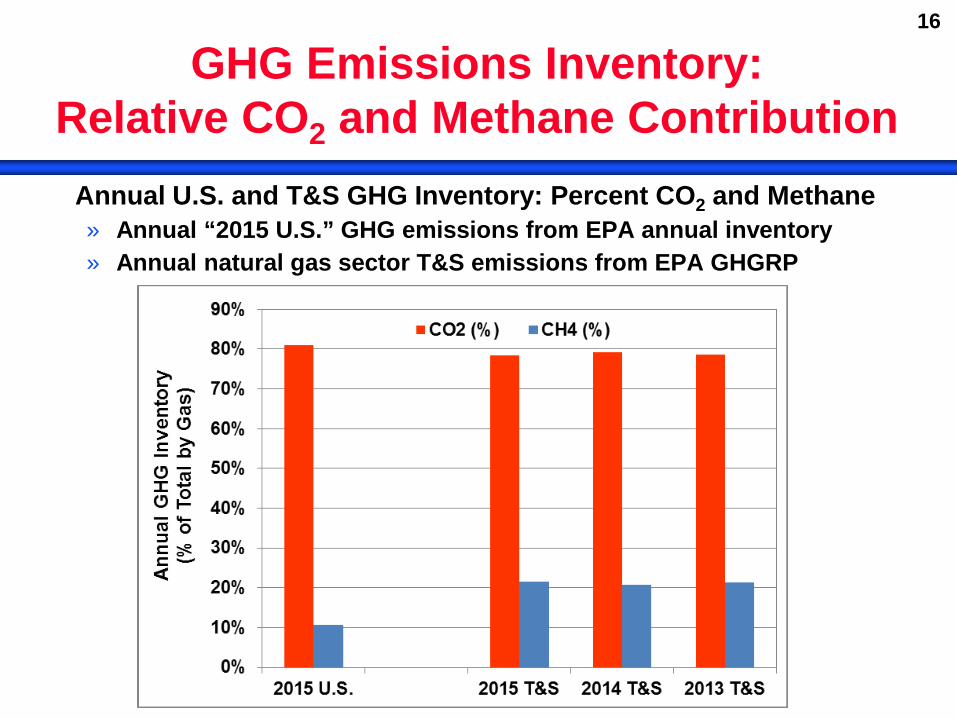
GHG Emissions Inventory: Relative CO2 and Methane Contribution
Annual U.S. and T&S GHG Inventory: Percent CO2 and Methane » Annual “2015 U.S.” GHG emissions from EPA annual inventory » Annual natural gas sector T&S emissions from EPA GHGRP
17
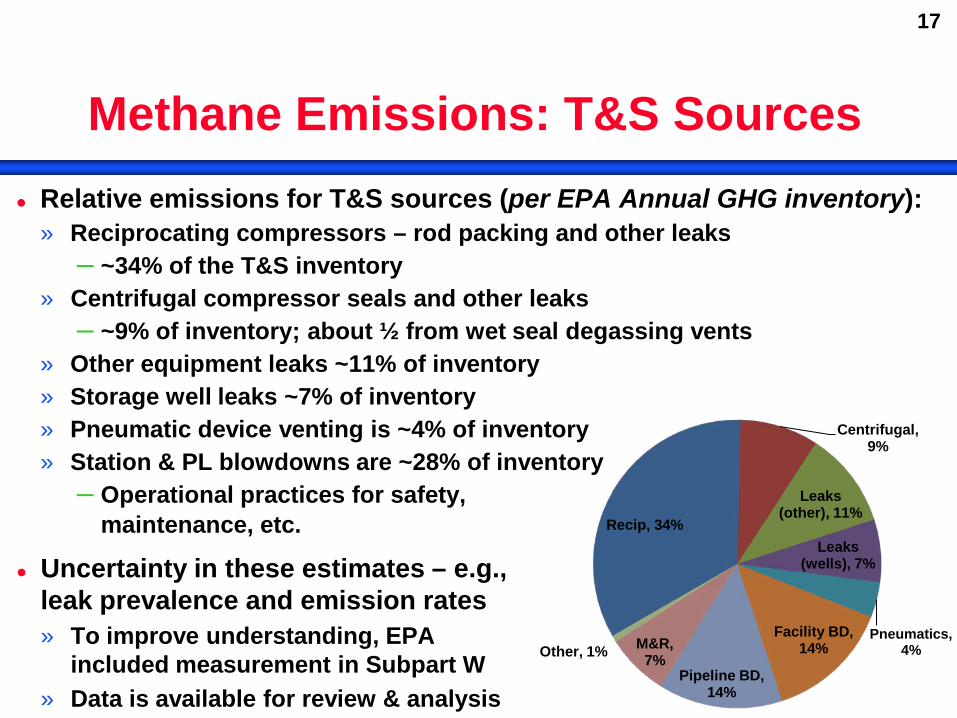
Methane Emissions: T&S Sources Relative emissions for T&S sources (per EPA Annual GHG inventory):
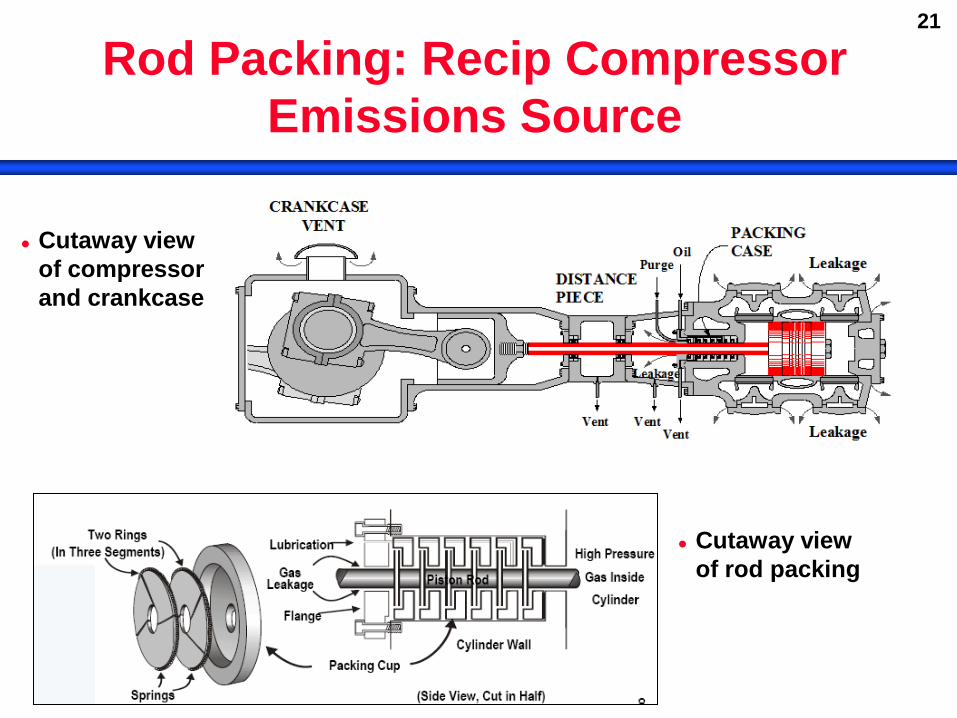
» Reciprocating compressors – rod packing and other leaks – ~34% of the T&S inventory
» Centrifugal compressor seals and other leaks – ~9% of inventory; about ½ from wet seal degassing vents
» Other equipment leaks ~11% of inventory » Storage well leaks ~7% of inventory » Pneumatic device venting is ~4% of inventory » Station & PL blowdowns are ~28% of inventory
– Operational practices for safety, maintenance, etc.
Uncertainty in these estimates – e.g., leak prevalence and emission rates » To improve understanding, EPA
included measurement in Subpart W » Data is available for review & analysis
Recip, 34%
Centrifugal, 9%
Leaks (other), 11%
Leaks (wells), 7%
Pneumatics, 4%
Facility BD, 14%
Pipeline BD, 14%
M&R, 7% Other, 1%
18
Subpart W Methane Emission Sources
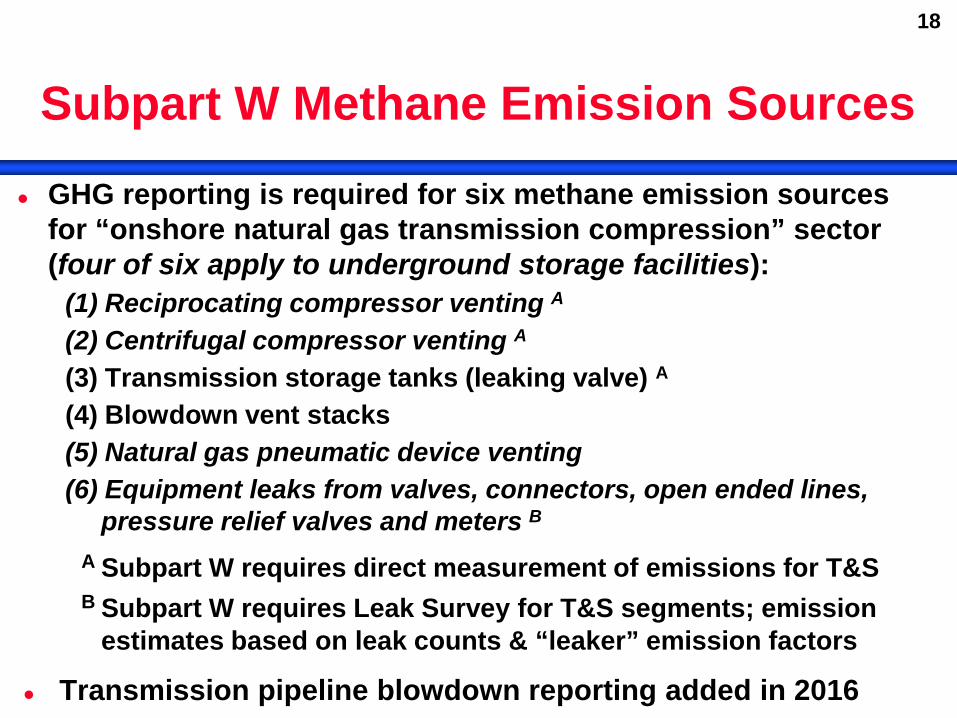
GHG reporting is required for six methane emission sources for “onshore natural gas transmission compression” sector (four of six apply to underground storage facilities):
(1) Reciprocating compressor venting A (2) Centrifugal compressor venting A (3) Transmission storage tanks (leaking valve) A (4) Blowdown vent stacks (5) Natural gas pneumatic device venting (6) Equipment leaks from valves, connectors, open ended lines,
pressure relief valves and meters B
A Subpart W requires direct measurement of emissions for T&S B Subpart W requires Leak Survey for T&S segments; emission
estimates based on leak counts & “leaker” emission factors
Transmission pipeline blowdown reporting added in 2016
19
Initial Overview of Emissions Mitigation (and Subpart OOOOa Sources)
EPA National Inventory and Natural Gas STAR reports provided background for 2014 EPA “White Papers” on mitigation of methane from natural gas leaks and venting
T&S sources and mitigation in Subpart OOOOa include: » Reciprocating compressor rod packing (replacement every
26,000 operating hours or 36 months) » Centrifugal compressors wet seals oil degassing vents
(reduce VOC emissions) » High bleed pneumatic devices (low / no bleed or air driven
devices) » Equipment leaks (LDAR) » Storage tanks with VOC emissions >6 TPY (reduce VOC
emissions)
20
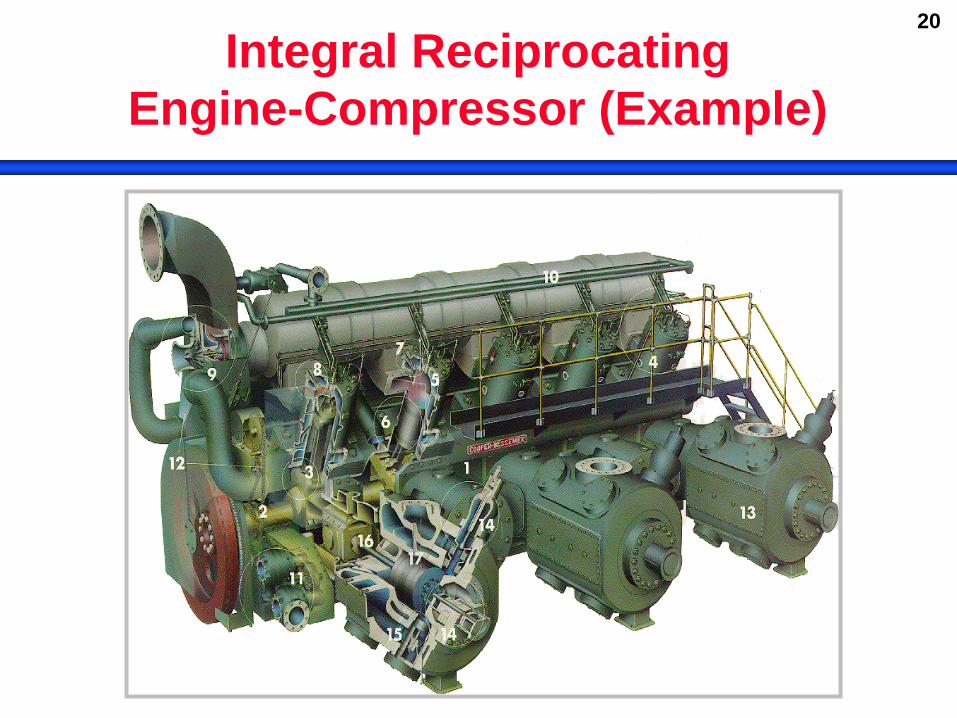
Integral Reciprocating Engine-Compressor (Example)
21
Rod Packing: Recip Compressor Emissions Source
Cutaway view of compressor and crankcase
Cutaway view of rod packing
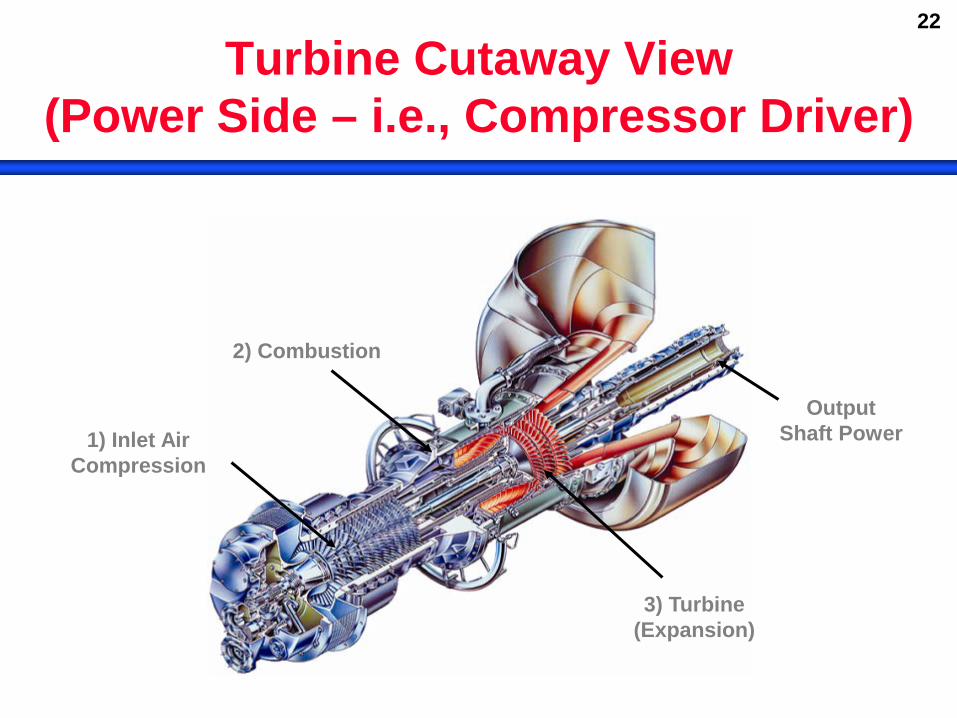
22
Turbine Cutaway View (Power Side – i.e., Compressor Driver)
1) Inlet Air Compression
2) Combustion
3) Turbine (Expansion)
Output Shaft Power
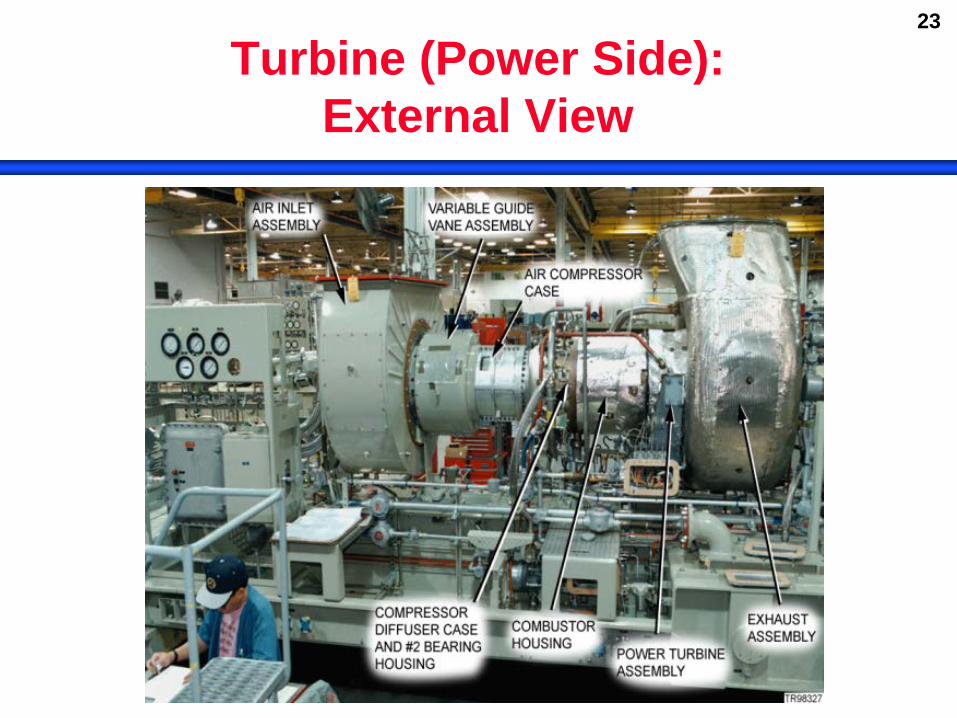
23
Turbine (Power Side): External View
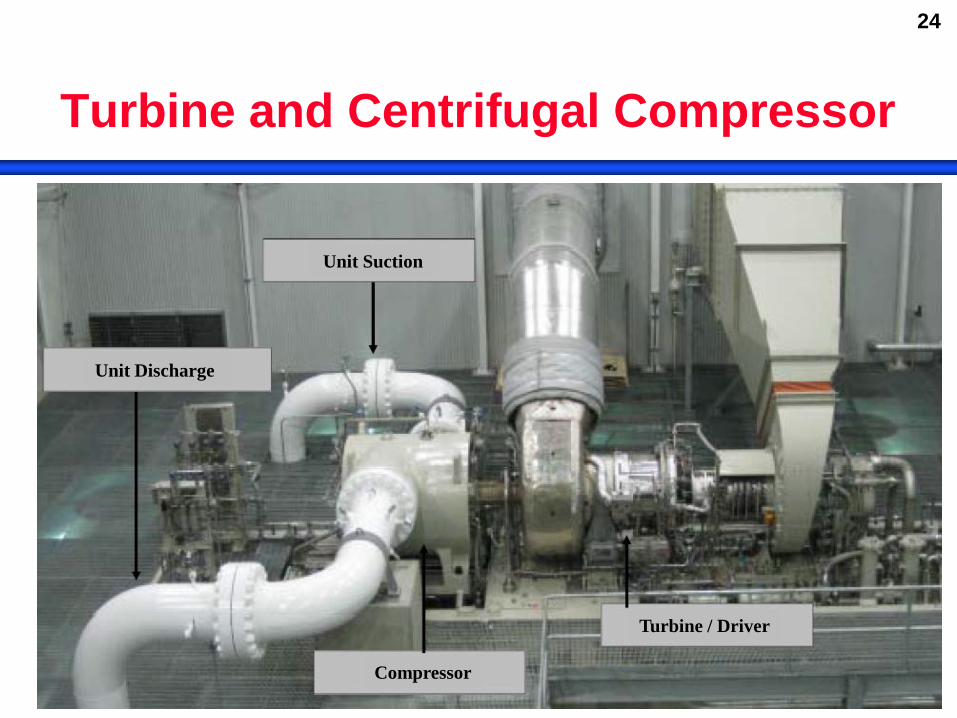
24
Turbine and Centrifugal Compressor
asdf
Turbine / Driver
Compressor
Unit Suction
Unit Discharge
25
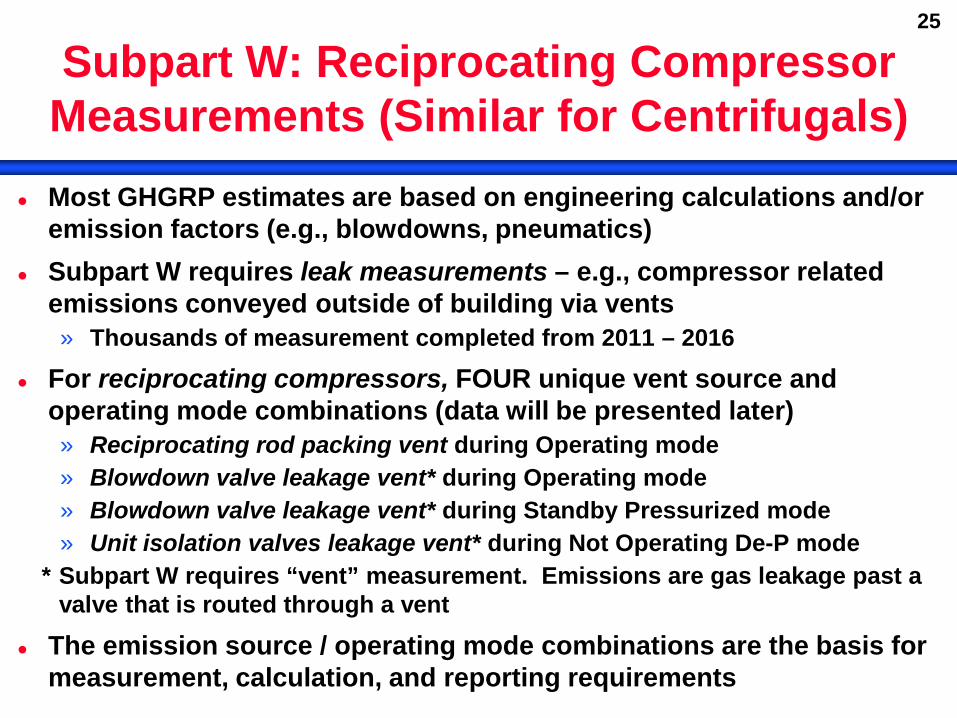
Subpart W: Reciprocating Compressor Measurements (Similar for Centrifugals)
Most GHGRP estimates are based on engineering calculations and/or emission factors (e.g., blowdowns, pneumatics)
Subpart W requires leak measurements – e.g., compressor related emissions conveyed outside of building via vents » Thousands of measurement completed from 2011 – 2016
For reciprocating compressors, FOUR unique vent source and operating mode combinations (data will be presented later) » Reciprocating rod packing vent during Operating mode » Blowdown valve leakage vent* during Operating mode » Blowdown valve leakage vent* during Standby Pressurized mode » Unit isolation valves leakage vent* during Not Operating De-P mode
* Subpart W requires “vent” measurement. Emissions are gas leakage past a valve that is routed through a vent
The emission source / operating mode combinations are the basis for measurement, calculation, and reporting requirements
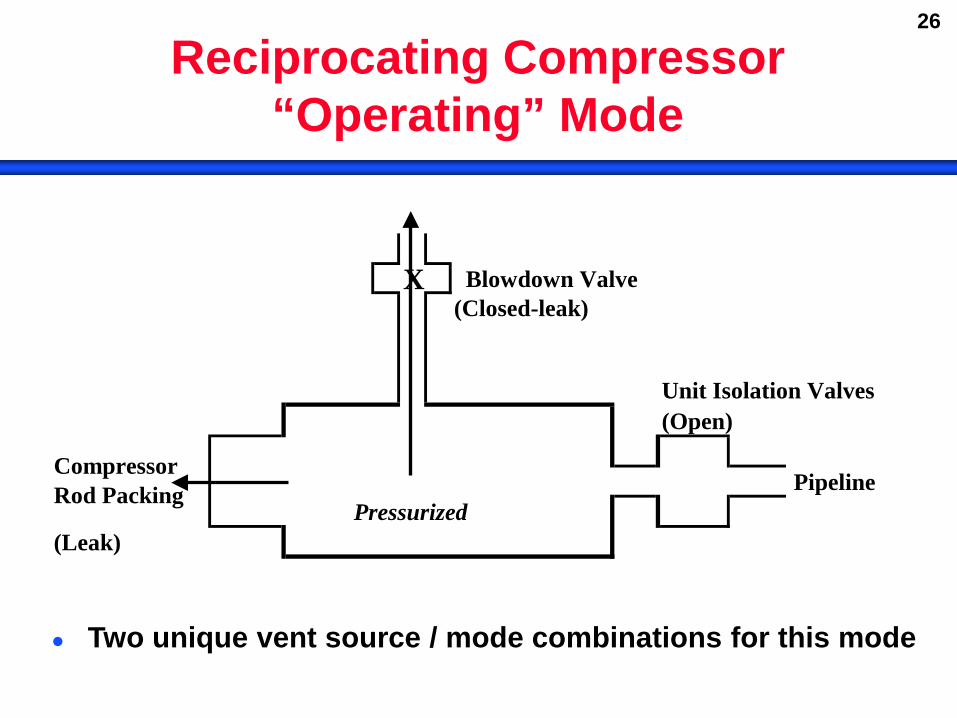
26
Reciprocating Compressor “Operating” Mode
X Blowdown Valve(Closed-leak)
Unit Isolation Valves(Open)
PipelinePressurized
(Leak)
Compressor Rod Packing
Two unique vent source / mode combinations for this mode
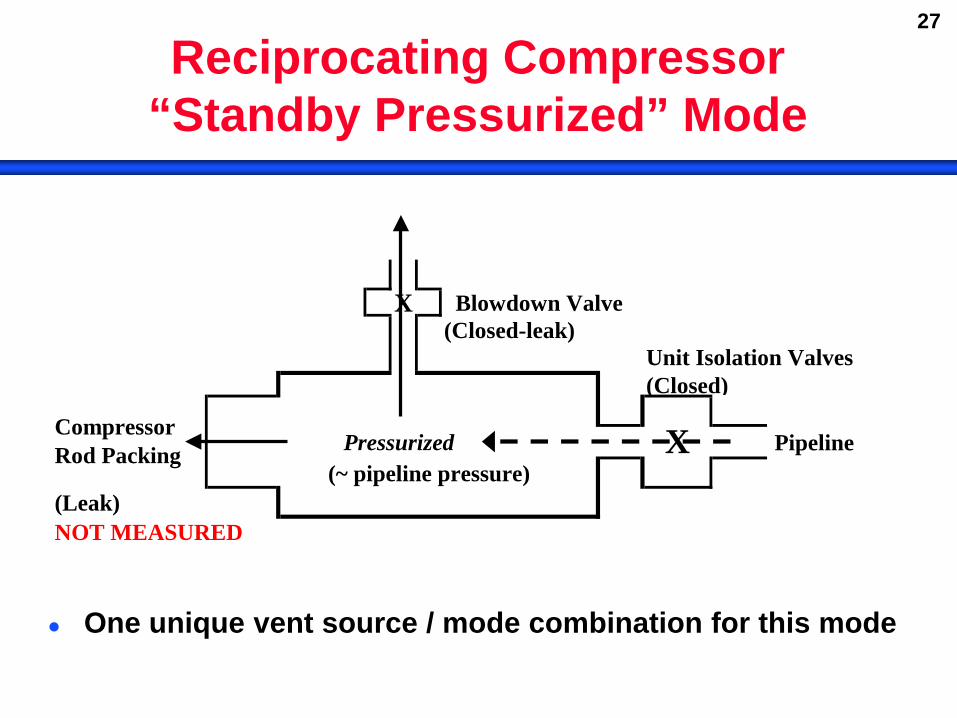
27
Reciprocating Compressor “Standby Pressurized” Mode
X Blowdown Valve(Closed-leak)
Unit Isolation Valves(Closed)
Pressurized Pipeline(~ pipeline pressure)
(Leak)NOT MEASURED
XCompressor Rod Packing
One unique vent source / mode combination for this mode
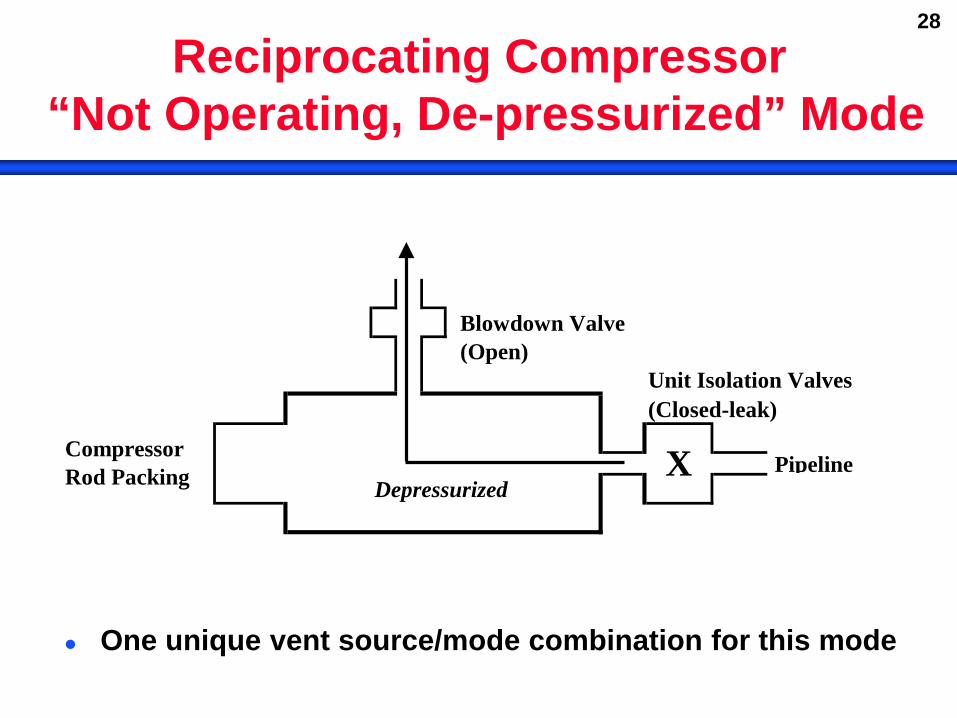
28
Reciprocating Compressor “Not Operating, De-pressurized” Mode
Blowdown Valve (Open)
Unit Isolation Valves(Closed-leak)
PipelineDepressurized
XCompressor Rod Packing
One unique vent source/mode combination for this mode
29
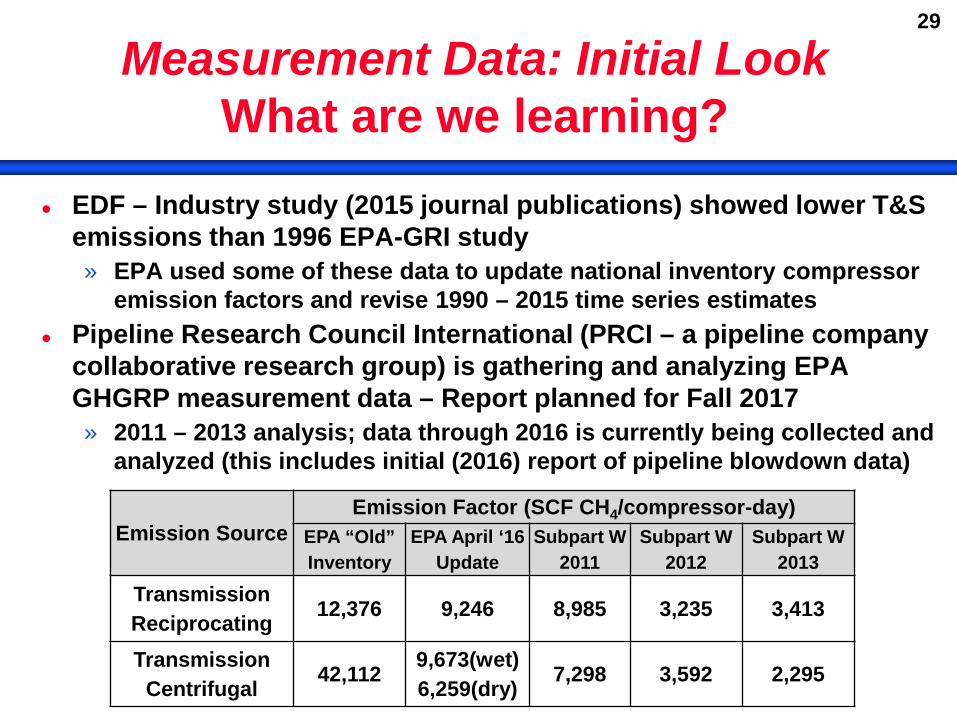
Measurement Data: Initial Look What are we learning?
EDF – Industry study (2015 journal publications) showed lower T&S emissions than 1996 EPA-GRI study » EPA used some of these data to update national inventory compressor
emission factors and revise 1990 – 2015 time series estimates Pipeline Research Council International (PRCI – a pipeline company
collaborative research group) is gathering and analyzing EPA GHGRP measurement data – Report planned for Fall 2017 » 2011 – 2013 analysis; data through 2016 is currently being collected and
analyzed (this includes initial (2016) report of pipeline blowdown data)
Emission Source Emission Factor (SCF CH4/compressor-day)
EPA “Old” Inventory
EPA April ‘16 Update
Subpart W 2011
Subpart W 2012
Subpart W 2013
Transmission Reciprocating 12,376 9,246 8,985 3,235 3,413
Transmission Centrifugal 42,112
9,673(wet) 6,259(dry) 7,298 3,592 2,295
30
T&S Methane Reduction: Voluntary and Regulatory Program Overview
Many companies participated in the Natural Gas STAR program – reductions reflected in EPA inventory updates » Data from recent studies and GHGRP measurements confirms
real reductions – i.e., current emissions are lower
With GHGRP implementation in 2010 and 2011, STAR related reporting slowed – i.e., operator focus on new regulation
Subpart OOOOa introduced reduction requirements for NSPS affected facilities (June 2016 final rule)
In 2015 and 2016, EPA rolled out Methane Challenge as an update to the Natural Gas STAR program » Opportunity to pursue voluntary program for existing facilities
included sector-specific BMPs » Operator response likely affected by EPA’s concurrent initiation
of a process to regulate existing sources (since slowed)
31
EPA Methane Mitigation for Natural Gas Transmission
A series of documents identify key sources and mitigation: » 2012 Subpart OOOO (VOC rule excluded T&S), 2014 Oil and Gas
Sector Methane White Papers, July 2015 Methane Challenge BMPs and June 2016 Subpart OOOOa rule include common sources and mitigation for T&S: – Reciprocating compressor rod packing maintenance – Centrifugal compressors – dry seals or control of wet seal
degassing vents – LDAR – Low bleed pneumatics (or air systems)
State actions are following a similar script
Methane Challenge also includes pipeline pump down BMP to reduce emissions from planned pipeline blowdowns » Based on Natural Gas STAR “Lessons Learned” document
32
Pipeline Blowdown Mitigation
Pipeline blowdown mitigation from “pump down” is common practice, but application is limited
Pipeline blowdown mitigation practices may include: » Divert to low pressure line: Transfer gas to a parallel line » In-Line compression: Operate downstream compression after
upstream valve is closed » Mobile compression: Use additional compressors to move gas
or pull line down to lower pressure (e.g., incremental gain) » Flaring: Rarely used
Practice is limited by: » Availability of parallel line » Pressures of lines » Economics (e.g., for mobile compression)
33
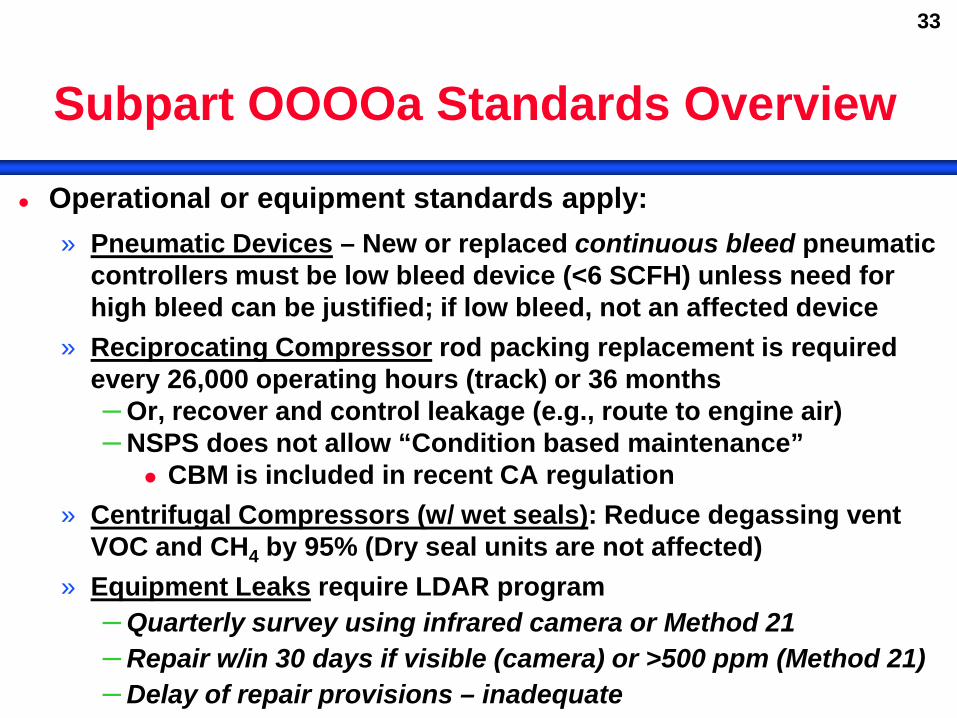
Subpart OOOOa Standards Overview
Operational or equipment standards apply: » Pneumatic Devices – New or replaced continuous bleed pneumatic
controllers must be low bleed device (<6 SCFH) unless need for high bleed can be justified; if low bleed, not an affected device
» Reciprocating Compressor rod packing replacement is required every 26,000 operating hours (track) or 36 months – Or, recover and control leakage (e.g., route to engine air) – NSPS does not allow “Condition based maintenance”
CBM is included in recent CA regulation » Centrifugal Compressors (w/ wet seals): Reduce degassing vent
VOC and CH4 by 95% (Dry seal units are not affected) » Equipment Leaks require LDAR program
– Quarterly survey using infrared camera or Method 21 – Repair w/in 30 days if visible (camera) or >500 ppm (Method 21) – Delay of repair provisions – inadequate
34
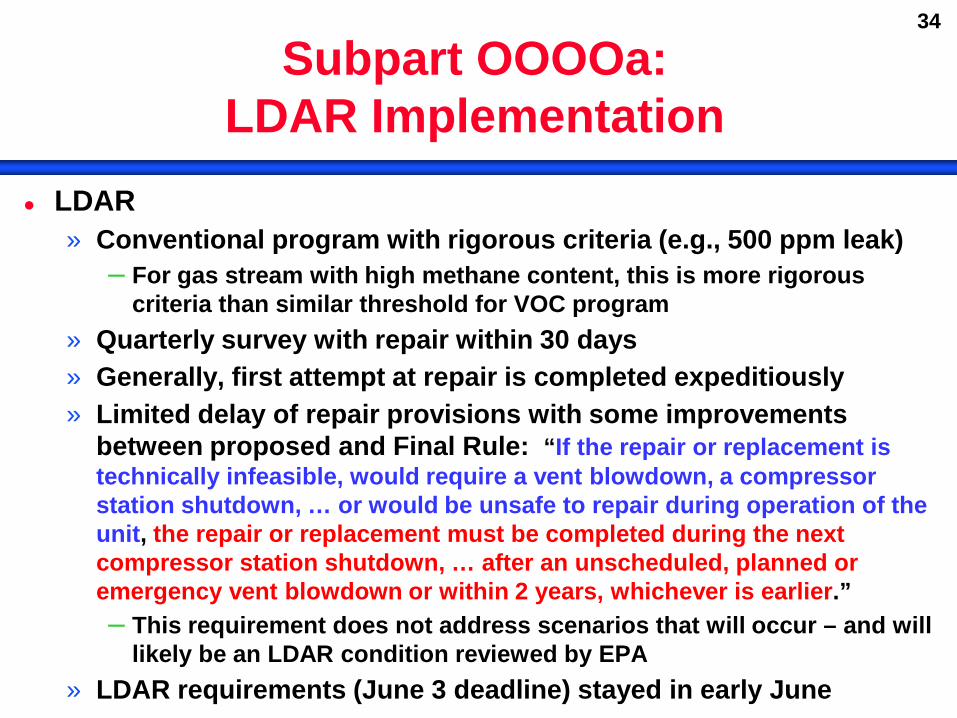
Subpart OOOOa: LDAR Implementation
LDAR » Conventional program with rigorous criteria (e.g., 500 ppm leak)
– For gas stream with high methane content, this is more rigorous criteria than similar threshold for VOC program
» Quarterly survey with repair within 30 days » Generally, first attempt at repair is completed expeditiously » Limited delay of repair provisions with some improvements
between proposed and Final Rule: “If the repair or replacement is technically infeasible, would require a vent blowdown, a compressor station shutdown, … or would be unsafe to repair during operation of the unit, the repair or replacement must be completed during the next compressor station shutdown, … after an unscheduled, planned or emergency vent blowdown or within 2 years, whichever is earlier.” – This requirement does not address scenarios that will occur – and will
likely be an LDAR condition reviewed by EPA » LDAR requirements (June 3 deadline) stayed in early June
35
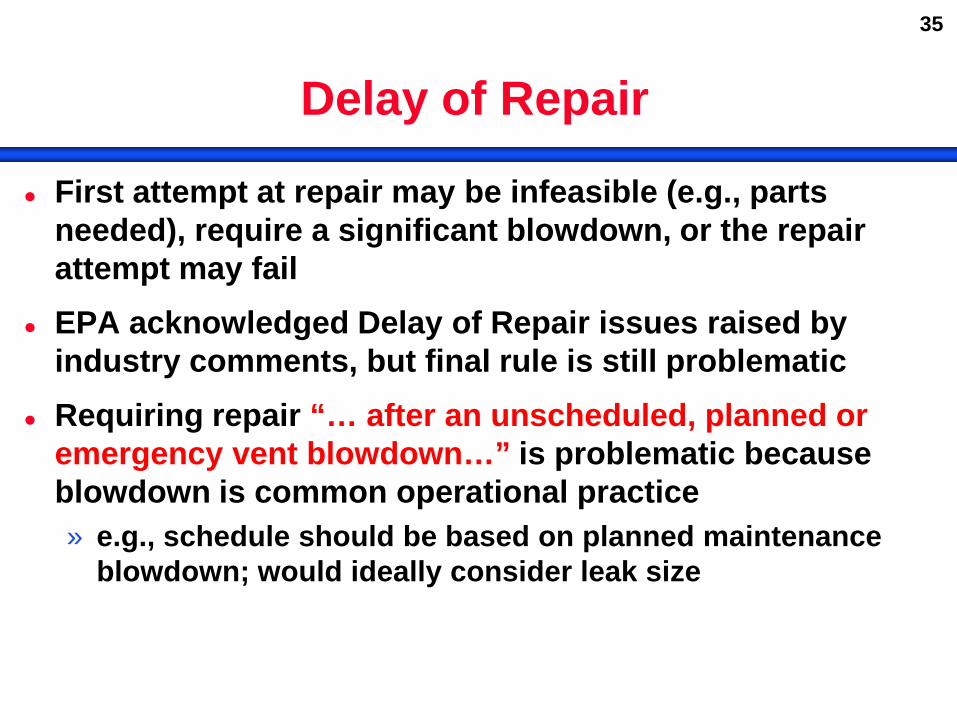
Delay of Repair
First attempt at repair may be infeasible (e.g., parts needed), require a significant blowdown, or the repair attempt may fail
EPA acknowledged Delay of Repair issues raised by industry comments, but final rule is still problematic
Requiring repair “… after an unscheduled, planned or emergency vent blowdown…” is problematic because blowdown is common operational practice » e.g., schedule should be based on planned maintenance
blowdown; would ideally consider leak size
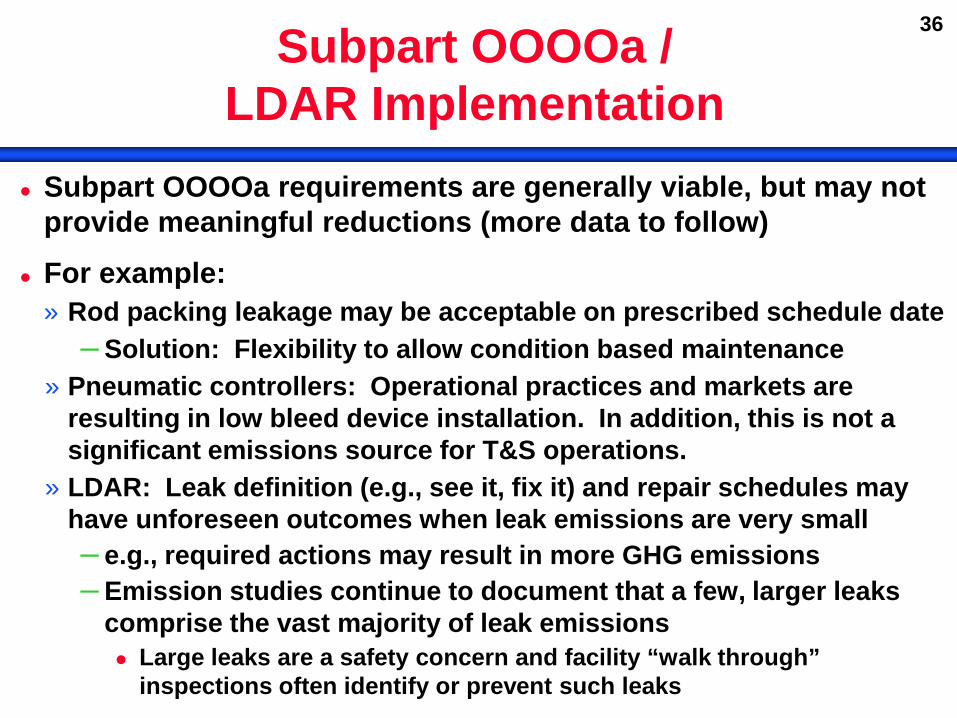
36 Subpart OOOOa / LDAR Implementation
Subpart OOOOa requirements are generally viable, but may not provide meaningful reductions (more data to follow)
For example: » Rod packing leakage may be acceptable on prescribed schedule date
– Solution: Flexibility to allow condition based maintenance » Pneumatic controllers: Operational practices and markets are
resulting in low bleed device installation. In addition, this is not a significant emissions source for T&S operations.
» LDAR: Leak definition (e.g., see it, fix it) and repair schedules may have unforeseen outcomes when leak emissions are very small – e.g., required actions may result in more GHG emissions – Emission studies continue to document that a few, larger leaks
comprise the vast majority of leak emissions Large leaks are a safety concern and facility “walk through”
inspections often identify or prevent such leaks
37
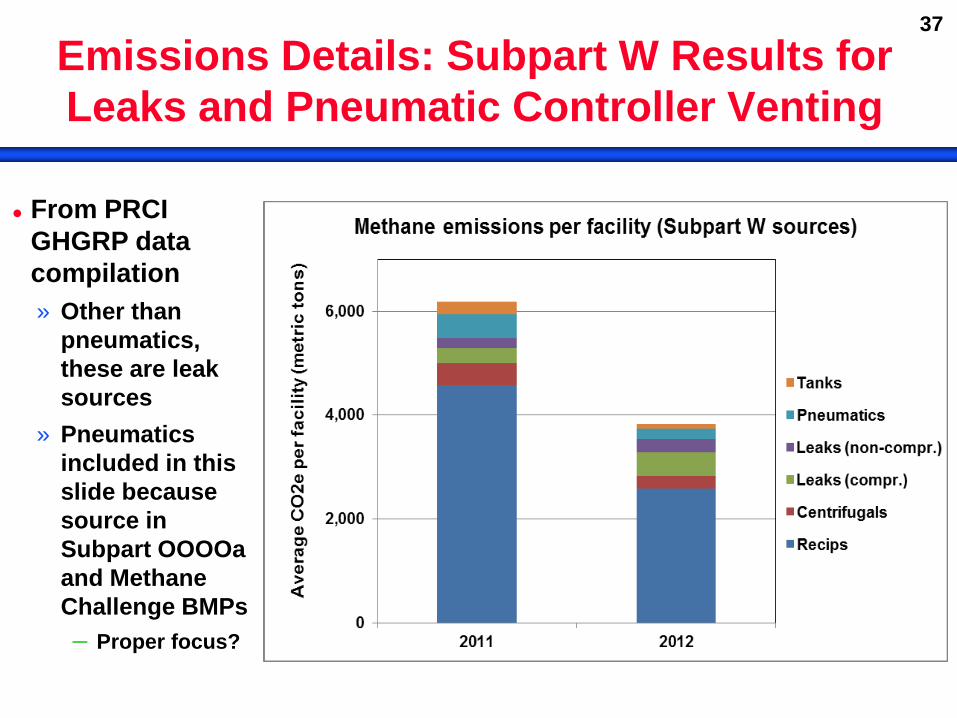
Emissions Details: Subpart W Results for Leaks and Pneumatic Controller Venting
From PRCI GHGRP data compilation » Other than
pneumatics, these are leak sources
» Pneumatics included in this slide because source in Subpart OOOOa and Methane Challenge BMPs – Proper focus?
38
Leak Emissions and LDAR: More Details and Discussion
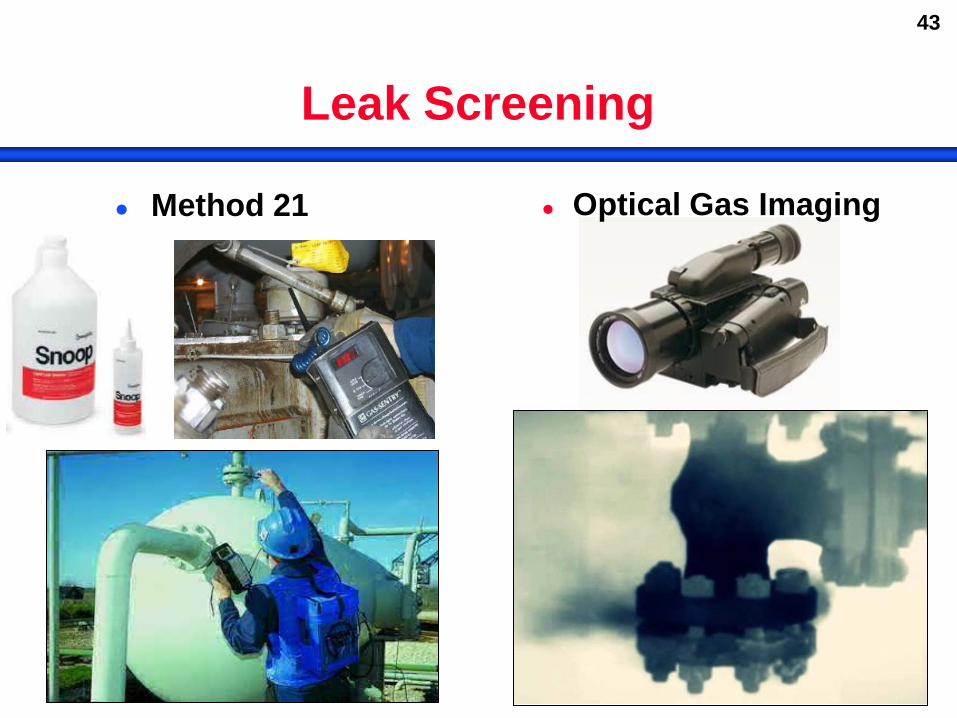
Conventional LDAR is the historical regulatory standard » Leak survey technology advancing from Method 21 to add
Optical Gas Imaging (OGI) – e.g., infrared camera » Subpart OOOOa allows OGI (visible = leak) or Method 21
(FID “sniffer” with 500 ppmv leak threshold) – Historical leak definitions as high as 10,000 ppmv
» Prescribed schedule to fix leaks unless “delay” allowed
BUT… » Emissions from some leaks are trivial (e.g., we will review
examples from a recent California ARB (CARB) report) » Concentration is not a great surrogate for emission rate » Recent literature identifies large leaks as primary driver
(i.e., a small number of leaks cause most leak emissions)
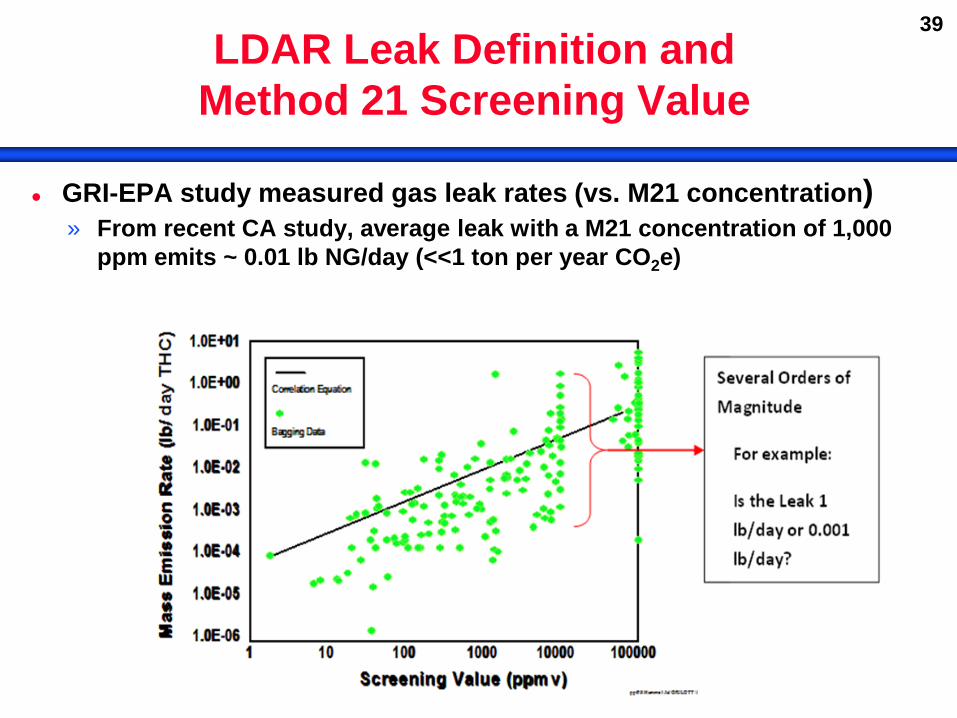
39 LDAR Leak Definition and
Method 21 Screening Value
GRI-EPA study measured gas leak rates (vs. M21 concentration) » From recent CA study, average leak with a M21 concentration of 1,000
ppm emits ~ 0.01 lb NG/day (<<1 ton per year CO2e)
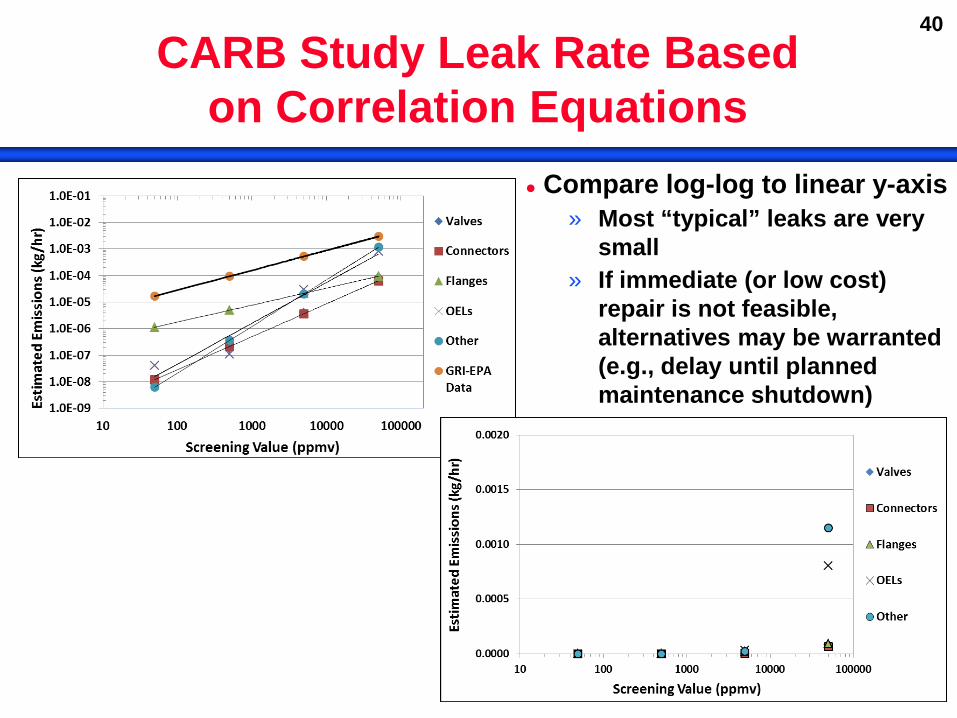
40 CARB Study Leak Rate Based
on Correlation Equations Compare log-log to linear y-axis
» Most “typical” leaks are very small
» If immediate (or low cost) repair is not feasible, alternatives may be warranted (e.g., delay until planned maintenance shutdown)
41
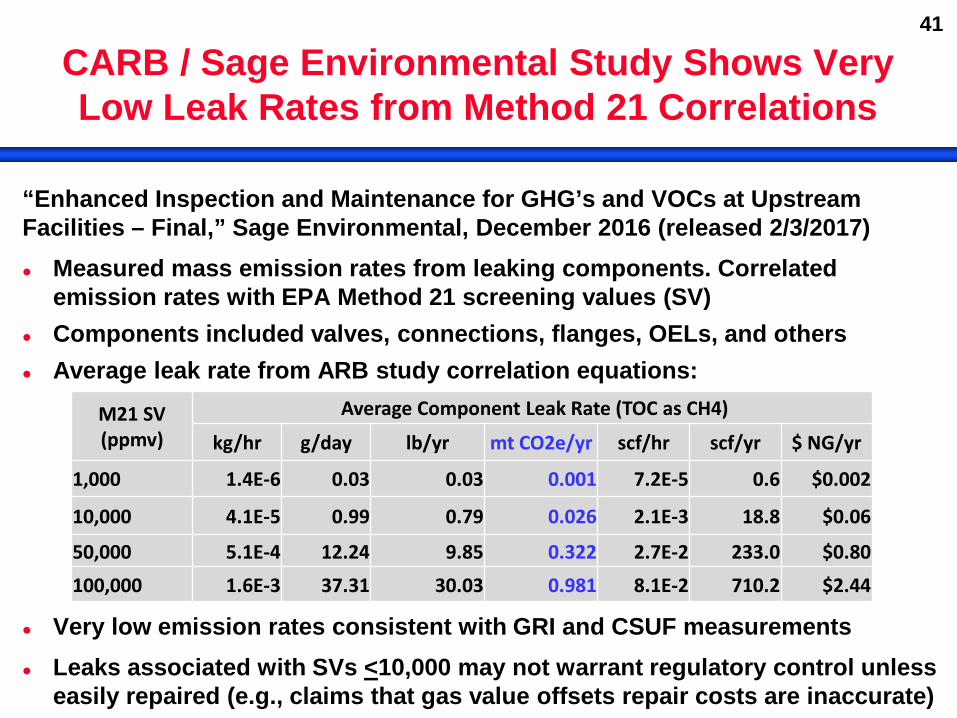
CARB / Sage Environmental Study Shows Very Low Leak Rates from Method 21 Correlations
“Enhanced Inspection and Maintenance for GHG’s and VOCs at Upstream Facilities – Final,” Sage Environmental, December 2016 (released 2/3/2017) Measured mass emission rates from leaking components. Correlated
emission rates with EPA Method 21 screening values (SV) Components included valves, connections, flanges, OELs, and others Average leak rate from ARB study correlation equations:
Very low emission rates consistent with GRI and CSUF measurements Leaks associated with SVs <10,000 may not warrant regulatory control unless
easily repaired (e.g., claims that gas value offsets repair costs are inaccurate)
M21 SV (ppmv)
Average Component Leak Rate (TOC as CH4)
kg/hr g/day lb/yr mt CO2e/yr scf/hr scf/yr $ NG/yr
1,000 1.4E-6 0.03 0.03 0.001 7.2E-5 0.6 $0.002
10,000 4.1E-5 0.99 0.79 0.026 2.1E-3 18.8 $0.06
50,000 5.1E-4 12.24 9.85 0.322 2.7E-2 233.0 $0.80 100,000 1.6E-3 37.31 30.03 0.981 8.1E-2 710.2 $2.44
42
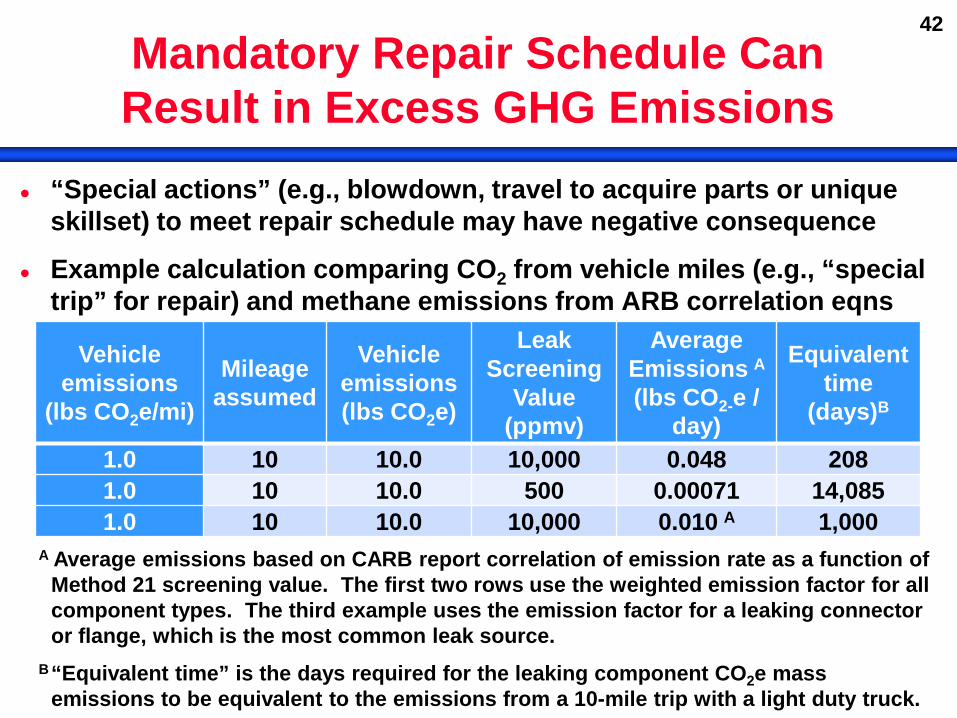
Mandatory Repair Schedule Can Result in Excess GHG Emissions
“Special actions” (e.g., blowdown, travel to acquire parts or unique skillset) to meet repair schedule may have negative consequence
Example calculation comparing CO2 from vehicle miles (e.g., “special trip” for repair) and methane emissions from ARB correlation eqns
Vehicle emissions
(lbs CO2e/mi)
Mileage assumed
Vehicle emissions (lbs CO2e)
Leak Screening
Value (ppmv)
Average Emissions A (lbs CO2-e /
day)
Equivalent time
(days)B
1.0 10 10.0 10,000 0.048 208 1.0 10 10.0 500 0.00071 14,085 1.0 10 10.0 10,000 0.010 A 1,000
A Average emissions based on CARB report correlation of emission rate as a function of Method 21 screening value. The first two rows use the weighted emission factor for all component types. The third example uses the emission factor for a leaking connector or flange, which is the most common leak source.
B “Equivalent time” is the days required for the leaking component CO2e mass emissions to be equivalent to the emissions from a 10-mile trip with a light duty truck.
43
Leak Screening
Optical Gas Imaging Method 21
44
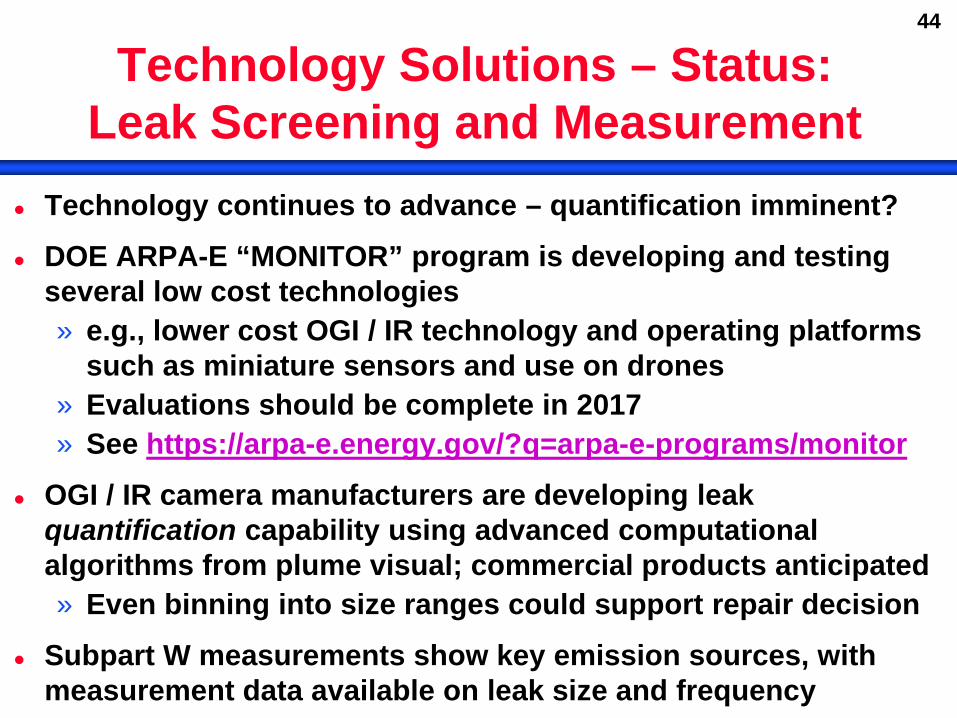
Technology Solutions – Status: Leak Screening and Measurement
Technology continues to advance – quantification imminent?
DOE ARPA-E “MONITOR” program is developing and testing several low cost technologies » e.g., lower cost OGI / IR technology and operating platforms
such as miniature sensors and use on drones » Evaluations should be complete in 2017 » See https://arpa-e.energy.gov/?q=arpa-e-programs/monitor
OGI / IR camera manufacturers are developing leak quantification capability using advanced computational algorithms from plume visual; commercial products anticipated » Even binning into size ranges could support repair decision
Subpart W measurements show key emission sources, with measurement data available on leak size and frequency
45
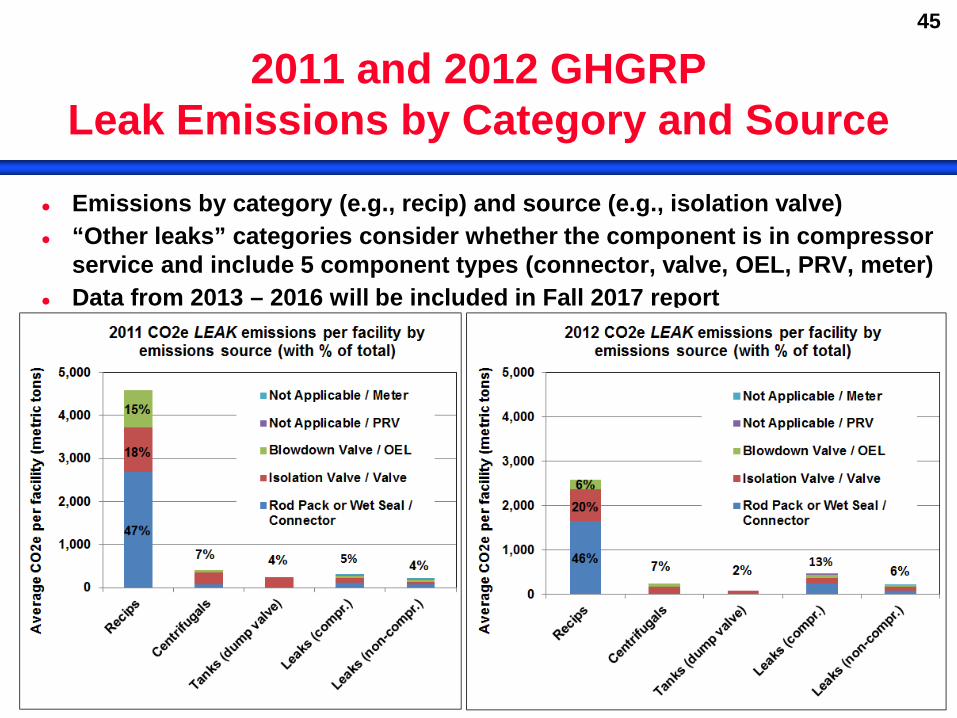
2011 and 2012 GHGRP Leak Emissions by Category and Source
Emissions by category (e.g., recip) and source (e.g., isolation valve) “Other leaks” categories consider whether the component is in compressor
service and include 5 component types (connector, valve, OEL, PRV, meter) Data from 2013 – 2016 will be included in Fall 2017 report
46
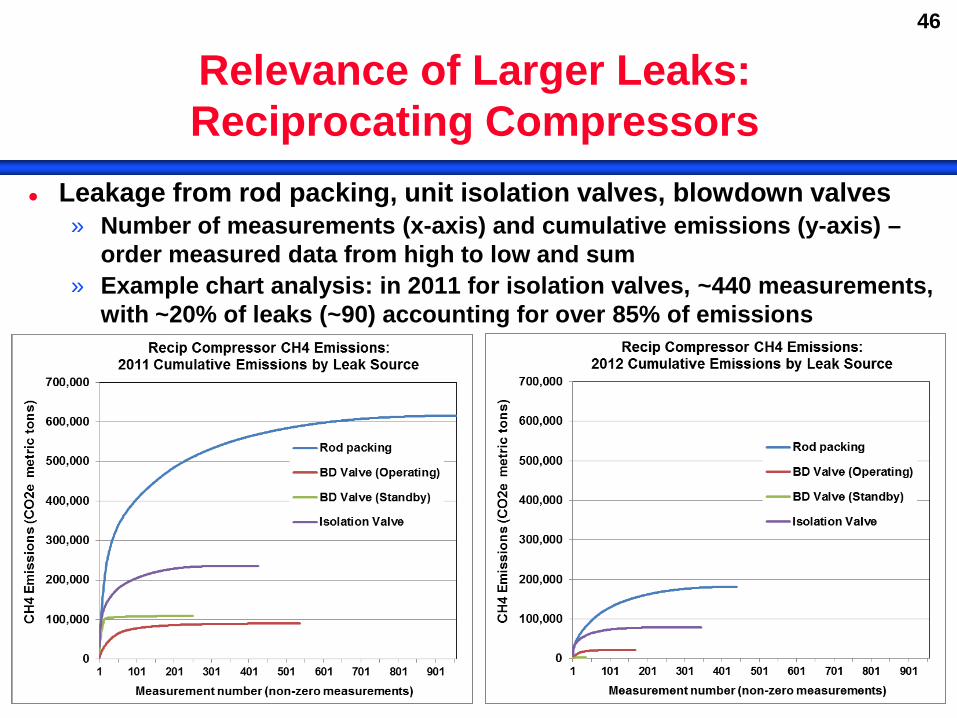
Relevance of Larger Leaks: Reciprocating Compressors
Leakage from rod packing, unit isolation valves, blowdown valves » Number of measurements (x-axis) and cumulative emissions (y-axis) –
order measured data from high to low and sum » Example chart analysis: in 2011 for isolation valves, ~440 measurements,
with ~20% of leaks (~90) accounting for over 85% of emissions
47
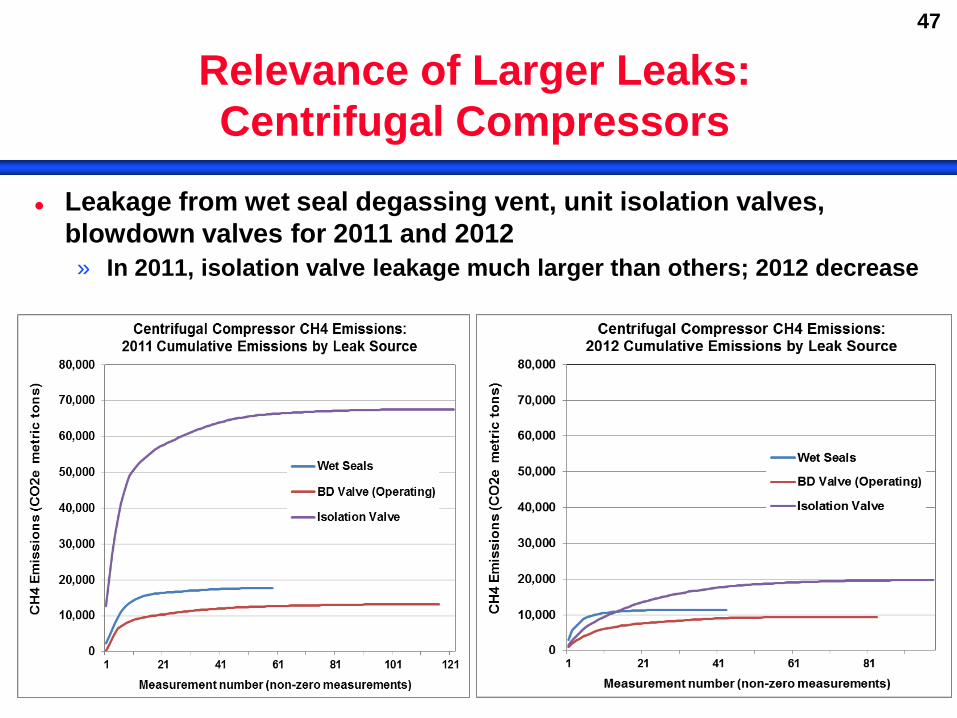
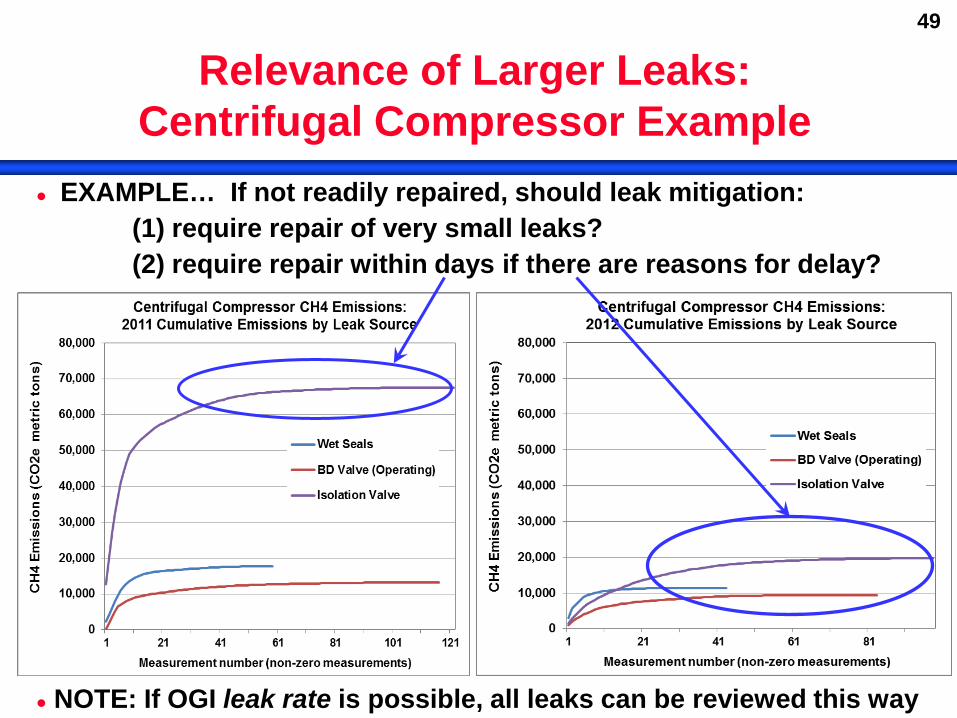
Relevance of Larger Leaks: Centrifugal Compressors
Leakage from wet seal degassing vent, unit isolation valves, blowdown valves for 2011 and 2012 » In 2011, isolation valve leakage much larger than others; 2012 decrease
48
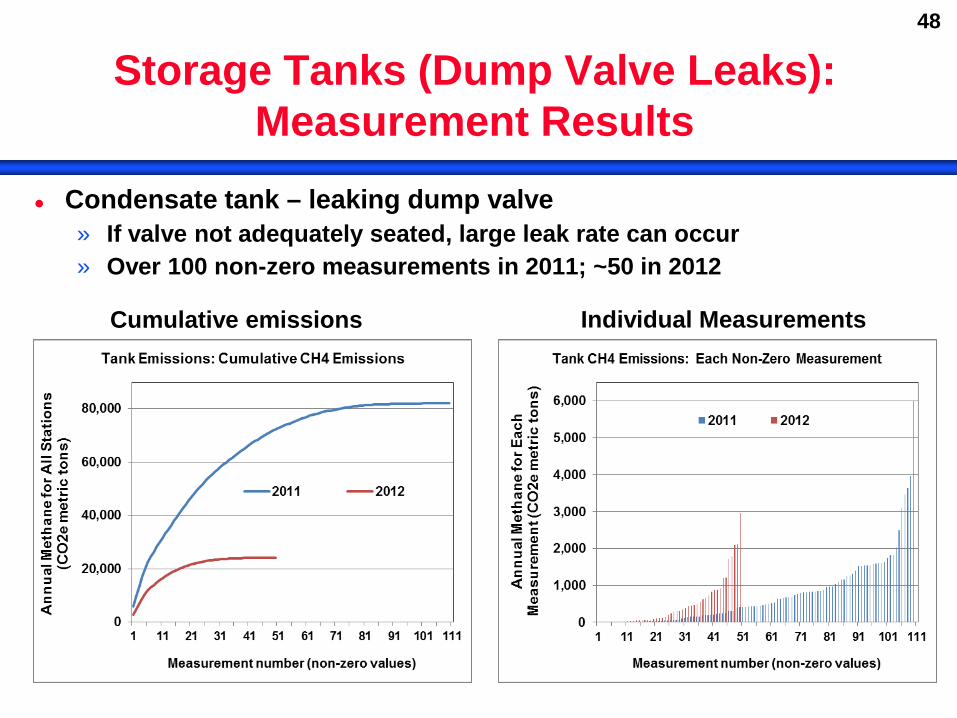
Storage Tanks (Dump Valve Leaks): Measurement Results
Condensate tank – leaking dump valve » If valve not adequately seated, large leak rate can occur » Over 100 non-zero measurements in 2011; ~50 in 2012 Cumulative emissions
Individual Measurements
49
Relevance of Larger Leaks: Centrifugal Compressor Example
EXAMPLE… If not readily repaired, should leak mitigation: (1) require repair of very small leaks? (2) require repair within days if there are reasons for delay? NOTE: If OGI leak rate is possible, all leaks can be reviewed this way
50
DI&M – Example BMP (alternative)
GHGRP and literature generally agree that few leaks contribute majority of emissions (e.g., 80% of emissions from 20% of leaks)
“Directed Inspection and Maintenance” (DI&M) vs LDAR » Screen for leaks, identify larger emitters, initial attempt for easy to
repair leaks, repair decision based on defined metric for others » Focus on larger leaks (+ easy to repair leaks) » Achieve similar reductions with far fewer repairs » 2003 EPA Natural Gas STAR Lessons Learned document
acknowledges DI&M as an alternative approach for leak mitigation
INGAA developed DI&M Guidelines for voluntary reductions » Focus on sources with larger leak potential – e.g., compressor
isolation valves, rod packing » Allow “trained operator” to assess leaks using an IR camera » Shared with EPA as a potential alternative to LDAR
51
Summary and Conclusions
T&S segment methane emissions are a minor contributor to MD GHG emissions » And, some emissions sources are minor for T&S facilities
Voluntary reductions have occurred and will continue If existing source reductions are desired, document
reductions from a voluntary program » e.g., modeled after EPA Methane Challenge » Addressing large leaks is key – and new technologies may
facilitate development of improved approaches » Support “next generation” approaches to leverage new
technologies » Multi-year implementation and/or near-term adjustments to
exploit new info (e.g., GHGRP data) and new technology

52
Questions and Discussion