Embed Size (px)
Citation preview

RE
SE
AR
CH
RE
PO
RT
SE
RIE
S I Z A Research Report No. 28
Review of Methodologies Applied for the Assessment of Employment and Social Impacts
Jan Maarten de Vet (ECORYS)Simon Roy (ECORYS)Hilmar Schneider (IZA)Vincent Thio (ECORYS)Gerbrand van Bork (ECORYS)
January 2010

This report has been supported by the European Community Programme for Employment and Social Solidarity (2007-2013) – PROGRESS - managed by the Directorate General for Employment, Social Affairs and Equal opportunities. This programme was established to financially support the implementation of the objectives of the European Union in the employment and social affairs area, as set out in the Social Agenda, and thereby contribute to the achievement of the Lisbon Strategy goals in these fields. The seven-year Programme targets all stakeholders who can help shape the development of appropriate and effective employment and social legislation and policies, across the EU-27, EFTA-EEA and EU candidate and pre-candidate countries. PROGRESS mission is to strengthen the EU contribution in support of Member States' commitments and efforts to create more and better jobs and to build a more cohesive society. To that effect, PROGRESS will be instrumental in: • providing analysis and policy advice on PROGRESS policy areas; • monitoring and reporting on the implementation of EU legislation and policies in PROGRESS
policy areas; • promoting policy transfer, learning and support among Member States on EU objectives and
priorities; and • relaying the views of the stakeholders and society at large For more information see: http://ec.europa.eu/employment_social/progress/index_en.html The information contained in this report does not necessarily reflect the position or opinion of the European Commission.

Review of Methodologies applied for the assessment of employment and social impacts (VC/2008/0303) Final Report
Client: DG Employment, Social Affairs and Equal Opportunities of the European Commission
In collaboration with:
Brussels, 15th January 2010

Contact address:
ECORYS Brussels NV
Rue Joseph II, no.9
B-1000 Brussels
Belgium
T: + 32 2 743 89 49
F: + 32 2 732 71 11
Legal address:
ECORYS Nederland BV
P.O. Box 4175
3006 AD Rotterdam
Watermanweg 44
3067 GG Rotterdam
The Netherlands
Registration no. 24316726
Fortis Bank no. 24.01.51.151
IBAN NL14 FTSB 0240 1511 51
BIC FTSBNL2R
VAT no. NL8080.28.741.B.08

Table of contents
Executive Summary i 0.1 Introduction i 0.1 Key findings ii 0.2 A Roadmap for assessing redistributive and regional employment impacts iii
0.1.1 Step 1: Scoping of impacts v 0.1.2 Step 2: Collecting additional evidence v 0.1.3 Step 3A: Methods for assessing redistributive effects vi 0.1.4 Step 3B: Methods for assessing regional employment effects viii
0.3 Recommendations ix
PART A: PROCESS AND METHODS 1
1 Introduction 3 1.1 Context and purpose of this report 3 1.2 Key dimensions of social impact assessment 5 1.3 A roadmap for assessing regional employment and redistributive effects 7 1.4 Structure of this report 13
2 Step 1: Scoping of impact 15 2.1 The role of initial scoping 15 2.2 Causal Chain Analysis 16
2.2.1 What is causal chain analysis? 16 2.2.2 Method example I: ESF in Mecklenburg-Vorpommern 17 2.2.3 Method example II: Trade Sustainability Impact Assessment 19 2.2.4 Applicability at EU level 21
3 Step 2: Collecting additional evidence 23 3.1 Measurability, evidence and data issues 23
3.1.1 Measurability 23 3.1.2 Data availability 24
3.2 Qualitative approaches and surveys 26 3.3 (Quasi-)experimental approaches: a realistic option? 27
3.3.1 What are "experimental" and "quasi-experimental" designs? 27 3.3.2 Method example: Quasi-experimental design in the ex-ante
evaluation of the rSa in France 30 3.3.3 Applicability at EU level 35
4 Step 3A: Assessing redistributive effects 37 4.1 Model family analysis 38

4.1.1 What is "Model family" analysis? 38 4.1.2 Method example I: Tax-benefit calculations 39 4.1.3 Method example II: Theoretical pension replacement rates 41 4.1.4 Applicability at EU level 41
4.2 Static micro-simulation models 42 4.2.1 What are static micro-simulation models? 42 4.2.2 Method example: EUROMOD 43 4.2.3 Applicability at EU level 45
4.3 Dynamic micro-simulation models 46 4.3.1 What are dynamic micro-simulation models? 46 4.3.2 Method example: The MICROS model 48 4.3.3 Applicability at EU level 49
4.4 Micro-simulation models combined with CGE models 49 4.4.1 What are micro-simulation models combined with CGE models? 49 4.4.2 Method example: the STSM-PACE-L model 50 4.4.3 Applicability at EU level 53
4.5 Micro-simulation models with spatial analysis 53 4.5.1 What are dynamic spatial micro-simulation models? 53 4.5.2 Method example: The SVERIGE model 53 4.5.3 Applicability at EU level 55
5 Step 3B: Assessing regional employment effects 57 5.1 Meso-level quantitative methods for ex-ante impact analysis 58
5.1.1 Input-output models 58 5.1.2 SAM-Leontief models 61 5.1.3 Partial equilibrium models 62
5.2 Regional CGE models 63 5.2.1 What are regional CGE Models? 63 5.2.2 Method example: MaMor2 Model (Poland) 63 5.2.3 Method example: VERM (Finland) 67 5.2.4 Method example: RegFin (Finland) 70 5.2.5 Method example: RAEM Model (Netherlands) 73 5.2.6 Applicability of CGE models at EU level 77
5.3 Macro-econometric models 78 5.3.1 What are macro-econometric models? 78 5.3.2 Method example: HERMES (Ireland) 78 5.3.3 Method example: REMI-NEI Model (The Netherlands) 82 5.3.4 Applicability of macro-econometric models at EU level 87
6 Conclusions and recommendations 89 6.1 Conclusions 89 6.2 Recommendations 90
PART B – APPLYING THE METHODS 93
7 TRANSPORT: Further liberalisation of the aviation ground handling market 95 7.1 Introduction 95

7.2 A. Identification of the methods / models 95 7.2.1 Problems to be addressed 95 7.2.2 Key aspects of policy 96 7.2.3 Objectives and constraints 98 7.2.4 Identification of direct impacts 99 7.2.5 Identification of redistributive and regional employment impacts 102 7.2.6 Focus for assessing redistributive and regional employment impacts 103 7.2.7 Methods to be considered 104
7.3 B. Testing results 106 7.3.1 Assessment of method 1: REMI-NEI model 106 7.3.2 Assessment of method 2: CGE Models 108
7.4 C. Conclusions 114
8 SOCIAL AFFAIRS: Workfare - a solution to the welfare trap? 117 8.1 Introduction 117 8.2 A. Identification of methods / models 117
8.2.1 Problems to be addressed 117 8.2.2 Key aspects of policy 119 8.2.3 Objectives and constraints 119 8.2.4 Identification of direct impacts 120 8.2.5 Identification of redistributive and regional employment impacts 120 8.2.6 Focus for assessing redistributive and regional employment impacts 120 8.2.7 Methods to be considered 121
8.3 B. Testing results 121 8.3.1 Assessment of micro-simulation model for individual labour supply 121 8.3.2 Assessment of the social experiments 124
8.4 C. Conclusions 126 8.5 References 126
9 ENERGY – Tighter requirements for the energy efficiency of buildings 129 9.1 Introduction 129 9.2 A. Identification of the methods / models 129
9.2.1 Problems to be addressed 129 9.2.2 Key aspects of policy 130 9.2.3 Objectives and constraints 132 9.2.4 Identification of direct and indirect impacts 134 9.2.5 Focus for assessing redistributive and regional employment impacts 138 9.2.6 Methods to be considered 140
9.3 B. Testing results 141 9.3.1 Assessment of method 1: Model family analysis 141 9.3.2 Assessment of method 2: Static micro simulation 144 9.3.3 Assessment of method 3: Dynamic micro simulation 145
9.4 C. Conclusions 146
PART C – COUNTRY REVIEWS 149
10 Country Reviews 151 10.1 Austria 151

10.1.1 Highlights on impact assessment practices 151 10.1.2 Methodological response 152
10.2 Finland 152 10.2.1 Highlights from IA practice 152 10.2.2 Methodological response 154
10.3 France 155 10.3.1 Highlights from IA practice 155 10.3.2 Methodological response 156
10.4 Germany 158 10.4.1 Highlights from IA practice 158 10.4.2 Methodological response 159
10.5 Ireland 160 10.5.1 Highlights from IA practice 160 10.5.2 Methodological response 161
10.6 Italy 163 10.6.1 Highlights from IA practice 163 10.6.2 Methodological response 164
10.7 The Netherlands 165 10.7.1 Highlights from IA practice 165 10.7.2 Methodological response 167
10.8 Poland 170 4.2.10 Highlights from IA practice 170 10.8.1 Methodological response 174
10.9 Spain 178 10.9.1 Highlights from IA practice 178 10.9.2 Methodological response 179
10.10 United Kingdom 183 10.10.1 Highlights from IA practice 183 10.10.2 Methodological response 185
ANNEX 1: SUMMARY OF METHODS AND MODELS 189
ANNEX 2: GLOSSARY OF TERMS 193

i
Executive Summary
0.1 Introduction
Impact Assessment (IA), as defined by the European Commission, involves a set of logical steps to be followed when preparing policy proposals. It is a process that prepares evidence for political decision-makers concerning the advantages and disadvantages of possible policy options based on an assessment of their potential impacts1. This report focuses on one aspect of the IA process: the assessment of the likely social impacts of the policy options proposed at EU level. This review was commissioned by DG Employment, Social Affairs and Equal Opportunities in recognition of the difficulties faced by those responsible for IA within the EU institutions in providing robust ex-ante assessments of the possible social impacts of new EU policy interventions2. The study3, undertaken over the course of 2009, set out to analyse methods used in EU Member States, at EU level and elsewhere in the world to assess two specific types of social impact: 1. The effects of policy interventions on employment at regional level ("Regional
employment effects") – essentially the spatial distribution of employment effects between and within regions and;
2. The effects of policy interventions on the employment, income and access to services of different social groups ("Redistributive effects") – essentially the distribution of social effects between different groups in society.
After an initial review of methods applied in a selection of EU Member States, as well as in international organisations and comparable countries outside the EU, the study examined a limited number of the most relevant methods in more depth. This second stage involved reviewing the way specific methods and models have been applied to date and making an assessment of their applicability for Impact Assessment exercises at EU level. In the final stage of the work, the strengths and weaknesses of different methods were analysed further by examining how they could be deployed to assess the regional employment and redistributive effects of three fictitious EU policy initiatives. These case studies provide worked examples of possible methodological approaches to the assessment of social impacts in different contexts and policy fields. The aim of the main study report is threefold:
1 European Commission, SEC (209) 92 – Impact Assessment Guidelines, 15th January 2009. 2 See: Evaluation Partnership (2007) Evaluation of the Commission’s Impact Assessment System, Final Report 3 DG EMPL – Contract no. VC/2008/0303 - Review of Methodologies applied for the assessment of employment and social
impacts

ii
• Firstly, to provide an overview of literature on impact assessment methods for measuring redistributive and regional employment effects, based on international literature and a series of country reviews;
• Secondly, to provide a structure – what we have termed a "Roadmap" - to guide systematic analysis of the regional employment and redistributive effects4;
• Thirdly, and within the context of this "Roadmap", to provide an overview of relevant methods for assessment of regional employment and redistributive effects, with a particular emphasis on the applicability of these methods in an EU context.
The report is designed to be of use to the following target group: Commission staff, policy makers, experts and practitioners who are interested and engaged in the assessment of redistributive and regional employment effects, including various stakeholders. Readers are expected to be broadly familiar with the Commission's Impact Assessment system and process, but are not expected to be model builders or advanced model users.
0.1 Key findings
The study demonstrates that ex-ante assessments of employment and social impacts are carried out at Member State level, but that the methods used are often basic in nature – with some exceptions. One of the main reasons for the apparently limited sophistication of social impact assessment methods appears to be a lack of political commitment to the importance of social impact assessment among commissioning authorities (mostly government departments) and, associated with this, the limited budgets and time made available to undertake detailed analysis of the issues at stake. This generally weak demand works against the development of more sophisticated methods and models. Furthermore, there is no well-established tradition of "impact assessment" in the social research community – on the supply side. Methods and models are therefore not always readily available to meet the requirements of real-world social impact assessment in a policy-making environment. A gap exists between "theory" and "practice" in social impact assessment. The country research confirms that guidelines and requirements in the area of (social) impact assessment have been developed in several Member States, often within a specific policy focus, such as poverty (Ireland), equality (UK), or regulatory burdens (Austria). However, the extent to which these guidelines and requirements are systematically applied in policy analysis appears to be limited. In addition, as noted in Germany, but also to some extent in France, as well as in some other Member States, policy preparation can be a rather 'closed' process, where outside providers of impact assessment expertise (e.g. research institutes) are frequently not involved in policy making. Ministries of Finance, in particular, tend to have their own, "in-house" methods and models, which are used in the budgetary preparation process, but often not beyond.
4 The Roadmap is designed to fit within the existing Commission IA Guidelines and complement DG EMPL Guidance for
assessing social impacts.

iii
There are currently important limitations to the capacity of methods and models to assess redistributive and regional employment impacts at the EU level in a comprehensive manner. Indeed, model builders and users have pointed to various and significant hurdles when it comes to up-scaling existing methods to the EU level. Common barriers are the major data requirements, especially when regional-level outcomes need to be assessed, strong differences in the functioning of national and regional economies, labour markets and institutional contexts and differences in the way methodological and modelling expertise is organised in different Member States. In selecting methods of Impact Assessment at EU level, a balance needs to be found between sophistication and practicality. Another, more general, key conclusion is that, irrespective of the methods selected, all social impact assessments require a thorough understanding of the policy initiative being proposed, the markets in which it intervenes and the social groups it may affect. Based on the above limitations, we can conclude that it is often too ambitious to attempt a comprehensive, EU-wide analysis of the social impacts of particular policy options. It may be better to assemble evidence through a case-by-case approach focused on particular regions or Member States. Indeed, many of the models analysed are specific for particular regions and countries and only a few can be used for the EU as a whole. The most practical solution to a lack of EU-wide coverage is in-depth research on 'typical' target groups or regions – allowing expertise and experience from the ground to be fully integrated into the assessment. The institutional context of the methods and models themselves is essential for their sustainable application. It is important that a method, or especially a model, is linked to an established research institution which maintains and develops it over time. The experience with micro-simulation models in general, and with EUROMOD in particular, demonstrates the importance of exchange of good practice and the development of a vibrant 'community' - which exceeds the knowledge and skills of any one individual or institution.
0.2 A Roadmap for assessing redistributive and regional employment impacts
Any guidance on assessing redistributive and regional employment impacts at EU level needs to remain fully aligned with the Commission Impact Assessment Guidelines and the Guidance provided for assessing social impacts within the Commission Impact Assessment system. In this context, the following points are of importance. First of all, assessment of redistributive and regional employment impacts takes place as one (partial) step within the IA process. Secondly, the analysis of impacts requires a staged approach, which starts with the identification of impacts at a general level, followed by a qualitative assessment of the more significant impacts and only then followed by an in-depth quantitative analysis of the most significant impacts. Concretely, we distinguish three main steps for each of which a specific question is to be addressed:

iv
Figure 0.1 Roadmap to assessment of redistributive and regional employment impacts
Assess redistributive and regional employment impacts
Step 1: Scoping of impacts(Chapter 2)
no yes
Step 2: not really…Collecting additional evidence (Chapter 3)
yes
no
yes
Step 3B: Assessment of regional employment Step 3A: Assessment of effects (Chapter 5) redistributive effects (Chapter 4)
not really yes yes! not really
Causal chain analysis
Regional employment
effects
Redistributive effects
Model family
analysis
Q1. Are causal links clear and impacts likely
to be significant?
Q4. What is the most important type
of outcome?
Prior IA Steps1. What is the problem?
2. What are the objectives?3. What are the policy options?
4. Main impacts
Subse-quent
IA step: Com-pare
options
Q3. Are data available for all or
parts of EU?
(Quasi-) experimental
designs
Regional CGE
models
Macro-econometric
models
Dynamic Micro-
simulation models
Static microsimulation
models
Micro-/ spatial model
Micro-/CGE model
Q5. Strong interest in dynamics over
time?
Q5. Strong interest in dynamics over
time?
Both social and regional dimension
Q2. Are any of these impacts
quantifiable?
Qualitative approaches
Surveys
Partial equilibrium
models
Macro-accounting methods
• Step 1: Scoping of impacts: are redistributive and regional employment impacts
expected to be significant, thus warranting further investigation?
v
• Step 2: Collecting additional evidence: Are the impacts measurable and are evidence and data available?
• Step 3: (Quantitative) assessment of redistributive and regional employment impacts: Which methods and models can be used to (help to) provide a quantitative assessment of a) redistributive and b) regional employment effects?
0.1.1 Step 1: Scoping of impacts
After an initial qualitative assessment of the different impacts that can be expected (what types of impact and who is affected), an important question to pose is whether causal links are clear and regional employment and redistributive impacts likely to be significant (Q1)? Establishing causal links can be complex and attention needs to be paid to existing diversity within the EU. If it is considered that the regional employment or redistributive effects of a particular policy proposal will not be significant, there is naturally no case for pursuing detailed analysis of such impacts. In such cases, the assessment of other impacts should naturally proceed, before moving to the next step in the Impact Assessment process - the comparison of options. In practice, however, redistributive and regional employment effects are often disregarded in IA reports on the basis of a simple statement that such impacts are "not significant". Implicitly, this could also mean "we don't care" or "we didn't have time to look into it". It is evident that, for the sake of transparency as well as good policy making, statements about the significance or otherwise of potential impacts should be appropriately justified. Causal chain analysis can be a useful basic method for impact assessment, especially when addressing the question whether or not redistributive or regional employment effects are significant. Causal chain analysis essentially involves mapping the different types of direct and indirect impact that could be expected and the inter-relationship between these. Causal chain analysis can be a valuable way to allow stakeholders to be involved in the identification of possible impacts, while at the same time, it allows economic, social and environmental impacts to be assessed in conjunction with each other. Clearly, such analyses are qualitative in nature and it can be difficult to describe more complex relationships involving conditionality and thresholds in the "impact maps" produced. In general terms, however, causal chain analysis is a very useful initial analytical tool for structuring further work in a wide range of Impact Assessment exercises.
0.1.2 Step 2: Collecting additional evidence
If the initial, qualitative assessment of causal links highlights the possibility of significant regional employment or redistributive impacts, which can be situated within (reasonably) clear lines of causality, two questions need to be answered before any attempt can be made to assess the likely scale of these impacts in a quantitative manner. Firstly, are any of the identified impacts quantifiable (Q2) and, subsequently, are data available for all or parts of the EU to allow measurement? (Q3).

vi
While certain impact variables, such as employment or household or firm-level income and expenditure can be quantified with relative ease, other types of impact are inherently more complex and difficult to quantify. Regional employment effects are, in principle, quantifiable, although data may not always exist (see below). Redistributive effects include a wider range of impact variables, not all of which are easy to measure5. If important impacts are difficult or impossible to quantify (and thus no meaningful quantitative data are likely to exist), then qualitative approaches (such as perception surveys or interviews) are the only way of assessing these impacts. If, however, identified impacts are, in principle measurable, the next question is whether baseline data are available, on the basis of which future changes (impacts) can be predicted or modelled. For a variety of potential impact variables, data sets are available and EUROSTAT, the OECD and the ILO are reliable sources that cover multiple Member States and can thus facilitate EU-wide comparisons. However, statistical sources have limits, notably in terms of coverage, comparability and level of (dis-)aggregation. An increasingly common approach in an ever larger EU is to study a number of Member States or regions which are 'typical' for a type of characteristic or institutional arrangement. If quantitative data are not even available for a selection of Member States, new data could be collected through surveys, specially tailored to the information needs of the Impact Assessment. This option has clear time and resource implications. In certain circumstances, information on the impacts of a particular policy could be collected by running a policy trial incorporating a (quasi-) experimental research design. Trials of this type involve implementing the proposed policy initiative on a small scale, monitoring impacts over time and comparing these with counterfactual evidence – derived from a control or comparison group. The use of experimental and quasi-experimental designs for ex-ante analysis is receiving increased attention at the EU level, but such methods have not been used in the context of EU policy initiatives to date and remain methodologically challenging to apply. Such methods are of considerable potential value when existing levels of knowledge about likely cause and effect or effects on specific social groups are insufficient to make reliable judgements about probable impacts. However, some requirements need to be met. The main difficulty relates to the selection of the treatment and non treatment groups. The way these groups are chosen underpins all subsequent analysis and the reliability of results. Truly experimental designs, with random assignment of individuals or entities to treatment, are difficult to implement for both political and practical reasons, while quasi-experimental alternatives are plagued by methodological difficulties.
0.1.3 Step 3A: Methods for assessing redistributive effects
If significant regional employment or redistributive impacts are expected from the policy proposed, the relevant impact variables are quantifiable and appropriate data sets are available (perhaps for a selection of Member States), the next question is what is the most important type of outcome expected? (Q4) As highlighted, "redistributive effects" relate
5 For example, impacts on overall levels "social inclusion" can be difficult to quantify in a meaningful way. Even if indicators
of relative poverty (based on household or individual income) are frequently used a proxy indicator for social inclusion, this is only one dimension of "inclusion".

vii
to differential impacts on different social groups, whereas "regional employment effects" require a territorial approach, requiring examination of employment (as well as income) effects on the basis of regional-level data. In some cases, both regional and redistributive impacts will need to be measured, with consequences for the methods to be used. Here, we focus initially on methods for assessing redistributive effects (Step 3A). Methods for assessing regional employment effects are reviewed in the next section (Step 3B). Model family analysis is a method closely related to static micro-simulation. However, rather than using data for a whole population, data for a set of pre-defined hypothetical "model" households are used as input for the analysis. Census or survey data are generally used to derive the statistical definition of the "model" households. Model family analysis is a simple, and therefore widely applicable, tool for measuring redistributive effects at the level of households. The typical applications in areas of pensions and social protection mean it is above all applicable at Member State level, where it provides added value in income distribution analysis. Areas where the method could be used can be extended to basic household needs, including housing, energy and mobility. An important advantage of its simplicity is that model family analysis can be applied quickly, and become an integral part of policy preparation. Amongst the main limitations are the focus on 'typical' households and the fact that it is most appropriate for expenditure-based interventions and income effects. Micro-simulation is a method used to determine the impact of policy changes by separately evaluating the effect of these changes at the micro level – in other words at the level of individuals, of households or of individual firms. It is thus a powerful type of model for assessing the impact of social and economic policy changes in some detail. If regional information is available, the method can be adjusted to allow for a regional approach to policy analysis. Truly static micro-simulation models look at economic agents at one point in time only. Models of this kind are simply accounting mechanisms and do not consider behaviour over time. They tend to be based on representative samples of a population and are primarily used to investigate the first round impact of government policy reform. Often, these models contain a high level of detail for the tax and benefit system. Within the family of micro-simulation models, EUROMOD is intended to be used across the whole EU. The EUROMOD team is currently developing a new version of the model which will further increase the comparability and coverage among Member States and further strengthen the applicability at the EU level. The strengths of EUROMOD are the possibility to analyse the effects of policy changes on income distribution and the public budget, taking into account interactions between policy instruments. The main limitation of the model is the very labour-intensive maintenance required to keep it up to date. Before reaching the method of choice, one further question needs to be posed: How strong is the interest in dynamics over time? (Q5). In principle, such interest should be strong amongst all policy-makers. As dynamic micro-simulation models allow for the evaluation of long-run effects, there is a demand for such models at the EU level. However, such a model does not currently exist.

viii
0.1.4 Step 3B: Methods for assessing regional employment effects
The study has reviewed methods commonly used in the regional economic modelling literature, and has done so in more depth for the more promising methods. Several methods exist to assess quantitatively the impacts of proposed policies on regional employment. Partial equilibrium models can be relevant when assessing impacts of policies on detailed variables (e.g. employment by group) on the labour market (or other specific markets). The main strength of partial equilibrium models is the possibility to focus in detail on the effects of policies on one market, such as the labour market. Weak points include the fact that the models ignore impacts on other markets and do not take into account interrelations between regional markets (for example between the goods market and labour market). Macro-accounting methods (i.e. input-output, SAM-Leontief) and some of the other more practical methods (shift-share, indicators) rely on relatively weak theoretical foundations and behavioural feedback mechanisms are not incorporated; prices are fixed and do not adjust to reflect changes in real activities. The multipliers calculated with SAM-Leontief models tend to be larger than those calculated with input-output models. In the study promising macro-econometric models have been assessed for Ireland (HERMES, and EU HERMIN models) and the Netherlands (REMI-NEI). Macro-econometric models have the advantage of having all key markets and outcome variables covered for a whole region, while having empirically estimated parameters. They can also be easily combined with input-output and inter-regional interdependencies. However, they are demand-oriented and tend to overestimate impacts due to a failure to take into account the supply side and (price) feedbacks. Macro-econometric models are more suitable for evaluating the short to medium-term impacts of investments and subsidies. All of these models can in principle be applied for regulatory policies (such as EU directives), but this would require additional studies to derive inputs for cost or price changes. The HERMES model is already rolled out across several EU Member States in the form of the simpler HERMIN models. The most important constraint for extending these models across the EU relates to differences in the characteristics and functioning of economies between regions. This implies that developing one general macro regional model for the EU (with one EU set of parameters) is probably too ambitious. Computable General Equilibrium (CGE) models have a stronger micro-economic foundation, including supply side and price adjustments. For long-term impacts of policy instruments in the fields of monetary stimuli and regulation, CGE models are likely to be the best choice. CGE models provide the flexibility necessary for analyzing regional economic impacts. Within the context of this study, several promising CGE models have been reviewed in depth, notably for Poland (MAMor2), Finland (VERM and REGFIN) and the Netherlands (RAEM). At the moment, the RAEM and the REGFIN models are already being developed for EU-level use and hence these models could be available relatively rapidly for use on an EU-wide basis. The Finnish VERM model also has potential for EU-level application, but rolling it out would most likely take significantly longer. Most of these models can in principle also be applied to regulatory policies, but need additional studies on costs or price effects as inputs.

ix
A more general conclusion emerging is that for very specific policy instruments (specific in terms of the sectors or markets affected) the development of tailor-made models is preferable to using existing, general macro-level employment models.
0.3 Recommendations
For practitioners of social impact assessment 1. The need to step up efforts in social impact assessment. Within the context of an
advanced system of Community Impact Assessment, the social pillar of impact assessment work has received relatively little attention to date. This is a concern, as good EU policy making requires a full and balanced overview of impacts – in advance of final decision-making. It is important that it is known in an early stage when specific target groups or regions are affected by such policy initiatives. For this, more methodological work is required to further develop social impact assessment.
2. Take a structured but pragmatic approach towards quantification/monetisation: The
Roadmap presented in this report can be a valuable tool for structuring IA work. A key element of this Roadmap is the staged approach – where causal chain analysis is recommended as a tool for scoping social impacts, prior to use of any quantification tools.
3. Invest time in the proper choice of methods and models beforehand. Nothing is more
frustrating than to carry through an assessment on the basis of inappropriate methods or models. As such, time should be invested in assessing the strengths and weakness of alternative methods. This report and the Roadmap could be seen as a tool in this process.
4. Explore data availability in an early stage. Many methods and models which may be
interesting from a theoretical point of view may not be applicable in practice due to the limited availability of disaggregated data at the EU level. Early exploration of data availability, for instance by using the Guidance provided for assessing social impacts within the Commission Impact Assessment system, is strongly recommended.
5. Make better use of ex-post evaluations: Impact assessments are often carried out
under time pressure, and there can be limited scope for additional data collection. Much can be gained by making use of the results from ex-post evaluations of related or relevant initiatives, which dealt with employment and social impacts. Ex-post evaluations can be particularly useful for identifying indirect and unintended impacts, but also for establishing key ratios that can be used in the methods and models described in the main report.
For policy makers in the impact assessment system 6. Stimulate demand for social impact assessments; the best way to promote the
development of social impact methods and models is to stimulate demand, by raising standards and expectations. At the level of the Commission, further support from the Secretariat General and Impact Assessment Board is required, whereas DG EMPL is well placed to support other DGs with such assessments in their respective areas. At

x
the level of Member States, the European Commission as a whole should also consider ways to encourage and stimulate greater assessment of social impacts. Peer review sessions between Member States – such as the meeting held in Bratislava in late 2008 – could be held more regularly.
7. Disaggregated data requirements are the most common barrier for assessing social
impacts at EU level, especially when time series are required. In light of the short timeframes available for Community IAs, it is often difficult to collect ad hoc data for impact assessments. Based on the Guidance provided for assessing Social impacts within the Commission Impact Assessment system, it is therefore important to further develop the overview of EU-wide disaggregated data sources and promote the collection of EU-wide data (including such sources as household surveys and labour market surveys). For this reason, cooperation between DG EMPL and EUROSTAT and contributing to the EUROSTAT work programme will be of vital importance.
8. The Commission is well-placed to develop an EU-wide community of practice in
social impact assessment, where practitioners, policy makers, dedicated independent or government institutes, social partners, sectoral social dialogue committees, experts and model builders can exchange and compare. The PROGRESS programme could provide powerful support to develop such an initiative. Calls for proposals should however be focused on specific issues, such as employment or income effects, social exclusion, access to services, or specific target groups (e.g. minorities, women, the disabled). Such a community of practice could also play a stimulating role in promoting social impact assessment at the Member State level.
9. Explaining and communicating (social) impact assessment methods. As discussed in
a recent seminar on the topic6, external stakeholders often consider Community Impact Assessment to be a black box – both in terms of process and methods. The Impact Assessment process itself, as well as the findings arrived at, need to be better explained. Experts from the Impact Assessment community should invest more time in explaining their methods and in ensuring that their findings address the questions that policy makers have; greater transparency about the criteria used to rank options in terms of impact is also required. This is especially important in the social area, where stakeholders play a prominent role.
10. The Commission is recommended to be prudent in directly supporting the supply
side, especially in terms of active and direct support to any new models ('picking winners'). After all, several models to assess social impacts with EU aspirations have already seen the daylight. At this stage, some competition between methods and models can be considered healthy, as long as there is a level playing field. There appears to be no reason for the Commission to back the full development of any new model without being clear about its value added compared to already existing models.
6 ECORYS "Ways forward for Impact assessment", Brussels, 22nd September 2009.

xi
Furthermore, all such models struggle with the same major challenges – in terms of data collection and the modelling of institutional frameworks.

1
PART A: PROCESS AND METHODS


3
1 Introduction
1.1 Context and purpose of this report
"The Commission has instigated a revolution in the way policies are made at the EU level, with public consultations and
impact assessments now the norm for new legislative proposals"
"We must make (policy) proposals fully conscious of the range of economic, social and environmental consequences they will have"
Commission President Barroso -
setting out the Political guidelines for the new Commission in 20097 Impact Assessment (IA), as defined by the European Commission, involves a set of logical steps to be followed when preparing policy proposals. It is a process that prepares evidence for political decision-makers on the advantages and disadvantages of possible policy options by assessing their potential impacts8. The core questions that must be answered in Impact Assessments conducted by the European Commission are as follows: 1. What is the problem that needs to be addressed by public policy intervention? 2. What should be the objectives of the proposed policy intervention? 3. What are the main policy options for reaching the objectives identified? 4. What are the likely economic, social and environmental impacts of these options? 5. How do the main options compare in terms of effectiveness, efficiency and coherence
in solving the problem identified? 6. How can the performance of the preferred policy option be evaluated in the future? This report focuses on the social dimension of the fourth of these core questions. It consolidates the findings of a review of methods that have been developed and used to identify and measure ex-ante, important social impacts of public policies. This review was commissioned by DG Employment, Social Affairs and Equal Opportunities in recognition of the considerable challenges faced by those responsible for IA within the EU institutions in providing robust ex-ante assessments of the possible social impacts of new EU policy interventions9. 7 José Manuel Barroso (2009), "Political guidelines for the next Commission". See
http://ec.europa.eu/commission_barroso/president/pdf/press_20090903_EN.pdf 8 European Commission, SEC (209) 92 – Impact Assessment Guidelines, 15th January 2009. 9 See: Evaluation Partnership (2007) Evaluation of the Commission’s Impact Assessment System, Final Report
4
A consistent message coming from those involved in Impact Assessments at the EU level is that assessment of employment and social effects tend to be relatively limited – especially in comparison to assessment of economic and environmental effects. The external evaluation of the IA carried out in 200610 confirmed the need to strengthen the quality of assessment of potential social impacts, given their importance. Similar conclusions were drawn by the European Parliament and the Economic and Social Committee. This study11, undertaken over the course of 2009, set out to analyse methods used in EU Member States, at EU level and elsewhere in the world to assess two specific types of social impact: 1. The effects of policy interventions on employment at regional level ("Regional
employment effects") – essentially the spatial distribution of employment effects between and within regions;
2. The effects of policy interventions on the employment, income and access to services of different social groups ("Redistributive effects") – essentially the distribution of social effects between different groups in society.
After an initial review of methods applied in a selection of EU Member States12, as well as in international organisations and comparable countries outside the EU, the study examined a limited number of the most relevant methods in more depth. This second stage involved reviewing the way specific methods and models have been applied to date and making an assessment of their applicability for Impact Assessment exercises at EU level. In the final stage of the work, the strengths and weaknesses of different methods were analysed further by examining how they could be deployed to assess the regional employment and redistributive effects of three fictitious EU policy initiatives. These case studies provide worked examples of possible methodological approaches to the assessment of social impacts in different contexts and policy fields. The aim of this report is threefold: • Firstly, to provide an overview of literature on impact assessment methods for
measuring redistributive and regional employment effects, based on international literature and a series of country reviews for selected EU Member States;
• Secondly, to provide a structure – what we have termed a "Roadmap" - to guide systematic analysis of the regional employment and redistributive effects of policy initiatives13;
• Thirdly, and within the context of this "Roadmap", to provide an overview of relevant methods for assessment of regional employment and redistributive effects, with a particular emphasis on the applicability of these methods in an EU context.
10 See the full evaluation report (p. 115) http://ec.europa.eu/governance/impact/docs/key_docs/tep_eias_final_report.pdf 11 DG EMPL – Contract no. VC/2008/0303 - Review of Methodologies applied for the assessment of employment and social
impacts 12 The 10 Member States covered were: AT, DE, ES, FI, FR, IE, IT, NL, PL and UK. They were selected on the basis of 1)
Overall IA tradition; 2) Attention paid to social impacts; 3) Attention to regional impacts and 4) Geographic coverage. 13 The Roadmap is designed to fit within the existing Commission IA Guidelines and complement DG EMPL Guidance for
assessing social impacts.
5
This report is designed to be of use to the following target group: Commission staff, policy makers, experts and practitioners who are interested and engaged in the assessment of redistributive and regional employment effects, including various stakeholders. Readers are expected to be broadly familiar with the Commission's Impact Assessment system and process, but are not expected to be model builders or advanced model users.
1.2 Key dimensions of social impact assessment
Methods for IA can be viewed from two main perspectives. On one side are the policy makers and officials who need to apply methods (or oversee their application) in order to reach a judgement about the potential impact of policy interventions being proposed. This can be viewed as the "demand side" of the IA equation. On the other side is the research community, which undertakes empirical research and develops methods and models – the "supply side". The development of methods and models for impact assessment requires both demand and supply to be in place. However, researchers and policy makers face very different questions, constraints, choices and dilemmas. A good impact assessment requires above all that researchers and policy makers understand each other – and reach a consensus about a method which is agreeable to both sides. We have examined the challenges for social impact assessment from both perspectives – the research/supply and the policy/demand perspective. However, in light of the target audience for this report, we will focus primarily on the policy makers' perspective. Two key questions for the study have been: a) how can the methods and models for impact assessment then be classified from the viewpoint of the practitioner? and b) which methods and models are most useful when one is charged with assessing the redistributive or regional employment effects of a particular policy initiative? In answering these questions at EU level, the following dimensions are important: • Dimension A: The type of intervention; • Dimension B: The outcome variable (type of effect) of interest; • Dimension C: The level at which outcomes need to be measured; • Dimension D: Budget and time constraints facing the assessment exercise and; • Dimension E: The time dimension (effects over time). Dimension A: Type of intervention Most experience in impact assessment has been gained in measuring the effects of expenditure-based interventions, but the policy trend is towards increased assessment of regulatory and coordination-type measures. • Expenditure-based interventions; all methods and models studied can in principle be
used with such interventions. Model-based approaches can be used provided the intended and/or expected impacts of the intervention are quantifiable.
• Legislative proposals (Regulation, including Regulations and Directives); Legislative proposals are more challenging to assess. In theory, macro models are capable of addressing legislative proposals, although this requires additional input studies that can translate any proposal into measurable input variables, which provide the basis for the modelling process. Finding the right inputs at the EU level can be complex, as

6
variation between Member States can be strong. It is therefore preferable to focus such input studies on case studies (Member States or regions) only, and direct the efforts to those areas where the macro model of choice is working. From these case study findings, more general impacts can then be estimated.
• Non-legislative proposals (Communications, Recommendations, White Papers, including OMC). Non-legislative approaches are the most difficult to assess as the direct effects of such measures and lines of causality between the intervention and likely outcomes are frequently unclear. A comprehensive assessment of the social impacts of such measures at the EU level is impossible – and most likely not proportional. A case study approach is recommended for non-legislative proposals (Communications, Recommendations, White Papers, including OMC).
Dimension B: Outcome variable Three factors can be viewed as particularly important in determining the "social impact" of a given policy initiative: a) effects on employment; b) effects on household income and c) effects on access to services. In basic terms, adequate employment, income and access to services may be considered the basis for social inclusion, meaning that changes to these factors, including those affecting particular territories or groups, will affect overall levels of social inclusion. The power of the methods studied clearly differs in terms of this dimension: • Employment; as employment is comparatively easy to quantify, virtually all methods
studied are capable of measuring employment effects, with the exception of model family analysis;
• Income; as income, is also quantifiable, all methods are capable of measuring income effects;
• Access to services; methods studied appear to be less powerful in assessing access to (public) services, largely because of difficulties in measuring the concept, and this may be a relative 'white space'14. The concept of "access to services" has various dimensions. Access in geographic terms calls for models with a spatial dimension. Differential levels of "access" between social groups and the effect of these differences are even more difficult to measure.
Dimension C: Level of outcome To what extent can likely policy outcomes be analysed and presented at the level of Member States or regions, specific sectors and/or social groups? This is a dimension where the methods clearly differ. In this report, we have focused on the distinction between geographical level (national and regional) and social groups (for example, men and women, high income and low income groups, the able bodied and the physically disabled). • Regional/National; macro models (both macro-econometric and CGE) are clearly
most powerful in this area; many of such models can assess impacts both at national and regional levels;
14 Examples of (public) services to be considered at EU level include education, culture and sports, financial services, postal
service and other services of general economic interest, including public transport and utilities (energy, water, telecoms). We have checked the above statement against a number of EU Impact assessments, but did not find significant methodological guidance on this issue.

7
• Social groups; micro models are clearly most powerful in this area, as the unit of analysis is detailed enough to allow for aggregation of target groups (such as low-income families). Policy trails involving (quasi-) experimental designs can also provide valuable insights into the impact of policies on different social groups. Some macro models can also distinguish social groups and model family analysis also focuses on (typical) social groups.
Dimension D: Budget and time constraints In practice, the budget and time available for social impact assessments is likely to be a key determinant of the methods applied. We can distinguish between, low, medium and high resource-intensity methods: • Low resource-intensity; causal chain analysis, based on qualitative assessment of
impacts is an important low resource-intensity method, hence the recommendation to use this approach in the Impact Assessment guidelines; this approach is a useful basic method in all Impact Assessments.
• Medium resource-intensity; some simple macro models require moderate resources; model family analysis is also limited in terms of resource-intensity.
• High resource-intensity; all model approaches, including micro-simulation models and the more complex macro models are expensive to develop in the first place and / or tailor to the needs to individual policies, if major changes to the model and available data are required (once set up, the marginal cost of running models can be modest); (quasi-) experimental designs are also resource-intensive. Evidently a combination of various models (e.g. micro-simulation models with spatial analysis) can only be carried out in environments where long-term planning and substantial resourcing are secured.
Dimension E: Time dimension From the policy perspective, a key question is how the effects of a particular policy initiative will be felt over time (in the short, medium and longer term). Some methods and models can only provide information on a newly emerging equilibrium at a specific point in time after the policy has been implemented. Other methods and models can take into account the reaction of affected populations to the policy change and thus provide an indication of the longer term effects of the intervention in question. The dimensions above have been used in the development of a "roadmap" for the assessment of redistributive and regional employment impacts, which we examine in the next section.
1.3 A roadmap for assessing regional employment and redistributive effects
Building on the Commission's Impact Assessment Guidelines Any guidance on assessing redistributive and regional employment impacts at EU level needs to remain fully aligned with the Commission Impact Assessment Guidelines (which set out a standard procedure of Impact Assessment) and the Guidance provided for assessing Social impacts within the Commission Impact Assessment system. In this context, a number of points are important.

8
First of all, assessment of redistributive and regional employment impacts takes place as one (partial) step within the IA process, and it is assumed that all previous steps have been taken into account. Therefore, problems have been analysed, objectives established for the proposed policy, options have been defined and a first identification of the broader impacts has been considered. It is only at this stage that detailed attention to the regional employment and redistributive impacts makes sense. It also needs to be recognised that the measurement of regional employment and redistributive impacts needs to be undertaken alongside measurement of wider economic and environmental effects and feed into the next step: the comparison of policy options. In practice, this will put time pressure on such assessment, especially when it is carried out as a separate building block. Having said this, IA is also an iterative process, which implies that previous steps that have been accomplished might be revisited on the basis of further findings. Secondly, it needs to be recognised that the analysis of impacts requires a staged approach, which starts with the identification of any impacts at a global level, followed by a qualitative assessment of the more significant impacts, only then followed by an in-depth quantitative analysis of the most significant impacts. This approach is very much supported by the emerging findings from this study, and we therefore build our roadmap around these steps. Concretely, we distinguish the following steps: • Step 1: Scoping of impacts: here we pose the question of whether redistributive and
regional employment impacts are expected to be significant and thus warrant further investigation;
• Step 2: Collecting additional evidence: here we address the questions of measurability of the impacts and the availability of evidence and data;
• Step 3: (Quantitative) assessment of redistributive and regional employment impacts: here we describe methods and models that can be used to (help to) provide a quantitative assessment of a) redistributive and b) regional employment effects.
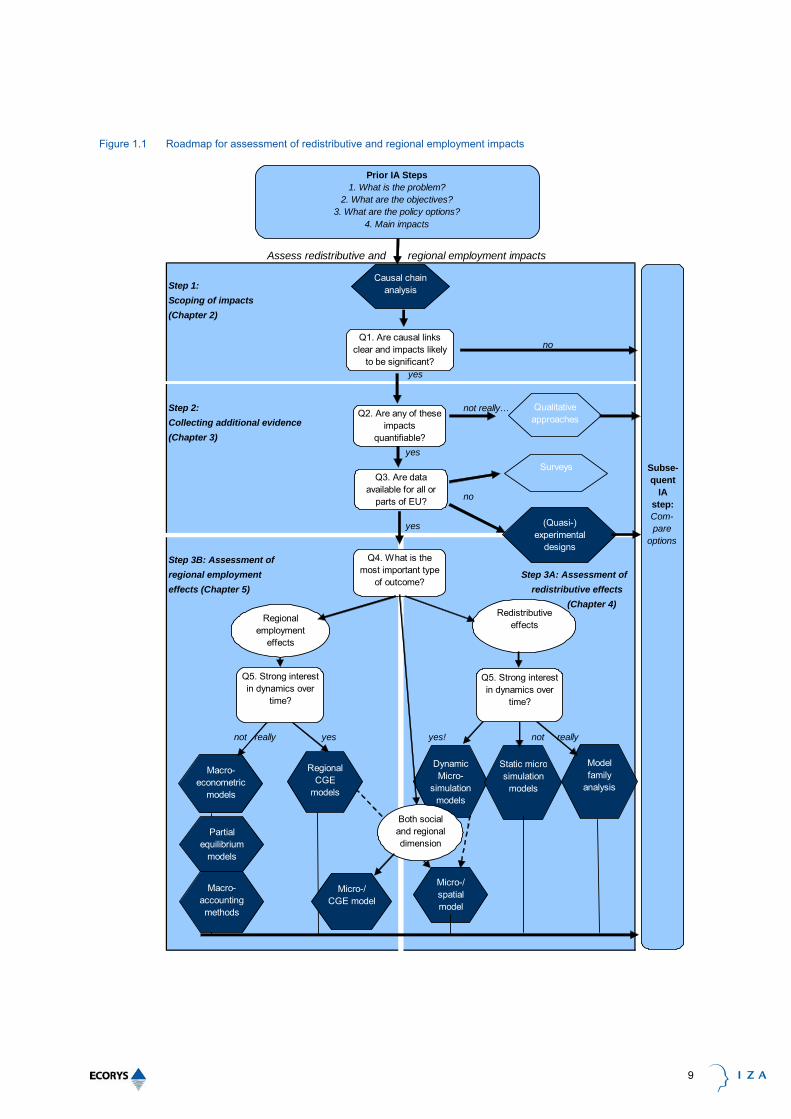
9
Figure 1.1 Roadmap for assessment of redistributive and regional employment impacts
Assess redistributive and regional employment impacts
Step 1: Scoping of impacts(Chapter 2)
no yes
Step 2: not really…Collecting additional evidence (Chapter 3)
yes
no
yes
Step 3B: Assessment of regional employment Step 3A: Assessment of effects (Chapter 5) redistributive effects (Chapter 4)
not really yes yes! not really
Causal chain analysis
Regional employment
effects
Redistributive effects
Model family
analysis
Q1. Are causal links clear and impacts likely
to be significant?
Q4. What is the most important type
of outcome?
Prior IA Steps1. What is the problem?
2. What are the objectives?3. What are the policy options?
4. Main impacts
Subse-quent
IA step: Com-pare
options
Q3. Are data available for all or
parts of EU?
(Quasi-) experimental
designs
Regional CGE
models
Macro-econometric
models
Dynamic Micro-
simulation models
Static microsimulation
models
Micro-/ spatial model
Micro-/CGE model
Q5. Strong interest in dynamics over
time?
Q5. Strong interest in dynamics over
time?
Both social and regional dimension
Q2. Are any of these impacts
quantifiable?
Qualitative approaches
Surveys
Partial equilibrium
models
Macro-accounting methods

10
Step 1: Scoping of impacts The start of any impact assessment, including assessment of redistributive and regional employment effects, involves a scoping stage, where the likely significant effects of a policy proposal and the possible policy options should be identified in a qualitative manner. As set out in the Commission IA Guidelines15, the following social domains should be considered in such an analysis: • Employment and labour market; • Standards and rights related to job quality; • Social inclusion and protection of particular groups; • Gender equality, equal treatment and opportunities, non-discrimination; • Individuals, private and family life, personal data; • Governance, participation, good administration, access to justice, media and ethics; • Access to and effects on social protection, health and educational systems; • Public health and safety; • Crime, terrorism and security; • Culture; • Social impacts in third countries. After an initial assessment of the different impacts that can be expected (what types of impact and who is affected), an important question to pose is whether causal links are clear and impacts likely to be significant (Q1)? Establishing causal links can be complex and attention needs to be paid to existing diversity within the EU. For example, assessment of an EU initiative to introduce minimum standards in a particular policy field may assume a clear causal link and strong impact in Member States in which existing standards are less strict than the proposed minimum. However, the assessment may need to recognise that positive impacts will be limited or non-existent in Member States where existing standards are equivalent or stricter than those proposed at EU level. This step may also benefit from consultation with stakeholders in general and social partners in particular. If it is considered that the regional employment or redistributive effects of a particular policy proposal will not be significant, there is naturally no case for pursuing detailed analysis of such impacts. In such cases, the assessment of other impacts should continue, before moving to the next step in the Impact Assessment process - the comparison of options. In practice, however, redistributive and regional employment effects are often disregarded in IA reports on the basis of a simple statement that such impacts are "not significant". Implicitly, this could also mean "we don't care" or "we didn't have time to look into it". It is evident that, for the sake of transparency as well as good policy making, statements about the significance or otherwise of potential impacts should be appropriately justified. Step 2: Collecting additional evidence If the initial, qualitative assessment of causal links highlights the possibility of significant regional employment or redistributive impacts, which can be situated within (reasonably) clear lines of causality, two questions need to be answered before any attempt can be made to assess the likely scale of these impacts in a quantitative manner. Firstly, are any
15 See SEC(2009) 92, pp.34-35
11
of the identified impacts quantifiable (Q2) and, subsequently, are data available for all or parts of the EU to allow measurement? (Q3). While certain impact variables, such as employment or household or firm-level income and expenditure can be quantified with relative ease, other types of impact are inherently more complex and difficult to quantify. Regional employment effects are, in principle, quantifiable, although data may not always exist (see below). Redistributive effects include a wider range of impact variables, not all of which are easy to measure16. If important impacts are difficult or impossible to quantify (and thus no meaningful quantitative data are likely to exist), then qualitative approaches (such as perception surveys or interviews) are the only option for obtaining information for assessing these impacts. If, however, identified impacts are, in principle measurable, the next question is whether baseline data are available, on the basis of which future changes (impacts) can be predicted or modelled. For a variety of potential impact variables, data sets are available and EUROSTAT, the OECD and the ILO are reliable sources that cover multiple Member States and can thus facilitate EU-wide comparisons. However, statistical sources have limits, notably in terms of coverage, comparability and level of aggregation. An increasingly common approach in an ever larger EU is to study a number of Member States which are 'typical' for a particular model or institutional arrangement. Another common problem, especially when dealing with redistributive and regional employment effects, arises when the level of aggregation of available data is not detailed enough. For example, in the case of a comprehensive neighbourhood investment programme with many different actions and projects it could be impossible to obtain relevant data, not only because of the low level of aggregation required, but also the fact the neighbourhoods do not coincide with statistical boundaries. In such cases, different options exist: 1. Pursue qualitative analysis, such as interviews, focus groups and case studies; they
are likely to bring evidence as long as sufficient triangulation takes place and robust qualitative research techniques are applied;
2. Collect additional information through surveys; the advantage of surveys is that they can be tailor-made and provide fresh information, including on views and perceptions; however they are expensive and can only monitor developments over time if regular updates are carried out.
3. Launch policy trials using (quasi-)experimental designs, which will be able to monitor impacts over time and compare these with counterfactual evidence – from a control or comparison group. Clearly, results from such an approach cannot be expected overnight and this method is only recommended if it is part of a long-term and rigorous research design.
It should be noted that policy trials using (quasi-)experimental designs – effectively social experiments – are a means to both collect new information and assess the effects of a
16 For example, impacts on overall levels "social inclusion" can be difficult to quantify in a meaningful way. Even if indicators
of relative poverty (based on household or individual income) are frequently used a proxy indicator for social inclusion, this is only one dimension of "inclusion".

12
particular policy, as a small scale version of the policy itself is actually tested on the ground and the immediate and short-term effects measured in real time. Once evidence and/or data are sufficiently available, one can proceed with the next step. Step 3: Quantitative assessment of most important impacts If the potential for significant regional employment or redistributive impacts is identified, the relevant impact variables can be quantified and appropriate data sets are available (perhaps for a selection of Member States), the next implicit question, with an important bearing on the selection of methods, is what is the most important type of outcome expected? (Q4). As highlighted, "redistributive effects" relate to differential impacts on different social groups, whereas "regional employment effects" require a territorial approach, requiring examination of employment effects on the basis of regional-level data. In some cases, both regional and redistributive impacts will need to be measured, with specific consequences for the methods to be used. Before final choice of method is made, one other question needs to be posed: How strong is the interest in the dynamics over time? (Q5). In principle, such interest should be strong amongst all policy makers. Some (static) models are only informative about a newly emerging equilibrium at a particular point in time. Other (dynamic) models can also predict what will happen in the medium and longer term, as particular populations change their behaviour in reaction to the new policy. A good example is the construction of a motorway bridge, which in the short term creates significant employment in the building industry, but which is expected to have broader and gradually increasing labour market impacts in the longer-term – once the bridge is opened and once residents and firms have adjusted their behaviour to this new link. It is through the five key questions in the Roadmap that one is likely to arrive at an appropriate method, which should potentially be capable of assessing the redistributive or regional employment impacts of choice. Evidently, before applying the method or running a model, it is important to check whether relevant conditions have been fulfilled. Typical questions to pose are: • Which models are available within the territory/target group of choice? • Do you need to adapt the territory/target group to the availability of methods/models? • Who are the researchers able and willing to provide the analysis? • At what cost, in what timeframe and against what quality standards can the method be
applied? Once the assessment of redistributive and regional employment effects has been completed, the results will need to be compared and balanced with the likely economic and environmental impacts of the same policy options. The process of comparing and balancing social, economic and environmental impacts may require consideration of potential "trade-offs", where negative impacts in one domain have to be balanced against positive impacts in another.

13
1.4 Structure of this report
The remainder of Part A is structured as follows: • Chapter 2 examines the first step in the roadmap – focusing on the initial scoping of
impacts (causal chain analysis); • Chapter 3 examines the issue of the measurability of impacts (a pre-requisite for
using the quantitative methods presented later) and the availability of evidence on causal relationships and data to measure relevant variables (step 2 in the roadmap);
• Chapter 4 examines methods most relevant to assessment of redistributive effects (step 3A in the roadmap);
• Chapter 5 examines methods most relevant to assessment of regional employment effects (step 3B in the roadmap).
Part B presents three case studies, which illustrate a theoretical application of the roadmap steps to three hypothetical EU policy initiatives. Part C presents the findings of the country review undertaken in the earlier part of the study, reviewing the application of the methods discussed in nine EU Member States.

15
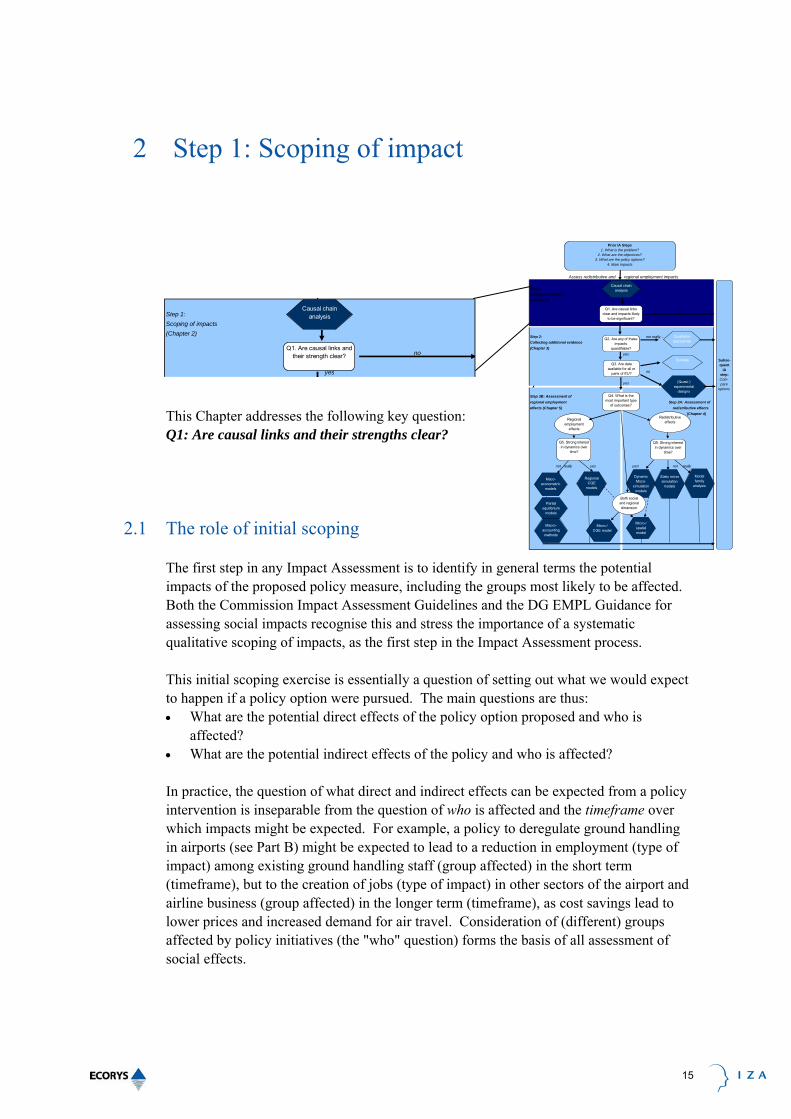
2 Step 1: Scoping of impact
This Chapter addresses the following key question: Q1: Are causal links and their strengths clear?
2.1 The role of initial scoping
The first step in any Impact Assessment is to identify in general terms the potential impacts of the proposed policy measure, including the groups most likely to be affected. Both the Commission Impact Assessment Guidelines and the DG EMPL Guidance for assessing social impacts recognise this and stress the importance of a systematic qualitative scoping of impacts, as the first step in the Impact Assessment process. This initial scoping exercise is essentially a question of setting out what we would expect to happen if a policy option were pursued. The main questions are thus: • What are the potential direct effects of the policy option proposed and who is
affected? • What are the potential indirect effects of the policy and who is affected? In practice, the question of what direct and indirect effects can be expected from a policy intervention is inseparable from the question of who is affected and the timeframe over which impacts might be expected. For example, a policy to deregulate ground handling in airports (see Part B) might be expected to lead to a reduction in employment (type of impact) among existing ground handling staff (group affected) in the short term (timeframe), but to the creation of jobs (type of impact) in other sectors of the airport and airline business (group affected) in the longer term (timeframe), as cost savings lead to lower prices and increased demand for air travel. Consideration of (different) groups affected by policy initiatives (the "who" question) forms the basis of all assessment of social effects.
Step 1: Scoping of impacts(Chapter 2)
no yes
Causal chain analysis
Q1. Are causal links and their strength clear?
Assess redistributive and regional employment impacts
Step 1: Scoping of impacts(Chapter 2)
no yes
Step 2: not really…Collecting additional evidence (Chapter 3)
yes
no
yes
Step 3B: Assessment of regional employment Step 3A: Assessment of effects (Chapter 5) redistributive effects (Chapter 4)
not really yes yes! not really
Causal chain analysis
Regional employment
effects
Redistributive effects
Model family
analysis
Q1. Are causal links clear and impacts likely
to be significant?
Q4. What is the most important type
of outcomes?
Prior IA Steps1. What is the problem?
2. What are the objectives?3. What are the policy options?
4. Main impacts
Subse-quent
IA step: Com-pare
options
Q3. Are data available for all or
parts of EU?
(Quasi-) experimental
designs
Regional CGE
models
Maco-econometric
models
Dynamic Micro-
simulation models
Static microsimulation
models
Micro-/ spatial model
Micro-/CGE model
Q5. Strong interest in dynamics over
time?
Q5. Strong interest in dynamics over
time?
Both social and regional dimension
Q2. Are any of these impacts
quantifiable?
Qualitative approaches
Surveys
Partial equilibrium
models
Macro-accounting methods

16
The IA Guidelines list different fields in the environmental, economic and social domains in which policy initiatives could possibly have an impact17, reflecting a range of EU policy concerns. These different fields effectively break the economy, the environment and society into different, smaller elements, in order to structure systematic consideration of potential impacts. As such, they can be viewed as a checklist to run through as part of the initial scoping exercise (once the broad lines of impact and cause and effect have been established), in order to ensure important effects are not missed. In the social domain, the fields listed by the IA Guidelines include, among other factors, employment, job quality, public health and safety and public service provision18. In order to structure initial scoping of potential direct and indirect impacts of policies and, importantly, the causal relations between these, "causal chain analysis" has been widely applied.
2.2 Causal Chain Analysis
2.2.1 What is causal chain analysis?
Causal chain analysis seeks to identify the significant cause and effect links between proposed changes arising from a new intervention and potential economic, social and environmental impacts. The basic principle of causal chain analysis – the identification of impacts and causal links – underpins all Impact Assessment and forms the basis for the application of other methods described in this report. Causal chain analysis is above all used to structure and describe the various links, and is, therefore, different from the more analytical methods examined in later sections. However, the method provides an almost indispensable basic 'map' of impacts, which is often a starting point for further analysis. In particular, it can be considered the prime tool for assessing whether redistributive or regional employment impacts are likely to be significant or not – a justification needed for any further analytical work. Causal chain analysis is closely related to the Logical Framework approach, a technique to support the objective definition of a project, as well as its implementation, monitoring and evaluation. The technique was developed in the 1960s in the US, and has become a preferred methodological tool for project planners in the field of overseas development. Its success owes much to its capacity to describe the internal functioning of a project in a given environment, and it has proved to be ideal in the context of simple programmes, where objectives and main actors are clearly identified. On the basis of its success, the method has also been extensively rolled out for the development, implementation, monitoring and evaluation of Structural Funds programmes, although with mixed success to date.
17 CEC (2009) Impact Assessment Guidelines 18 A full list of social impacts can be found on pp.34-35 of the Commission Impact Assessment Guidelines. "Social Inclusion
and protection of social groups" is a more complex field, also included in the IA Guidelines. "Social inclusion" relates primarily to the distribution of income and employment between different social groups (relative poverty, being a key indicator of social inclusion).

17
The Commission's Impact Assessment Guidelines clearly present causal chain analysis as an approach for impact analysis19. The Guidance for assessing Social Impacts, also highlights analysis of "causalities and strengths of linkages" as a key step in the IA process20. Both documents propose listing the various problems linked to the issue at stake; then set out problems in a hierarchical order and then order these in a tree-like structure, such as the example below. Clearly, the higher the number of problems a policy is supposed to address, the more complex the tree. In general, considerable reflexion is required to prepare a causal chain model. It often requires knowledge and expertise which is shared, hence there is a preference in this method to mobilise a group of experts or stakeholders through a workshop or brainstorming session.
2.2.2 Method example I: ESF in Mecklenburg-Vorpommern
1. Background, theoretical basis and key design features As mentioned, the causal chain model has in various forms been promoted as part of the implementation of the EU Structural Funds. The method has been used since the 1990s as part of the preparation, implementation, monitoring and evaluation of Structural Funds programmes. Findings from ex-post evaluations (e.g. on key indicators) have also been used as input into ex-ante evaluations. The ESF programme in Mecklenburg-Vorpommern for the period 2007-2013 made use of this approach when designing the programme, in combination with an indicator-based monitoring system. The approach used reflects the methodological principles developed for the Structural Funds, originally set out in detail in the MEANS collection.
19 Impact Assessment Guidelines, Annex 11. 2, p. 60-62 20 DG EMPL (2009) Guidance for assessing Social Impacts within the Commission Impact Assessment system
http://ec.europa.eu/governance/impact/key_docs/key_docs_en.htm

18
Figure 2.1 The standard EC logical framework for evaluation of Structural Funds
A key challenge in indicator-based monitoring systems such as the one used in this programme is to distinguish between outputs, results and impacts. The longer term impacts (relating to global objectives) tend to be influenced not only by the programme, but also by the socio-economic context. The programme in Mecklenburg-Vorpommern has been particularly innovative in addressing this challenge. 2. Input data – requirements, sources and challenges Input data are derived from financial tables, and organised by priority and measure. Furthermore, context and target values are set at the start of the programme activities. For example, the number of school leavers without a diploma (context) is 10% in Mecklenburg-Vorpommern at the start of the programme, whereas the target of the programme is to bring this percentage down to 6%. This needs to be achieved by a range of actions, with the aim of reaching as many schools as possible. 3. Outcome variables Proving a causal relationship (chain) between the outputs (e.g. Number of unemployed in vocational training) or direct results of the programme (e.g. Number of those trained brought back into the labour market) and the larger socio-economic evolution of the area is exceptionally difficult. The Mecklenburg-Vorpommern ESF Operational Programme makes an attempt to link results and impacts through addressing the coverage rate for each priority. The greater the extent to which a targeted population is covered by a particular set of activities, the easier it will be to establish a causal link between the results of these activities and their impact on more general socio-economic trends. For example, Priority 2 of the Mecklenburg-Vorpommern Operational Programme aims at supporting schools throughout the Land to improve their social activities and the quality of their management. Almost 100 % of

19
Mecklenburg-Vorpommern's schools are covered, which undeniably raises the chances that change in this sector can be attributed to the ESF programme. In contrast, the coverage rate is much lower in other sectors, such as advisory services for SMEs, where only 0.4 of the Land's SMEs benefit from the programme. Below a certain threshold of coverage, causal chains between results and wider impacts can no longer be established. Clearly, addressing the coverage rate for each priority is only one of possible ways forward in linking results and impacts. Other elements to be considered are other interventions targeting the same population and assessing exogenous (contextual) factors that can be of influence to the attendance rate. 4. Strengths and limitations The key advantages of causal chain analysis in the use of Structural Funds are the ease of use and its structuring role: it adds rigour to the development of Operational Programmes, but also to its implementation, monitoring and evaluation. An additional strength of causal chain analysis is its ability to check the appropriateness of other, more advanced, methods – notably model-based approaches. A key limitation of this analysis – especially for evaluation and impact purposes – lies in the fact that links between results and impacts are very difficult to establish, especially in the case of complex programmes, where the ability to attribute impacts to individual components/measures becomes problematic. The more complex the programme, the more difficult the assessment becomes. A further limitation lies in the complexity of distinguishing gross and net effects, as well as dead weights. Double counting is a major risk. 5. Links to other methods Causal chain models can be a good basic method for structuring Structural Funds programmes or similar interventions, both in their development and in their implementation, monitoring and (ex ante and ex post) evaluation. They can act as a filter for the appropriateness of other, more advanced, methods – notably model-based approaches. 6. Relevant references • EC Structural Funds (1999) "MEANS Collection", Vol. 3, Principal evaluation
techniques and tools, p. 139 • Europäischer Sozialfonds (25/6/2007) Operationelles Programm des Landes
Mecklenburg-Vorpommern im Ziel Konvergenz. • A. Martini (2008) "How Counterfactual Analysis got lost on the way to Brussels;
paper prepared for the Symposium "Policy and programme evaluation in Europe: cultures and prospects", Strasbourg, 3-4 July 2008
2.2.3 Method example II: Trade Sustainability Impact Assessment
1. Background, theoretical basis and key design features Trade Sustainability Impact Assessments (TSIAs) are increasingly used by EU Member States and international organisations as part of proposals for trade liberalisation.

20
Although, in an EU context, TSIAs are implemented according to a specific set of guidelines, there are clear overlaps with other impact assessments. Within the trade field, causal chain analysis is frequently used to identify the cause-effect links between proposed alterations to trade rules and agreements and their potential economic, social and environmental impacts. For example, a change in tariff levels will directly alter the pattern of prices for producers and consumers. Similarly, a rule change in competition policy alters the market conditions for producers and consumers, although the impact on prices will be indirect.
Figure 2.2 Framework for Trade Sustainability Impact Assessment
2. Input data – requirements, sources and challenges In TSIAs, the specific inputs are the trade measures and the pre-existing economic, social, environmental, and legal framework. These are commonly translated into initial economic impacts, commonly by using economic trade models, based on CGE. This results in global data about employment, GDP, exports, imports, etc. 3. Outcome variables Causal chain analysis is then used for exploring the social, economic and environmental consequences of proposed changes. 4. Strengths and limitations A strength of the approach to causal chain analysis used in the context of Trade Sustainability Impact Assessments is that it allows stakeholders to be involved in the generation of possible impacts. Typically, an initial version of assumed causal relationships and impacts is prepared by those leading the TSIA and then discussed in consultation meetings with relevant stakeholders. This provides an opportunity to validate (or not) initial assumptions, as well as identify additional impacts and causal relations, which the TSIA team may not have identified. Another strength of the method is that it allows economic, social and environmental impacts to be assessed in conjunction

21
with each other, as the causal chain and consultation process can include all types of possible impact. A clear limitation of this method is that it does not lead to any quantification of the impacts and it is also limited in dealing with conditionality ("only if" questions) and thresholds. For instance, when is a negative health effect resulting from an increase in mining activities in the Ukraine significant, and how does this relate to quality of work effects? 5. Links to other methods In the area of trade sustainability impact assessments, causal chain analysis is often used as a qualitative elaboration of direct economic, quantified effect that are generated by trade (CGE) models. 6. Relevant references • Belausteguigoitia, Juan Carlos; Causal chain analysis and root causes: the GIWA
approach, Royal Swedish Academy of Sciences 2004, Ambio Vol. 33 No. 1-2, Feb. 2004.
• Handbook for Trade SIA, European Commission, External Trade, March 2006 • Zinke Environment Consulting and M. Popovici (1999b); Transboundary Analysis -
Causal Chain Analysis for the Middle and Lower Danube Basin Countries. Entire report available at the Secretariat of the International Commission for Protection of the Danube River.
• Dr. Gunilla Björklund (1997); Preparation of a Strategic Action Programme (SAP) for the Tumen River Coastal Area and related Northeast Asian Environs.
• TumenNet SAP; RAS/98/G31 – UNDP/Global Environment facility. • Marcia Marquez and William Hogland (2000); GIWA methodology testing in the
Baltic region, Report No.111 Department of Technology, University of Kalmar Sweden.
• Caribbean Large Marine Ecosystem Project21 • Development of causal chains for the priority trans-boundary issues; UNDP GEF
Dnipro Basin Environment Programme22 • SIA EU-Chile Final Report, Planistat Luxembourg
2.2.4 Applicability at EU level
The case studies illustrate that causal chain analysis can be a useful basic method for mapping the likely impacts of different policy options. The first step is to identify the potential direct effects of the policy option proposed and the groups affected. These direct impacts can be mapped in graphical form in a causal chain. This can then form the basis for considering the potential indirect effects of the policy and the groups affected by these secondary effects.
21 http://cavehill.uwi.edu/cermes/clme_eng.html 22 http://www.dnipro-gef.net/first_stage/project-reports/transboundary-diagnostic-analysis-1/transboundary-diagnostic-
analysis-of-the-dnipro-river-basin/dnipro-basin-tda-methodology/development-of-causal-chains-for-the-priority-transboundary-issues/view?set_language=en

22
Causal chains can be refined on the basis of consultation exercises with relevant stakeholders (notably representatives of the groups affected by the policy). Such consultation can also be a helpful means to reach agreement on which of the direct and indirect impacts are the most important. However, when using causal chain analysis at high aggregate levels of analysis, it should be kept in mind that the method was originally designed for assessing project-level interventions. In more sophisticated (EU) policy environments, causal chain models can become elaborate and complex. In these cases, one cannot always expect a black and white answer to the question of whether redistributive/regional employment effects are significant or not. However, this should not be seen as a deterrent for applying causal chain analysis as an initial analytical tool for structuring further work in a wide range of Impact Assessment exercises.
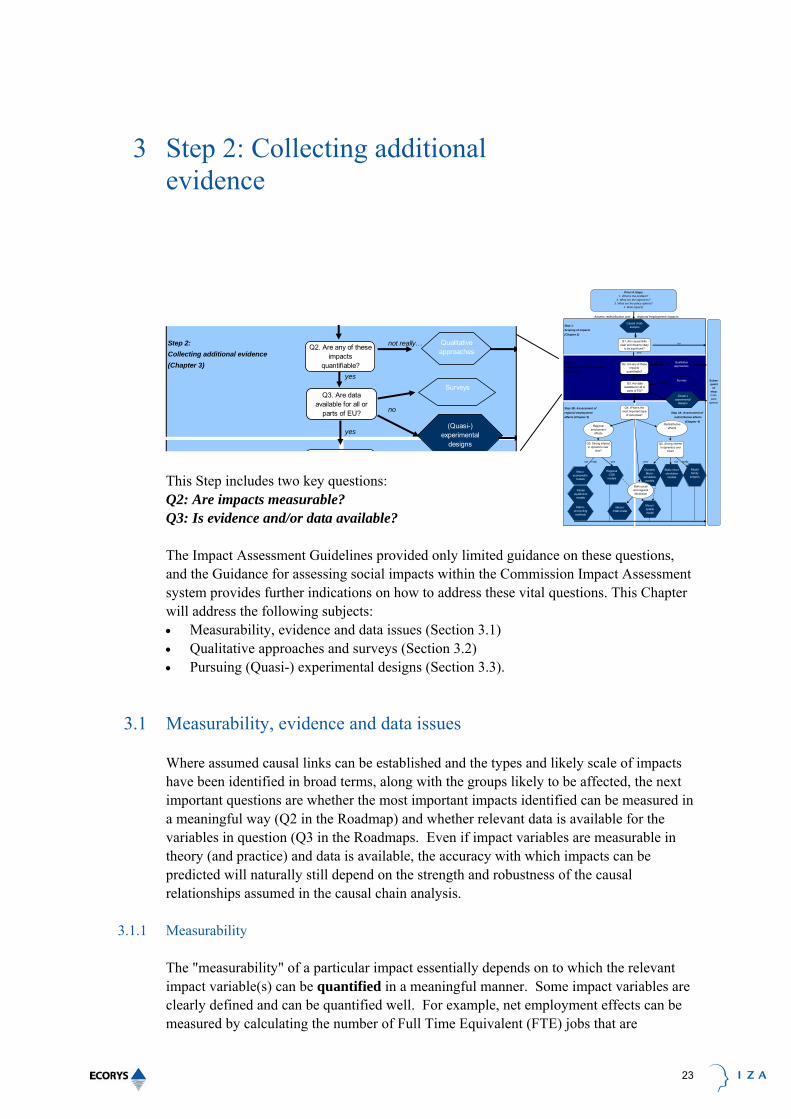
23
3 Step 2: Collecting additional evidence
Step 2: not really…Collecting additional evidence (Chapter 3)
yes
no
yes
Q3. Are data available for all or
parts of EU?
(Quasi-) experimental
designs
Q2. Are any of these impacts
quantifiable?
Qualitative approaches
Surveys
This Step includes two key questions: Q2: Are impacts measurable? Q3: Is evidence and/or data available? The Impact Assessment Guidelines provided only limited guidance on these questions, and the Guidance for assessing social impacts within the Commission Impact Assessment system provides further indications on how to address these vital questions. This Chapter will address the following subjects: • Measurability, evidence and data issues (Section 3.1) • Qualitative approaches and surveys (Section 3.2) • Pursuing (Quasi-) experimental designs (Section 3.3).
3.1 Measurability, evidence and data issues
Where assumed causal links can be established and the types and likely scale of impacts have been identified in broad terms, along with the groups likely to be affected, the next important questions are whether the most important impacts identified can be measured in a meaningful way (Q2 in the Roadmap) and whether relevant data is available for the variables in question (Q3 in the Roadmaps. Even if impact variables are measurable in theory (and practice) and data is available, the accuracy with which impacts can be predicted will naturally still depend on the strength and robustness of the causal relationships assumed in the causal chain analysis.
3.1.1 Measurability
The "measurability" of a particular impact essentially depends on to which the relevant impact variable(s) can be quantified in a meaningful manner. Some impact variables are clearly defined and can be quantified well. For example, net employment effects can be measured by calculating the number of Full Time Equivalent (FTE) jobs that are
Assess redistributive and regional employment impacts
Step 1: Scoping of impacts(Chapter 2)
no yes
Step 2: not really…Collecting additional evidence (Chapter 3)
yes
no
yes
Step 3B: Assessment of regional employment Step 3A: Assessment of effects (Chapter 5) redistributive effects (Chapter 4)
not really yes yes! not really
Causal chain analysis
Regional employment
effects
Redistributive effects
Model family
analysis
Q1. Are causal links clear and impacts likely
to be significant?
Q4. What is the most important type
of outcomes?
Prior IA Steps1. What is the problem?
2. What are the objectives?3. What are the policy options?
4. Main impacts
Subse-quent
IA step: Com-pare
options
Q3. Are data available for all or
parts of EU?
(Quasi-) experimental
designs
Regional CGE
models
Maco-econometric
models
Dynamic Micro-
simulation models
Static microsimulation
models
Micro-/ spatial model
Micro-/CGE model
Q5. Strong interest in dynamics over
time?
Q5. Strong interest in dynamics over
time?
Both social and regional dimension
Q2. Are any of these impacts
quantifiable?
Qualitative approaches
Surveys
Partial equilibrium
models
Macro-accounting methods

24
predicted to exist at a certain point in time, once assumed job losses and job creation resulting from a policy intervention are taken into account. Other types of impact are more complex both to define and to quantify, or cannot be quantified at all in a meaningful manner. For example, the phenomenon of "social inclusion" (or, more frequently, "exclusion"), one of the key dimensions of social impact to be explored in IA, can be interpreted (defined) in different ways and is unquestionably multi-dimensional23. While household income can be measured (to produce an indicator of relative poverty), other factors that can affect inclusion and exclusion (social relations, access to services etc) are very difficult, if not impossible, to quantify at all. As such, "proxy" indicators (such as relative poverty) frequently have to be used to cover different aspects of social exclusion. In general terms, in the social sphere, employment and income are the most easily quantified variables. This is one of the reasons why the Guidance for assessing social impacts argues that quantitative models (such as those reviewed in later sections of this report) should be used when major impacts in these fields are expected from proposed policy initiatives. Differences in the scale and nature of changes in employment and income between social groups (redistributive effects) and geographical units (such as difference in regional employment effects) can potentially be used as an input for assessing the overall effects of more complex issues, such as equality of opportunity and social inclusion. However, in such cases, the results of quantitative modelling will need to be combined with additional evidence from qualitative studies. When the main impact variables identified for a proposed policy initiative are not quantifiable, qualitative approaches are the only option.
3.1.2 Data availability
Even when impact variables are in principle quantifiable – in other words, when meaningful indicators can be developed to measure them – empirical real-world data is still required. The availability of such data will clearly depend on whether anyone has made the effort to collect them. The main issues in relation to data availability are: • Whether or not data are collected at all. This is the difference between defining a
theoretically meaningful indicator and actually collecting the empirical data to "fill" it. Clearly, statistical offices and the wider research community in Europe collect data for a very wide range of indicators, so this is frequently a more academic point;
• Whether or not datasets are consistent and comparable. A key issue for using data collected in different jurisdictions (as is generally required at EU level), is whether or not indicators are defined in a consistent manner and data collected according to comparable methods. Given the reliance of surveys (of households or businesses, for example) for a large proportion of official and research data, consistent design of surveys is frequently as important as the consistent definition of indicators. It is frequently impossible to harmonise data which have been defined and collected in
23 For example, the UK government uses the following definition "Social exclusion is a complex and multi-dimensional
process. It involves the lack or denial of resources, rights, goods and services, and the inability to participate in the normal relationships and activities, available to the majority of people in a society, whether in economic, social, cultural or political arenas. It affects both the quality of life of individuals and the equity and cohesion of society as a whole". Cabinet Office based on Levitas et al. (2006) Poverty and Social Exclusion in Britain: The Millennium Survey (ed. with Christina Pantazis and Dave Gordon) Policy Press 2006
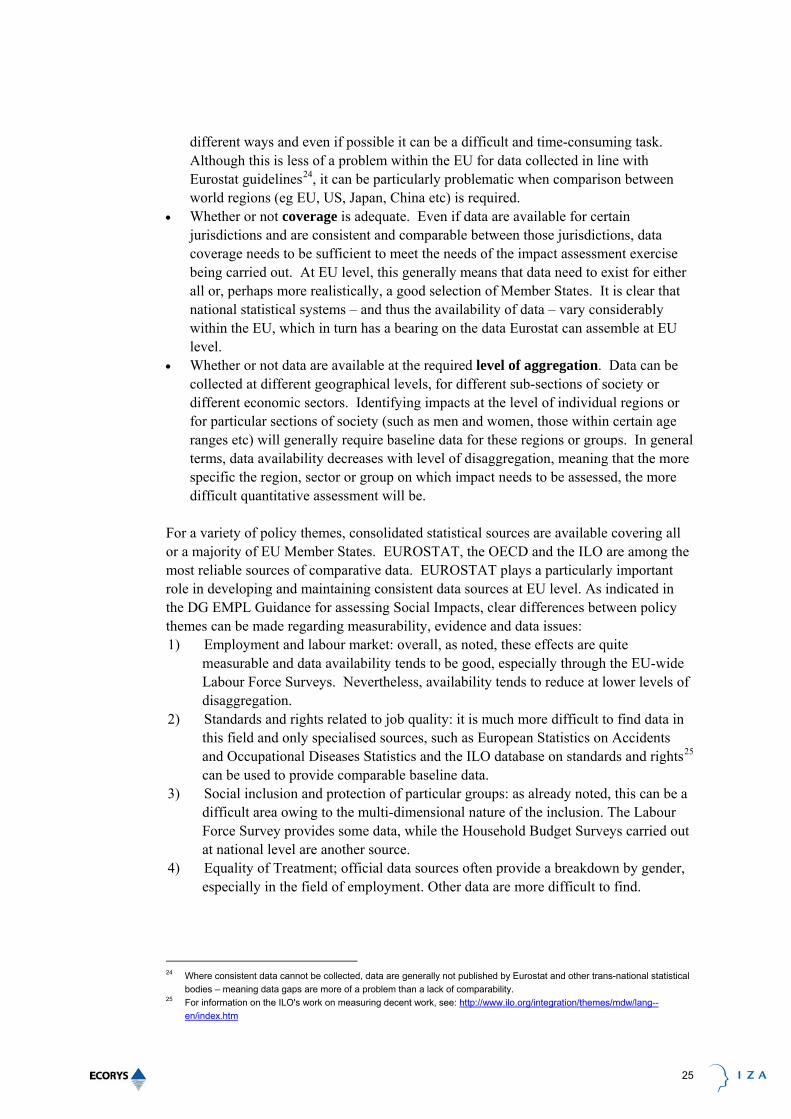
25
different ways and even if possible it can be a difficult and time-consuming task. Although this is less of a problem within the EU for data collected in line with Eurostat guidelines24, it can be particularly problematic when comparison between world regions (eg EU, US, Japan, China etc) is required.
• Whether or not coverage is adequate. Even if data are available for certain jurisdictions and are consistent and comparable between those jurisdictions, data coverage needs to be sufficient to meet the needs of the impact assessment exercise being carried out. At EU level, this generally means that data need to exist for either all or, perhaps more realistically, a good selection of Member States. It is clear that national statistical systems – and thus the availability of data – vary considerably within the EU, which in turn has a bearing on the data Eurostat can assemble at EU level.
• Whether or not data are available at the required level of aggregation. Data can be collected at different geographical levels, for different sub-sections of society or different economic sectors. Identifying impacts at the level of individual regions or for particular sections of society (such as men and women, those within certain age ranges etc) will generally require baseline data for these regions or groups. In general terms, data availability decreases with level of disaggregation, meaning that the more specific the region, sector or group on which impact needs to be assessed, the more difficult quantitative assessment will be.
For a variety of policy themes, consolidated statistical sources are available covering all or a majority of EU Member States. EUROSTAT, the OECD and the ILO are among the most reliable sources of comparative data. EUROSTAT plays a particularly important role in developing and maintaining consistent data sources at EU level. As indicated in the DG EMPL Guidance for assessing Social Impacts, clear differences between policy themes can be made regarding measurability, evidence and data issues: 1) Employment and labour market: overall, as noted, these effects are quite
measurable and data availability tends to be good, especially through the EU-wide Labour Force Surveys. Nevertheless, availability tends to reduce at lower levels of disaggregation.
2) Standards and rights related to job quality: it is much more difficult to find data in this field and only specialised sources, such as European Statistics on Accidents and Occupational Diseases Statistics and the ILO database on standards and rights25 can be used to provide comparable baseline data.
3) Social inclusion and protection of particular groups: as already noted, this can be a difficult area owing to the multi-dimensional nature of the inclusion. The Labour Force Survey provides some data, while the Household Budget Surveys carried out at national level are another source.
4) Equality of Treatment; official data sources often provide a breakdown by gender, especially in the field of employment. Other data are more difficult to find.
24 Where consistent data cannot be collected, data are generally not published by Eurostat and other trans-national statistical
bodies – meaning data gaps are more of a problem than a lack of comparability. 25 For information on the ILO's work on measuring decent work, see: http://www.ilo.org/integration/themes/mdw/lang--
en/index.htm
26
5) Access to and effects on social protection, health, social security and educational systems: health data, social security information and educational attainment are commonly available from Eurostat, other aspects are more difficult.
6) Public health and safety: in addition to Eurostat, DG SANCO provides a Health Systems Impact Tool26.
Obtaining consistent data across the whole EU-27 is frequently impossible, sometimes even for basic indicators. In order to address this difficulty, an increasingly common approach is to study a number of Member States which can be viewed as 'typical' for a particular institutional arrangement27. For instance in labour market research, a common distinction is made between more and less protected labour markets, crossed with active or less active labour market policies – which brings about four labour market models. Such "case study" approaches can reduce the workload for Impact Assessment exercises, but naturally rely on the availability of relevant data in Member States or regions with the characteristics established by the selection typology. The case study approach can be used to address the challenge of limited data availability at lower levels of aggregation, if such data are available in some Member States. However, estimating impacts on smaller societal groups or on smaller geographical entities can generally only be based on qualitative estimations. In general terms, in the absence of reliable quantitative data at the required levels of disaggregation, those responsible for assessing impacts have two options: • To use qualitative assessments, perhaps based on the findings of previous empirical
studies or policy evaluations or; • To collect new quantitative data through specially-commissioned surveys.
3.2 Qualitative approaches and surveys
For those undertaking Impact Assessments, there can be considerable pressure to quantify impacts. However, as we have discussed, our ability to produce reliable quantitative estimations of the likely impact of proposed policy initiatives is heavily conditioned by a) the inherent "measurability" of the impact variables in question and b) the availability of data to map the baseline situation against which to model potential changes. If it can be demonstrated that meaningful indicators and data are not available for predicted impacts, qualitative approaches are not only justified, but the only available options. By "qualitative approaches", we effectively mean collecting and using a range of evidence which is not purely numerical. Qualitative methods investigate the "why" and "how" of probable changes, not just "what", "where", "when" and require smaller, but more focused samples than in the case of quantitative approaches. Qualitative evidence
26 http://ec.europa.eu/health/ph_overview/co_operation/high_level/index_en.htm 27 The selection of "typical" Member States will depend on the issue being addressed. The existing national policy context in
which EU initiative will have to be implemented (as in the labour market example given) is one important dimension to take into account. In addition, it is important to ensure sufficient geographical balance, including Member States from different parts of the EU (a typical distinction is between Nordic Countries, North West Europe, Southern Europe, Central and Eastern Europe).

27
provides a vital input for quantitative approaches, as the assumptions used to predict changes to particular variables over time as a result of policy initiatives (i.e. the "why" and "how") will inevitably be based, at least in part, on the findings of qualitative work. Key evidence sources include previous studies and policy evaluations, interviews, focus groups and case studies. Such approaches can provide a robust evidence base, provided sufficient triangulation takes place between sources of evidence and opinion (about the nature and scale of likely impacts, for example). Surveys can be used to collect both qualitative and quantitative data. Provided the number of respondents is sufficiently large and sufficiently representative, responses to surveys (either seek objective information or the subjective judgements of respondents) can generate new data sets which can be used in Impact Assessment exercises. This said, such data collect requires considerable preparation in order to develop appropriate questionnaires and identify and contact the desired target group of respondents. The precise objectives of surveys (including what is feasible in the timescale available) need to be established in advance, before taking the decision to embark on such primary data collection within an Impact Assessment exercise.
3.3 (Quasi-)experimental approaches: a realistic option?
Experimental or quasi-experimental research approaches, whereby policy options are effectively "tested" on specific groups or geographical areas are another form of primary data collection that can be used to assess the impact of new policies. As the name suggests, experimental approaches effectively involve running a policy experiment and observing (measuring) the outcomes among a treatment group and a control group, not subject to the policy. The policy experiment allows the impact of the intervention in question to be monitored and measured in real time, meaning such approaches can be seen to combine both data collection (step 2 in the roadmap) and assessment of impact (step 3). Such approaches have received considerable attention in recent years, including at EU level, but can be resource intensive and potentially difficult to implement. Experimental and quasi-experimental approaches are inherently "ex-post", in that the difference between the treatment and control groups is measured after the policy (treatment) has been applied28. Nevertheless, the testing of future EU policy initiatives through closely monitored "pilots" is an option that deserves further exploration – hence our decision to include this section in this report.
3.3.1 What are "experimental" and "quasi-experimental" designs?
In a policy-making context, both "experimental" and "quasi-experimental" research designs seek to identify the impact of given policy interventions by comparing outcomes among a groups of direct participants in the intervention (the treatment group) with outcomes observed in a group of non-participants (the control or comparison group). "Experimental" designs are distinguished from "quasi-experimental" designs by the random assignment of individuals or entities to the treatment and control groups, which can ensure that the two cohorts are statistically identical. In contrast, quasi-experimental 28 For this reason, building quasi-experimental data collection methods into policy implementation is seen as a promising
means to improve the quality of ex-post evaluations more generally – for example for the EU Structural Funds.
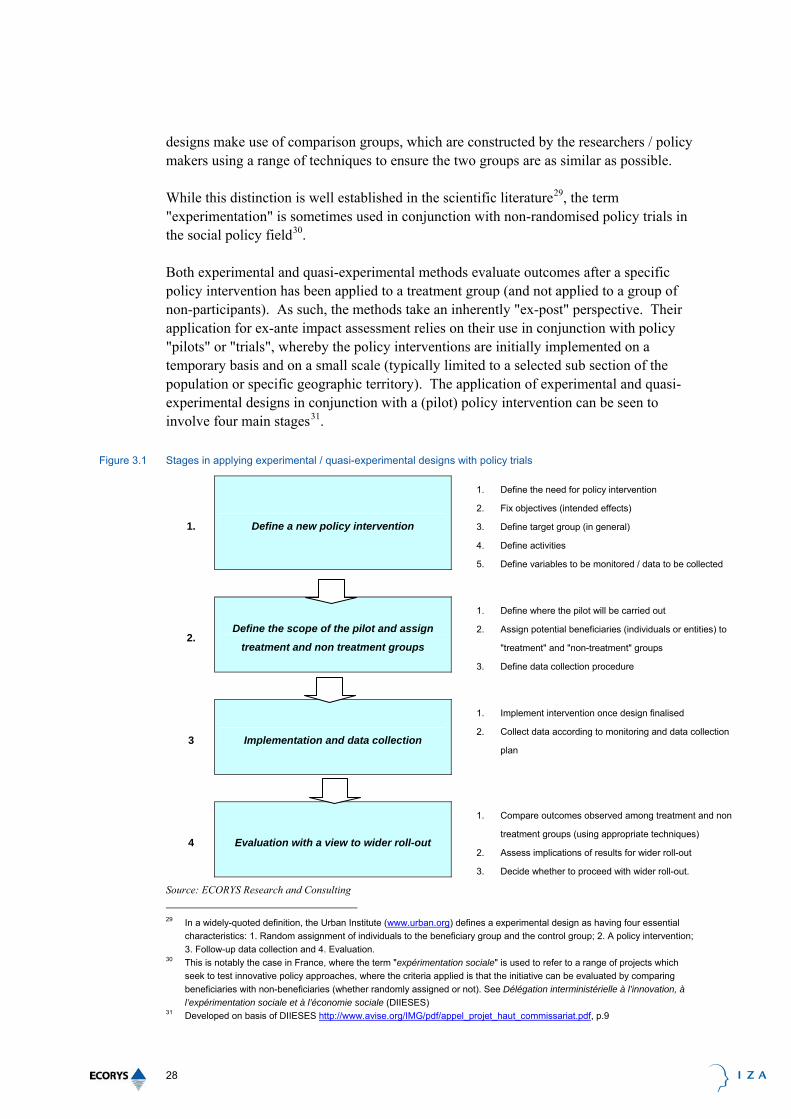
28
designs make use of comparison groups, which are constructed by the researchers / policy makers using a range of techniques to ensure the two groups are as similar as possible. While this distinction is well established in the scientific literature29, the term "experimentation" is sometimes used in conjunction with non-randomised policy trials in the social policy field30. Both experimental and quasi-experimental methods evaluate outcomes after a specific policy intervention has been applied to a treatment group (and not applied to a group of non-participants). As such, the methods take an inherently "ex-post" perspective. Their application for ex-ante impact assessment relies on their use in conjunction with policy "pilots" or "trials", whereby the policy interventions are initially implemented on a temporary basis and on a small scale (typically limited to a selected sub section of the population or specific geographic territory). The application of experimental and quasi-experimental designs in conjunction with a (pilot) policy intervention can be seen to involve four main stages31.
Figure 3.1 Stages in applying experimental / quasi-experimental designs with policy trials
1. Define a new policy intervention
1. Define the need for policy intervention
2. Fix objectives (intended effects)
3. Define target group (in general)
4. Define activities
5. Define variables to be monitored / data to be collected
2. Define the scope of the pilot and assign
treatment and non treatment groups
1. Define where the pilot will be carried out
2. Assign potential beneficiaries (individuals or entities) to
"treatment" and "non-treatment" groups
3. Define data collection procedure
3 Implementation and data collection
1. Implement intervention once design finalised
2. Collect data according to monitoring and data collection
plan
4 Evaluation with a view to wider roll-out
1. Compare outcomes observed among treatment and non
treatment groups (using appropriate techniques)
2. Assess implications of results for wider roll-out
3. Decide whether to proceed with wider roll-out.
Source: ECORYS Research and Consulting
29 In a widely-quoted definition, the Urban Institute (www.urban.org) defines a experimental design as having four essential
characteristics: 1. Random assignment of individuals to the beneficiary group and the control group; 2. A policy intervention; 3. Follow-up data collection and 4. Evaluation.
30 This is notably the case in France, where the term "expérimentation sociale" is used to refer to a range of projects which seek to test innovative policy approaches, where the criteria applied is that the initiative can be evaluated by comparing beneficiaries with non-beneficiaries (whether randomly assigned or not). See Délégation interministérielle à l’innovation, à l’expérimentation sociale et à l’économie sociale (DIIESES)
31 Developed on basis of DIIESES http://www.avise.org/IMG/pdf/appel_projet_haut_commissariat.pdf, p.9
29
The application of experimental and quasi-experimental designs with policy pilots, to test the (potential) impact of policy interventions initially follows the standard policy-making process (also reflected in European Commission IA Guidelines) of defining the need to intervene, the objectives to be achieved and possible policy measures (options) that could be pursued to achieve the objectives (Stage 1 above). The policy piloting activity, combined with the experimental / quasi-experimental measurement activities, intervenes in stages 2 and 3, as an empirically-based alternative to expert or model-based ex-ante impact assessment. In order to design the "experiment", it is first necessary to establish a clear intervention logic for the policy in question (defining the variables on which the policy is expected to have an effect). This process will necessarily include the definition of the target beneficiaries for the intervention. On this basis, the geographical scope of the pilot phase needs to be defined (where the intervention will be tested) and then the treatment group and non treatment groups selected (these will typically be composed of individuals, but could, in principle, also be other small entities, such as small firms)32. Once the "treatment" and "non treatment" groups are defined, the detailed implementation of the pilot must be planned and necessary preparatory actions taken (such as training "implementing" staff). In parallel, the system for collecting data covering the different variables that need to be monitored to be able to evaluate the action needs to be put in place. Implementation and data collection can then proceed, taking into account that there is likely to be a start-up period before the policy trial is functioning at "cruising speed". After the defined implementation and data collection time have elapsed, the data collected from the treatment and non-treatment groups can be analysed and compared. Depending on the design of the trial and the complexity of the intervention being tested, the net impact of the intervention can then be determined with varying degrees of certainty. This overview of the basic steps in implementing experimental or quasi-experimental policy trials illustrates the comparative complexity and resource-intensity of this type of approach to impact assessment. Nevertheless, pilot policy trials in conjunction with quasi-experimental evaluation designs have been applied, with varying degrees of frequency, in a number of EU Member States33. Moreover, there is increasing interest in such methods in certain Member States and at EU level34, particularly in policy areas where causal relationships and impacts on beneficiary behaviour are poorly understood (and thus knowledge necessary to make informed judgements or construct reliable models is absent). Unlike the models examined later in this report, which require established
32 As we discuss below, the use of larger "units of analysis" poses inherent and serious problems in relation to the statistical
reliability of findings. 33 Hitherto, within the EU, quasi-experimental designs have been most widely applied in the UK, notably in the field of
employment and benefits programmes. The approach has also been applied, and is now receiving considerable attention, in France, as discussed in the case examined. However, examples of such approaches have been identified in the Netherlands and Spain and the review undertaken for this study was not exhaustive. Examples of randomised (truly experimental) designs are very infrequent, for reasons we return to below.
34 See for example, the recent call for proposals under DG EMPL's own PROGRESS programme: VP/ 2009/005 http://ec.europa.eu/social/main.jsp?catId=631&langId=en&callId=217&furtherCalls=yes

30
assumptions and existing data, experimental and quasi-experimental methods can be used to gather new data and new insights into causal relationships between policy and impact. Moreover, the basic principles of the design can be tailored to the needs of individual cases (in terms of the design of treatment and non-treatment groups, for example). To illustrate this, as well as the positive aspects and limitations of quasi-experimental approaches in an ex-ante context, we focus below on a recent and high-profile example from France – the evaluation of the new Revenu de Solidarité Active in 2008-09.
3.3.2 Method example: Quasi-experimental design in the ex-ante evaluation of the rSa in France35
1. Background, theoretical basis and key design features Plans for the introduction of the Revenu de Solidarité Active (rSa)36 were initially developed by the French government in 2007, as a means to provide a financial incentive for recipients of the country's basic income support benefit (Revenu Minimum d'Insertion - RMI) to (re-)enter employment. For RMI-recipients already in, or moving into, low-paid jobs, the new benefit was designed to complement income generated from employment, to ensure recipients took home a guaranteed minimum income. Following initial policy development, the concept was subsequently extended to cover recipients of lone parent benefit (Allocation Parent Isolé – API), with a view to simplifying the overall benefit system with a single benefit type applying to different categories of benefit recipient in employment. From the outset, the French authorities planned to test the rSa in pilot areas in order to assess its effectiveness – a process referred to in French as "expérimentation", but best translated as "testing" or "trialling"37. The trial ("treatment") areas were selected on the basis of expressions of interest from local governments responsible for administering social benefits38. 33 départements (out of the 96 in mainland France) were selected to implement the policy trial, based primarily on the willingness of local authorities to participate, but also taking into account the "representativeness" of the areas in terms of number and type of benefits recipient. Specific urban or rural areas within each département were selected for the trials by the Conseil Général in question. In contrast, the comparison areas39 were selected by a specially-convened "evaluation committee" using statistical matching techniques40. An initial list of comparison areas with comparable socio-demographic characteristics was established (based on population, number of RMI recipients, urban/rural nature etc). These were then ranked according to
35 Thanks to interviewees: Marie-Odile Simon and Augustin Vicard of the High Commission for Active Inclusion Against
Poverty 36 Literally: "Active solidarity income" 37 This possibility was included in the loi de finances 2007. Trialling or testing policies on selected sections of the population
was made possible by a constitutional amendment in March 2003, which permitted derogations from the general legal principle of equality in provision of public services and benefits.
38 Conseils Généraux – the equivalent of county / provincial councils, operating at the level of départements 39 Referred to by the evaluation committee as "control areas" (zones témoins) 40 See: Haut commissaire pour la solidarité active contre la pauvreté - Comité d'Evaluation des expérimentations (2009)
Rapport final sur l'évaluation des expérimentations rSa http://www.ladocumentationfrancaise.fr/rapports-publics/094000222/index.shtml

31
their similarity to treatment areas in relation to the likely propensity of RMI-recipients to enter employment. The latter calculation was based on information from social security databases. Finally, the selection of comparison areas for each treatment area was checked with the local authorities for the area to identify particular characteristics of the areas not picked up by the statistical analysis. The trials overall involved around 15,000 individuals at any given time. The policy trialling began in June 2007 in the first département and was rolled out until March 2008 in other départements. It is notable that the precise format of rSa implementation varied between treatment areas, with minor differences in eligibility criteria, the level of entitlement and the intensity of on the job mentoring and support provided to recipients. The trials ended in May 2009 – meaning the trial and observation period was on average 18 months. The initial results of the trials showed a positive impact from the rSa and, on this basis, the government and parliament approved the roll-out of the rSa nationally before the end of the trial period. The rSa entirely replaced the RMI in France in July 2009. 2. Input data – requirements, sources and challenges Reliable quantitative data are of vital importance for all experimental and quasi-experimental policy research at two main stages. Firstly, basic data about the individuals and entities that will make up the treatment and non-treatment groups are required in order to assign these individuals or entities to one or the other group. While the data requirements for random assignment are limited, detailed and accurate data covering a wide range of variables are theoretically required for quasi-experimental approaches, in order to apply statistical matching techniques (such as Propensity Score Matching – PSM) to construct comparison groups. Secondly, updated data are required to undertake a reliable comparison of observed outcomes among the treatment and control groups after the policy trial. This means that data on the relevant outcome variables among both treatment and non treatment groups need to be gathered on an ongoing basis during the trial phase. Procedures for this data collection need to be built into the trial design. The rSa trials were implemented to test a new form of social benefit within an existing administrative structure with established data collection procedures. In common with other systems, the French social security system collects a considerable amount of data about benefit recipients, which, in the case of rSa, meant that ready-made datasets of relevant variables41 existed to facilitate the assignment of individuals to treatment and non treatment groups. Similarly, the intrinsic design of the new and existing support mechanisms for treatment and non treatment groups required beneficiaries to report regularly on their employment status and income levels, allowing data to be collected on an ongoing basis during the trials. These administrative datasets were complemented by targeted surveys of RMI and API recipients in some zones, carried out specifically for the evaluation of the trial.
41 Administrative data from the CNAF (Caisse nationale des allocations familiales), the CCMSA (Caisse Centrale de la
Mutualité Sociale Agricole), the Conseils Généraux and the DARES (Direction de l’animation de la recherche, des études et des statistiques)

32
The first key challenge in relation to input data for quasi-experimental research designs revolves around the selection of appropriate comparison (non treatment) groups. In the rSa case, as noted, matching techniques were used and an ex-post check of the treatment and non-treatment zones concluded that, as observed trends in the different zones were on average similar, the comparison areas selected have indeed been an appropriate "counterfactual". Nevertheless, the risk of interference from unobserved factors (ie factors not appearing in the statistical dataset used to establish the groups) is considerable and, in the case of the rSa trials, the overall evolutions observed in individual treatment areas and their corresponding comparison areas over the trial period were frequently divergent42. The challenge of controlling for unobserved variables is one that plagues quasi-experimental designs. A second input data challenge faced in the rSa trials concerned the phenomenon of "attrition", widespread in social welfare evaluations, whereby beneficiaries of the trial intervention leave the intervention (cease to participate) before any impacts can be recorded – people thus move in and out of the programme all the time. A related and even more fundamental challenge is the time required to observe and measure impacts. In general, a considerable time period is required to allow the effects of a given intervention to work through. However, the political realities of policy making frequently mean that policy makers cannot wait until effects have been reliably measured before deciding whether or not to roll-out the initiative being trialled. This happened in the case of rSa. The final evaluation report notes "It would certainly have been more rigorous for the decision on the roll-out of the intervention to have been taken on the basis of the final results of the trials, rather than on the intermediate results"43. 3. Outcome variables The key outcome variables that were measured in the rSa trials were the employment status and the total income of the individuals observed. This reflected the objectives of the rSa to a) improve the rates of "returning to work" among participating RMI and API recipients and b) to support them to remain in work, once (or if) they had a job. The evaluation found that the rate of entering employment among RMI recipients in the treatment areas was on average higher than in the comparison areas, but that the difference varied considerably between individual départements. The ability of the trials to measure the (necessarily longer term) impact of the rSa on beneficiaries' propensity to remain in work, particularly after 12 months, could not be measured during the trials, owing to the time frame for their implementation. The observed outcomes among individuals in the treatment and non treatment areas were collated for the whole country to create an aggregate estimate of the impact on return to / entry into work rates. While this may have overcome difficulties in relation to the comparability of the comparison areas (the areas proved on average to be reliable, but not in each individual case), it poses undoubted methodological difficulties in the case of the rSa trials, given that the design of the intervention was not identical in all trial areas. Moreover, the fact that the "treatment" areas were effectively self-selecting (rather than chosen at random) is likely to have introduced further biases into the results of the
42 Haut commissaire pour la solidarité active contre la pauvreté - Comité d'Evaluation des expérimentations (2009), p.5 43 Ibid, p.6

33
analysis. Individual aspects of the different trial design may thus have influenced outcomes, but this would not be picked up in the aggregate figures. 4. Demand – how and why the method has been used The rSa trials were the first major application of such quasi-experimental methods in French policy making – it was thus seen as a major break with the past in terms of social policy reform. This situation, however, reflects the particularities of the French legal context, which forbade such trials until the constitutional reform of 2003. Quasi-experimental policy trials had already been undertaken in other EU Member States44 and elsewhere in the world, notably the US and Canada, where the practice is longest established45. The new French "High Commissioner for Solidarity", Martin Hirsch, appointed in 2007 has provided high level political support for use of quasi-experimental designs in the field of social policy in France. The main incentive to use such methods has been the desire to test new and innovative initiatives that seek to tackle employment and social inclusion problems, the effects of which are difficult to predict without empirical tests. The rSa trials have been part of a wider trend to increased use of quasi-experimental methods in France, supported through a specific fund and promoted through annual calls for proposals46. 5. Strengths and limitations In general, the key strength of policy trials in combination with experimental and quasi-experimental designs is their ability to test new and innovative interventions and gather new knowledge on effectiveness and causal links between intervention and effect. Such methods are thus of considerable potential value when existing levels of knowledge about likely cause and effect or effects of specific social groups are insufficient to make reliable judgements about probable impacts. The "method" consists of a set to principles, which can be applied in a tailored way to a wide variety of situations. However, some basic requirements need to be met: • The number of individuals or entities in the treatment and non treatment groups needs
to be sufficiently large to be able to draw statistically reliable conclusions – the underlying unit of analysis should be the individual, household or, perhaps, small firm (even if the final analysis is undertaken at aggregate level);
• The objectives of the intervention and the relevant outcome variables should be clear from the outset and be as simple as possible, if direct causality is to be established (otherwise there will be a "black box" approach, which tells us little about why something does or does not work);
44 Notably in the UK, but also in the Netherlands and Spain. For relevant examples from our own review of recent studies in
selected Member States include, see references below. 45 For example, the "experiments" undertaken since 1945 by the Rand Corporation, notably that on health care costs run
between November 1974 and January 1982, which showed that the healthcare expenditure of individuals is inversely correlated tot their personal financial contribution. Free for All ? Lessons from the Rand Health Insurance Experiment, 1996, Harvard University Press, Cambridge
46 The fond interministériel à l'expérimentation sociale. See http://www.travail-solidarite.gouv.fr/ministere/presentation-organigramme/02-ministre-du-travail-relations-sociales-solidarite-autorite-conjointe-avec-ministre-economie-finances-emploi/delegation-interministerielle-innovation-experimentation-sociale-economie-sociale-diieses.html

34
• There must be sufficient time to allow a trial phase – such methods can not be used if urgent action is required;
• It must be possible to collect accurate baseline data47 on the relevant outcome variables for the individuals or entities examined (the subjects of the experiment), and obtain updated observations over the period of the trial. For these reasons, such methods lend themselves to use in the field of social policy or business support, where data collection about subjects is already part of standard policy administration.
On top of the basic practical challenges, the policy trials and experimental designs are resource and time intensive (the rSa trial is estimated to have cost €300,000, excluding the time for costs of the benefits staff involved and the benefit payments themselves), the main difficulty relates to selection of the treatment and non treatment groups. The way these groups are chosen underpins all subsequent analysis and the reliability of results. The crux of the problem is that truly experimental designs, with random assignment of individuals or entities to treatment are difficult to implement on the ground for both political and practical reasons, while the quasi-experimental alternatives are plagued by methodological difficulties. From a political perspective, it may be either unethical or politically impossible to offer a "treatment" to some individuals or entities and not to others on a purely random basis. Practically, it may be easier to select particular geographical areas as treatment areas as they correspond with existing administrative and service-providing sub-divisions, even if these areas are too small to allow proper randomised selection. Both these factors are observed in the French case examined. When treatment and non treatment groups are "constructed", using statistical matching techniques, it is impossible to control for all unobserved factors and achieve a perfect match between the two groups. Unobserved factors may thus explain differences in observed outcomes and lead to biases in the ex-post analysis. This is likely to have been the case in the French case examined, the results of which are likely to have been further compromised by differences in the format of the "intervention" applied in the different trial areas. Moreover, in that case, the sample size was too small to allow analysis at the local and regional level – results could only be considered at the aggregate, national level. The methodological debate on the thresholds of reliability (sample size, selection methods etc) of quasi-experimental designs appears to remain open. 6. Links to other methods Data from trials conducted using experimental and quasi-experimental methods can be used as an input into structural micro-econometric models that rationalise the behaviour of individual programme recipients. Such data can be used to identify structural parameters such as labour supply elasticities or reservation wages, without imposing strong distributional and/or behavioural assumptions.
47 Such data needs to cover both the treatment and control / comparison group. Such data can be collected through a
specific survey of these groups at the beginning of the "experiment".

35
7. Relevant references • Haut commissaire pour la solidarité active contre la pauvreté - Comité d'Evaluation
des expérimentations (2009) Rapport final sur l'évaluation des expérimentations rSa http://www.ladocumentationfrancaise.fr/rapports-publics/094000222/index.shtml
• Greenberg, D, Walter, J and Knight, G (2009) The cost of services and incentives in the UK Employment Retention and Advancement (ERA) demonstration: Preliminary analysis, Working Paper No 64, Department for Work and Pensions
• Adam, S; Bozio, A and Emmerson, C (2009) Can we estimate the impact of the Choices package in Pathways to Work? Working Paper No 60, Department for Work and Pensions
• Selby, P (2008) Net impact evaluation of the Department for Work and Pensions Working Neighbourhoods Pilot, Working Paper No 51, Department for Work and Pensions
• Duch, N; Montolio, D and Mediavilla, M. (2007) Evaluating the impact of public subsidies on a firm's performance: A quasi-experimental approach. Working paper 2007/3, Barcelona Institute of Economics
• Evers, W; Brouwers, A and Tomic, W. (2006) A quasi-experimental study on management coaching effectiveness; Consulting Psychology Journal: Practice and Research, Vol. 58, No. 3. 2006.
• Burtless G., (1995) The Case for Randomized Field Trials in Economic and Policy Research, Journal of Economic Perspectives, vol. 9, pp. 63-84.
• Krueger A., (2001) Experimental Estimates of Education Production Functions, The Quarterly Journal of Economics, 2001, vol. 114, p. 497-532.
3.3.3 Applicability at EU level
From a theoretical perspective, the flexibility and adaptability of experimental and quasi-experimental approaches means that it would certainly be possible to develop policy trails using these techniques at EU level. In an EU policy-making context, trials could be applied in the context of direct funding programmes (such as the European Social Fund), to test the impact of different approaches, while the results of national or regional studies using these techniques could certainly feed in the Open Method of Coordination (it is clear in the case of the French rSa, that lessons were already drawn from the experience of the UK with a similar measure). Trials of particular initiatives at national or regional level can also be a source of evidence for EU level Impact Assessment exercises, which may, for example, consider the effects of rolling out similar initiatives EU-wide. This said, any such "extrapolation" of potential impacts across the EU must take into account differences in national institutional and economic contexts, which may influence the likely effects of particular initiatives. "Meta-studies", comparing the results of previous policy trials in a given field of intervention could provide valuable evidence to EU-level Impact Assessments. Evidence about the applicability of such techniques for regulatory approaches and "softer" measures such as awareness raising scheme is less clear. In particular, it is more difficult to apply regulatory measures (which provide a framework in which individuals and entities operate) to a randomly or non-randomly-selected group of entities or individuals, while excluding another set from the regulation. It could theoretically be possible to test a regulatory initiatives of a sub section of the population (for example,
36
application of stricter energy efficiency rules for buildings (the regulatory aspect), perhaps combined with enhances subsidies for energy efficiency measures). However, this study has not found examples of such approaches being applied in practice. The use of experimental and quasi-experimental designs for ex-ante analysis is already receiving increased attention at the EU level. A conference on "Social experiments in Europe" was held in Grenoble in November 2008 under the French presidency, focusing on ways of generalising use of experimental or quasi-experimental approaches in Europe. In a related development, the European Commission has published a call for proposals48 in the context of the PROGRESS programme with the objective of to developing and evaluating innovative social policies in key areas of the European strategy for social protection and social inclusion. Despite these developments, a core challenge remains to explore the extent to which randomised approaches, which offer the highest level of methodological reliability, can be used in practice and / or to agree on acceptable standards for the use of quasi-experimental methods. Such standards would indicate minimum methodological criteria to be met by quasi-experimental designs for results to be taken into account for impact assessment.
48 Call for Proposals VP/2009/005 Transnational Actions on Social Experimentation
http://ec.europa.eu/social/main.jsp?catId=630&langId=en&callId=217&furtherCalls=yes
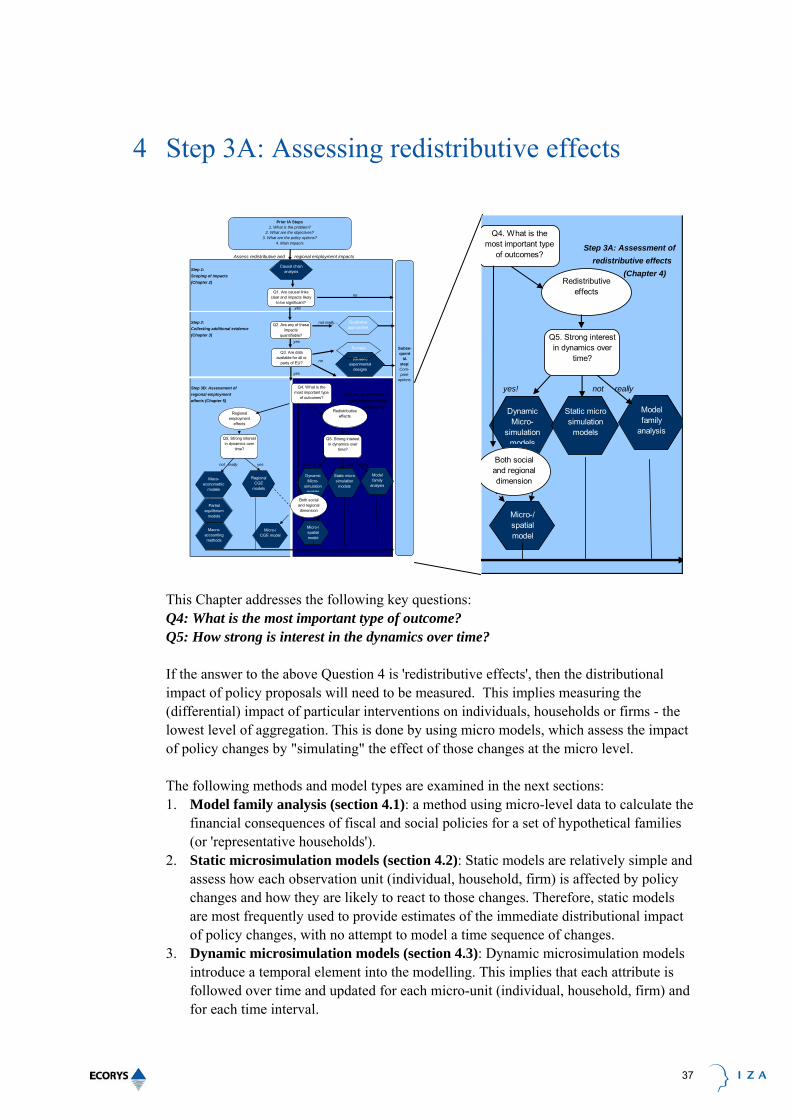
37
4 Step 3A: Assessing redistributive effects
This Chapter addresses the following key questions: Q4: What is the most important type of outcome? Q5: How strong is interest in the dynamics over time? If the answer to the above Question 4 is 'redistributive effects', then the distributional impact of policy proposals will need to be measured. This implies measuring the (differential) impact of particular interventions on individuals, households or firms - the lowest level of aggregation. This is done by using micro models, which assess the impact of policy changes by "simulating" the effect of those changes at the micro level. The following methods and model types are examined in the next sections: 1. Model family analysis (section 4.1): a method using micro-level data to calculate the
financial consequences of fiscal and social policies for a set of hypothetical families (or 'representative households').
2. Static microsimulation models (section 4.2): Static models are relatively simple and assess how each observation unit (individual, household, firm) is affected by policy changes and how they are likely to react to those changes. Therefore, static models are most frequently used to provide estimates of the immediate distributional impact of policy changes, with no attempt to model a time sequence of changes.
3. Dynamic microsimulation models (section 4.3): Dynamic microsimulation models introduce a temporal element into the modelling. This implies that each attribute is followed over time and updated for each micro-unit (individual, household, firm) and for each time interval.
Assess redistributive and regional employment impacts
Step 1: Scoping of impacts(Chapter 2)
no yes
Step 2: not really…Collecting additional evidence (Chapter 3)
yes
no
yes
Step 3B: Assessment of regional employment Step 3A: Assessment of effects (Chapter 5) redistributive effects (Chapter 4)
not really yes yes! not really
Causal chain analysis
Regional employment
effects
Redistributive effects
Model family
analysis
Q1. Are causal links clear and impacts likely
to be significant?
Q4. What is the most important type
of outcomes?
Prior IA Steps1. What is the problem?
2. What are the objectives?3. What are the policy options?
4. Main impacts
Subse-quent
IA step: Com-pare
options
Q3. Are data available for all or
parts of EU? (Quasi-)
experimental designs
Regional CGE
models
Maco-econometric
models
Dynamic Micro-
simulation models
Static microsimulation
models
Micro-/ spatial model
Micro-/CGE model
Q5. Strong interest in dynamics over
time?
Q5. Strong interest in dynamics over
time?
Both social and regional dimension
Q2. Are any of these impacts
quantifiable?
Qualitative approaches
Surveys
Partial equilibrium
models
Macro-accounting methods
Step 3A: Assessment of redistributive effects (Chapter 4)
yes! not really
Redistributive effects
Model family
analysis
Q4. What is the most important type
of outcomes?
Dynamic Micro-
simulation models
Static microsimulation
models
Micro-/ spatial model
Q5. Strong interest in dynamics over
time?
Both social and regional dimension

38
4. Microsimulation models combined with CGE models (section 4.4): As a third stage in the development of microsimulation, a combination has been made between macro models, such as Computable General Equilibrium (CGE) models, and microsimulation models. This allows the assessment of the employment and social impacts of policy proposals that impact on the aggregate supply and demand side.
5. Microsimulation models with spatial analysis (section 4.5): Spatial models allow the analysis of regional or local dimensions to impacts and the extent to which they are affected differently by policies.
4.1 Model family analysis
4.1.1 What is "Model family" analysis?
Model family analysis is an approach that centres on the calculation of the financial consequences of changes in fiscal and social policies for a set of hypothetical families. The calculations allow one to see the effect of policy variations and the effects of changes in household circumstances49. The technique starts by defining a set of different households that differ with respect to particular characteristics, such as age, marital status, labour market situation, income situation, housing situation and so on. For each household type, net disposable income can then be calculated, taking into account the current state of a given tax-benefit system. On this basis, the impact of changes in the tax-benefit system on the household's disposable income can be calculated. Furthermore, the analysis can be made almost 'continuous' in relation to some variables. Instead of undertaking a simulation based on one or a few wage or benefit levels, it is possible to simulate a wide range of levels (gradually going from zero to two or three times the median level, for instance). Graphical analysis of the outcome of such a simulation exercise can be very powerful (see graphs produced by the OECD in 'Pensions at a glance'50 and 'Benefits and wages'). A key strength of the approach is that model family analysis can assess jointly different elements of policy. Many policies / arrangements have an impact on the disposable income of households. Model family analysis allows one to explore the final impact of a proposed policy decision on household income, taking into account the interaction with different policies / benefit or taxation rules. This is especially useful in view of the fact that decision making is all too often fragmented: decisions in one area can often have important impacts on other areas. Another advantage is that the focus on the family level allows the identification of details important to specific population groups and individuals that can be erased at the aggregate level. This gives model family analysis an advantage compared to general population averages produced by using macro models, which tell us very little about impacts on specific vulnerable groups (winners and losers). Model family
49 Luxemburg Presidency (2005) " Taking forward the EU Social Inclusion Process", independent report prepared by A.B.
Typical applications of model family analysis include the effects of taxation and social security on net incomes. For instance a recent OECD report 49 uses this methods for estimating the role of unemployment benefits on the incentives to work. Other applications, also from the OECD, include the evaluation of pension schemes across countries.
49 Atkinson, B. Cantillon, E. Marlier and B. Nolan., p. 86 and further. 50 OECD(2009), Pensions at a Glance 2009: Retirement-Income Systems in OECD Countries
(www.oecd.org/els/social/pensions/PAG)

39
analysis can also facilitate the policy debate because it makes the impact of a decision concrete and relatively easy to grasp for a larger audience / stakeholders. A second strength of the approach, in comparison to the models examined in the next chapter, is that time and budgetary requirements are relatively limited. In comparison with micro-simulation models, distributional aspects of policy proposals can only be taken into account in a limited way. The assumptions made about the hypothetical individual or household necessarily limit the number of possible situations that can be taken into account. Another limitation of the approach is the need to make a large number of assumptions for the selection of family types. A policy bias in the development of these family types has to be prevented, as it can lead to skewed results. Finally, comparability between Member States will also depend on the representativeness of the underlying theoretical case. For instance, in the case of long term calculations, such as prospective pension replacement rate calculations, the performance of indicators will depend directly on assumed economic development. However, economic performance will in reality differ between Member States and this may lead to biased outcomes regarding differences in replacement rates. Therefore, it is important to take into account information about both the general context and the representativeness of the theoretical cases in the interpretation of the results. The problem that a particular family type may not necessarily be representative across countries can be addressed through the development of an extended set of typical cases that is used in a sensitivity analysis.
4.1.2 Method example I: Tax-benefit calculations
Typical applications of model family analysis include estimating of the effects of taxation and social security on net incomes. Examples include "making work pay" indicators, such as "unemployment trap", "inactivity trap" (especially in the case of second earners) and the "low-wage trap" that are published on the EUROSTAT website for all EU Member States. Additional indicators of this type include the net income of social assistance recipients as a percentage of the "at risk of poverty" threshold for three jobless household types. The OECD has also developed a synthetic measure of the generosity of benefits relative to net earnings (simple average of replacement rates for two earnings levels and four family types). See: Benefits and Wages 2007, page 99. Tax benefit calculation is also applied in the context of the EU social inclusion process. Using a set of representative households, the financial consequences of fiscal and social policies are calculated. The calculations allow one to see the effect of policy variations; they allow one to examine the effects of changes in household circumstances. By calculating net disposable incomes and by comparing them to income poverty lines, minimum and average wages, model families results can give a clear indication of the level of (minimum) income protection, and also the financial incentive to take up work associated with a package of fiscal and social measures. Therefore, they are related to the main objectives of social protection: minimum income protection, maintenance of the

40
acquired standard of living and promoting social participation, in particular labour market participation. A set of common indicators is derived and is available using recent data51. Finally, Bradshaw and Finch (2002) construct a ranking of child care benefits in 22 countries based on an overall comparison of the level of the child benefit package. This ranking takes into account the variation in the child benefit package by family type, number of children, level of earnings and whether the comparison is made before or after housing costs, and the costs and benefits of services. Next they analysed what caused the variation in the rankings. They look at a number of structural and regulatory features, such as fertility rates, the level of the wealth of a nation, the character of the labour market, the level of earnings as well as the level of social expenditure and especially the share of its social expenditure going to families. A limitation of the approach is that it explores the impacts of changes in tax-benefit rules in theory - ignoring the possibility that the rules may not be implemented adequately (e.g. the problem of non take up of benefits). Taner and Hendrix (2006) use model families analysis to show marginal and average tax rates for different types of households in The Netherlands. In their study they analyse whether a decrease of the marginal tax rate also leads to increased labour participation. However they emphasize that depending on the specific household situation financial and non-financial factors will have a greater impact on behaviour. The method can also be used to examine impacts on basic household needs, including housing, energy and mobility. An important advantage of its simplicity is that model family analysis can be quickly applied, and become an integral part of policy preparation. Interesting work seems to have been done in France on the Contribution climat énergie. Here the impact of a new proposed tax is calculated for different specific family types depending on whether they live in city/suburbs/countryside. • Luxemburg Presidency (2005) " Taking forward the EU Social Inclusion Process",
independent report prepared by A.B. Atkinson, B. Cantillon, E. Marlier and B. Nolan., p. 86 and further.
• Bradshaw, J., Ditch, J., Holmes, H., Whiteford, P. (1993), Support for children: A comparison of arrangements in fifteen countries. UK Department of Social Security, Research Report 21, London.
• Bradshaw, J. and N. Finch (2002), A comparison of Child Benefit packages in 22 countries, UK Department for Work and Pensions, Research Report No 174.
• Rapport de la conférence des experts et de la table ronde sur la contribution Climat et Énergie, 2009
• Taner, B. and Hendrix, P. (2006), Armoedeval, een nieuwe kijk op een oude probleem (The poverty trap, a new perspective on an old problem). Dutch Ministry of Labour.
• OECD (2009) "Benefits and wages", OECD Indicators52;
51 http://ec.europa.eu/employment_social/spsi/common_indicators_en.htm. 52 http://www.oecd.org/document/3/0,3343,en_2649_34637_39617987_1_1_1_1,00.html
41
4.1.3 Method example II: Theoretical pension replacement rates
Theoretical pension replacement rates describe the adequacy of pensions and measure the extent to which pension systems enable workers to preserve their previous living standard when moving from employment to retirement. It can be used to compare the adequacy of different pension systems at a particular point in time. However, it can also be used for prospective purposes. In such cases, the impact of pension reforms on the adequacy of pensions is assessed over time. This is relevant since pension reforms are typically implemented gradually and take time to mature. For example, this type of analysis allows the replacement rates in 2006 to be compared with those in 40 or 50 years. Theoretical replacement rate calculations should be accompanied by other indicators in order to get a more comprehensive picture of adequacy and sustainability of the pension system. The Indicator Subgroup of the Social Protection Committee also provides empirical measures of pension adequacy, based on current income data as well as background information regarding the pension system in each Member State, such as coverage, the average retirement age as well as seniority at retirement. • Indicators Sub-Group of the Social Protection Committee, 2006, Current and
prospective theoretical pension replacement rates. • OECD (2007) "Pensions at a Glance"53,
4.1.4 Applicability at EU level
Model family analysis is closely related to static micro-simulation models. A key strength of both methods is the ability to include detailed modelling of the institutional setting for tax and benefits. Model family analysis uses hypothetical data as input for the analysis instead of population data, as in micro-simulation models. However, census or survey data are generally used to derive the set of households. The consequence of using representative households rather than population data is that specific impacts resulting from the concurrence of certain effects for specific households may be overlooked. Model family analysis is a simple and therefore widely applicable tool for assessing redistributive effects at the level of households. The typical applications in areas of pensions and social protection make it above all applicable to Member State level, where it provides value added in income distribution analysis compared to typical calculations based on Gini-coefficients. Different examples demonstrate that international or EU-wide applications are indeed possible. One example is the work done by the DG EMPL Indicators Sub-Group of the Social Protection Committee54 on current and prospective theoretical pension replacement rates. In addition, the method has been used by the OECD to compare social protection packages in its Benefits and Wages series. Bradshaw et al. have undertaken a series of studies since 1980 to compare child benefit packages, social assistance, child support and policies for lone parents in Europe55.
53 http://www.oecd.org/document/35/0,3343,en_2649_34757_38717411_1_1_1_1,00.html 54 http://ec.europa.eu/employment_social/spsi/spc_indicators_subgroup_en.htm 55 See for instance, Bradshaw, J. and E. Mayhew (2009): Child benefit packages in CEE/CIS countries in 2009. A report for
UNICEF, Geneva.

42
Areas where the method could be used can be extended to basic household needs, including housing, energy and mobility. An important advantage of its simplicity is that model family analysis can be quickly applied, and become an integral part of policy preparation. The method has however some important limitations; the models are static although they can be used for prospective calculations also. They tend to focus on 'typical' households whereas there is a case to focus on 'a-typical' households as well. When the variation of the impact of a policy measure within a certain typical household is large due to specific features of the household, this may be overlooked using model family analysis whether this is output of a micro-simulation analysis, since in these models the entire population is considered. Finally, the method is most comfortable with expenditure-based interventions, and it focuses on income rather than employment or access to services.
4.2 Static micro-simulation models
4.2.1 What are static micro-simulation models?
Micro-simulation is a method used to determine the impact of policy changes by separately evaluating the effect of those changes at the micro level – in other words at level of individuals, households or individual firms. It is a powerful type of model for assessing the impact of social and economic policy changes at the micro-level. If regional information is available, the method can be adjusted to allow for a regional approach to policy analysis. Micro-simulation models (MSM) are designed to answer “what if?" questions about different policy reform options and can evaluate policy impacts ex ante. Truly static models look at economic agents at one point in time only. Models of this kind are simply accounting mechanisms and do not consider behaviour over time. They tend to be based on representative samples of a population and are primarily used to investigate the first round impact of government policy reform. Simulation of this type is used to disentangle the complexity of government policy rather than simulate behaviour. Often, these models contain a high level of detail for the tax and benefit system. A specific example of this type of analysis is the model family analysis that was discussed in the section above. The advantage of using survey or census data is that is allows distributional impacts of government policies to be taken into account. In the case one needs to calculate the impact of policy reform over a number of years one needs to know the structure of the population at different times. One method is to use static ageing. This is done by reweighing the reference database using statistical projections to reflect an alternative time period. Consequently, the range of policies that can be analysed by static micro-simulation models is determined by the degree of detail that is provided by the reference database used. Given the demographic and income characteristics of families, for example, static micro-simulation models are often used to determine the impact effects of alternative benefits policies on the income distribution as well as the budgetary cost.

43
The key example selected in the context of this study is EUROMOD, which is a micro-simulation model for several Member States of the European Union.
4.2.2 Method example: EUROMOD
1. Background, theoretical basis and key design features EUROMOD builds on the approach taken in various national-level tax-benefit micro-simulation models. The model has been developed over 12 years by a group of experts involved in national modelling. The construction and development of EUROMOD has been supported through three European Commission-funded projects: • The initial model construction project covered all (pre 2004) 15 Member States of the
European Union. • The MICRESA project (“Micro-level analysis of the European Social Agenda”)
explored the impact of national, social and fiscal policies, and reforms of these policies, on poverty reduction in the original 15 Member States.
• The I-CUE (Improving the Capacity and Usability of EUROMOD) project expanded and enhanced EUROMOD to enable the incorporation of the 10 New Member States of 2004.
EUROMOD currently covers 19 EU countries and is in the course of development to cover the whole EU27. The model is not based on theoretical assumptions; users must make these choices themselves. The key feature of EUROMOD is its ability to simulate equivalent aspects across many countries. Thus, the method has evolved to (a) take on board best practice among national models, (b) to maximize comparability across countries and (c) to be flexible, to allow national/individual preferences in terms of established practice and assumptions to be adopted or replicated. EUROMOD is largely deterministic, i.e. it works as a tax benefit calculator (income accounting), but can be linked to stochastic models or stochastic elements can be introduced into it. The model itself does not incorporate feedback mechanisms, but can be linked into other modelling frameworks that do so. The EUROMOD model has been used in a wide range of applications56. Most recently, themes such as the simulation of welfare state systems, distributional effects of tax-benefit policies, or labour incentive reforms have been covered by EUROMOD. Current projects that involve researchers from the University of Essex's Institute for Social and Economic Research (ISER) include: • AIM-AP (Accurate Income Measurement for the Assessment of Public Policies) is an
integrated programme of research aiming at improving the comparability, scope and applicability of tools, methods and data for the measurement of income;
• The European Observatory on Demography and the Social Situation (SSO), participating in the network monitoring and reporting on trends in income distribution and social inclusion for the European Commission;
• Flat tax reform in Eastern Europe: Comparative analysis of alternative scenarios in Estonia, Hungary and Slovenia, using Euromod (Euromod Working paper, EM9/09).
56 For details, see http://www.iser.essex.ac.uk/research/euromod/working-papers

44
EUROMOD is unique in covering many Member States of the EU. The model can assess fiscal policies (including social transfers) and employment policies and can be used to assess the impacts of a monetary stimulus and, under some circumstances, of regulatory instruments. For the latter to be possible, the regulatory instrument in question must be translated into a monetary equivalent. For example, the social impact of a regulation targeted at a reduction of carbon dioxide emissions, could be assessed by computing the implications of such a rule on the disposable income of households. This is likely to affect car owners differently from non-owners and it might also change the propensity to own a car. By estimating a micro-econometric labour supply model, one could even assess second degree effects arising from changes in labour supply. By using the same type of behavioural model for different Member States, one could not only assess the impact of a policy on the EU as a whole, but also the impact of transferring regulations from one Member State to another. Learning to use EUROMOD effectively requires some learning time, but with at least basic model experience, it is possible to get useful results within a few days. 2. Input data – requirements, sources and challenges
Table 4.1 Input data
1 Indicators / data used household income micro-data
2 Panel / cross section? cross-sectional
3 Level of aggregation national data aggregated to EU and/or EU-SILC data
4 Data sources national data sources
5 Parameters -
EUROMOD is a static model without consideration of behavioural aspects. The model itself is available free of charge, but access to input data must be secured separately. The main data challenges are to get access permission for the data, the need for detailed information on gross income by source at the individual level and the need for high quality data on characteristics and income referring to the same period. Moreover, the work involved in implementing the model for a new country and updating policies is considerable and requires dedicated resources. 3. Outcome variables EUROMOD itself calculates the effects of changes in tax and benefit policies on household disposable incomes and hence poverty, income inequality, work incentives and the public budget. It can also be used to explore the implications of changes in population characteristics for such indicators. It can be linked to other models (e.g. behavioural models or macro models) to provide data on "what if?" scenarios concerning the effects of policy and policy changes on household income. The lowest level of aggregation of outputs is the individual level. 4. Strengths and limitations The strengths of EUROMOD are the possibility to analyze the effects of policy changes on income distribution and the public budget, taking into account interactions between policy instruments. Moreover, EUROMOD enables comparisons across countries, including “policy swapping” (a policy from one country applied to another country).

45
National level analysis for a single country may be more easily carried out using a national tax-benefit model, if one is available. However, EUROMOD is much more flexible than many national models and users wanting to design new policies might find using EUROMOD preferable to using a national model. Valid comparisons of two or more countries, or policy swaps between countries, will be much easier to achieve using EUROMOD. EUROMOD requires very labour-intensive maintenance in order to keep the model up to date. The resources required are however fixed and relate to maintenance, not to use of the model per se. Provided resources are committed to maintaining the model, the marginal cost of running the model for different policy scenarios is comparatively limited (although this will depend on the complexity and number of options to be modelled). A weakness of the model is that it does not simulate any behavioural reactions to policy reform. However, the model can be combined with behavioural models. Currently, full take-up of benefits and no tax evasion are assumed in EUROMOD. In addition, only the population resident in households is covered. Among other options, the following development possibilities can be considered: comprehensive coverage of regional differences in tax-benefit rules, inclusion of indirect taxes for all countries, inclusion of non-cash benefits for all countries, and/or comprehensive explicit modelling of non take-up of benefits and tax evasion. 5. Links to other methods As an alternative to EUROMOD, national models can be used. However, using several different national models leads to results that are less likely to be comparable. Another alternative is using calculations of hypothetical cases, which are not based on representative micro-data and cannot be used to measure budgetary effects or the effects on income distribution. 6. Relevant references • http://www.iser.essex.ac.uk/research/euromod. Model manuals are available in pdf on
request. • Sutherland H., 2007, “EUROMOD: the tax-benefit micro-simulation model for the
European Union” in A. Gupta and A. Harding (eds) Modelling Our Future: population ageing, health and aged care International Symposia in Economic Theory and Econometrics Vol 16, Elsevier pp 483-488.
• Sutherland H., F. Figari, O. Lelkes, H. Levy, C. Lietz, D. Mantovani and A. Paulus. 2008, “Improving the Capacity and Usability of EUROMOD: Final Report” EUROMOD Working Paper EM4/08, Colchester: ISER, University of Essex.
4.2.3 Applicability at EU level
As dynamic micro-simulation models allow for the assessment of the long-run effects of certain types of policy, it would clearly be advantageous to have a statistical dynamic micro-simulation model at the EU-level. Given the experiences with EUROMOD, it should be feasible to develop such a model covering a selection of, or all, EU Member States.

46
Currently, EUROMOD is designed to assess distributional impacts of a policy. It offers a highly standardized modelling of country-specific tax benefit systems, which can also be applied to other Member States. EUROMOD does not offer behavioural models. Using EUROMOD as a basis for a dynamic micro-simulation model would require the estimation of a standardized behavioural model for each member country, based on the related country sample contained in EUROMOD. This would result in structurally equal models, but allow for behavioural parameters to be country specific. In this way, standardization would allow for a consistent aggregation of behavioural impacts across Member States. However, one should not under-estimate the amount of work that would be necessary for such a large scale operation on the EU level. Some lessons can be drawn from experiences with the MICROS model, as well as other dynamic micro-simulation models. Given the time and budgetary requirements of such a model, it would be advisable to start with a dynamic population model that is as simple as possible, with the aim of creating valuable deliverables that can be developed progressively and enhanced over time. At the same time, the model should have clear objectives, be user friendly, produce timely outputs, and be transparent and well documented. Finally, for acceptance by policy makers and the public, the outcomes need to align with external benchmark data. Incorporating behavioural response in micro-simulation models at the EU-level is even more demanding in terms of time, budget and data availability, particularly as expectations about reliability are likely to be high.
4.3 Dynamic micro-simulation models
4.3.1 What are dynamic micro-simulation models?
Dynamic micro-simulation models can be classified as either "statistical dynamic models" or "behavioural response models"57: Statistical dynamic models In contrast to static micro-simulation models, statistical dynamic micro-simulation models use dynamic ageing to project the population forward in time. This type of procedure builds up a life history for each individual in a population, by simulating lifetime transitions, such as changes in demographic characteristics, labour market patterns, income mobility and so on. This increases the range of questions that can be explored relative to static models. Most dynamic micro-simulation models are designed specifically to consider the inter-temporal and long-term effects of counterfactual conditions, rather than the impact effects with which static models are usually concerned. Harding (1993a) distinguishes two major types of statistical dynamic micro-simulation models. Firstly, dynamic cohort models in which only one or a series of cohorts are used in the simulation rather than the entire population. Such models have been used to analyse lifetime income distribution and redistribution, lifetime rates of return to education and 57 Micro-simulation and public policy, editor Ann Harding (1996) Amsterdam: North Holland, Contributions to Economic
Analysis 232

47
repayment patterns for student income-contingent loans. Secondly, dynamic population models which involve ageing a sample of the entire population. Such dynamic models have been used to analyse retirement incomes, future health status, the long term impact of social security amendments, and the lifetime redistributive impact of the social security system. Most recent examples of successful dynamic micro-simulation models appear to be dynamic population models. The main reason for using statistical dynamic models is that they allow for an evaluation of the long-run effects. For instance, an analysis of the development of the income distribution of the elderly population in the longer term should take into account that the labour force participation behaviour of women has increased over the past decades, which will have an impact on the future income distribution of the elderly population. Behavioural response A major criticism of the static and statistical dynamic models is that they do not model the impact of government policy on behaviour. These models can thus be used only to simulate first order effects of policy changes. The adjustment effects, which follow because people change their behaviour as a result of the policy changes, are ignored. In most cases the focus lies on the labour market. This implies, for instance, that decisions regarding labour supply behaviour need to be made dependent on the tax benefit system. However, even when labour supply is not the main focus of a policy, ignoring behavioural responses may lead to biased outcomes. Measures of the welfare losses, for example resulting from increases in taxes, can be overstated by non-behavioural models that rely on ‘morning after' changes in tax paid, rather than allowing for substitution away from activities whose relative prices increase. In addition, estimates of the distributional implications of tax changes may be misleading unless behavioural adjustments are modelled. Estimates of tax rates required to achieve specified revenue levels are likely to be understated58. In order to incorporate behavioural responses in a micro-simulation model an explicit relation need to be made between transitions and the policy parameters. In the past decade, efforts have been made to take into account such general equilibrium effects, by trying to link sectoral household models, in most cases labour market models, to a household micro-database. A requirement regarding the validity of the outcome of the model is that the behavioural relationship is stable such that the parameters do not change as a result of the policy changes59. Examples of the use of behavioural response in micro-simulation models include models that take into account changes in consumption patterns resulting from price changes. This requires information about how the demand for a particular good will change in relation to changes in its own price (the own price elasticity) and the impact of price changes for other goods (cross price elasticities). Another example is the use of models to take into account changes in demand for certain services, such as childcare, resulting from a price
58 J. Creedy and G. Kalb, Behavioural Micro-simulation Modelling With the Melbourne Institute Tax and Transfer Simulator
(MITTS): Uses and Extensions, 2004 59 N.A. Klevmarken (1997), Behavioural modelling in micro simulation models

48
change, as well as the related impacts on labour supply behaviour (female participation in the workforce etc)60.
4.3.2 Method example: The MICROS model
1. Background, theoretical basis and key design features MICROS is both a static and dynamic micro-simulation model of taxes and transfers for The Netherlands. It has been developed and is maintained by the Dutch Ministry of Social Affairs and Employment61. The model is mainly a dynamic statistical model, in the sense that decisions regarding birth, marriage and other relevant "life events" are explicitly modelled. Behavioural responses are incorporated only in so far it concerns the labour market. Hitherto, the main application of MICROS as a dynamic micro-simulation model is to provide a long-term projection of the income distribution for elderly people in the Netherlands. Currently, an update of the dynamic labour market module is foreseen. 2. Input data – requirements, sources and challenges
Table 4.2 Input data
1 Indicators / data used -
2 Panel / cross section? cross-sectional
3 Level of aggregation individual data
4 Data sources Woning Behoefte Onderzoek
5 Parameters -
MICROS uses a static database. The input data are attached to the model. Data at the household level are used as input. Among others, the following household characteristics are available: household composition, labour market behaviour, extensive income information and wealth position. In addition, the model describes the tax and benefit system in the Netherlands in great detail. 3. Outcome variables The main outcome variables are changes in taxes, transfers, and/or disposable income and the lowest level of aggregation at which outcomes are generated is the individual level. 4. Strengths and limitations The main strength of MICROS is the possibility to analyse the tax-benefit system in great detail. Both a static and a dynamic version of the model are available. The considerable time and budgetary requirements of the model place some restrictions on the further development of the dynamic version. Since the model is being developed
60 See for instance G. Kalb and W.S. Lee Childcare Use and Parents’ Labour Supply in Australia, 2005 Melbourne Institute
Working Paper Series Working Paper No. 13/07 61 http://home.szw.nl/

49
within a government department, more priority is given to the development of the static model, which focuses on the short term. 5. Links to other methods There is exchange of ideas and validation of outcomes with other government departments, such as the Central Planning Bureau in the Netherlands that have their own micro-simulation models. Also the Ministry uses representative household models for tax-benefit calculations.
4.3.3 Applicability at EU level
Considering that dynamic micro-simulation models allow for the evaluation of long-run effects, there is a clear demand for a statistical dynamic micro-simulation models at the EU-level. Given the experiences with EUROMOD, it should be feasible to develop such a model covering a selection of, or all, EU Member States. However, some lessons can be drawn from experiences with the MICROS model, as well as other dynamic micro-simulation models. Given the time and budgetary requirements of such a model, it would be advisable to start with a dynamic population model that is as simple as possible, with the aim of creating valuable deliverables that can be developed progressively and enhanced over time. At the same time, the model should have clear objectives, be user friendly, produce timely outputs, and be transparent and well documented. Finally, for acceptance by policy makers and the public, the outcomes need to align with external benchmark data. Incorporating behavioural response in micro-simulation models at the EU-level is even more demanding in terms of time, budget and data availability, particularly as expectations about reliability are likely to be high.
4.4 Micro-simulation models combined with CGE models
4.4.1 What are micro-simulation models combined with CGE models?
As a third stage in the development of micro-simulation, a combination has been made between macro models, such as Computable General Equilibrium (CGE) models, and micro-simulation models. In these models, the size distribution of incomes is generated by a household module (typically estimated with econometric techniques), in which the units correspond to individual household observations in a survey. This allows the assessment of the employment and social impacts of policy proposals that impact on the macro-economic level. In the literature, three different approaches are used to link micro-simulation modules to CGE models: 1. The module may be fully integrated with the CGE model, permitting full
interaction between the two levels of analysis; 2. A sequential approach can be used, where the CGE model supplies a separate
micro-simulation module with data on employment, wages, and consumer prices; 3. A modelling approach can be used, where the outcome of the micro-simulation
model feeds back into the CGE model.

50
The example selected and assessed here is the STSM-PACE-L model that was first developed by the ZEW62 in Mannheim and also further developed by the IAB63 in Nuremberg (both in Germany).
4.4.2 Method example: the STSM-PACE-L model
1. Background, theoretical basis and key design features A first version of the micro-simulation model STSM was developed at the ZEW Mannheim in the 1990s. The CGE model PACE-L was integrated into STSM in recent years. Both parts have been further developed at the IAB in Nuremberg (IabSIM-IabGE). The model STSM-PACE-L has two components. STSM is a micro-simulation model of the German tax-transfer system. The model uses individual-level data from the German Socio-Economic Panel (GSOEP) to quantify ex-ante the fiscal effects of a reform, and its distributive impact on household net income. The integrated labour supply module allows behavioural responses to a reform to be taken into account. PACE-L is a multi-sector CGE model of Germany as an open economy. Special focus is placed on the labour market, which is modelled as a collective bargaining setting, resulting in wages that are above the market-clearing level and hence in involuntary unemployment. In the linkage of the two model components, the CGE model has the role of determining the level of the wages and unemployment, the micro-simulation (STSM) model captures labour supply. The two model components are iterated until convergence, producing a consistent overall solution. The main advantage of combining STSM and PACE-L is that one can model reactions of both labour supply and labour demand in response to a policy reform. The STSM-PACE-L model assumes households to act as a single decision-maker, who can choose among alternative labour supply categories. Due to rationing on the labour market and/or wage setting there is (involuntary) unemployment. Further, a full take-up of benefits and no tax evasion are assumed. In the CGE part, it is assumed that all markets (except the labour market) clear. The CGE model is naturally based on General Equilibrium Theory, i.e. neoclassical microeconomics. It includes wage setting and, as a consequence, (involuntary) unemployment. Further market imperfections could be added. Thus, although it seems to be Walrasian at first sight, the model is actually a Non-Walrasian GE model. The CGE part of the model is deterministic, while the micro-simulation part is stochastic. In the labour supply part, the response to a change in the tax-transfer system is modelled and in the CGE part, the wage response to labour supply changes is modelled. Both parts are iterated (feedback mechanisms in both directions).
62 Zentrum für Europäische Wirtschaftsforschung (Centre of European Economic Research) http://www.zew.de/ 63 Institut für Arbeitsmarkt- und Berufsforschung (Institute for Labour Market and Occupational Research) - http://www.iab.de/

51
Both parts of the model have been used for various ex-ante assessments (e.g. labour supply and distributional effects of in-work benefit proposals). There are no main alternatives that produce comparable results. The policy areas covered by STSM-PACE-L are tax and benefit policies, social insurance and minimum wage policies. It can assess the impact of any monetary stimulus. 2. Input data – requirements, sources and challenges
Table 4.3 Input data
1 Indicators / data used Micro-data / social accounting matrix
2 Panel / cross section? Panel data
3 Level of aggregation National
4 Data sources GSOEP
5 Parameters -
While micro-simulation requires only cross-sectional data in principle, the use of retrospective questions for important income-related variables in the GSOEP makes it necessary to draw on more than one wave to obtain the relevant information for a given year. The panel structure of the German Socio-Economic Panel also offers the possibility of modelling labour market dynamics. The main data sources for the CGE component PACE-L are the national accounts (input-output table), national tax statistics, and national labour market indicators (unemployment rates, quit rates, skill composition of sectoral labour forces). Both parts of the model are currently static. The main data challenge concerning the labour supply part is finding a data set that is rich enough to model the main aspects of the tax-transfer system and to model behavioural responses. Concerning the CGE part, the main challenge is to find appropriate information for functional forms. 3. Outcome variables Outcomes include a broad range of efficiency and distributional measurements. In the macro part, typical national accounts measures can be computed (GDP, consumption, investment…). In the micro part, gross and net incomes (wages) are computed and form the basis of distributional measures (e.g. Gini coefficient, poverty rates). The CGE model also allows for the computation of compensating or equivalent variations, to allow welfare analysis. The lowest level of aggregation is individuals in the micro part and industry level (NACE 2) in the macro part. Concerning geographical aggregation, the evaluation is usually undertaken at the national level, but finer disaggregation is possible, including the NUTS 3 level, which in Germany corresponds to the level of counties (Kreise). 4. Strengths and limitations The strength of STSM-PACE-L is its combination of a micro-simulation model and a CGE model that are usually used separately. A weakness is seen in its reliance on economic theory.

52
The main problem is the lack of theoretical and empirical consistency between the micro and the macro parts which can give rise to (dis)aggregation errors. To be able to successfully link micro-simulation and CGE models, there have to be some common variables through which the two models can exchange information. Usually, it is necessary to aggregate or disaggregate these variables to be comparable with the variables in the other model. Of course, the less variables have to be (dis)aggregated, the more of the underlying heterogeneity in the data will be retained. Furthermore, it has to be checked if the same variable in both models represents the same population (e.g. household consumption in the micro model vs. aggregated total consumption including government in the macro model). Functional forms (e.g. the preference functions in the labour supply model and the aggregated utility in the CGE model) have to be specified in a consistent way. In addition, it has to be checked if one run of each model represents the same time horizon. However, despite the best efforts, there is no guarantee of coherence between the two models - something which can be complex and technically challenging to achieve. 5. Links to other methods STSM-PACE-L is a combination of a micro-simulation model and a CGE model and therefore the two parts of the model can be used separately. There is no direct exchange with other models or methods. 6. Relevant references • Boeters, Stefan; Feil, Michael (2009): Heterogeneous labour markets in a micro-
simulation-AGE model – application to welfare reform in Germany. In: Computational Economics, Vol. 33, No. 4, S. 305-335
• Boeters, Stefan; Feil, Michael; Gürtzgen, Nicole (2005): Discrete working time choice in an applied general equilibrium model. In: Computational Economics, Vol. 26, H. 3/4, S. 183-211
• Böhringer, Christoph; Boeters, Stefan; Feil, Michael (2005): Taxation and unemployment – an applied general equilibrium approach. In: Economic modelling, Vol. 22, Nr. 1, S. 81-108
• Wiemers, Jürgen; Bruckmeier, Kerstin (2009): Forecasting behavioural and distributional effects of the Bofinger-Walwei model using micro-simulation. In: Jahrbücher für Nationalökonomie und Statistik, Bd. 229, H. 4, S. 1-20
• Arntz, Melanie; Clauss, Markus; Kraus, Margit; Schnabel, Reinhold; Spermann, Alexander; Wiemers, Jürgen (2007): Arbeitsangebotseffekte und Verteilungswirkungen der Hartz-IV-Reform. (IAB-Forschungsbericht, 10/2007), Nürnberg
• Arntz, Melanie, Stefan Boeters, Nicole Gürtzgen, and Stefanie Schubert (2008), Analysing Welfare Reform in a Micro-simulation-CGE Model - The Value of Disaggregation, Economic Modelling 25, 422-439.
• Arntz, Melanie, Stefan Boeters, and Nicole Gürtzgen (2006), Alternative Approaches to Discrete Working Time Choice in an AGE Framework, Economic Modelling 23, 1008-1032.
• Boeters, Stefan, Nicole Gürtzgen, and Reinhold Schnabel (2006), Reforming Social Welfare in Germany - An Applied General Equilibrium Analysis, German Economic Review 7, 363-388.

53
• Boeters, Stefan, Michael Feil, and Nicole Gürtzgen (2005), Discrete Working Time Choice in an Applied General Equilibrium Model, Computational Economics 26, 183-211.
• Boeters, Stefan, Christoph Böhringer, and Michael Feil (2005), Taxation and Unemployment: An Applied General Equilibrium Approach for Germany, Economic Modelling 22, 81-108.
• Clauss, Markus and Reinhold Schnabel (2008), Distributional and Behavioural Effects of the German Labour Market Reform, Journal of Labour Market Research 4, S. 431-446.
• Beninger, Denis, François Laisney and Miriam Beblo (2007), Welfare Analysis of Fiscal Reforms: Does the Representation of the Family Decision Process Matter? Evidence for Germany, Journal of Population Economics 20, 869-893.
4.4.3 Applicability at EU level
Both micro-simulation and CGE modelling are in principle applicable at the EU level or for several Member States. So far, the model is focused on Germany, but the method could in principle be applied to all European countries combining a European-wide micro model (e.g., EUROMOD) with a European CGE model. There is interest in being involved in testing an application across EU Member States. The ZEW Mannheim has already gained experience in this domain by the “European Tax Analyzer”. Another organisation that might be interested is the CPB (Netherlands Bureau for Economic Policy Analysis).
4.5 Micro-simulation models with spatial analysis
4.5.1 What are dynamic spatial micro-simulation models?
In a spatial micro-simulation model regional attributes are incorporated in developing the various socio-economic modules of the model. In general, the outputs of such models can be illustrated using maps and Geographic Information Systems. We focus here on the SVERIGE models, which are used for modelling regional impacts in Sweden.
4.5.2 Method example: The SVERIGE model
1. Background, theoretical basis and key design features SVERIGE (System for Visualizing Economic and Regional Influences Governing the Environment) is the name given to a family of related models. The original model is a spatial, dynamic micro-simulation model, representing all individuals and families in Sweden. LISA, a later version of SVERIGE, is a simplified version especially targeting labour supply experiments, while the SVESIM model, a third generation of SVERIGE, extends SVERIGE and LISA with endogenous labour demand and labour market clearing modules. This last part of the model is currently (late 2009) under construction. The LISA model version is used for analysing the relationship between labour supply and seven major social security programmes. The general result is that small changes in
54
benefit levels do have substantial effects on participation and on labour supply and that such effects become much more obvious and visible with the help of a simulation, compared to just inspecting parameters in the estimated equations. The full effect of a change does not emerge until after several years due to the cumulative dynamic side effect of different partial causal chains. In another study the simulation model was used to evaluate a number of scenarios involving potential investments in Östhammar (a municipality in Uppsala County), one of which was a nuclear waste repository. As part of the study, the direct local effect of the investments was estimated. The results of the simulations indicated that investments such as the nuclear waste repository will have some economic and demographic effects. However, infrastructure projects that increase accessibility seem to generate more profound and long-lasting effects at the local level. A municipality such as Östhammar, located close to the Stockholm metropolitan area, may be especially likely to benefit by such infrastructure investments. As such, the spatial micro-simulation model is able to predict the location and the size of the expected economic impacts at a relatively low aggregation level. 2. Input data – requirements, sources and challenges SVERIGE uses the ASTRID longitudinal individual database as start sample, for estimating behaviour and for validating the models by running counterfactual simulations for historical, observed periods. ASTRID contains around one hundred demographic and socio-economic attributes for each inhabitant in Sweden including location of place of residence and work, with a resolution of 100 metres. Some individual demographic information is available for each year from 1968 up to at least 2005, while most socio-economic attributes are obtainable annually at least for 1985 to 2005. Data for each firm and place of work are in place for every year since 1990. Some information regarding location, size, type and value of individually-owned properties is also available for years after 1995. All data in ASTRID derives from administrative registers at Statistics Sweden (SCB) and are used under special conditions in order not to reveal any individual information outside the laboratory. 3. Outcome variables The main outcome variables are changes in taxes, transfers, and/or disposable income and the lowest level of aggregation at which outcomes can be generated is the individual level. The outcomes can be read year by year for any chosen groups of individuals or regions. 4. Strengths and limitations Spatial micro-simulation models are especially interesting for their ability to analyse the impact of policies outside the social domain, such as those concerning transport, mobility and energy etc. A specific interesting feature of the SVERIGE model is that it is a family of related models ranging from a extensive spatial, dynamic micro-simulation model representing all individuals and families in Sweden, to a simplified version especially targeting labour supply experiments.
55
Data requirements are very onerous, as is the knowledge required regarding spatial labour market patterns. 5. Relevant references • Holm, E., Holme, K., Mäkilä, K., Mattsson-Kaupi, M. & Mörtvik, G. (2002): The
SVERIGE spatial micro-simulation model – Content, validation, and example applications. Gerum Kulturgeografi 2002:4, Umeå Universitet.
• Lindgren, U., Strömgren, M., Holm, M., Lundevaller (2008), E.H., Analyzing Socio-Economic Impacts of Large Investments by Spatial Micro-simulation
4.5.3 Applicability at EU level
The current model is focused on Sweden only, apart from a migration module. It could be developed for other European countries. However, the model uses a unique database (ASTRID) that provides data on many different subjects over a long period of time and which is unlikely to have direct equivalents in many other EU countries. A simple version of model allowing for spatial analysis would be to have at least data on location in the database. This implies that the impact of policies can be shown for different regions. Hereby it is ignored that behavioural response may differ between regions. For instance, the survey that used in MICROS micro-simulation model that is used in The Netherlands provides information on the postal code of the household. This allows for instance calculations of the impact of road pricing on income for different household types.

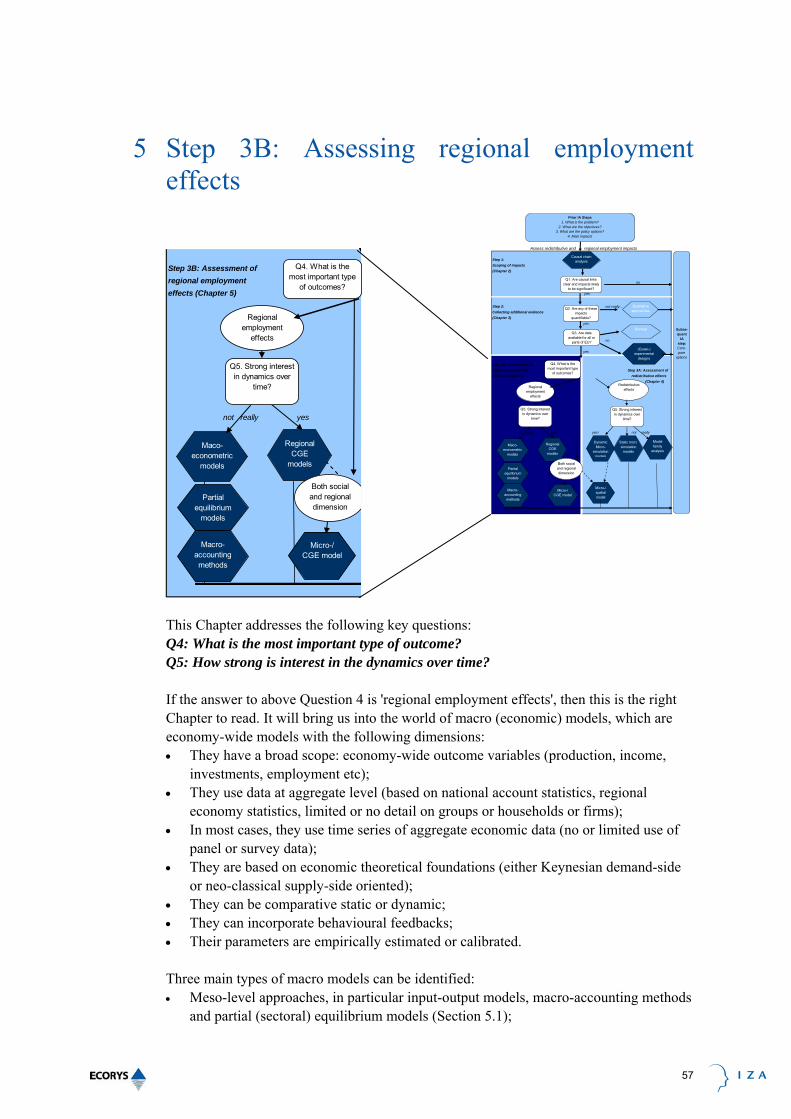
57
5 Step 3B: Assessing regional employment effects
Step 3B: Assessment of regional employment effects (Chapter 5)
not really yes
Regional employment
effects
Q4. What is the most important type
of outcomes?
Regional CGE
models
Maco-econometric
models
Micro-/CGE model
Q5. Strong interest in dynamics over
time?
Both social and regional dimension
Partial equilibrium
models
Macro-accounting methods
This Chapter addresses the following key questions: Q4: What is the most important type of outcome? Q5: How strong is interest in the dynamics over time? If the answer to above Question 4 is 'regional employment effects', then this is the right Chapter to read. It will bring us into the world of macro (economic) models, which are economy-wide models with the following dimensions: • They have a broad scope: economy-wide outcome variables (production, income,
investments, employment etc); • They use data at aggregate level (based on national account statistics, regional
economy statistics, limited or no detail on groups or households or firms); • In most cases, they use time series of aggregate economic data (no or limited use of
panel or survey data); • They are based on economic theoretical foundations (either Keynesian demand-side
or neo-classical supply-side oriented); • They can be comparative static or dynamic; • They can incorporate behavioural feedbacks; • Their parameters are empirically estimated or calibrated. Three main types of macro models can be identified: • Meso-level approaches, in particular input-output models, macro-accounting methods
and partial (sectoral) equilibrium models (Section 5.1);
Assess redistributive and regional employment impacts
Step 1: Scoping of impacts(Chapter 2)
no yes
Step 2: not really…Collecting additional evidence (Chapter 3)
yes
no
yes
Step 3B: Assessment of regional employment Step 3A: Assessment of effects (Chapter 5) redistributive effects (Chapter 4)
not really yes yes! not really
Causal chain analysis
Regional employment
effects
Redistributive effects
Model family
analysis
Q1. Are causal links clear and impacts likely
to be significant?
Q4. What is the most important type
of outcomes?
Prior IA Steps1. What is the problem?
2. What are the objectives?3. What are the policy options?
4. Main impacts
Subse-quent
IA step: Com-pare
options
Q3. Are data available for all or
parts of EU?
(Quasi-) experimental
designs
Regional CGE
models
Maco-econometric
models
Dynamic Micro-
simulation models
Static microsimulation
models
Micro-/ spatial model
Micro-/CGE model
Q5. Strong interest in dynamics over
time?
Q5. Strong interest in dynamics over
time?
Both social and regional dimension
Q2. Are any of these impacts
quantifiable?
Qualitative approaches
Surveys
Partial equilibrium
models
Macro-accounting methods
58
• Regional Computable General Equilibrium (CGE) models, which are more neo-classical supply side-and market equilibrium oriented, and a variant of national CGE models (Section 5.2);
• Macro-econometric models, which are more Keynesian demand-oriented (Section 5.3).
5.1 Meso-level quantitative methods for ex-ante impact analysis64
In regional modelling, accounting models based on statistics are frequently used for impact assessment. In general, these methods have the following dimensions: • Aggregation at macro or meso level (regional, sectoral); • They are based on statistical accounts (macro or meso data, time series); • They are static, not dynamic; • Limited scope of outcome variables (production, income and total employment); • No behavioural feedback mechanisms; • Limited theoretical foundations, but more demand-side oriented than supply-side
oriented. This section briefly reviews the international literature on regional economic modelling and provides an overview of the methodologies used for the assessment of regional employment impacts. Although there is a growing interest in developing regional economic models based on national economic models, regional models differ from their national counterparts in several respects. These differences stem from the fact that regions are more open economies than nations. Regions are not only open to other countries, but they are also highly influenced by other regions (due to inter-regional trade) and national economic growth. As a result, regional methods have to incorporate this regional dependency and should also be capable of analysing the impact of changes in government policies or of analyzing the specific development pattern of a region. Both single region and multi-region methods (or models) are described in the literature. While single region methods can only estimate impacts for one region, multiregional models can identify impacts for more regions and the interdependencies between these.
5.1.1 Input-output models
Description Input-output models are based upon the exchanges between different economic sectors, taking into account that outputs from one sector can be an input into others (the input-output matrix of a region or country as in the national or regional accounts). An input output table presents all deliveries from a given sector to the sector itself and to other sectors in a matrix. Input-output models are structured on transaction tables, combining supply table and use tables to provide a consolidated regional input-output model. These tables display the sources of inputs and outputs for a region in a matrix format, with each sector listed in both the rows and columns. The models display the interactions and interdependencies in the economy, where different industries can not operate separately. 64 Methods described in this section have only been analysed in the scoping stage of this study and have been inserted here
for the sake of completeness.

59
The models show if a policy affects one sector what the impacts will be for other sectors and the economy as a whole. In a study by Vaqar (2006), four different techniques are mentioned that have been used over the past few decades. These are single region models (impacts of changes on regional output, income and unemployment level are calculated), interregional models (encompassing several regions having interregional trade origin-destination details), multiregional models (models of several regions with origin-only details) and balanced regional models (assuming all trade occur in nationally balancing sectors). Furthermore, three approaches exist to form regional input-output models: bottom up, top-down and a hybrid method: • Bottom-up: Survey for each region to obtain details of the source of supply of all
inputs and the destination of outputs.(Most reliable, but most expensive); • Top-down: Non-survey based approach which makes use of the material available in
the form of national tables and modifies them to the region; • Hybrid model: Begins with the top-down disaggregation of the national model but is
supplemented by selective surveys of key sectors for the region. A regional input-output study65 was carried out by Statistics New Zealand, reviewing the international methodologies used to assess the suitability of the various methodologies for the production of official regional input-output tables. A case study on Finland examines the use of location quotients (LQ) in constructing regional input-output models focusing on the augmented FLQ formula (AFLQ) proposed by Flegg and Webber (2000), which takes regional specialisation explicitly into account. The results show that, in contrast with the other LQ-based formulas examined, the AFLQ is able to produce adequate estimates of output multipliers in all regions66. Another paper67 attempts to provide insight into the economic performance of the South-east region of Bulgaria by presenting quantitative relationships between sectors in the regional economy. It is based on a regional input–output model together with an application of non-survey GRIT technique (Jensen et al., 1979d)68. The derived regional input-output table is expected to serve as a solid quantitative basis for simulating exogenous shocks to the regional economy. RIMS II (Regional Industrial Multiplier System), developed by the Bureau of Economic Analysis in the US69, is a method used for estimating regional input-output multipliers based on an input-output table. It is widely used by both the public and private sectors to study economic impacts. The main policies studied are investments in tourism, energy, transport, manufacturing plants, military bases and universities. By using multipliers, the economic impact of a change in final demand, in earnings, or in employment on a region’s economy is measured. They are used to estimate how much additional production is created for every initial increase in production and how many
65 Statistics New Zealand (July 2003) Regional Input-Output Study. 66 A.T. Flegg and T. Tohmo, Regional Input−Output Models and the FLQ Formula: A Case Study of Finland 67 Golemanova, A, Input-Output Model for the South-East Region in Bulgaria, University of National and World Economy. 68 Jensen R. C., Mandeville T.D. & Karunarante N.D. (1979) Regional Economic Planning: Generation of Regional Input-
Output Analysis 69 The Bureau of Economic Analysis (BEA), US Department of Commerce

60
additional jobs are created. RIMS II multipliers can be estimated for any region composed of one or more counties and for any industry or group of industries. For estimating the impacts of changes on employment, RIMS II presents two types of multipliers: final-demand multipliers and direct-effect multipliers70. A "User Handbook for the Regional Input-Output Modelling System (RIMS II)’’ gives a detailed explanation on RIMS II, together with case studies such as departure or arrival of an industry from/in a region. Another system used in the US for regional input-output modelling is IMPLAN, which estimates sectoral activity for final demand, final payments, gross output, and employment for each county model used. Data retrieval, data reduction-model development and impact analysis are the three functions of the system. It provides a high degree of flexibility, both in terms of geographic coverage and model formulation. Areas of usability Input-output models can be applied to estimate the impacts of regional investment or spending policies which affect production or employment in one or multiple sectors in the region (or other regions). An example of this would be direct investments to increase production capacity in a certain sector. Input-output models are demand-oriented and as such these models are only relevant for estimate the short to medium term impacts of investment policies on production or employment. These models are often not relevant for impact assessment of regulatory or coordination policies. As these models do not explicitly model the supply side, and generally do not model dynamic changes in technology and labour markets, input output models are not very suitable for estimating long term supply side effects or impacts of policies on productive capacity or the labour market. Strengths and weaknesses The strong points of these methods are the detailed information on sectoral impacts and the strong inter-sectoral dimension. However, these models can be used only for short-term analysis of small policy changes affecting sectors. In the models, relative prices are considered to be fixed (no feedback) making them unsuitable for analysis where the changes in relative prices are important. The main weak point of these models is the demand side orientation and lack of supply side. For these reasons, impacts of policies on employment can be seriously overestimated, as labour supply or capital are not taken into account as constraints for economic expansion. Additions of these models with a labour market block and price adjustments are necessary to avoid this problem. Trends in method development As the major weak point of these methods is related to lack of supply-side and feedback mechanisms. Developments are mostly in the field of combining input-output methods with macro-econometric or CGE models. An example of this is the REMI model, which includes elements of macro-econometric and CGE models, while making use of regionalised input-output tables. Input-output structures are thus often incorporated into CGE or macro-econometric models and feedbacks through relative price adjustments are added – which addresses an important weakness of stand-alone input-out models.
70 The total impact on regional employment is calculated by multiplying the final-demand change in the column industry by the
sum of the multipliers for each row.
61
5.1.2 SAM-Leontief models
Description SAM-Leontief models are used to give a statistical representation of the economic and social structure of a country or a region. A Social Accounting Matrix (SAM) is used as a basis for the model, which is the extension of input-output tables with more detailed information on institutions and production factors. It is a data set presented in the form of a matrix in which the consumption and purchase of different institutions in the economy (households, industries, government) is presented. The data sources for a SAM come from input-output tables, national income statistics, and a household survey with a labour module. It comprises all the economic activities of the system (consumption, production, accumulation and distribution), is flexible in the degree of disaggregation and shows many details about the circular flow of income and the linkage between income distribution and economic structure. In 1996, a Strategic Micro and Macro Modelling project was carried out by the Western Cape Department of Agriculture and the Agricultural Research Council in South Africa to develop a framework for quantitative decision-making based on SAM findings. In 2001, the PROVIDE71 (Provincial Decision-Making Enabling) project emerged and the development of a CGE model was initiated by following the structure used by the previous SAM. In a study conducted by Madsen and Jensen-Butler in Denmark, (2005), spatial accounting methods were used to construct spatial SAMs, which are an extension of the more general regional SAMs, driven by growing interest in regional and local economic performance and interactions with other regions and localities. Another project was conducted on a SAM-based model for the Border, Midland and West region of Ireland. In order to assist policy makers in improving their understanding of backward and forward linkages, SAM-based multiplier analysis was performed72. Areas of usability SAMs can be used for some simple policy simulations applied to the analysis of the interrelationships between structural features of an economy and the distribution of income and expenditure among household groups. They provide a basis to ensure the consistency of statistics from the various sources as it reflects the whole economy. They can be complemented by the use of household surveys to map impacts into distributional changes. Strengths and weaknesses The multipliers calculated with SAM-Leontief models tend to be larger than those calculated with input-output models because a SAM captures the full circular flow, as 71 The project aims to facilitate policy design by supplying policy makers with provincial and national level quantitative policy
information. The project entails the development of a series of databases (in the format of Social Accounting Matrices) for use in Computable General Equilibrium models. For further information please see; The PROVIDE Project Standard Computable General Equilibrium Model (2005)- Technical Paper Series.
72 Vaqar (2006), Regional economic modeling: evaluating existing methods and models for constructing Irish prototype.

62
opposed to input-output tables, which do not allow for the feedback of factor incomes to households for consumption expenditures. Moreover, SAMs serve as a very good way of displaying information between a macro framework and a more detailed description of markets and institutions. SAM models have several major disadvantages. Firstly, the economic theoretical foundation is weak and prices are fixed, and do not adjust to reflect changes in real activities (no feedback mechanisms). Secondly, the results of the simulations can differ widely due to the assumptions made about which accounts are exogenous and which endogenous (lack of robust outcomes).
5.1.3 Partial equilibrium models
Description The partial equilibrium methodologies concentrate on modelling the demand and supply side of a particular market or sector in the (regional) economy, assuming other variables are constant in value. Examples are models for the labour market or for the automotive sector, where wages or prices are influenced by demand and supply on that market. The effects in other markets or sectors are either ignored or assumed to be very small, thus the other markets or industries are treated as exogenous to the model. Given this concentration, it is possible to focus on a particular market or commodity chosen in much greater detail than is the case with general equilibrium models. Areas of usability These models can only be used for specific questions regarding impacts of a policy on one market (e.g. labour market) or sector. While making a decision on using either a general equilibrium or partial equilibrium model, the important matter is to make a realistic assumption regarding the possible scope of effects of a specific policy change (whether it is assumed to have effects on a broad range of markets or only on one market). Partial equilibrium analysis illustrates results for one market or industry at a time. Many applications are in the field of the labour market, where labour demand, labour supply and wage reactions can be modelled in detail. In an ex-post study conducted by Buch et. al (2008)73, the trends in employment volatility over the past four decades have been examined and the impact of openness for trade on volatility has been tested using regional data of eleven west German states for the years 1970-2005. A partial-equilibrium model of regional labour markets was adopted and the importance of structural and cyclical factors determining the volatility of employment at the regional level was stressed. Strengths and weaknesses The main strengths of partial equilibrium models are the possibility to focus in detail on effects of policies on one market, such as the labour market. In addition, the models normally have a strong theoretical micro-economic foundation, include behaviour and feedbacks through prices and contain empirically estimated parameters. Moreover, these models can have detailed outcomes on employment by level, labour force by group and 73 Buch, C.M. and Schlotter, M. (2008) Regional Origins of Employment Volatility: Evidence from German States.

63
wages. Weak points include the fact the models ignore impacts on other markets and do not take into account interrelations between regional markets (for example between the goods market and labour market). Finally, most models are static; therefore the dynamic adjustment process is often not visible with these models.
5.2 Regional CGE models
5.2.1 What are regional CGE Models?
Computable General Equilibrium (CGE) models are based on the neo-classical concept of market equilibrium. Prices on the markets adjust to shocks, so as to bring about equilibrium on the markets. These models are mostly used for analysing the effect of a particular shock or change in policy on important markets (product markets, labour market etc.) They can also be used for analysing the direction in which the economy may tend to move, given an economic shock. The main data for building a CGE model are national account statistics (or similar regional statistics) and a Social Accounting Matrix (SAM). In this sub-section, a number of types of CGE models are reviewed. We start with a simple regional CGE model for Poland, before examining two more sophisticated Finnish regional CGE models. The overview of CGE models is concluded with a review of the Dutch RAEM model, which has a detailed regional level and includes some new geography elements.
5.2.2 Method example: MaMor2 Model (Poland)
In the interim phase of the project, the Polish MaMor2 model was selected for review as an example method because the model is a recently-developed, state of the art CGE model, applied for EU Funds production and employment impacts at the regional level in Poland. 1. Background, theoretical basis and key design features Originally, the MaMor1 (national) CGE model for the Polish economy was developed by Tomasz Kaczor, who later developed the model as the Mamor2 regional version at the Institute for Market Economy Research in Poland. The model remains his intellectual property. The MaMor2 model is in principle more focused on impacts on GDP and productivity, rather than on employment and redistributive effects. There are three versions of the model: • Version 1 PhD version national CGE Model with 18 sectors; • Version 2 Regional version for simulation of impacts of EU Funds for Poland (1
homogenous product, no sectors); • Version 3, currently in development: Regional CGE model with four sectors
(Agriculture, Manufacturing, Market services and non market services). The model is a CGE model for 16 regions in Poland. It is based on a production function (CES: constant elasticity of substitution) with determinants Capital, Non-skilled labour and Human Capital (high-skilled labour). The production factors (stocks) are estimated

64
based on cumulative infrastructure investments, share of skilled employees and payments (skilled labour) and share of unskilled workers with minimum wages. Version 2 is for one homogenous product (one sector) and the regions are autonomous in capital and labour endowments. The model contains an investment function, consumption function, exports (together demand) and prices and wages to bring equilibrium between demand and supply. The interest rate is determined by the government debt to GDP ratio and by the general external interest rate. The model is dynamic and consumption and investment are based on rational expectations from households. In general, a 30-year time horizon is used. For impact simulation, the main inputs are changes to the production factors. In short, important assumptions are: • Supply side oriented model; • Market equilibrium (CGE) (neoclassical with rational expectation elements); • Perfect competition; • One homogenous good; • Constant Elasticity of Substitution (CES) production function. This means factors of
production (labour, capital, human capital) can substitute for each other depending on the factor prices, but at a constant rate.
The model is deterministic and incorporated feedback mechanisms from supply and demand through wage and price adjustments. The model is a dynamic model. Future expectations are in the model for determination of investments and household consumption. Outcomes are yearly (in principle indefinitely, but in practice 30 years is used as time horizon) The applications of the model were in the fields of: • EU Funds impacts for Poland and impacts on Maastricht criteria (GDP, budget
deficit, exchange rate, interest rate and inflation); • Energy: introduction of CO2 trading schemes (with a different energy model added to
Mamor2). So far the model has not been used for assessing regulatory policy instruments. The main alternatives in Poland for the model are HERMIN Poland model. The model can be used for the policy areas transport (infrastructure impacts on factor productivity), energy, HR policies and subsidies and tax policies and can be used to assess economic impacts of expenditure-based interventions (investments, subsidies and taxes). For regulatory impact assessment first the impacts of regulatory changes on the production factors should be assessed. This would require a completely extra model or study. Coordination and communication type of policies are not possible to simulate with the model.

65
2. Input data – requirements, sources and challenges
Table 5.1 Input data
1 Indicators / data used National accounts data at the regional level (GDP, employment, consumption,
investments, exports, prices, wages etc. )
- Infrastructure data
- Payments to capital and payments to unskilled and skilled labour data
- For version 3: (sectoral regional version): regional input-output tables are
needed
2 Panel / cross section? Time series
3 Level of aggregation Nuts 2 (16 regions Poland)
4 Data sources National accounts, national account data Polish regions
5 Parameters Calibrated
The main challenges regarding data are the infrastructure data to generate the estimation of the regional physical capital stocks and the division between skilled and unskilled labour. 3. Outcome variables The main outcome variables of the model are: • Production (GDP) ( national and NUTS 2); • Employment (national and NUTS 2),; • Public debt (national); • Interest rate (national); • Exchange rate (national); • Wages and prices (national and NUTS 2). 4. Strengths and limitations Key strengths of the model are: • Simplicity and easy and quick to implement: the requirements for implementing one
run are limited. Most of the time is creating the right inputs for the model and checking the outcomes. For one simulation total time might be about 1 working week. Technically running time is only maximum 40 minutes;
• Extra modules in the model to convert variables to EU and Maastricht indicators (GDP, public deficit, public debt etc);
• Software easy to use; • Small data requirements; • Supply side well incorporated and feedbacks on prices and demand. Weaknesses are: • Monetary block is missing (so interest rate and exchange rates highly exogenous); • Labour supply block is missing (no labour market in detail withy population and
labour force etc); • Human capital is modelled in a simple way no details between skill levels or
professions. Whereas this input variable (supply side production factor) is modelled with two skill levels, the output employment variable of the model only has one

66
average skill dimension. Employment is inherently an output variable as it is determined by both labour supply and demand;
• It is a macro model based on production function: all additions to the same production factor have the same effect (a new road from nowhere to nowhere has the same effect as a road with many users and time savings).
Some of the weaknesses could be overcome as it is possible to expand and detail the model further. Expansions are possible in the areas of: • Addition of a monetary block; • human capital refinements (blue collar, white collar, skill levels); • labour market refinements: gender, age cohorts; • sectoral refinements (more sectors). 5. Links to other methods The first version of MaMor2 was based on the simple dynamic CGE models of the World Bank. It could be useful to expand the model with methods for deriving the inputs for impact simulations with this model: studies about the impacts of regulatory changes on production factors or prices etc. 6. Relevant references Relevant references are: • PhD Thesis of Mr. Tomasz Kaczor; • Model MaMoR2 Informacje o konstrukcji i załoŜeniach, Tomasz Kaczor, 2006
(Paper about MaMor2 in Polish); • Paper about MaMor3 version (upcoming in Autumn 2009); • Ministry of Regional Development Reviews of MaMor2 and HERMIN (in Polish); • Regular papers paid by the Ministry of Regional Development in Poland. 7. Applicability at EU level The model is in principle applicable at EU level. As the model is small and simple, the data requirements are limited and quite easy to fulfil for other countries. The applicability of the model is good for expenditure-based interventions (investments, subsidies, taxes). However, for typical EU policy instruments, such as regulation and coordination and communication, application possibilities are limited or would require additional methods. The main conditions for application at the EU level would be that statistics from national accounts are available at the regional level across EU countries. For version 3 (sectoral regional version) there is a more problematic condition that regional input-output tables would be required (and these are seldom available in the Member States). A challenge for application at EU total level is the difference between small open economies in the EU and large, more closed economies. Additionally, labour markets tend to function differently across the EU which might impose limitations for the creation of an overall EU model. The model developer is interested in possible roll out across EU and in testing the model.

67
5.2.3 Method example: VERM (Finland)
This model was selected as an interesting example for in-depth review as it is a recent, state of the art and detailed regional CGE model. The model has been used for various Finnish government policy analyses to estimate economic impacts, including regional employment impacts. 1. Background, theoretical basis and key design features The VERM regional CGE model of the Government Institute of Economic Research in Finland (VATT) is based on and linked to the nationwide CGE model VATTAGE, also developed by the VATT. The VERM model is based on the Australian TERM regional CGE model with some MONASH74-model type dynamics. This means that the dynamics in the model can be run in a recursive way or by expectations about the future (forward-looking expectations). Thanks to the extremely extensive and detailed data availability in Finland, the inclusion of different types of indicators and issues is impressive and the VATT has a long track record of running models. The model divides Finland in to 20 regions according to the NUTS 3 level specifications. Further, the model includes data for some 72 LAU 175 level sub-regions. The model is run using the GEMPACK program. Some of the main features of the model features include: • The model has as main input categories intermediate products and primary factors of
production (labour, capital and energy); • Constant Elasticity of Substitution (CES) and Transformation production function; • A Keynesian oriented demand for goods and services function (consumption, exports,
investments etc); • Heterogeneous products for industries and multi-industry products; • Domestic and foreign demand specification for goods and services and imports from
two main sources, the EU and the rest of the world; • Explicit government demand; • Inclusion of direct and indirect taxes, margins and local and national government
budgets; and • The model is dynamic with exogenous labour supply, gradual wage adjustments and
endogenous unemployment determination. The dynamic features have been introduced with three main channels connecting the time periods: 1. Accumulation of fixed capital; 2. Accumulation of financial claims; and 3. Lagged adjustments mechanisms, especially for labour markets. The speed of adjustments depends on: 1. Rate of capital depreciations at industry level; 2. The rate of adjustment on returns to capital; and
74 MONASH-model is a dynamic CGE model developed at the Centre of Policy Studies in Monash University. 75 LAU1 refers to level 1 of Local Administrative Units (LAU) defined for the EU for statistical purposes.

68
3. The rate of adjustment on real wages, where in the Finnish model sluggish adjustment is assumed.
The model has been used for various Finnish government policy analyses76 including in the following policy areas: 1. Income distribution and social benefits; 2. Education policies; 3. Regional policies; and 4. Taxation and VAT policies. The model is very suitable for application in the fields of budgetary policy instruments (taxation, subsidies, investment). Due to the presence of cost and price variables by industry, the model can in principle be applied for regulatory policy instruments, but input studies on the effects of such instruments on costs or prices of firms are needed. The resources needed to run the model depend on the type of analysis needed and whether or not the model needs to be changed in someway for the analysis. In case the model can be used as it is, the modelling and analysis will take only few days. However, in case the model needs to be adjusted for the analysis, the time needed for it can be months (depending on the level of changes needed). In general, the update of the model database takes considerable work every year (many man months). 2. Input data – requirements, sources and challenges The data for the model is gathered mostly from the official statistics of the Statistics Finland, which are of the most detailed datasets in the world. The raw data from the statistics is available for some 200 industries (and 900 products) in national level, to some 80 industries (products) in regional level and for some 40 industries in sub-region (LAU 1) level.
Table 5.2 Input data
1 Indicators / data used (Regional) Input-output tables, National accounts (e.g. on capital stock,
industry level production, taxes, financial accounts), (regional and industry
level) Employment and production data, Government income and costs per
region, Region governments budget and annual reports, other studies (e.g.
GTAP for Armington elasticities and for inter fuel elasticities)
2 Panel / cross section? Cross-section, time series
3 Level of aggregation NUTS 3, NUTS 4 (LAU 1) in regional level
4 Data sources Statistics Finland, other studies
5 Parameters Calibrations and external estimations
76 The VERM model has been used only for Finnish policy analysis, but similar types of models are in use in various other
countries as well. See below the links to other models.

69
3. Outcome variables The main outcome variables of the model include e.g.: • GDP and income changes for representative households and government (totals) at
the NUTS3 level; • Welfare changes; • Employment changes (and unemployment) by sector and region; • Changes on regional and national budgetary items (such as government income,
social transfers, transfers to municipalities, public sector deficit, etc.); • Production effects on industry level; • Changes on prices; • Changes in investments; • Change on foreign trade; and • Changes to energy production. 4. Strengths and limitations Key strengths of the model are: • Thanks to the VERM model methodology77, the number of regions can be relatively
easily extended (though until now the largest models have still only around 30 regions)78;
• Vast number of outputs and possibilities for different types of policy analyses; • Extensive presentation of labour markets; • Inclusion of various government budgetary items and social transfers; • Inclusion of energy production and other environmental indicators (makes possible
also environmental policy analysis); • Relatively flexible programming code and possibilities to change the model (for
different policy issues and time frames); • Transparent of coding and possibilities for very detailed post-simulation analysis; • Allows the replication and explanation of historical developments in the economy; • Public statistics use; and • Long history of the VATT on modelling and estimations. Weaknesses are: • The relatively extensive structure of the model can make it difficult to use without
extensive experience; • Relatively large data needs and human resources needed to keep the model up-to-
date; • Calibration is essential for the validity of the results and; • Several parameters are calibrated and not empirically estimated. 5. Links to other methods The VERM model is related to both the Australian The Enormous Regional Model (TERM) and the MONASH model. The TERM model has also been used as basis for the
77 The VERM methodology divides the regional input-output data in to 2 matrixes instead of 1, which makes the expansion of
industries easier and the modelling faster. 78 Wittner and Horridge (2007), CGE modelling of the resources boom in Indonesia and Australia using TERM, 51st annual
conference of AARES, 2007
70
regional CGE models in Brazil, China, Japan and Indonesia (in addition to Australia and Finland). Similarly, the Australian Monash model also used as the basis for VERM, is used in various other countries, ranging from the USA to China, South Africa and Denmark. The MONASH model has been used in many economic policy impact assessments, including analyses of changes in taxes, tariffs, environmental regulations and competition policy. 6. Relevant references • COPS (2008) MMRF: Monash Multi-regional forecasting model; A dynamic multi-
regional applied general equilibrium model of the Australian economy, Centre of Policy Studies, Monash University
• Honkatukia, Kinnunen & Marttila (2009), Väestön ikääntymisestä johtuvien julkisten kulutusmenojen kasvun rakenteelliset vaikutukset / Anticipating the regional effects of an ageing population: a dynamic CGE analysis for Finland, VATT (Government Institute for Economic Research, Finland)
• Honkatukia, Juha (2009), VATTAGE – A dynamic, applied general equilibrium model of the Finnish economy, VATT
• Wittner and Horridge (2007), CGE modelling of the resources boom in Indonesia and Australia using TERM, Centre of Policy Studies, Monash University, Paper presented in 51st annual conference of AARES, New Zealand
7. Applicability at EU level The VERM model is relatively extensive and excellent for certain budgetary and regulatory policy analyses. Furthermore, the original TERM model used for the basis of the model has also been used in other countries, as has the MONASH model. Hence, there is a possibility to extend the model type for various other countries. Even though the model includes a flexible means for introducing new regions, in practice there is no model with more than 30 regions included. Therefore, an application that would cover all EU27 countries in one model at a regional level is still most likely not possible, or would require extensive further research. However, the development of the model for each EU country could be possible. Due to the vast number of equations and variables included in the model, the creation of such a model for new countries would be rather timely and expensive. The inclusion of the public sector accounts in the depth that the Finnish model has could be also difficult in other countries (due to data limitations), but on the other hand the model is relatively easily changeable (especially to limit the aspects included). Overall, due to the considerable data requirements the applicability of the model for EU27 level analysis is considered limited at least in the short term. The model developer would have interest in rolling out the model to EU27 level, especially with the possible help of Australian modellers.
5.2.4 Method example: RegFin (Finland)
The RegFin model was selected as an interesting example for review as it is a recent, state of the art and detailed sectoral and regional CGE model, with government activities well
71
represented. The model has been applied in numerous Finnish government policy analyses to estimate economic impacts, including regional employment impacts. 1. Background, theoretical basis and key design features The development of a Finnish CGE model was started in 1985 in the Helsinki University Ruralia Institute and later in 1998 the RegFin, a Finnish regional CGE model, was developed by Prof. Törmä together with Dr. Rutherford. Currently there is both a static and dynamic version of the model available. The model has been developed mainly in the Ruralia Institute by Prof. Törmä with some international cooperation, including with the Polish Academy of Sciences. Future cooperation with with Hirosaki University in Japan has been planned. Recently, there have been efforts to develop "RegFinDynBio" - a dynamic version of the model with inclusion of the energy sector. The RegFin model is being applied to the EU27 level for analysis of rural development in a project for DG AGRI. In this application a rural application (CAPRI model) will be linked to the CGE models for agricultural policy analysis. The regional model includes also the 20 Finnish regions (NUTS 3 level) and 27 sectors for each region. The model can be used both in GEMPACK and in GAMS programs. Some of the main assumptions/model features include the following: • The model tends to market equilibrium on the relevant markets (has a neoclassical
orientation); • Production functions with so-called constant elasticity of scale (CES); • Labour markets are defined at national, sectoral and regional levels and
unemployment is derived; • Local and national budgets, taxation, subsidies and transfers (including transfers to
households from the government) are included as variables; • The model assumes a small open economy framework for trade; • Regional net migration of the population is included in the model. The dynamic features are presented in a recursive way. The model has been used for over 25 studies relating to regional and rural policy. The main clients have included e.g. various Finnish ministries, but also private clients. For example the following policy areas have been studied with the model: • Tax policies; • Social benefits policies; • Agricultural policies; • Infrastructure policies; • Regional policies; • Mine investments; and • Industrial policies. The model is useful for applications for budgetary policy instruments (taxation, subsidies, investment). Due to the presence of cost and price variables by industry, the model can in principle be applied for regulatory policy instruments, but input studies on the effects of such instruments on costs or prices of firms would be needed.

72
2. Input data – requirements, sources and challenges As the Finnish Statistics provides regional data in NUTS 3 level (also some official data is available in LAU 1 level), the RegFin model is used with this. In the EU27 level, NUTS 2 level data could be used in the model for regional analysis.
Table 5.3 Input data
1 Indicators / data used 2002 Regional input-output tables, Other official regional statistics, National
accounts
2 Panel / cross section? Cross-sectional, time series
3 Level of aggregation NUTS 2 and 3, LAU 1
4 Data sources Statistics Finland
5 Parameters Calibration (from 2002 structure dataset), estimations
3. Outcome variables The main outcome variables of the model include • Regional GDP impacts; • Impacts on regional and sectoral employment • Change in regional unemployment rate; • Impacts on household income; • Migration figures, persons; • Impacts on wages; • Impact on consumer prices; • Changes in exports and imports; and • Impact on various taxes (e.g. payroll taxes, VAT, etc.). 4. Strengths and limitations Key strengths of the model are: • Vast potential for social and employment analysis (inclusion of employment,
unemployment, migration, social benefits, etc.); • Easy usability of the model; • Flexibility and easy modification possibilities; • Relatively easy access required data (public data). Weaknesses are: • Dependence on regional input-output tables for calibration and their late updates; • A relatively small main team behind the model meaning that it there can be delays in
making changes to the model or running it for specific projects; • Need to rely on macro-projections for the baseline; • Simple application to foreign trade (only domestic and general foreign demand and
supply specified, no specification on the foreign trade partners); • Several parameters are calibrated and not empirically estimated; • Due to the limited resources in the institute at the moment for modelling, total CGE
analysis with the model takes several months (although this time already includes adjustment of the model for the specific task). Furthermore, the update of the databases takes several weeks every year.

73
5. Links to other methods The Polish Academy of Sciences has created a Polish version of the model for 16 regions and 15 sectors per region. Furthermore, there is also a plan to make a Japanese version of the model (with Hirosaki University). 6. Relevant references • Törmä, Hannu and Rutherford, Thomas (1998), Regional computable general
equilibrium model for Finland, Kemi-Tornion ammattikorkeakoulun julkaisuja • Kinnunen, Jouko (2007), Dynamic version of the RegFin regional model – practical
documentation, University of Helsinki, Ruralia Institute • Törmä, Hannu and Zawalinska, Katarzyna (2007), Technical description of the CGE
RegFin/RegPol models, Helsinki University, Ruralia Institute • Rurali Institute website: http://www.helsinki.fi/ruralia/asiantuntijapalvelut/regfin.htm 7. Applicability of the REGFIN model at EU level The model is relatively easy to replicate for other countries. It has good usability for employment and social impact analysis. Moreover, the model offers numerous possibilities for analysis of different types of policies. In addition, the data requirements should be relatively easy to fill with the Eurostat NUTS 2 level data (though some additional sources might also be needed). Within the project for DG AGRI, work has already been undertaken to extend the model to the EU27 level (although mainly for agricultural applications). While it would seem to be relatively easily to develop the the RegFin model for each EU27 Member State, it could be difficult to change it to include all regions of the EU27. Hence, the best applicability in EU27 level would involve developing the model for all EU27 countries. Furthermore, the current assumption of a small, open economy would need to be changed for larger economies. The development of the model for all Member States would also take considerable time and resources. The model developers are interested in possibilities to further extend the model for EU level use with some partners
5.2.5 Method example: RAEM Model (Netherlands)
The RAEM model is an interesting, originally Dutch, regional CGE model which estimates regional production and employment and income impacts of policies at quite a detailed level in the Netherlands. The model is also included as an example because it is currently being developed into an EU wide model as part of a DG REGIO project. 1. Background, theoretical basis and key design features The RAEM Model was developed in 2000 by the University of Groningen and TNO-Inro. Important developers of the model are Jan Oosterhaven, Thijs Knaap, Cees Ruijgrok and Lóri Tavasszy. The latest update of the model has been done by TNO Inro in cooperation with TML in 200779. The structure of the model has been refined in order to include international trade and the governmental sector. The model is currently also applied in the 79 See http://www.tmleuven.be/project/raem/RAEMFinalreport.pdf

74
Netherlands Environment Assessment Agency (Planbureau voor de Leefomgeving, PBL). RAEM was mainly developed for the purpose of estimating indirect economic impacts of transport policies on regions in the Netherlands. For this reason the model is in principle more focused on impacts in terms of GDP, productivity and aggregate employment rather than on redistributive effects. The model is a typical spatial CGE model and incorporates elements of the New Economic Geography theory developed by Nobel Prize winner Paul Krugman. The model uses a combination of Dixit-Stiglitz varieties and monopolistic competition. Production is based on a CES production function and output prices are set as mark-up over costs. The mark-up is a function of the number of operating firms in an industry and substitution elasticity between various product varieties produced by the production firms. The number of operating firms is determined endogenously in the model. Transportation costs are explicitly modelled as part of the costs functions. Consumers maximise utility based upon goods and services (and the variety of goods and services). The New Economic Geography theory is embedded in the model through (external) economies of scale; the larger the variety of goods and services the higher is the productivity of firms and the more utility this generates for consumers. The model incorporates 14 industries and each industry produces one variety of goods. The model contains feedbacks as prices bring equilibrium between regional demand and supply. Moreover, the model is based on interregional input-output tables so as to allow for inter-regional trade between the industries. RAEM can procure outputs for 40 NUTS 3 regions in the Netherlands. Besides interregional trade the model also takes into account regional unemployment, migration and commuting between the regions. Commuting is modelled based on search and matching labour market model of Pissaridis. Unemployment is due to temporal mismatch between the vacancies and unemployed. The model has been mainly applied for estimating the regional economic impacts of transport policies in the Netherlands. The assessment of the economic impacts of the plan for a high speed railway between Amsterdam and Groningen is the most published application. Recently the model has been applied by the Netherlands Environment Assessment Agency (Planbureau voor de Leefomgeving) for estimating the regional economic impacts of congestion in the Netherlands. In 2008-2009 TNO Inro has applied the model in order to assess the regional economic impacts of several important road investment projects in the area around Amsterdam. In 2009 the model has been applied for assessment of the regional economic effects of flooding of the Rotterdam area. The main alternatives for the model in the Netherlands are REMI-NEI model (ECORYS), REGINA (Louter) and Mobilec (Rijkswaterstaat Limburg). The model is most suitable for applications in the area of transport policies because transportation costs are explicitly modelled. In principle the model can be applied in policy areas with important impacts on costs of industries (such as transport and environmental policies). RAEM is most suitable for investments, taxes and subsidy policies which affect production costs and prices. RAEM has an explicit modelling of the
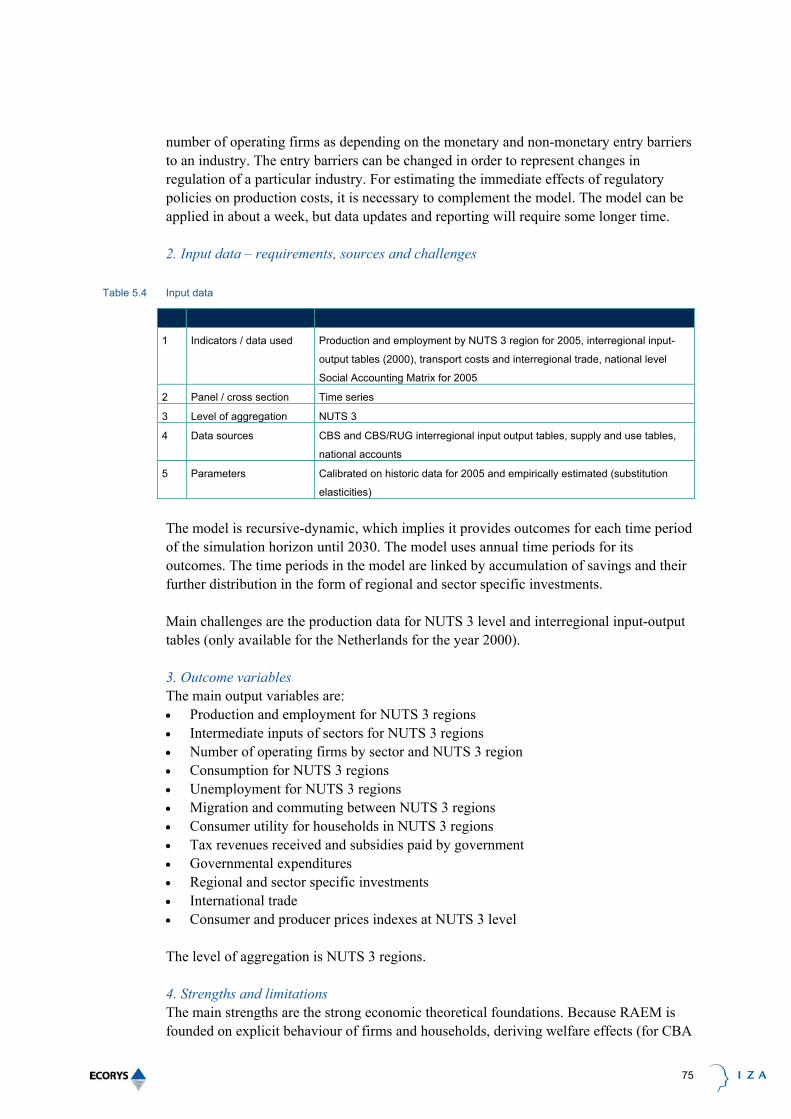
75
number of operating firms as depending on the monetary and non-monetary entry barriers to an industry. The entry barriers can be changed in order to represent changes in regulation of a particular industry. For estimating the immediate effects of regulatory policies on production costs, it is necessary to complement the model. The model can be applied in about a week, but data updates and reporting will require some longer time. 2. Input data – requirements, sources and challenges
Table 5.4 Input data
1 Indicators / data used Production and employment by NUTS 3 region for 2005, interregional input-
output tables (2000), transport costs and interregional trade, national level
Social Accounting Matrix for 2005
2 Panel / cross section Time series
3 Level of aggregation NUTS 3
4 Data sources CBS and CBS/RUG interregional input output tables, supply and use tables,
national accounts
5 Parameters Calibrated on historic data for 2005 and empirically estimated (substitution
elasticities)
The model is recursive-dynamic, which implies it provides outcomes for each time period of the simulation horizon until 2030. The model uses annual time periods for its outcomes. The time periods in the model are linked by accumulation of savings and their further distribution in the form of regional and sector specific investments. Main challenges are the production data for NUTS 3 level and interregional input-output tables (only available for the Netherlands for the year 2000). 3. Outcome variables The main output variables are: • Production and employment for NUTS 3 regions • Intermediate inputs of sectors for NUTS 3 regions • Number of operating firms by sector and NUTS 3 region • Consumption for NUTS 3 regions • Unemployment for NUTS 3 regions • Migration and commuting between NUTS 3 regions • Consumer utility for households in NUTS 3 regions • Tax revenues received and subsidies paid by government • Governmental expenditures • Regional and sector specific investments • International trade • Consumer and producer prices indexes at NUTS 3 level The level of aggregation is NUTS 3 regions. 4. Strengths and limitations The main strengths are the strong economic theoretical foundations. Because RAEM is founded on explicit behaviour of firms and households, deriving welfare effects (for CBA

76
studies) on consumer utility and firms outputs is straightforward. Also the market equilibrium tendencies are strong points of the model. Important limitations of the model are the lack of details on the labour market such as skill levels and occupation types. This might prevent getting realistic results for particular policies related to the development of human capital and education. The model substitution of elasticity parameters are empirically estimated; however there are quite some parameters which are calibrated (not empirically estimated) on data for a single year. The model is quite detailed in its regional level, which might pretend too much precision of forecasts for densely economic NUTS 3 regions. RAEM could be further developed by expanding the representation of labour market and commuting. For example one can distinguish different skill levels and population groups. It can incorporate the representation of different income groups with their specific consumption patterns. Production functions of the model can be further developed by incorporating the elements of endogenous growth theory. One can also include emissions as a part of the model. Representation of housing market can be improved by explicit modelling of housing prices and housing developments. 5. Links to other methods The model has links to other CGE and NEG models, such as the models of Bröcker (1998) and Venables and Gasiorek (1996). 6. Relevant references • A survey of spatial economic planning models in the Netherland, Netherlands
Institute for Spatial research, 2005 • On the development of RAEM: The Dutch Spatial General Equilibrium Model and its
first application to a new railway link, Jan Oosterhaven, Thijs Knaap, Cees Ruijgrok and Lóri Tavasszy, Paper presented to the 41st Congress of the European Regional Science Association, Zagreb, August 29 – September 1, 2001.
• RAEM: version 3.0, see full report on http://www.tmleuven.be/project/raem/RAEMFinalreport.pdf
7. Applicability of RAEM model at EU level The model structure is applicable at EU level. DG REGIO has launched a research project to attempt to do this, which is currently being undertaken by a consortium led by TNO-Inro. The main objective of the DG REGIO study is to develop a prototype and a system of regional models for a chosen set of European regions. The developed model will be further used in order to perform an ex-ante impact assessment of the European Cohesion policy for the period 2014-2020. The model will also be used for ex-post evaluation, other policy simulations and comparison between policy scenarios. In these impact assessments, the focus is on impacts on production, income and employment. The model is less suitable for addressing social or redistributive impacts between groups (see above). The constructed model will incorporate the following important features: • Link regions within a New Economic Geography framework;
77
• Have inter-temporal dynamic features with main endogenous growth engines; • Incorporate public sector interventions; • Incorporate a multi-level governance system. The first version of the model should be ready by the end of 2009 and will include five EU countries (Poland, Hungary, Slovakia, the Czech Republic and Germany). The model will be further extended to the rest of EU in 2010-2012. The main challenges (or conditions) for roll-out are the data regarding regional input-output tables, calibration of parameters and the more general question of whether one structure for the whole EU (especially at the regional level) is appropriate given the differences in structural characteristics of the countries and the regional economies. Important conditions relate to data requirements and data consistency.
5.2.6 Applicability of CGE models at EU level
Most of the CGE models reviewed in the preceding sections are, in principle, applicable at the EU level. CGE models are especially interesting for assessing the production and employment impacts of investment, taxation and subsidy and regulatory policies, as the market behaviour of firms is explicitly modelled. In principle, these models are especially useful for the estimation of economic type of impacts at national and or regional level such as impacts on production, employment and income. The macro CGE models reviewed in this chapter are less suitable for estimation of redistributive effects, because the models generally incorporate only one type of representative households. However, the models can simulate redistributive effects between industrial sectors or regions. Differences in national economic structures and, especially, differences in regional economies limit the opportunities for developing one single CGE model structure for the EU as a whole. The Polish MaMoR2 model has serious drawbacks for roll-out because of its lack of detail and the lack of opportunities for sound policy applications. The reliance on one model developer also creates a dependency risk. Application of the sophisticated and detailed Finnish VERM model to cover all EU27 countries at a regional level is unlikely to be possible, as it would require extensive further research and data. However, the development of the VERM model in selected EU Member States at national level could be possible. While the Finnish RegFin model would seem to be relatively replicable for other Member States, it could be extremely difficult to modify it to include all regions of the EU27 (mainly because of the vast data requirements). Finally, it appears that the less advanced (in comparison with the Finnish CGE models) RAEM model, with a detailed regional level could be rolled out more easily, especially at the national level or possibly at NUTS 2 level. Indeed, the RAEM model is currently being developed for the EU level on behalf of DG REGIO. In general it can be concluded that the application of CGE models across the EU requires a balance to be struck between the need for simplicity and the need to incorporate the relevant policy variables (costs and prices, taxes, budgets).

78
5.3 Macro-econometric models
5.3.1 What are macro-econometric models?
Macro-econometric models are based on macro-economic theory and, in general, contain empirically-estimated consumption, investment, export and import functions for the economy. Most of these models have a more or less Keynesian demand-side orientation (sometimes with limited supply side elements). The macro-econometric methods are methods based on macro-economic data (mainly national account statistics) and usually contain econometrically-estimated parameters. The examples selected and assessed here are the HERMES macro-economic model for the Irish economy and the REMI-NEI model for Dutch regions. HERMES is a national macro-econometric model for Ireland with four main sectors. The model has quite a number of smaller spin-off models (so-called HERMIN models) in a variety of countries (including Poland, Estonia and Belgium). The REMI-NEI model is based on the group of REMI models and is a regional macro-econometric model with some supply-side and new geography elements.
5.3.2 Method example: HERMES (Ireland)
The HERMES model as an example of macro-econometric models is explored further for several reasons. First of all, the HERMES model for the Irish economy is a typical example of a state of the art, macro-econometric model with a variety of applications. Secondly the labour market and employment are important elements in the model. Thirdly, the HERMES model has been the framework for development of the EU wide HERMIN system of macro-econometric models, widely applied for assessing the impacts of EU accession or other funds in some of the new Member States. 1. Background, theoretical basis and key design features The HERMES (Harmonised Econometric Research for Modelling Economic Systems) model was originally developed by John Bradley and others for the Irish economy in the late 1980s. Since then, the model has been further developed and detailed along several lines. The model became more supply-side oriented in the 1990s and recently important changes have been made. Examples include the treatment of the services sector as partially competing on the world economy, a more detailed labour market block, changes in migration and labour supply equations and the inclusion of an energy sector module and the housing market. The main assumptions are both the typical national account identities and Keynesian demand function. However the model is also supply driven in such a way that the output of the manufacturing sector and the open part of the service sector is determined by the competitiveness of Irish industries compared to the international competitors. The model contains eleven sectors based upon the four main sectors: agriculture, manufacturing (open internationally-traded goods) and construction and energy, market services (open and closed economy) and non-market services (government, health etc). Labour and capital demand is then derived from outputs and wages and prices react on demand and supply changes. However, the model is not a CGE model, as there is no explicit CES
79
production function limiting supply and there is no return to full equilibrium again (there are permanent volume changes of policy simulations). In addition, the model does not include expectations. The model contains feedback mechanisms and is deterministic.
The HERMIN Models
The HERMIN model framework has a wide range of use in the European Union and it is based on the
multi-sectoral HERMES80 (Harmonised Econometric Research for Modelling Economic Systems) model
at EU level that was developed by ESRI for the European Commission (DG REGIO) from the early 1980s.
The HERMIN framework was designed on a simple theoretical framework because of the lack of detailed
macro-sectoral data and of sufficiently long time-series availability in the new EU Member States and
countries in Southern Europe.
HERMIN models were developed for the first accession round for Greece, Ireland, Portugal and Spain.
The main aim was to study the economic impacts of the implementation of the Single European Market
and the EU Structural Funds for these countries. Later, HERMIN models have been developed for the
12 new Member States, including Poland and Estonia. Recently, a HERMIN model has been developed
for Turkey and there are plans to develop a HERMIN model for Bulgaria.
Each HERMIN model has three broad sub-components (a supply side, an absorption side and an
income distribution side) which function as an integrated system of equations. A conventional
Keynesian aggregate demand mechanism underpins the absorption side of the model. There is some
degree of sectoral disaggregation with a supply-side sub-component helping to determine traded
(manufacturing) output as a consequence of national price and cost competitiveness. Interest and
exchange rates are exogenous to the HERMIN model, in line with the general assumption that the
cohesion economies are ‘small’ and ‘open’. The main use of the HERMIN models is for macro-economic
impacts of the single market and EU Funds. For the single market, changes result in the model through
dismantling of non–tariff barriers reflected in cost reductions for firms and shifts from the internationally
non traded sectors to the traded sectors. The effects of EU Funds are in the model simulated via
changes in physical capital stock and human capital and productivity changes.
For this study, two users of the HERMIN model have been interviewed: The Ministry of Regional
development in Poland and the State Planning Organisation in Turkey (for the latest HERMIN model).
The Polish model is a regional model (with 16 regions), whereas the Turkish model is a national model.
Both users seem quite satisfied with the model and its use for simulations regarding medium to long
term forecasts and impacts of EU Funds (subsidies, investment policy instruments). The interviewees in
Turkey see as the strong points the reputation of the model towards the European Commission and the
international standing. The main weaknesses are lack of detail (regional detail of the Turkish HERMIN
model or sectoral detail for the Polish model) and the importance of the capital stock and human capital
stock for simulations. In principle, any euro infrastructural addition to the capital stock would have
similar effects, which might not be relevant at the project level. Also it seems difficult to simulate the
effects of regulatory policies with the HERMIN model as the model does not contain a detailed sectoral
cost or price block. Especially for national HERMIN models, the models can mainly be used for macro-
simulations of the single market and large subsidy or investment programmes.
80 Regional projections and regional simulation studies does not exist in HERMES. Thus the regions are not separately
modeled. To overcome this problem, HERMREG has been developed.
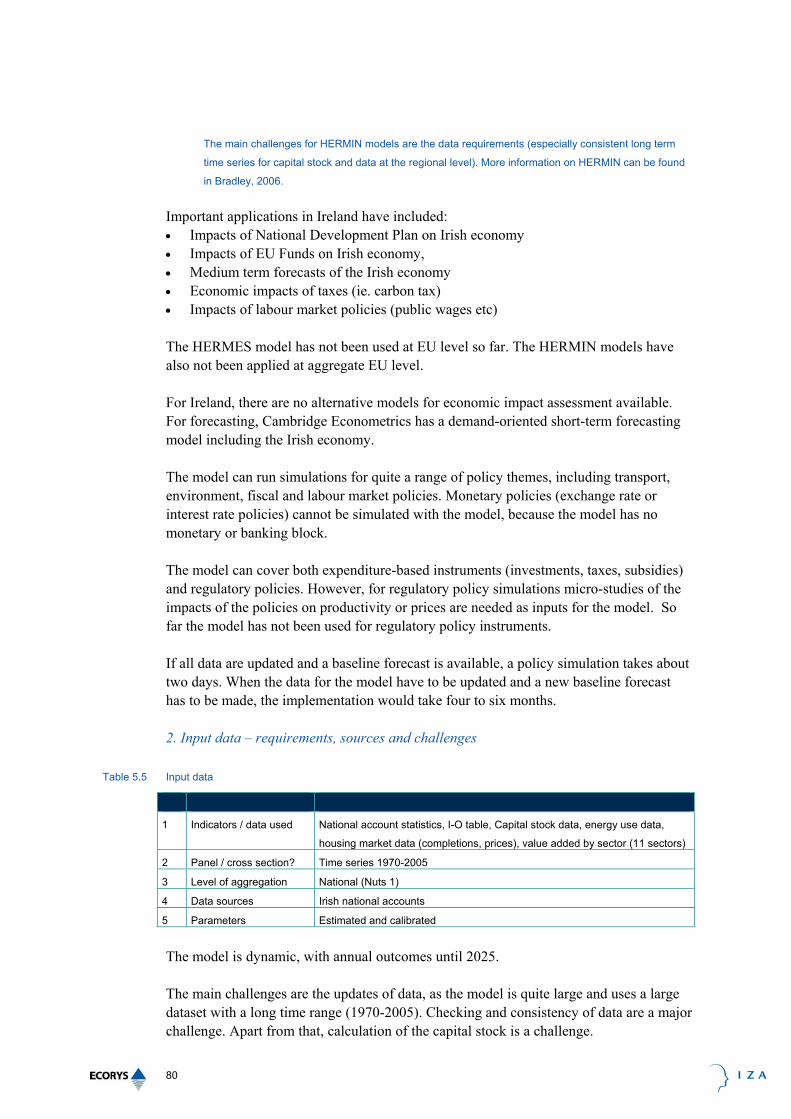
80
The main challenges for HERMIN models are the data requirements (especially consistent long term
time series for capital stock and data at the regional level). More information on HERMIN can be found
in Bradley, 2006.
Important applications in Ireland have included: • Impacts of National Development Plan on Irish economy • Impacts of EU Funds on Irish economy, • Medium term forecasts of the Irish economy • Economic impacts of taxes (ie. carbon tax) • Impacts of labour market policies (public wages etc) The HERMES model has not been used at EU level so far. The HERMIN models have also not been applied at aggregate EU level. For Ireland, there are no alternative models for economic impact assessment available. For forecasting, Cambridge Econometrics has a demand-oriented short-term forecasting model including the Irish economy. The model can run simulations for quite a range of policy themes, including transport, environment, fiscal and labour market policies. Monetary policies (exchange rate or interest rate policies) cannot be simulated with the model, because the model has no monetary or banking block. The model can cover both expenditure-based instruments (investments, taxes, subsidies) and regulatory policies. However, for regulatory policy simulations micro-studies of the impacts of the policies on productivity or prices are needed as inputs for the model. So far the model has not been used for regulatory policy instruments. If all data are updated and a baseline forecast is available, a policy simulation takes about two days. When the data for the model have to be updated and a new baseline forecast has to be made, the implementation would take four to six months. 2. Input data – requirements, sources and challenges
Table 5.5 Input data
1 Indicators / data used National account statistics, I-O table, Capital stock data, energy use data,
housing market data (completions, prices), value added by sector (11 sectors)
2 Panel / cross section? Time series 1970-2005
3 Level of aggregation National (Nuts 1)
4 Data sources Irish national accounts
5 Parameters Estimated and calibrated
The model is dynamic, with annual outcomes until 2025. The main challenges are the updates of data, as the model is quite large and uses a large dataset with a long time range (1970-2005). Checking and consistency of data are a major challenge. Apart from that, calculation of the capital stock is a challenge.

81
3. Outcome variables The HERMES model has a range of national outcome variables, mainly the national accounts data (GDP, employment, wages, prices, labour supply), value added for 11 sectors, housing market and energy use. The model can be linked to an environmental emissions module to estimate environmental emissions. The simpler HERMIN versions of HERMES also contain regional (NUTS 2) outcome variables, but for four broad sectors: see, for example, HERMIN Poland. 4. Strengths and limitations Key strengths of the model are: • It is an elaborate model, with a detailed structure; • It has a wide range of output variables; • It has a wide range of policy theme applications and simulations for different policy
instruments possible; • It include energy market simulations; • It links to the world economy model NIGEM (so simulations with world economy
shocks are possible); • It has a long track record. Limitations of the model are: • It has no monetary block, so no feedbacks on exchange rate or interest rates. This
means that the effects of especially macro- and monetary policies which could have important impacts on these variables have to be considered as very partial;
• It is a large and complex model; • It has no expectations and fixed parameters (Lucas critique); • It has high data requirements and the time required for data updates of the model is
considerable; • It has limited long term supply side general equilibrium characteristics; • There is limited possibility to expand HERMES to the regional level, due to data
requirements and complexity. This is easier with the simpler HERMIN model. Expansion / development possibilities: • Inclusion of monetary block (and endogenous interest rates, public debt etc). 5. Links to other methods The model has a link to the NIGEM model for the world economy and to the environment emissions module. 6. Relevant references • Adele Bergin, Thomas Conefrey, John FitzGerald and Ide Kearney (2009), ‘The
Behaviour of the Irish Economy: Insights from the HERMES macro-economic model’, ESRI working Paper April 2009.
• Upcoming (September), description of HERMES model 2009.
82
7. Applicability at EU level The HERMES model could be used for a wide range of EU-wide and national policy applications. The main challenges are the differences between the open and closed economies in the EU and differences in the functioning of labour markets in different EU Member States. This seems especially problematic if the objective were to develop an overall EU model, with one structure and one set of parameters. Adopting different structures for models for different type of economy within the EU would seem to be a more suitable approach, but would remain challenging. The initial data requirements and data updating remain a major challenge for the roll out of the model in other EU Member States or for EU as a whole. The conditions for application of the model at EU level would be to meet the large data requirements (providing recent, uniform and consistent data across the EU). Important conditions in this respect are long term and consistent and up to date national account statistics, I-O tables, Capital stock data, energy use data, housing market data (completions, prices), value added by sector for all EU countries. Regarding the simpler HERMIN versions, the model has already been rolled out in a number of countries (see before). However, maintenance and application of the HERMIN models varies depending on the interest, understanding and quality of the national institutes involved. ESRI is interested in rolling out and testing the HERMES model and has done this in the past for HERMIN models.
5.3.3 Method example: REMI-NEI Model (The Netherlands)
The REMI-NEI macro regional econometric model is an interesting model for review for several reasons. The model is a typical macro-econometric model, but applied at the regional level and has an explicit labour market block with regional wages and employment as important outcome variables. Moreover, the model is now applied in a range of EU countries and has recently been applied for assessing regional employment impacts of EU Funds and new EU directives. 1. Background, theoretical basis and key design features The original version of the REMI model was developed at the University of Massachusetts in 1977. In later years, it was extended into a model that could be generalised for all States and counties in the US using a grant from the National Cooperative Highway Research Program. Since 1977, literature on the model, extensions and estimation of equations have been produced in international articles (see references). REMI Inc detailed the model for the United States and for a number of States within the country. In the last five years, in addition to the Netherlands, the REMI model has been developed for several countries and regions in Europe. The REMI-NEI model for the Netherlands was developed by REMI Inc and ECORYS and applied by ECORYS. The REMI model has recently been applied for the UK as a whole (by ECOTEC), for Scotland, and for the Walloon region (by the Walloon planning bureau), for southern Italy and Spain (by the European Commission) and for Nordrhein Westfalen (by RWI) in Germany.

83
The REMI- NEI model is a macro-econometric model designed for analysing the effects of policy on regional economic structure. It integrates macro-econometric Keynesian characteristics with limited structural elements of the supply side, input output models, and new economic geography insights. The model is dynamic, with forecasts and simulations generated on an annual basis and behavioural responses to wage, price, and other economic factors. Key features of the model are: • It is an interregional macro-economic model with mainstream economic behaviour of
firms, consumers and employees and strong demand side modelling; • It has interregional linkages based on market shares and distance between regions; • Inter industry linkages based on the CBS input-output table of the Netherlands and
regionalized input-output tables (Treyz, 2003); • The labour market (labour supply, labour demand and wages) is modelled in a
separate block; • Consumer industry relationships are based on CBS consumer sector tables; • New Economic Geography elements (agglomeration forces) are included in the
model. The REMI- NEI model (now) contains eight regions for the Netherlands at NUTS 2 and NUTS 3 level. The model is deterministic, but contains many feedback mechanisms. In the last five years, the model has been applied in the Netherlands in a number of fields: • Transport infrastructure (regional economic impacts); • Spatial planning alternatives (economic impacts); • Forecasting of regional employment. The model has been used in the Netherlands for
forecasting regional employment based on exogenous regional population and labour supply forecasts and exogenous long term productivity by sector and labour demand forecast for the national economy;
• Environment and energy policy scenarios (economic impacts). Recently the model has been applied in the Netherlands for assessing the impacts of the European Commission Directive on New Emission ceilings (NEC) and for energy policy scenarios;
• EC Water Framework directive (economic impacts for Netherlands). The main alternative model for the REMI-NEI Model in the Netherlands is the RAEM (CGE) Model of RUG/TNO and PBL. Outside the Netherlands, there are a range of alternatives, but especially HERMES and simpler HERMIN models could be seen as rather similar alternative models. The main policy areas for which the model can be applied are: transport, environment and energy, urban development, labour market policies and fiscal policies. The model is most suitable for expenditure-based policy instruments (investments, taxes and subsidies), but is and can in principle also be applied to regulatory policies. In the latter category, the model has so far been applied in the Netherlands for environmental regulatory policy instruments. These studies focused on estimation of the economic impacts in the Netherlands of the implementation alternatives to the EU New Emission Ceiling directive, in light of a Cost Benefit Analysis, and for the EU Water Framework directive.

84
However, for regulatory policies, it is important that insights into the main direct effects of regulations on costs or prices for firms in the relevant affected industries are estimated and available, because these are the main input variables in the model for policy simulations of regulatory policies. This requires an additional study about estimating these direct effects on prices or costs for the relevant affected industries. The costs and duration of the impact assessment will increase because of this requirement. In a study about the economic impacts in the Netherlands of the EC New Emission Ceiling directive such an input study took some 3 months. Only after that the model could be applied. One run with the model would take about five working days including baseline forecast construction, creation of input variables and testing and checking the outcomes. Technically one run takes about one minute. The model software is user friendly and contains a number of graphs. However, the software is standardised and users of REMI cannot make changes in the model or parameters without support of REMI Inc in the US. 2. Input data – requirements, sources and challenges
Table 5.6 Input data
1 Indicators / data used National Account Statistics at national and regional level:
- GDP, BRP, employment, population, labour force, consumption, investment,
exports, inputs, wages, prices, national and regional input-output tables,
production consumer expenditure tables.
2 Panel / cross section? Time series
3 Level of aggregation NUTS 1, NUTS 2 and NUTS 3 level
24 Sectors
4 Data sources CBS statistics
5 Parameters Estimated and calibrated (mixture)
The model has a yearly basis (dynamic until 2030) and can be used for both forecasting and impact simulations. The main challenges for the input data are: • Regional input-output tables are constructed on the basis of the national input-output
table and the regional production structure for the Netherlands, but recent regional input-output table data are lacking.
• The transport distances based on the travel times on the infrastructure network between regions.
• Interregional trade amounts are calibrated on the basis of the regional input-output tables and the distance between the regions.
3. Outcome variables The main output variables are: • GDP, BRP, labour productivity, wages and incomes (NUTS 1, NUTS 2, NUTS 3); • Production by sector (24 sectors in the model); • Investments, consumption, exports, imports, government expenditure (NUTS 1,
NUTS 2, NUTS 3);

85
• Employment, labour force (by gender and age) and labour participation (by gender and age) (NUTS 1, NUTS 2, NUTS 3);
• Population, migration (NUTS 1, NUTS 2, NUTS 3). 4. Strengths and limitations Key strengths of the model are: • The wide range of output variables; • The wide range of possible applications (policy areas and policy instruments) due to
detailed data and structure of the model; • The diversity of elements and feedbacks in the model; • Elements of new geography are included in the model (agglomeration advantages and
disadvantages); • Interregional linkages are included in the model; • The detailed sectoral structure; • The detailed interregional transportation matrices for transport policy simulations; • It is easy to implement. Important limitations of the model are: • There are no output variables on unemployment or employment by education level; • It contains limited supply side elements. The model is basically demand oriented and
therefore has rather positive employment impacts (although it is possible to run the model in equilibrium mode where price changes temper the impacts);
• Quite a number of parameters are based on general empirical research and are not empirically estimated for the Netherlands (or Italy of Germany in these country versions);
• Regional parameters are similar; ie households react uniformly to changes across the regions;
• Regional input-output tables are estimated (due to lack of data) and interregional trade is calibrated;
• The data requirements are quite large • Users of the model are dependent on REMI Inc for changes to the model or
parameters. This can affect the flexibility of use. Key assumptions are: • Keynesian demand structure; • Cost changes are passed to prices (assumption of competitive markets); • Exogenous world economy; • No monetary block. Expansion of the model is possible along several lines: • A more detailed labour demand (by skill or education level) element could be
introduced; • Different regional structures and additional regions could be added; • Development of sub modules (energy prices etc) would be possible. 5. Links to other methods The model has some similarities with the HERMES model and the simpler HERMIN versions.

86
6. Relevant references • drs. Gerbrand van Bork en dr. Frederick Treyz, 2005, ‘The REMI Model for the
Netherlands, ‘A survey of spatial economic planning models in the Netherlands, Ruimtelijk Planbureau.
• Treyz, Frederick, and George I. Treyz. 1997. “The REMI Multi-Regional U.S. Policy Analysis Model,” paper presented at the North American Regional Science Association Meetings.
• Treyz, George I., Ann F. Friedlaender, and Benjamin H. Stevens. 1977. “Massachusetts Economic Policy Analysis Model.”
• Treyz, George I., and Lisa M. Petraglia. 2001. “Consumption Equations for a Multi-Regional Forecasting and Policy Analysis Model,” Regional Science Perspectives in Economic Analysis. Elsevier Science B.V., 287-300.
8. Applicability at EU level There is evidence that the REMI model can be applied at EU level and for regions within the EU: • Firstly, the model is already available and applied in several EU countries
(Netherlands, Belgium, Germany, UK, Italy and Spain). • Secondly, the model has been applied to assess the economic impacts of EU Funds
(in Spain). • Thirdly, the model can be used for quite a wide scope of policy themes and for
investments, subsidies and taxes and for regulatory policies. The application to regulatory policies is shown by the studies mentioned earlier on the economic impacts of implementation of EU environmental directives for the Netherlands, but did require additional input studies.
However, the model is quite similar to the macro-econometric HERMIN models which are already rolled out for many EU countries. Therefore, the value added of this model in comparison to HERMIN models is limited. Moreover, applying the same model structure for all regions within EU Member States would seem inappropriate, given the structural differences between the economies of EU Member States and regions. For regulatory policies, there is a need to use more micro oriented studies on the effects of regulatory policies on costs (or productivity) or prices of industries as inputs for the model. If the REMI model were considered for use in other Member States, the main conditions are the data requirements. Data on national account statistics, national (and possibly regional) input-output tables, regional national account type statistics have to be available. Apart from this important coefficients (for example regarding the labour market) have to be re-estimated. The main challenges in using the model thus lie in the field of data gathering across EU countries and re-estimation of core parameters. The regional sectoral data and input-output data would be the main hurdles in this respect. In general, it would also be problematic if the parameters and structure of the model remained the same for large, more closed economies such as France or Germany, as well as for small, more open economies such as the Netherlands or Belgium.

87
5.3.4 Applicability of macro-econometric models at EU level
The applicability of macro-econometric models at EU level for Member States (country level) is good. At country level, national account statistics are available from Eurostat. The applicability is especially good in areas such as budgetary policies (investments, taxation, subsidies) and there is some potential to apply such models for regulatory policies, although input studies on price effects for firms are needed. The applicability of this type of model has been demonstrated by the HERMIN models rolled out in the EU (and Turkey). However, when it comes to the regional level, data requirements become more problematic, especially regional input-output tables. As HERMIN has already been rolled out in several Member States, the roll out of another macro-econometric model would appear to have limited added value.


89
6 Conclusions and recommendations
6.1 Conclusions
The study demonstrates that ex-ante assessments of employment and social impacts are carried out at Member State level, but that the methods used are often basic in nature – with some exceptions. One of the main reasons for the apparently limited sophistication of social impact assessment methods appears to be a lack of political commitment to the importance of social impact assessment among commissioning authorities (mostly government departments) and, associated with this, the limited budgets and time made available to undertake detailed analysis of the issues at stake. This generally weak demand works against the development of more sophisticated methods and models. Furthermore, there is no well-established tradition of "impact assessment" in the social research community – on the supply side. Methods and models are therefore not always readily available to meet the requirements of real-world social impact assessment in a policy-making environment. A gap exists between "theory" and "practice" in social impact assessment. The country research confirms that guidelines and requirements in the area of (social) impact assessment have been developed in several Member States, often within a specific policy focus, such as poverty (Ireland), equality (UK), or regulatory burdens (Austria). However, the extent to which these guidelines and requirements are systematically applied in policy analysis appears to be limited. In addition, as noted in Germany, but also to some extent in France, as well as in some other Member States, policy preparation can be a rather 'closed' process, where outside providers of impact assessment expertise (e.g. research institutes) are frequently not involved in policy making. Ministries of Finance, in particular, tend to have their own, "in-house" methods and models, which are used in the budgetary preparation process, but often not beyond. There are currently important limitations to the capacity of methods and models to assess redistributive and regional employment impacts at the EU level in a comprehensive manner. Indeed, model builders and users have pointed to various and significant hurdles when it comes to up-scaling existing methods to the EU level. Common barriers are the major data requirements, especially when regional-level outcomes need to be assessed, strong differences in the functioning of national and regional economies, labour markets and institutional contexts and differences in the way methodological and modelling expertise is organised in different Member States. In selecting methods of Impact Assessment at EU level, a balance needs to be found between sophistication and practicality. Another, more general, key conclusion is that, irrespective of the methods

90
selected, all social impact assessments require a thorough understanding of the policy initiative being proposed, the markets in which it intervenes and the social groups it may affect. Based on the above limitations, we can conclude that it is often too ambitious to attempt a comprehensive, EU-wide analysis of the social impacts of particular policy options. It may be better to assemble evidence through a case-by-case approach focused on particular regions or Member States. Indeed, many of the models analysed are specific for particular regions and countries and only a few can be used for the EU as a whole. The most practical solution to a lack of EU-wide coverage is in-depth research on 'typical' target groups or regions – allowing expertise and experience from the ground to be fully integrated into the assessment. The institutional context of the methods and models themselves is essential for their sustainable application. It is important that a method, or especially a model, is linked to an established research institution which maintains and develops it over time. The experience with micro-simulation models in general, and with EUROMOD in particular, demonstrates the importance of exchange of good practice and the development of a vibrant 'community' - which exceeds the knowledge and skills of any one individual or institution.
6.2 Recommendations
For practitioners of social impact assessment 1. The need to step up efforts in social impact assessment. Within the context of an
advanced system of Community Impact Assessment, the social pillar of impact assessment work has received relatively little attention to date. This is a concern, as good EU policy making requires a full and balanced overview of impacts – in advance of final decision-making. It is important that it is known in an early stage when specific target groups or regions are affected by such policy initiatives. For this, more methodological work is required to further develop social impact assessment.
2. Take a structured but pragmatic approach towards quantification/monetisation: The
Roadmap presented in this report can be a valuable tool for structuring IA work. A key element of this Roadmap is the staged approach – where causal chain analysis is recommended as a tool for scoping social impacts, prior to use of any quantification tools.
3. Invest time in the proper choice of methods and models beforehand. Nothing is more
frustrating than to carry through an assessment on the basis of inappropriate methods or models. As such, time should be invested in assessing the strengths and weakness of alternative methods. This report and the Roadmap could be seen as a tool in this process.
4. Explore data availability in an early stage. Many methods and models which may be
interesting from a theoretical point of view may not be applicable in practice due to the limited availability of disaggregated data at the EU level. Early exploration of
91
data availability, for instance by using the Guidance provided for assessing social impacts within the Commission Impact Assessment system, is strongly recommended.
5. Make better use of ex-post evaluations: Impact assessments are often carried out
under time pressure, and there can be limited scope for additional data collection. Much can be gained by making use of the results from ex-post evaluations of related or relevant initiatives, which dealt with employment and social impacts. Ex-post evaluations can be particularly useful for identifying indirect and unintended impacts, but also for establishing key ratios that can be used in the methods and models described in the main report.
For policy makers in the impact assessment system 6. Stimulate demand for social impact assessments; the best way to promote the
development of social impact methods and models is to stimulate demand, by raising standards and expectations. At the level of the Commission, further support from the Secretariat General and Impact Assessment Board is required, whereas DG EMPL is well placed to support other DGs with such assessments in their respective areas. At the level of Member States, the European Commission as a whole should also consider ways to encourage and stimulate greater assessment of social impacts. Peer review sessions between Member States – such as the meeting held in Bratislava in late 2008 – could be held more regularly.
7. Disaggregated data requirements are the most common barrier for assessing social
impacts at EU level, especially when time series are required. In light of the short timeframes available for Community IAs, it is often difficult to collect ad hoc data for impact assessments. Based on the Guidance provided for assessing Social impacts within the Commission Impact Assessment system, it is therefore important to further develop the overview of EU-wide disaggregated data sources and promote the collection of EU-wide data (including such sources as household surveys and labour market surveys). For this reason, cooperation between DG EMPL and EUROSTAT and contributing to the EUROSTAT work programme will be of vital importance.
8. The Commission is well-placed to develop an EU-wide community of practice in
social impact assessment, where practitioners, policy makers, dedicated independent or government institutes, social partners, sectoral social dialogue committees, experts and model builders can exchange and compare. The PROGRESS programme could provide powerful support to develop such an initiative. Calls for proposals should however be focused on specific issues, such as employment or income effects, social exclusion, access to services, or specific target groups (e.g. minorities, women, the disabled). Such a community of practice could also play a stimulating role in promoting social impact assessment at the Member State level.
9. Explaining and communicating (social) impact assessment methods. As discussed in
a recent seminar on the topic81, external stakeholders often consider Community Impact Assessment to be a black box – both in terms of process and methods. The
81 ECORYS "Ways forward for Impact assessment", Brussels, 22nd September 2009.

92
Impact Assessment process itself, as well as the findings arrived at, need to be better explained. Experts from the Impact Assessment community should invest more time in explaining their methods and in ensuring that their findings address the questions that policy makers have; greater transparency about the criteria used to rank options in terms of impact is also required. This is especially important in the social area, where stakeholders play a prominent role.
10. The Commission is recommended to be prudent in directly supporting the supply
side, especially in terms of active and direct support to any new models ('picking winners'). After all, several models to assess social impacts with EU aspirations have already seen the daylight. At this stage, some competition between methods and models can be considered healthy, as long as there is a level playing field. There appears to be no reason for the Commission to back the full development of any new model without being clear about its value added compared to already existing models. Furthermore, all such models struggle with the same major challenges – in terms of data collection and the modelling of institutional frameworks.

93
PART B – APPLYING THE METHODS
The three chapters in Part B each present a hypothetical EU-level policy proposal in a different policy sector and consider which methods could be used to assess the potential regional employment and redistributive effects of the policy proposed. Each case study involves three stages: A Identification of potentially relevant methods or models, on the basis an initial
assessment of the types of impact expected from the policy proposal. This stage follows the logic of the roadmap presented in the previous section.
B "Testing" results, by considering in more detail how the different methods selected could be applied in the policy case specified and the respective strengths and weaknesses of each method. This assessment remains theoretical, as, for obvious reasons of time, resources and practicality, it was not possible to run models or implement methods in the scope of this study.
C Drawing conclusions about the most appropriate methods for assessing regional employment and redistributive effects in the case examined.
The three policy cases are: 1. Further liberalisation of the aviation ground handling market – a regulatory proposal
in the transport sector. 2. Workfare – a solution to the welfare trap? – an initiative in the field of social affairs,
which would most probably take the form of a recommendation to Member States within the scope of the Open Method of Coordination.
3. Tighter requirements for the energy efficiency of buildings – a regulatory proposal in the field of energy and climate change.


95
7 TRANSPORT: Further liberalisation of the aviation ground handling market
7.1 Introduction
Ground handling in airports is of importance for the efficient handling of passengers and freight and mail air transport. Ground handling services include both airside and landside services. Landside services are passenger-related services, such as ticketing and baggage handling at the check-in desks and freight and mail related storage and transport. Airside services comprise services such as ramp handling, fuelling and de-fuelling operations, aircraft maintenance and the provision of catering services to the aircraft.
7.2 A. Identification of the methods / models
7.2.1 Problems to be addressed
Put simply, most liberalisation policies aim to change a situation with limited competition into a more open, competitive market. The idea is that more competition on a market will result in lower prices for consumers and a higher quality of products or services. This is only true if the market is able to function well: i.e. if it fulfils a number of conditions, such as clear ownership rights, absence of substantial economies of scale or externalities, no barriers for entry of new companies and sound market supervision. In the policy case selected, the idea is essentially the same. The policy case objective is to increase the competition on the market for ground handling in airports. Already in October 1996, the EU Council adopted a directive to liberalise the market for ground handling services in the EU. This directive concerned services in the areas of baggage handling, ramp handling, fuel and oil handling and freight and mail handling. Until that moment, services such as baggage handling and ramp services at most EU airports were supplied by monopolies. These monopolies were operated by the airport authority or the dominant carrier at the airport. Airlines complained about the relatively high cost of ground handling services at EU airports and the quality of service. The Directive 96/67/EC82 sought to establish complete freedom for both self handling and third party handling.
82 Council Directive 96/67/EC on access to the ground handling market at Community airports.

96
The directive's aim was to increase the number of handlers for the services by fixing some minimum conditions for airports with more than two million passengers and/or 50,000 tonnes of freight. The directive binds Member States for all services that at least one of the handlers should be entirely independent from the airport and the dominant carrier at that airport. Similar limitations were introduced for self handlers (which mean that airlines provide the ground handling services for themselves), for which a threshold of 1 million passengers or 25,000 tonnes of freight. For these services at least two air carriers should be admitted in the airport. In the Commission's airports package of 2007 an evaluation of the 1996 directive was undertaken (EC, 2007) and more recently in 2009 a study by Airport Research Center was published (ARC, 2009). In consultation rounds airports indicated that the directive had already achieved its objectives to a large extent. However, airlines call for more significant action as they still perceive ‘excessive invoices and suboptimal standards of service’83. The European Parliament has also stated the wish for a revised directive, which allows for more liberalisation. The European Commission is currently developing a proposal for amendment of the directive. For this research project, a policy case is established for the further liberalization of the airport ground handling. However, the policy case does not reflect specific Commissions intentions and any resemblance with Commission ideas is a coincidence. For the purpose of this study, a proposal for an extension of the directive on ground handling is assumed to overcome the following problems: • High costs to airlines for ground handling activities in airports • Poor quality service (for airlines and passengers) • Lack of transparency with risk of airport operators abusing dominant position by
operating ground handling
7.2.2 Key aspects of policy
The policy case should be regarded as a hypothetical extension of the directive 97/67/EC. Based on the report from the Commission of 2007 and a recent study on the impact of directive 97/67/EC by Airport Research Center (ARC, 2009), a policy case is developed regarding increasing the competition for ground handling services for major airports in the EU. The main issues are: • Although in general the number of suppliers has increased, this is not the case for all
airports; • Prices of handlers are in some cases still seen as sub-optimal; • Sharing and transparent setting of the user charges for central infrastructure and
installations; • Transparent procedures for procurement and selection of service suppliers; • Clear quality standards for suppliers.
83 European Commission, 2007, Report from the Commission on the application of Council Directive 96/67/EC of 15 October
1996.

97
In relation to these issues we propose the following measures for the policy case:
1. An extension of the directive 96/67/EC to larger and medium-sized airports (above 10 million passengers per year) and prescribing more than two ground handlers for the services at these airports (except for fuelling of aircraft services). This implies that especially the EU top 31 of 2007 would be affected (see table below);
2. Reduction of entry barriers for ground handlers by prescribing equal access to infrastructure and airport installations;
3. Guidelines for a transparent user charging system for centralised infrastructure facilities and supervision of the implementation of these guidelines by national competition authorities;
4. Procurement of the services in line with European Procurement rules.
Table 7.1 List of relevant top 31 airports in EU (passengers over 10 million in 2007) with passenger numbers.
Airport in EU Number of annual passengers in millions in 2007
1. London / Heathrow (UK) 67.85 2. Paris / Charles De Gaulle (FR) 59.55 3. Frankfurt (Main) (DE) 53.86 4. Madrid / Barajas (ES) 51.21 5. Amsterdam / Schiphol (NL) 47.76 6. London / Gatwick (UK) 35.17 7. München (DE) 33.82 8. Barcelona (ES) 32.74 9. Roma / Fiumicino (IT) 32.37 10. Paris / Orly (FR) 26.42 11. London / Stansted (UK) 23.76 12. Milano / Malpensa (IT) 23.63 13. Dublin (IE) 23.20 14 Palma De Mallorca (ES) 23.17 15. Manchester (UK) 21.89 16. København / Kastrup (DK) 21.29 17. Wien / Schwechat (AT) 18.72 18. Stockholm / Arlanda (SE) 17.90 19. Düsseldorf (DE) 17,78 20. Brussel-Bruxelles / Brussels (BE) 17.74 21. Athinai / Eleftherios Venizelos (GR) 16.53 22.Malaga (ES) 13.57
23 Lisboa (PT) 13.39
24 Berlin Tegel (DE) 13.33
25. Helsinki Vantaa (FI) 13.15
26. Hamburg (DE) 12.69
27. Prague (CZ) 12.36
28. Köln-Bonn (DE) 10.40
29. Nice Cote D’azur (FR) 10.29
30. Stuttgart (DE) 10.27
31. Las Palmas Gran Canaria (ES) 10.04

98
Expanding the directive to smaller airports under 10 million passengers was not considered. The reason for this is that economies of scale do matter for ground handling services and that at small airports more competition and lower market shares for suppliers implies a lower scale of companies. Therefore economies of scale might imply lower impacts or even less efficient ground handling if done by 2 or 3 parties for small airports. As can be seen, both the airports of Schiphol (Amsterdam) and Vantaa (Helsinki) would be affected by the hypothetical policy case. In the case study, more will be elaborated on methods for these airports and airport regions. An alternative for the extension of the directive is to improve the supervision and regulatory measures of competition authorities for the existing ground handlers. However, this might create a need for wider responsibilities of the national competition regulatory authorities in relation to the transportation sector, airports and setting of penalties in case of high profit margins or bad services. As this is regarded as quite a complex issue this alternative policy is not further examined in this study.
7.2.3 Objectives and constraints
The objectives of the policy case are: • To increase the number of third party handlers; • To increase price competition and reduce costs for airliners and in the end to
passengers and freight customers; and • To increase service quality. Important constraints for the policy are both additional institutional aspects (e.g. lobbying of social partners) and imperfect markets. Regarding institutional aspects, the lobby of the ground handlers organizations (existing incumbents) and labour unions against extension of the directive might be strong. More competition could reduce profit margins for the existing handlers and result in lower wages. Employers and labour unions might oppose the policy. Imperfections on the market for ground handling services create other constraints. First of all, economies of scale can play a large role, as the services are quite standardized and technical equipment allow for economics of scale. In the case of large economies of scale, aiming at two or three ground handlers at smaller airports might result in less efficient ground handling instead of more efficient ground handling. In addition, entry barriers will probably exist because of the economies of scale which favour (large) existing handlers. Moreover, absence of regulations regarding infrastructure sharing (cargo terminals, luggage belts, check in desks etc) can reduce effective competition and might lead to dominant suppliers. In this respect extension of the directive has to go hand in hand with regulations regarding the use of the airport infrastructure. Finally, if airlines have dominant positions on the relevant airport, this may act as a constraint to passing on cost reductions to passengers and freight customers. This will probably be more likely for smaller airports, or in case of alliances or price agreements between the airline carriers.

99
7.2.4 Identification of direct impacts
First of all we need to define the difference between direct and indirect impacts. In line with welfare theory and CBA, we will use the causality between markets affected. Direct impacts of a policy are defined here as the effects on the directly affected market or on the direct objectives of the policy. In this case, one of the most essential assumptions is that the direct impacts include an increase in the competition on the costs and prices in the market for ground handling, aviation and the transport market as a whole. Indirectly affected markets are defined as those effects on the labour market and other markets or sectors. In a partial analysis, the researcher would focus only on the direct effects, whereas in a general equilibrium analysis, all other markets and redistributive or social effects are analyzed as well. Comparison to the counterfactual or baseline scenario Effects of the policy case can only be estimated compared to a baseline scenario, the counterfactual without the policy case. The first question to assess therefore is whether competition on the ground handling market for the relevant airports in the EU would change anyway, without implementation of the new policy. For simplicity reasons it is assumed here that the number of suppliers of handling services would remain constant with implementation of the new policy. The baseline trend for costs (including wages), profit margins, prices and employment on the market for handling services and aviation market in the EU also has to be assessed first. It could be assumed that these variables would develop according to the trend in inflation and employment in the future without the new policy. The effects of the policy on competition, costs and prices have to be viewed as differences to these trends. The main expected direct impacts of more third party handlers (increased competition) compared to the baseline development are then: 1. Lower prices through lower profit margins or costs of ground handling The idea is that more suppliers on the market for ground handling will result in more competition and therefore either cost reductions (more efficiency in operations) or reductions of profit margins (less monopolistic competition). These effects will only hold true if: i) entry of newcomers can take place, thus no large entry barriers exist and ii) there are no substantial economies of scale. In the case of substantial economies of scale in ground handling services, the third party handling might result in lower market shares, lower scale and therefore less efficiency (and higher prices). Analysis of the actual market structure, imperfections and situation in the ground handling market is crucial for proper estimation of the direct effects. More efficiency in operations (higher productivity) can result in lower employment and work pressure in the ground handling sector. This indirect effect on the labour market will be described under the indirect effects. Lower prices of ground handling services can be passed on by airline companies to passengers and freight customers in lower prices. This will happen under the condition that there is sufficient competition between airlines or, differently stated, that the price elasticity of airline suppliers is larger than the demand elasticity for passengers (or

100
freight). In the case of dominant carriers at an airport, the reductions in costs might not be passed on and can only result in higher profits of airline companies. Analysis of the actual market structure, imperfections and situation in the airline market for a variety of airports is crucial for justification of passing on of effects to end customers. The situation will differ by airport; some airports are dominated by one home carrier, whereas other airports have more competition between airlines. 2. Higher quality of services More competition can result in better quality of services if competition takes place on both prices and service quality. If competition only takes place on the basis of costs, than quality effects might even be negative. This will depend on the situation on the market of the airline companies. If competition between this carriers is highly price competitive (as is the case for example for low costs carriers for tourist passengers and freight), then the effects on improving quality might be limited and most effects could be on lower prices. The situation will differ by airport. Some airports mainly target low cost carriers, while other airports have more flights for business travellers. Therefore, the pass-on effects will be different depending on the character of the airport and competition between carriers. 3. Costs of implementation of the directive Implementation of the EC directive has several direct costs related to transposition of the directive into national law and supervision, which should be compared in the impact analysis against the considered economic benefits. These costs consist primarily of administrative and legal costs for transposition and supervision by national authorities and airport management. 4. Effects on aviation security More suppliers could in principle have a negative effect on aviation security, as more parties have access to critical airport infrastructure and aircrafts. Both internal safety (staff safety, safety in the airport) and external safety (aircraft accidents etc) could in principle be affected. However, according to an evaluation report of the Commission (EC, 2007), no indications were found that the number of handling parties had an impact on the security requirements for airports. Potential effects on the labour market and social aspects of this will be described under the indirect impacts. For this reason we will disregard this effect here.
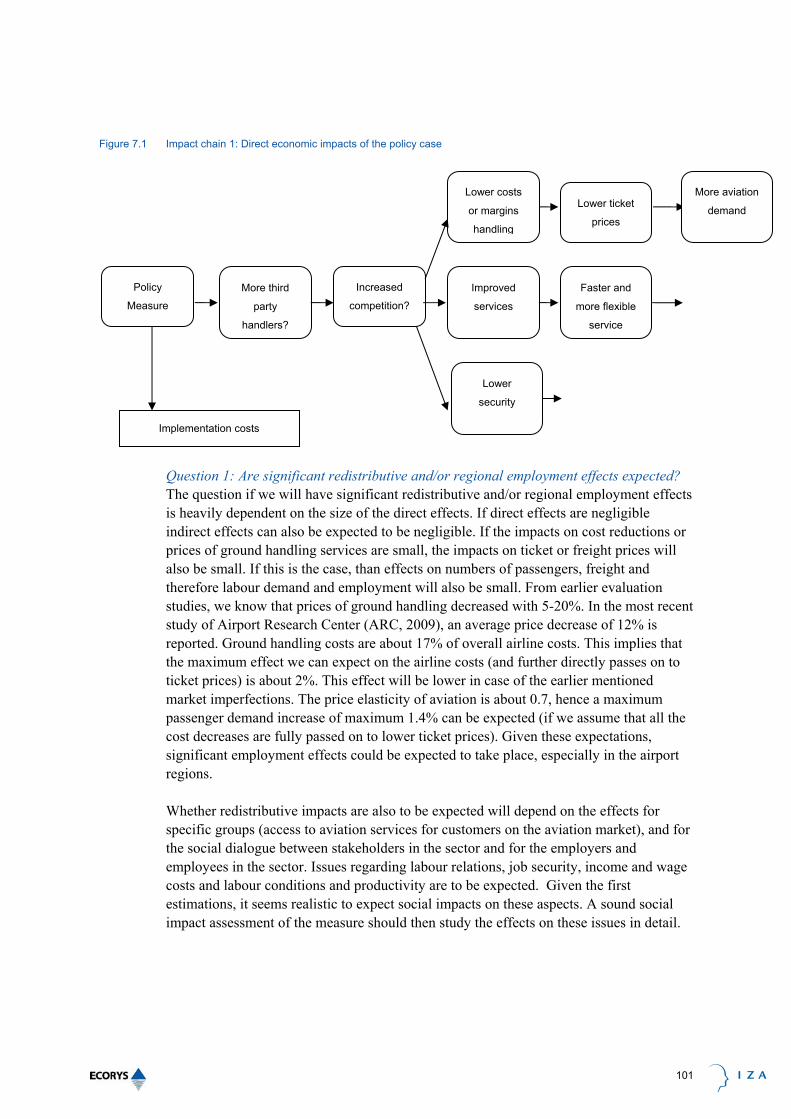
101
Figure 7.1 Impact chain 1: Direct economic impacts of the policy case
Question 1: Are significant redistributive and/or regional employment effects expected? The question if we will have significant redistributive and/or regional employment effects is heavily dependent on the size of the direct effects. If direct effects are negligible indirect effects can also be expected to be negligible. If the impacts on cost reductions or prices of ground handling services are small, the impacts on ticket or freight prices will also be small. If this is the case, than effects on numbers of passengers, freight and therefore labour demand and employment will also be small. From earlier evaluation studies, we know that prices of ground handling decreased with 5-20%. In the most recent study of Airport Research Center (ARC, 2009), an average price decrease of 12% is reported. Ground handling costs are about 17% of overall airline costs. This implies that the maximum effect we can expect on the airline costs (and further directly passes on to ticket prices) is about 2%. This effect will be lower in case of the earlier mentioned market imperfections. The price elasticity of aviation is about 0.7, hence a maximum passenger demand increase of maximum 1.4% can be expected (if we assume that all the cost decreases are fully passed on to lower ticket prices). Given these expectations, significant employment effects could be expected to take place, especially in the airport regions. Whether redistributive impacts are also to be expected will depend on the effects for specific groups (access to aviation services for customers on the aviation market), and for the social dialogue between stakeholders in the sector and for the employers and employees in the sector. Issues regarding labour relations, job security, income and wage costs and labour conditions and productivity are to be expected. Given the first estimations, it seems realistic to expect social impacts on these aspects. A sound social impact assessment of the measure should then study the effects on these issues in detail.
Policy
Measure
More third
party
handlers?
Increased
competition?
Lower costs
or margins
handling
Improved
services
Lower ticket
prices
Faster and
more flexible
service
Lower
security
More aviation
demand
Implementation costs
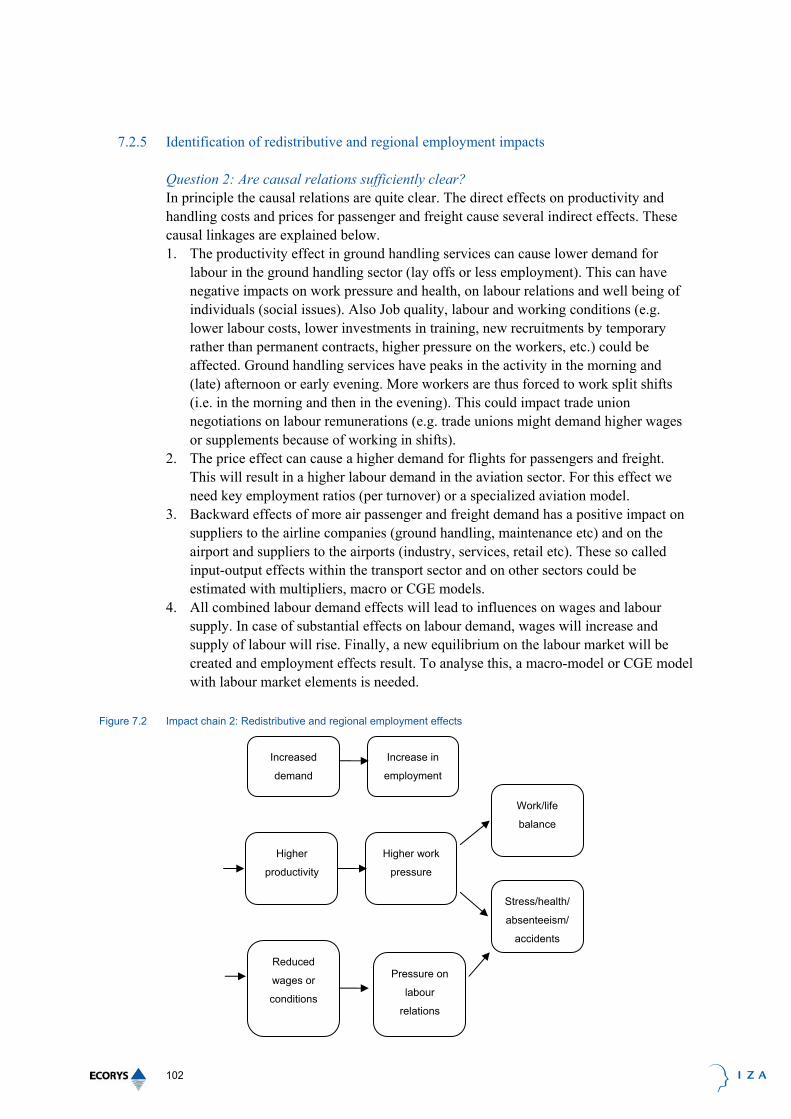
102
7.2.5 Identification of redistributive and regional employment impacts
Question 2: Are causal relations sufficiently clear? In principle the causal relations are quite clear. The direct effects on productivity and handling costs and prices for passenger and freight cause several indirect effects. These causal linkages are explained below. 1. The productivity effect in ground handling services can cause lower demand for
labour in the ground handling sector (lay offs or less employment). This can have negative impacts on work pressure and health, on labour relations and well being of individuals (social issues). Also Job quality, labour and working conditions (e.g. lower labour costs, lower investments in training, new recruitments by temporary rather than permanent contracts, higher pressure on the workers, etc.) could be affected. Ground handling services have peaks in the activity in the morning and (late) afternoon or early evening. More workers are thus forced to work split shifts (i.e. in the morning and then in the evening). This could impact trade union negotiations on labour remunerations (e.g. trade unions might demand higher wages or supplements because of working in shifts).
2. The price effect can cause a higher demand for flights for passengers and freight. This will result in a higher labour demand in the aviation sector. For this effect we need key employment ratios (per turnover) or a specialized aviation model.
3. Backward effects of more air passenger and freight demand has a positive impact on suppliers to the airline companies (ground handling, maintenance etc) and on the airport and suppliers to the airports (industry, services, retail etc). These so called input-output effects within the transport sector and on other sectors could be estimated with multipliers, macro or CGE models.
4. All combined labour demand effects will lead to influences on wages and labour supply. In case of substantial effects on labour demand, wages will increase and supply of labour will rise. Finally, a new equilibrium on the labour market will be created and employment effects result. To analyse this, a macro-model or CGE model with labour market elements is needed.
Figure 7.2 Impact chain 2: Redistributive and regional employment effects
Higher
productivity
Increased
demand
Increase in
employment
Higher work
pressure
Reduced
wages or
conditions
Work/life
balance
Pressure on
labour
relations
Stress/health/
absenteeism/
accidents
103
7.2.6 Focus for assessing redistributive and regional employment impacts
After all direct and indirect impacts (including redistributive and regional employment impacts) of the policy case are identified an important dilemma is whether to estimate the indirect impacts or not. In order to answer this dilemma the researcher first has to assess two aspects: Question 3 Are the direct impacts potentially significant enough to justify estimation of the indirect effects (including redistributive and regional employment impacts)? As mentioned already, the indirect effects such as impacts on regional employment or the relations on the labour market are caused by the direct effects. This implies that it is only necessary to estimate indirect effects if the size of the direct effects is large enough to justify passing on to indirect markets (such as the labour market) or to redistributive effects. For this policy case some significant effects on prices and demand are expected (see before). If price or cost changes are expected to be insignificant then indirect effects can not be expected and do not have to be further considered. Question 4 Are any significant economy-wide or regional economy-wide and redistributive impacts of the policy case to be expected? For this dilemma the researcher carefully has to assess whether she or he expects relevant impacts on regional employment and redistributive (social) effects for certain groups. The causal analysis of the impact relationships is crucial for this. For these reasons, outcome variables have to be carefully identified for the policy case. The main impacts expected in this policy case are already explained under the Question 1. Question 5 Do we expect employment market failure and structural unemployment in the baseline scenario (without the new policy) and is the policy likely to affect these? Regarding if potential structural employment impacts are to be expected, the relevant labour market segment has to be analyzed. Only in case of market failure on the relevant labour market and a baseline scenario of future unemployment, can a justification for employment effects be made. For example, for this policy case, the labour market for the education and skill level of workforce for ground handling has to be analysed (probably low skilled labour). If the labour market for ground handling is expected to have persistent labour shortages in the future, it is very unlikely to have substantial negative employment effects of the policy case. Or if the labour market functions perfectly in this segment, wage adjustment would bring always equilibrium between demand and supply and the policy will not change this equilibrium fundamentally. This implies that a justification for structural employment effects of a policy can only be justified if persistent market failure and unemployment in the relevant segment on the labour market is expected.

104
Question 6 Is the focus more on long term supply side indirect economic impacts or more on short/medium term demand side indirect economic impacts? If the focus is more on short or medium term demand side effects (on production and labour demand) in the transport sector and economy wide, then macro-econometric methods are preferable. If the attention in the research is on long term supply side effects on the labour market and economy, then CGE methods are to be preferred.
7.2.7 Methods to be considered
For the issue of which methods to consider for the estimation of the indirect impacts of the policy on employment and redistributive effects some additional considerations are relevant for assessing the suitability of methods. If the impact analyst has answered the question that he expects some significant indirect impacts at the level of employment or social effects, the next consideration is to assess the level of these impacts. Question 7: What is the most important level of outcomes? The outcomes for the direct impacts are mainly relevant at the level of the ground handling and aviation sector. That implies that for assessing the direct impacts we either need methods specifically focusing on the ground handling and aviation sector in the EU Member State or across some EU Member States out of the list in the table of affected airports. These methods could be for example ex-post evaluations of previous measures based on surveys or interviews or an economic model specifically constructed for the ground handling and aviation sector. An alternative is to use simple elasticity’s and key ratios, as we did above for this case. The relevant level of the indirect effects is more difficult to assess. Regarding the labour market and employment effects in principle both national and regional level and both sectoral level (aviation sector, transport) could be relevant. However, we are dealing with a specific part of the transport sector which is often regionally concentrated around the airports and has an important role in the regional economies of airport regions. That implies that the regional level is of high importance for the research. The national level will only be relevant for employment if expectations are that the regional effects are substantial and interregional linkages are very important. For the redistributive effects, the main impacts are expected regarding the employees and employers in the ground handling sector. This sector is concentrated in and around the airport so a focus on these two groups in the airport region is justifiable. For the methods this means that the focus is on the following level of outcomes: Regional employment in ground handling and aviation (transport sector): This implies we could consider regional employment methods where prices, costs and production variables are incorporated for the transport sector. The following methods could be relevant for assessing the regional employment impacts: 1. Regional CGE models with explicit transport sector and costs or prices and
production and employment in the transport sector and input-output relations with

105
other sectors. The disadvantage of all these models is that ground handling and aviation branches are mostly not explicitly modelled.
2. Regional macro-econometric models with explicit transport sector and costs or prices and production and employment in the transport sector and input-output relations with other sectors. The disadvantage of all these models is that no ground handling and aviation branches are explicitly modelled.
3. Micro economic methods at the level of firm behaviour in the ground handling and aviation sector. A game theoretic or competition model, or simple demand-supply employment model could be used for assessing both price and employment effects of more competition in the ground handling sector. In the overview of regional impact methods, such specific models have not been identified so far. However, specifically for the research on effects of more competition in these sectors such a model could be constructed and seems most appropriate given the specificity of the ground handling and aviation branches. .
4. Simple methods based on key elasticities, key ratios and multipliers. The main redistributive impacts are expected on the labour market in the specific ground handling (wages, productivity, job quality, work pressure etc). As there are generally no specific employees - employers social impact models available for this specific sector, the researcher will have to rely on ex-post evaluations, surveys or interviews with stakeholders in the sector. Question 8: what quality level of the impact study is expected? Finally, for the choice between using either sophisticated macro or CGE employment or micro firm level models or using some key elasticities/ratios/multipliers, the quality level of the impact study is important. The higher the quality required for the study, the more sophisticated the method should be. 1. Regarding the macro-methods the following regional macro models were identified
and shortlisted in stage 2 of the project: the HERMIN models and the REMI-NEI model. However, the HERMIN model does not contain the transport sector explicitly, so is not discussed further.
2. Regarding the CGE methods, the following models were identified and shortlisted: RAEM, VERM, Regfin and Marmor2. As only the VERM model has a detailed enough sector collection, this model is considered for the analysis. Section 9 will explain the selection of the specific CGE model more carefully.
3. For the micro methods, no micro model of firm behaviour in the ground handling market has been identified in stage 2 of this project. For this reason, we are not able to test this method type. However, given the specificity of the impact research considered for this policy case such models would be the optimal solution.
4. Elasticities, key ratios and multiplier method: this method is easiest to implement and very suitable in this case. If, however, a very rigorous impact study is required, this approach is less suitable, given its more basic nature.
Interim conclusion: In principle, a micro-economic method (model or game theory approach) with specific firm behaviour on the ground handling market is considered as most appropriate given the specific sectoral level of this policy case. Regional macro-econometric (eg. REMI-NEI) or CGE methods (VERM, RAEM) might be considered only if significant direct impacts

106
and national or regional economy wide impacts are expected and there is a requirement for a very rigorous impact study.
7.3 B. Testing results
7.3.1 Assessment of method 1: REMI-NEI model
1. Key design features The REMI-NEI model could be used for this impact assessment for assessing the regional employment impacts of the policy case for Schiphol airport for the region of greater Amsterdam in the Netherlands. The REMI-NEI model could in principle be suitable for several reasons. First of all, the regional level contains the relevant region surrounding Schiphol airport. Secondly the transport sector is explicitly modelled. Thirdly costs, prices and employment variables are available in the model for the greater Amsterdam region. The REMI- NEI model is a structural macro-econometric regional economic model. It integrates macro-econometric Keynesian characteristics with limited structural elements of the supply side, input output models, and new economic geography insights. The model is dynamic, with forecasts and simulations generated on an annual basis and behavioural responses to wage, price, and other economic factors. 2) Input data required For this policy case the following input data in the REMI model are required. First of all we need to know the weights of production, employment of ground handling and aviation in the total transport sector in order to translate the direct effects to input variables in the transport sector in the model. Changes in the prices or costs in the ground handling and aviation sectors are then adjusted for the transport sector as a whole and changed as inputs in the model. For the complete set of inputs, see the second interim report.
1 Indicators / data used Production costs transport sector
Price transport sector
Production transport sector
Employment transport sector
Wages
Productivity transport sector
2 Panel / cross section? Time series
3 Level of aggregation Regional
NUTS 1, NUTS 2 and NUTS 3 level
24 Sectors
4 Data sources National accounts, I-O table, regional accounts CBS
5 Parameters Estimated and calibrated
3) Transmission mechanism and outcomes These price reductions in the transport sector will cause in the REMI model a gain in market share of the region and increased production in the aviation and transport sector as

107
a whole. Through the sectoral input-output linkages suppliers in other sectors will produce more goods and services. Moreover through the interregional trade other regions (mainly trading with the affected sectors) will also benefit, but some other regions might loose as well as their relative price competitiveness is negatively affected. More production in the airport region Greater Amsterdam has a positive influence on the demand for labour in the region (especially for low skilled workers). However if a productivity effect is inserted in the model in the ground handling sector some negative effects on employment in the region might also occur. The resulting overall labour demand change (which can be positive or negative) will induce wage adjustment, but will also influence labour participation and labour supply. Depending on the wage adjustments a new equilibrium will result with a higher (or lower) employment in the Greater Amsterdam region. The overall effect on employment will depend on the balance between the negative productivity effect in the ground handling market and the positive effect of lower prices on the aviation market. As the number of jobs in the aviation sector normally outweighs the number of jobs in the ground handling sector it is likely that overall employment effects will be positive. The main outcomes are therefore changes in: • National and regional production transport sector, other branches and totals • National and regional employment transport sector, other sectors and totals • National and regional wages • National and regional productivity transport sector, other sectors and totals 4) Demand The model has been used to simulate effects of production costs changes in other sectors before. Recently the model has been applied in the Netherlands for assessing the impacts of the European Commission Directive on New Emission ceilings (NEC) and for energy policy scenarios. Both these directives have direct impacts on the costs of production for specific sectors (energy, chemical industry, transport) and simulations have been undertaken. The model was quite appropriate for this. 5) Strengths and limitations Apart from the general strengths and weaknesses mentioned in the second interim report specifically for this case the following issues are important. Key strengths of the REMI model for this policy case are: • Explicit incorporation of transport sector in Greater Amsterdam region (Schiphol
airport region) • Prices and costs of transport sector in Greater Amsterdam region can be adjusted • Input-output effects to other sectors and other regions in the Netherlands can be
shown • Explicit modelling of regional labour demand and supply and wage adjustment.
Employment and wage changes can be presented for both the Shiphol airport region and the Netherlands as a whole
Weaknesses in respect of this policy case are: • No explicit modelling of ground handling or aviation branch

108
• The transport sector as a whole might have different reactions to prices or costs than the specific ground handling or aviation sector (different elasticities)
• The model contains limited supply side elements (and not for aviation sector). The model is basically demand oriented and therefore has rather positive employment impacts (although it is possible to run the model in equilibrium mode where price changes temper the impacts);
6) Conditions/assumptions for use Important assumptions for use of the model for this policy case are: • Price decreases in ground handling are passed on to customers and the same is true
for aviation ticket and freight price changes. • The transport sector as a whole will not have too different reactions to prices or costs
than the specific ground handling or aviation sector (no different elasticities) 7) Budget and timing aspects A run and brief report of the indirect employment impacts of the policy case would amount to 10,000-20,000 euro. The time needed would be around one Month. 8) Links with other methods/models The main relation is with the method to estimate the direct effects of more competition in ground handling on prices of ground handling and aviation. If these effects are under- or overestimated then the indirect employment effects will be under- or overestimated (garbage in garbage out). 9) Overall applicability at EU level At the moment the model is available for the Netherlands (Schiphol airport region), UK (greater London region), Germany (Düsseldorf region) and Italy (Milan region). That implies the model could be used for assessing regional employment impacts of the policy case around a number of airports in the EU. Main challenges are to properly estimate the direct effects on prices and costs (as inputs to the model).
7.3.2 Assessment of method 2: CGE Models
In general with regards to the applicability of CGE models for this policy analysis the following points should be kept in mind: • CGE models can capture well the spin-off effects of policies affecting one sector on
the whole economy (i.e. other sectors and regions); • This is also their disadvantage, since CGE models work best for relatively large
policy actions. Minor changes in only one relatively small sector are not likely to create large impacts on other sectors. As mentioned in the causal-chain analysis, this policy is most likely to affect only other transport service sectors (i.e. especially aviation), but effects on other sectors are more likely to be relatively small. However, a CGE model can indeed reveal the exact magnitude of the policy impacts on other sectors;
• As the long-term impacts in this case are not expected to be very different from the relatively short term impacts, only a static CGE model would be required. Running a dynamic model would be most likely waste of money and resources;

109
• CGE models can most of the time provide all the changes on output, prices, wages and employment in every region and every sector included in the model; and
• Relatively detailed CGE model would be the best for the analysis of such a detailed policy (i.e. a model with explicit aviation sector would the best).
Hence, in short, the availability of detailed regional level sector data and possibilities for using all the data available in the model are one of the most important criteria for the selection of the specific model to be used (if CGE will be used at all). Of the specific CGE models studied earlier, the VERM model from VATT would be most suitable for this policy analysis owing to the very detailed sector selection that it has in regional level (around 80 sectors/products in regional level). Even though the RAEM model from the Netherlands has been specifically developed for transport policy analysis, the very limited number of sectors per region (and the transport sector mainly appearing via the explicit transportation costs in the sectoral costs structures) means it is not likely to be detailed enough to capture the aviation sector specifically. Similarly, the Regfin has significantly less sectors modelled in regional level (27), which is not likely to provide the needed detail level for the analysis of this particular policy, and the Mamor2 models models only 1 sector. For these reasons, the further analysis estimates the applicability of the VERM model for this fictional ex-ante policy impact analysis. However, it should be noticed that similar statistics on sectors in a regional level or as detailed regional GGE models are not available in most other EU countries outside Finland. Hence, similar analysis could be not possible in the same detail in other EU countries unless some serious work in done on building similar models in other countries with equal detail levels. Further, the aviation and ground handling sectors affect in Finland mostly only the capital region (as the other airports are too small to be covered by the directive) and hence a more detailed analysis with a less complicated model could be more efficient also in Finland. A) VERM model 1) Key design features – what are the main distinguishing characteristics of the method/model, including the origin and theoretical basis – in relation to the case. The VERM regional CGE model of VATT (Finland) is a dynamic model based on the Australian TERM regional CGE model, but has also a possibility for static modelling. The model divides Finland in to 20 regions according to the NUTS 3 level specifications and can model 80 industries (products) at this level. It has Keynesian type demand function and Constant Elasticity of Substitution production function (with the Armington assumptions) with assumption of perfect competition. Direct and indirect taxes and margins are included. The labour market is modelled with exogenous labour supply, gradual wage adjustments and endogenous unemployment determination. 2) Input data required The impact of the policy needs to be inserted on most CGE models, including the VERM, via its effects on either costs or prices. Hence, a study on the impacts of the policy on costs or prices needs to prior the CGE analysis. This in itself can already be a reason to opt for another method, since depending on the data availability, the analysis of the policy

110
in costs and prices can be cumbersome and time consuming (and needs to be done with some other method in any case). However, thanks to the ex-post study made after the introduction of the 1996 directive, there are some estimations on the impact of such policies on the market structure and costs (as explained previously). Further, as mentioned, very detailed data on the regional output and employment levels in the aviation sector are needed together with the links of this sector on other sectors of the economy. 3) Transmission mechanism and Outcomes The ground handling policy is (as pointed in the causal chain analysis) most likely to affect the aviation sector and hence, the regional employment (and unemployment) levels. The policy impacts can be inserted in the VERM model through the expected productivity and this is also the most critical assumption on this policy analysis. These changes in the productivity levels of especially aviation sector in a specific region will then affect prices and production. The expected production increase in the aviation sector will create spin-off effects on the employment and production of suppliers in other sectors and in the whole regional economic structure (and possibly even at the country level economic structure), depending on the impact magnitudes. The impacts in Finland would be assumed to take place only in the Capital region (i.e. Uusimaa region), where the Helsinki-Vantaa airport lies. The production, employment and welfare of the aviation (and larger transport sector) in this region are expected to be positively affected. Impacts on other sectors and regions employment and production levels could occur as well, but are expected to be small. The most interesting outcome variables for this analysis that can be produced by the VERM model include for example: • Employment changes (and unemployment) in sector and regional level; • Income and welfare changes in regional level; • Production effects on industry level by region; • Changes on prices; and • Changes in investments. 4) Demand The VERM model has been used earlier on the analysis of some public sector services (e.g. waste management) liberalisation in regional level in Finland. Further, in general, the Australian Monash type models have been used for competition policy analyses and also for airline sector liberalisation scenarios earlier.84 5) Strengths and limitations In addition to the general strengths and weakness of CGE models for this type of policy analysis, the key strengths of the VERM model for this specific analysis include the following: • Incorporation of the aviation sector on the regional level; • Productivity of this sector can be adjusted in regional level; • Effects on all other sectors and regions in Finland can be modelled; and 84 http://www.monash.edu.au/policy/monmod.htm

111
• Provides the wage, employment and unemployment impacts for all regions and sectors.
On the other hand, the key limitations of the model include the following: • The ground handling sector can not be modelled explicitly (however, the possibility
for aviation sector modelling is partially covering this limitation already); and • The model covers only Finland, where specific policy in question is most likely to
impact only few regions (specifically in the Helsinki region) and similar level of sector data in a regional level is not available in most other countries.
6) Conditions/assumptions for use Key assumptions of this policy analysis with the VERM model include the following: • As ground handling sector is not explicitly modelled, it is assumed that the price
decreases in that sector are passed to the aviation sector, which again will affect the aviation sector productivity; and
• The model assumes perfect competition in the production side (though this is not an impossible assumption since the competition in the aviation sector is especially nowadays relatively tough).
7) Budget and timing aspects Even thought the VERM model is relatively extensive, the modelling of such a case should not take more than few days if the analysis is done based on the productivity effects assumed earlier. Similarly, the budget required would be relatively low (for the modelling part only). However, it should be noticed again that this model can be used at this moment only in Finland (especially at this detail level) and similar analysis in other EU27 countries would naturally raise the required time and budget needs significantly. 8) Links with other methods/models Similar, MONASH type models in regional level could be considered for the analysis in other countries. However, it should be noticed again, that in practise the number and detail of sectors included in the models to be used are more important than the actual other specifications of the models (even a relatively simple model could be used in case it has the aviation sector output and employment in regional level explicitly modelled). 9) Overall applicability at EU level As mentioned, the VERM model is modelling at this moment only Finland and the data requirements of regional level data of the aviation sector is essential for the analysis. Hence, similar analysis in other countries could be possible only if they have the needed data and some other models would need to be used in these other EU countries analysis. In other words, while the model would be very good for analysing the direct and indirect impacts of such a policy, the applicability at EU27 level is still low and more similar models would need to be built in the EU. However, in example in the Netherlands, LEI has according to the VERM modellers started the building of a similar type of model.
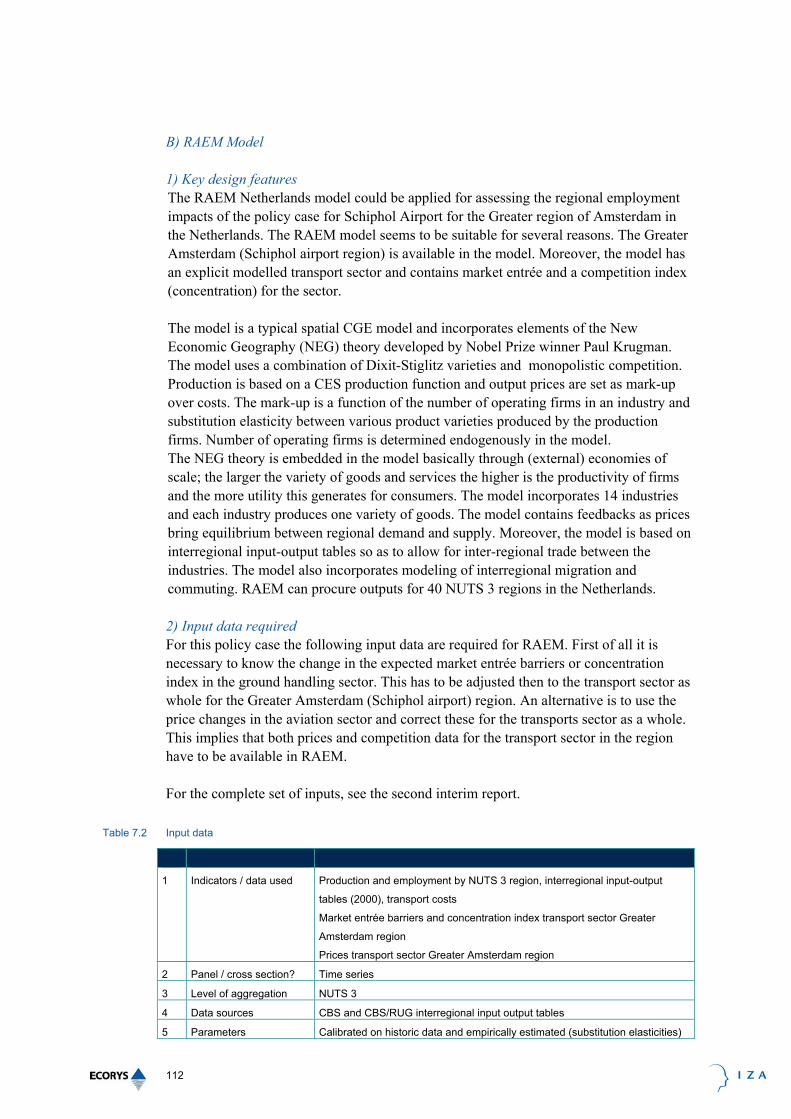
112
B) RAEM Model 1) Key design features The RAEM Netherlands model could be applied for assessing the regional employment impacts of the policy case for Schiphol Airport for the Greater region of Amsterdam in the Netherlands. The RAEM model seems to be suitable for several reasons. The Greater Amsterdam (Schiphol airport region) is available in the model. Moreover, the model has an explicit modelled transport sector and contains market entrée and a competition index (concentration) for the sector. The model is a typical spatial CGE model and incorporates elements of the New Economic Geography (NEG) theory developed by Nobel Prize winner Paul Krugman. The model uses a combination of Dixit-Stiglitz varieties and monopolistic competition. Production is based on a CES production function and output prices are set as mark-up over costs. The mark-up is a function of the number of operating firms in an industry and substitution elasticity between various product varieties produced by the production firms. Number of operating firms is determined endogenously in the model. The NEG theory is embedded in the model basically through (external) economies of scale; the larger the variety of goods and services the higher is the productivity of firms and the more utility this generates for consumers. The model incorporates 14 industries and each industry produces one variety of goods. The model contains feedbacks as prices bring equilibrium between regional demand and supply. Moreover, the model is based on interregional input-output tables so as to allow for inter-regional trade between the industries. The model also incorporates modeling of interregional migration and commuting. RAEM can procure outputs for 40 NUTS 3 regions in the Netherlands. 2) Input data required For this policy case the following input data are required for RAEM. First of all it is necessary to know the change in the expected market entrée barriers or concentration index in the ground handling sector. This has to be adjusted then to the transport sector as whole for the Greater Amsterdam (Schiphol airport) region. An alternative is to use the price changes in the aviation sector and correct these for the transports sector as a whole. This implies that both prices and competition data for the transport sector in the region have to be available in RAEM. For the complete set of inputs, see the second interim report.
Table 7.2 Input data
1 Indicators / data used Production and employment by NUTS 3 region, interregional input-output
tables (2000), transport costs
Market entrée barriers and concentration index transport sector Greater
Amsterdam region
Prices transport sector Greater Amsterdam region
2 Panel / cross section? Time series
3 Level of aggregation NUTS 3
4 Data sources CBS and CBS/RUG interregional input output tables
5 Parameters Calibrated on historic data and empirically estimated (substitution elasticities)

113
3) Transmission mechanism and outcomes Higher market entrée and higher competition in the transport sector will result in lower prices in the transport sector in the Greater Amsterdam region. This will cause more demand for transport services from both households and firms from other sectors in the region. The increase in the productivity of transport will result in an increase in production and employment in the Greater Amsterdam region. For the other regions the effects might be positive, but for some regions they also could be negative. In particular one will see positive effects in the regions, from which people commute to the Greater Amsterdam area. Remote regions of the Netherlands might have negative economic effects due to working of agglomeration forces in Amsterdam.
The main outcomes are therefore changes in: • Production and employment for NUTS 3 regions (in particular in transport sector) • Intermediate inputs of sectors for NUTS 3 regions (in particular in transport sector) • Number of operating firms by sector and NUTS 3 region • Consumption for NUTS 3 regions (in particular of transportation services) • Unemployment for NUTS 3 regions • Migration and commuting between NUTS 3 regions • Consumer utility for households in NUTS 3 regions • Tax revenues received and subsidies paid by government • Governmental expenditures • Regional and sector specific investments • International trade • Consumer and producer prices indexes at NUTS 3 level 4) Demand In 2008-2009 TNO Inro has applied the model in order to assess the regional economic impacts of several important road investment projects in the area around Amsterdam. In particular an assessment was made of the details of the transport link between Amsterdam and Almere. In 2009 the model has been applied for assessment of the regional economic effects of flooding of the Rotterdam area. 5) Strengths and limitations Apart from the general strengths and weaknesses mentioned in the second interim report specifically for this case the following issues are important. Key strengths of the RAEM model for this policy case are: • Explicit incorporation of transport sector in Greater Amsterdam region (Schiphol
airport region); • Competition, prices and costs of transport sector in Greater Amsterdam region can be
adjusted; • Input-output effects to other sectors and other regions in the Netherlands can be
shown; • Explicit modelling of regional employment effects; • Explicit modelling of regional employment and unemployment effects; • Explicit modelling of inter-regional migration and commuting; • Explicit modelling of inter-temporal effects and investments.
114
Weaknesses of RAEM in respect of this policy case are: • No explicit modelling of ground handling or aviation branch • The transport sector as a whole might have different reactions to more competition or
prices or costs changes than the specific ground handling or aviation sector (different elasticities)
• The model is comparative static, so it will not show the time path of the impacts; • Many parameters are calibrated on data for 2005 and not empirically estimated.
6) Conditions/assumptions for use Important assumptions for use of the model for this policy case are: • The model assumes monopolistic competition in all sectors (including the transport
sector); • Price decreases in ground handling are passed on to customers and the same is true
for aviation ticket and freight price changes; • The transport sector as a whole will not have too different reactions to prices or costs
than the specific ground handling or aviation sector (no different elasticities). 7) Budget and timing aspects A run and brief report of the indirect employment and unemployment impacts of the policy case would amount to € 35,000. A model run and brief impact report would need around 1.5 months. 8) Links with other methods/models A good study regarding the main direct impacts of the hypothetical directive on competition and costs and prices on the market for ground handling services and implications for aviation is essential. If the quality of these inputs to the model is not sound, than the model can overstate or understate the impacts. 9) Overall applicability at EU level At the moment the model is available for the Netherlands (including the Greater Amsterdam Schiphol airport region). The model is recently being developed at the EU level for 5 countries (interrelated national models) for Poland, Hungary, Slovakia, the Czech Republic and Germany as well as for the Benelux countries. These models contain 14 sectors at NUTS 2 regional level. However, as the airport regions are generally better presented at the NUTS 3 regional level, the applicability of the EU RAEM Models for this policy case is more limited.
7.4 C. Conclusions
From the case study, several conclusions can be drawn. Firstly, an important issue derived from the analysis is that a thorough understanding and definition of the regulatory policy proposed and the directly affected market (in this case the market for ground handling services) is crucial. As most regulatory policy instruments will be quite specific and can affect very specific markets, a proper market analysis is necessary before even considering use of any model. This policy case, being very specific for the ground handling and aviation sector, lends itself to a tailor-made specific micro or sectoral

115
ground handling or aviation model over more general macro-econometric or CGE-type of models. A more general conclusion emerging from this is that for very specific policy instrument (specific in terms of affected branches or markets) development of tailor-made methods is often to be preferred over using existing general micro or macro-methods. Only if the existing models can be refined and extended with very specific tailor-made sub-models would a combination be possible. In the analysis it is also shown that consideration of a model for capturing regional employment impacts is only useful if: a) Direct effects on costs or prices in the directly relevant affected market are
significant; b) If regional and national economy wide effects are to be expected (significant effects
on several branches or markets); c) if structural employments effects are justified based on market imperfections
(unemployment etc) on the relevant labour market; d) If the regional or national model is specific enough (regions, sector, data) for the
policy case and directly affected market in question. From the analysis it seems that three models could in principle be used in this respect because the regional detail (airports regions) and sectoral detail (transport sector) is specific enough for such a regulatory policy case. These models are REMI-NEI (Netherlands), RAEM (Netherlands and EU) and VERM (Finland). The VERM model is the most promising CGE model for the analysis and it could provide the impacts as only model on the aviation sector itself as well as other sectors on regional level, but only for Finland. RAEM and REMI can also be seen as possible applicable models, but they tend to be quite general for the specific policy case. RAEM has the advantage over REMI that market entry and competition (concentration) are explicit variables. Both models have the disadvantage compared to VERM that inputs have to be considered at the transport sector as a whole and not for the ground handling and aviation sector. The recently developed EU RAEM models have a more aggregated regional level than the Dutch version and therefore seem to be less suitable for this specific policy case.


117
8 SOCIAL AFFAIRS: Workfare - a solution to the welfare trap?
8.1 Introduction
As this study focuses on redistributive effects, as well as regional employment effects, it was considered appropriate to select an explicitly redistributive policy initiative, in the field of employment and social affairs as one of the case studies85. This provides the opportunity to test the potential of applying the methods identified as most suitable for assessment of redistributive effects – notably micro-simulation models and experimental designs - at EU level. As the tax and benefit systems which govern redistributive policies fall almost exclusively within the competence of Member States and the scope for the EU to intervene directly in these fields is limited. The EU nevertheless seeks to promote employment and counter unemployment and labour market exclusion through the so-called Open Method of Coordination (OMC). Under the OMC, the European Commission supports cooperation between the Member States with a view to directing national policies (such as employment of social assistance policies) towards certain common objectives. Within such a context, the hypothetical case imagined would involve an EU initiative to promote the deployment the principles of "workfare" at Member State level. In general terms, workfare involves placing requirements on benefit recipients to either engage in employment or engage in activities to improve their employability. In the case of direct employment, systems can allow beneficiaries to retain some social benefits if they move into low-paid jobs in order to make employment a more attractive and viable option. The case study assumes that an impact analysis is required at EU level in order to inform a decision on whether to pursue a generalised recommendation for workfare schemes at Member State level through the OMC.
8.2 A. Identification of methods / models
8.2.1 Problems to be addressed
In general terms, low-skilled workers will generally only be able to access comparatively low-paid jobs. Their productivity is often too low to allow them to access jobs that are
85 This was suggested by the steering group for the study.

118
better paid. This generates a conflict with the welfare system. The more generous welfare payments are, the more likely it becomes that low-skilled workers lose incentives to search for regular jobs, because they simply cannot improve their disposable income. The reason for this is that welfare claims are more or less reduced by the amount of earned income. If the productivity of a worker is not sufficiently above the level of his or her welfare claim, working may become unattractive. Those affected are caught in a trap, the so-called "welfare trap". They might have work options, but those are not sufficiently worthwhile. Working in the hidden economy becomes an option in order to evade reduction of welfare claims. There are several options to overcome the problem. An obvious solution can be viewed in increasing the skill level of workers. However, one has to take into consideration natural limitations, meaning that not everybody can be trained for high-skilled work and some level of low-skilled employment will always be required for the economy to function. Therefore, an alternative might be viewed in a minimum wage policy. However, firms cannot be forced to offer jobs, if the related revenue is destroyed by minimum wage standards. As a consequence, it might well be that the earnings of those with a job are sufficiently high above a social minimum standard, but that the number of jobs required is not sufficient. Another alternative option could be seen in in-work benefits, which are nothing but a generous deduction rule. If welfare claims are only mildly reduced by earned income, even working in a low paid job might remain sufficiently attractive. The problem here is that firms might feel tempted to lower wages below the productivity of the related jobs as they can rely on the welfare state, who will compensate workers for the wage differential. Here again, the welfare state actively generates welfare claims. As a result, the total volume of welfare claims may become extremely expensive. Workfare offers a solution to the problem, which is largely neutral with regard to behavioural responses of workers and firms. It therefore helps to restrict the number of welfare claims to a level which is objectively necessary according to a given minimum income standard. Workfare simply means linking welfare claims to a work requirement in a wide sense. One could think of welfare claims having to be earned, at least for those, who are able to work. Work in this context is a metaphor for activation in general. In practice, it could mean ordinary work as well as community activities or training or intensified placement activities. Practical experience shows indeed that work in a narrow sense should only be placed at the end of a chain of activation measures (see Eichhorst/Schneider 2008). The roots of the workfare concept are to be found in the United States. During the 1970’s, the so-called Earned Income Tax Credit (EITC) was introduced under the slogan “Making Work Pay” (see Kaltenborn/Pilz 2002). Originally, it was intended as a strategy to fight the phenomenon of the working poor. At first sight, the EITC appears as an in-work benefit, but within the context of a quasi-lacking welfare system, it generated de facto a situation, where welfare claims are strictly tied to a work requirement. The term workfare emerged later in the course of a second welfare reform under president Clinton
119
during the 1990’s. The Welfare Reform Act of 1996 was characterized by the headline “from welfare to work”, which soon became known as workfare. To summarize, the problems to be addressed are the following: • Low work incentives for low-skilled workers (structural unemployment) • Strong incentives to work in the hidden economy • Unnecessary cost of the welfare system
8.2.2 Key aspects of policy
Welfare payments are linked to a work requirement.
8.2.3 Objectives and constraints
Objectives: • Making low paid jobs in the market more attractive for low-skilled workers; • Reducing the cost of the welfare system and focussing welfare on the helpless; • Cutting back the hidden economy. Constraints: • Workfare is mainly addressing supply-side problems in the labour market; • The welfare state has to provide work opportunities for people, whose productivity
does not allow for a wage above the welfare level.
As already indicated above, workfare is primarily useful, if labour market problems of the low-skilled are predominantly caused by a lack of work incentive generated by the welfare system. If there is a genuine lack of labour demand for low-skilled workers, the instrument will not improve the labour market situation of the target group. It is therefore crucial to provide evidence that the problem at hand is primarily supply-side driven. However, this is to some extent complicated by endogeneity problems. If low-skilled workers have little incentive to pick up low-paid jobs, firms might be forced to escape strategies, which may end up in low demand for low-skilled workers. As a consequence, even low demand for low-skilled workers may be caused by low work incentives for low-skilled workers. From that, one could conclude that low demand for low-skilled workers might increase, if work incentives for these workers increase. Some micro-simulation models are trying to capture such endogeneity problems by incorporating labour demand in a more or less suitable manner. A simple form consists of an iterative linkage between a micro-simulation model for labour supply with a macro-simulation model for labour demand (see for example Haan/Steiner 2007). A more sophisticated approach consists of a linkage between a micro-simulation model with a CGE model as applied by Boeters/Feil (2009). In both cases, however, empirical evidence is not much in favour of genuine labour demand restrictions, at least for Germany, where these models have been applied. Given the huge effort linked with the estimation of a CGE model and its high sensitivity to underlying assumptions, it is hardly justified to go too far into this direction. Therefore, modelling a simple iterative feedback between

120
labour supply and labour demand seems to be a sufficient and feasible strategy for the consideration of labour demand restrictions.
8.2.4 Identification of direct impacts
• Employment: Employment of low-skilled workers increases, because low paid jobs become more attractive for them. The work requirement makes any job beneficial that allows for an income above the welfare level.
• Income: Disposable income increases for those, who leave the welfare system in favour of picking up a job. The concept is therefore Pareto optimal. Statistically, however, average labour income will decrease, according to an extension of the workforce by low-wage earners.
• Poverty: Workfare is likely to reduce poverty. Assuming that workfare is only affecting households on the left hand side of the median, the median income remains unchanged. The increasing income of low-skilled workers enables more households to cross the low-income threshold, defined as a certain percentage of median income.
• Inequality: For similar reasons, workfare is likely to reduce inequality. Workfare reduces the share of households on the extreme left of the income distribution and therefore contributes to a concentration in the core of the income distribution.
Figure 8.1: Impact chain 1: Direct economic/social/environmental impacts
Question 1: Are redistributive and/or regional employment effects being expected? Workfare contributes to poverty reduction and thus helps to reduce inequality. It may affect regional disparities to the extent that they are caused by disparities in welfare policy. However, workfare may be less effective in regions with poor labour market prospects.
8.2.5 Identification of redistributive and regional employment impacts
Question 2: Are causal relations sufficiently clear? Yes. There is nothing to add here with regard to Figure 8.1
8.2.6 Focus for assessing redistributive and regional employment impacts
Question 3: What types of outcomes are expected? • Reduction of acceptance wage
Workfare
Lowering of acceptance
wages
Job finding rate of low-skilled unemployed
increases
Increased organizational cost
Working in the hidden economy
becomes less attractive
Employment rate of low-skilled workers
increases
Income of low-skilled workers
increases
Welfare expenditures decrease
Tax revenue and social contributions increase
Overall budget effect (likely positive)
People either retreat from working in the hidden economy or
from welfare recipiency
Reduction of unemployment
Reduction of poverty and inequality

121
• Increase of job finding rate of low-skilled workers • Increase of employment of low-skilled workers • Decrease of unemployment of low-skilled workers • Increase of income of low-skilled workers • Reduction of poverty and inequality • Fiscal budget effects due to fiscal savings and tax revenue, but also organizational
costs • Reduction of working in the hidden economy
8.2.7 Methods to be considered
Question 4: What is the most important level of outcomes? Individuals and households Question 5: How different (in terms of nature and size) are long-term impacts expected to be compared to short-term effects? This is mainly a matter of time preferences of individuals. According to related studies, it appears that most individuals have a high preference for present consumption. Therefore it is unlikely that short-term impacts differ much from long-term impacts. However, one should take into consideration that institutional settings may change social norms over time, although the related long-term impact is difficult to identify. Interim conclusions The expected impact can most appropriately be assessed on the micro level (individuals and households). Micro-simulation based on an empirically estimated model of labour supply behaviour is a useful tool for assessing the impact of changes in the tax-benefit system on individual behaviour. However, such micro-simulation models have to rely on parametric assumptions that may not necessarily hold in reality. For example, parameters may be subject to biased estimation for various reasons. Moreover, especially for extreme changes in the tax-benefit system one may cast doubt on the underlying assumption of behavioural parameters remaining constant. Alternatively, one could assess the impact of changes in the tax-benefit system using social experiments. The quality of results is mainly depending on the quality of random or quasi-random assignment to treatment and control group. Social experiments do not have to rely on parametric assumptions. Instead, they take a purely empirical view of assessment. The disadvantage compared to micro-simulation models consists of a higher need for resources in terms of time and money. Results are also less generalisable.
8.3 B. Testing results
8.3.1 Assessment of micro-simulation model for individual labour supply
1) Key design features Micro-simulation models are typically used for the assessment of changes in the tax-benefit system, like changes of tax rates, wage subsidies and benefit levels.
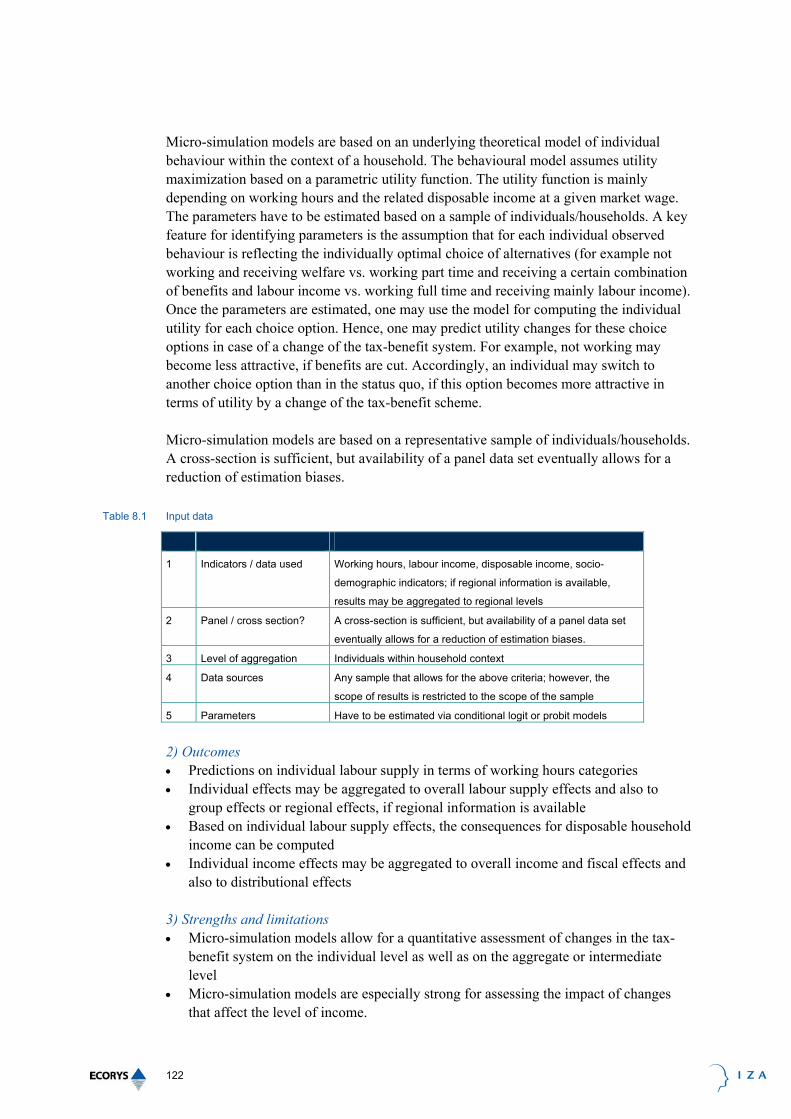
122
Micro-simulation models are based on an underlying theoretical model of individual behaviour within the context of a household. The behavioural model assumes utility maximization based on a parametric utility function. The utility function is mainly depending on working hours and the related disposable income at a given market wage. The parameters have to be estimated based on a sample of individuals/households. A key feature for identifying parameters is the assumption that for each individual observed behaviour is reflecting the individually optimal choice of alternatives (for example not working and receiving welfare vs. working part time and receiving a certain combination of benefits and labour income vs. working full time and receiving mainly labour income). Once the parameters are estimated, one may use the model for computing the individual utility for each choice option. Hence, one may predict utility changes for these choice options in case of a change of the tax-benefit system. For example, not working may become less attractive, if benefits are cut. Accordingly, an individual may switch to another choice option than in the status quo, if this option becomes more attractive in terms of utility by a change of the tax-benefit scheme. Micro-simulation models are based on a representative sample of individuals/households. A cross-section is sufficient, but availability of a panel data set eventually allows for a reduction of estimation biases.
Table 8.1 Input data
1 Indicators / data used Working hours, labour income, disposable income, socio-
demographic indicators; if regional information is available,
results may be aggregated to regional levels
2 Panel / cross section? A cross-section is sufficient, but availability of a panel data set
eventually allows for a reduction of estimation biases.
3 Level of aggregation Individuals within household context
4 Data sources Any sample that allows for the above criteria; however, the
scope of results is restricted to the scope of the sample
5 Parameters Have to be estimated via conditional logit or probit models
2) Outcomes • Predictions on individual labour supply in terms of working hours categories • Individual effects may be aggregated to overall labour supply effects and also to
group effects or regional effects, if regional information is available • Based on individual labour supply effects, the consequences for disposable household
income can be computed • Individual income effects may be aggregated to overall income and fiscal effects and
also to distributional effects 3) Strengths and limitations • Micro-simulation models allow for a quantitative assessment of changes in the tax-
benefit system on the individual level as well as on the aggregate or intermediate level
• Micro-simulation models are especially strong for assessing the impact of changes that affect the level of income.

123
• Limitations arise from the underlying parametric assumptions and the identifying assumption necessary for parameter estimation. The validity of results crucially depends on the validity of these assumptions.
• Conventional micro-simulation models are less suited for assessing the impact of changing time patterns of the tax-benefit system (for example, the duration of unemployment support). This would require a dynamic type of micro-simulation model, which calls for a remarkably higher level of complexity.
4) Budget and timing aspects The development costs for an up-to-date micro-simulation model are high and may amount to several 100.000 Euros depending on the cost for generating the data and on the complexity of the simulation procedure. Creating and maintaining such a model requires a year and more. The costs for using an up-and-running micro-simulation model are comparably low. For an experienced user it normally takes not more than two to three weeks for implementing a new scenario of tax-benefit reform. The related costs then mainly depend on the related labour costs and the share of development costs assigned to it. 5) Links with other methods/models Case studies for prototypical types of workers and households may be considered as a low budget alternative. This gives at least a qualitative insight into potential behavioural changes caused by changes of the tax-benefit system. However, it is difficult to extrapolate such insights to an aggregate level. Case studies are rather suited for an explorative phase of designing a reform of the tax-benefit system. Macro-simulation models are suited for an overall assessment of changes in the tax-benefit system, but only to the extent that a reform can be translated into a macro-economic stimulus. Since macro-simulation models are unable to capture structural aspects, which normally form the key issue of such a reform, their scope for impact assessment is limited. CGE models try to overcome the shortcomings of macro-simulation models by modelling structural relations between representative micro-level actors and macro level. However, this is more a labelling issue, since representative micro-level actors is a misleading description for a macro-level consideration. The shortcomings of macro-simulation models therefore apply to CGE Models as well. 6) Overall applicability at EU level This depends in principle on the availability of suitable data. The rest is a matter of model development. EUROMOD is a micro-simulation tool that allows the assessment of changes in the tax benefit system for practically all European member states. However, EUROMOD is restricted to the capability to simulate monetary implications only. Nevertheless, in quite a number of member states micro simulation models are available that allow for an assessment of behavioural aspects as well. For example, IZAΨMOD is such a model for Germany. This model is run at IZA and has been used for numerous simulation studies of German welfare reform (see for example Bonin/Kempe/Schneider 2003; Bonin/Schneider 2006, 2007a, 20007b; Bonin/Falk/Schneider 2007). It is based on the sample of the German Socio-Economic Panel comprising about 12.000 households.

124
Labour supply is modelled as joint utility maximization within households. Household utility is mainly generated by individual leisure and disposable household income. The main challenge when using this model is designing it in a way that is sufficiently flexible to allow one to consider different types of reform by changing only certain institutional parameters. In order to improve the scope of the method it would be useful to extend EUROMOD allowing for a consideration of behavioural aspects. Although this is possible, it has so far only been used for selected national samples of EuroMod (see for example Bargain/Orsini 2007).
8.3.2 Assessment of the social experiments
1) Key design features A social experiment is a random experiment, which requires a proper random assignment into a treatment and a control group as an identification strategy for assessing the impact of a treatment on defined outcomes. The random assignment makes sure that members of the treatment group do not systematically differ from members of the control group except for the treatment and that access to the treatment group is not selective. Under these conditions, differences between members of the treatment group and members of the control group occurring after the treatment can be causally attributed to the treatment. For obvious reasons, this is the same logic as applied to medical experiments. Social experiments require a sufficiently large sample of participants, who are either treated or not treated. Sufficiency is depending on the size of the impact under consideration. Strong effects require fewer cases than weak effects in order to pass usual tests for statistical significance. Contrary to the U.S., social experiments are still rarely used in European member states for a systematic evaluation of active labour market policy. France seems to be an exception here so far as social “experimentation” has become a large scale issue. However, the term “experimentation” indicates that the idea of random assignment is not consequently pursued in this context. In place of pure random assignment, projects have been set up, which allow for a comparison between regions where the treatment has been applied and regions where the treatment has not been applied. Nevertheless, the attempt towards a more systematic approach to the evaluation of instruments of active labour market policy in France deserves acknowledgement.
Table 8.2 Input data
1 Indicators / data used Working hours, labour income, disposable income
2 Panel / cross section? Panel data set by definition
3 Level of aggregation Individuals within household context
4 Data sources Data collected within a defined project
5 Parameters Not required
2) Outcomes • Difference in individual labour supply between treatment and control group • Difference in individual labour income between treatment and control group

125
3) Strengths and limitations • The undoubted strength of social experiments lies in the high reliability of causal
attribution with regard to the treatment under consideration, without requiring functional or parametric assumptions.
• With social experiments, it is possible to achieve statistically significant results with relatively few cases.
• Another strength is the persuasive power of social experiments. The logic of a social is easy to communicate and the same holds for the conclusions drawn from the results.
• For various reasons, social experiments are difficult to implement in practice. One reason consists of reluctance of practitioners, who often claim to know better, who fits and who doesn’t fit into a certain programme. Sometimes, practitioners might also suspect that the outcome of a social experiment may be used to evaluate their performance. Last but not least, it may be an issue that public authorities are afraid of being blamed for preventing people from access to opportunities. A way out of this dilemma could be seen in using “natural” limitations of programme capacity as a device of random assignment.
• It may sometimes be difficult to generalize results. • Outcomes that mainly occur on an aggregate level are difficult to capture with social
experiments
4) Budget and timing aspects On the one hand, social experiments can be viewed as very expensive, if programme costs are taken into consideration. For example, introducing a wage subsidy requires high costs for running the experiment as the members of the treatment group will be covered by such a complementary payment. On the other hand, however, social experiments can be viewed as very cheap. Given that a certain programme would have been put into practice anyway, running it as a social experiment does not produce relevant additional costs. The time necessary for doing impact assessment based on a social experiment can be significant. One does not only have to consider duration of treatment but also a decent post treatment period in order to capture long-term effects and sustainability effects.
5) Links with other methods/models From a methodological point of view, natural experiments are an alternative to social experiments. A natural experiment is a situation, where assignment to a treatment is affected by a change in legislation or something comparable, which cannot be anticipated or bypassed by those affected. As a result, this generates a quasi random assignment. For example, the introduction of mandatory military service starting with a certain birth cohort would allow for an assessment of the role of military service on post military career prospects by comparing members of a birth cohort immediately preceding the cut-off date with members of a birth cohort immediately following the cut-off date. However, natural experiments do not occur by intention, but rather by chance. In practice, they are therefore only of limited value for an impact assessment of a concrete policy instrument.

126
In practice, model projects are often implemented without a proper control design. This results in uncontrolled selectivity effects, which may seriously impair the identification of the causal impact of a policy instrument. A reference has to be artificially constructed by using more or less fancy econometric models to control for selection effects. Such models typically rely on certain identifying assumptions that cannot be tested. This makes them not only sensitive with regard to the validity of such assumptions but also generates a hunger for the number of cases. Since the implementation of policy instruments is often accomplished on a low-scale level, it is likely to end up with statistically insignificant or ambiguous results. 6) Overall applicability at EU level The applicability of social experiments is especially suited for cases, where a stimulus can be separated between treatment and control group. Therefore, the impact of an information campaign, for example, is difficult to assess with social experiments, because it is practically impossible to prevent people from receiving the information under consideration. The impact of a monetary stimulus or an activation stimulus is easy to assess by a social experiment, because the assignment process can easily be controlled by project managers. The main challenge for a proper social experiment in the context of workfare is the avoidance of selective programme assignment by caseworkers and participants. Although it is possible to control for selectivity by econometric methods, the usage of such techniques requires a significant multiple of cases in order to yield statistically significant results and is also sensitive to certain identifying assumptions. To some extent, the main advantage of social experiments, namely the potential of providing reliable results with relative few cases, is foiled by this strategy.
8.4 C. Conclusions
In this case of assessing the impacts of workfare, micro-simulation models have a clear advantage over social experiments, because they allow for an easy assessment of aggregate effects, based on an aggregation over individual effects. However, social experiments should play an important complementary role here. Since micro-simulation models are based on theoretical assumptions and also on certain identifying assumptions, their credibility is depending on the willingness to believe in the validity of these assumptions. Social experiments can help to assess the relevance of such doubts by either confirming or rejecting the postulated reactions in a reliable way. The specific strength of social experiments comes into play for an assessment of behavioural aspects that are difficult to model within the framework of a micro-simulation model.
8.5 References
• Bonin, H.; Kempe, W.; Schneider, H.: (2003): Household Labour Supply Effects of Low-Wage Subsidies in Germany. Journal of Applied Social Science Studies, 123, 199-208
• Bonin, H.; Schneider, H. (2006): Analytical Prediction of Transitions Probabilities in the Conditional Logit Model. Economics Letters, 90, 102-107

127
• Bonin, H.; Falk, A.; Schneider, H. (2007): Workfare – Praktikabel und gerecht. ifo Schnelldienst 4/2007, 33-37
• Bonin, H.; Schneider, H. (2007): Untersuchung der beschäftigungs- und finanzpolitischen Auswirkungen eines Konzepts für existenzsichernde Beschäftigung des Bundesministeriums für Wirtschaft. IZA Research Report No. 12, Bonn
• Bonin, H; Schneider, H. et al. (2007): Untersuchung der beschäftigungs- und finanzpolitischen Auswirkungen des Konzepts von Prof. Dr. Bofinger und Dr. Walwei zur Neuordnung des Niedriglohnbereichs aus der Studie „Vorrang für das reguläre Arbeitsverhältnis:Ein Konzept für Existenz sichernde Beschäftigung im Niedriglohnbereich“. IZA Research Report No. 11, Bonn
• Boeters, S.; Feil, M. (2009): "Heterogeneous Labour Markets in a Microsimulation–AGE Model: Application to Welfare Reform in Germany," Computational Economics, Springer, vol. 33(4), pages 305-335
• Haan, P. and V. Steiner (2007), Mehr Beschäftigung durch Subventionierung der Sozialbeiträge? Eine empirische Evaluation aktueller Reformvorschläge, Perspektiven der Wirtschaftspolitik 8(4), 378-388.
• Bargain, O.; Orsini, K. (2007): Beans for Breakfast? How Exportable is the British Workfare Model? In: Bargain, O. (Ed.): Micro-simulation in Action – Policy Analysis in Europe Using EUROMOD. Research in Labour Economics, Vol. 25, pp. 165-198


129
9 ENERGY – Tighter requirements for the energy efficiency of buildings
9.1 Introduction
With a range of energy- and climate policies being prepared and implemented at all policy levels, it is important to see what the social and redistributive impacts of such policies can be. Several methods are thereto compared: model family analysis, static and dynamic micro-simulation.
9.2 A. Identification of the methods / models
9.2.1 Problems to be addressed
According to COM(2006) 545 final, the direct cost of our inability to use energy efficiently will amount to more than 100 billion Euros (390 Mtoe at USD 48 / barrel net of taxes86) annually by 2020. Realising the savings potential in a sustainable way is thus a key element in Community energy policy. It is estimated that energy efficiency measures to reduce consumption could result in a saving of 205 Euros per citizen per year. The EU’s ‘Action Plan on Energy Efficiency’87 was endorsed by EU energy ministers in November 2006. The plan lays out ten priority areas to achieve its objective of providing EU citizens with “the most energy-efficient buildings, appliances, processes, cars and energy systems in the world” by 2012. The Energy Performance of Buildings Directive (EPBD), introduced in 2003, was already a central legislative component of energy efficiency activities of the European Union, designed to meet the Kyoto commitments and respond to issues raised in the earlier Green paper on energy supply security. The Directive set out to promote the improvement of energy performance of buildings with the following requirements to be implemented by the Member States: • proposes an expanded role for the public sector to demonstrate new technologies and
methods (2009); • proposes lowering significantly the threshold for minimum performance requirements
for major renovations (2009);
86 1 barrel of oil equivalent (boe) contains approximately 0.146 toe (i.e. there are approximately 6.841 boe in a toe). That
means that 390 Mtoe energy savings amounts to $128 billion or €102 billion (at a €/$ rate of 1.25). If the price for a barrel doubles (from $48 to $96), the saved cost also doubles (thus from €102 billion to €205 billion).
87 COM(2006) 545.

130
• proposes minimum performance requirements (kWh/m²) for new and renovated buildings and some components with a target for new buildings to approach the level of passive houses from 2015 (2009);
• considers proposing binding requirements to install passive heating and cooling technologies (by the end of 2008);
• proposes measures for Member States to provide financing for highly cost effective investments (2009).
Within these general principles and objectives, it is the individual responsibility of each Member State to choose measures that correspond best to its particular situation (subsidiarity principle). However, collaboration and information exchange are assumed to facilitate implementation. The action plan on energy efficiency specifically included proposals to extend and amend the Energy Performance of Buildings Directive (2002/91/EC) with the aim to increase its effectiveness.
9.2.2 Key aspects of policy
We examine the (social) effects of possible new policy options in the EU buildings sector. The following options have been discussed in stakeholder consultations with the Commission, as well as various studies projecting a possible recasting of the EPBD, a study that ECORYS led in a consortium of partners that included Ecofys and Bio-Intelligence in 2008. The selected options are the following: • At present, the current EPBD requires that owners of buildings exceeding 1000 m2
upgrade the energy performance of the building when they undergo major renovations88, meaning that all buildings over this area fall under the regulatory requirements of the EPBD. We will assume that this threshold is lowered to 500 m², to include all medium-sized buildings89;
• We will assume that energy performance certificates are made a mandatory part of property advertisement and/or property transaction documents;
• With regard to energy performance requirements, we will assume that EU-wide low or zero energy or carbon buildings/passive house requirements are set up. This would imply an EU-wide definition of passive buildings. National action plans drawn up in each country rather than a rigid uniform definition, would be appropriate given the widely varying characteristics of the EU building stock and climate.
A working definition of passive housing, as well as working inspections and certifications of buildings form the basis for the option to lower the EPBD threshold to 500 m2. In other words, without the latter two regulatory initiatives, a 500 m2 threshold is of little significance in practical terms, given the difficulty of monitoring and the current lack of
88 The EU Commission states that “major renovation are cases such as those where the total cost of the renovation related to
the building shell and/or energy installations such as heating, hot water supply, air-conditioning, ventilation and lighting is higher than 25% of the value of the building, excluding the value of land upon which the building is situated, or those where more than25% of the building shell undergoes renovation”
89 Out of the EU’s 20708 million square meters of buildings (both residential and commercial), the new threshold would include another 2649 million m2 in addition to the 5965 million m2 already covered (PROPOSAL FOR A RECAST OF THE ENERGY PERFORMANCE OF BUILDINGS DIRECTIVE (2002/91/EC); IMPACT ASSESSMENT; COM(2008) 780 final.)

131
benchmarks against which to gauge how energy efficient measures are implemented. When discussing options below, it is implied that certification and definitions are in place at the EU level to better implement a recast EPBD. The table below summarises the main characteristics of the possible new policy options in the EU buildings sector. It describes the problems to be addressed, the key aspects of the policy, the objectives and constraints and the main employment or social impacts and the assumed causal chain.
Case 3: ENERGY – Tighter requirements for the energy efficiency of buildings
1 Problems to be
addressed
The direct cost of our inability to use energy efficiently will amount to more than €100
billion annually by 2020. The Energy Performance of Buildings Directive (EPBD) was
introduced in 2003, but certain aspects of this are considered as insufficient
2 Key aspects of
policy
The threshold above which buildings fall under the regulatory requirements of the
EPBD is lowered to 500 m², to include all medium sized buildings; out of the EU’s
20,708 million m² of buildings the new threshold would include another 2,649 million
m², in addition to the 5,965 million m² already covered
"Energy performance certificates" are made a mandatory part of property
advertisement and/or property transactions documents
EU-wide low or zero energy or carbon buildings/passive house requirements are
established, allowing for national variation to account for varying characteristics of
the EU building stock and climate.
3 Objectives To improve the energy efficiency of building in the EU
4 Constraints National transposition of the EU rules may vary, while existing norms are not
harmonised in the EU.
5
Employment or
social impacts
and assumed
causal chain
Employment: The demand for energy saving building materials (e.g. insulation
material) and for the installation of these materials will increase, which would have a
positive impact on employment in the manufacturing and installation sectors.
Retraining may be required in construction sector to deal with new technologies.
Increased costs for building owners / buyers: Landlords may seek to pass costs
associated with conforming to tighter energy requirements on to tenants, with
potential reductions in disposable income. Owner occupiers will feel these effects
directly. "First time buyers" of large buildings may be forced to postpone purchase
owing to the higher costs – which could reduce demand for new build buildings or
renovation work, with consequent, negative employment effects in the construction
sector (even if these are assumed to be outweighed by positive effects above)
Savings in energy costs: will lead to increased income for occupiers
Health: better insulated buildings are quieter, warmer in winter and cooler in
summer, which can have a positive effect on public health. Moreover, the reduction
in CO2 emissions achieved may slow damaging climate change.
6.
Focus for
assessing
redistributive
effects (see
Q1: Significant effects
Q2: Causal relations sufficiently clear
Q3: Income effects
Q4: Social groups – lower/medium/high income level

132
roadmap) Q5: Strong interest in long-term and indirect impacts
7. Methods to be
considered
• Model family analysis
• Static micro-simulation
• Dynamic micro-simulation
9.2.3 Objectives and constraints
General objectives The 2007 Spring European Council emphasized that the “EU is committed to transforming Europe into a highly energy-efficient and low greenhouse-gas-emitting economy”90. The Council agreed to the following three objectives as the core of a comprehensive Energy Policy for Europe (EPE): 1. promoting environmental sustainability and combating climate change; 2. increasing security of supply; and 3. ensuring competitiveness and the availability of affordable energy supply. The Commission believes that a sound EPE will allow Europe to become a “thriving and sustainable energy economy that has grasped the opportunities behind the threats of climate change and globalisation, gained world leadership in a diverse energy portfolio of clean, efficient and low-emission energy technologies and become a motor for prosperity and a key contributor to growth and jobs.”91 Within the Commission, the cross-cutting issues of energy and climate change are not exclusively addressed by DG TREN, but are also increasingly covered in policies and programmes of DG BUDG, DG ENV and DG RTD. Objectives specific to the social domain Starting with the European Employment Strategy initiated by the Delors Commission in the early 1990s, to the Luxembourg process in 1997 and the Lisbon strategy in 2000, the European Commission has consistently recognized that energy policy plays a part in stimulating jobs and growth. The January 2008 Communication from the Commission regarding the so-called “20 20 by 2020” goals states that developing the EU’s energy policy is “at the heart of the European Union’s political programme: a guiding theme for the Union, central to the Lisbon strategy for growth and jobs”. As such, a multi-pronged approach for developing a competitive and sustainable energy policy for Europe is inextricably linked to the Lisbon principles of competitiveness, openness, and competition. The 2008 “Climate action and renewable energy package” reaffirmed the importance of sustainable development as a central variable in the overall EU energy equation. Employment consequently lies within these policy goals. The main objectives of the EU’s energy policy is to reduce dependence on imported energy, achieve a sustainable energy policy hand in hand with environmental objectives and foster a competitive internal energy market. As such, energy and climate change are increasingly being seen as two sides of the same coin. Because energy policy in the EU 90 Presidency Conclusions of the March 2007 European Council. 91 COM(2007) 1 Final.

133
touches on varied policy areas, and because an ambitious policy for energy is in its early phases, there are many uncertainties in the outcomes of current EU initiatives. Uncertainties in outcomes include whether renewable energy targets will be met, what importance nuclear and coal generated energy will take in the next decades and how liquid, transparent, unbundled and interconnected wholesale energy trading will be. As such, assessing the employment effects of individual initiatives must account for the uncertainty in outcome of the initiatives themselves. Initiatives' ramifications on labour markets must therefore account for the highly evolving nature of the EU’s energy policy. Specific objectives With respect to tightening the requirements of the EPBD, we identify the following specific objectives: • The threshold above which buildings fall under the regulatory requirements of the
EPBD is lowered to 500 m², to include all medium-sized buildings. Out of the EU’s 20,708 million m² of buildings the new threshold would include another 2,649 million m², in addition to the 5,965 million m² already covered. This will lead to an additional investment in energy efficiency of buildings that will have positive environmental impacts as well as (indirect) effects in the economic and social domain.
• "Energy performance certificates" are made a mandatory part of property advertisement and/or property transaction documents. Energy performance certificates allow the value of energy efficiency to be recognized. Besides, an indirect effect may be that it increases awareness within Member States.
• EU-wide low or zero energy or carbon buildings/passive house requirements are established, allowing for national variation to account for varying characteristics of the EU building stock and climate.
These measures will have to be implemented in the period up to 2020. Constraints The main rationale for Government intervention at Member State level in this specific case is the obligation to implement the Directive and that the energy market is failing to deliver cost-effective energy efficiency improvements to buildings at a fast enough rate to reduce the risk of climate change. The reasons for the lack of investment are well understood and include: • lack of information on the opportunities, • the short payback periods required if there is no perceived increase in asset value, and • landlord/tenant issues concerning who invests and who benefits. If households do not know their level of energy expenditure, how energy can be reduced, by how much, or at what cost, they are unlikely to consider investment in energy efficiency. However although information provision is often necessary it is rarely sufficient in itself to encourage behaviour change. Besides, uncertainty about future energy prices can deter house owner from investing since they cannot be assured of further savings. Finally, house owners, may also be wary of the risk associated with unfamiliar products.

134
The motivation for energy efficiency improvements has been limited in the past to recovery of a capital expenditure by lower energy costs. For most people the expected time of living in a property is not known but can be relatively short. There is therefore a reluctance to invest in measures with a payback period longer than a few years. The introduction of an energy performance certificate however allows the value of energy efficiency to be recognized in the market place and thus allows a higher property price to be achieved, so that the occupier need not rely solely on the benefit from reduced running costs for the period of occupation. An obvious constraint is the ‘owner-tenant’ split whereby house owners may under invest in energy efficiency measures because their tenants pay the energy bills or conversely tenants have no incentive to reduce their energy use as the house owner pays the energy cost.
9.2.4 Identification of direct and indirect impacts
When analyzing the impact of tighter requirements for the energy efficiency of buildings with a specific focus on the distributional impacts we should distinguish between direct and indirect effects. Direct effects look only at the impact of the measure on the groups that are directly involved, whereas indirect effects affect society as a whole. Figure 8.2 provides an overview of the main direct and indirect impacts. For sake of completeness we also add the expected impacts of a mandatory introduction of energy performance certificates and EU-wide housing requirements. These will however not be discussed in detail, since it is assumed they are in place at the EU level.

135
Figure 9.1 Overview of direct and indirect impacts
Proposed policy Direct impacts Indirect impacts
Investment in energy efficiency
of buildings (500-1000 m2)
EmploymentIncrease in demand in the construction and
installation sector
EnvironmentalReduction of CO2
emissions
Housing marketIncrease in cost of
housing or owners / tenants
Income effectsLower expenditure on energy for owners /
tenants
Public healthPositive health effects
Mandatory energy performance certificates
Housing MarketRecognize value of
energy efficiency in the market
EnvironmentalAwareness raising
EU-wide housing requirements are set up
Housing marketProvide information on
energy efficiency
EnvironmentalAwareness raising
Income effects(Short-term) impacts on income due to increase in rent (risk of poverty)
We expect the policy to have the following direct impacts: • The demand for energy saving building materials (e.g. insulation material) and for the
installation of these materials will increase • The cost of owning a building will rise • Savings in energy costs will lead to increased income effects • Positive impact on the living environment of the inhabitants We expect indirect effects of reduced energy consumption on the environment (in particular, less CO2) and public health. Besides, owners who let their building may try to pass on the increased costs to their renters. This will lower disposable income. This negative income effect can induce negative social effects. A short description of the direct and indirect effects is given below. It is important that both intended as well as unintended impacts are taken into consideration. 1. Increased demand for energy saving building materials and for the installation of these materials Due to the tighter building requirements, the demand for energy saving building materials (e.g. insulation material, specialist glass products, energy-efficient boilers, etc.) will rise

136
both for renovations, as well as for the construction of new buildings. This increased demand will lead to job creation in the sector of building materials92. Job creation and demand should be calculated by isolating the policy change (tightened threshold alongside definitions of passive housing and institutional capacity for certification and inspection) as the only variable, in order to exclude other factors such as overall economic situation or technological advances. Although there is restructuring in the building materials sector (e.g. shrinking demand for low-skilled workers, higher demand for high-skilled workers93), the net outcome of the EU policy change is assumed to be employment growth in the building material sector. Besides, it is likely that there will regional disparity in employment growth owing to location of the building material industry. At the same time, these energy saving materials need to be installed in the buildings, leading to more demand in the construction sector. A recast Directive would require an additional bulk of the EU building stock to comply with the EPBD (all buildings with a surface area between 500 m2 and 1000 m2). Thus, upgrades would be undertaken in the building stock with a size between 500 m2 and 1000 m2 when these buildings undergo major renovations. This increase in demand will generate new jobs in the construction sector. In this sector, workers are predominantly male and lower educated (manual workers). The construction sector is also occupied by workers from disadvantaged groups (e.g. migrant workers, illegal immigrants). When the installation of these energy saving building materials demands applying new techniques and technologies, retraining of the current construction workforce is needed (job transformation). 2. Owning and/or acquiring a building will become more costly in the future The tighter building requirements will all induce extra costs for building owners in the future94 (related to renovations required, mandatory energy performance certificates, more expensive materials for new buildings). Assuming that compliance with a new EPBD is mandatory (and implementation is flexible), building owners will be forced into upgrading their building to the energy efficiency standards laid out in the Directive, when the building undergoes major renovations. Here we can distinguish between three different groups of building owners. Firstly, owners who let their building are likely to try to pass on the increased costs to their tenants. If this is possible and by how much the rent can increase will depend on the local legislation governing rental agreements and the price elasticity of the demand for renting. An important issue in this case is the division of cost and benefits between owners and tenants. As structural investments (such as insulation measures) are generally the responsibility of landlords, but energy costs (electricity and gas bills etc) are paid by tenants, landlords will often not benefit directly in financial terms from the effects of
92 This effect will be partly offset by higher costs in the building material sector. The higher demand for energy saving
appliances such as insulation material, multi-glazed windows or more energy efficient boilers, heating and cooling systems together with higher investments in new technology and thus more expensive material (especially in the first couple of years) will result in an increased cost of these materials.
93 More energy efficient building material is a more technologically advanced product and requires as such more high-skilled workers (engineers, technicians) for both the development as well as the production process.
94 In the very short term, i.e. in 2010, introducing a lower threshold will not have any decisive additional impact on the total costs savings, since only a small proportion of the buildings stock will by then have undergone major renovation. The impacts of this case are most visible in the medium to long term.

137
energy saving investment. If landlords seek to recoup costs through rent increases, this may however, certainly in the short run, affect moving behaviour of the tenants. If the trigger for applicability of the new requirements is carrying out renovation, owners may be dissuaded from undertaking improvement work (and energy saving elements of this) if they can generate some form of economic return, for instance by an increase in the rent. To help to overcome this, the EU or the individual Member States may introduce additional subsidies, to reduce the investment costs for owners and achieve energy saving goals more quickly. Secondly, building owners who do not let their buildings necessarily have to bear the increased costs of the tighter building requirements themselves. This will diminish their income, which can also lead to negative social effects. However, as they will gain due to increased energy savings, the essential question is how long the pay-back period is. The longer this is, the more likely this will lead to behavioural impacts on the building owners. A third group is made up of potential building owners. These can be both those seeking to buy an existing building, as well as persons wanting to buy a new building. Due to the increased cost price of buildings (existing and new ones) caused by the tighter building requirements, demand to own a building will be reduced. People will postpone investments, keep on renting longer or decide to build smaller buildings due to the increased costs of acquiring a building. This is likely to lead to a decrease in the demand to construct new buildings and in the demand to buy (and possibly renovate) existing buildings. This drop in demand can have negative job effects in the construction sector and in the real estate sector (job losses). Jobs in the construction sector are less skilled (male, manual workers) while those in the real estate sector are higher skilled. The size of the demand drop depends on the price elasticity of the demand for new and existing buildings. However, we expect this effect to be small. The net job effect in the construction sector is assumed to be positive as job creation is likely to outweigh job destruction. 3. Increased income effects As more buildings comply with the tighter building requirements, more owners and tenants will benefit from energy savings. This has a positive effect on the income of both groups. This income effect might have employment or social effects depending on the spending policies of individuals, companies and governments. Lowering the threshold for application of the Directive from 1000m² to 500 m² has been estimated to generate a total cost saving of 4 billion euro per year for the EU as a whole, in comparison to the situation reached through the current EPBD. On the one hand total capital costs are approximately 5 billion euro which accrue mainly to the building and maintenance sector. On the other hand total energy savings for house owners and renters are over 9 billion euros95. 95 See, http://www.fedarene.org/events/Fedarene_events/Promenlab/04-C.Hamans-Eurima.pdf

138
The income effect (distribution of the 4 billion euro saving) will vary between groups. The costs incurred by different groups will vary depending on factors such as the size of the buildings owned, the year of construction and the use of the buildings affected. The benefits will also depend on different factors, such as current patterns of energy use and the price of energy. Finally, income effects will also depend on the way the costs are shared between owner and tenants. 4. Indirect effects: Environmental, public health and income effects When less energy is used to heat or cool buildings, this has positive environmental effects, as use of fossil-fuel energy sources can be reduced. The reduction in CO2 emissions achieved may slow damaging climate change. At the societal level, better insulated buildings are quieter, warmer in winter and cooler in summer, which can have a positive effect on public health. The most significant potential health impacts are likely to arise when cost effective measures are implemented and hence improve the internal environment. Plant inspections are likely to improve the performance of boilers and air conditioning systems, with beneficial effects on occupants. It is unlikely that the introduction of energy performance certificates or plant inspection will have a negative impact on health. Owners who let their building may try to pass on the increased costs to their renters. If this is possible and by how much the rent can increase will depend on the local renting legislation and the price elasticity of the demand for renting. If rents are increased, this will lower the disposable income of persons (or companies) renting the building. This negative income effect can induce negative social effects if the renter cannot afford the rent increase. These persons can eventually be pushed into poverty, especially if they already belong to vulnerable groups (low income earners, migrants, illegal immigrants).
9.2.5 Focus for assessing redistributive and regional employment impacts
Policy options can be beneficial to the economy or society as a whole, but might have positive and negative impacts unevenly spread across different sectors, target groups or regions. This means that the initiative has winners and losers. Identifying both groups helps to foresee resistance and may point to mitigating measures reducing the negative impacts. A policy change may also have a distributional impact if existing inequalities are aggravated. In this section we identify impacts where we expect distributional or regional impacts that can be assessed in a quantitative analysis. Impacts of the Directive may differ between groups in society or (sub)sectors. Since we focus on distributional issues we first show who will bear the cost. Next we will identify groups that will benefit from the Directive.

139
Table 9.1 Overview of the costs of the tighter requirements for the energy efficiency of buildings
Cost item Type of users
Who will bear the
cost Type of cost
Recurring / non-
recurring
Investment in
energy efficiency of
buildings due to
tighter requirements Owners and tenants Owners and tenants
Capital cost (use of
energy saving
materials), labour
cost
Non-recurring
Energy performance
certificates All Owners and tenants
Wage cost,
administrative cost Recurring
Definition of EU-
wide low or zero
energy or carbon
buildings/passive
house requirements All Government Administrative cost Non-recurring
Table 9.1 provides an overview of the main cost drivers of the new policy options in the EU buildings sector of the policy initiative. These are the following: • Owners of buildings of a size between 500 m² and 1000 m² as well as their tenants96.
Depending on the energy performance of the building(s), owners will have to bear (at least a proportion of) the costs of energy efficiency measures themselves, along with associated inspection and certification costs.
• Owners of new buildings will see the cost of construction increased by higher energy efficiency standards (most costly construction techniques and materials);
• Households and businesses will be affected by the requirement for energy certificates either as property owners when they come to sell or rent their property or as occupiers when they decide to rent a building. The public sector will be involved in the certifying energy performance certificates.
Table 9.2 Overview of the main benefits of the initiative
Cost item Type of impact Who will benefit Type of benefit
Recurring / non-
recurring
Investment due to
tighter requirements Increase in demand
Building and
installation sector Direct Non-recurring
Lower energy use Owner and tenants Direct Recurring
Lower emissions Society Indirect Recurring
Public health effect Society Indirect Recurring
Table 9.2 provides an overview of the main benefits of the new policy options in the EU buildings sector of the policy initiative. These are the following: • The construction industry will need to produce them for each new building.
96 The European Commission states that “major renovation are cases such as those where the total cost of the renovation
related to the building shell and/or energy installations such as heating, hot water supply, air-conditioning, ventilation and lighting is higher than 25% of the value of the building, excluding the value of land upon which the building is situated, or those where more than25% of the building shell undergoes renovation”

140
• The energy efficiency industry will benefit from an increased demand for their goods and services;
• Lower energy use; • Decrease in carbon-dioxide emissions; • Demand for building inspectors to assess building energy performance and certify
works undertaken will increase. The impact will differ between regions, depending on a number of factors, such as the local housing market, the energy price level, existing measures with respect to regulation and subsidies as well as differences in labour cost. Therefore, specific attention needs to be paid to the regional dimension. Also, the current proposal focuses on buildings size 500 to 1000 m2 only. This has implications for the analysis, since this will mainly concern businesses and tenants living in fairly large apartment buildings. The definition of size threshold thus excludes large sections of society, particular in countries with high residential owner occupation (most of Europe). Direct effects on individual households are likely to be highest in countries with lower owner occupation and proportionally more large housing units (i.e. blocks of flats etc). In most EU Member States a fairly high proportion of non-owner occupiers in large apartment buildings come from lower income groups – most at risk from rent increases. Hence, the most significant distributional and regional effects are expected with respect to employment and income effects. Besides , we expect regional impacts to be of interest due to the impact of specific market conditions. In the next section we will examine three methods by which impacts distributional impacts can be assessed. Other impacts, such as health effects are considered to be of secondary importance, so have not be subject to in depth analysis.
9.2.6 Methods to be considered
In this section we examine different methods that can be used to assess the distributional impacts of the proposed policy. Purpose is to show how these methods can be used and what type of questions can be assessed using these methods. The methods used should allow us to assess the effects resulting from a) an increase in accommodation costs due to investment in insulation of buildings and b) a reduction of energy costs. We analyse the impact of tighter requirements using the following three methods: • Model family analysis • Static micro-simulation • Dynamic micro-simulation All three methods analyse the issue of investment of energy savings at the lowest aggregation level, the building and or the household, and are therefore especially useful to analyse the impacts for specific groups or regions. The main difference between model family analysis and (static and dynamic) micro-simulation is that it uses hypothetical cases whereas micro-simulation models use survey or administrative data as input. Model family analysis and static micro-simulation look only at first-order effects and ignore any behavioural effects of the policy measure. Dynamic micro-simulation, however, does allow behavioural effects to be taken into account.
141
In the analysis we focus mainly on employment and income effects. However, given that the impact of investment in energy savings is known, this approach will also enable us to calculate the environmental effects in terms of a reduction of carbon dioxide emissions.
9.3 B. Testing results
9.3.1 Assessment of method 1: Model family analysis
The model family analysis centres on the calculation of the financial consequences of fiscal and social policies for a set of hypothetical families. The calculations allow one to see the effect of policy variations and the effects of changes in household circumstances. A model family analysis consists of the following steps: • Step 1 - Identify representative cases • Step 2 - Calculate cost of energy saving measures • Step 3 - Calculate benefits of energy savings measures • Step 4 - Calculate the impact on carbon dioxide emissions • Step 5 – Scenario analysis The type of model used in this specific case can be described as a physically based model. In the model the impact of the policy measure is shown directly at the level of physical factors which influence energy use. In contrast, in an econometric model energy use is related to variables such as disposable income or energy prices via short-run and long-run elasticities. Such an approach will be used to analyse the effect of the policy measure on underlying economic factors. Hence, both methods can be used in the context of assessing the impacts of energy efficiency in the social domain. However, when we are specifically interested in the impacts for specific groups, the analysis should focus at the lowest aggregation level. In such circumstances, a model family analysis seems appropriate. Step 1: Identify representative cases – types of building and existing energy consumption A first step in a model family analysis is to identify which cases will be included as representative cases in the analysis. For this part of the analysis it seems logical to take the perspective of the building for the analysis. We suppose that at least the following criteria are relevant to distinguish between buildings with a size between 500-1000 m2. • Rental versus owner-occupier; • Year of construction; • Size of the building; • Type of utilization (industrial use, office use, residential use). Based on these criteria a number of representative cases (20 up to 1000) can be constructed for which the expected energy savings due to better housing isolation can be calculated. 97 For these typical building categories additional assumptions have to be
97 For instance the SAWEC model of the Energy Research Centre in The Netherlands uses this approach to calculate the
future use of gas and electricity. In this model the annual energy consumption (separately for the various end-uses) of a dwelling is calculated on the basis of its characteristics. The SAWEC model identifies 180 different dwelling types. BREDEM is a similar model used in the United Kingdom. The BREHOMES model classifies the housing stock in into 1 000

142
made with regard to factors such as electricity consumption and the use of energy efficient technologies. Given these criteria a number of different building categories can be indentified that can be used to simulate the energy use. For reasons of comparison of the outcome between Member States a careful construction of the representative cases is very important. As we already stated, direct effects on individual households are likely to be highest in countries with lower owner occupation and proportionally more large housing units. Step 2: Calculate non recurring costs of implementing tighter building efficiency requirements To calculate the cost of implementing tighter building efficiency requirements different European countries have already developed calculation models as a result of Article 3 of the EPBD, which calls for a methodology for calculating the energy performance of buildings, to be applied at the national or regional level. For instance, the United Kingdom has developed the national Calculation methodology. Other examples can be found on the website of the European Portal for Energy Efficiency in Buildings.98 In general, the calculation is based on a general framework including various criteria, such as thermal characteristics of the building, information regarding heating installation, hot water supply, air conditioning installation and natural and mechanical ventilation. It is necessary to identify the baseline for each of the cases identified in the first step. A common approach is to use the notional building, a similar building that satisfies the requirements with respect to passive housing. Based on the characteristics of each building type an estimate can be made of the level of investment needed to comply with these requirements. The output from the calculations should include both capital cost and labour cost. Some cost will depend on the size of the building, such as labour cost and cost for improvement that have clear costs per square meter like insulation are calculated. Other costs are taken as ‘per building’. To calculate labour cost in a model family analysis we may use direct measurement of the cost involved, we may however also use an indirect approach using an econometric model where the relation between labour cost and a number of characteristics, such as year of construction, size of the building and type of utilization is estimated. By means of imputation methods, labour cost can be calculated for each representative case. The output of the analysis is calculated at the level of the typical building. It is feasible to determine the cost level for individual households, in case of a building that is used by different households, provided information is available.
categories, using BREDEM to calculate the energy consumption of each such category. The overall energy consumption in households is checked against total deliveries determined from the supply side.
98 http://www.buildup.eu/

143
Step 3: Calculate benefits of implementing tighter building efficiency requirements The level of energy savings can be calculated for each building type by making a comparison between the level energy spending in the baseline scenario (no action) and the level of energy spending after the introduction of tighter requirements (i.e. the notional building scenario). To calculate the level of energy saving, data availability is crucial. The European Commission has examined the possibility of improving knowledge of final energy consumption at the household level99. For this purpose, a non-exhaustive investigation was made of Member States where data collection systems exist on energy consumption in households. Among others, Germany, Austria, France, Denmark and the United Kingdom have household surveys that provide information on energy use. Also data collection systems in the USA and Canada as well as the EU-PHARE exercise, a survey on energy consumption in EU10 Member States implemented in 1996, were discussed. The investigation identifies a list of information to be monitored in the residential sector. This includes the following data to be collected at the household level: • Energy consumption per household • Consumption attributed to end-use • Data on penetration of EE technologies • Data on characteristics of the housing stock; • Unit/specific consumption data • Corresponding activity data, e.g. household numbers • Additional information on appliances and trend in energy service demand Also the benefits can be calculated at the level of a typical building or calculations can be made for a typical household. Step 4: Calculate the impact on carbon dioxide emissions Given the outcome from step 3 the impact on carbon dioxide emissions for each building type can be calculated. Step 5: Scenario analysis Different scenarios will provide useful information that enable to complement results related to the base case. Following the same methodology as for the analysis of the base case, different scenarios can be calculated that can be compared to the base case. Especially relevant in this case will be the way cost and benefits are divided between owner and tenants. By making different scenarios a bandwidth can be shown of the impact given a certain split of cost. The level of energy savings will be vulnerable regarding assumptions with respect to for instance the future price of energy. A sensitivity analysis may show how the impact of changes is affected if we change the level of energy savings or energy prices. Therefore different scenarios should be taken into account with respect to the energy price. 99 Meeting of the Working party “Final Energy Consumptions in Households’, WP-HOUS/2008/08

144
Also the impact of the measure will differ between regions since external factors will differ, such as the current housing condition, the weather conditions et cetera. Conclusion To conclude, in a model family analysis for a number of representative cases we are able to calculate the cost and the benefits of tighter requirements for energy efficiency measures of buildings. Using scenario analysis we are able to show the impact of different division of rents between owners and tenants as well as the sensitivity of the outcome for certain key parameters in the model, such as energy prices.
9.3.2 Assessment of method 2: Static micro simulation
The calculation method used in a static micro-simulation is similar to that is used in model family analysis. Model family analysis and static micro simulation are able to take into account the same interdependencies. Hence, in a micro-simulation model we are able to provide outcomes with respect to employment, income and environmental impacts provided that the information is available. As in a model family analysis, an analysis using micro-simulation should also include a sensitivity analysis of the key parameters of the model. The main difference is that a static micro-simulation model uses information about actual households, obtained from sample surveys or from administrative data. A static micro-simulation model may show relatively large impacts for certain smaller groups due to specific interactions that may be overlooked in a model family analysis. Besides, since a micro-simulation model provides the effect of a change in the policy for the entire population, the model is able to provide a more exact estimate of the bandwidth of the income effects and can also provide information on the coverage of the policy measure in certain target groups. Therefore, (static) micro-simulation models are especially useful for policy proposals where distributional issues are important. Finally, the results of a micro-simulation model can be used to estimate budgetary impact of a policy measure for the entire population. Micro-simulation models can also be used to analyse long term distributional effects. Since the implementation of the building directive is foreseen in the period until 2020 the building stock will not be static. We may think of the following changes: • Change in the number of buildings; • Changes in the number and the composition of households • Demolition and construction of buildings • Proportion owner-occupier versus tenant • Distribution with respect to the year of construction To assess the impacts of the directive over a longer period we should take into account these developments. In a static micro-simulation model changes in the composition of the housing stock can be taken into account. If projections with regard to the development of these factors are available from external resources, a micro-simulation model can take into account future changes with respect to these factors.

145
In this case especially relevant will be differences in regional or local effects. When energy efficiency measures are more likely to occur in certain regions or the impact on household income will depend on the local housing situation it is relevant to take into account these differences. In a model family analysis, specific assumptions need to be made regarding the residence of the household. The main advantage of a spatial micro-simulation approach is the fact that it allows one to account for the heterogeneity in the building stock across space. Regional differences in the impact on household income or regional impact on the poverty risk will be an automatic by-product of the analysis. Also with respect to the obligatory use of certificates the cost between regions can be differ, or instance because the costs in rural areas will be higher due to the need for a surveyor to visit the property and therefore incur additional travelling time. Data availability The availability of data will in general restrict the use of micro-simulation in this specific context. Static (as well as dynamic) micro-simulation models will not include the information on the housing sector that is necessary to calculate the impact of the directive at the household level. As approach would be enrich the database using an additional monitoring. However, in most cases this will not be feasible. Therefore, in most cases imputation techniques will be used to enrich the dataset. This will however restrict the analysis of distributional impacts.
9.3.3 Assessment of method 3: Dynamic micro simulation
In the model family analysis and the static micro-simulation models behaviour is fixed, which means that the models cannot allow for the effects of policy that operate via behavioural change. We illustrate this by means of two possible behavioural impacts: • Impacts in the housing market • Impact on consumer behaviour Impact in the housing market The directive may lead to changes in behaviour in the housing market in different ways: • The directive may cause landowners to postpone major renovations due to the
increase in costs. • The directive may lead to an increase in the demolition of older buildings • The directive may lead to a change in the moving behaviour of tenants due to an
increase in rent for renovated buildings. Whether we are able to take these behavioural impacts into account will depend on the knowledge that is available with respect to the causal effects. Ignoring these impacts will provide an upper boundary on the expected impacts. An alternative could be to use a sensitivity analysis that takes into account that not all house owners will invest in energy efficiency or will invest at a later stage. Impact on consumption behaviour An important behavioural impact is the impact that energy saving has on consumption behaviour at the individual or household level. Modelling behavioural responses to indirect tax reforms requires information about how the demand will change in relation to changes in its own price (the own price elasticity) and also about the impact of prices

146
changes for other goods (cross price elasticities). In order to estimate the behavioural response we use a consumer demand system that describes how a consumer or household with goods and services and facing prices allocates its total income. Given a change in the price of one of the goods, here the price of energy, it is possible to calculate how consumer behaviour will adjust. Long term-effects A final argument for using a dynamic micro-simulation model rather than a static model is that the directive is implemented over a long period. In a static micro-simulation model changes in the population are modelled using prognosis that are entered in the model exogenously. In a dynamic model these behavioural effects are modelled explicitly. Data availability Data availability will be greater issue an when we want to use dynamic micro-simulation. To run a dynamic micro-simulation model information on the housing sector that is necessary to calculate the impact of the directive at the household level should be enriched with information on its behavioural impacts.
9.4 C. Conclusions
In the previous section we described three methods to assess the impacts of tighter requirements for the energy efficiency of building. Table 9.3 summarises the main results.
Table 9.3 Overview of strengths and weaknesses of the three methods
Model family
analysis
Static micro-
simulation model
Dynamic micro-
simulation model
Time and budget requirements ++ - --
Analysis of regional differences O + +
Impact of changes in the population - + ++
Behavioural effects important - - ++
The main difference between model family analysis and (static and dynamic) micro-simulation is that it uses hypothetical cases whereas micro-simulation models use survey or administrative data as input. This will provide some limitations with regard to the distributional analysis. Impacts for certain smaller groups due to specific interactions may be overlooked in a model family analysis. Therefore specific attention should be paid to the identification of the representative cases. However, a major advantage is that budget and time requirements will be relatively limited. Besides, it will be relatively easy to use the model at an EU-wide level. However, again the identification of the representative cases may cause some problems as well as the comparison of results between member States. Static micro simulation models are specifically useful when distributional impacts are considered important, especially in the short run. A static micro-simulation model provides a more precise estimate of the bandwidth of the income effects and can also provide information on the coverage of the policy measure in certain target groups.

147
Besides, the budgetary impact of a policy measure can be calculated relatively easy. Using static micro-simulation it is also possible to assess long term distributional effects due to changes in the population. Finally, differences between regions are an output of a micro-simulation analysis. Finally, dynamic micro-simulation models are useful when behavioural effects are assumed important. In the analysis we show that behavioural effects can be expected both in the housing market and with respect to consumer behaviour.


149
PART C – COUNTRY REVIEWS


151
10 Country Reviews
10.1 Austria
10.1.1 Highlights on impact assessment practices
Since 2001, there has been a regulatory obligation in Austria for the federal government to consider the effects of policy proposals in their financial, economic, social, environmental and consumer dimensions when drafting or amending laws. The impact on administrative burdens and costs have also to be considered. However, despite this obligation, the overall impression exists that social impact assessments have been carried out in a rather superficial way and without much methodological rigour. Indeed, most of the impact assessment work is carried out on the basis of informal practice and there are no practical guidelines that provide any substantial methodological support. Building on Sen's capability approach, the underlying reasons for this state of play are mainly related to stakeholders (including political decision makers, administrative units, statistical offices, the scientific community and NGOs) and resource limitations100. A large proportion of IA carried out in Austria are related to budgetary and distributional outcomes of income tax reforms. The Ministry of Finance analyses the impact of reforms at the level of taxpayers or on the household level. Furthermore, work has been carried out on the reform of pension policy, which has led to specific assessments of labour market outcomes. Another field of interest concerns projections of long-term economic development and its impacts on the labour market. This type of work is carried out by the Ministry of Labour, Social Affairs and Consumer Protection. Moreover, there are ad hoc studies related to the impact of reform measures on income redistribution requested by the National Parliament. Institutions active in the field • Ministry of Finance (Alfred Katterl); • Ministry of Labour, Social Affairs and Consumer Protection (Hans Steiner); • Labour Market Service; • Austrian Federal Labour Chamber / Austrian Federal Economic Chamber; • Institute for Advanced Studies (Helmut Hofer/Lorenz Lassnigg); • Wirtschaftsforschungsinstitut (Wifo, Helmut Mahringer); • European Centre for Social Welfare Policy and Research (Michael Fuchs); • Austrian Institute for Family Studies (Wolfgang Mazal).
100 See also the Austrian contribution to the Peer Review on Social Impact Assessment, Slovak Republic, 6-7 November 2008.

152
10.1.2 Methodological response
Most of the IA is carried out with simulation models on the micro-level while there also macro simulation models. In addition, some empirical/econometric models are used. The following table gives an overview of the models used for ex-ante IA in Austria that are considered highly relevant.
Table 10.1 Relevant methods in Austria
Type of
method
Name of
model
Source Short description What policy areas can
be addressed
Rele-
vance
Dynamic
general
equilibrium
model
TAXLAB IHS DCGE model,
detailed description
of labour supply
Labour market policies,
tax policies
high
Theory based
Econometrics
Macroeconomi
c Models
IHS, Wifo, OeNB Macro-econometric
Models
Macro Policies, Labour
market policies
high
I-O Input-Output
Models
IHS, Wifo Input-Output Model Sectoral policies High
Disaggregate
d macro-
economic
model
PROMETEUS,
MulitREG
WIFO Labour market model labour supply, labour
demand, income
High
Trend
calculations,
least square
estimations,
etc.
Ministry of Labour,
Social Affairs and
Consumer
Protection
Forecast models for
the laobur market on
micro data basis
labour supply, number
of employed persons,
number of unemployed
persons, etc.
High
Micro-
simulation +
labour supply
model
ITABENA IHS Tax-Benefit Model Tax Polices, Social
Policies, Employment
Policies
High
Static Micro-
simulation
EUROMOD/AU
STROMOD
European Centre
for Social Welfare
Policy and
Research (orig.
EUROMOD
developed by
ISER/Essex)
Model for the impact
analysis of tax-
/benefit reforms
disposable income,
income redistribution
(tax reforms,
introduction of benefits,
etc.), income poverty
High
10.2 Finland
10.2.1 Highlights from IA practice
Thanks to the very comprehensive and up to date statistics available in Finland, policies and their impacts have been studied in detail for decades, using some quantifiable models and a larger number of qualitative methods. Models have especially been used to estimate
153
the expected impacts of (costly) budgetary, fiscal and social benefit policies. However, otherwise, ex-post impact assessments have been significantly more common, owing to the limited resources and time before policy decisions are made. But these ex-post studies are often being used to support policy making – providing key input to ex-ante assessments of new policies101. In addition, forecasting models and various (trend) indicators are used extensively to guide the policy-making in Finland. These methods work especially well due to the outstanding statistical information and constant collection of new data. The demand for ex-ante impact assessment of regional level employment or of social impacts is rising from various parts of the Finnish government, but a common factor is that a large proportion of this research is related to budgetary issues (such as taxes, social benefits, subsidies, budget division to regions, etc.). For example, the Ministry of Social Affairs has been using a micro-simulation model to estimate the redistribution and income impacts of various social benefits, such as student subsidies. In addition, especially CGE models have been used to calculate the regional employment impacts of tax reductions. In addition, some impact assessment studies have been undertaken for large-scale legislative and regulatory measures. For example, the former Ministry of Internal Affairs (current Ministry of Employment and Economy) undertook an impact analysis of the expected wide scale effects of regionalisation policy. Most of the ex-ante impact assessments studied with respect other policy fields (such as transport policies) focused mostly on nation-wide employment impacts, if at all (e.g. general economic and environmental impacts were studied in more detail). Furthermore, forecasting models are heavily used in the field of education policy. Institutions active in the field • Government Institute for Economic Research in Finland (Valtion Taloudellinen
Tutkimuskeskus, VATT). They own also some of the main models used to ex-ante impact assessments (as listed above);
• Ministry of Employment and the Economy (TEM) is actively researching the impacts of different policies and what policy actions should be made in the field. Even though the TEM is doing some ex-ante evaluations, majority of the research seems to concentrate still on ex-post impact assessment studies (and use of pilots) and use of current data/indicators and forecasts for policy-making. Also other ministries, such as the Social Ministry, have made some relevant research;
• The Labour institute for Economic Reseach (Palkansaajien tutkimuslaitos) is also researching constantly the employment and social impacts of various policies and the current situation and making forecasts of the expected changes. However, majority of their work is also concentrated on ex-post studies and forecasting 102;
• Pellorvo Economic Research Institute (Pellervon taloudellinen tutkimulaitos); • Research Institute of the Finnish Economy (ETLA) are mostly directed to ex-post
analysis and forecasting, but do perform some ex-ante analysis as well.
101 VATT (2008), Vaikuttavaa tutkimusta – Miten arviointitutkimus palvelee päätöksenteon tarpeita?, VATT Publications 47 102 http://www.labour.fi/ptprojektit.asp

154
10.2.2 Methodological response
In Finland, most of the direct impact assessment methods are rather quantitative, while ex-ante impact assessment are done also with “softer” multi-approaches including some data analysis and more qualitative methods (e.g. pilot methods). The following table lists the main methods and models found to be used in ex-ante impact assessments of regional employment impacts and social impacts in Finland, that are considered to be highly relevant. However, more emphasis has been given to the more quantitative methods used over the qualitative ones.
Table 10.2 Relevant methods in Finland
Type of
method
Name of
tool/method
found
Source Short description What policy areas
can be addressed
Rele-
vance
Employment impact assessment models
Dynamic
Regional CGE
mocel
RegFin Törmä Hannu,
Rutherford Thomas
F. Regional
computable general
equilibrium mode for
Finland
Kemi-Tornion
ammattikorkeakoulun
julkaisuja
Sarja E. Työpapereita
1/1998.
Independent
regions though
moving capital and
labour
Unemployment
included
6 sectors only per
region
Statis and dynamic
options
Provides estimates
for: production,
employment,
unemployment,
trade
Government and local
state budget impact
estimations
High
Regional CGE
model
VERM –
model
VATT,
http://www.vatt.fi/en/r
esearch/areaIV/
Detailed regional
economic
description
Provides estimates
for production and
employment
Various policies
• e.g. regional
support policies
• regionalisation
policy(of
government
institutes)
High
Dynamic
Regional
Macroeconomi
c model
HEMAASU
model
Regional council of
Northern-Savo:
http://www.pohjois-
savo.fi/fi/psl/liitetiedos
tot/hemasu.pdf
The demographic
part of the model
comprises
anticipation of the
population and the
supply of labour.
• Regional and
local policies
• Budget policies
• Rural policies
• Educational
policies
High
Social impact assessment methods
Static Micro-
simulation
model
TUJA VATT,
http://www.vatt.fi/en/r
esearch/areaII/
• Household
level
redistribution
and income
• Financial and
social policy (Ex-
ante evaluation
of tax and social
High

155
Type of
method
Name of
tool/method
found
Source Short description What policy areas
can be addressed
Rele-
vance
effects of
government
tax and social
policies
• Static model,
dynamic parts
in
development
redistribution
reforms)
• Other legal
changes
assessments
Micro-
simulation
model
SOMA -
model
Social ministry of
Finland ,
http://www.vatt.fi/file/v
att_publication_pdf/k2
96.pdf
• Redistribution
and income
effects of
government
tax and social
policies
Financial and social
policies (e.g. taxes,
unemployment
benefits, student
benefits, housing
subsidies, etc.)
High
10.3 France
10.3.1 Highlights from IA practice
In France, there was no institutional requirement for ex-ante impact assessment by law. However, in 1998 the Conseil National de l’Evaluation, CNE was created and has recommended the further development of evaluation practice at the level of central government. Even more recently, in April 2009, a law was changed and stricter requirements were enforced. Ex-ante evaluations are conducted informally by, or on behalf of, the government or on behalf of parliamentary commissions. There are no handbooks or official guidelines for this. A majority of ex-ante impact assessment in France is concerned with fiscal effects of social reforms (tax-benefit system, labour market regulation etc.). Other fields of interest are effects of reforms on labour supply or labour incentives. Over the years, France has built up a strong tradition in 'territorial impact assessment' – driven by regional policy objectives to spread economic and employment growth to areas outside the Ile-de-France. Up to the 1980s and 1990s, sophisticated assessments of the spatial effects of sectoral policies were executed on behalf of the former central government agency DATAR, for instance by making use of gravity models. These studies were effectively considered when preparing new transport and economic strategies at both national and regional level. However, the interest in this type of work has recently faded in France – above all due to shifting political priorities and a subsequent reallocation of public resources.
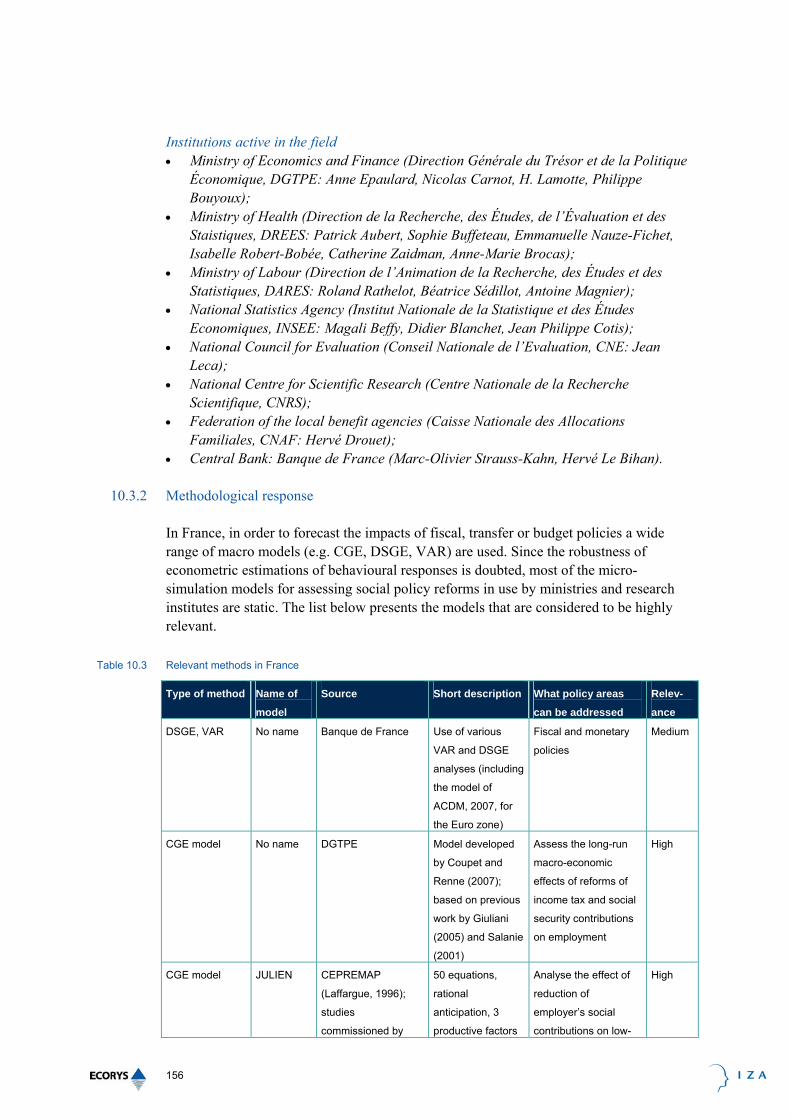
156
Institutions active in the field • Ministry of Economics and Finance (Direction Générale du Trésor et de la Politique
Économique, DGTPE: Anne Epaulard, Nicolas Carnot, H. Lamotte, Philippe Bouyoux);
• Ministry of Health (Direction de la Recherche, des Études, de l’Évaluation et des Staistiques, DREES: Patrick Aubert, Sophie Buffeteau, Emmanuelle Nauze-Fichet, Isabelle Robert-Bobée, Catherine Zaidman, Anne-Marie Brocas);
• Ministry of Labour (Direction de l’Animation de la Recherche, des Études et des Statistiques, DARES: Roland Rathelot, Béatrice Sédillot, Antoine Magnier);
• National Statistics Agency (Institut Nationale de la Statistique et des Études Economiques, INSEE: Magali Beffy, Didier Blanchet, Jean Philippe Cotis);
• National Council for Evaluation (Conseil Nationale de l’Evaluation, CNE: Jean Leca);
• National Centre for Scientific Research (Centre Nationale de la Recherche Scientifique, CNRS);
• Federation of the local benefit agencies (Caisse Nationale des Allocations Familiales, CNAF: Hervé Drouet);
• Central Bank: Banque de France (Marc-Olivier Strauss-Kahn, Hervé Le Bihan).
10.3.2 Methodological response
In France, in order to forecast the impacts of fiscal, transfer or budget policies a wide range of macro models (e.g. CGE, DSGE, VAR) are used. Since the robustness of econometric estimations of behavioural responses is doubted, most of the micro-simulation models for assessing social policy reforms in use by ministries and research institutes are static. The list below presents the models that are considered to be highly relevant.
Table 10.3 Relevant methods in France
Type of method Name of
model
Source Short description What policy areas
can be addressed
Relev-
ance
DSGE, VAR No name Banque de France Use of various
VAR and DSGE
analyses (including
the model of
ACDM, 2007, for
the Euro zone)
Fiscal and monetary
policies
Medium
CGE model No name DGTPE Model developed
by Coupet and
Renne (2007);
based on previous
work by Giuliani
(2005) and Salanie
(2001)
Assess the long-run
macro-economic
effects of reforms of
income tax and social
security contributions
on employment
High
CGE model JULIEN CEPREMAP
(Laffargue, 1996);
studies
commissioned by
50 equations,
rational
anticipation, 3
productive factors
Analyse the effect of
reduction of
employer’s social
contributions on low-
High

157
Type of method Name of
model
Source Short description What policy areas
can be addressed
Relev-
ance
ministry of labour or
affiliated councils
(former CSERC)
(capital, skilled and
unskilled labour)
skill labour; of change
in minimum wage
Dynamic CGE
model
CHARLOT
TE
CEPREMAP
(Laffargue, 1996),
commissioned by
DGTPE
Dynamic model,
rational
anticipation, 5
household types
(workers with 3
skill levels,
unemployed, civil
servant, inactive
people); account
for the main
fiscal/social
parameters
Unemployment for
different group of
workers (skilled,
unskilled); wage
inequality between
these groups
High
Dynamic micro-
simulation
DESTINIE INSEE Dynamic model
with demographic
and economic
events to analyze
the evolution of
social security
benefits in the long
Term (2040)
Assess reforms of the
pension schemes, in
particular demographic
effects, distributional
effects and
employment effects
(long-term female
participation)
High /
but high
sensitivit
y to
assumpt
ions
Randomization No name Direction de
l’Animation de la
Recherche, des
Études et des
Statistiques (DARES,
Ministère du Travail)
Social experiments Effects of private vs.
public assistance to
job search by
unemployed workers
Labour
market
policy
Static micro-
simulation
MYRIAD CNAF Model used to
simulate actual
and suggested
reforms of the
family benefit
system
Mostly family benefits,
but also social benefits
and taxes
High
Static and
behavioural
micro-simulation
SAPHIR DGTPE Tax model built on
a large
representative
sample (500,000) ;
tax-benefit model
build on a smaller
representative
sample; wage and
participation
equation
Distributional effect of
taxes, social
contributions,
transfers ; some
labour supply
response
High
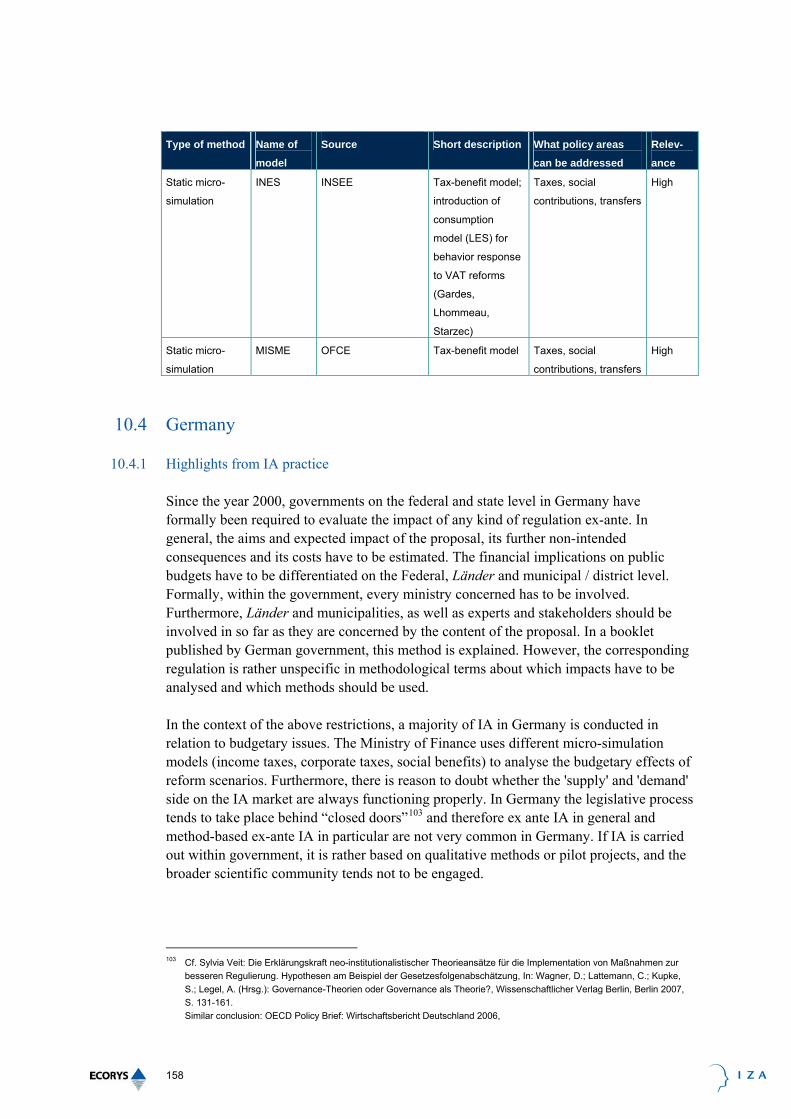
158
Type of method Name of
model
Source Short description What policy areas
can be addressed
Relev-
ance
Static micro-
simulation
INES INSEE Tax-benefit model;
introduction of
consumption
model (LES) for
behavior response
to VAT reforms
(Gardes,
Lhommeau,
Starzec)
Taxes, social
contributions, transfers
High
Static micro-
simulation
MISME OFCE Tax-benefit model Taxes, social
contributions, transfers
High
10.4 Germany
10.4.1 Highlights from IA practice
Since the year 2000, governments on the federal and state level in Germany have formally been required to evaluate the impact of any kind of regulation ex-ante. In general, the aims and expected impact of the proposal, its further non-intended consequences and its costs have to be estimated. The financial implications on public budgets have to be differentiated on the Federal, Länder and municipal / district level. Formally, within the government, every ministry concerned has to be involved. Furthermore, Länder and municipalities, as well as experts and stakeholders should be involved in so far as they are concerned by the content of the proposal. In a booklet published by German government, this method is explained. However, the corresponding regulation is rather unspecific in methodological terms about which impacts have to be analysed and which methods should be used. In the context of the above restrictions, a majority of IA in Germany is conducted in relation to budgetary issues. The Ministry of Finance uses different micro-simulation models (income taxes, corporate taxes, social benefits) to analyse the budgetary effects of reform scenarios. Furthermore, there is reason to doubt whether the 'supply' and 'demand' side on the IA market are always functioning properly. In Germany the legislative process tends to take place behind “closed doors”103 and therefore ex ante IA in general and method-based ex-ante IA in particular are not very common in Germany. If IA is carried out within government, it is rather based on qualitative methods or pilot projects, and the broader scientific community tends not to be engaged.
103 Cf. Sylvia Veit: Die Erklärungskraft neo-institutionalistischer Theorieansätze für die Implementation von Maßnahmen zur
besseren Regulierung. Hypothesen am Beispiel der Gesetzesfolgenabschätzung, In: Wagner, D.; Lattemann, C.; Kupke, S.; Legel, A. (Hrsg.): Governance-Theorien oder Governance als Theorie?, Wissenschaftlicher Verlag Berlin, Berlin 2007, S. 131-161. Similar conclusion: OECD Policy Brief: Wirtschaftsbericht Deutschland 2006,

159
Notwithstanding the above, impact assessment studies are from time to time commissioned to independent research institutes, commonly by the Ministry of Finance, as well as other Ministries (especially Economic Affairs, Labour and Social Affairs). A specific characteristic of the German landscape is the wealth of such independent and often authoritative research institutes. Sometimes, results from such independent and competing research institutes contradict – often due to differences in the use of assumptions, methods and models. In the federal German landscape, such findings often give rise to diverging interpretations regarding 'costs and benefits' that accrue to particular Federal States – often in the context of the East-West divide in the country. Institutions active in the field • Ministry of Finance (Ulrich van Essen, Volker Lietmeyer); • Ministry of Labour and Social Affairs; • Ministry of Economic Affairs; • Fraunhofer Institute FIT (Hermann Quinke); • German Institute for Economic Research (DIW Berlin) (Viktor Steiner, Stefan Bach); • IZA - Institute for the Study of Labor (Hilmar Schneider, Andreas Peichl); • ZEW - Centre for European Economic Research (Holger Bonin); • Institute for Employment Research (IAB) (Michael Feil); • GWS: Gesellschaft für Wirtschaftliche Strukturforschung (Bernd Meyer).
10.4.2 Methodological response
Most of the mandatory ex-ante IA in Germany is done with qualitative methods (e.g. pilot projects, Delphi method, standardized questionaires) and almost never published. The following table lists the main quantitative models found to be used in ex-ante IAs of regional employment and social impacts in Germany, that are considered to be highly relevant.
Table 10.4 Relevant methods in Germany
Type of
method
Name of
model
Source Short description What policy areas
can be addressed
Rele-
vance
Regional employment impact modelling
Macroeconomic
simulation
combined with
environmental
model
PANTA RHEI GWS Combination of
IAB/INFORGE
and environmental
model
Employment
High
Social impact modelling
Behavioural
household
micro-
simulation
STSM DIW
ZEW
IAB
Tax benefit model Income tax
Social benefits
High
Behavioural
household
micro-
simulation
IZA(PSI)MOD IZA Tax benefit model Income tax
Social benefits
High

160
Type of
method
Name of
model
Source Short description What policy areas
can be addressed
Rele-
vance
Linked
Behavioural
household
micro-
simulation +
CGE
STSM-PACE-
L
ZEW
IAB
Tax benefit model Income tax
Social benefits
High
The quantitative analysis of social impacts is much more prominent in Germany than the analysis of regional employment effects. In addition, forecasting models are in use in Germany to forecast growth (e.g. RWI-Konjunktur-Modell, Bundesbank DSGE-Modell) and employment as well as demographic changes. These estimations are used heavily in policy-making. However, by definition, these models are not actual impact assessment models, but they rather guide the policy making process by providing estimates on the expected changes if no policies are taken (or tell what kind of needs there are in the future that should be met by policies).
10.5 Ireland
10.5.1 Highlights from IA practice
In Ireland, social impact assessment exists under various headings, including poverty impact assessment and equality impact assessment including gender impact assessment and disability impact assessment104. At national level, poverty impact assessment has been conducted under the auspices of the Office for Social Inclusion (OSI), which forms part of the Department of Social and Family Affairs. The OSI has overall responsibility for coordinating and driving the government’s social inclusion agenda. The OSI defines Poverty Impact Assessment as the process by which government departments, local authorities and State agencies assess policies and programmes at design, implementation and review stages in relation to the likely impact that they will have or have had on poverty and on inequalities which are likely to lead to poverty, with a view to poverty reduction. Over the years, this so-called 'poverty proofing' has turned out to be rather problematic –as it requires specialised expertise and appropriate resourcing. Furthermore, other issues include the definition of poverty and the need to address data deficiencies. From 2008 onwards, a process of ‘Poverty Impact Assessment’ has been agreed as a way forward. Despite the existence of guidelines provided, the methodological steer remains limited105. More recently, Regulatory Impact Assessment (RIA) has been introduced to assess the likely costs, benefits and impacts of new regulations. RIA employs a process similar to that employed for Poverty Impact Assessment. To date, while there is an awareness that
104 See also the Irish contribution to the Peer Review on Social Impact Assessment, Slovak Republic, 6-7 November 2008. 105 See for the Poverty Impact Assessment Guidelines: http://www.socialinclusion.ie/documents/PIAGuidelineswithnewEU-
SILCfigures_000.pdf

161
government departments are now required to assess the same policies over an ever increasing range of impacts, integrated impact assessment remains to be developed. Ireland has benefited considerably from the European Structural Funds, and this also holds true for the development of ex-ante impact assessment methods in both the economic and social domain. Indeed, the substantial budgets of Structural Funds programmes (especially so in the periods 1994-99 and 2000-2006) have spurred much research on the macro-economic and regional impacts of these interventions. In turn, this has contributed to the elaboration of economic models in the area, notably the development of the HERMIN / HERMES model already referred to in Chapter 3.3106. Much of the social, employment and economic impact assessment in Ireland is carried out by the Economic and Social Research Institute (ESRI) in Dublin. Institutions active in the field • IPD (Investment Property Databank); • National Training and Employment Authority, FÁS; • National Economic and Social Forum (NESF); • National Economic and Social Council (NESC); • Office of Public Sector Information; • Department of Finance and Personnel; • Economic and Social Research Institute (ESRI); • Better Regulation Unit; • Department of the Taoiseach.
10.5.2 Methodological response
A growing interest is now to develop regional outlook frameworks that are linked to national economic models107. A prominent example s the HERMES macro-economic model of the Irish economy, that was first developed in the late 1980s. Since its inception the model has undergone substantial further development to improve its treatment of how the Irish economy works, taking account of advances in economic research, and also to keep pace with the changing structure of the economy. The detailed specification of the supply side of the HERMES model made it particularly suitable for tasks such as modelling the impact of the EU Structural Funds and related investment on the Irish economy as well as studying the impact of EMU on the economy. It has also proved to be a very suitable tool for developing consistent medium-term forecasts for the economy and for analysing the long-term impact of major policy variables.
106 See for a recent publication about the use of the HERMES model in the Irish economy:
http://www.esri.ie/UserFiles/publications/20090403095300/WP287.pdf 107 Ahem and O'Donoghue (2006) "Regional Economic Modelling: Evaluating Existing Methods and Models for Constructing
and Irish Prototype". Jan. 2006
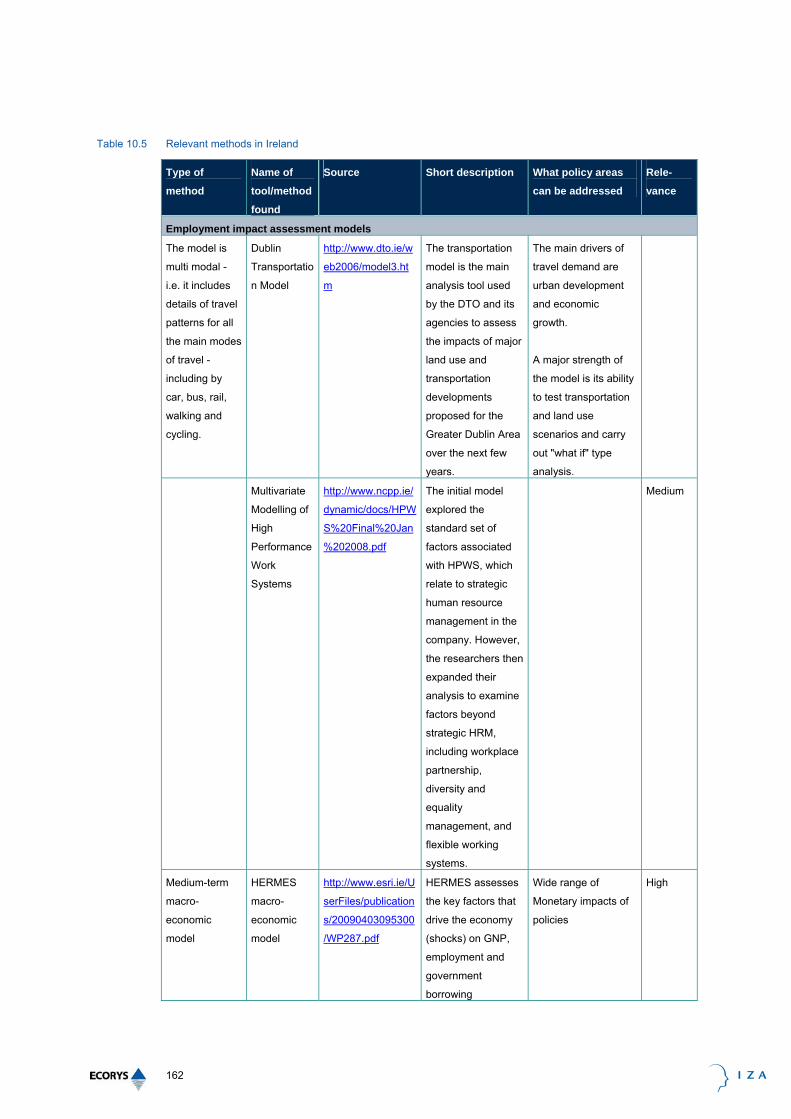
162
Table 10.5 Relevant methods in Ireland
Type of
method
Name of
tool/method
found
Source Short description What policy areas
can be addressed
Rele-
vance
Employment impact assessment models
The model is
multi modal -
i.e. it includes
details of travel
patterns for all
the main modes
of travel -
including by
car, bus, rail,
walking and
cycling.
Dublin
Transportatio
n Model
http://www.dto.ie/w
eb2006/model3.ht
m
The transportation
model is the main
analysis tool used
by the DTO and its
agencies to assess
the impacts of major
land use and
transportation
developments
proposed for the
Greater Dublin Area
over the next few
years.
The main drivers of
travel demand are
urban development
and economic
growth.
A major strength of
the model is its ability
to test transportation
and land use
scenarios and carry
out "what if" type
analysis.
Multivariate
Modelling of
High
Performance
Work
Systems
http://www.ncpp.ie/
dynamic/docs/HPW
S%20Final%20Jan
%202008.pdf
The initial model
explored the
standard set of
factors associated
with HPWS, which
relate to strategic
human resource
management in the
company. However,
the researchers then
expanded their
analysis to examine
factors beyond
strategic HRM,
including workplace
partnership,
diversity and
equality
management, and
flexible working
systems.
Medium
Medium-term
macro-
economic
model
HERMES
macro-
economic
model
http://www.esri.ie/U
serFiles/publication
s/20090403095300
/WP287.pdf
HERMES assesses
the key factors that
drive the economy
(shocks) on GNP,
employment and
government
borrowing
Wide range of
Monetary impacts of
policies
High

163
10.6 Italy
10.6.1 Highlights from IA practice
In Italy, by far the most important share of IA conducted concerns income and the social effects of tax reforms. A routine assessment of any tax reform is undertaken at the Inland Revenue Department in order to analyse its financial sustainability. In September 2008, a broader institutional requirement for impact assessment was implemented. The law “DPCM N. 170” provides an IA procedure that should be used for all legislative acts of different levels of government. Exceptions are concerned with plans affecting constitutional law, normative acts for internal/external security, and the ratification of international treaties. The implementation procedure and guidelines are closely linked to those recommended by the EU. However, informal discussions with experts seem to suggest that the IA requirement exists only formally. Among the regulation authorities, only one has already passed internal guidelines for IA implementation and only a few others are working on them. In addition, only one region and two municipalities are using IA for their legislative acts. The former government set up commissions on the impact assessment of various tax reforms (personal, capital, and corporate income taxation) informally. However, because of a change of government, these commissions had to stop their activities. Furthermore, and due to the strong regional disparities in the country, Italy has also made progress in the area of regional employment assessments. Noteworthy in this context is the Tuscany-based IRPET research institute, which publishes widely on the regional impact of various central governmental policies. Furthermore, considerable academic activity exists in the area, notably at the University of Milan, from where R. Camagni carries out European-scale work on territorial impact assessment, while M. Florio has been leading on European guidelines for Cost-benefit analysis. Institutions active in the field • Ministry of Finance (Dr. Ottavio Ricchi); • Bank of Italy, Rome (Research Center, Dr. Paolo Sestito, Dr. Stefano Siviero); • Inland Revenue Office (Agenzia delle Entrate); • National Statistical Office, ISTAT (Dr. Gaetano Proto); • Econpubblica, Bocconi University, Milan (Prof. Carlo Fiorio); • CAPP, University of Modena (Prof. Massimo Baldini, Prof. Carlo Mazzafero, Dr.
Marcello Morciano); • ISAE, Rome (Dr. Carlo Declich); • IRPET; • CER, Rome (Dr. Corrado Pollastri); • CERP (Prof. Elsa Fornero); • Prometeia; • REF; • Confederation of Italian Industries Research Centre; • Trade Unions Research Centre.

164
10.6.2 Methodological response
Very often one makes use of (static) micro simulation tax-benefit models, mostly without behavioural response equations. In addition, it is referred to typical cases (e.g. a typical family) or made use of rudimentary cell-based calculations.
Table 10.6 Relevant methods in Italy
Type of
method
Name of
model
Source Short description What policy areas
can be addressed
Relev-
ance
Medium-term
projectionscon
ditional on
international
scenarios.
ITEM http://www.dt.tesoro
.it/it/analisi_progra
mmazione_econom
ico_finanziaria/
modellistica/modell
o_econometrico_ite
m_economia_italia
na.html
Macro-dynamic
quarterly model of
the Italian economy.
Focus separately on
the demand and the
supply side of the
economy. Conditions
from the supply side
(labour force
participation and level
of employment, inter
alia) affect medium
term projections.
High
Large-scale
econometric
model
Bank of Italy
quarterly
macroeconom
etric model
“Modello trimestrale
dell’economia
italiana. Volume 1:
struttura e
proprietà; Volume
2: equazioni e note
tecniche”, Banca
d’Italia, Temi di
discussione, No.
80, 1986; D.
Terlizzese, “Il
modello
econometrico della
Banca d'Italia: una
versione in scala
1:15”, Banca
d'Italia, Ricerche
quantitative per la
politica economica
1993, Roma, Banca
d’Italia,1994.
Macro-econometric
quarterly model of
the Italian economy
Short- and medium-
term projections; any
macroeconomic
assessment of policy
changes
Used
within the
Bank of
Italy.
DSGE model Bank of Italy
DSGEM
R.Cristadoro,
A.Gerali, S.Neri,
M.Pisani, ”Real
exchange rate
volatility and
disconnect: an
empirical
investigation”, Temi
2-country, 2-sector
DSGE model
Forecasting, and
assessment of
structural, monetary,
fiscal policies.
Used
within the
Bank of
Italy.

165
Type of
method
Name of
model
Source Short description What policy areas
can be addressed
Relev-
ance
di discussione, No.
660, April 2008,
http://www.bancadit
alia.it/pubblicazioni/
econo
/temidi/td08/td660_
08/en_td660/en_te
ma_660.pdf
Static
simulations
with
behavioural
response.
ECONLAV http://www.dt.tesoro
.it/it/analisi_progra
mmazione_econom
ico_finanziaria/
modellistica/modell
o_microsimulazione
_econlav/
Static micro-
simulation model,
with behavioural
response equations
for labour supply.
Focus on tax &benefit
effects.
High
Static and
dynamic
simulations.
Bank of Italy
micro-
simulation
model
The model is under
construction. A
predecessor of the
model is:
http://www.bancadit
alia.it/pubblicazioni/
econo/temidi/td04/t
d533_04/
td533/tema_533.pd
f
Dynamic micro-
simulation model of
demographic
development and
household’s
economic behaviour
Demographic model,
combined with a
specification of the
processes generating
income, social
security, wealth,
retirement, and
consumption
behaviour of the
households.
To be
used
within the
Bank of
Italy.
Static
simulations.
MASTRICT ISTAT
http://www.istat.it/d
ati/pubbsci/rivista/n
umero3.1999.htm#
2.1
Static micro-
simulation model.
impact of policy
measures on
household income
distribution, by
simulating personal
taxes ands transfers.
Used
mainly
within
Istat.
Results
occasion
ally
reported
to
parliame
ntary
hearings.
10.7 The Netherlands
10.7.1 Highlights from IA practice
In the Netherlands, from the 1970s onwards, numerous ex-ante evaluation studies have been carried out. Impact studies are an important research discipline and the country has built up a tradition in ex-ante impact assessment for a variety of policy domains. This is

166
both a reflection of the Tinbergen tradition in the research community and the strong position of CPB (Netherlands Bureau for Economic Policy Analysis) in the policy preparation process. Most impact assessment studies are undertaken for income policies, social security and fiscal policies and show the income effects for households. This is related to the importance of the principle of equality in Dutch politics. However, impact analyses related to employment policies and regional policies, constitute only a small share of the overall impact assessment work undertaken. The use of methods to estimate regional employment impacts has been stimulated more recently. Since 2000, it has been obligatory to carry out a Cost Benefit Analysis (CBA) for all national transport infrastructure investments. For important major projects, CBA is used together with regional economic models to show the regional employment impacts of these projects. More recently, CBA has also been expanded in the Netherlands to cover spatial policy domains and urban development. In general, the Dutch government has a tendency to undertake ex-ante economic impact assessments of policies, especially in the field of income, employment, social security and fiscal policies. Several handbooks have been written to assist policy makers and researchers in conducting assessments. However, more progress has been made for infrastructure and spatial development projects than for policies in the social domain. Especially in the fields of education, security and social inclusion, ex-ante impact assessments are scarce and more ad-hoc. If one considers the type of policy instrument, most ex-ante impact assessments are undertaken in the field of monetary stimulus policies (investments, subsidies and taxes). In the areas of regulation and coordination and communication-type instruments, ex-ante impact assessment is very rare. Several research centres are attempting to expand the range of methods and tools available, financed (partly) by the Dutch government. CentERdata is an example of such a research institute. They received major NWO funding for the project entitled: An Advanced Multi-Disciplinary Facility for Measurement and Experimentation in the Social Sciences (MESS). These funds have been used to establish a new representative panel of 5,000 Dutch households: the LISS panel. The new panel focuses on fundamental longitudinal research and provides a laboratory for the development and testing of new, innovative research techniques. The MESS project is strongly geared towards integrating different academic disciplines. Furthermore, the CentERlab provides the equipment for experiments in economics and business. Papers have been published on a whole range of issues, including topics as the influence of unemployment benefit sanctions on job search. Institutions active in the field Regional employment: national planning bureaux are involved in the development and application of methods and tools for impact assessment in the Netherlands, as they are independent institutes that have to advise on policies as put forward by the ministries. For regional impact assessment of policies, these institutes are: • Netherlands Bureau for Economic Policy Analysis (CPB) (mainly economic impacts
of policies); • Netherlands Spatial and Environmental Assessment Agency (PBL) (mainly spatial
and environmental impacts of policies).

167
Moreover, there are several academic, (partly) public or private research institutes that carry out regional impact assessment work. Among these are: • TNO (applied research); • ECORYS (research and consulting); • NEA (research and consulting in transport, infrastructure, logistics); • KiM (knowledge institute for mobility); • RUG (University of Groningen). Social policy: the planning bureau concerned with social policy is the Social and Cultural Planning Office of the Netherlands (SCP). This institute mainly undertakes social research and ex-post evaluation of policies in the field of education, labour market and integration. The institute rarely undertakes systematic quantitative ex-ante policy evaluations for the social policy domain. The Netherlands Bureau for Economic Policy Analysis (CPB) undertakes mainly ex-ante economic impact studies for more socio-economic policies such as social security reforms, tax changes and income policies. Most of the studies focus on impacts on the labour market, income and GDP. The relevant ministry in this field is the Ministry of Social Affairs and Employment. The Ministry (its research department) has a forecasting model for social security and can perform ex-ante impact assessment of social security reforms (mainly on income and costs of the welfare system). Other institutes performing impact assessment include: • CENTER (academic research institute for economic and business); • ECORYS (research and consulting); • SEO (research on labour market issues); • OSA (research on labour market issues); • ITS (academic research institute for social sciences); • ICS (academic research institute for social sciences); • AIAS (academic research institute for labour market issues).
10.7.2 Methodological response
In the Netherlands, micro-simulation seems to be one of the most important methods to analyse policies related to the labour market and participation. This has been linked to child care and participation of women on the labour market. In the overview presented hereafter, two examples of micro-simulation models are included, which shows that this type of model is also used for impacts of income policies, social security and redistribution. Furthermore, the use of (controlled) experiments with policy pilots before new policy is occasionally implemented in the social sciences. A study carried out in 2004 (Verdurmen et al.) found only 12 experiments that randomly assigned participants to a control and study group. Half of these were related to parenting, three to prevention of alcohol/drugs abuse and three to problematic behaviour. The method is not used often in the Netherlands on financial, ethical and legal grounds, as the selection of the sample group

168
will naturally exclude others. Sometimes, a non-randomized experiment was set up to mitigate these selection problems. In the Netherlands, this has been done for judicial policies. The results of the analyses were troubled by the non-randomness of participants, as only motivated participants subscribed for the study groups. The most recent extension is the Impact Evaluation Framework for Regional Development Agencies (RDAs). The model provides a familiar, practical approach. It does not typically address questions around the quality of employment impacts and its focus is primarily on short term effects. Most importantly, it is primarily applicable in contexts where there is significant underutilisation of resources/unemployment. In very pressured labour markets the main effect of interventions may be to 'crowded out' and lower value added activities through the factor markets, with positive effects on productivity, competitiveness and factor incomes but with more limited effects on overall employment.
Table 10.7 Relevant methods in the Netherlands
Type of
method
Name of
model
Source Short description What policy areas
can be addressed
Rele-
vance
Regional employment impact modelling
Regional
economic
model with
elements of
both
demand
model, input-
output, new
economic
geography
and some
general
equilibrium
elements
(feedback on
wages and
prices).
REMI-NEI
model
(ECORYS)
Netherlands
Institute for Spatial
research – A
survey of spatial
economic planning
models in the
Netherland, 2005
Able to quantify
impact of policies in
the fields of
transport, spatial
investments, labour
market, energy,
environment (mainly
monetary stimulus
policies). The
results can be
obtained for regions
(eight regions) and
national level.
Secondly, the
model can be used
for long-term
scenario
construction. The
model can deliver
input for cost benefit
analysis, after some
adjustments. The
model contains both
demand, labour
market, input-
output and supply
side elements and
feedbacks between
regions. The model
Used mainly for
infrastructure projects
and urbanisation
perspectives.
High

169
Type of
method
Name of
model
Source Short description What policy areas
can be addressed
Rele-
vance
includes some New
Geography
elements
(agglomeration
advantages and
disadvantages).
Multi-sector
applied
general
equilibrium
model, NEG
based
model.
RAEM-
Regional
Applied general
Equilibrium
Model
(TNO/RUG)
Netherlands
Institute for Spatial
research – A
survey of spatial
economic planning
models in the
Netherland, 2005
The model is
especially suited to
evaluate impacts
and produce
forecast for policy
on transport
infrastructure, but
can be extended to
other types of
policies. It
determines the
overall effects of
policy measures
and takes indirect
effects into account
in detail. The output
indicates changes
in regional labour
market conditions,
amongst others.
Has been used since
2000, to analyse
effects of substantial
infrastructure projects
in the Netherlands:
High
Social impact modelling
Static and
dynamic
micro-
simulation
MICROS
(SZW)
http://www.nwo.nl/fil
es.nsf/preview/NW
OP_5UDLVN/$file/
WSAverslagMicrosi
mulatie25juni1999.
Income policy. This
model is based on a
population of
60.000 households,
taken from a
national survey
(2002?) of the
Ministry of Housing,
Spatial planning
and the
Environment. The
model is able to
calculate household
income (for
consumption),
taking into account
changes in:
• Tax rules
• Social security
Used by the Ministry
of Social Affairs and
Employment
High

170
Type of
method
Name of
model
Source Short description What policy areas
can be addressed
Rele-
vance
payments
• (gross) welfare
befits
• (gross) wages
• Level of
pensions and
living costs
Micro-
simulation
MIMOSI (CPB
http://www.cpb.nl/e
ng/model/)
A model used to
analyse changes in
income policy.
Since the summer
of 2007, CPB
Netherlands Bureau
for Economic Policy
Analysis has
employed the
MIMOSI micro
simulation system
for forecasts and
analyses in the
related fields of
purchasing power,
labour costs, social
security and income
taxation. This model
is based on 2002
data and its
purpose is to
replace the 3
separate models
that were used
before in an
integrated manner.
This model replaces
the formerly used
three CPB models
since 2008 and is
mainly used by the
Social Security unit of
the CPB. Its
predecessor was
used by the CPB to
calculate:
• Social security
receipts and
payments
• Income tax
receipts
• Social benefit
payments
High
10.8 Poland
4.2.10 Highlights from IA practice
Impact assessment has only a weakly developed theoretical basis in Poland itself and there is no real tradition in this area. Despite the transition of the 1990s, the evaluation of public policies remained under-developed. The first step towards wide-scale evaluation efforts can be linked to the enlargement of the EU in 2004, when Poland became a

171
beneficiary of the Cohesion policy and Structural Funds. This process demanded implementation of the evaluation procedures required by the European Commission108. Furthermore, a system of the regulatory impact assessment (RIA) was introduced in Poland in 2001. Practice so far has shown that, despite the fact that RIA has been in place in the Polish legal system for the last six years, it is still far from perfect. Therefore, the Council of Ministers adopted Guidelines for Regulatory Impact Assessment in October 2006109. The Guidelines introduce some new elements, such as broader environmental impact, assessment of administrative burdens on entrepreneurs, ex-post Regulatory Impact Assessment based on the cost-benefit approach or an electronic database on RIAs available to the public110. The most progressive public interventions in terms of employment and social IA are the programmes financed from the Structural Funds. However, the guidelines regarding IA remain very general. There are several handbooks devoted to ex-ante evaluation, which also cover the topic of the employment and social impact assessment, but these are commonly not translated into Polish with limitations to their usefulness as a consequence111. A separate set of IA handbooks, prepared for the needs of national programmes and policies, has been in circulation since November 2008. This initiative is part of the “Guidelines to Regulatory Impact Assessment” implementation process. Most EU-driven Impact Assessments and guidelines in circulation in Poland mainly focus on monetary interventions, related to the substantial Structural and Cohesion Fund programmes. Within these, the focus is clearly on economic and environmental aspects, with the employment and social dimension remaining considerably behind. Clearly, the requirements in environmental IA are more stringent now and this has led to considerable attention and debate on programmes implemented under Structural and Cohesion Funds, notably focusing on infrastructural investments. These requirements have clearly led to a growth in the evaluation market. Consequently, the range of methods in use and the quality of the monitoring system is much better. In comparison to economic and environmental IA, employment and social IA is more fragmented and for a long time was not obligatory. Even if there is a separate section on employment and social IA in the ex-ante evaluation, the main focus is on labour market-related issues, for at least two reasons. Firstly a methodological reason: employment lends itself more easily to measurement and quantification than other social themes. Secondly, a policy-related reason: the rapid growth in structural unemployment in the late 1990s became the biggest concern for the government, and most public policies and programmes in Poland therefore include direct or indirect employment goals. The same applies to the programmes implemented under the Structural Funds.
108 Szlachta J., 2007, Ewaluacja ex ante funduszy strukturalnych w Polsce - rys historyczny, Ministerstwo Rozwoju
Regionalnego (Ministry of Regional Development) http://www.funduszestrukturalne.gov.pl/NR/rdonlyres/4E41CBAE-F849-48BE-BAC9-0614753930AA/38871/publikacjaluty1.pdf
109 Szarfenberg R., 2009, Ewaluacja strategii a polityka społeczna, Instytut Polityki Społecznej, Uniwersytet Warszawski http://www.ips.uw.edu.pl/rszarf/pdf/ewalps.pdf
110 http://www.reforma-regulacji.gov.pl/english/Regulatory+reform+programme/Regulatory+Impact+Assessment+RIA/ 111 See http://www.funduszestrukturalne.gov.pl/English/Evaluation/Evaluation+documents/
172
Therefore, the most important thematic area in the analysed IA studies is employment and labour market. The range of variables investigated under this heading is very broad and includes: labour market supply, labour market flows, change in the number of workplaces, spatial, occupational and sectoral change in creation of new work places, etc. In some studies labour market-related impacts concern narrow groups, such as people employed in agriculture, people employed in industry, job creation in rural areas, etc. In comparison, other social topics in ex ante studies suffer from a lack of adequate analytical methods and tools. They include gender equality, equality in accessibility to public services for disabled and various impacts on rural areas. The methodology of these studies is usually based on an expert approach only. Compared to EU-supported policies, programmes and projects, the situation is different in case of national policies and programmes. Some of these still lack an adequate ex-ante evaluation at all, although most of them include a diagnosis and some elements of forecasting. These are, however, mostly focused on direct products and results of a particular intervention, and tend to include indirect impacts including those in employment and social domains. When public programmes are continued, then very often the ex-post evaluation automatically becomes a basis for measurement of employment and social effects. A good example is the evaluation of preventive health programmes implemented by the Polish Ministry of Health, such as the National Programme for Overweight and Obesity Prevention112. In Polish IAs, an expert-based approach is most commonly used, which takes into account the lack of empirical analysis. Indeed, the supply of adequate evaluation services is developing very slowly and is one of the barriers in IA studies overall. In practice, supply is further restricted by the fact that foreign IA-expertise is not commonly imported due to language barriers and the specificities of the Polish situation. A positive aspect of IA being developed in Poland is the participatory model of intensive collaboration between evaluators and Managing Authorities in the public sector, which contributes to improvement in public interventions, policies and programmes. The IA studies thereby contribute in an interactive manner to the quality and robustness of the policies and programmes under development. Another positive phenomenon is the improvement in the range of methodologies used in IA studies. Apart from the standard desk research methods, new techniques such as interviews, brain-storming, econometric models and scenarios are becoming more common113. The evaluative capacity and consciousness in the public sector is still developing, which is also positive. Indeed, the evaluation culture in Poland is evolving and this provides an improved seedbed for impact assessment in the years to come. For example, the Ministry of Economy carries out activities aimed at implementing the Guidelines to Regulatory Impact Assessment, through, inter alia, training courses addressed to the government administration staff.
112 http://www.mz.gov.pl/wwwfiles/ma_struktura/docs/program_otylosc_02042009.pdf 113 Szlachta J., 2007, Ewaluacja ex-ante dokumentów programowych na lata 2007-2013 – kluczowe zagadnienia. Organizacja
procesu ewaluacji., Ministerstwo Rozwoju Regionalnego (Ministry of Regional Development) http://www.funduszestrukturalne.gov.pl/NR/rdonlyres/4E41CBAE-F849-48BE-BAC9-0614753930AA/38871/publikacjaluty1.pdf
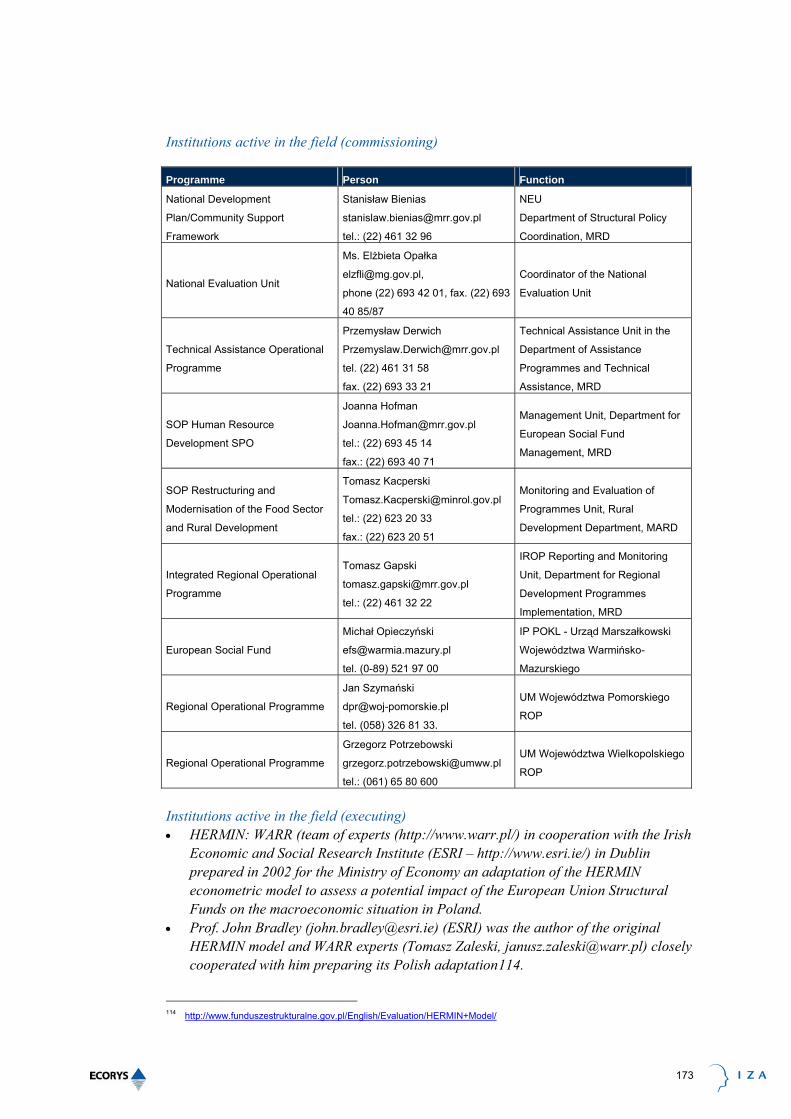
173
Institutions active in the field (commissioning) Programme Person Function
National Development
Plan/Community Support
Framework
Stanisław Bienias
tel.: (22) 461 32 96
NEU
Department of Structural Policy
Coordination, MRD
National Evaluation Unit
Ms. Elżbieta Opałka
phone (22) 693 42 01, fax. (22) 693
40 85/87
Coordinator of the National
Evaluation Unit
Technical Assistance Operational
Programme
Przemysław Derwich
tel. (22) 461 31 58
fax. (22) 693 33 21
Technical Assistance Unit in the
Department of Assistance
Programmes and Technical
Assistance, MRD
SOP Human Resource
Development SPO
Joanna Hofman
tel.: (22) 693 45 14
fax.: (22) 693 40 71
Management Unit, Department for
European Social Fund
Management, MRD
SOP Restructuring and
Modernisation of the Food Sector
and Rural Development
Tomasz Kacperski
tel.: (22) 623 20 33
fax.: (22) 623 20 51
Monitoring and Evaluation of
Programmes Unit, Rural
Development Department, MARD
Integrated Regional Operational
Programme
Tomasz Gapski
tel.: (22) 461 32 22
IROP Reporting and Monitoring
Unit, Department for Regional
Development Programmes
Implementation, MRD
European Social Fund
Michał Opieczyński
tel. (0-89) 521 97 00
IP POKL - Urząd Marszałkowski
Województwa Warmińsko-
Mazurskiego
Regional Operational Programme
Jan Szymański
tel. (058) 326 81 33.
UM Województwa Pomorskiego
ROP
Regional Operational Programme
Grzegorz Potrzebowski
tel.: (061) 65 80 600
UM Województwa Wielkopolskiego
ROP
Institutions active in the field (executing) • HERMIN: WARR (team of experts (http://www.warr.pl/) in cooperation with the Irish
Economic and Social Research Institute (ESRI – http://www.esri.ie/) in Dublin prepared in 2002 for the Ministry of Economy an adaptation of the HERMIN econometric model to assess a potential impact of the European Union Structural Funds on the macroeconomic situation in Poland.
• Prof. John Bradley ([email protected]) (ESRI) was the author of the original HERMIN model and WARR experts (Tomasz Zaleski, [email protected]) closely cooperated with him preparing its Polish adaptation114.
114 http://www.funduszestrukturalne.gov.pl/English/Evaluation/HERMIN+Model/

174
• MaMoR2 : The Gdańsk Institute for Market Economics (GIME), www.ibngr.edu.pl, Tomasz Kaczor [email protected]
• Model by de la Fuente115: PSDB Sp, z o.o., www.psdb.com.pl, Piotr Stronkowski: [email protected]
• Short Term Expert, Marie-Claude TEYSSIER, [email protected] • IBRKK - Institute for Market, Consumption and Business Cycles Research ,
www.ibrkk.pl, dr Tadeusz Smuga [email protected] • ECORYS Poland www.ecorys.pl, Katarzyna Matuszczak
10.8.1 Methodological response
The dominant approach used in employment and social IA studies is the quantitative approach based on econometric models, such as HERMIN, MaMoR2 or EU ImpactMod. Other studies are based on expert and desk research methods, but these are less precise and present only general results. Most of the IA studies in the area of employment and social issues are based on econometric models, especially the HERMIN model. In addition to a national HERMIN model, a specifically adjusted HERMIN model is in operation for each of 16 Polish regions. This has resulted in 16 regional employment and social IA studies of the National Development Plan, which were commissioned at a national level. Apart from this, there are only three cases, when the employment and social IA studies were initiated by regional authorities. Two of these studies concern Regional Operational Programmes (Wielkopolskie and Pomorskie Voivodeship) and one regional employment impacts of the Human Capital OP (Warmińsko-Mazurskie Voivodship)116. An overview of methods and models identified is presented in the table below.
Table 10.8 Relevant methods in Poland
Type of
method
Name of
method found
(link to
literature
overview)
Source Short description What policy areas can
be addressed
Rele-
vance
Employment impact assessment models
Econometric
model
PL-SVECM Bukowski, M.
(2008) "Modele
makroekonomiczn
e w ewaluacji
Model was
commissioned by
the Polish
National Bank and
employment and labour
market policies,
social policy,
fiscal policy
Medium
115 de la Fuente, A., 2003. El impacto de los Fondos Estructurales: convergencia real y cohesión interna. Instituto de Análisis
Económico 116 A particularly good comparative study of IA methods including triangulation of analytical methods (desk research, IDI, CATI,
econometric modelling using de la Fuente scheme) has been commissioned by the Office of Warmińsko-Mazurskie Voivodship, [email protected], and executed by PSDB Sp, z o.o., contact person - Piotr Stronkowski [email protected]. The study is titled "Labour market change forecast as an impact of the ERDP and SF in the context of implementation of the Human Capital Operational Programme in the Voivodship of Warmia and Mazury. See http://www.funduszestrukturalne.gov.pl/NR/rdonlyres/22ACE351-F940-4D6D-9E32-0344CCEF591A/49155/Prognozazmiannarynkupracy.pdf

175
Type of
method
Name of
method found
(link to
literature
overview)
Source Short description What policy areas can
be addressed
Rele-
vance
programów
publicznych",
presentation at
Akademia
Ewaluacji
Programów
Rozwoju
Społeczno-
Gospodarczego,
EUROREG -
Uniwersytet
Warszawski,
Warsaw, 13 of
December 2008.
used to
investigate
sources of a a
rapid growth of
unemployment in
late 90s and
contractions of
this process after
2004.
Econometric
model
ALMPmod Bukowski, M.
(2008) "Modele
makroekonomiczn
e w ewaluacji
programów
publicznych",
presentation at
Akademia
Ewaluacji
Programów
Rozwoju
Społeczno-
Gospodarczego,
EUROREG -
Uniwersytet
Warszawski,
Warsaw, 13 of
December 2008.
Model
commissioned by
the Ministry of
Labour and Social
Policy as an
assessment tool
for the active
employment
policies in Poland.
employment and labour
market policies,
social policy,
Medium
Econometric
model
EUImpactMod Bukowski, et al.,
2008, “Wpływ
funduszy unijnych
na gospodarkę
Polski w latach
2004-2020”,
Warszawa, Instytut
Badań
Strukturalnych
A model of a small
economy, in which
all foreign-related
variables are
exogenous used
to estimate the
impact of SF on
the national
economy. The
model is based on
the most recent
employment and labour
market policies,
educational policy,
fiscal policy,
infrastructure and
transport policy,
Low

176
Type of
method
Name of
method found
(link to
literature
overview)
Source Short description What policy areas can
be addressed
Rele-
vance
findings of
econometrics and
includes seven
categories of
public impact.
New – constructed
in 2007
Econometric
model
OLG-DSGE Bukowski M.
Zawistowski J.
(Eds), 2008,
”Zmiana
technologiczna na
polskim rynku
pracy”, Warszaa,
Instyutu Badań
Strukturalnych
Constructed to
investigate
changes of labour
supply in Poland.
It includes a
demographic
mode based on
the generation
scheme. It also
includes features
of the Polish
pension system.
employment and labour
market policies,
educational policy,
social policy
Low
Redistributive models
Econometric
model
NECMOD Budnik et al., 2008,
NECMOD:
prezentacja
nowego modelu
prognostycznego,
Warszawa,
Narodowy Bank
Polski
New, updated,
main forecasting
model of the
Polish National
Bank (Former
ECMOD). It is a
hybrid model that
includes both
neoclassic and
Keynesian
approaches. It is
used to assess
impacts of various
stimulus
interventions
(fiscal, migration,
etc.)
Fiscal Policy,
Social Policy,
Employment and Labour
market policy
Medium

177
Type of
method
Name of
method found
(link to
literature
overview)
Source Short description What policy areas can
be addressed
Rele-
vance
Econometric
model
HERMIN http://www.fundusz
estrukturalne.gov.p
l/PFS_Wzorce/Wz
orce/PFS_Podstaw
owy.aspx?NRMOD
E=Published&NRN
ODEGUID={76D3
C5FA-B01A-494C-
AB9D-
D31C3F624193}&
NRORIGINALURL
=%2fEWALUACJA
%2bfunduszy%2b
w%2bPolsce%2fO
ddzialywanie%2bm
akro%2fModel%2b
HERMIN%2f&NRC
ACHEHINT=NoMo
difyGuest#realizow
anepraceh
The most popular
econometric
model in Poland,
originally invented
by John Bradley
(ESRI), it was
adjusted to Polish
context in
collaboration with
its author. There
are now 17 (16
regional + 1
national) separate
sub-models.
Model is based on
Keynesian
approach and
used to assess
impacts on labour
market (labour
supply, labour
productivity,
unemployment
rate, etc.)
Employment and Labour
market policy
Social policy
Fiscal policy
Regional policy
High
computable
general
equilibrium
model, CGE
MaMoR2 http://www.fundusz
estrukturalne.gov.p
l/EWALUACJA+fun
duszy+w+Polsce/O
ddzialywanie+makr
o/Model+MAMoR2/
The model
assumes that
each region is
autonomous. It is
used to predict
various social and
economic impacts
on the regional
economy.
Regional policy High
Models that deserve further investigation are all of the 17 HERMIN models (16 regional + 1 national) and the MaMoR2 model.

178
10.9 Spain
10.9.1 Highlights from IA practice
In Spain, the evaluation culture has slowly been introduced into politics and public institutions over the last three decades. It was after joining European Community and under the measures and requirements imposed by the European Union, that the evaluation process acquired high visibility at the different levels of the Spanish public administration. The State Agency for Evaluation of Public Policies and Quality of Services (SAEPPQS) has recently been constituted under the 28/2006 Act in 2006. SAEPPQS focuses on endorsing the evaluation process in every single programme of the public administration. The priority objective of the SAEPPQS is to establish and develop a rational methodology for designing systems of quality and excellence in the public administration. On the other hand, there are examples of legislation at national level that focus on evaluation, such as Law 30/2003 of 13th October, on measures to include gender impact assessment of any regulation prepared by the government. At regional level, Catalonia has established the need of cost-benefit analysis as part of the proposal for new regulations117. Taking into account this context, most methods developed to evaluate social polices have been based on qualitative techniques and aimed at carrying out ex-post evaluations. In some cases, the results are used as a basis for ex-ante evaluation of new policies. Often, the social impacts of employment policy are addressed as part of the whole economic system, i.e. using macro-economic models to simulate the effect of different policies. However, there are also a number of methodologies to study specific effects of redistributive effects (indirect taxation, benefits and taxes reforms, etc.). After contacting with the Secretary of Strategies of Employment of the Ministry of Employment and Migration, it became clear that employment impact assessments have not been carried out as of late by the Ministry. As such, there is a lack of employment impact assessments exclusively designed to address employment as a whole. At regional level, the situation is quite similar to the national context, since regional governments are also using macro-economics models to analyse labour market and micro-simulation models to study redistributive effects. The public bodies keen to use impact assessments are those working with economic issues (Ministry of Economy, Institute of Fiscal Studies, Economic Departments of regional governments, etc). Quantitative analysis and impact assessments have mostly been used in the academic sphere and with a limited use by public administrations. For instance, Spanish academic research on the impacts of the Structural Funds has only had limited impacts on the design and implementation of these Funds in practice
117 in article 63 of Law 4/2001 of 9th April

179
Institutions active in the field At national level the main institutions developing impact assessments methodologies are: • Ministry of Economy; • Ministry of Employment and Migration; • Spanish Institute for Fiscal Studies; • Spanish High Council for Scientific Research (Consejo Superior de Investigaciones
Científicas –CSIC). Several regional governments (Autonomous Communities) are quite active in the use and development of methodologies, such as the Basque Country, Catalonia and Navarra.
10.9.2 Methodological response
Most of the models used in Spain to assess the impact of policies have been elaborated under an econometric approach, while the social issues have been analysed as part of the whole evaluation. This characteristic is linked with the fact of most of techniques used are based in quantitative methods. Labour market is mainly analysed through macro-economic models at national and regional level, whereas redistributive effect policies are studied with micro-simulation models. An interesting case is the ISERE model of Basque Country government, which was specifically designed to address employment policy problems. Below are presented the most relevant models.

180
Table 10.9 Relevant methods in Spain
Type of
method
Name of
tool/method
found
Source Short description What policy areas
can be addressed
Rele-
vance
Employment impact assessment models
Dynamic
General
Equilibrium
(DGE) /
Dynamic
Micro-
simulation
model
REMS (Rational
Expectations
Model of the
Spanish
Economy),
Luis González
Calbet
Ministry of
Economy
http://www.sgpg.pa
p.meh.es/SGPG/Cl
n_Principal/Presup
uestos/Documentac
ion/Documentosdet
rabajo
A Rational
Expectation Model
for Simulation and
Policy evaluation of
the Spanish
economy is in
the tradition of small
open economy
dynamic general
equilibrium models,
with a strongly
microfounded
system of
equations.
It is primarily
constructed to serve
as a tool for
simulation and
policy evaluation of
alternative
scenarios.
The greatest value
added of REMS is
the specification of
the labour market
block, achieved by
adding search and
matching rigidities
to a small open
economy
framework.
Various policies
• Employment
• Monetary policy
• Prices
High
Dynamic
Simulation /
Econometric
model
S21 Models
(GS21, AS21,
NS21, EUS21)
Silvio Martinez
Vicente
Profesor de
Investigación
Instituto de
Economía,
Geografía y
Demografía
(IEGD)
Centro de Ciencias
Humanas y
Sociales (CCHS)
The objective of this
kind of model is to
reproduce and
simulate the global
behaviour of the
region’s social-
economic system
by interrelating the
multiple partial
mechanisms which
it comprises. XS21
models constitute a
Regional Policies High

181
Type of
method
Name of
tool/method
found
Source Short description What policy areas
can be addressed
Rele-
vance
silvio.martinez@cc
hs.csic.es
Tlno. fijo
916022396 Tlno.
móvil 629622631
c/Albasanz, 26-28,
3F9
28037-Madrid.
convenient tool for
strategic planning
and for the
simulation of the
impact of different
political and
economic strategies
and macroeconomic
scenarios on the
endogenous
variables of the
model. It was
implemented using
the dynamic
simulations program
Vensim, which
allows its user to
assess the dynamic
consequences for
the endogenous
variables of
changes in a wide
range of exogenous
variables, including
budget allocations,
economic policies,
legislation, and
macroeconomic
scenarios.
Dynamic
simulation
model
REMI- Policy
Insight
Blas de los Arcos
León
Director del
Servicio de
Economía
Tel 84842 72 11
blosarcl@cfnavarra
.es
Valentina Galasso
Associate
Economist
Regional Economic
Models Inc.
433 West Street
Amherst, MA 01002
Policy Insight is a
structural economic
forecasting and
policy analysis
model. It integrates
input-output,
computable general
equilibrium,
econometric, and
economic
geography
methodologies.
The model is
dynamic, with
forecasts and
simulations
• Output
• Labour and
Capital Demand,
• Population and
Labor Supply
• Wages, Prices,
and Costs
• Market Shares.
High
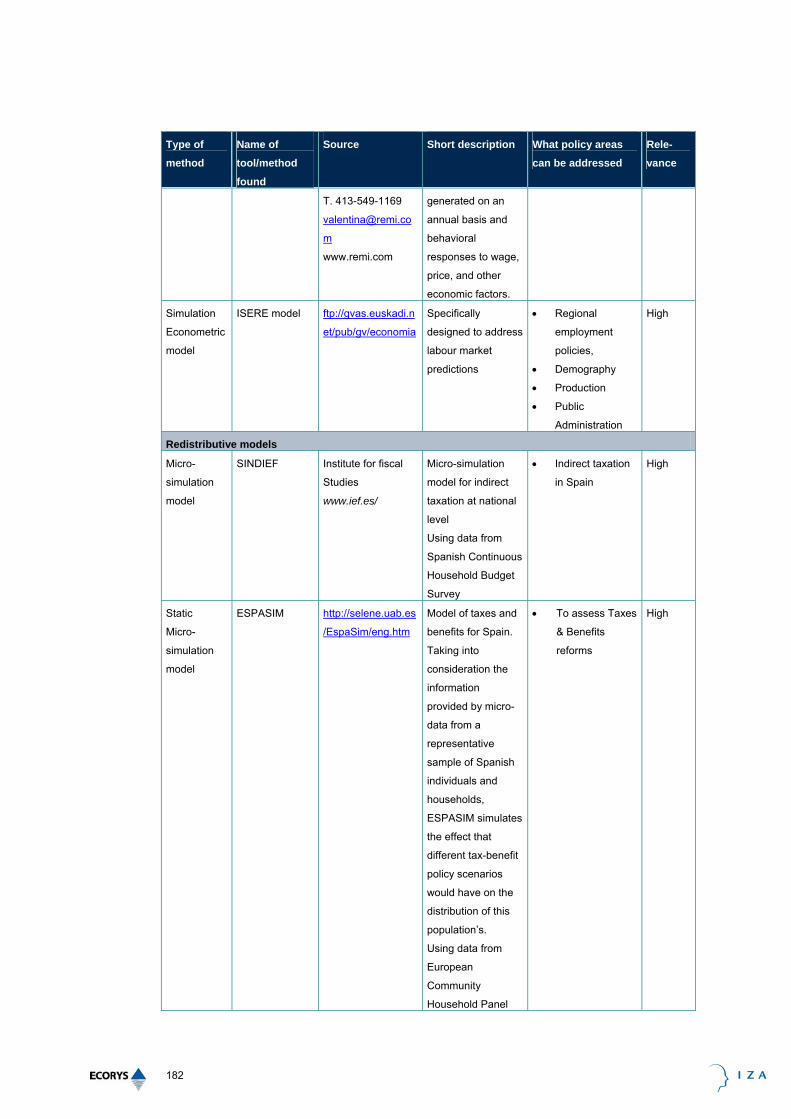
182
Type of
method
Name of
tool/method
found
Source Short description What policy areas
can be addressed
Rele-
vance
T. 413-549-1169
m
www.remi.com
generated on an
annual basis and
behavioral
responses to wage,
price, and other
economic factors.
Simulation
Econometric
model
ISERE model ftp://gvas.euskadi.n
et/pub/gv/economia
Specifically
designed to address
labour market
predictions
• Regional
employment
policies,
• Demography
• Production
• Public
Administration
High
Redistributive models
Micro-
simulation
model
SINDIEF Institute for fiscal
Studies
www.ief.es/
Micro-simulation
model for indirect
taxation at national
level
Using data from
Spanish Continuous
Household Budget
Survey
• Indirect taxation
in Spain
High
Static
Micro-
simulation
model
ESPASIM http://selene.uab.es
/EspaSim/eng.htm
Model of taxes and
benefits for Spain.
Taking into
consideration the
information
provided by micro-
data from a
representative
sample of Spanish
individuals and
households,
ESPASIM simulates
the effect that
different tax-benefit
policy scenarios
would have on the
distribution of this
population’s.
Using data from
European
Community
Household Panel
• To assess Taxes
& Benefits
reforms
High

183
Type of
method
Name of
tool/method
found
Source Short description What policy areas
can be addressed
Rele-
vance
Regional
Micro-
simulation
Model
SIMCAT-P http://www.gencat.c
at/economia
Micro-simulation
model for Catalonia
to simulate
progressivity and
redistributive effect
of property tax
reforms in this
regions
• Redistributive
effects of
property tax
reforms
High
10.10 United Kingdom
10.10.1 Highlights from IA practice
The UK is one of Europe's forerunners in policy and regulation impact assessment. The UK has an integrated and comprehensive regulation impact assessment system, and the Department of Business Enterprise and Regulatory Reform (BERR) issues a range of guidelines, frameworks and toolkits on impact assessment. HM Treasury's Green Book also provides good practice guidance on economic and social assessments for the costs and benefits of new policies projects and programmes118. Over the last few years, the Department for Transport (DfT) and various other departments have commissioned reports on different assessment techniques and methods, such as multi-criteria analysis and cost-benefit analysis. The employment and social impacts of new projects and programmes in the UK are normally integrated within broader economic, equality, health or environmental impact assessments, which predominately stem from activities of agencies and departments such as Homes and Communities Agency (formally English Partnerships), the Department of Work and Pensions (DWP) and the Department for Transport (DfT). Macro econometric modelling of regional economies in the UK is in its infancy. Most analytical studies have traditionally focused on the national level rather than on a regional level. The development of regional models has been hindered by the limited availability and quality of regional data, and limited role that local government has had in relation to economic development. However, any recent econometric models that have been constructed for regions have been primarily driven by the European Structural Funds, which specify requirements for the quantification of programme objectives and projections of impact, but also through the devolved national administrations and establishment of the Regional Development Agencies (RDAs) in England.
118 More information: The HM Treasury Greenbook http://greenbook.treasury.gov.uk/index.htm

184
For example, an econometric model (Experian Scenario Impact Model) has been developed for East Midlands Development Agency (EMDA) to forecast the performance of the East Midlands economy. Other well-known macro-economic models used for forecasting and impact assessment in the UK are the Oxford Economic Forecasting (OEF) models with a top-down approach, and the Cambridge Econometrics (CE) models with a bottom-up approach. The Department for Transport (DfT) is developing a Network Modelling Framework (NMF) model to assess the wider economic benefits of transport investment, but this primarily assesses GDP and welfare effects. At present, the number of employment and social method-based ex-ante impact assessments is limited, most of the studies that do exist tend to be ex-post evaluations, but occasionally these ex-post evaluations inform and support further ex-ante impact assessments and are used to estimate the impacts of new policies. The growing importance of evaluation has initiated a range of new approaches to ex-post evaluation, which use econometric techniques, but model development remains limited. In the social area, the Department for Work and Pensions (DWP) leads in the field of impact assessment (formerly Regulatory Impact Assessment). Impact assessments are published119 so that those with an interest can challenge why the government is proposing to take action, how new polices may affect people and what the estimated costs and benefits are. Particular attention is paid to equality impact assessments, which are carried out in two stages: 1) initial assessment looking at the scale and significance of the impacts; 2) full equality impact assessment. It is striking that these studies cover a wide range of areas, including areas such as access to mortgages, housing benefits, and distributional impacts of energy-related measures120. Equality impact assessments are also conducted by the Ministry of Justice121. The recently devolved administrations of the UK, i.e. Scottish Government, Northern Ireland Executive, and Welsh Assembly Government have also devised a range of their own models for assessing the economy. In Scotland, the Fraser of Allander Institute (FAI) has developed the AMOS model (A macro-micro model of Scotland), which has had wide application. In Northern Ireland, there is the Northern Ireland Policy Simulation (NI_PS) model for assessing and monitoring the broad health of the Northern Ireland economy. In Wales, the Welsh Economy Research Unit has compiled input-output models for the Welsh economy and is currently looking at developing a Computable General Equilibrium (CGE) model. Guidance on distributional weights can be found in the HM Treasury Green Book, but these weights are illustrative rather than evidence-based. Distributional weighting is not widely used in cost-benefit analysis because the weights that are appropriate for this purpose are unknown. The Department for Work and Pensions (DWP) developed the Cost Benefit Framework (CBF) guidance in an attempt to assess systematically the relative and actual cost-effectiveness of its policies and programmes in a consistent way. 119 See http://www.dwp.gov.uk/resourcecentre/ria.asp 120 See for instance the PSI Working Paper on The Distributional Impact of Economic Instruments to Limit Greenhouse Gas
Emissions from Transport, http://www.psi.org.uk/docs/rdp/rdp19-dresner-ekins-transport.pdf 121 See for an overview of Equality Impact assessments: http://noms.justice.gov.uk/news-publications-
events/publications/impact-assessments/
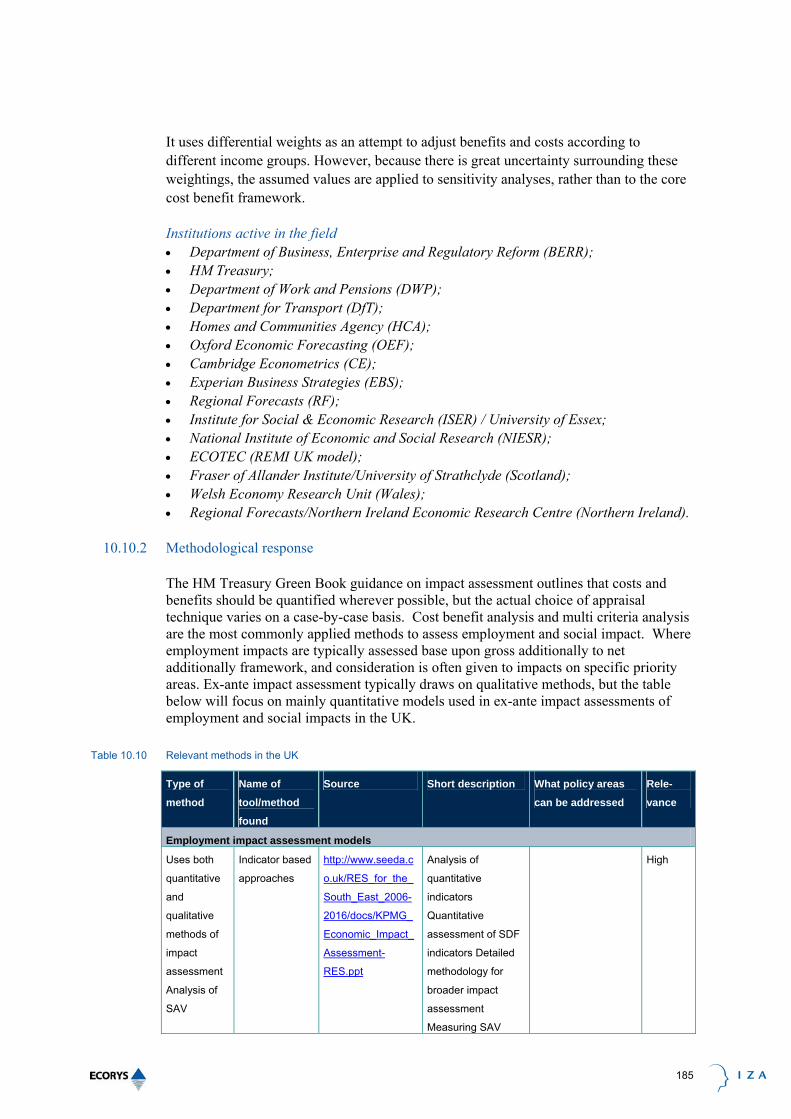
185
It uses differential weights as an attempt to adjust benefits and costs according to different income groups. However, because there is great uncertainty surrounding these weightings, the assumed values are applied to sensitivity analyses, rather than to the core cost benefit framework. Institutions active in the field • Department of Business, Enterprise and Regulatory Reform (BERR); • HM Treasury; • Department of Work and Pensions (DWP); • Department for Transport (DfT); • Homes and Communities Agency (HCA); • Oxford Economic Forecasting (OEF); • Cambridge Econometrics (CE); • Experian Business Strategies (EBS); • Regional Forecasts (RF); • Institute for Social & Economic Research (ISER) / University of Essex; • National Institute of Economic and Social Research (NIESR); • ECOTEC (REMI UK model); • Fraser of Allander Institute/University of Strathclyde (Scotland); • Welsh Economy Research Unit (Wales); • Regional Forecasts/Northern Ireland Economic Research Centre (Northern Ireland).
10.10.2 Methodological response
The HM Treasury Green Book guidance on impact assessment outlines that costs and benefits should be quantified wherever possible, but the actual choice of appraisal technique varies on a case-by-case basis. Cost benefit analysis and multi criteria analysis are the most commonly applied methods to assess employment and social impact. Where employment impacts are typically assessed base upon gross additionally to net additionally framework, and consideration is often given to impacts on specific priority areas. Ex-ante impact assessment typically draws on qualitative methods, but the table below will focus on mainly quantitative models used in ex-ante impact assessments of employment and social impacts in the UK.
Table 10.10 Relevant methods in the UK
Type of
method
Name of
tool/method
found
Source Short description What policy areas
can be addressed
Rele-
vance
Employment impact assessment models
Uses both
quantitative
and
qualitative
methods of
impact
assessment
Analysis of
SAV
Indicator based
approaches
http://www.seeda.c
o.uk/RES_for_the_
South_East_2006-
2016/docs/KPMG_
Economic_Impact_
Assessment-
RES.ppt
Analysis of
quantitative
indicators
Quantitative
assessment of SDF
indicators Detailed
methodology for
broader impact
assessment
Measuring SAV
High

186
Type of
method
Name of
tool/method
found
Source Short description What policy areas
can be addressed
Rele-
vance
Potential indictors
for future monitoring
Micro
simulation
approach to
local labour
market policy
analysis
Spatial
modelling
approaches to
socio economic
impact
assessment
http://www.geog.lee
ds.ac.uk/papers/99-
10/99-10.pdf
Impacts of
employment change
Medium
meta-analytic
techniques
Meta-
Regression
Analysis
Meta-analysis http://www.iser.ess
ex.ac.uk/files/iser_
working_papers/20
06-10.pdf
Scientific
assessment, using
comparative applied
research, of the
empirical validity of
the perception of a
negative impact of
immigration on
labour market
outcomes. Meta-
analytic techniques
to 165 estimates
from 9 recent
studies for various
OECD countries and
assess whether
immigration leads to
job displacement
among native
workers
The Impact of
Immigration on the
Employment of
Natives in Regional
Labour Markets
Medium
Regional
economic
model with
elements of
both demand
model, input-
output, new
economic
geography
and some
general
equilibrium
elements
(feedback on
wages and
prices).
REMI-ECOTEC
UK model
REMI Inc. in
partnership with
ECOTEC Research
& Consulting Ltd.
http://www.ecotec.c
o.uk/media/7008/re
mi_brochure.pdf
Able to quantify
impact of policies in
the fields of
transport, spatial
investments, labour
market, energy,
environment (mainly
monetary stimulus
policies).
Used mainly for
infrastructure projects
and urbanisation
perspectives.
High
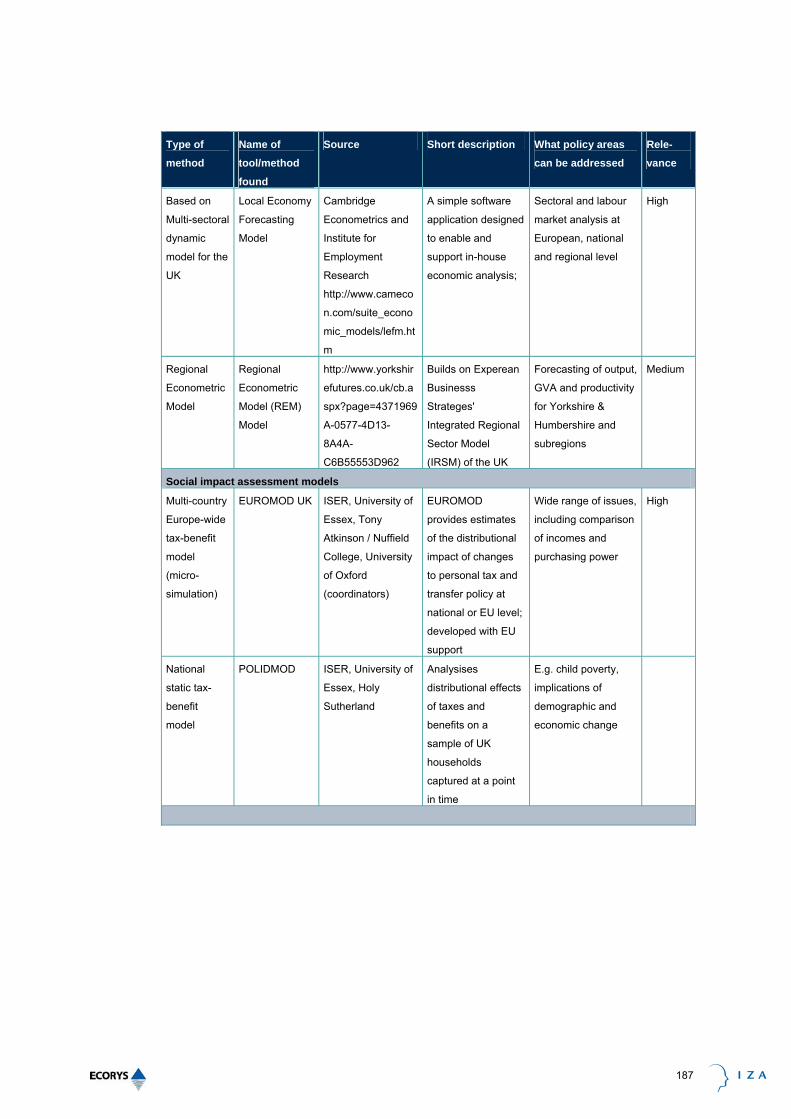
187
Type of
method
Name of
tool/method
found
Source Short description What policy areas
can be addressed
Rele-
vance
Based on
Multi-sectoral
dynamic
model for the
UK
Local Economy
Forecasting
Model
Cambridge
Econometrics and
Institute for
Employment
Research
http://www.cameco
n.com/suite_econo
mic_models/lefm.ht
m
A simple software
application designed
to enable and
support in-house
economic analysis;
Sectoral and labour
market analysis at
European, national
and regional level
High
Regional
Econometric
Model
Regional
Econometric
Model (REM)
Model
http://www.yorkshir
efutures.co.uk/cb.a
spx?page=4371969
A-0577-4D13-
8A4A-
C6B55553D962
Builds on Experean
Businesss
Strateges'
Integrated Regional
Sector Model
(IRSM) of the UK
Forecasting of output,
GVA and productivity
for Yorkshire &
Humbershire and
subregions
Medium
Social impact assessment models
Multi-country
Europe-wide
tax-benefit
model
(micro-
simulation)
EUROMOD UK ISER, University of
Essex, Tony
Atkinson / Nuffield
College, University
of Oxford
(coordinators)
EUROMOD
provides estimates
of the distributional
impact of changes
to personal tax and
transfer policy at
national or EU level;
developed with EU
support
Wide range of issues,
including comparison
of incomes and
purchasing power
High
National
static tax-
benefit
model
POLIDMOD ISER, University of
Essex, Holy
Sutherland
Analysises
distributional effects
of taxes and
benefits on a
sample of UK
households
captured at a point
in time
E.g. child poverty,
implications of
demographic and
economic change


189
ANNEX 1: SUMMARY OF METHODS AND MODELS


191
Summary of characteristics of methods and models examined
Research / Supply dimensions Policy-making / Demand dimensions EU
1 2 3 4 5 A B C D1 D2 D3
Level of
Aggregation
Time
dimension
Behavioural
Adjustment
Static /
Dynamic
Stochastic/
Deterministic
Type of
Interventions
Outcome
Variables
Level of
outcomes
Data Budget Time Applicability
to EU level?
Non Model
Approaches
Causal chain
analysis
Micro to
macro
No Partially Static Deterministic Expenditure,
Legislative,
Non legisl.
Employment
Income
Access to
services
Aggregate None Low Low High
Experimental
designs
Micro Yes (Time
series / panel)
Yes Dynamic Uses real
world
observations
Expenditure,
legislative
Non
legislative
Employment
Income
Social groups
(can be
aggregated to
region etc)
Administrative
Survey
(Quant)
Survey (Qual)
High High High
Quasi-
experimental
designs
Micro Yes (Time
series / panel)
Yes Dynamic Uses real
world
observations
Expenditure,
Legislative
Non
legislative
Employment
Income
Social groups
(can be
aggregated to
region etc)
Administrative
Survey
(Quant)
Survey (Qual)
High High High
Model family
analysis
Micro No No Static Deterministic Expenditure,
Legislation
Income Typical
households
Administrative
Survey
Medium Medium Medium
Micro Models
Static micro-
simulation
models
Micro no No/yes Static Deterministic Expenditure Employment
Income
Individual
(aggregated)
Administrative
Survey
High High High
Dynamic micro-
simulation
Micro yes Yes Dynamic Stochastic Expenditure Employment
Income
Individual
(aggregated)
Administrative
Survey
High High High

192
Research / Supply dimensions Policy-making / Demand dimensions EU
1 2 3 4 5 A B C D1 D2 D3
Level of
Aggregation
Time
dimension
Behavioural
Adjustment
Static /
Dynamic
Stochastic/
Deterministic
Type of
Interventions
Outcome
Variables
Level of
outcomes
Data Budget Time Applicability
to EU level?
models
Micro-
simulation
models + CGE
models
Micro Yes/no yes Both possible deterministic Expenditure Employment
Income
Individual
(can be
aggregated)
Administrative
Survey
High High High
Micro-
simulation
models with
spatial analysis
Micro Yes Expenditure
(Transport,
mobility,
energy, etc.)
Employment,
Income
Access to
services (in
theory)
Individual to
regional
Administrative
, heavy
requirements
High High No
Macro Models
Macro-
econometric
models
Macro
(national
accounts) or
regional
Annual
(based on
time series)
Yes Dynamic Deterministic Expenditure
and regulatory
(with
additional
input studies)
Employment,
Income,
production etc
Aggregate
(national,
regional or
sectoral)
Time series
national or
regional
accounts
Input output
table
Medium to
high
Several
weeks
High (already
rolled out in EU
for HERMIN
model)
Computable
General
Equilibrium
(CGE) models
Macro
(national
accounts) or
regional
Either
comparative
static or
annual
(dynamic)
Yes Static or
dynamic
Deterministic Expenditure
and regulatory
(with
additional
input studies)
Employment,
Income,
production
Aggregate
(national,
regional or
sectoral)
Time series
national or
regional
accounts
SAM matrix
Medium to
high
Several
weeks
High (see
RAEM model
under
construction for
EU)
193
ANNEX 2: GLOSSARY OF TERMS
Behavioural models: Social models that incorporate behavioural elements and responses since social policies are often designed to influence individual behaviour. Capability approach: identifies nine broad aspects relevant for assessing the well being of individuals and groups in society. The capability approach builds on Sen and Nussbaum and emphasizes the importance to functional capabilities (the ability to do things) and is therefore different from the utility based welfare approach (which is based on fulfilment of needs). Computable General Equilibrium (CGE) models: CGE models offer a comprehensive way of modelling the overall impact of policy changes on the economy. They are completely-specified models of an economy or a region, including all production activities, factors and institutions, including the modelling of all markets and macroeconomic components, such as investment and savings, balance of payments, and government budget. These models incorporate many economic linkages and are used to explain medium to long-term trends and structural responses to changes in policy. Direct application of CGE models for policy purposes regarding employment and social issues is limited. Outputs of CGE models are often in terms of net employment and income effects at the national level or the EU level. Examples of this type of model include LINKAGE, GEM and EDIP. Control groups: Comparison group consisting of eligible people or organisations which have been excluded from all participation in the intervention by a process of random selection. Apart from its non-participation in the intervention, the control group is, from every point of view, comparable to the group of participants. It has also been exposed to the same variations in the socio-economic context (confounding factors). When a group of participants and a control group are compared, the influence of confounding factors is the same on both sides (provided the two groups are large enough). Counterfactual situation: A situation which would have occurred in the absence of a public intervention. For example, a firm was assisted so that its employees could be retrained in new technologies. No redundancies were recorded in the following two years. It is estimated that without the assistance (counterfactual situation) 50 jobs would have been lost. By comparing the counterfactual and real situations, it is possible to determine the net effects of the public intervention. Various tools can be used for the construction of the counterfactual situation: shift-share analysis, comparison groups, simulation using econometric models, etc. At the baseline, the real situation and the counterfactual situation are identical. If the intervention is effective, they diverge. (Source: Evalsed) Cross-sectional data: a data set containing observations on multiple phenomena observed at a single point in time (eg Income, age, employment status of person X in 2006)

194
Difference-in-Differences Estimator: The difference in a given outcome between recipients of the project (the treatment group) and a comparison or control group is computed before the project is implemented. This difference is called the “first difference”. The difference in outcomes between treatment and control groups is again computed some time after the project is implemented, and this is called the “second difference”. Under the difference-in-difference technique, the impact of the project is the second difference less the first difference. The logic is that the impact of the project is the difference in outcomes for treatment and control groups after the project is implemented, net of any pre-existing differences in outcomes between treatment and control groups that pre-date the project. (Based on work by the World Bank on Impact Evaluation Methods see http://web.worldbank.org/wbsite/external/countries/africaext/extimpeva/0) Dynamic models: in contrast to static models, dynamic models are more complicated as a time element is introduced into the modelling – allowing for the inclusion of secondary effects. Econometric models: defined by the use that data play in informing the model structure, namely to calculate the model’s coefficients through a variety of possible estimation methods. (European Commission Sourcebook) EUROMOD: EU-wide microsimulation tax-benefit model calculating disposable income for each household in the dataset by using elements of income taken from survey data (e.g. employee earnings) combined with components that are simulated by the model (taxes and benefits) and provides estimates of the distributional impact of changes to personal tax and transfer policy, either at the individual country or EU-wide level. Ex-ante impact assessment of policies: Evaluation which is performed before programme implementation. For an intervention to be evaluated ex ante, it must be known with enough precision; in other words, a plan, at least, must exist. If the intervention still has to be planned from scratch, one would refer to a needs analysis rather than ex ante evaluation. This form of evaluation helps to ensure that an intervention is as relevant and coherent as possible. Its conclusions are meant to be integrated at the time decisions are made. Ex ante evaluation mainly concerns an analysis of context, though it will also provide an opportunity for specifying the intervention mechanisms in terms of what already exists. It provides the relevant authorities with a prior assessment of whether development issues have been diagnosed correctly, whether the strategy and objectives proposed are relevant, whether there is incoherence between them or in relation to Community policies and guidelines, whether the expected impacts are realistic, etc. Moreover, it provides the necessary basis for monitoring and future evaluations by ensuring that there are explicit and, where possible, quantified objectives. (Source: Evalsed) Experimental methods: stem originally from the natural sciences (laboratory experiments) and psychology, but have been increasingly applied in economics. The main types of experiment are "controlled" and "non controlled". An experiment is a study of cause and effect. It differs from non-experimental methods in that it involves the deliberate manipulation of one variable, while trying to keep all other variables constant. How do the main options compare in terms of effectiveness, efficiency and coherence in solving the problems? Impact assessment - IA (European Commission definition): IA involves a set of logical steps to be followed when preparing policy proposals. It is a process that prepares evidence for political
195
decision-makers on the advantages and disadvantages of possible policy options by assessing their potential impacts. Impact: A consequence affecting direct beneficiaries following the end of their participation in an intervention or after the completion of public facilities, or else an indirect consequence affecting other beneficiaries who may be winners or losers. Certain impacts (specific impacts) can be observed among direct beneficiaries after a few months and others only in the longer term (e.g. the monitoring of assisted firms). In the field of development support, these longer term impacts are usually referred to as sustainable results. Some impacts appear indirectly (e.g. turnover generated for the suppliers of assisted firms). Others can be observed at the macro-economic or macro-social level (e.g. improvement of the image of the assisted region); these are global impacts. Evaluation is frequently used to examine one or more intermediate impacts, between specific and global impacts. Impacts may be positive or negative, expected or unexpected. (Source: Evalsed) IMPLAN: estimates sectoral activity for final demand, final payments, gross output, and employment for each county model used. Indicator-based approaches: are widely used in the evaluation of Structural Funds programmes. The indicators are based upon the Indicators Working Document of DG Regio. The causality runs from inputs to outputs to results and impacts. By obtaining key ratios between the indicators from ex-post evaluations and by correcting the impacts for deadweight losses, the researchers try to obtain estimations for employment impacts of projects or programmes – also for ex-ante evaluations. Input: Financial, human, material, organisational and regulatory means mobilised for the implementation of an intervention. For example, sixty people worked on implementing the programme; 3% of the project costs were spent on reducing effects on the environment. Monitoring and evaluation focus primarily on the inputs allocated by public authorities and used by operators to obtain outputs. Private inputs mobilised by assisted firms, for example, are considered to be results of public intervention. The above definition gives a relatively broad meaning to the word "input". Some prefer to limit its use to financial or budgetary resources only. In this case, the word "activity" can be applied to the implementation of human and organisational resources. The term "financial outputs" is sometimes used in the sense of consumption of budgetary inputs. (Source: Evalsed) Input-output analysis: Tool which represents the interaction between sectors of a national or regional economy in the form of intermediate or final consumption. Input-output analysis serves to estimate the repercussions of a direct effect in the form of first round and then secondary effects throughout the economy. The tool can be used when a table of inputs and outputs is available. This is usually the case at the national level but more rarely so at the regional level. The tool is capable of estimating demand-side effects but not supply-side effects. (Source: Evalsed) Input-output models: Input-output models are based upon the deliveries of sectors to each other (the input-output matrix of a region or country as in the national or regional accounts). Input-output models are structured on transaction tables, combining supply table and use tables to provide a consolidated regional input-output model. The models display the interactions and interdependencies in the economy, where different industries can not operate separately. The models show if a policy affects one sector what the impacts will be for other sectors and the economy as a whole.

196
Macro models: models rather used for the measurement of effects at national levels. Meso Model: models rather used for the measurement of effects at regional levels. Method for Impact assessment: General technique needed for structuring, collecting, analysing or judging qualitative and quantitative information. Micro- models: models rather used for the measurement of effects at household, firms, individual levels Microsimulation models: Microsimulation is a method used to determine the impact of programme changes by separately evaluating the effect of those changes at the micro level, such as the individual level, the household level or for firms. Model for Impact Assessment: Specification of a quantitative method in terms of structure, parameters and data. Model: a specification of a quantitative method in terms of structure, parameters and data. Multipliers: They are used to estimate how much additional production is created for every initial increase in production and how many additional jobs are created. RIMS II multipliers can be estimated for any region composed of one or more counties and for any industry or group of industries. For estimating the impacts of changes on employment, RIMS II presents two types of multipliers: final-demand multipliers and direct-effect multipliers Non-behavioural models: Models that are non-behavioural do not allow for changes or feedback in individual behaviour in response to policy changes. Non-model based methods: These techniques can be defined as techniques collecting soft information (e.g. opinions, experiences) rather than hard information (indicators, figures, multiplier effects).They are often used in ex-ante impact assessment both for regional impact analysis but especially in the social domain. Panel data: A data set containing observations on multiple phenomena observed over multiple time periods or according to another second dimension (eg Income, age, employment status of person X in 2006, 2007, 2008) Partial equilibrium models: The partial equilibrium methodologies concentrate on modelling the demand and supply side of a particular market or sector in the (regional) economy, assuming other variables are constant in value. Redistributive impacts are considered to include all relevant aspects including impacts among affected groups (especially vulnerable groups), income redistribution, access to goods and services, and geographical redistributive impacts. Regional employment impacts are considered to include those impacts deriving from public policies, including horizontal (e.g. industrial, transport, environmental) and sectoral ones (e.g. agricultural, coalmining, and railway transport) which are introduced at the national and European level. Impacts include:

197
• Labour force (by age, education level, and gender); • Labour demand and supply (by age by age, education level, and gender); • Unemployment (by education level); • Labour participation (by age by age, education level, and gender); • Regional production or income (and per capita). • Job creation and job losses • Functioning of labour market Regulatory Impact Analysis (RIA): is used to assess the impacts of regulation. It is used to examine and measure the likely benefits, costs and effects of new or existing regulation. The implementation of RIA supports the process of policy making by contributing valuable empirical data to policy decisions, and through the construction of a rational decision framework to examine the implications of potential regulatory policy options. RIMS II (Regional Industrial Multiplier System): method used for estimating regional input-output multipliers based on an input-output table. It is widely used by both the public and private sectors to study economic impacts. SAM-Leontief models: are used to give a statistical representation of the economic and social structure of a country or a region. A Social Accounting Matrix (SAM) is used as a basis for the model, which is the extension of input-output tables with more detailed information on institutions and production factors. It is a data set presented in the form of a square matrix in the sense that all institutional agents are represented as buyers and sellers. Shift-share analysis: technique primarily used for examining the sources behind local employment growth or decline in a set of urban areas or regions. Simple ex-ante evaluation models: These “simple” methods consist in most cases of a single or a limited number of equations that are specified to analyse behavioural responses to a specific policy measure. In most applications, a partial approach is taken and the institutional context is not taken into account in detail. The core of these methods is an assessment of the behavioural response to a policy change at the individual or household level. Social Accounting Matrix (SAM): main database for building a CGE model. Social impacts are considered as impacts on: • Employment and labour market; • Standards and rights related to job quality; • Social inclusion and protection of particular groups; • Equality of treatment and opportunities, non discrimination; • Private and family life, personal data; • Governance, participation, good administration, access to justice, media and ethics; • Public health and safety; • Crime, terrorism and security; • Access to and effect on social protection, health and educational systems. • Culture • Social impacts in third countries

198
Spatial SAMs: extension of the more general regional SAMs, driven by growing interest in regional and local economic performance and interactions with other regions and localities. Static models: These models are relatively simple in structure and assess what each individual would, counterfactually, have under a new system or set of policy rules. Static models are most frequently used to provide estimates of the immediate distributional impact of policy changes. Stochastic model: a probabilistic model. Time series data: a data set containing observations on a single phenomenon observed over multiple time periods (eg Income of person X in 2006, 2007, 2008)