Embed Size (px)
Citation preview
[29]
Chapter – 2
Review of Literature - Customer
satisfaction and Cellular services
2.1. Introduction.
In this chapter, an attempt has been made by the researcher to review the
literature relating to the modern concepts of customer satisfaction and telecom
sector. Accordingly, they are reviewed in Part ‘A’ and Part ‘B’ respectively.
PART - A
There was an increase in conducting customer satisfaction surveys by many service
industries (Danaher and Haddrell, 1996)1. Increased research into customer
satisfaction has been influenced dramatically by the variety of measurement scales
used in customer satisfaction instruments tests (Devlin et al., 1993)2. Customer
satisfaction is defined generally as the feelings or judgments of the customer towards
products or services after they have been used (Jamal and Naser, 2003)3. Customer
satisfaction in service industries has been approached differently by equity theory,
attribution theory, the confirmation and disconfirmation paradigm, and satisfaction as
1 Danaher, P.J. & Haddrell, V. (1996). A comparison of question scales used for measuring customersatisfaction. – International journal of service industry management. 7 (4): 4-26.
2 Devlin, S.J.Dong, H.K & Brown, M. (1993) – selecting a scale for measuring quality.3 Jamal, A & Naser.k. (2003). Foctor influencing customer satisfaction, International journal of
Commerce and Management, 13 (2) : 29-53.
[30]
a function of perception (Parker and Mathews, 2001)4. Equity theory is essentially a
social comparison theory in which an individual evaluates his 'inputs into' versus
outputs derived from a given situation relative to those of another, where this may be
another person, a class of people, an organization, or the individual himself relative to
his experiences from an earlier point in time (Jacoby, 1976)5. Such theory deals with
exchange relationships and the fairness or equity of these exchange relationships. One
way to operationalize equity theory is to measure the fairness of each facet or attribute
in the decision process (Campbell and Pritchard, 1976)6. Attribution theory is a
social psychology theory developed in 1958. The theory is concerned with the ways in
which people explain (or attribute) the behaviour of others or themselves (self-
attribution) with something else. It explores how individuals "attribute" causes
to events and how this cognitive perception affects their usefulness in an organization.
The confirmation/disconfirmation paradigm provides the grounding for the vast
majority of satisfaction studies (Parker and Mathews, 2001). The
confirmation/disconfirmation paradigm views customer satisfaction judgments as the
result of the consumer's perception of the gap between their perceptions of
performance and their prior expectations (Parasuraman et al., 1994)7. However, the
disconfirmation theory has been increasingly criticized by many marketing scholars
(e.g., Teas, 1994)8. In particular, Teas (1994) argued that the different definitions of
4 Parker, C.S.Mathews, B.P. (2001), “Customer satisfaction” – Marketing intelligeme & planning, 19(1);38-44.
5 Jacoby.J.(1976), Consumer and industrial psychology – Hardbook of industrial and organizationpsychology, Rand Mc Nally College publishing co.
6 Campbell, J.P and Pritchard, R.D(1976), Motivation theory in industrial and organization psychology, -Handbook of industrial psychology – Rand Mc Nally college publishing co.,
7 Parasuraman, A.Zeithaml, V.A., & Berry, L.L (1994), “Alternative seales for measuring service quality,- Joural of retailing – 70(3).
8 Cronin, J.J & taylor and Teas (1994), SERVPERF versus SERVQUAL, Journal of marketing. 58(1).
[31]
expectations and the difficulties with measurement have undermined these models
which used expectation concepts. However, to avoid the debate surrounding the nature
of the expectation concept in measuring customer satisfaction, this research has
followed an alternative approach. This approach initially depended on customers'
actual evaluations of satisfaction, rather than on the gap between perception and
expectations (Cronin and Taylor, 1994; Teas, 1994).
Service quality
Service quality can be defined as the conformance to customer requirements in the
delivery of a service (Chakrabarty et al., 2007)9. Service quality is important to
service firms because it has been shown to increase profit levels, reduce costs, and
increase market shares (Parasuraman et al., 1985)10. Moreover, service quality has
been shown to influence purchase intentions (Sullivan and Walstrom, 2001), and is
used by some firms to strategically position themselves in the market place (Brown
and Swartz, 1989)11. Service quality is an abstract and elusive construct, and in the
absence of objective measures, consumers' perception of service quality is commonly
assessed. Among the measurement instruments used to assess service quality,
SERVQUAL (Parasuraman et al., 1988)12, SERVPERF (Cronin and Taylor, 1992),
and the Retail Service Quality Scale (RSQS) (Dabholkar et al., 1996) have been the
most prominent and most widely used instruments. Parasuraman et al. (1988)
9 Chakrabarty, S.Whitten, D.. & Green, K.W.(2007), -understanding service quality, journal ofcomputer information systems, 48(2), 1-15.
10 Parasuraman, A,Zeithanl, V.A and Berry, L.L.91985), “A conceptual model of service quality and itsimplications for future research, -Journal of marketing, Vol.99, Fall, PP-41-50.
11 Brown, S.W. & Swartz, T.A (1989) – A gap analysis of professional service quality, Journal ofmarketing, 53(2); 92-98.
12 Parasuraman, A,Zeithaml, V.A & Berry, L.L. (1988), SERVQUAL. Consumer perception of servicequality, journal of Retailing, 64(1).
[32]
introduced SERVQUAL, a 22-item instrument that assesses five dimensions of
service quality. The five dimensions are: 1) Tangibles - physical facilities, equipment,
and appearance of personnel, 2) Reliability - ability to perform the promised service
dependably and accurately, 3) Responsiveness -willingness to help customers and
provide prompt service, 4) Assurance - knowledge and courtesy of employees, and
their ability to inspire trust and confidence, and 5) Empathy - caring, individualized
attention the firm provides to its customers. The SERVQUAL instrument has
demonstrated both excellent validity and reliability (Babakus and Boiler, 1992;
Bolton and Drew, 1991; Cronin et al., 1992)13 and applied to different industries,
such as professional services (Freeman and Dart, 1993), health care (Lam, 1997),
tourism (Tribe and Snaith, 1998), business school (Pariseau and McDaniel, 1997),
and information systems (Kettinger and Lee, 1994)14.
Gronroos (1984)15 proposed two dimensions of service quality, which are the
technical quality and functional quality. Technical quality refers to the result or the
outcome of the service, while functional quality refers to the process or the way the
service has been delivered. The distinction of technical and functional qualities is
parallel to the dimensions of perceived justice theory, namely distributive and
procedural justices (e.g., Cohen-Charash and Spector, 2001). According to the
theory of justice, distributive justice deals with decision outcomes, while procedural
justice deals with decision-making procedure or how the outcome distribution is
13 Babakus, E & Boller, G.W.(1992), -SERVQIAL scale, journal of business research, 24(3), p.no.253-268.14 Kettinger, W.J & Lee, C.C. (1994), Perceived servicy quality and user satisfaction, dension sciences,
25(5-6).15 Gronroos, C.(1984), “A service quality model and its marketing implications; European journal of
marketing. 18(4).
[33]
arrived (Lind and Tylor, 1988). Mels et af. (1997)16 analyzed the data from four
service industries and found that, in reality, SERVQUAL only measures two factors:
intrinsic service quality (resembling what Gronroos termed as functional quality) and
extrinsic service quality (which refers to technical quality). Hui et al. (2004)17 further
suggested that reliability can be viewed as an outcome measure because customers
judge it after their service experience. The other four dimensions are process attributes
because they can be evaluated by the customers' during the service delivery.
It is commonly noted that service quality is an important determinant factor of
customer satisfaction (e.g., Parasuraman et al., 1988; Cronin and Taylor, 1992;
Spreng and Mackoy, 1996)18. Evidence shows that service satisfaction is a function
of both technical and functional performance (Gronroos, 1995; Yi, 1993). Justice
theory can provide plausible explanations for the impact of technical and functional
qualities on satisfaction. Focusing on the perceived fairness of outcomes, distributive
justice theory states that people will respond to unfair relationships by displaying
certain negative emotions (dissatisfaction) (Greenberg, 1990)19.
Several studies also support the notion that consumers make equity judgments with
respect to outcomes, and the equity evaluations would then affect consumer's
satisfaction (Oliver and DeSarbo, 1988; Oliver and Swan, 1989)20. Defined as the
perceived fairness of the means (or process) by which the ends are accomplished
(Lind and Tylor, 1988), procedural justice aims to enhance the probability of
16 Lind, E.a and Tyler, T.R. (1997), The social psychology, New York, plemum press.17 Hui et al., (2004) – Journal of consumer research 31(2).18 Spreng, R.A, Mackoy, R.D (1996), “Perceived service quality and satisfaction”, Journal of retailing, Vol.
72, PP.201-214.19 Greenbery, J, (1990), -Journal of marketing.16(2).20 Oliver, R.L., et al., (1988, 1989), journal of marketing, 53 (2). P.no.21-35.
[34]
maintaining long-term productive relationship between parties, and has been shown to
have a positive effect on consumer service satisfaction (Greenberg, 1990; Konovsky,
2000; Tax et al., 1998). Although the effect of performance expectations on
satisfaction is known to be contingent on the type of tangible products (e.g.,
Churchill and Suprenant, 1982; Patterson, 1993, Tse and Wilton, 1988)21, few
studies have tested this contingency concept in services. Research on organizational
justice has also found that distributive justice is more important predictor of
satisfaction with personal outcomes, whereas the reverse is true when people make
more general evaluations (Folger and Konovsky, 1989; Lind and Tylor, 1988;
McFarlin and Sweeney, 1992)22. This suggests that the predictive roles of outcome
perception (i.e., technical quality) and the perceived fairness of process (i.e.,
functional quality) may depend on the nature of the outcome in question. We will
explore this issue and propose the service types and alternative differentiation as
moderators of the quality/satisfaction relationship for services. The human element of
service quality (Staff-customer interaction) refers to all aspects of staff/customer
interaction in service delivery. The importance of the human element in forming the
customer's perception of service quality has been identified by many marketing
scholars (Jabnoun and AI-Tamimi, 2003; Yavas et al., 1997)23. Employees have an
important effect on customer service because customers today are better educated than
ever before (Mouaawd and Kleiner, 1996)24. Further, frontline employees play a
vital role in representing the firm in interactions with outside parties, and influencing
21 Chruchill, G.A and Carol,S. (1982), - journal of marketing research, 19 (4).22 Folger, R. and Konovsky, M.A. (1989), Academy of management journal, 32(1).23 Jabnoun, N & L-Tamimi, H.A.H (2003), International journal of quality & reliability management 20(4).24 Mouawad, M & Kleiner, B.H. (1996), Managing service quality 6(2).
[35]
the cognitions, attitudes and evaluations formed by customers (Schneider and
Bowen, 1995)25.
Thus, frontline employees were considered to be a main driver of customer
satisfaction and favourable service quality perceptions. Finally, four out of the five
SERVQUAL dimensions, were about human elements; reliability, responsiveness,
empathy and assurance (Sureshchandar et al., 2002).
Consistency of service delivery (Service delivery process) referred to the processes,
procedures, and systems that would make service delivery a seamless experience
(Sureshchandar et al., 2002)26. It highlighted whether the service delivery process
was standardized, streamlined, and simplified, so customers could receive the service
without any problems. The structural aspects of the service delivery process have not,
however, been adequately studied (Sureshchandar et al., 2002). In the literature,
there were a few marketing scholars who have tried to focus on the importance of the
structural content of service delivery in service quality evaluation (Danaher and
Mattsson, 1998). The structural content of the service delivery process is considered
important in service quality evaluation (Danaher and Mattsson 1998)27. The relative
degree and intensity of activities such as waiting and delays in delivering the service
have a significant effect on service quality (Danaher and Mattsson, 1998).
Tangibles of Service (Physical facilities) were one of the few dimensions that have
been consistently used by different researchers (Bahia and Nantel, 2000)28. However,
25 Schneider, B & Bowen, D.E, (1995), winning the service game, Harvard business school press, Boston.26 Suresh chandar, et al., (2002) – Journal services Marketing, 16(1), p.no.9-34.27 Danaher, J.(1998) – Internation journal of service industry management. 9(1). P.48-63.28 Bahia, K & Nantel, J. (2000) – The international journal of marketing. 18(2).
[36]
tangibles refer to physical facets of the service facility; equipment, machinery,
signage, communication materials etc. (Bahia and Nantel, 2000; Parasuraman et
al., 1985). It included the physical evidence of the service, except the personal
appearance of staff which was included in the human element dimension. Employees
and customers are usually influenced by the tangible facets of service in physiological,
psychological, emotional, and cognitive ways (Bitner, 1992)29. The intangible aspects
of the staff customer interface have a considerable influence, both negative and
positive, on service quality (Voss and Johnston, 1995). Tangibles are associated with
the impact on the customers' inferences about what service should be like and,
therefore, will influence the evaluation of service quality (Zeithaml et al., 1993).
Customer perceptions of tangibles were generally considered more important in the
case of banks than other service industries such as securities brokerage, and product
repairs and maintenance (Parasuraman et al., 1988).
2.2. Customer satisfaction.
In a market economy30, the cliche "the customer is king" is well known and never
failing in its veracity. TQM's purpose is customer satisfaction to a degree that his/ her
expectations are to be not only met but also exceeded. ‘So delight the customer’.
Edwards Deming said so that he/she continues to do repeat business with the
organisation. Customer satisfaction should be the primary driving force of most of the
TQM initiatives. The development of customer orientation, involves building stronger
29 Bitner, M.J. (1992), service escape – Journal of marketing, 56(2).30 Services liability and users satisfaction in India, an exploratory study on mobile phone users.
[37]
relationships between the marketer and the customer which may provide high levels of
customer retention and significant opportunities for increased sales.
We all know about Mahatma Gandhi’s famous saying, “A customer is the most
important visitor on our premises. He is doing us a favour by giving us an
opportunity to serve him”.
Stressing on the customer satisfaction and its significance in the business, it is said by
Sir Richard Greenbury, Chairman, and Marks & Spencer: “We do not need
financial pundits to tell us how to run our business; we have customers who tell
us." Yoshiro Okishima, General Manager, Minolta said: “The customer prizes
are the ones that count."
‘A business cannot survive without satisfied customers31’. However, in most of the
companies, only a small proportion of management effort is spent on customers.
World over those companies who have prospered by aligning the business around
customer needs, plan to spend more time this way. Attracting customers today is
very tough. Losing them is disastrous. Therefore, to-day, just satisfying the customers
may not be enough. The competitive edge would only come from customer delight.
When a company seeks a major improvement, the customer is the primary driving
force. Obviously, the external customer who pays for the service is important in
winning or losing customers. But who is he or she? Which one? Do we respond to the
needs of the big customer or the small one? The demanding one or the passive one?
The immediate purchaser or the consumer? It may be noted that customers are the
31 Ibid
[38]
people but consumers are the statistics. The reality is that, we will be dealing with
many customers on a continuous basis and they are all important to us. In a quality
organisation, the customer is a generic word for the receiver of the service. For every
transaction, we must have a customer a person to tell us whether we have got it right
or not. Without an identified customer, we should question why are we doing this
activity? With an identified customer, we can find out what is needed? If everyone is
thinking the ‘customer’ in this way, a strong movement for improvement is created.
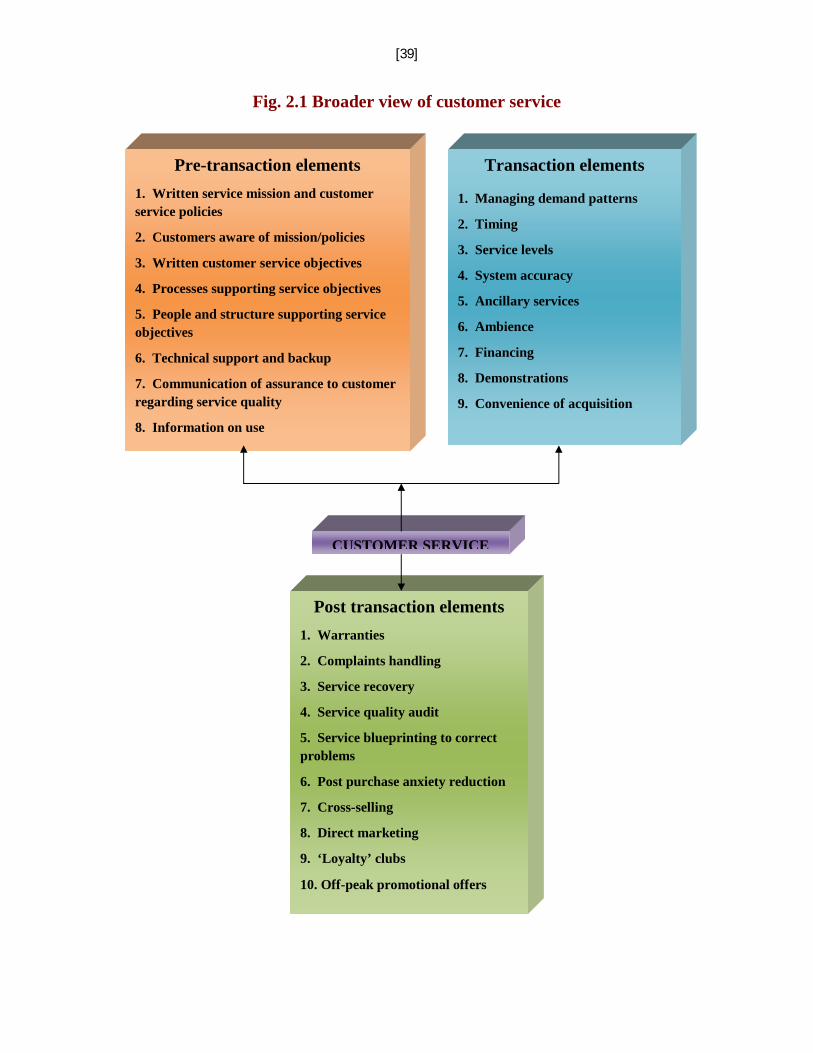
2.3. A broader view of customer service.32
There are different perspectives on customer service. There is a wide range of views
as to the definition of customer service. Some of them are given below:
32 D.D. Sharma, Marketing Research, Sultan Chand & Sons, New Delhi, 1999.
[39]
Fig. 2.1 Broader view of customer service
Pre-transaction elements
1. Written service mission and customerservice policies
2. Customers aware of mission/policies
3. Written customer service objectives
4. Processes supporting service objectives
5. People and structure supporting serviceobjectives
6. Technical support and backup
7. Communication of assurance to customerregarding service quality
8. Information on use
Transaction elements
1. Managing demand patterns
2. Timing
3. Service levels
4. System accuracy
5. Ancillary services
6. Ambience
7. Financing
8. Demonstrations
9. Convenience of acquisition
CUSTOMER SERVICE
Post transaction elements
1. Warranties
2. Complaints handling
3. Service recovery
4. Service quality audit
5. Service blueprinting to correctproblems
6. Post purchase anxiety reduction
7. Cross-selling
8. Direct marketing
9. ‘Loyalty’ clubs
10. Off-peak promotional offers
[40]
1. The different types of activities required to accept process, deliver and fulfil
customer orders and to follow up on any activity that has gone wrong.
2. The timely and reliable activities of delivering products and services to
customers as per their expectations.
3. A variety of activities covering all areas of the business, for the purpose of
delivering the company's products and services in a fashion that is perceived as
satisfactory by the customer.
4. Making all communications with customers, and providing full control of
defects.
5. Providing timely and accurate delivery of products and services ordered by
customers with accurate follow up.
The above opinions provide different views about the meaning of customer
service. Thus, the customer service is broader than these definitions and is
concerned with the building of bonds with customers and other markets or
groups to ensure long-term relationships of mutual advantage which reinforce
the other marketing mix elements. Customer service is an activity which provides
time and place utilities for the customer and which also involves pre-transaction and
post-transaction considerations relating to the exchange process with the customer.
Customer Delight is the process of ensuring that every customer interaction
consistently demonstrates your commitment to exceeding customer expectations.
Customer Delight goes well beyond customer satisfaction. When practiced at all
levels, it will set your organization apart from the crowd and position you as the
organization of choice for current and potential customers.
[41]
When a brand meets customer expectations, it is ensuring customer satisfaction.
However, when customers get value or benefits beyond what they had expected, the
brand has ensured customer delight. Generally, a delighted customer may be more
loyal to a brand than a satisfied customer.
Customer delight is not just about better product performance. Consumers have a
certain degree of functional expectation from a brand, and in most cases, the brand is
likely to deliver a level of performance pretty close to that expected by the customer.
This is precisely the reason why functional parameters have ceased to be meaningful
differentiators for customers to choose one brand over the other.
The results of a research project done by Richard Oliver, Roland Rust and Sajeev
Varki suggests that delight is a function of three components. Unexpectedly high
levels of performance, arousal (e.g. surprise, excitement) and positive affect (e.g.
pleasure, joy, happiness, satisfaction is a function of positively disconfirmed
expectations (better than expected)33 and positive affect34.
So what is customer delight all about? How is it ensured by brand? Customer
delight is about demonstrating and providing a set of tangible and intangible benefits
beyond the functional features, a combination of which provides value beyond what
the customer had expected to receive from the brand.
It is important to recognize that customer delight is a moving target. It is not a
fixed benchmark to be achieved. As competition intensifies and responds, the
33 Richard L.Olver, Roland Rust, Sajeev Varki, ‘Customer Delight, Foundations, findings andmanagerial insight’ – Journal of Retailing 73 (fall 1997), p.311.
34 Christopher Lovelock, Jochen Wirtz, Jayantha Chatterjee – Services Marketing – PearsonEducation - 2007, p.42.
[42]
power of some benefits to act as differentiators gets diluted or erased. Brands,
therefore, have to constantly monitor customer satisfaction and delight levels in
relation to competitive offerings. Then they must create both more and innovative
value propositions for customers to continue to feel delighted.
In many categories, brands have taken the easy route of providing higher value
through lower price. However, not only is there no guarantee of it being a sustainable
advantage (because it is replicable by other players too), but it also strips the brand of
much needed profitability to create and sustain alternate benefits. Apart from a
sensible price point, customers look at brand imagery, service, and other intangible
parameters for selecting between brands. For a brand that seeks to provide ever-
increasing service levels and standards, competing on price will seriously limit its
ability to invest in technology and resources to provide the desired service levels. In a
digitally enabled business environment, it has become relatively easier for a brand to
plan and implement strategies to provide customer delight. Though it requires an
initial investment in time, resources, and technology, creating a robust database of
customers is the first step in making the task of providing continued customer delight
easier and efficient for the organization.
To conclude, customer satisfaction is generally presumed to be a means by which
companies attempt to differentiate their product, keep customer loyal, increase
sales and improve profits.
[43]
PART-B
The Indian Telecom sector has emerged as the fastest growing telecom market in
the world. With more affordable services, increased penetration and a supportive
Government have brought significant changes in the number of consumers and usage
of cellular telecom services. The volume of formal research carried out in the field of
Telecom Industry is not much in quantity. Despite the high growth market of mobile
communication, it is understood that the research is still in its initial stages to develop
an understanding about the Cellular Industry.
In this part, an attempt has been made to examine the literature relating to the
telecom sector which is grouped under the following heads:
1. Growth of telecommunication industry.
2. Customer satisfaction studies in telecommunication services.
3. Performance of the service providers.
4. Customers’ usage pattern of the cellular services.
5. Strategies used by the cellular service providers to enhance their market
share and customer satisfaction.
2.4. Literature relating to growth of telecom sector.
A major revolution in communications is sweeping across business, industry and
influencing the daily lives of everyone. As an offshoot, the developments are never
ending in the field of Information and Communication Technology (ICT). From
[44]
being the object of luxury, nowadays Cellular phone has become a necessity for the
people. It is a moot point whether this mindset has been prompted by the rapidly
evolving telecommunications industry, which has been witnessing dramatic changes
since the early 1990s, or it is the consumer need which has fuelled the transformation
in telecom industry. The changes in this industry is have been so fast and profound
that people call it the “ Telecom Revolution”, finding the terms ‘Change’ or
‘evolution’ inadequate to describe its scope and magnitude.
Pallab Dutta (2008)35, observed that there has been an evolutionary change in mobile
communication systems in every decade. The first generation (1G) in the 1980s and
second generation (2G) cellular systems in the 1990s have been used mainly for voice
transmission and to support circuit-switched services. The 1G system was based on
the analogue technologies; however, 2G systems are digital systems such as the GSM
(Global system for mobile communication), CDMA One and PDC. These systems
operate nationwide and internationally, and are today’s mainstream systems.
Initiatives such as SMS, WAP, WI-FI, Bluetooth, i-mode etc. based on 2G have
exploited the data capability of wireless networks to deliver value-added services to
customers. Now, third generation (3G) systems have emerged and the central theme of
these technologies is the convergence of communication and computing. Other than
voice, 3G supports video telephony, video games, multimedia, net-browsing, network
games, email and downloading, all at a very high data-transfer rate. The migration
from 3G to Fourth generation (4G) technology will be a revolution both from
technological and user perspectives. The 4G today is only an evolving concept and
35 Pallab Dutta,”Zen of Mobile Communication”, http://personal .vsnl.com accessed on October 2008.
[45]
there is no real definition of what it will be. The concept of convergence has already
begun with 3G and 4G will bring about convergence of communication, computing,
broadcasting etc.
Kushan Mitra (11th January 2009)36, said that India’s inordinate delay in launching
3G networks might just mean that Indian telecom can do another skip and enter 4G
field. To the uninitiated, 4G (also known as Beyond 3G), is a term used to describe the
next complete evolution in wireless communications.
Mobile phone sector emerged in India in the mid-1990s and has been growing. The
growth has been more visible in the last 3-4 years. Airtel was the forerunner among
mobile services providers, followed by the Hutch, Spice and later Reliance, Tata
Indicom and a host of small players like Idea, BPL etc. In fact, the increase in mobile
phone subscribers between 1998 and 2003 was approximately 100%. In the beginning
of 2005, there were 50.7 million mobile users in India (including both GSM and
CDMA users) and this number is expected to grow by 20 million in the year 2005-06.
Intense competition in this sector has resulted in a substantial decline in tariffs in case
of mobile services and long distance calls in the last two years. On one hand, due to
fall in tariffs, profitability has gone down while on the other, this has led to an
increase in sales due to the growth in mobile subscriber base.(9th March 2005)37
According to a government release (July 2004)38, mobile phone subscription in
India may exceed fixed line by year end of 2004 with cellular and WLL (Wireless
local loop) combined comprising over 45% of the total subscribers. Releasing the
36 Kushan Mitra, “3G Finally. 4G Not Too Far”, Business today pp30-31 January 11, 2009.37 “50.7 million mobile users in India”, March 9,2005, http://www.rediff.com accessed on October 5, 2007.38 http://www.cellular news.com.3 July,2004.accessed on September 18, 2008.
[46]
latest figures of performance of telecom sector during the first two months of the
current fiscal, government said 28.74 lakh new fixed line connections were added
compared to 25.95 lakh in the same period last year, registering a growth of 39%. The
number of mobile phones, including WLL (M), as in May 2004 stood at over 363 lakh
and their share in the total number of 794.14 lakhs ones was over 45%. The private
sector has contributed more than 90% of the additional phones provided in April-May
2004. Its share in the total number of phones has increased to 41%. The number of
village public telephony (VPTs) as on March 31,2004 stood at 5,22,515, while the
number of rural direct exchange lines was at 123.33 lakh. Tele-density during the
period increased to 7.29% from 7.02% as on March 31,2004.
According to Mr.T.V.Ramachandran, Director General of COAI
(September 2004)39 BSNL registered a record monthly additions of 6,27,713
subscribers. This is the highest ever monthly additions by any company since the
inception of Cellular Telephony in India. Total all India GSM subscriber figure stood
at 3,20,19,351. Around 14 Lakh GSM Subscribers were added in August. At this
level, GSM continues to hold 79% of the total mobile market and the GSM additions
in August 2004 represent 85% of all new additions, the trend very clearly is in line
with international trends, where GSM continues to be the predominant choice of
customers globally.
39 http://www./cellular news.com 9th September, 2004 accessed on 7th October, 2008.
[47]
Today, the Indian telecom industry has become the poster boy of India’s
economic growth (TRAI, January 2006)40, It is adding approximately five million
customers per month and has the distinction of charging the lowest mobile tariff rates
in the world (approximately 2.5 cents per min). Based on the reports released by the
TRAI for the quarter ending December 2005, tele-density crossed double digits for the
first time (11.43 %).
Ganesan a Deputy general manager, BSNL, Chennai (2006)41, said Indian telecom
sector has witnessed a very slow growth during the last century it was the era of
landline connections under the monopoly of the Department of Telecommunications,
Government of India. It started picking up only after 1995 when the first competitive
regime was opened with the participation of private operators in the field of cellular
mobile telephone and it witnessed a tremendous growth (50%) in the year 2006, India
exceed 100 million GSM mobile subscribers target and became the fifth nation to
have achieved this benchmark after China, Japan, the US and Russia. Continuous
reduction in tariffs and improved affordability of handsets and services have also
contributed to the rapid growth in the number of mobile subscribers.42
Pandya & Bulsari (2007)43, opine ever since the economic liberalization in India in
early 1990s, the service sector has witnessed an unprecedented boom. The
liberalization policy introduced many changes in the telecom sector and this has
40 The Telecom Regulatory Authority of India; Supplement to “Indian Telecom Services Performance IndicatorReport for the Quarter Ending September 2005”, 31st January, 2006.
41 “Teledensity the Great Urban-Rural Divide”, Ganesan A, Deputy General Manager, BSNL, Chennai,http://www.hindu.com/seta/2006/11/30/stories/2006.
42 “Telecom Sector in India Ready to Boom in 2007”, http://www.rncos.com/Blog/2006/12/telecom-sector-in-india-ready-to-boom.html. accessed on March 17,2008.
43 Pandya K , Baulsari S (2007) “Telecom Services development in post liberalization period in India, theIcfaian Journal of Management ResearchVol-VI,No-4, April 2007.
[48]
shown positive impact on this sector. After the adoption of liberalization policy,
drastic changes are visible in the operation and deployment of telecom services.
Privatisation in manufacturing of telecom equipments and telecom networks in
industrial areas introduced after liberalization and also government initiative to divest
25 % of its stake and surrendering its management control in VSNL, has also led to
rapid growth and development of telecom sector.
Kathuria (2004)44, observed that despite these positive changes introduced after the
adoption of liberalization policy, available evidences suggests that expansion of
telecom sector is limited to urban growth centres and towards more affluent circles in
case of mobile phones. This suggests that there is a vast market lying open for
expansion of telecom sector, thus rural and urban population and consumers there on
can be added up to make it a formidable total, but this needs systematic generation of
understanding on consumer preferences, choices etc. As the competition becomes
fiercely intense, there is a growing pressure that these players look into the
consumers’ preferences, choice and means to approach them and thereafter satisfy
them.
Sustained Increase in mobile phone subscribers in India (News roundup,
marketing mastermind, April 2008)45, the number of mobile phone subscribers in
India reached 24.24 cr. by end of January 2008, an increase of 55% over that a year
ago. However, the number of fixed line telephone subscribers continued to decline as
more and more users shifted to mobile phones. The total landline subscribers reduced
44 Kathuria R (2004), “Trade in Telecommunications services: Opportunities and Constraints”. Indian Councilfor Research on International Scenario Releations, Working paper No.149.
45 News Roundup, Marketing Mastermind, April 2008 p 6
[49]
to 3.92 cr. in January 2008, down from 4.04 cr. a year earlier. Including both mobile
and wire line phones, India has 28.16 cr. telephone users by end of January, taking the
percentage of total population with telephones to 24.63% as against 23.89% in
December 2007. A record number of 87.7 lakh new mobile phone subscribers
were added in January 2008, as against 81.7 lakh numbers during the previous
month.
2.5. Literature relating to customer satisfaction in telecom sector.
Despite the high growth market of mobile communication, the research is still in its
initial stages to develop an understanding about the concept of customer satisfaction in
mobile services the work of following authors were studied.
Johnson W C and Sirikit A (2002)46, have conducted a study on both landline and
mobile users of Thai telecommunication industry using the service quality dimensions
of reliability, responsiveness, assurance, empathy and tangibles with a seven-point
scale of “strongly agree (7)” to “strongly disagree (1)” to find out the perceptions and
expectations of service quality, showed no significant difference among the different
companies. To the customers, tangibles are the most important aspect, but no link was
found between service quality ratings and behavioral intentions of customers.
Wang and Lo (2002)47, have used Structural Equation Modelling (SEM) to find out
the effect of five service quality variables as done by Johnson and Sirikit (2002) and
an additional variable network quality on the overall service quality, customer value
46 Johnson W C and Sirikit A (2002), “Service Quality in the Thai Telecommunication Industry: A Tool forAchieving a Sustainable Competitive Advantage”, Man agement Decision, Vol.40, No. 7, pp.693-701.
47 Wand Y and Lo H P (2002), “Service Quality, Customer Satisfaction and Behavior Intentions: Evidence from“China’s Telecommunications Industry”, Info, Vol.No. 6, pp 50-60.
[50]
and customer satisfaction and the effect of customer value and satisfaction on
behavioural intentions in China’s mobile industry. Most of the relations were found
significant by Wang and Lo.
Kesti and Ristola (2003)48 investigated consumer intentions to use different mobile
services. To this end mobile services had been tested in a real, interactive situation by
voluntary test users. The field trials was conducted which focused on testing m-
services and technology in an actual end-users environment. The data was collected
using questionnaires to inquire the perceptions of mobile services, experiences of test
use and intentions to use the services again were implemented on seven-point Likert-
type of scales. The main findings of the study indicated that the perceptions users got
from testing mobile services affect their intention to use those kinds or similar
services in the future.
Tung Lai Lai (2004)49, studied the service quality and the impact of perceived value
on satisfaction, intention and usage of Short Message Service (SMS). The study
examines how the service quality of the service providers and perceived value of the
customers affect customer satisfaction, and how customer satisfaction affects their
behavioural intention to continue to use SMS, which in turn affects the extent of SMS
usage in the local context. Using the Partial Least Squares regression, an analysis was
conducted based on 150 surveys collected for testing the proposed relationships. The
results showed that the dimensions of service quality, i.e., tangibility, empathy and
48 Kesti M and Ristola A (2003), Tracking Consumer Intention to use Mobile Services; Empirical Evidencefrom a Field Trial in Finland, accessed on November 2008 available at http://www.rotuaari.net.
49 Tung Lai Lai (2004), “Service Quality and Perceived Value’s Impact on Satisfaction, Intention and Usage ofShort Message Service (SMS)”, Information Systems Frontiers, Vol. 6, No.4, December, pp.353-368.
[51]
assurance are antecedents of customer satisfaction and a positive relationship exists
between customer satisfaction and customers’ intentions to continue to use SMS.
Sanjeev Panandikar and Rahul Rajput (August 2005)50, carried out the
multivariate analysis in order to compare the cellular operators on the satisfaction
levels of key quality elements. This would give the Cellular operators performance on
the key service quality elements; sigma scaling is used to get more accurate values of
the consumer’s perception. The summarized results are as follows.
Profile analysis done on pre paid and post paid users for mobile operators with various
service quality attributes does not show any big difference in satisfaction. The service
providers are providing the same level of service quality not exceptionally different
from other operator. The consumers of either type that pre-paid and post-paid, though
perceive the operators same, do understand the meanings of various service elements
and perceived them differently.
P Sashikala (2006)51, conducted a research to measure customer satisfaction by
meeting the expectations of telecom service providers that delight the customers. The
results implicate that customers set Reliability among the components of service
quality as the important criterion to determine behavioural intention. Service quality
includes elements like coverage, connectivity and voice clarity, which are strongly
correlated with technical limitation of the mobile subscriber network as well as service
providers’ own infrastructure. Raising service quality requires a long term effort and
50 Sanjeev Panandikar and Rahul Rajput, “ Comparative Study on Service Quality of Mobile Operators: AnApproach of Multidimensional Profile Analysis”, Indian Journal of Marketing, August 2005, pp3-8.
51 P.Sashikala, “Telecom Services: Measurerment of Customer Satisfaction” The Icfaian Journal ofManagement Research, Vol.V, No.10, 2006 pp.34-53.
[52]
therefore service providers need a practicable project to provide short-term
performance within a long-term strategy for network development.
2.6. Literature relating to the performance of the service providers.
Pakola et al. (2003)52, Surveyed 397 Finnish consumer-purchsing motives on one
hand and factors affecting operator choice on the other. The results indicate that while
price and properties were the most influential factors affecting the purchase of a new
mobile phone, whereas audibility, price and friend’s operators were regarded as the
most important in the choice of the mobile phone operator. The article concludes that
with a discussion of contributions and proposes ideas for future studies in the un-
researched area.
K Mohan, C Madhavi and K Thilagavathi (February 2004)53, conducted a study
with an objective to find out the most influencing factor in selection of the telephone
service provider, have identified that better service, no alternative and timeliness of
connection alternative plan, special offers and multi-usage are dominant factors which
influence the selection of the service providers.
According to the survey conducted by the “Business World” (2004)54, in
telecommunication sector Reliance Infocomm has been ranked 3rd in 2004 while it
was 11th in 2003, the list was topped by Bharati Tele-ventures and 2nd was Tata
Teleservices. The criteria used for ranking are:
52 Pakola J, Pietila M and Svento, R (2003), “An Investigation of Consumer Behavior in Mobile Phone Marketsin Finland’, Proceedings of 32nd EMAC Conferences, Track: New Technologies and E-marketing, accessedon November 2005 available at ww.oasis.oulu.fi
53 K Mohan, C Madhavi and K Thilagavathi, “Customer’s perception on Telephone –A study with specialReference to Chennai City” The ICFAI Journal of Marketing Management, February 2004, pp 11-17
54 Business World, 8th November, 2004.
[53]
Quality of top management
Depth and quality of talent
Ability to attract and retain talent
Belief in transparency and ethics
Social responsibility
Quality of product and services
Response to customer needs
Corporate product brand management
Dynamism and speed of response to change
Innovation
Global in competitiveness
Consistent performance
Returns to shareholders
Value creation for stake holder and
Ability to cope with recession.
A Selvarasu K Gomathishankar and M G Loganathan, (2006)55, conducted a
study with the objectives of, to measure the quality of services provided by the service
providers and the degree of deviation from the existing standards, to estimate the
reliability of customers upon service providers in respect of various competitors and to
evaluate the tangibility of services among various service providers and the difference
55 A Selvarasu K Gomathishankar and M G Loganathan, , “GSM Mobile Service in Telecom Sector: AnOntology of Quality of Service” The Icfai Journal of Service Marketing, Vol. IV. No.4, 2006. pp24-34.
[54]
in comparison with the established measures. The findings of their study were that the
Aircel has a minimum gap when compared to Aircel and BSNL. The value-added
services provided by Aircel, i.e SMS is a deciding factor of the cellular service.
BSNL Mobile is found to have the responsiveness and empathy that restrict fair
quality of services, whereas tangibility, reliability and assurance represent good
quality of service. Airtel and Aircel have almost equivalent proportion of their
components as good except the assurance component of Airtel GSM service.
Telecom companies revenue growth lags subscriber growth (Business Line
December 2008)56, Indian telecom companies have managed scorching growth in
subscriber numbers and have become a role model for almost every new sunrise
sector. While the subscriber base for the top four telecom companies has grown from
4.9 cr. to 24.2 cr. since 2005-end, revenues have expanded at a slower clip from
Rs.21,209.6 cr. to Rs.59,206.4 cr. India is now among the fastest growing mobile
markets in the world. i.e eight million mobile subscribers are being added every
month. But this does not guarantee that the players will report a record increase in
revenues as well.
Bharati Airtel saw its subscriber base at 85 million, expand five-fold (425.2 per
cent) over the last three years, while its revenue base is three times its December
2005 levels. But surprisingly, its revenue per user fell 37.3 per cent from its December
2005 levels. Vodafone Essar, the second largest GSM player had the fastest
subscriber growth and steepest revenue per user fall. Idea Cellular and Reliance
56 “Telecom companies revenue growth lags subscriber growth” The Hindu Business Line Sunday, December14, 2008.
[55]
Communications also reflect this trend. The reason is, 90% of the India’s
cellphone subscribers are under “pre paid” plans, where growth is driven mainly
by promos and offers. Since 2003, telecom companies have added subscribers
mainly through tariff cuts.
From a ‘calling party pay’ regime in 2003, to innovative recharge schemes in 2005, to
multi-year free incoming calls, every promotional offer has revolved around lower call
charges. These moves later morphed into popular ‘life time recharge’, which set the
ball rolling for an accelerated pace of subscriber adds. Falling tariffs and recharges for
lower and lower denominations and for longer periods meant lower revenues per user
for operators.
2.7. Literature relating to the customers’ usage pattern of the cellular
services.
Rogers (1976)57, mentioned that the innovation adoption and diffusion process differs
from one individual to another. All people do not adopt an innovation at the same
time. Schiffman and Knauk (2002)58 opined that adoption of innovation depends on
several variables like age, education, gender, lifestyles, area, information accessibility,
etc. However consumers do not accept all innovations at the same fashion. For
example, cordless telephones seem to attract the consumers almost overnight, where
as some products like trash compactors fail to catch the consumers’ mind for a very
long period of time.
57 Rogers Everett M (1976), Diffusion of Innovation, 1st Edition, Free Press, New York.58 Schiffman G Leon and Kanuk Lesile Lazar (2002), Consumer Behavior, 7th Edition, Prentice-Hall of India Pvt
Ltd., pp. 395-436.
[56]
Grant and O’Donohoe (2007) 59 proposed five factors for owning a mobile handset-
convenient, social stimulation, experiential learning, escapism and purchase
information and advice.
Bhagaban Das and Sangeeta Mohanty (November 2007) have concluded in their
research that on an average businessmen utilize cellular services to the maximum
extent and professionals the least, the service providers provide more or less the same
service and there exist no significant difference in the different brands of service
providers and different motivational factors have the same effect on consumers and
brands provider more or less the same service quality.60
Today, mobile phone is not just a substitute of land line telephone, but more than
that. Users can use it not only for calling and messaging but for sending pictures,
updating sports and news, playing games, listening music, watching movies,
photography, transferring data and pictures, doing calculation, reminding important
days and organizing their day to day activities (Mazzoni, 2007)61.
2.8. Literature relating to the strategies used by the service providers to
enhance the market share and customer satisfaction.
Marketing strategy is a key part of overall corporate strategy, which is
concerned with developing plans for finding out what customers want and then
efficiently meeting their requirements.
59 Grant Ian and O’Donohoe Stephanie (2007), “Why young consumers are not open to mobile marketingcommunication”, International Journal of Advertising, Vol.26, No.2,pp.223-246.
60 Bhagaban Das and Sangeeta Mohanty (Nov 2007), “Service usability and users’ satisfaction in India: Anexploratory study on mobile phone users” The Icfai Journal of Services Marketing, vol. v,No.4,2007.
61 Mazzoni V et al (2007), “Consumer Behaviour In the Italian Mobile Telecommunication Market”,Telecommunications Policy, doi: 10.1016/j.telpol.2007.07.009
[57]
Riquelme (2001)62, conducted an experiment with 94 customers to identify the
amount of self-knowledge that the consumers have when choosing a mobile service
provider. The study was build upon six key attributes telephone features, connection
fee, access cost, mobile phone purchasing respondents had to important rate.
The research shows that consumers with prior experience about a product can predict
their choices relatively well but tend to overestimate the importance of features, call
rates and free calls and underestimate the importance of a monthly access fee, mobile-
to mobile rates and connection fees.
Jan van den Ende (2002)63, developed a model for the governance mode of service
development in the different phases of the lifecycle of the mobile network and service,
based on the degrees of uncertainty and urgency involved in the network and service
development processes. The study indicates that the number of redesigns, and the
level of communication costs in collaboration projects indeed depend on the degree of
urgency and uncertainty involved in these projects, which are in turn affected by the
lifecycle of the network.
Liu (2002)64 examined factors affecting the brand decision in the mobile phone
industry in Asia. It was concluded that the choice of cellular phone is characterized by
two distinct attitudes to brands: Attitude towards the mobile phone brand on one hand
and attitude towards the network on the other. While price and regulatory of service
62 Riqulme, H (2001), “Do consumers Know What They Want?”, Journal of Consumer Marketing18(5),pp.437-448.
63 Jan van den Ende (2002), “Modes of Governance of New Service Development for Mobile Networks: ALifecycle Perspective”, ERS-2002-94-ORG
64 Liu, C M (2002), The Effects of Promotional Activities on Brand Decisions in the Cellular.
[58]
were found to dominate choices between network providers, choices between mobile
phone brands but towards phones with better capability and large screens.
The growth of Reliance in the Indian telecom industry is astounding65, though
marred by several controversies. Reliance entered into mobile services using CMDA
technology and acquired licenses different from what other GSM operators had to
obtain. Therefore, due to the relative ease with which Reliance managed to acquire
licenses, it has an advantage over GSM operators. This led the government to come up
with the unified services regime. Despite being in existence for less than a year, it
became the largest mobile service provider in the country by May 2003. The
‘Monsoon Hungama’ scheme that offered a mobile phone to customers on an up-front
payment of INR500 reversed the falling growth in mobile subscriber base. In fact it
created a world record by adding one million customers in a mere 10 days. Later,
through a series of acquisitions, Bharati regained its leadership position in the mobile
market.
General Manager (Marketing), BSNL (January 2004)66, says the days when the
customers came to us for telephone connections are gone. Today our emphasis is to
reach out to the public and sell our services aggressively. In 2004, BSNL earmarked
INR 1.6 bn for advertising and marketing related activities.
M Chinnadurai and B Kalpana (May 2006)67, said in their research that Effective
advertisements, Media Selection, Disclosing full information, Modification of
65 www.oneindia.in/phonecalls/reliance/landline.shtml. Accessed on 12th March, 2007.66 The Economic Times, January 8, 2004.67 M Chinnadurai and B Kalpana , “ Promotional Strategies of Cellular Service: A Customer Perspective”,
Indian Journal of Marketing, May 2006,pp29-37.
[59]
advertisements, Analysis of sales promotional offer, Customer oriented promotion
will help the cellular service providers to face the stiff competition with better
strength.
Abhay Jain and B S Hundal (2006)68, have conducted a research with an objective
to study the factors affecting the choice of mobile phone operators among the rural
people. The main results of the study indicate that consumer education is an integral
part of rural marketing strategy. Due to lack of knowledge and education, they were
unable to make use of their own mind and have to depend upon others. So apart from
formal media like newspaper, television, radio, cinema and direct mail, rural –
specific promotion methods like demonstrations, puppet shows, house to house
campaigns, processions, rural melas, dance programs etc., would be more useful
in attracting the rural consumers. While making the choice of the service
provider they focused on facilities provided, effectiveness, dexterity, relative
advantage and influential person.
R Srivastava et al (September 2006)69, tested the hypothesis in their research that
‘price plays no role in competing growing market like the telecom sector’. The results
revealed that the null hypothesis is rejected and proved that the price plays an
important role in the growing market like telecom sector and subscribers switch one
operator to another because of better price offered.
68 Abhay Jain and B S Hundal, “Factors Influencing the Adoption of Cell Phone Services in Rural Areas”,TheIcfaian Journal of Management Research, April 2006.pp 22-32.
69 R Srivatsava, Jatin Bhangde, Nirav Bhatt, kunal Gogri and Hemal Marfatia, Indian Journal of Marketing,September 2006, pp 8-16.
[60]
Grahame Maher, Chief Executive Officer of Vodafone Czech Republic said70,
“Our results show that being fair to all customers pays off; however, we are aware of
the fact that a fully saturated market demands innovative solutions and new
approaches. We see potential for future growth the business services segment and also
in prepositions that allow for a convergence between the worlds of the internet and
mobile. We believe that with this strategy for lower prices while continuing to ensure
that economic growth of the mobile industry.”
According to Bedabal Ray (May 2008)71, Average Revenue Per User (ARPU)
should be around Rs. 325-350 a month so that the company can make some profit per
user. If it is less than Rs.325-350 a month, the company may make very insignificant
profit or no profit at all. In order to enhance the ARPU, the researcher suggests the
following measures to Vodafone to capture the Indian telecom market.
Target Heavy Users with innovative pricing schemes and useful value added
services
Plan for “3G” immediately to India
Communicate strongly to Indian consumers that “Vodafone” is the only
alternative for technology-driven “3G” in India
Focus on Cost Leadership , Technology innovation, Image differentiation
70 www.cellularnews.com. Accessed on 14th July 2008.71 Bedabal Ray, Head of the Department, Amity Institute of Telecom Technology & Management, Amity
University, “Vodafone in the Indian Telecom Market Issues and Challenges”, The Icfai Marketing MasterMind, May 2007. pp19-21.
[61]
Optimize talk-time for each and every corporate managers, rich youngsters, rich
kids, rich professional including film artists, models, doctors, lawyer’s chartered
accountants, and management consusltants.
Subhash Jha (2008)72, conducted an empirical study which provides a snapshot of the
Indian Youth market for mobile phones. The analysis was on one of the large
segments the young consumers can prove useful for mobile telecom service providers,
especially for handset manufacturer attempting to expand their market as well as to
retain their current customers. Understanding youngsters as mobile phone
consumers can help firms to forecast demand, formulate their strategic choices
and gain a better positioning of their offerings. The findings of the paper suggest
that there exist sub-segments within a larger segment, which behave differently from
one another. This segmentation approach can help to identify the consumer
characteristics and assist tele communication companies’ strategic decisions.
Young consumers can be effectively analysed through three different variables
(gender, monthly voucher amount and years of owning the mobile phones).
Indeed there exists a marked difference among mobile users, with respect to these
variables. The key finding is that there is a significant difference between two groups
of youngsters in the mobile phone usage pattern. For example male respondents use
mobile phones for updating sports, playing games and downloading software, more
than their female counterparts. Similarly, the respondents who spend upto Rs.600
monthly on recharging their mobile phones do less local calling, STD calling, sending
72 Subhash Jha 2008, “Understanding Mobile Phone Usage Pattern Among College-Goers” The icfai Journalof Services Marketing, Vol.VI, No.1, 2008.
[62]
and receiving messages and sending pictures than the respondents who spend above
Rs. 600 monthly on recharging their mobile phones.
Sabitha Nikesh (August 2008)73, observed in his study that the mobile operators are
basically concentrating on the fact that the service is need based. To take the
advantage of customer needs, the strategies introduced by these mobile operators are
revolving around the price factor. In this context the BSNL, whenever the competitors
launch new schemes, reduces their prices. The key factor for the success of this brand
is its pricing strategy. It is also a brand name for the masses of India. It is developing
trust in the customers to keep the loyalty with BSNL. The company believes in
providing good quality service at an affordable price.
Shrishendu Ganguli (August 2007)74, said that story of Cellular service in India is
full of marketing innovations by different market players and then retaliation from the
competitors on a military emergency basis. However innovations should go on
because it is a very rapidly changing technology oriented business. The key is to curve
out more benefits from existing applications like SMS in order to create revenue
generating opportunities at the same time the basic essence of these activities still
retains the traditional marketing activities like delivering on promises, proper
customer service by listening to them, innovating to attract customers and increase
their satisfaction and rewarding the loyalty of customers.
73 Sabitha Nikesh , “ Mobile Number Portability- The Challenges for Mobile Services” Advertising(August 2008)
74 Shrishendu Ganguli, “Marketing in Indian Cellular Services-Story of Innovations, Retaliations and Use ofTechnology” The ICFAI Journal of Marketing , August 2007 pp52 to55.
[63]
Mr.Sunit Bharati Mittal, Chairman & Managing Director, Bharati Airtel Ltd,
said (23January 2009),75 “Bharati Airtel continues to lead the telecom growth story
adding customer and revenue market share despite intense competition. Bharati’s
strategy of extensive roll out ahead of competition, especially in new villages, has
yielded rich dividends. Our launch in Sri Lanka has received a huge response
and despite coming in as the fifth operator we hope to be in a leadership position
in the coming years. Bharati got close to 10 million new subscribers during the
October-December quarter taking its total user base to 88.3 million as on
December 2008. (December 2007, 57.3million). On the network side Airtel now
covers 4 lakh villages, 5,057 census towns through 88,319 towers. It also has an
optic fibre network of 90,205 route km. The company is planning a capital
investment of around $3 billion for the next financial year.” All these show that
the spirit of achieving is not hampered by the economic meltdown.
To conclude, based on the literature review the following points emerge.
Decrease in handset prices along with tariffs from service providers has
resulted in the phenomenal increase in the number of mobile users.
Mobile phone subscribers have exceeded the fixed line subscribers from the
year 2005.
The Indian telecom industry has become the poster boy of India’s economic
growth.
Young consumers are the real drivers of growth in a wireless industry.
75 “Bharati Q3 net rises 25% on record subscriber additions”, The Hindu Business Line, 23 rd January, 2009.
[64]
Transmission quality and network coverage are most important.
Value added services are gaining popularity.
The marked difference exists among mobile users with respect to variables
like gender, monthly voucher amount and years of owning the mobile
phones.
Economy, performance and value added services are the major parameters
determine the choice of the service providers.
The consequences of economic meltdown are also seen in the Cellular Service
Industry, resulting decrease in the average revenue per user.
The earlier researches conducted in the field of customer satisfaction in the cellular
service industry have been done with different perspectives confined to different
geographical locations all over the world. This study has been attempted to
examine the customer satisfaction towards the select cellular service providers
with special reference to Chennai city and its environs.