Embed Size (px)
Citation preview
Review of Life Prediction Methodology and Adhesive Joint Design and Analysis Software
W R Broughton and R D Mera
June 1997
Review of Life Prediction Methodology and Adhesive Joint Design and Analysis Software
W R Broughton and R D Mera National Physical Laboratory
ABSTRACT This report reviews predictive models suitable for evaluating long-term properties, residual strength and life expectancy of adhesive joints subjected to cyclic fatigue and/or hostile environments. Methods for simulating accelerated ageing are included in the assessment. Several different approaches, including mechanistic models, fracture mechanics, stress analysis and phenomenological models are considered. The predictive techniques and models identified will be evaluated within a subsequent experimental programme. Parametric studies are to be carried out to determine the effect of temperature and the level of degrading agent with the degree of degradation, identifying any synergistic or superimposed effects between environmental and loading parameters. The report also reviews a number of commercially available finite element analysis (FEA) and non-FEA software packages used for design of adhesive joints and materials selection. The report was prepared as part of the research undertaken for the Department of Trade and Industry funded project on "Performance of Adhesive Joints - Combined Cyclic Loading and Hostile Environments".
NPL REPORT CMMT(A)62
© Crown Copyright 1997 Reproduced by permission of the controller of HMSO.
ISSN 1361-4061
National Physical Laboratory Teddington, Middlesex, UK, TW11 0LW
No extract from this report may be reproduced without the prior written consent of the Director, National
Physical Laboratory; the source must be acknowledged.
Approved on behalf of Managing Director, NPL, by Dr C Lea, Head of Centre for Materials Measurement and Technology.
NPL REPORT CMMT(A)62
2
LIST OF NOTATIONS
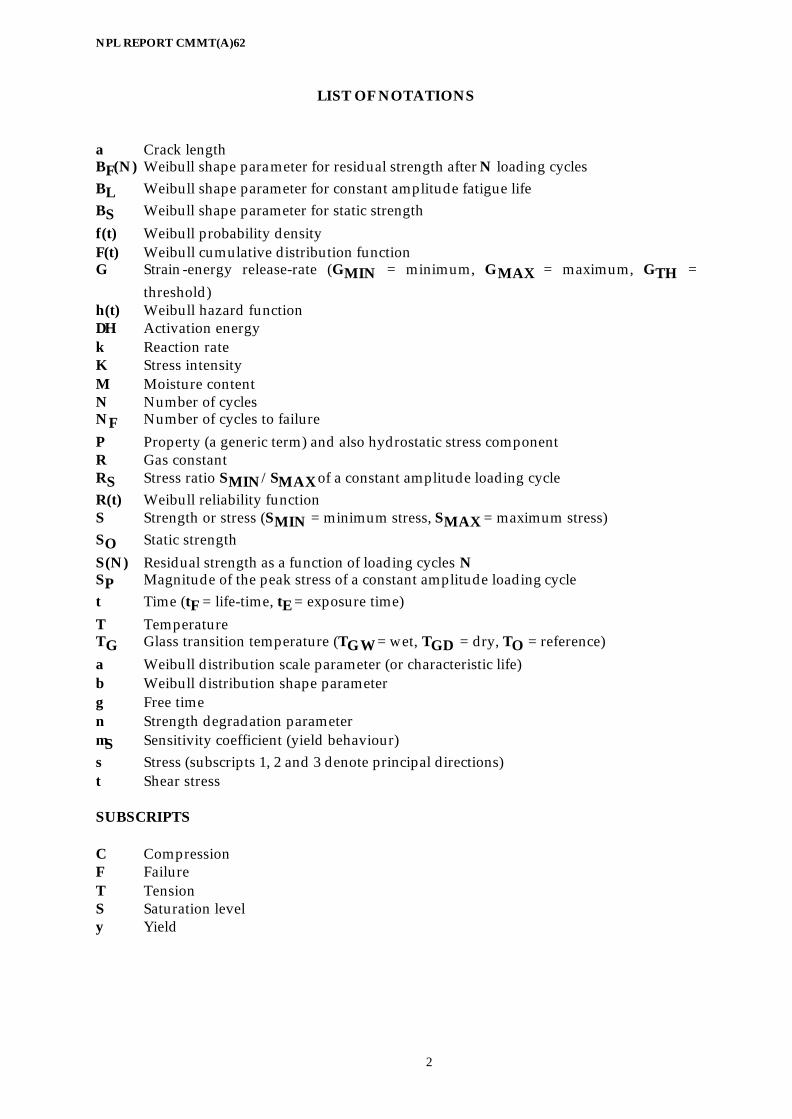
a Crack length BF(N) Weibull shape parameter for residual strength after N loading cycles BL Weibull shape parameter for constant amplitude fatigue life BS Weibull shape parameter for static strength f(t) Weibull probability density F(t) Weibull cumulative distribution function G Strain-energy release-rate (GMIN = minimum, GMAX = maximum, GTH =
threshold) h(t) Weibull hazard function ∆H Activation energy k Reaction rate K Stress intensity M Moisture content N Number of cycles NF Number of cycles to failure P Property (a generic term) and also hydrostatic stress component R Gas constant RS Stress ratio SMIN/SMAX of a constant amplitude loading cycle R(t) Weibull reliability function S Strength or stress (SMIN = minimum stress, SMAX = maximum stress) SO Static strength S(N) Residual strength as a function of loading cycles N SP Magnitude of the peak stress of a constant amplitude loading cycle t Time (tF = life-time, tE = exposure time) T Temperature TG Glass transition temperature (TGW = wet, TGD = dry, TO = reference) α Weibull distribution scale parameter (or characteristic life) β Weibull distribution shape parameter γ Free time ν Strength degradation parameter µS Sensitivity coefficient (yield behaviour) σ Stress (subscripts 1, 2 and 3 denote principal directions) τ Shear stress SUBSCRIPTS C Compression F Failure T Tension S Saturation level y Yield
NPL REPORT CMMT(A)62
TABLE OF CONTENTS
1. INTRODUCTION 1 2. SCOPE OF REVIEW 3 3. HYGROTHERMAL EFFECTS 4 3.1 IRREVERSIBLE TEMPERATURE EFFECTS 4 3.2 TEMPERATURE-MOISTURE 5 3.3 TEMPERATURE-MOISTURE-STRESS SUPERPOSITION 7 4. CYCLIC FATIGUE 7 4.1 PHENOMENOLOGICAL FATIGUE MODELS 8 4.2 FRACTURE MECHANICS 9 5. NON-FINITE ELEMENT ANALYSIS SOFTWARE 11 6. FINITE ELEMENT ANALYSIS SOFTWARE 14 7. CONCLUSIONS 16 7.1 PREDICTIVE MODELS 16 7.2 SOFTWARE 16 ACKNOWLEDGEMENTS 17 REFERENCES 17 FIGURES 20
APPENDIX I - WEIBULL DISTRIBUTION 22 APPENDIX II - MULTIAXIAL STRESS YIELD CRITERIA 26

NPL REPORT CMMT(A)62
1
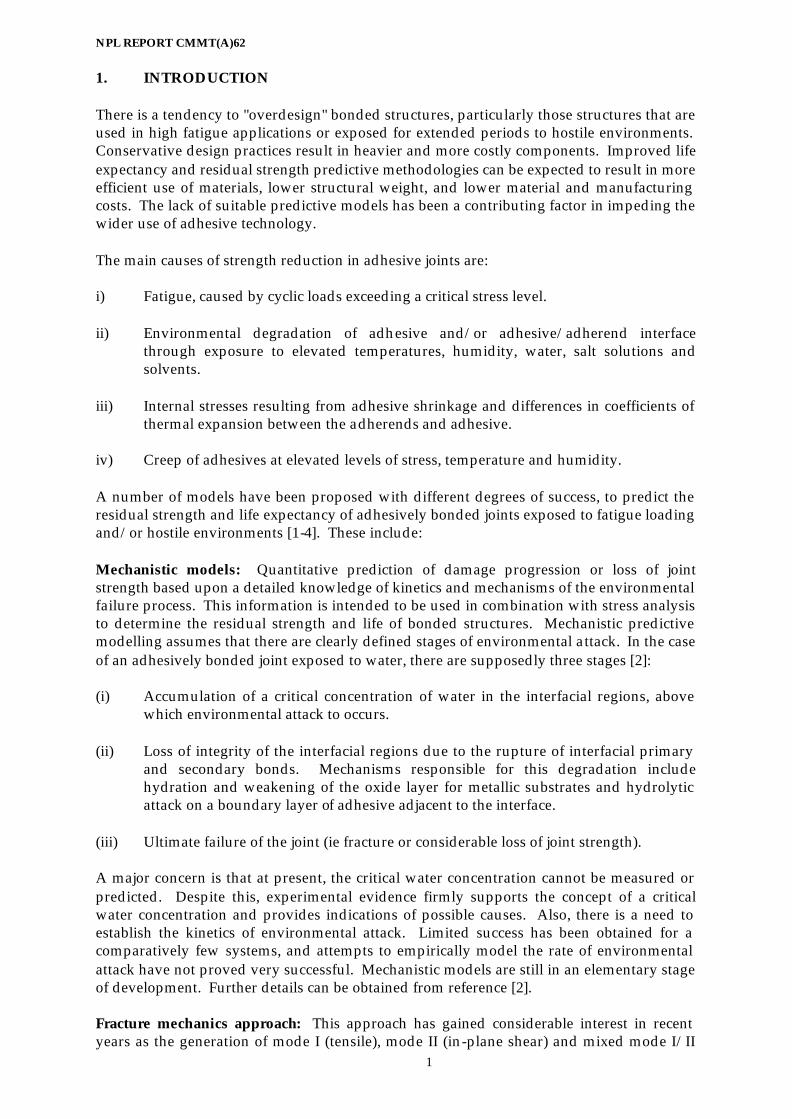
1. INTRODUCTION There is a tendency to "overdesign" bonded structures, particularly those structures that are used in high fatigue applications or exposed for extended periods to hostile environments. Conservative design practices result in heavier and more costly components. Improved life expectancy and residual strength predictive methodologies can be expected to result in more efficient use of materials, lower structural weight, and lower material and manufacturing costs. The lack of suitable predictive models has been a contributing factor in impeding the wider use of adhesive technology. The main causes of strength reduction in adhesive joints are: i) Fatigue, caused by cyclic loads exceeding a critical stress level. ii) Environmental degradation of adhesive and/or adhesive/adherend interface
through exposure to elevated temperatures, humidity, water, salt solutions and solvents.
iii) Internal stresses resulting from adhesive shrinkage and differences in coefficients of
thermal expansion between the adherends and adhesive. iv) Creep of adhesives at elevated levels of stress, temperature and humidity. A number of models have been proposed with different degrees of success, to predict the residual strength and life expectancy of adhesively bonded joints exposed to fatigue loading and/or hostile environments [1-4]. These include: Mechanistic models: Quantitative prediction of damage progression or loss of joint strength based upon a detailed knowledge of kinetics and mechanisms of the environmental failure process. This information is intended to be used in combination with stress analysis to determine the residual strength and life of bonded structures. Mechanistic predictive modelling assumes that there are clearly defined stages of environmental attack. In the case of an adhesively bonded joint exposed to water, there are supposedly three stages [2]: (i) Accumulation of a critical concentration of water in the interfacial regions, above
which environmental attack to occurs. (ii) Loss of integrity of the interfacial regions due to the rupture of interfacial primary
and secondary bonds. Mechanisms responsible for this degradation include hydration and weakening of the oxide layer for metallic substrates and hydrolytic attack on a boundary layer of adhesive adjacent to the interface.
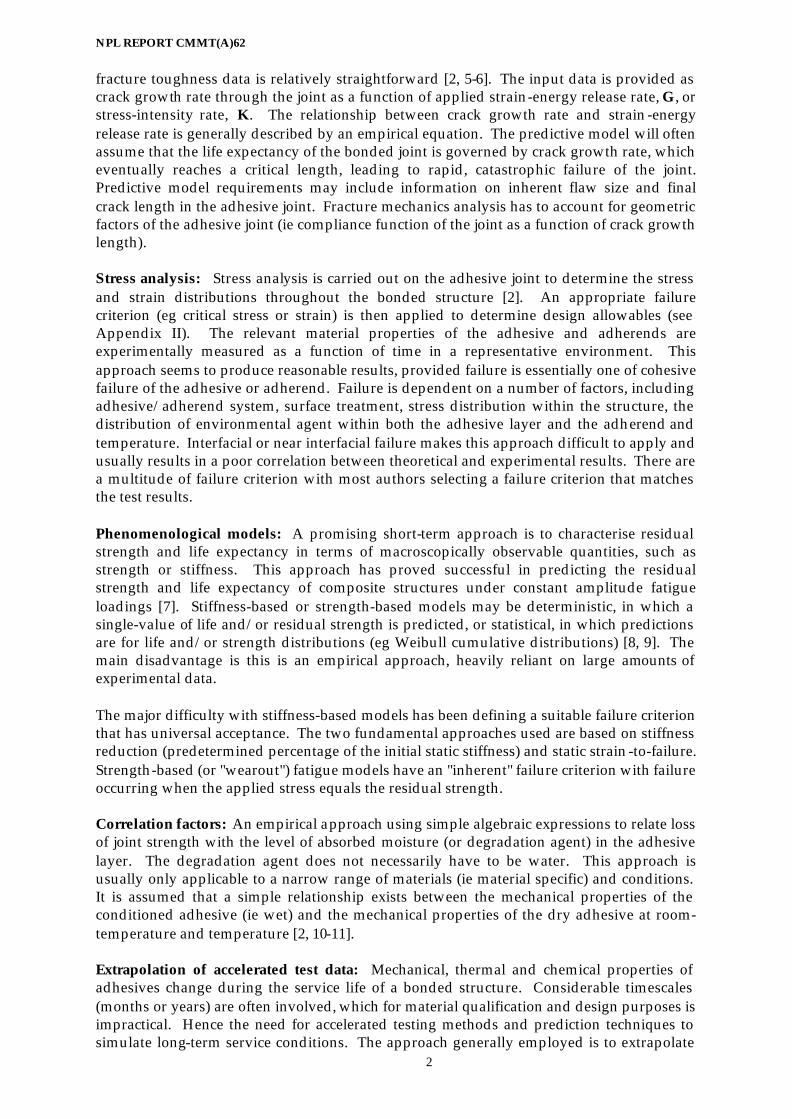
(iii) Ultimate failure of the joint (ie fracture or considerable loss of joint strength). A major concern is that at present, the critical water concentration cannot be measured or predicted. Despite this, experimental evidence firmly supports the concept of a critical water concentration and provides indications of possible causes. Also, there is a need to establish the kinetics of environmental attack. Limited success has been obtained for a comparatively few systems, and attempts to empirically model the rate of environmental attack have not proved very successful. Mechanistic models are still in an elementary stage of development. Further details can be obtained from reference [2]. Fracture mechanics approach: This approach has gained considerable interest in recent years as the generation of mode I (tensile), mode II (in-plane shear) and mixed mode I/II
NPL REPORT CMMT(A)62
2
fracture toughness data is relatively straightforward [2, 5-6]. The input data is provided as crack growth rate through the joint as a function of applied strain-energy release rate, G, or stress-intensity rate, K. The relationship between crack growth rate and strain-energy release rate is generally described by an empirical equation. The predictive model will often assume that the life expectancy of the bonded joint is governed by crack growth rate, which eventually reaches a critical length, leading to rapid, catastrophic failure of the joint. Predictive model requirements may include information on inherent flaw size and final crack length in the adhesive joint. Fracture mechanics analysis has to account for geometric factors of the adhesive joint (ie compliance function of the joint as a function of crack growth length). Stress analysis: Stress analysis is carried out on the adhesive joint to determine the stress and strain distributions throughout the bonded structure [2]. An appropriate failure criterion (eg critical stress or strain) is then applied to determine design allowables (see Appendix II). The relevant material properties of the adhesive and adherends are experimentally measured as a function of time in a representative environment. This approach seems to produce reasonable results, provided failure is essentially one of cohesive failure of the adhesive or adherend. Failure is dependent on a number of factors, including adhesive/adherend system, surface treatment, stress distribution within the structure, the distribution of environmental agent within both the adhesive layer and the adherend and temperature. Interfacial or near interfacial failure makes this approach difficult to apply and usually results in a poor correlation between theoretical and experimental results. There are a multitude of failure criterion with most authors selecting a failure criterion that matches the test results. Phenomenological models: A promising short-term approach is to characterise residual strength and life expectancy in terms of macroscopically observable quantities, such as strength or stiffness. This approach has proved successful in predicting the residual strength and life expectancy of composite structures under constant amplitude fatigue loadings [7]. Stiffness-based or strength-based models may be deterministic, in which a single-value of life and/or residual strength is predicted, or statistical, in which predictions are for life and/or strength distributions (eg Weibull cumulative distributions) [8, 9]. The main disadvantage is this is an empirical approach, heavily reliant on large amounts of experimental data. The major difficulty with stiffness-based models has been defining a suitable failure criterion that has universal acceptance. The two fundamental approaches used are based on stiffness reduction (predetermined percentage of the initial static stiffness) and static strain -to-failure. Strength-based (or "wearout") fatigue models have an "inherent" failure criterion with failure occurring when the applied stress equals the residual strength. Correlation factors: An empirical approach using simple algebraic expressions to relate loss of joint strength with the level of absorbed moisture (or degradation agent) in the adhesive layer. The degradation agent does not necessarily have to be water. This approach is usually only applicable to a narrow range of materials (ie material specific) and conditions. It is assumed that a simple relationship exists between the mechanical properties of the conditioned adhesive (ie wet) and the mechanical properties of the dry adhesive at room-temperature and temperature [2, 10-11]. Extrapolation of accelerated test data: Mechanical, thermal and chemical properties of adhesives change during the service life of a bonded structure. Considerable timescales (months or years) are often involved, which for material qualification and design purposes is impractical. Hence the need for accelerated testing methods and prediction techniques to simulate long-term service conditions. The approach generally employed is to extrapolate
NPL REPORT CMMT(A)62
3
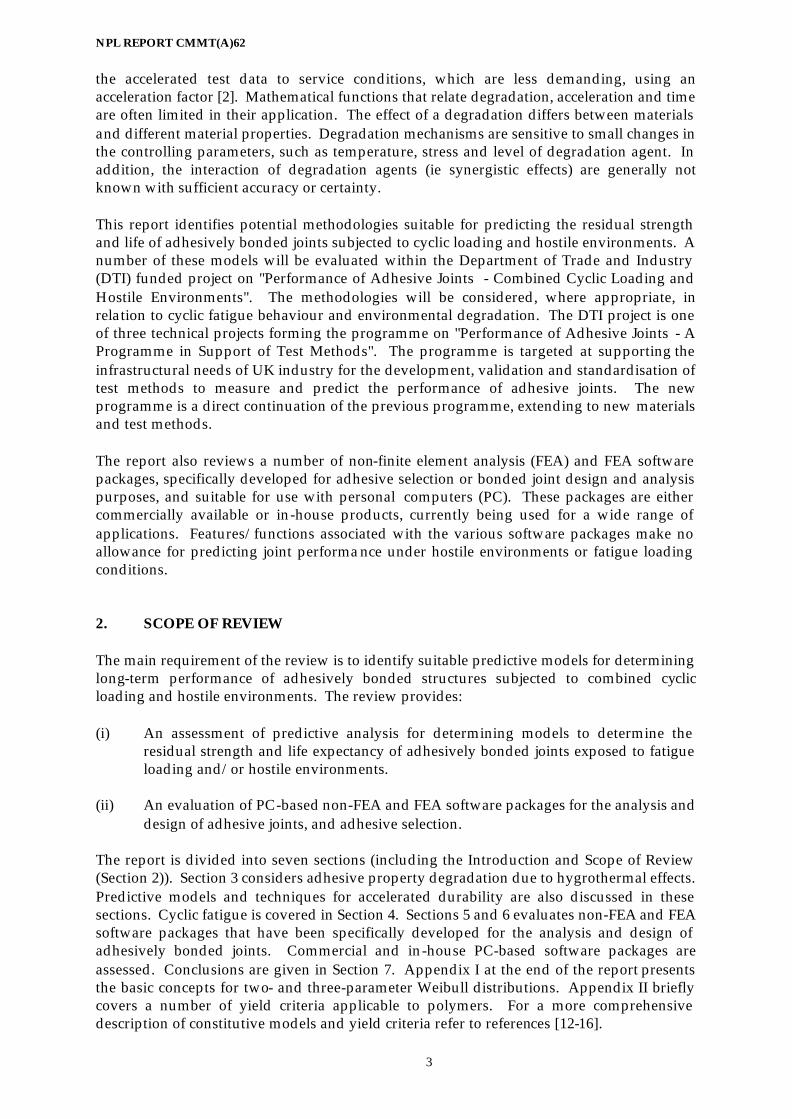
the accelerated test data to service conditions, which are less demanding, using an acceleration factor [2]. Mathematical functions that relate degradation, acceleration and time are often limited in their application. The effect of a degradation differs between materials and different material properties. Degradation mechanisms are sensitive to small changes in the controlling parameters, such as temperature, stress and level of degradation agent. In addition, the interaction of degradation agents (ie synergistic effects) are generally not known with sufficient accuracy or certainty. This report identifies potential methodologies suitable for predicting the residual strength and life of adhesively bonded joints subjected to cyclic loading and hostile environments. A number of these models will be evaluated within the Department of Trade and Industry (DTI) funded project on "Performance of Adhesive Joints - Combined Cyclic Loading and Hostile Environments". The methodologies will be considered, where appropriate, in relation to cyclic fatigue behaviour and environmental degradation. The DTI project is one of three technical projects forming the programme on "Performance of Adhesive Joints - A Programme in Support of Test Methods". The programme is targeted at supporting the infrastructural needs of UK industry for the development, validation and standardisation of test methods to measure and predict the performance of adhesive joints. The new programme is a direct continuation of the previous programme, extending to new materials and test methods. The report also reviews a number of non-finite element analysis (FEA) and FEA software packages, specifically developed for adhesive selection or bonded joint design and analysis purposes, and suitable for use with personal computers (PC). These packages are either commercially available or in-house products, currently being used for a wide range of applications. Features/functions associated with the various software packages make no allowance for predicting joint performance under hostile environments or fatigue loading conditions. 2. SCOPE OF REVIEW The main requirement of the review is to identify suitable predictive models for determining long-term performance of adhesively bonded structures subjected to combined cyclic loading and hostile environments. The review provides: (i) An assessment of predictive analysis for determining models to determine the
residual strength and life expectancy of adhesively bonded joints exposed to fatigue loading and/or hostile environments.
(ii) An evaluation of PC-based non-FEA and FEA software packages for the analysis and
design of adhesive joints, and adhesive selection. The report is divided into seven sections (including the Introduction and Scope of Review (Section 2)). Section 3 considers adhesive property degradation due to hygrothermal effects. Predictive models and techniques for accelerated durability are also discussed in these sections. Cyclic fatigue is covered in Section 4. Sections 5 and 6 evaluates non-FEA and FEA software packages that have been specifically developed for the analysis and design of adhesively bonded joints. Commercial and in-house PC-based software packages are assessed. Conclusions are given in Section 7. Appendix I at the end of the report presents the basic concepts for two- and three-parameter Weibull distributions. Appendix II briefly covers a number of yield criteria applicable to polymers. For a more comprehensive description of constitutive models and yield criteria refer to references [12-16].
NPL REPORT CMMT(A)62
4
3. HYGROTHERMAL EFFECTS 3.1 IRREVERSIBLE TEMPERATURE EFFECTS 3.1.1 Arrhenius Model Modelling of any degradation process requires information on the change in material properties with time and the rate of change of those properties with the level of degrading agent(s). The change of property with time can take one of many forms (eg linear or logarithmic). The first approach usually considered when modelling material degradation as a function of temperature is to use the Arrehenius relationship. According to the Arrehenius rate law, the rate of a simple (first-order) chemical reaction depends on the temperature as follows [3, 9]: )/exp( RTHAk ∆= (1) where k is the reaction rate (or degradation rate) for the process, ∆H is the activation energy, R is the gas constant, T is the absolute Kelvin temperature and A is a constant. The activation energy ∆H plays a pivotal role in determining the degradation rate and its value depends on the failure mechanism materials involved. ∆H is usually measured using differential scanning calorimetry (DSC). The ratio of the change in rate constants for temperatures T and TO is given by:
−
∆+=
00
11303.2
loglogTTR
Hkk (2)
where kO is the rate constant at the reference temperature TO. A plot of log(k/kO) against 1/T produces a straight line with a slope of ∆H/2.303R. Data can be extrapolated from this relationship, although caution is needed when interpreting the results. Assuming a power law applies with respect to time (ie tn) then the change in material property P is given by: ( )[ ]RTHAtPP n /exp0 ∆−= (3) where n is a constant and PO is the value of the property at the reference temperature TO. 3.1.2 Kinetic Rate Theory According to the kinetic rate theory (ie time-temperature superposition), the relation between the time tF needed for a given property to reach a predetermined or limit value and the test temperature TN for a first order degradation reaction is logarithmic and is expressed by the following relationship [17]: CMfCMN BtAT += ln (4) where ACM and BCM are constants determined from linear regression. The life-time tF of the material (for a certain property) can be determined at any chosen temperature TN by rearranging Equation (4) as follows [17]:
−=
CM
CMNf A
BTt exp (5)
The general approach is to set the limit value to 50% of the material property as measured dry under standard laboratory conditions (23oC, 50% RH). It is important that the test temperatures are kept moderate (ie < 100oC) to ensure that chemical reactions (eg thermal oxidation) that occur at higher temperatures are avoided, and the dominant mode of failure
NPL REPORT CMMT(A)62
5
is identical at all temperatures and stress levels. 3.1.3 Phenomenological Approach Ha and Springer [18] showed that for Fiberite 976 epoxy resin, the changes in strength, initial elastic modulus and initial Poisson's ratio with temperature could be approximated by:
n
NN TT
TTPP
−
−=
0
0 (6)
where P is the property under consideration at temperature T, and PN is the value of the property at temperature TN (typically room-temperature). TO is the reference temperature, and n is a constant with a value between 0 and 1 (0 ≤ n ≤ 1). The values of TO and n are obtained from fitting Equation (6) to the experimental data. The primary cause of chemical degradation of polymeric materials exposed to moisture is hydrolysis. This results in a reduction in the cross-link density of the polymer. Assuming that the loss of mechanical properties due to hydrolysis is of the form of an Arrhenius relationship then the degradation process can be represented by [19]:
−−=
−−
∞*
0
0 exp1Ct
PPPP E (7)
where tE is the exposure time, PO is the material property value in the untreated state, P∞ is the ultimate value of that property at the aged state and C* is a material constant. The values of PO, P∞ and C* are obtained using a linear regression (ie least squares fit) to the experimental data. An alternative approach is to relate the strength of the adhesive joint and the water uptake in the adhesive layer. it has been suggested that the relationship between the two parameters can be described by the following empirical equation [2]:
−=
SMM
PSS
10
(8)
where S is the strength of the joint at time t, SO is the initial strength of the joint, M is the mass uptake of the water at time t, MS is the mass uptake of water at saturation and P is the ratio of the absorbed water contributing to bond breakage. P is determined from a curve fitting experimental data, and the value of C is dependent on the diffusion coefficient of water in the material. Equation (8) describes an S-shaped curve function of percentage strength retention against time. This approach is rather limited because the rate of degradation may not be governed by water diffusion. 3.2 TEMPERATURE-MOISTURE SUPERPOSITION 3.2.1 Parametric Approach Hygrothermal effects refer to the effects caused by the combination of moisture and temperature. Adhesive property degradation due to hygrothermal effects is often approximated by a simple algebraic relationship of the form shown below [10, 11]:
2
1
00
−−
=TTTT
PP
GD
GW (9)
where P denotes the material property (usually strength), and TGD and TGW are the glass
NPL REPORT CMMT(A)62
6
transition temperatures (TG) of dry and conditioned (ie wet) material. TGW can be expressed in terms of TGD as follows [17]:
GDGW TCBMAMT )( 2 ++= (10) where M is the moisture in the adhesive in percent weight, and A, B and C are constants obtained by curve fitting experimental data. The glass transition temperature may be measured using either DMTA (dynamic mechanical thermal analysis) or DSC techniques. Chamis and Murthy [10] suggest that for thermoset based systems, the constants A, B and C have values of 0.005, -0.1 and 1.0, respectively. In fact, these constants can be expected to differ for different adhesive systems and mechanical properties, and therefore need to be determined for a specific case. The authors extended Equation (9) to include the degradation effect of cyclic loading [17]:
NATTTT
PP
GD
GW log2
1
00
−
−−
= (11)
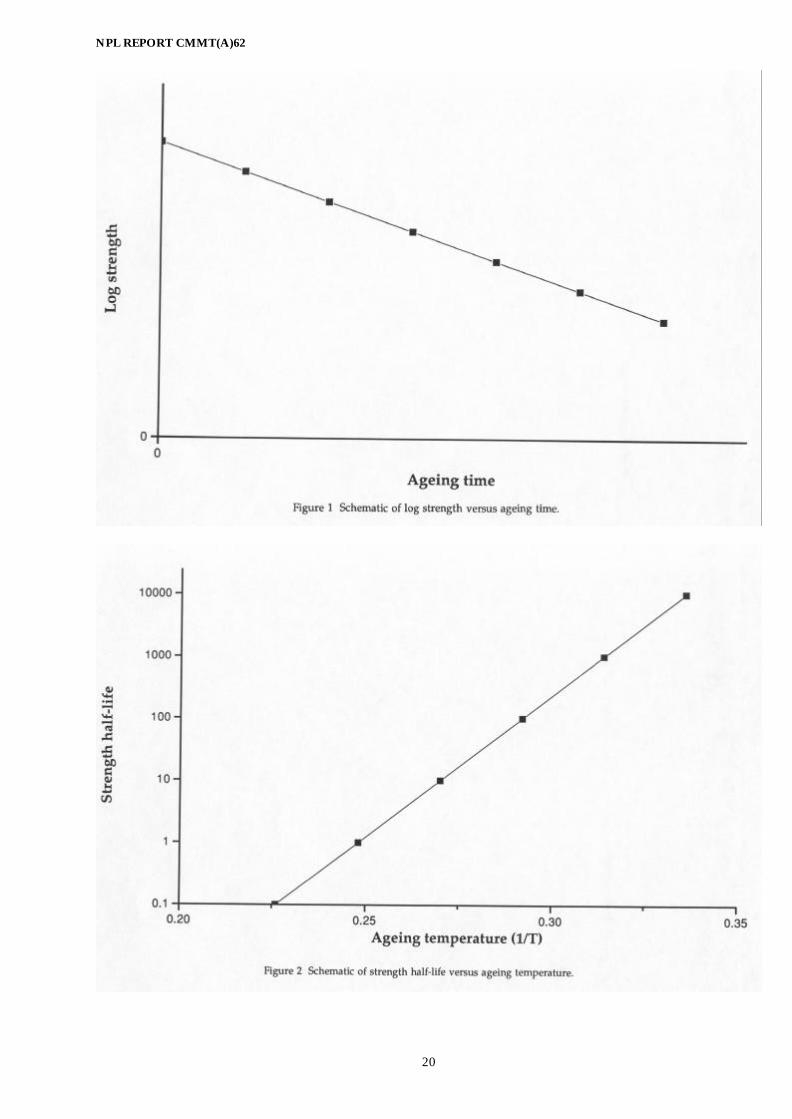
where A is obtained by curve-fitting experimental data and N is the number of cycles. The value of constant A will vary between adhesive systems and mechanical properties, although a designated value of 0.1 has been recommended for hot/wet conditions [17]. 3.2.2 Accelerated Ageing Models The natural process of moisture absorption in many polymeric materials is normally slow. It is therefore very difficult to obtain saturation conditions or even realistic levels of moisture within a practical time scale. Collings et.al. [11] postulated that an increase in test temperature, equivalent to the change in the glass transition temperature δTG (ie TGD - TGW) due to hot/wet exposure could be used to represent the degradation of polymer matrix composites due to moisture. Thus, the strength properties of a conditioned material tested at TO would be equivalent to the strength properties of the dry material tested at TO + δTG. This approach obviously relies on the fact that failure mode characteristics of the hot/wet conditioned structure can be duplicated at the higher temperature free of moisture. The procedure is simplistic, but warrants further consideration in relation to adhesive joint performance. An alternative approach is to plot material property data against time for one temperature-moisture level (Figure 1). The data is often represented by the following equation [20]: tBALogA 11 += (12) where B is the material property (eg shear strength), B1 is the material property at zero ageing time, B1 is the degradation rate and t is the ageing time. Similar data is generated at different temperatures. Then the time required for the strength to degrade to half its original value (half-life) at each temperature is calculated from the fitted equations. The next step is to plot the half-life properties as a function of the reciprocal of the ageing temperature (ie 1/T) as shown in Figure 2. This is the Arrehenius temperature dependence relationship which can be represented by the following equation [20]: TBALogt /222/1 += (13) where t1/2 is the half-life property, A2 and B2 are material constants and T is the ageing
temperature (oK). the service life (or half-life at service temperature) can be estimated by extrapolation from the plot of log t1/2 versus 1/T or from the fitted Equation (13).
NPL REPORT CMMT(A)62
7
A number of factors may provide difficulties in interpretation of property-time measurements. These include: • Joint strength may increase or decrease upon initial exposure to elevated
temperatures. This may result from loss of volatiles, chemical cross linking or relief of internal stresses.
• Long-term degradation rate may change during the ageing period. The ageing
process may also change with temperature and exposure time. • Statistical variability, which generally increases with exposure time, can introduce
anomalous effects that make it difficult to differentiate the effects of key variables and to determine the ageing sequence. Rigorous statistical analysis is required to determine the precision (confidence limits) of the durability data.
• It is virtually impossible to duplicate service conditions using accelerated ageing
procedures, particularly as realistic environments include large random variations in temperature and humidity.
3.3 TEMPERATURE-MOISTURE-STRESS SUPERPOSITION The Arrhenius relationship can be extended to the mechanical behaviour of adhesive bonds subjected to a combination of temperature, moisture and stress. The failure time tF can be determined by [21]:
TS
bRT
HTLogt f −
∆+=
303.2log (14)
where C and b are constants, T is absolute temperature, ∆H is the activation energy, R is the gas constant, T is the absolute temperature (OK) and S is the stress. At constant temperature, log tF versus S/T is a straight line. This empirical approach can be used to determine the service life (eg half-life) of bonded joints. 4. CYCLIC FATIGUE Fatigue damage is caused by exposure to repeated or cyclical mechanical stress, where the stress level exceeds a limiting value called the critical stress. The damage is due to internal structural deformations within the material, which do not return to the original prestressed condition when the stress is removed. Fatigue damage is cumulative, resulting in ultimate failure of the component. The concern is that: • Fatigue failure can occur within 107 to 108 cycles at stress levels less than 50% of the
static fracture strength. • Critical stress levels can be less than 25% of the static fracture strength. Quantification and prediction of fatigue performance is largely empirical and based on experiment with the high degree of uncertainty being a major concern. This section examines a number of generic approaches that could be used to predict the residual strength and fatigue life of adhesively bonded joints.
NPL REPORT CMMT(A)62
8
4.1 PHENOMENOLOGICAL FATIGUE MODELS 4.1.1 Deterministic Approach The residual strength, S(N), initially equals the static strength SO, and is assumed to monotonically decrease with fatigue cycles. Ignoring environmental and frequency effects, the rate of degradation should be dependent on SO, the magnitude of the peak stress SP and the stress ratio RS. The stress ratio RS for constant amplitude loading is given by:
11; ≤<−= SMAX
MINS R
SS
R (15)
where SMIN and SMAX are the minimum and maximum stresses, respectively. The residual strength S(N) may be written in the form of [7]:
( )ν
−−=
FP N
NSSSNS 00)( (16)
where N is the number of loading cycles, NF is the constant amplitude fatigue life and ν is the "strength degradation parameter". Failure is assumed to occur when the residual strength S(N) is equal to the peak stress SP, hence the number of loading cycles N at failure equals the constant amplitude fatigue life NF. The peak stress SP is usually 50% of SO. Equation (16) defines a family of curves for residual strength as a function of fatigue loading cycles. The path of each curve is dependent on the strength degradation parameter ν with: a) Linear degradation occurring for ν = 1; b) Sudden death behaviour for ν >> 1; and c) Rapid initial loss of strength for ν < 1. Sudden death behaviour describes a degradation path, where the residual strength is relatively constant (ie S(N) ≈ SO) over the initial portion of the S-N curve, then rapidly decreases to equal the peak stress SP. The strength degradation parameter ν is determined by comparing theoretical and experimental fatigue life results. 4.1.2 Statistical Approach Due to the inherent variability in residual strength and life expectancy, the deterministic approach described in Section 4.1.1 has generally proved inaccurate, necessitating statistical analysis of the data. A widely used approach has been to represent the residual strength and life expectancy by two parameter Weibull functions. Using this approach, the probability of failure for constant amplitude loading (ie the probability that the residual strength is less than the peak stress SP) can be expressed as [7]:
[ ]
−−
−−=≤
)(
00
exp1)(
NB
Fp
PP
f
NN
SSS
SSNSP
ν (17)
where Bf(N) is the Weibull shape parameter for residual strength. A similar relation for the Weibull fatigue life distribution is given by [7]:
NPL REPORT CMMT(A)62
9
[ ]
−−=≤
LB
FF N
NNNP exp1 (18)
where BL is the shape parameter for fatigue life. At zero cycles, Equation (18) reduces to the static strength Weibull cumulative distribution function, which describes the probability that the initial strength SO is less than or equal to the peak stress SP. This function has the following form [7]:
[ ]
−−=≤
SB
PP S
SSSP
00 exp1 (19)
where BS is the shape parameter for static strength. Static and fatigue life tests are conducted to obtain NF and the shape parameters Bf(N), BL and BS. The "optimum" value of the strength degradation parameter ν is obtained by determining the best predictive fit of Equation (17) to the experimentally obtained Weibull distribution for fatigue life given by Equation (18). The two parameter Weibull model can be used to predict the residual strength and fatigue life of bonded joint subjected to constant amplitude and two-stress level loadings. The scatter in residual strength distributions increases with increasing cycles, and hence the shape parameter decreases. 4.2 FRACTURE MECHANICS The general approach is to relate the rate of crack growth da/dt through the joint to the applied strain-energy release rate, G, or the stress intensity factor, K. It is worth noting that good progress has been made in applying fracture mechanics to predicting the fatigue life of adhesively bonded joints for single-mode loading configurations, although the relevance and potential usage to actual bonded structures is regarded by the engineering community with some scepticism. From an engineers perspective, prediction of crack growth rate is considered far less important than determining the crack initiation stress or energy. Nonetheless, a considerable amount of effort has been expended in attempting to predict the rate of crack growth under mode I, mode II and mixed mode I/II static and cyclic loading conditions. Studies have been conducted for a range of environmental conditions, including elevated temperature and humidity (ie hot/wet), and full immersion in water. Crack growth rate da/dN per cycle can be related to the maximum value of the applied strain energy release rate Gmax by a form of the Paris Equation [2, 5]:
nGCdNda
)( max= (20)
where C and n are material constants. This relationship applies only to the linear portion of the logarithmic-logarithmic plot of GMAX versus da/dN . Alternatively, the crack growth rate can be expressed as a function of the range of the strain-energy release rate ∆G by [2, 5]:
qGAdNda
)(∆= (21)
where A and q are constants. The difference between maximum and minimum of the strain-energy release-rate per cycle,
NPL REPORT CMMT(A)62
10
∆G is given by: MINMAX GGG −=∆ (22) The relationship given by Equation (20) only applies to the linear portion of a logarithmic-logarithmic plot of ∆G versus da/dN. Values for both sets of constants (ie C and n, and A and q) can be determined using linear regression least squares technique applied to the linear region of the logarithmic-logarithmic plots. Generally, the relationship between log GMAX or log ∆G and log da/dN is sigmoidal in shape, which can be described as follows [2, 5]:
−
−
=
1
2
1
1
)( max
n
n
C
MAX
MAX
TH
n
GG
GG
GCdNda
(23)
where GTH is the minimum, or threshold, value of the adhesive fracture energy, GC is the adhesive fracture energy from constant rate of displacement tests (ie static fracture energy) and A, n, n1 and n2 are material constants. No significant fatigue crack growth occurs below GTH. Mode I values of GTH obtained from measurements on bonded double cantilever beam (DCB) specimens are typically an order of magnitude lower than the corresponding adhesive fracture energy GC, measured under static test conditions. Kinloch and Osiyemi [5] demonstrated the potential of using fracture mechanics to predict the fatigue life of bonded single lap-joints. The authors used mode I data obtained from DCB tests. The analysis was based on the assumption that single-overlap joints loaded in tension fail as a result of transverse (out-of-plane) stresses, or cleavage stresses acting at right angles to the direction of the applied load. The equation used to determine the number of fatigue cycles to failure was relatively complex. This poses particular problems in applying a fracture mechanics approach to actual structures, particularly where the loading configuration is not a well defined single-mode loading configuration. Design of bonded structures against fatigue using a fracture mechanics approach would require that the calculation of maximum fatigue loads be based on GTH values. As with static tests, the crack extension is measured using either a travelling microscope or video camera. For static tests, the coefficient of variation is typically 20% or higher. The uncertainty is higher for fatigue tests where the power-law relationship (Equations (20), (21) and (23)) are hypersensitive to small errors in applied load and crack length.
NPL REPORT CMMT(A)62
11
5. NON-FINITE ELEMENT ANALYSIS SOFTWARE Simplified analytical procedures for designing adhesively bonded joints are available in the form of PC compatible software, although these packages are limited in number and scope. As with all design tools, the effectiveness of the analysis is directly related to the users knowledge, and therefore it is advisable that the user has a good understanding of engineering design and material behaviour. The software packages are there to assist in the design of efficient bonded joints. A brief description of a number of in-house and commercial non-FEA (finite element analysis) packages are given below. The main features and equipment requirements of each software package are identified. Permabond Adhesive Locator (PAL) The PAL software is an "expert" system widely used by industry for the initial selection of an adhesive type or grade [22-24]. The software, designed to enable the selection of potential candidates for a range of engineering applications, is quick and simple to use. PAL can be used to assess both mechanical and structural bonded joints, specifically lap, honeycomb, sandwich and butt joint assemblies, and for the fitting of bushes, gears, bearings, shafts and splines, sealing of pipes, threaded fittings and gaskets with adhesive related sealants. PAL software is MS-DOS based, compatible with 286 processor (or better) and totally interactive, providing information on design and production. The program states the reason for each decision(s) and also automatically provides guidance information on subjects which are known to cause engineering problems. The software provides elastic stress analysis of joints through the use of the P-stress program. The influence of geometrical and adhesive modulus changes can be observed graphically for fatigue and creep. PAL provides a detailed glossary covering individual generic adhesive types and relating issues such as surface preparation. ADHESYS - AEA Technology ADHESYS is an "expert" system that covers all aspects of the adhesive bonding process, from material selection and surface preparation to stress analysis and design optimisation procedures [25]. The package, which is compatible with PAL (Section 1.2), provides helpful guidance on health and safety, a glossary of terms, a list of adhesives suppliers and a database of abstracts of important technical papers. BISEPS-TUG - AEA Technology BISEPS-TUG is a closed form computer code for the prediction of stresses and strains in adhesively bonded coaxial joints [25]. The software is aimed at the designer/analyst, and has been validated against the proprietary FEA package ABAQUS (proprietary system), and measurements obtained using laser Moiré interferometry. ABAQUS is a general purpose, non-linear FEA package, that is routinely employed as a benchmark for assessing other design/analysis packages. The joint data is specified by the user in response to a question and answer prompt format. The main features of BISEPS-TUG include: a) Applied loads - torsional and axial. b) Adherends - isotropic and orthotropic material properties. c) Allows for plasticity of adhesive layer. d) Calculates thermal stresses. e) Stepped and profiled joints.
NPL REPORT CMMT(A)62
12
BISEPS-LOCO - AEA Technology BISEPS-LOCO is a closed form computer code for the prediction of stresses and strains in adhesively bonded single-lap shear joints [25]. Data specification and code validation identical to that employed for BISEPS-TUG (Section 1.3). The main features of BISEPS-LOCO include: a) Applied loads - tensile, shear and bending moments. b) Calculates peel and shear stresses and strains. c) Allows for plasticity of adhesive layer. d) Calculates thermal stresses. e) Stepped and profiled joints. Engineering Sciences Data Unit (ESDU) ESDU provide a comprehensive range of data sheets and software for use in structural design. The information is provided primarily for use in aerospace structures, but has wider application to other areas of engineering [26]. The information is accepted by the Federal Aviation Administration (FAA) in the United States and by the Civil Aviation Authority in the United Kingdom as a basis for submissions. In most cases, PC software is available with computer listings. The production of the design data and software is monitored and guided by expert committees of professionally qualified engineers from industry, research laboratories and universities. Items are continuously checked and updated to include the latest amendments, which are available to software leasees on request. The software can be run on a PC with a 386 processor and 5 MB disk space. Both MS-DOS and Window versions of the software can be leased from ESDU. Each program has a main menu enabling the user access to different input screens (eg material properties, loading conditions and results). The ESDU software is relatively sophisticated compared with most analytical packages. To maximise the software benefits requires a good understanding of engineering design. It is advisable, prior to use, that the manual be read carefully. ESDU provide data sheets and software for the analysis of bonded structures. Structures sub-series Volume 12 contains five modules, which are listed below: ESDU 78042 Shear stresses in the adhesives in bonded joints. Single-step double-lap joints
loaded in tension. ESDU 79016 Inelastic shear stresses and strains in the adhesives bonding lap joints loaded
in tension or shear (computer program). ESDU 80011 Elastic stresses in the adhesive in single step double-lap bonded joints. ESDU 80039 Elastic adhesive stresses in multi-step lap joints loaded in tension (computer
program). ESDU 81022 Guide to the use of Data Items in the design of bonded joints. Corresponding data sheets and software for the analysis of laminated fibre-reinforced composite materials are available in a seven volume sub-series on composites (ie Volume 4).
NPL REPORT CMMT(A)62
13
SAAS (Stress Analysis for Adhesive Structures)-Surrey University This software is basically a finite element analysis (FEA) package with a Windows-based front end and the appearance of a computer aided design (CAD) package [27]. The program runs under Windows 3.1 or 3.11 (but not Windows 95), and requires approximately 1.5 Mb of hard disk space. The software enables two-dimensional stress analysis of arbitrary adhesive joint configurations of the users design or selection from a pa lette of five pre-defined joints, including single-lap, double-lap, top hat and right-angle butt joints and clinch flange. Joint geometries can be constructed using a series of building blocks (eg single substrate, sandwich, angle, etc.). In all cases, the user is able to adjust the geometry, material properties, applied loads and constraints. Composite substrates can be constructed, provided ply properties, orientation and total number of plies is defined. The use of construction lines and datum enables the user to define adherend dimensions, overlap length and adhesive thickness, etc. Loads and constraints (free, translational and rotational) can be applied to the bonded structure at intersections of construction lines. Once configured, the model is meshed and analysed using FEA. Results of the analysis can be viewed in three ways; (i) deformed shape of the model; (ii) graph of stresses; and (iii) listings of stresses. Stresses include direct stress for isotropic materials and peel, shear and/or von Mises stresses for adhesives. The analysis distinguishes between plane-stress and plane-strain (ie lateral constraint). Data can be saved in a spreadsheet (eg Excel). DLR - Preliminary Design of Composite Joints Deutsche Forschungsantalt für Luft-und Raumfahrt e.V. (DLR), Stuggart, Germany have developed PC compatible MS-DOS software for preliminary design of composite joints [28]. The design procedures cover both adhesively bonded joints and mechanically fastened bolted joints. Simplified procedures based on shear lag analysis are employed for design of adhesive joints. The analyses considers linear-elastic and linear-elastic/plastic behaviour, tension loaded and shear loaded lap joints, and symmetric and asymmetric joints. The software provides simple analytical procedures for solving structural load transfer and load introduction problems, providing shear stress and tensile stress distributions. JOINT (Defence and Evaluation Research Agency, Farnborough) The JOINT software program was developed by Bristol University for the Structural Materials Centre, Defence Research and Evaluation Agency (DEAR) at Farnborough [29] to analyse the stress state in bonded joints, particularly carbon fibre-reinforced plastic (CFRP)/metal, subjected to long-term weathering. The analysis accounts for environmental effects, such as thermal contraction stresses within the joint, swelling of the adhesive by absorbed water, and the relatively low shear stiffness of CFRP adherends and plastic deformation of the adhesive. The analysis applies to single- and double-lap joints where adherends may be either isotropic or orthotropic (eg fibre-reinforced composite materials), have unequal thickness and different material properties. The analysis assumes a state of plain strain resulting in a two-dimensional elasticity problem where the longitudinal, peel and shear stresses are required for each layer. The analysis extends the stress function approach developed by Allman [30] who employed two stress functions to represent the complete stress state. The modified analysis developed by Mallick [29] employs four stress functions, thus allowing for stress variations across the adhesive thickness and hygrothermal deformation of the adhesive and adherends. The elasto-plasticity stress-strain curve of the adhesive is modelled as a bi-linear function and then solved iteratively. Joints can be analysed using either Mallick or Allman methods (single-lap), Volkersen, or Grant and Tait methods
NPL REPORT CMMT(A)62
14
(double-lap). User defined material properties can be entered into the database, and it is also possible to input vertical shear and moment loads on the ends of the adherend (eg mode I and II), as well as the longitudinal tensile load. Output includes data name and filename; longitudinal, peel, shear, maximum shear and principal stresses and strains in each element of the adhesive layer, averaged over the element. The results can be compared to the selected failure criterion, which can include von Mises stress and peel failure at interfaces or in composite adherends; values exceeding the failure limit are highlighted on the screen display. The current version V.2 has provision for a modified von Mises yield criterion to provide improved accuracy for plastic analysis. Results can be displayed as plots or in tabular form, which can be saved in CGM metafile or ASCII formats for importing into a spreadsheet. The software can be run on a PC with a 286 processor (or better) under DOS 3.0 (or higher). The hard disk system requires a maths co-processor and approximately 0.4 Mb of memory. The graphics display uses the EMATEK GSS*CGI system. The user does not require specialist engineering or stress analysis knowledge in order to use the system. 6. FINITE ELEMENT ANALYSIS SOFTWARE Numerical analysis techniques, such as FEA, are used extensively in the design and stress analysis of adhesive joints and bonded structures. These techniques offer solutions to complex problems that are too difficult or impossible to resolve using analytical models. Numerous FEA codes are commercially available. These codes provide in-built constitutive models suitable for simulating the behaviour of most adhesives, allowing for non-uniform stress/strain distributions, geometric non-linearity, hygrothermal effects, elastic-plastic and visco-plastic behaviour, static and dynamic analysis, strain rate dependence [1, 16, 32]. Orthotropic element types include two-dimensional solid plane-stress or plane-strain elements, axisymmetric shell or solid elements, three-dimensional solid or "brick" elements, and crack-tip elements. A number of automatic mesh (element) generators are available with postprocessing capabilities (eg PATRAN). Although numerical methods are able to accommodate complex geometries, loadings, material properties and boundary conditions, the solutions generated are only approximations to the actual solution. It is important that the designer/analyst is aware of the limitations of the numerical techniques being applied and has a fundamental understanding of the mechanics of bonded joints (ie stresses and failure mechanisms). This section provides a brief description of a number of commercial FEA programs and graphics based pre- and post-processors. Extensive and comprehensive surveys of FEA packages, such as ABAQUS, LUSAS, MSC/NASTRAN, PAFEC, and NISA, and associated constitutive models are available in references [1, 16, 32]. FELOCO - AEA Technology FELOCO is a finite element computer code (FORTRAN) developed for the prediction of stresses and strains in adhesively bonded lap-shear joints [25]. The software, which operates on an IBM compatible PC microcomputer, or on a mini or mainframe computer, provides the designer with a powerful tool for analysing complex joints. In the hands of a designer, the software is relatively easy to use. FELOCO has been validated against both the FEA package ABAQUS and measurements using laser Moiré interferometry. A question and answer format is employed for joint data specification. The program can also read files produced by BISEPS-LOCO for more refined analysis.
NPL REPORT CMMT(A)62
15
The main features of FELOCO are listed below: a) Applied loads - tension, shear, bending moments and pressure. b) Accommodates non-linear material behaviour in both the adhesive layer and
adherends. c) Accounts for the full effect of thermal expansion in both the adhesive layer and
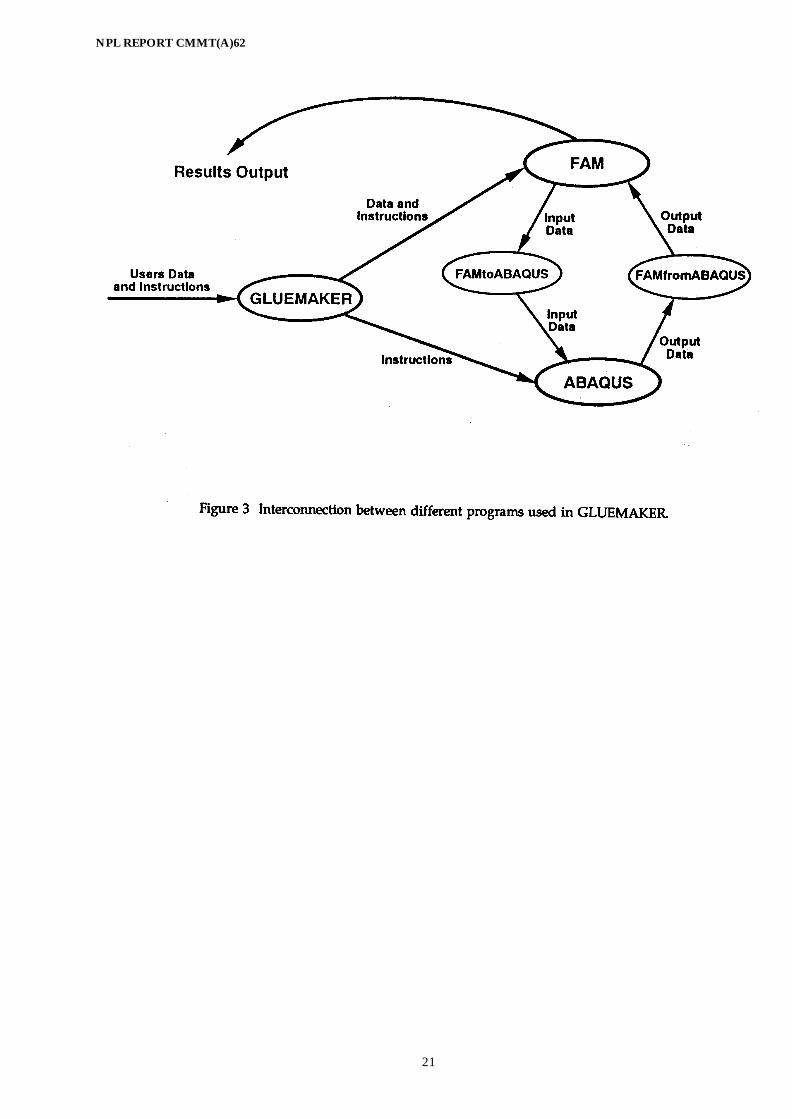
adherends. d) Stepped and profiled joints. e) Spot welds may be applied in the joints. f) Shear, peel and longitudinal stresses and strains calculated g) Prescribed displacement can be applied. GLUELEM - AEA Technology GLUELEM is a computer code for calculating the stiffness matrix of an adhesive bond to be easily included in large structures for the prediction of the overall structural stiffness. The code allows both isotropic and orthotropic adherends to be used, and only requires input data on the bond length and width of the joint, and the thickness and material properties of the adhesive layer and adherends. The code operates on mini and mainframe computers. The generated stiffness matrices have been validated against ABAQUS. GLUEMAKER - The Welding Institute The interactive capability of numerical codes is often poor to fair. GLUEMAKER (a non-commercial product) provides a user friendly graphical interface with database for FAM and ABAQUS, which facilitates the FE analysis and design of adhesive joints [34]. The Window based software was developed to make meshing of adhesive joint elements easier, particularly for the inexperienced user. FAM is a graphics based, general pre- and post-processing system for generating FE models and viewing FEA results, and ABAQUS is a general purpose FEA program. Both FAM and ABAQUS are commercial software packages and can be run on most workstations [34]. Operation is achieved through a series of 'dialogue boxes', which appear on the screen, prompting the user to answer questions on dimensions, materials and loading of the joint to be analysed. Figure 3 illustrates the inter-relationship between the various software packages and GLUEMAKER. The main features of GLUEMAKER include: a) A range of lap joint (ie single, double, tapered and stepped) and scarf joint
configurations. b) Two dimensional and three dimensional FE modelling of flat plates and tubular
structures. c) Linear and non-linear stress/strain behaviour in both the adhesive layer and
adherends. d) Thermal expansion coefficients for thermal stress analyses, material property data at
a single temperature or for a range of temperatures. e) Shear, bending and peel end loads, compression load across joint overlap; and
uniform temperature gradients. f) Fixed (lateral displacements restrained) and pinned (lateral and rotational
displacements restrained) end(s) boundary conditions. g) Linear elastic and non-linear elastic-plastic stress analysis, includes non-linear
geometry (large displacement effects). h) Stress and strain components, displacement components, .principal stresses, von
NPL REPORT CMMT(A)62
16
Mises stress, maximum principal and shear strains The software allows the designer/analyst to input materials data for both the adhesive and adherends or to select their properties from a Materials Database. The user input can be from a file or typed in directly. This data can be saved on file for future use. A number of presentation formats are available, including contour and vector plots, graphs of a result variable as a function of position along the bondline and cross-plot of variables. 7. CONCLUSIONS 7.1 PREDICTIVE MODELS Many of the life prediction methodologies considered in this report are generic and not specifically developed for adhesively bonded structures, although the long-term properties could be modelled using a number of these approaches. Due to the limited number of publications in the general literature, it was not possible to compare the different approaches in terms of advantages and disadvantages. Evidence was available to suggest that efforts, although limited, were being made to incorporate life prediction methodologies into design procedures. Chamis and Murthy [10] describe a step-by-step procedure for the preliminary design of composite adhesive joints (including single, double and step lap joints, and scarf joints) for use in hot/wet service environments under static and cyclic loads. The equations for calculating adhesive property degradation (see Section 3.2) were used in conjunction with simple failure criteria and safety margins to demonstrate the approach that could be used to determine residual strength and life expectancy of bonded joints. This simplistic approach needs reliable stress analysis (eg FEA) support to ensure structural integrity. It is worth noting that the majority of the temperature-moisture and temperature-moisture-stress superposition relationships adopted have the form of an Arrehenius law. This is often by chance rather than by design. As with most of the predictive models considered, this approach is empirical (ie curve fitting to experimental data). Relating actual damage mechanisms, such as reduction in cross-linkage density of a polymer to strength reduction through hydrolysis is still in its infancy. In contrast, statistical life prediction models are well developed and are regularly used by engineers for lifing materials. Again, the analysis is empirical. In practice, there is often considerable scatter in failure data, which increases with exposure time. Hence, consideration needs to be given to data variability. The data need to be subjected to rigorous statistical analysis to ensure a meaningful result. 7.2 SOFTWARE Most of the non-FEA software packages offer similar features for a limited number of joint geometries. Often differences are limited to the number of joint geometries or to the loading/boundary conditions available. The more versatile packages (eg SAAS) provide a construction facility, which enables the user to produce non-standard variants of well known joint configurations. Ergonomic factors have forced most software suppliers to produce Window based software compatible with 386 or 486 processors. A number of the calculations involved could possibly be carried out using commercial available mathematical software packages (eg MATHCAD) or spread sheets (eg EXCEL).
NPL REPORT CMMT(A)62
17
Although, non-FEA software provides the user/designer with relatively cheap design tools, their versatility or capability of expansion to account for a wider range of joints or non-linear stress/strain behaviour is severely limited. The approach of using a pre-processor program, such as GLUEMAKER, to generate and analyse FE models of adhesive joints is probably the best way forward. GLUEMAKER has considerable industrial potential, combining the advantages of simplified joint construction with a versatile Material Database facility and the powerful FE solver capability of ABAQUS. The program could be expanded to include a far wider range of joint constructions. A major draw back for small to medium enterprises would be the relatively high software and hardware costs. The linkage between long-term predictive models and FEA software is inevitable, although currently there is limited evidence to suggest that software incorporating fatigue modules use lifing techniques as described in this report. ACKNOWLEDGEMENTS This work forms part of the programme on adhesives measurement technology funded by the Department of Trade and Industry as part of its support of the technological competitiveness of UK industry. The authors would like to express their gratitude to all members of the Industrial Advisory Group (IAG) and to members of UK industry outside the IAG, whose contributions and advice have made this review possible. Other DTI funded programmes on materials are also conducted by the Centre for Materials Measurement and Technology, NPL as prime contractor. For further details please contact Mrs G Tellet, NPL. REFERENCES 1. "Adhesives and Sealants", Engineered Materials Handbook, Volume 3, ASM
International, 1990. 2. Kinloch, A.J., "Predicting the Lifetime of Adhesive Joints in Hostile Environments",
MTS Adhesive Programme, Project 3: Environmental Durability of Adhesive Bonds, Report No 5, AEA Technology, Harwell, United Kingdom, January 1995.
3. Brown, R.P., Kockott, D., Trubiroha, P., Ketola, W. and Shorthouse, J., "A Review of
Accelerated Durability Tests", VAMAS Report No.18, Edited by Brown, R.P., Versailles Project on Advanced Materials and Standards, 1995.
4. Broughton, W.R. and Mera, R.D., "Review of Durability test methods and Standards
for Assessing Long Term Performance of Adhesive Joints", NPL Report CMMT(A)61, 1997.
5. Kinloch, A.J. and Osiyemi, S.O., "Predicting the Fatigue Life of Adhesively-Bonded
Joints", Journal of adhesion, 43, 1993, pp 79-90. 6. Fernando, M., Harjoprayitno, W.W. and Kinloch, A.J., "A Fracture Mechanics Study
of the Influence of Moisture on the fatigue Behaviour of Adhesively Bonded Aluminium-Alloy Joints", International Journal of Adhesion and Adhesives", 16(2), 1996, pp 113-119.
7. Schaff, J.R. and Davidson, B.D., "Life Prediction Methodology for Composite
Structures. Part I - Constant Amplitude and Two-Stress Level Fatigue", Journal of
NPL REPORT CMMT(A)62
18
Composite Materials, 13 (2), 1997, pp 128-157. 8. O'Connor, P.D., "Practical Reliability Engineering", 3rd Edition, John Wiley & Sons,
1991. 9. Nelson, W., "Accelerated Testing: Statistical Models, Test Plans, and Data Analyses",
John Wiley & Sons, 1990. 10. Chamis, C.C. and Murthy, P.L.N., "Simplified Procedures for Designing Bonded
Composite Joints", Journal of Reinforced Plastics and Composites, Volume 10, 1991, pp 29-41.
11. Collings, T.A., Harvey, R.J. and Dalziel, A.W., "The Use of Elevated Temperature in
the Structural Testing of FRP Components for Simulating the Effects of Hot and Wet Environmental Exposure", Composites, 24(8), 1993, pp 625-634.
12. "Failure of Plastics", edited by Brostow, W. and Corneliussen, R.D., Hanser
Publishers, 1986. 13. Kinloch, A.J., "Adhesion and Adhesives - Science and Technology", Chapman and
Hall, 1987. 14. "Joining Fibre-reinforced Plastics", Edited by Matthews, F.L., Elsevier Applied
Science, 1987. 15. McCrum, N.G., Buckley, C.P. and Bucknall, C.B., "Principles of Polymer
engineering", Oxford science Publications, 1994. 16. Charalambides, M.N., "A Survey of Constitutive Models in Finite Element Analysis
Software Packages Suitable for Adhesives, to be produced as a NPL Report, 1997. 17. Buchman, A., Holdengraber, Y., Dodiuk, H. and Kenig, S., "Durability of
Polyurethanes Elastomers", Polymer for Advanced Technologies, 2(3), 1991, pp 137-147.
18. Ha, S.K. and Springer, G.S., "Nonlinear Mechanical Properties of a Thermoset Matrix
Composite at Elevated Temperatures", Journal of Composite Materials, 23, 1989, pp 1130-1158.
19. Ghorbel, I. and Spiteri, P., "Durability of Closed-End Pressurized GRP Pipes under
Hygrothermal Conditions. Part I: Monotonic Tests", Journal of Composite Materials", 30(14), 1996, pp 1562-1580.
20. River, B.H., "Accelerated, Real-Time Aging for 4 construction Adhesives", Adhesives
Age, 27(2), 1984, pp 16-21. 21. Levi, D.W., Wegman, R.F., Ross, M.C. and Garnis, E.A., Use of Hot water Aging for
Estimating Lifetimes of adhesive Bonds to Aluminium", SAMPE Quarterly, 7(3), 1976, pp 1-4.
22. "Adhesives and the Engineer", Edited by Lees, W.A., Mechanical Engineering
Publications Limited, London, United Kingdom, 1989. 23. Lees, W.A., "Bonded Assembly - Pros, Cons and Ground Rules", Materials and
NPL REPORT CMMT(A)62
19
Design, 11(5), 1990, pp 227-233. 24. Lees, W.A., "Adhesive Selection by the PAL Expert System", Journal of Adhesion, 55,
1995, pp 59-76. 25. J McCarthy, "Personal Communication, AEA Technology Plc, Harwell, United
kingdom. 26. Oakeshott, J.L., Soininen, R. and Matthews, F.L., "Review of Composites - Related
Software. Final report. Part I: Non-FE Software", Technical Report TR96/01, Centre for Composite Materials, Imperial College, London, March 1996.
27. "SAAS (A Stress Analysis for Adhesive Structures)", User Manual, University of
Surrey, United Kingdom, 1995. 28. Stellbrink, K., "Preliminary Design of Composite Joints", DLR Institut für
Bausweisen-und Konstruktionforschung, Stuggart, Germany, 1992. 29. Mallick, V. and Stone, M.H., "JOINT - A New Stress Analysis Method for Adhesive
Joints", EURADH '94 Conference Proceedings, September 1994, pp 528-531. 30. Allman, D.J., "A Theory for Elastic Stresses in Adhesive Bonded Lap Jjoints",
Quarterly journal of Mechanics and Applied Mathematics, XXX (4) 1977, pp 415-436. 31. Oakeshott, J.L., Soininen, R. and Matthews, F.L., "Review of Composites - Related
Software. Final report. Part II: FE Software", Technical Report TR96/01, Centre for Composite Materials, Imperial College, London, March 1996.
32. Dyer, A.P., GLUEMAKER - A Program for Simplified Finite Element Analysis of
Adhesive Joints", TWI Report 8180/15/95, The Welding Institute, United Kingdom, September 1995.
NPL REPORT CMMT(A)62
20
NPL REPORT CMMT(A)62
21
NPL REPORT CMMT(A)62
22
APPENDIX I - WEIBULL DISTRIBUTION
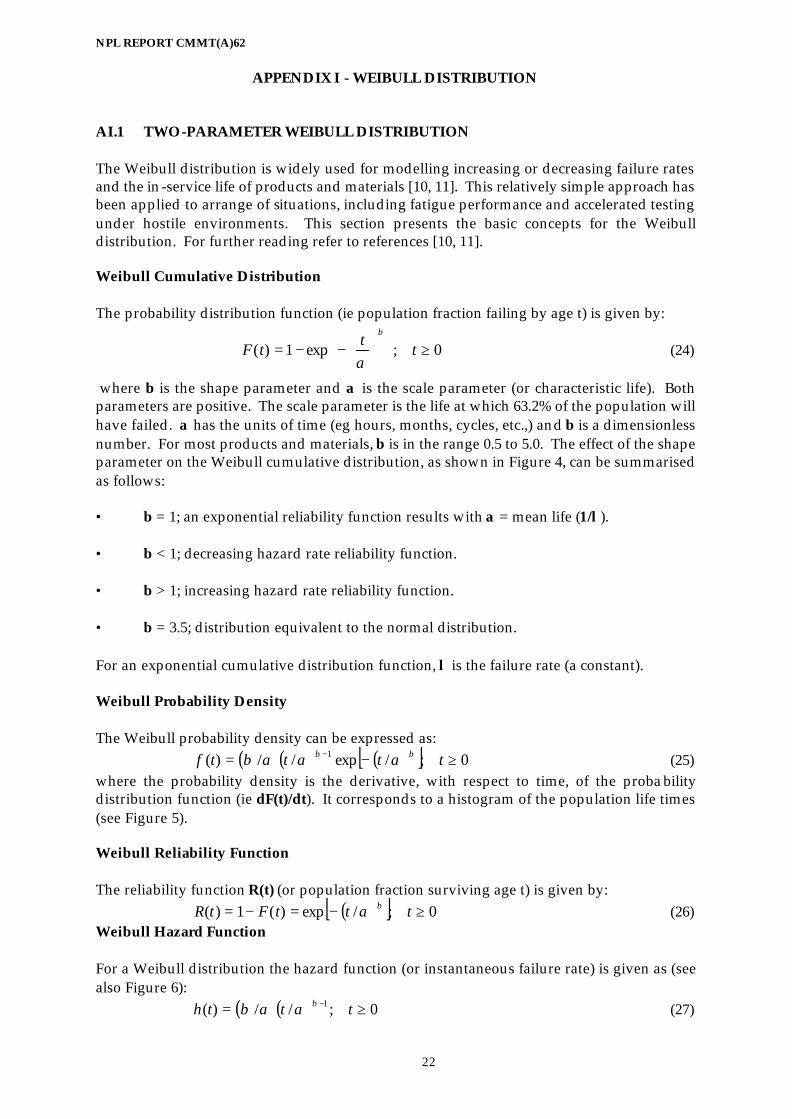
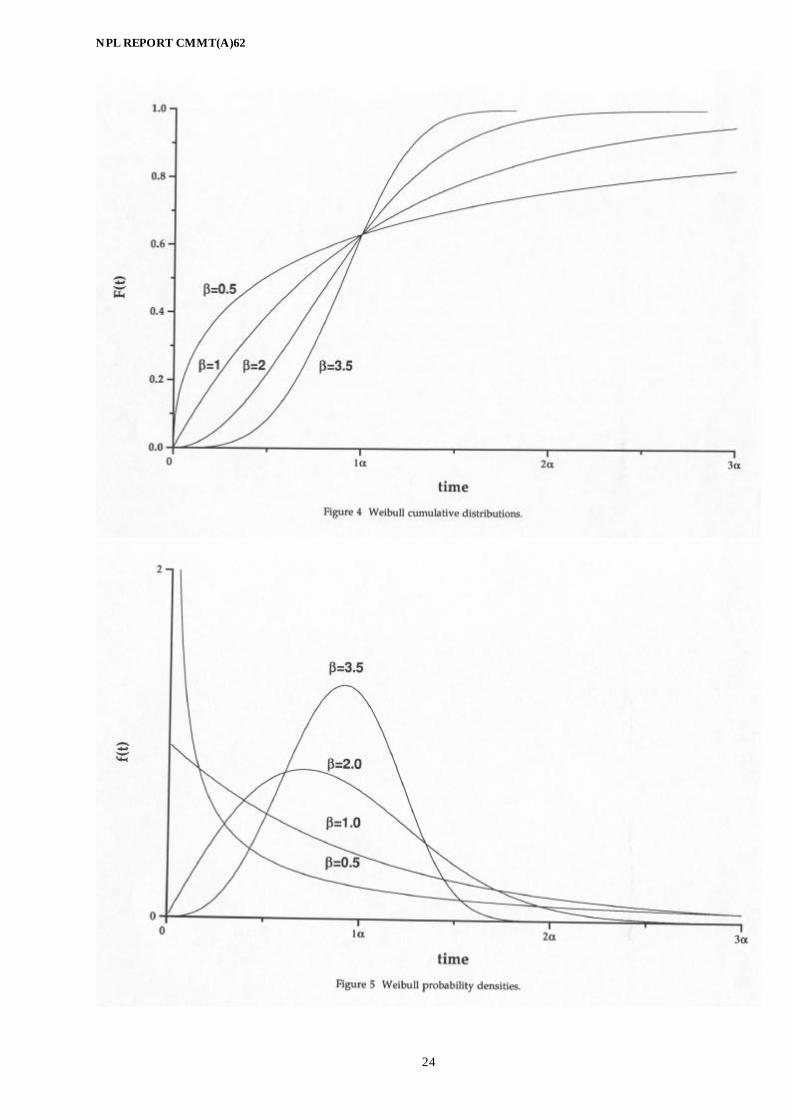
AI.1 TWO-PARAMETER WEIBULL DISTRIBUTION The Weibull distribution is widely used for modelling increasing or decreasing failure rates and the in-service life of products and materials [10, 11]. This relatively simple approach has been applied to arrange of situations, including fatigue performance and accelerated testing under hostile environments. This section presents the basic concepts for the Weibull distribution. For further reading refer to references [10, 11]. Weibull Cumulative Distribution The probability distribution function (ie population fraction failing by age t) is given by:
0;exp1)( ≥
−−= t
ttF
β
α (24)
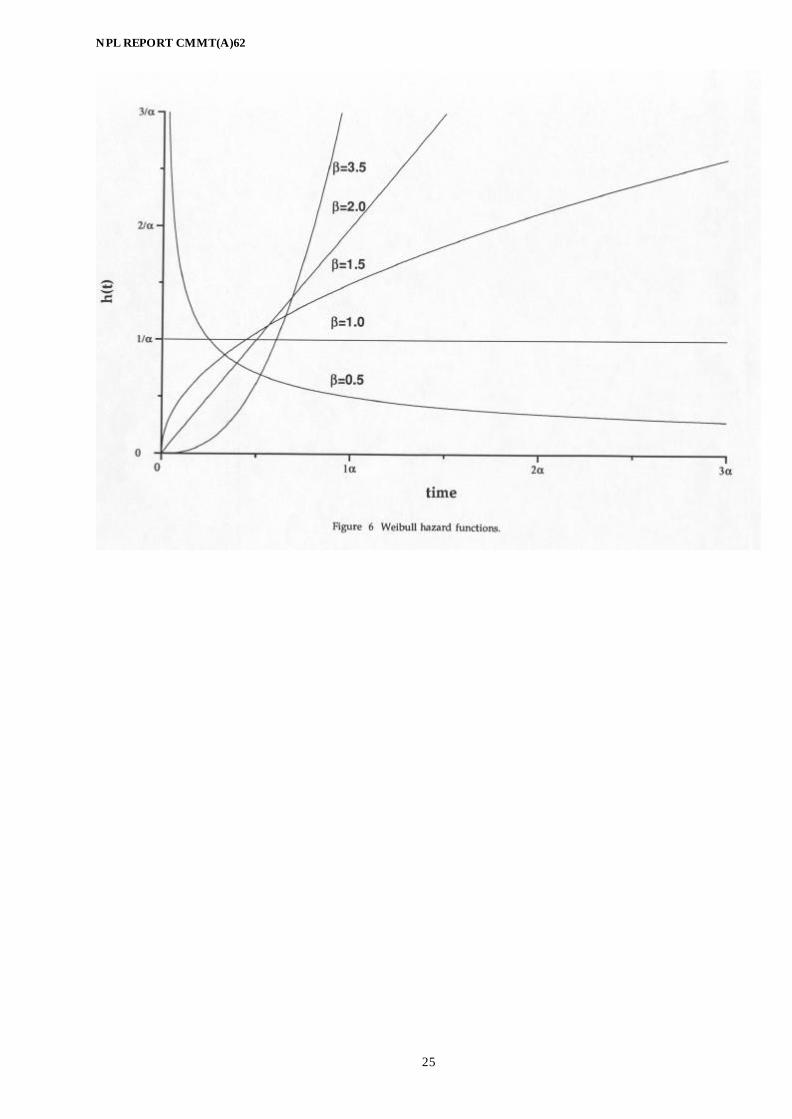
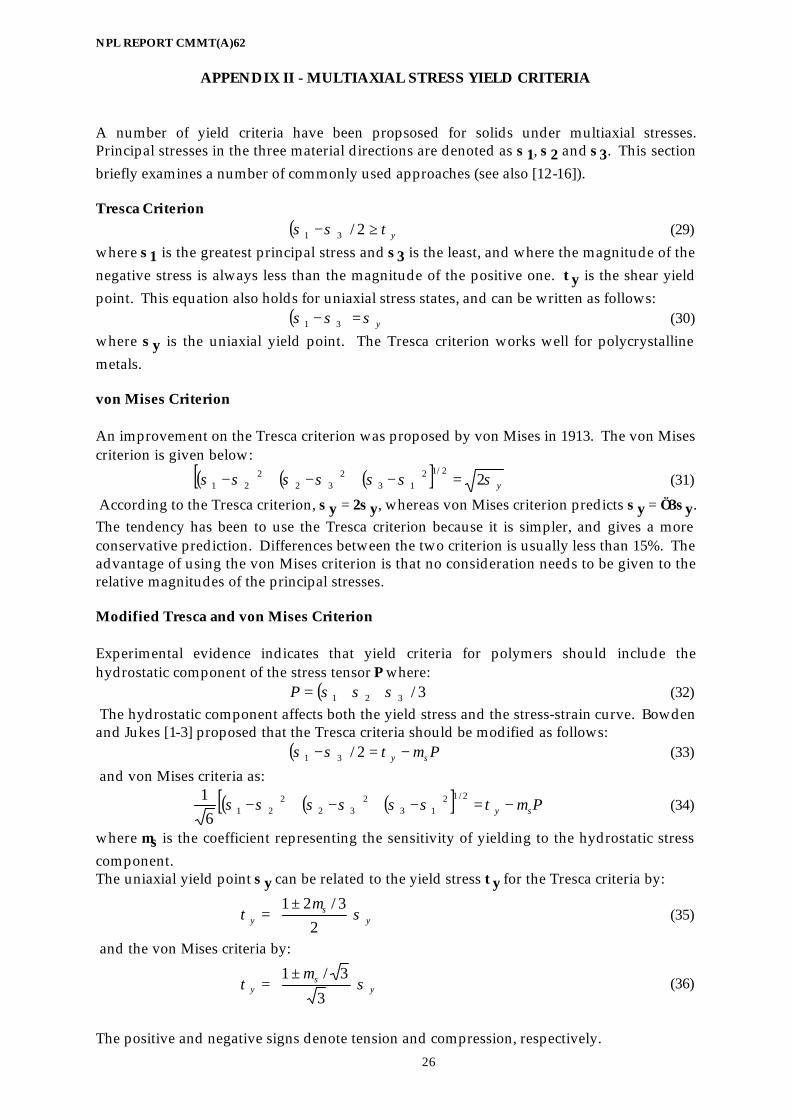
where β is the shape parameter and α is the scale parameter (or characteristic life). Both parameters are positive. The scale parameter is the life at which 63.2% of the population will have failed. α has the units of time (eg hours, months, cycles, etc.,) and β is a dimensionless number. For most products and materials, β is in the range 0.5 to 5.0. The effect of the shape parameter on the Weibull cumulative distribution, as shown in Figure 4, can be summarised as follows: • β = 1; an exponential reliability function results with α = mean life (1/λ). • β < 1; decreasing hazard rate reliability function. • β > 1; increasing hazard rate reliability function. • β = 3.5; distribution equivalent to the normal distribution. For an exponential cumulative distribution function, λ is the failure rate (a constant). Weibull Probability Density The Weibull probability density can be expressed as: ( )( ) ( )[ ] 0;/exp//)( 1 ≥−= − ttttf ββ αααβ (25) where the probability density is the derivative, with respect to time, of the probability distribution function (ie dF(t)/dt). It corresponds to a histogram of the population life times (see Figure 5). Weibull Reliability Function The reliability function R(t) (or population fraction surviving age t) is given by: ( )[ ] 0;/exp)(1)( ≥−=−= tttFtR βα (26) Weibull Hazard Function For a Weibull distribution the hazard function (or instantaneous failure rate) is given as (see also Figure 6): ( )( ) 0;//)( 1 ≥= − ttth βααβ (27)
NPL REPORT CMMT(A)62
23
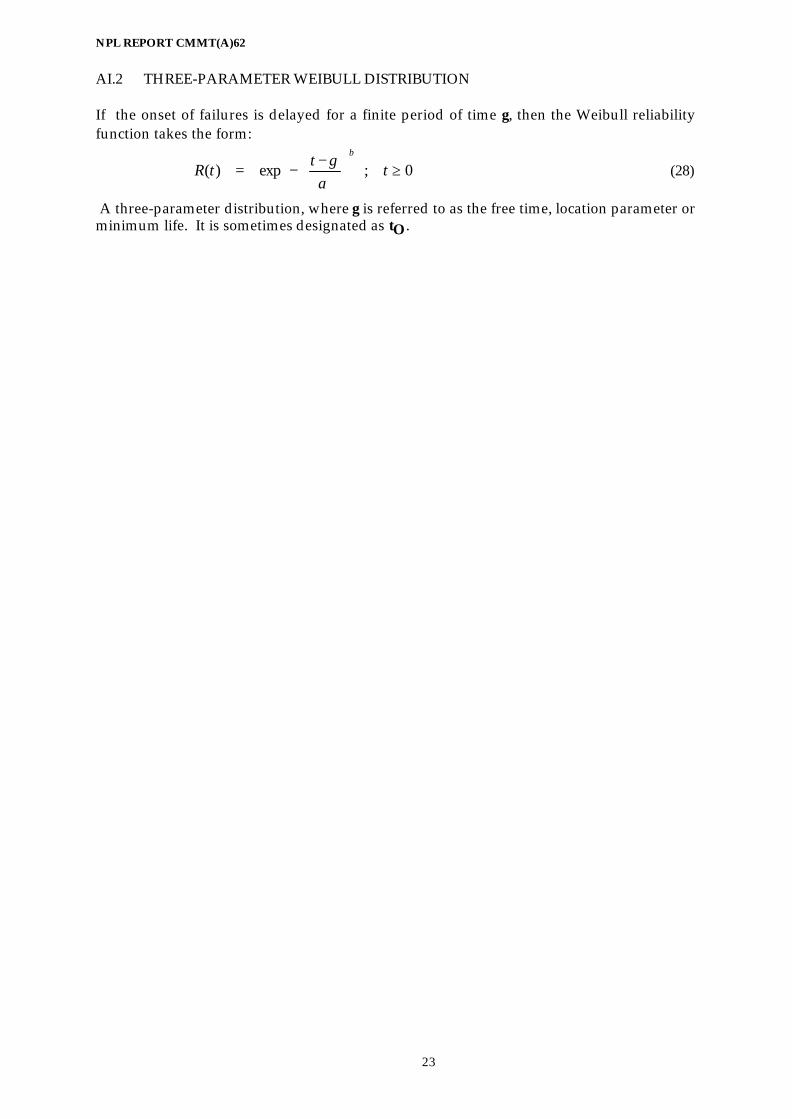
AI.2 THREE-PARAMETER WEIBULL DISTRIBUTION If the onset of failures is delayed for a finite period of time γ, then the Weibull reliability function takes the form:
0;exp)( ≥
−
−= tt
tRβ
αγ
(28)
A three-parameter distribution, where γ is referred to as the free time, location parameter or minimum life. It is sometimes designated as tO.
NPL REPORT CMMT(A)62
24
NPL REPORT CMMT(A)62
25
NPL REPORT CMMT(A)62
26
APPENDIX II - MULTIAXIAL STRESS YIELD CRITERIA
A number of yield criteria have been propsosed for solids under multiaxial stresses. Principal stresses in the three material directions are denoted as σ1, σ2 and σ3. This section briefly examines a number of commonly used approaches (see also [12-16]). Tresca Criterion ( ) yτσσ ≥− 2/31 (29) where σ1 is the greatest principal stress and σ3 is the least, and where the magnitude of the negative stress is always less than the magnitude of the positive one. τy is the shear yield point. This equation also holds for uniaxial stress states, and can be written as follows: ( ) yσσσ =− 31 (30) where σy is the uniaxial yield point. The Tresca criterion works well for polycrystalline metals. von Mises Criterion An improvement on the Tresca criterion was proposed by von Mises in 1913. The von Mises criterion is given below:
( ) ( ) ( )[ ] yσσσσσσσ 22/12
132
322
21 =−+−+− (31)
According to the Tresca criterion, σy = 2σy, whereas von Mises criterion predicts σy = √3σy. The tendency has been to use the Tresca criterion because it is simpler, and gives a more conservative prediction. Differences between the two criterion is usually less than 15%. The advantage of using the von Mises criterion is that no consideration needs to be given to the relative magnitudes of the principal stresses. Modified Tresca and von Mises Criterion Experimental evidence indicates that yield criteria for polymers should include the hydrostatic component of the stress tensor P where: ( ) 3/321 σσσ ++=P (32) The hydrostatic component affects both the yield stress and the stress-strain curve. Bowden and Jukes [1-3] proposed that the Tresca criteria should be modified as follows: ( ) Psy µτσσ −=− 2/31 (33) and von Mises criteria as:
( ) ( ) ( )[ ] Psy µτσσσσσσ −=−+−+−2/12
132
322
216
1 (34)
where µs is the coefficient representing the sensitivity of yielding to the hydrostatic stress component. The uniaxial yield point σy can be related to the yield stress τy for the Tresca criteria by:
ys
y σµ
τ
±
=2
3/21 (35)
and the von Mises criteria by:
ys
y σµ
τ
±=
3
3/1 (36)
The positive and negative signs denote tension and compression, respectively.
NPL REPORT CMMT(A)62
27
Paraboloidal Yield Criterion It has been shown that the a paraboloidal yield criterion of the form [14]: ( ) ( ) ( )[ ] ( )( ) TCTC σσσσσσσσσσσσσ 22 321
213
232
221 =++−=−+−+− (37)
applies to a number of amorphous polymers over a wide range of stress states. The paraboloidal yield criterion reduces to the von Mises criterion when σC = σT.