Embed Size (px)
Citation preview
Distr.GENERAL
UNCTAD/ECDC/SEU/927 January 1995
ENGLISH ONLY
REVIEW OF LABOUR AND EMPLOYMENT TRENDSIN THE WEST BANK AND GAZA STRIP
Study prepared by Dr. Abdelfattah Abu-Shokor, UNCTAD consultant*
* This study is based on the contribution of Dr. Abdelfattah Abu-Shokor(An-Najah National University, Nablus) to the intersectoral project of theUNCTAD secretariat on "Prospects for sustained development of the Palestinianeconomy in the West Bank and Gaza Strip". The opinions expressed in thisstudy are those of the author and do not necessarily reflect those of thesecretariat of the United Nations. The designations employed and thepresentation of the material in this document do not imply the expression ofany opinion whatsoever on the part of the secretariat of the United Nationsconcerning the legal status of any country, territory, city or area, or of itsauthorities, or concerning the delimitation of its frontiers or boundaries.
GE.95-50289 (E)
- 2 -
CONTENTS
Page
List of statistical tables . . . . . . . . . . . . . . . . . . . . . . . 4List of abbreviations . . . . . . . . . . . . . . . . . . . . . . . . . . 6Preface . . . . . . . . . . . . . . . . . . . . . . . . . . . . . . . . . 7Introduction . . . . . . . . . . . . . . . . . . . . . . . . . . . . . . 8
Chapter I. Characteristics of the labour forcein the West Bank and Gaza Strip . . . . . . . . . . . . . 9
A. Main factors affecting the Palestinian labour forc e . . . . . . . . 9
1. Population growt h . . . . . . . . . . . . . . . . . . . . . . . 92. Size of the labour force, its annual rates of
increase and participation . . . . . . . . . . . . . . . . . . 103. Emigration and its effect on the labour forc e . . . . . . . . . 11
B. The structure of the labour force . . . . . . . . . . . . . . . . 12
1. Labour force structure by gender and age . . . . . . . . . . . 122. The geographic distribution of the labour forc e . . . . . . . . 133. Social status of the labour forc e . . . . . . . . . . . . . . . 134. Educational level of the labour forc e . . . . . . . . . . . . . 14
Chapter II. Employment in the West Bank and Gaza Strip . . . . . . . . 16
A. Characteristics of employmen t . . . . . . . . . . . . . . . . . . . 16
1. Sectoral structure . . . . . . . . . . . . . . . . . . . . . . 162. Occupational structure . . . . . . . . . . . . . . . . . . . . 173. Work conditions in the territory . . . . . . . . . . . . . . . 18
(a) Employment status . . . . . . . . . . . . . . . . . . . . 18(b) Wages in the territor y . . . . . . . . . . . . . . . . . . 19(c) Number of working days and hour s . . . . . . . . . . . . . 20(d) Employment benefits in the territor y . . . . . . . . . . . 21(e) Trade union organizatio n . . . . . . . . . . . . . . . . . 21
B. Palestinian labourers in Israe l . . . . . . . . . . . . . . . . . . 22
1. Number of Palestinian labourers in Israe l . . . . . . . . . . . 222. Sectoral distribution of Palestinians
working in Israe l . . . . . . . . . . . . . . . . . . . . . . . 223. Occupational structure of Palestinians
working in Israe l . . . . . . . . . . . . . . . . . . . . . . . 23
- 3 -
CONTENTS(continued )
Page
4. Work conditions of Palestinian labourers in Israel . . . . . . 23
(a) Employment status . . . . . . . . . . . . . . . . . . . . 23(b) Wages and labour inpu t . . . . . . . . . . . . . . . . . . 24(c) Health and safety . . . . . . . . . . . . . . . . . . . . 24(d) Labour union organization . . . . . . . . . . . . . . . . 25(e) Some social characteristics of Palestinian
labourers in Israel . . . . . . . . . . . . . . . . . . . 25
Chapter III. Unemployment in the West Bank and Gaza Strip . . . . . . . 26
A. Unemployment before and during the intifada . . . . . . . . . . . . 26B. The impact of new emigration to Israel and the Gulf crisis on
Palestinian unemployment . . . . . . . . . . . . . . . . . . . . . 28C. Developments since 1991 affecting Palestinian unemployment . . . . 30
Chapter IV. Human resource development and employment prospectsin the Palestinian territory . . . . . . . . . . . . . . . 32
A. Higher education and vocational training syste m . . . . . . . . . . 32
1. Higher education syste m . . . . . . . . . . . . . . . . . . . . 322. Vocational trainin g . . . . . . . . . . . . . . . . . . . . . . 333. On-the-job trainin g . . . . . . . . . . . . . . . . . . . . . . 344. The labour market and the educational and
training syste m . . . . . . . . . . . . . . . . . . . . . . . . 34
B. Human resource development: problems and objectives . . . . . . . 35C. Entrepreneurship and development needs . . . . . . . . . . . . . . 37D. Areas for action . . . . . . . . . . . . . . . . . . . . . . . . . 39
Notes . . . . . . . . . . . . . . . . . . . . . . . . . . . . . . . . . . 40Tables . . . . . . . . . . . . . . . . . . . . . . . . . . . . . . . . . 47References . . . . . . . . . . . . . . . . . . . . . . . . . . . . . . . 66

- 4 -
List of tables
Table 1. West Bank and Gaza Strip: population estimates in selectedyears, 1967-1989.
Table 2. West Bank and Gaza Strip: population by age groups, 1988.
Table 3. West Bank: population aged 14 and over by labour forcecharacteristics in selected years, 1968-1989.
Table 4. Gaza Strip: population aged 14 and over by labour forcecharacteristics in selected years, 1968-1989.
Table 5. West Bank and Gaza Strip: distribution of male labour force byage groups, 1970, 1988 and 1989.
Table 6. West Bank and Gaza Strip: distribution of the labour force byplace of residence, 1987.
Table 7. West Bank and Gaza Strip: distribution of the labour force bytype of settlement, 1985.
Table 8. West Bank and Gaza Strip: marital status of the labour force,1985.
Table 9. West Bank and Gaza Strip: distribution of the labour force byeducational level, 1985.
Table 10-a. West Bank: employed persons by sector and sex in selectedyears, 1970-1989.
Table 10-b. Gaza Strip: employed persons by sector and sex in selectedyears, 1970-1989.
Table 11. West Bank: employed labour force by occupation and sex, 1972,1980 and 1989.
Table 12. Gaza Strip: employed labour force by occupation and sex, 1972,1980 and 1989.
Table 13. West Bank and Gaza Strip: employment status of the Palestinianlabour force in selected years, 1970-1989.
Table 14. West Bank and Gaza Strip: employment status of labour force byemployers, 1985.
Table 15. West Bank and Gaza Strip: average daily wage per employee bysector in selected years, 1970-1989.
Table 16. West Bank and Gaza Strip: average wage per employee, 1985.
Table 17. West Bank and Gaza Strip: average monthly work days peremployee in selected sectors and years, 1981-1989.

- 5 -
List of tables (continued )
Table 18. Palestinian labourers working in Israel, selected years,1970-1989.
Table 19. Employed Palestinian labour force in Israel by sector, selectedyears, 1970-1989.
Table 20. Average daily wage of Palestinian employees in Israel by sector,selected years, 1970-1989.
Table 21. Average monthly work days of Palestinian employees in Israel bysector, selected years, 1985-1989.
Table 22. West Bank and Gaza Strip: unemployment in selected years,1968-1989.
Table 23. West Bank and Gaza Strip: enrolment in universities by majorfields of study, academic years, 1987/1988 and 1988/1989.
Table 24. West Bank and Gaza Strip: distribution of graduates by fieldsof specialization, during 1975-1989.
Table 25. West Bank and Gaza Strip: distribution of students inintermediate colleges according to occupation, 1989.
- 6 -
List of abbreviations
CBS Israel Central Bureau of Statistics
GS Gaza Strip
JD Jordanian dinar
OPT Occupied Palestinian territory (the terms: "occupied territory" or"territory" used in this study refer to occupied Palestinianterritory)
UNCTAD United Nations Conference on Trade and Development
UNRWA United Nations Relief and Works Agency for Palestine Refugees inthe Near East
WB West Bank
$ United States dollar
.. Data not available
- Equals zero or negligible

- 7 -
Preface
(i) As part of its work programme pursuant to resolution 239 (XXIII) of theTrade and Development Board and resolution 44/174 of the General Assembly, theUNCTAD secretariat initiated, in 1990/91, the preparation of an in-depthintersectoral project on the economy of the West Bank and Gaza Strip. Partone of the project deals with a comprehensive assessment of the economic andsocial situation in the West Bank and Gaza Strip, the main impediments tosustained growth and development, pressing needs, and corresponding measuresfor immediate action to promote recovery. Part two of the project constitutesan in-depth analysis of prospects under different scenarios for the futuredevelopment of the Palestinian economy. Part three of the project is intendedto provide both a strategy framework and policy guidelines for the revival andsustained future development of the Palestinian economy in the West Bank andGaza Strip.
(ii) For the implementation of the project, a total of 25 in-depth studieswere initiated at the field level covering economic and social sectors andissues. Concurrently, and in order to facilitate the technical aspects ofwork on parts two and three, the UNCTAD secretariat has also prepared anin-depth study of a quantitative framework examining future options andprospects under several scenarios. The summary findings of the first part ofthe field studies, in particular an identification of pressing needs andcorresponding feasible measures for immediate action, were presented forfurther consideration by an expert group meeting (held in May 1992). Thereport of that meeting was published separately (UNCTAD/DSD/SEU/2). Thesecretariat’s study of a quantitative framework for analysing future prospectswill be published as UNCTAD/ECDC/SEU/6.
(iii) In order to provide more detailed substantive background to thefindings and recommendations of the expert group meeting, and to enable donorsto further develop their programmes of assistance to the Palestinian people,the first parts of a selected number of field studies commissioned within thescope of this project are being published in a special study series onPalestinian economic and social development. The second and third parts ofthe field studies will be subsequently consolidated by the UNCTAD secretariat.The present document constitutes part one of the study prepared by aconsultant, Dr. Abdelfattah Abu-Shokor, An-Najah National University, Nablus,West Bank, on labour, employment and human resource development in the WestBank and Gaza Strip.
(iv) It should be noted that, in view of the early completion of thein-depth sectoral studies undertaken within the context of the intersectoralresearch project, the implications of the accords concluded between Israel andPalestine in 1993 and 1994 could not be reflected in this study.
- 8 -
Introduction
War, civil strife and political conflict not only impede economicdevelopment, but can also bring about drastic changes in the demographicsituation, including the size of labour force and conditions of the labourmarket. The occupied Palestinian territory is a case in point. For decades,the West Bank and Gaza Strip have been subjected to difficult circumstances.Both the 1948 and 1967 wars led to demographic changes that in turn changedsupply and demand conditions in the labour market of the territory. Duringthe period 1948-1967, the territory experienced a drain on its skilled labourforce as qualified people emigrated to Jordan and the Arab oil-producingStates in the Gulf. After the Israeli occupation of the West Bank andGaza Strip in 1967, residents still sought employment elsewhere, largely inthe Gulf and later in Israel. The deterioration in the economic conditions ofthe territory owing to the unstable political situation, the absence of aPalestinian planning authority and the restrictions imposed under occupationconstrained the ability of the Palestinian economy to absorb its growinglabour force, resulting in widespread unemployment. This process alsoresulted in a growing dependence of Palestinian labour on employment in Israeland steady emigration to Jordan and the Arab oil-producing countries in theregion.
This study explores developments in the supply and demand conditions ofthe labour market in light of changing circumstances. Data from publishedsources as well as findings of field research are made use of in this study.Chapter I details the characteristics of the labour force in the occupiedPalestinian territory, tracing developments in its size, age structure,participation and emigration as well as highlighting the nature of itsstructure. Chapter II focuses on employment of the Palestinian labour forcein the territory and in Israel, reviewing the sectoral, occupational,educational and social structure in each market. Chapter III profilesunemployment in the territory and evaluates the impact of the intifada andJewish emigration to Israel on the Palestinian labour market. Chapter IVexamines human resource development, including the system of higher education,vocational and on-the-job training as well as the relation between theeducation system and the needs of the labour market. Chapter V presentsconclusions and measures for action to be addressed by the responsibleauthorities in the future.
- 9 -
Chapter I
CHARACTERISTICS OF THE LABOUR FORCE IN THE WEST BANK AND GAZA STRIP
A. Main factors affecting the Palestinian labour force
The size of the labour force in an economy is directly correlated to thatof its population, which constitutes the main source of labour supply.Furthermore, the age structure of the population is an important indicator ofgrowth in the labour force. From relevant projections, an assessment oftrends can be made and plans for the future drawn to accommodate the growinglabour force.
Therefore, before examining the development of the labour force in theterritory, it is useful to first highlight the factors that affect thedemographic situation and define the correlation between the size of thepopulation and that of the labour force.
1. Population growth
The size of the population is influenced by its natural rate of increaseand the net migration movement. The rate of annual growth in overallpopulation is a combination of these two factors.
In the occupied territory, war and the political and economic instabilitythat ensued have led to the resettlement of a large number of people and theemigration of many in pursuit of jobs abroad. Data in table 1 indicate thatthe population of the West Bank and Gaza Strip increased between 1967 and 1989from 0.97 million to 1.5 million, or by 58 per cent. Data exclude thepopulation of east Jerusalem which was estimated at 136,500 in 1987. 1 /Using the annual rate of growth for the West Bank (3.1 per cent for 1988 and2.3 per cent for 1989), the population of east Jerusalem is estimated at144,000 for 1989 and total population of the territory at 1.7 million duringthe same year.
The data in table 1 are based on estimates and not on a census. A censuswas carried out once in the occupied Palestinian territory in 1967; and theestimates published by the Israel Central Bureau of Statistics (CBS) and mostother sources are based on this census. Some unofficial Palestinian andIsraeli estimates of population are based on sample surveys and indicate apopulation greater than that estimated by CBS. 2 /
As in many developing countries, the natural rate of growth of thePalestinian population is high. During 1968-1989, this rate increased from2.2 to 4.1 per cent in Gaza Strip, and from 2.2 to 3.8 per cent in the WestBank. The rate of natural increase of population in developing countries wasestimated at 2.0 per cent in low-income countries and 2.1 per cent inmiddle-income countries during 1984-1990. 3 / Based on the high rate ofnatural increase, the population of the territory should have almost doubledby now. However, owing to emigration of large numbers of Palestinians in thewake of the Middle East war in June 1967, this increase has notmaterialized. 4 /
- 10 -
Age structure in the territory is similar to that in many developingcountries, where 40 to 50 per cent of the population is below the ageof 15. 5 / Data in table 2 confirm this, as the percentage of the populationaged 14 years and below was 47.4 per cent in the West Bank, and 49.5 per centin Gaza Strip in 1988.
The high percentage of population below the age of 14 in the West Bankand Gaza Strip implies the small size of the labour force as compared todeveloped countries. Coupled with a high percentage of those aged between 15and 44 years (40 per cent and 39.6 per cent in the West Bank and Gaza Strip,respectively), which indicates a high birth rate, the current age structure ofthe labour force calls for appropriate economic plans to absorb the largenumber of present and expected new entrants into the labour force.
2. Size of the labour force, its annual rates of increase andparticipation
The size of the labour force in the territory increased from 180,800 in1970 to 290,300 in 1989, or by 60.6 per cent (see tables 3 and 4). Thistranslates into an average annual increase of approximately 2.3 per cent forthe same period.
Data given in tables 3 and 4 indicate low participation rates in theWest Bank and Gaza Strip, among the lowest reported worldwide. 6 / The rate,which measures the proportion of the total population engaged in the labourforce, ranged from 15.9 per cent in 1968 to 20.7 per cent in 1989 for theWest Bank, and 15 per cent to 16.5 per cent for Gaza Strip during the sameperiod. This is due to migration, low female participation rate and the highpercentage of people studying at schools and/or universities. The low labourforce participation rate translates into a high dependence rate reaching4.8 and 6 persons per labour force member in 1989 for the West Bank andGaza Strip, respectively.
In 1975, the world dependency rate averaged 2.4; for developing countriesit stood at 2.5. 7 / The rate was even higher for some Arab countries suchas Egypt, Libyan Arab Jamahiriya, Sudan, and Lebanon, where it was 3.6, 3.7,4.0, and 3.6, respectively. 8 /
The crude activity rate in the West Bank, which measures the proportionof the working age population engaged in the labour force, grew from30 per cent in 1968 to over 40 per cent by 1989. In Gaza Strip, this rate waslower, ranging from 29.4 per cent in 1968 to 33.6 per cent in 1989. The crudeactivity rate in the occupied Palestinian territory as a whole (37.7 per centin 1989) is close to that found in Jordan where it stood at 33.9 per cent in1987. 9 / In Israel, this rate was put at 52 per cent in 1989. 10 / Theoverall low crude activity rate of the labour force in the territory reflectsthe high proportion of those aged under 14 years, the high percentage ofworking age population enrolled in schools and universities, the low femalecrude activity rate, emigration and the engagement of many female labourers inthe informal labour market. 11 /
- 11 -
The crude activity rate of females in the labour force of the territoryis low, ranging from 8.3 per cent to 17.8 per cent in the West Bank, and from2 per cent to 6.4 per cent in Gaza Strip, during 1968-1989. The crudeactivity rate of females in the territory is lower than the overall world rateof 29.1 per cent and even lower than the average rate of 26.4 per cent fordeveloping countries. 12 / This low rate is due to customs and traditionsthat confine women to the care of domestic affairs. Women who withdraw fromthe labour market, due to marriage or child care, seldom rejoin the workplace. In addition, the low educational level of females limits workopportunities.
Conversely, the crude activity rate of males in the territory isrelatively high. This rate rose from 56.5 per cent in 1968 to 73.6 per centin 1989 in the West Bank, and from 58.8 per cent to 66.8 per cent inGaza Strip during the same period. This rate is higher than the world averageof 53.8 per cent and even higher than the average rate of 52.5 per centprevailing in developing countries. It is similar to that of some Arabcountries, such as Egypt, the Syrian Arab Republic and Lebanon where therespective crude activity rate of males registered 51.3 per cent,45.2 per cent and 42.1 per cent. 13 /
3. Emigration and its effect on the labour force
Emigration is considered to be a major factor affecting the size of thelabour force in the territory. The phenomenon began in the late 1940s andcontinued until the war in June 1967. A total of around 400,000 personsemigrated from the West Bank to the East Bank of Jordan and to the Arab Statesof the Gulf, particularly Kuwait. 14 / In the wake of the war in June 1967,about 200,000 persons emigrated from the West Bank. 15 / The wave ofemigration from the West Bank remained steady during the 1970s and until themid-1980s.
The net emigration from the West Bank during the period June 1967 to theend of 1988 may be calculated at 370,400 persons, equivalent to a41.4 per cent loss of inhabitants during that period. 16 / Emigrants fromeast Jerusalem are not included in the official Israeli statistics on netmigration movement in the West Bank. However, their official and legal statusunder Israeli rule and the greater ability of the east Jerusalem economy tosupport its population as compared to more disadvantaged areas of theterritory, probably mitigated in favour of somewhat lower emigration ratesthan the rest of the West Bank.
In Gaza Strip, net emigration between June and December 1967 wasestimated at 31,000 persons or 8 per cent of the inhabitants. Like theWest Bank, the wave of emigration did not cease and the number of netemigrants from June 1967 until the end of 1988 may be calculated at 129,600persons, 17 / or 22 per cent of the inhabitants.
Emigration from the territory accelerated after 1967, especially duringthe period 1975-1982 when the rate ranged from 23.9 persons per thousandpopulation in 1980 to 10.5 in 1982 in the West Bank; and from 11.2 personsper thousand in 1980 to 6.2 in 1982 in Gaza Strip. 18 / The average before1967 was 2.5 emigrants per thousand in the West Bank. 19 /
- 12 -
Lack of domestic employment opportunities was deemed the major reason foremigration. A field study carried out in 1985 revealed that 67 per cent ofthe emigrants from the West Bank were males, whereas in Gaza Strip the figurewas 80 per cent. 20 / The study concluded that most emigrants were young, inthe 21-35 age group. In the West Bank, of the total emigrants, 69 per centwas in the 21-35 age group which 23 per cent represented the 36-50 age group.In Gaza Strip, the percentage was 58 per cent for the 21-35 age group, and34 per cent for the 36-50 age group. 21 /
The lack of jobs in the territory and availability of employmentopportunities in the countries of the region constituted, at the time, themajor push and pull factors to emigration. The 1985 field study also revealedthat some 51 per cent of emigrant labourers surveyed in the territoryattributed their emigration to work opportunities in host countries and tolack of jobs in the occupied Palestinian territory. In addition, higher wagesin host countries constituted another pull factor for Palestinianlabourers. 22 /
From the above, it may be concluded that emigration of Palestinianlabourers from the occupied Palestinian territory constrained labour supply inthe territory, functioning as a vent that reduced unemployment, particularlystructural unemployment.
B. The structure of the labour force
1. Labour force structure by gender and age
Data in tables 3 and 4 indicate that males dominate the labour force ofthe territory, constituting 89.3 per cent of the labour force in 1989 in theWest Bank and 96.9 per cent in Gaza Strip. From 1968 to 1980, the percentageof males in the labour force dropped from 85.2 per cent to 81.3 per cent inthe West Bank but increased from 87.7 per cent to 93.2 per cent in Gaza Strip.This figure is attributable to high emigration of young men, especially fromthe West Bank, and does not reflect increasing female labour forceparticipation.
Official Israeli statistics refer only to the distribution of the malelabour force according to age; and no disaggregated data by age is availableon the female labour force in the territory. Table 5 shows that the malelabour force in the occupied territory is predominantly and increasinglyyoung, falling within the age group 15-34 years, constituting 71.8 per cent ofthe labour force in 1989 in the West Bank, and 72.3 per cent in Gaza Strip.It is expected that this age group’s contribution to the labour force willincrease as almost 50 per cent of the population of the West Bank andGaza Strip are below the age of 14. The age curve of the male labour force inthe occupied territory follows the natural pattern that begins by a gradualrise of the 18-24 age group and reaches its peak in the 25-34 age group, abovewhich it gradually declines.
Statistics on the age distribution of the female labour force in theterritory are lacking. However, in one broadly comparable society, that ofJordan, most females fall into a narrow age group. A study of labour force inJordan, conducted by the Statistics Department in 1987, revealed that thepercentage of female participants in the labour force was highest in the
- 13 -
20-24 age group, contributing some 20.4 per cent. This is approximately10 years lower than that for males. The age curve for females begins to fallthereafter. The percentage of female labourers within the 15-34 age groupconstitutes 80 per cent of total female labourers. 23 / This is owingmainly to social customs and traditions that prompt females to leaveemployment after marriage or childbirth, in order to devote themselves todomestic work and child-care. 24 / These, and other common factors, implybroadly similar trends among Palestinian women in the occupied territory,especially the West Bank.
2. The geographic distribution of the labour force
The geographical distribution of the Palestinian labour force may beexamined by administrative divisions of the West Bank and Gaza Strip and theplace of residence of the labourers. As available data follow officialadministrative divisions and so exclude east Jerusalem, estimates for thishave been made and added to the West Bank data.
Table 6 shows that the Hebron area accounts for the highest share of thelabour force at 19 per cent followed by the Ramallah area at 15 per cent. Ineast Jerusalem, Jenin, Nablus, Bethlehem, and Jericho each account for around13 per cent with Tulkarm, at 12 per cent, being the lowest contributor to thelabour force. In Gaza Strip, Gaza city accounts for 57 per cent, the KhanYunis area for 31 per cent, and the Rafah area for 12 per cent of the labourforce. These proportions broadly reflect the geographic distribution ofpopulation, albeit with minor deviations.
Table 7 presents a breakdown of the labour force according to urban,rural, and refugee camp areas. The data indicate that in 1985, 45 per cent ofthe Palestinian labour force in the West Bank resided in urban centres,38 per cent in rural areas, and 17 per cent in refugee camps. The labourforce distribution does not mirror population distribution, especially forrural areas. 25 / This indicates a trend of emigration of labour from ruralinto urban areas of the West Bank. Some 48 per cent of Gaza Strip labourforce resides in cities, 47 per cent in refugee camps, and only 5 per cent inrural areas. This disparity is owing to the existence of large refugee campsand only a few villages, as compared to a much larger rural population andlabour force in the West Bank. The long-term implications of such a largerural/refugee camp labour force call for careful consideration of futureinvestment and job-creation schemes in order to avoid uncontrolled andunsustainable rural-urban labour migration.
3. Social status of the labour force
Official Israeli statistics include information on the social status ofthe labour force in the territory. From these statistics, it may be concludedthat the percentage of those never married among the labour force is much lessthan those married. The unmarried represented 37 per cent of the labour forcein 1987 in the West Bank and 30 per cent in Gaza Strip. 26 / The highpercentage of married workers in the labour force was owing to the higherpercentage of males in the labour force, most of whom are married, as femalestend to leave employment upon marriage. 27 /

- 14 -
The 1985 field study referred to earlier, indicated a higher percentageof married workers in the surveyed labour force of the territory compared tothat published by the CBS. Based on this study, table 8 shows that the shareof unmarried workers in the surveyed labour force in the West Bank was8 per cent and in Gaza Strip only 4 per cent. The discrepancy with theofficial data appears to be owing to definitional and methodologicaldifferences between the two sources.
4. Educational level of the labour force
Education affects participation rates in the labour force in two ways.First, enrolment in the educational system lowers participation rates in thelabour force within the younger age groups, as students postpone joining thelabour force until they acquire an appropriate level of education orvocational/technical qualification. Secondly, education tends to increase theparticipation rates in the labour force of all age groups in general, andfemale groups in particular.
The educational level of the labour force is highly correlated with thelevel of labour productivity; an effective educational system is a necessaryrequirement for sustained economic and social development. In addition,educational levels affect directly the participation rates of males andfemales in the labour force, but particularly that of females as more educatedfemales often seek employment in the labour market. Usually, the kind of workavailable for uneducated members of the labour force is unacceptable to womenowing to traditions and customs (e.g. in construction or other sectors whichrely heavily on unskilled, daily workers).
The results of the 1985 study cited earlier do not differ from thesegeneral trends. Table 9, derived from that study, indicates a low percentageof illiteracy among labourers in the territory, notwithstanding a generallylow educational level. Illiterate labourers and those that can only read andwrite accounted for 23 per cent of the labour force in the West Bank and29 per cent in Gaza Strip. Skilled labourers with qualifications such as anintermediate diploma or a university degree account for 14 per cent in theWest Bank and in Gaza Strip. This low percentage is attributed to theemigration of skilled and professional workers from the West Bank andGaza Strip. On the other hand, demand in the Israeli labour market isconfined largely to unskilled labour from the occupied territory. 28 /
In addition, there are differences in the educational level of the labourforce among urban, rural, and refugee camp areas. Table 9 indicates that in1985 39 per cent of illiterate labourers of the West Bank come from ruralareas, 32 per cent from cities, and 28 per cent from refugee camps. As forlabourers who can read and write, 48 per cent reside in rural areas,35 per cent in cities, and 17 per cent in refugee camps. As for labourers whocompleted elementary, preparatory or secondary levels of education, themajority come from urban areas. These figures appear to confirm that theeducational level of the urban labour force in the West Bank is higher thanthat of rural and refugee labour force.

- 15 -
For Gaza Strip, available data in table 9 indicate that 60 per cent ofilliterate labourers of Gaza Strip come from the refugee camps, 34 per centfrom urban centres, and 5 per cent from rural areas. Concerning labourers whocompleted elementary, preparatory or secondary levels of education, more camefrom cities than refugee camps; the same is true of skilled labourers withuniversity degrees. This situation reflects the concentration of educationalinstitutions and facilities in the urban areas of Gaza Strip, and the greatereconomic and educational obstacles confronting disadvantaged social groups,especially refugee camp dwellers.
- 16 -
Chapter II
EMPLOYMENT IN THE WEST BANK AND GAZA STRIP
A. Characteristics of employment
1. Sectoral structure
The sectoral structure of the labour force is an important indicator ofthe level of economic development reached by a country. Developing countriesare characterized by higher share of employment in the agricultural sector, ascompared to the higher share of employment in the industrial and servicessectors in developed market economies. In many developing economies, theshare of labour in services tends to increase more rapidly than that inindustry as the former sector is more adapted to absorbing labour force fromthe rural/agricultural sector in low-skilled distributive or personalservices. In addition, the industrialization process employs fewer labourersthan those released from the rural sector in the course of the process ofagricultural modernization and development.
Data in tables 10-a and 10-b show the continuous decrease of theagricultural sector’s share in the labour force of the occupied territory. Inthe West Bank, the agricultural sector’s share in the labour force had droppedfrom 39 per cent in 1970 to 20 per cent by 1989; for Gaza Strip it haddeclined from 33 per cent to 19 per cent during the same period. Even thoughthe pattern is similar to that of developing countries, the underlying causesare not. Policies and practices under occupation encouraged labour from theterritory to disengage from the agricultural sector. Rather than entering theindustrial sector (which at most stages has been incapable of effecting majorabsorption of labour) much of the displaced labour was induced to seekemployment in the Israeli labour market. The balance endeavoured to move tovarious professions in the construction and domestic services sectors. As aresult, the share of the Palestinian labour force remained unchanged in theindustrial sector, at around 16 per cent in the West Bank and 13 per cent inthe Gaza Strip, reflecting the stagnant structure of the industrial sector inthe territory.
A continuous rise in the share of the labour force in the constructionsector took place during 1970-1989, reflecting the increasing number ofPalestinians working in the construction sector both in Israel and theoccupied territory. The share of the labour force in domestic constructionrose from 15 per cent in 1970 to 26 per cent in 1989 in the West Bank andfrom 12 per cent to 29 per cent in Gaza Strip. Also, the share of labourforce employed in commerce, restaurants and hotels increased from 11 per centin 1970 to 14 per cent in 1989 in the West Bank and from 16 per centand 18 per cent in Gaza Strip during this period.
The sectoral employment of the labour force by sex shows that the highestpercentage of males in the West Bank has been employed in the constructionsector, followed by agriculture and industry. Similarly, for Gaza Strip, theconstruction sector accounts for the largest share of employed labour followedby agriculture. As for females, agriculture absorbs the highest percentage in
- 17 -
the West Bank followed by public and community services. In Gaza Strip, thelargest proportion of the female labour force is employed in public andcommunity services followed by industry.
The differentiated sectoral distribution of the labour force according togender reveals some of the factors affecting female participation. Thissituation corresponds to many other developing economies whereby rural womentend to find employment in labour-intensive agriculture while those urbanwomen active in the labour force tend to concentrate in public services whichare best suited to their education, skill development and social status. Thesectoral distribution of the male labour force, on the other hand, correspondsclearly to the sectoral structure of demand for Palestinian manpower, withconstruction and agriculture predominant.
2. Occupational structure
More so than the sectoral distribution of the labour force, theoccupational structure plays an important role in guiding the planning effortsof a country. This distribution defines most clearly the various types oflabour available and needed to elaborate and implement development policies.While occupational distribution is largely a function of an economy’s sectoraldevelopment, other factors, especially education and social status can play animportant role.
The data presented in tables 11 and 12 indicate that the majority of thelabour force in the territory are employed in production (categories 7, 8and 9). In the West Bank, over 70 per cent of the labour force in 1989 wasemployed in agriculture, industry, construction and other relevant skilled ornon-skilled production-related occupations; 8 per cent held scientific,professional or other highly specialized occupations; 11 per cent wereemployed in administrative, clerical and services areas; and 10 per cent assales workers. The occupational structure of the labour force in Gaza Stripresembles that of the West Bank. Data in table 12 indicate that 69 per centof labourers in 1989 worked in the production process in agriculture,industry, construction, and other relevant skilled or non-skilled areas;7 per cent were employed in the specialized and skilled professions;9 per cent worked as administrative, clerical and services workers and15 per cent as sales workers.
From a closer examination of the occupational distribution of labourersin the territory, disaggregated by sex, data in tables 11 and 12 indicate aremarkable difference between the occupational distribution of males and thatof females. The highest percentage of male labourers is found in productionrelated occupations, accounting for 72 per cent in the West Bank, and71 per cent in Gaza Strip.
Agriculture absorbed the highest percentage of females in 1989,at 52 per cent, followed by professional workers, at 27 per cent. During1972-1989, the percentage of female workers in production-related professionsin the West Bank dropped from 74 per cent to 61 per cent with a simultaneousrise in the share of female workers in specialized and skilled professions,growing from 18 per cent to 27 per cent. In Gaza Strip, the highest share offemale workers was in specialized and skilled professions, estimated at74 per cent in 1989; this was followed by administrative, clerical and

- 18 -
services, at 8 per cent and sales workers, at 6 per cent. The percentage offemale workers in productive professions, both skilled and non-skilled, haddecreased from 42 per cent in 1972 to 12 per cent by 1989, indicating asignificant occupational advancement of employed Palestinian women over theperiod. However, while this may indicate the entry of new female workers intomore advanced occupations, it also involved the "de-activation" of a part ofthe female rural labour force with the decline of agriculture.
It should be noted that there have been some important shifts between1972 and 1989 among certain occupations (especially with the decrease in theproportion of agricultural workers). However, the broad occupationaldistribution, as between so-called "white-collar" occupations (categories 1-6)and "blue-collar" occupations (7-9), has remained fairly rigid in both theWest Bank and Gaza Strip. This is especially true for males, while amongfemales there has been a growing concentration in professional/technicaloccupation and public and community services parallel (though not linked) tothe decline in the proportion of female agricultural workers. Indeed, ifanything the main impact on occupational structure of the decline inagricultural employment since 1967 has been to inflate the unskilled categoryof "other workers in industry, transport and building" especially in GazaStrip. This occupational stagnation reflects clearly the weak structuraltransformation experienced by the Palestinian economy since 1967.
3. Work conditions in the territory
(a) Employment status
The process of economic and social development effects dynamic changes inthe labour market. One notable result of the development process in mosteconomies is the transformation of many economic activities from smallfamily-owned and managed enterprises into relatively larger establishmentscharacterized by more sophisticated and advanced technical standards andcorrespondingly different labour force requirements. In such circumstances,the percentage of self-employed and those working for the family without awage tends to decrease as the share of regularly engaged employees increases.
This situation has not been experienced in the Palestinian territory.The employment situation there, as depicted in table 13, reveals that althoughthe number of employees has increased since 1970, this has not been primarilythe result of economic growth in the territory. The increase reflects morespecifically growth of employment opportunities in Israel. The number ofPalestinians working in Israel, or domestically, doubled between 1970 and 1989with their share of total employment growing from 56 per cent to 61 per cent.In Gaza Strip, the same trend had also emerged, albeit with less intensity.
Though Israel CBS data do not readily identify the distribution ofemployees between those working domestically and in Israel, this may beestimated indirectly. Since the total number of employed persons in Israel isknown, and since the vast majority of them are employees , the estimated numberof employees in the Palestinian domestic labour market can be calculated.Using this method, it is estimated that in the West Bank the total number ofemployees in the local economy grew marginally between 1970 and 1989, from42,000 to 45,000, while in Gaza Strip, the number of employees in the localeconomy declined in the same period, from 29,000 to 22,000. In the West Bank,
- 19 -
the share of locally employed fell from 42 per cent in 1970 to 39 per cent by1989; in Gaza Strip the fall was even greater, from 55 per cent to37 per cent.
These data point to growing informal, small-scale, self-employment modesof economic activity in the territory. The process of contraction in theoccupied territory’s agriculture has not significantly spurred, or beenfollowed by, more advanced forms and sources of employment in other vitalsectors involved in production. In fact, as regards employment status, thepast 25 years have witnessed growing irregularity in the employment situation,especially among the rural and refugee-camp labour force.
Table 14 indicates that the private sector was the largest employer inthe West Bank in 1985, accounting for 26 per cent of formal employment. Thegovernment and municipalities’ sector accounted for 23 per cent;United Nations Relief and Works Agency for Palestine Refugees in the Near East(UNRWA) absorbed 6 per cent and the balance of 45 per cent were mobile dailyworkers who moved between domestic sectors and occasional jobs in Israelaccording to changing opportunities. In Gaza Strip, the public sector(government and municipalities) absorbed the largest proportion of formalemployment, accounting for 25 per cent, followed by the private sector,at 18 per cent, and UNRWA, at 11 per cent. Daily workers accounted for morethan 46 per cent of the total number of those employed. While a certainnumber of daily workers may have found employment in the private sector (on aninformal/occasional basis), formal private sector employment has beenovershadowed by the share of public and community service employment (i.e.including UNRWA), highlighting the weaknesses of Palestinian privateproductive and services sectors.
(b) Wages in the territory
Wages in the territory are paid on a monthly, weekly, daily, hourly orper-piece basis. Official Israeli statistics refer only to the average dailywages of employees in the West Bank and Gaza Strip by economic sectors. Thereis no disaggregation of daily wages by localities, such as rural, urban orrefugee camp. In order to provide a wider description of prevailing wagerates, reference is made to the above-mentioned 1985 field survey, inexamining the various wage rates in urban, rural, and refugee camp areas. Thediscrepancy in daily wages between those reported in the survey and theIsraeli statistics may then be clarified.
Table 15 depicts a steady increase in the average daily wage rate in theterritory across various sectors. This increase accelerated notably as of themid-1980s. However, despite the rise of nominal daily wages, during 1985-1989by 100 per cent in the West Bank and even more in Gaza Strip - high rates ofinflation coupled with devaluation of the Israeli currency have eroded thereal wage rate and the purchasing power of residents of the territory. Thecumulative impact has been to bring wage levels in the territory more in linewith those prevailing at the lower end of the Israeli market, though stillwell above those prevailing in Jordan or other neighbouring countries.
Table 16, based on 1985 field data, indicates that the daily wage in theWest Bank and Gaza Strip in that year was $10 on average. There is a cleardifference in the wage rate between urban centres, on the one hand, and rural
- 20 -
areas and refugee camps, on the other. Furthermore, the daily wage in urbanareas in the West Bank is double that of Gaza Strip. This may be attributedto the better economic conditions and greater diversification of the West Bankurban economy, as compared to Gaza Strip. By contrast, the daily wage ratesin rural areas and in refugee camps of Gaza Strip are higher than those in theWest Bank. This would appear to reflect the overall greater degree of"urbanization" in Gaza Strip whereby refugee camps are effectively extensionsof urban areas and villages are more closely linked to the urban economy thanin the West Bank. Comparisons between average daily wages reported by thesurvey and those by CBS show that the latter estimates are lower. This may bebecause the 1985 survey data include east Jerusalem where wages are muchhigher, whereas the official Israeli statistics exclude the labour forcethere.
Data in table 16 also indicate that there is a difference in the averagemonthly wage rate between rural, urban and refugee camp areas. As comparedwith the average monthly wages in Israel, estimated at $478 in 1985, localwage rates are 40 to 60 per cent lower, depending on the area. 29 / Themonthly wages in the West Bank are highest in urban areas and in general aremuch higher than those in Gaza Strip. On the other hand, the average weeklywage is higher in Gaza Strip than in the West Bank. This is attributable tothe fact that the majority of those paid on a weekly basis are in refugeecamps, where UNRWA wage levels are higher than elsewhere in the Strip.
(c) Number of working days and hours
The number of total working days per year in the territory increasedsteadily, reaching its highest level in 1987 at 1,211,000 working days in theWest Bank and 534,000 working days in Gaza Strip, equivalent to a riseof 27 per cent and 13 per cent over the 1981 level, respectively. 30 / Theincrease in the number of working days reflects the increase in the size ofthe labour force in the territory over the same period, which increased during1981-1987 by 35 per cent in the West Bank 31 / and by 22 per cent in GazaStrip. 32 / However, these figures disguise the fact that the average hoursworked per employee fell during the same period, as the local economy did notexpand in line with growth in labour supply, with employment in Israelremaining the only alternative.
With the outbreak of the Palestinian intifada in 1988, the number ofmonthly working days decreased notably as a result of partial strike days andthe increase in the number of days of general strikes. In addition, thefrequent imposition of curfews by the Israeli authorities contributed to thereduction in the number of monthly working days in the territory. Hence, thenumber of monthly working days dropped in 1988 to 915,000 in the West Bank,and 422,000 in Gaza Strip, then rising in 1989 to 1,002,000 in the West Bankand 442,000 in Gaza Strip, but still below the 1987 levels. 33 / This trendcreated additional labour market pressures, in terms of encouragingunder/unemployment and of depressing wage levels and demand. Table 17indicates that average monthly working days decreased from 24.2 in 1987 to21.5 in 1989 in the West Bank and 24.1 to 19.4 in Gaza Strip. Table 17 alsodetails the average monthly work days per employee for the West Bank andGaza Strip for selected economic branches. As may be expected, employees inpublic services were the least affected, while other sectors contracted more
- 21 -
sharply, especially construction, industry, and agriculture in Gaza Strip (adecrease of over 30 per cent in labour input from 1987 to 1989) and commercein both the West Bank and Gaza Strip (by over 20 per cent in the same period).
In the West Bank, during 1980-1987, the average number of weekly workinghours ranged from 43 to 44.1 then dropped with the onset of the intifada to30.2 in 1988 and 32.9 in 1989. 34 / In Gaza Strip, the average number ofhours ranged from 42.3 to 42.6 during 1980-1987, and decreased to 34 in 1988and 35.9 in 1989. The average weekly hours for the territory remains lessthan that in Jordan where it is estimated to be 45.1. 35 / With theprevalence of the six-day work-week in the territory, it is estimated that thenumber of hours worked per day after the onset of the intifada wasrespectively about 5.5 and 6 hours in the West Bank and Gaza Strip. Suchlevels imply weak and sluggish production and economic activity in thesecircumstances.
(d) Employment benefits in the territory
Work benefits acquired by employees are considered to be part of thetotal employment package. They usually vary from one country to anotheraccording to the prevailing labour legislation. In the Palestinian territory,these benefits appear to be minimal as compared to some developed countries.For example, in many developed countries employees are entitled to both sickand annual leaves of respectively 5 and 30 days a year. 36 / Current labourlaw in the territory stipulates that employees of institutions that employfive or more workers are entitled up to 21 days of annual leave. Othercategories of employed persons are not covered by such provisions.
The majority of the employees in the territory are not covered by ahealth insurance scheme. Benefits such as unemployment compensation, coverageagainst injuries at work and other kinds of privileges are not common practicein the West Bank and Gaza Strip. Moreover, it is estimated that fewerthan 50 per cent of employees have written contracts with their respectiveemployers and those are mainly in urban centres. The prevalence of daily orirregular work status and the absence of legal contracts provide for minimalprotection or job security for most labourers in the territory. Labour marketagreements are based on direct relations between the employers and employeesand are regulated on a basis of personal trust rather than written labourcontracts.
(e) Trade union organization
Trade and labour unions aim at improving the economic and socialconditions of labourers, representing their interests vis-à-vis the employersor the state. The development of trade unions in a country tends to becorrelated with the stage of industrialization and economic development,resulting, inter alia , in an increase in the number of regular wage labourers.
The issuance of the Jordanian labour law No. 35 in 1953 marked thebeginning of labour union formation in the West Bank. Later, this law wasrepealed and replaced in 1960 by labour law No. 21, which became the lawgoverning labour unions in the West Bank. 37 / By 1967, some 29 labourunions were registered in the West Bank and 7 in Gaza Strip. 38 /
- 22 -
Under occupation, labour union activities were curtailed and some unionswere suspended. However, since 1979 and as a result of the increasing numberof wage labourers in the West Bank and Gaza Strip, labour unions haveintensified their activity. About 24 new labour union organizations wereformed. Some of them were registered officially, while others were notrecognized by the authorities or by Israeli employers. 39 /
The percentage of labourers belonging to unions in the West Bank wasestimated in the mid-1980s at 21 per cent, higher than that of any developingcountry. 40 / For example, in India, with a wide industrial infrastructure,only 5 per cent of labourers were unionized. 41 / Gaza Strip resembles theaverage for developing countries, with only 3 per cent of its wage earners,mostly from refugee camps, belonging to unions. 42 / Despite the relativelyhigh rate of average enrolment in unions in the territory, which may beparticularly ascribed to the political activism of many Palestinian tradeunions, enrolment remains relatively low when compared to developed countriessuch as Germany where the rate reached almost 42 per cent in 1985. 43 /Labour unions in the territory continue to be weak as many employees do notrealise their advantages. In addition, the unions could not defend theinterests of workers in Israel, thus diminishing their effectiveness.
B. Palestinian labourers in Israel
1. Number of Palestinian labourers in Israel
During the early years of occupation, only a few thousand labourers fromthe territory were allowed to work in Israel. They had to obtain specialpermits issued by the authorities, totalling 5,000 in 1968 and 10,200 in1969. 44 / Starting in 1971, the number of Palestinian labourers working inIsrael increased steadily. This was mainly owing to job opportunitiesresulting from the rapid expansion of construction activities in Israel.Furthermore, the contraction of agricultural employment in the territoryresulted in the release of a large number of Palestinian labourers who couldnot find alternative job opportunities in the local market. Table 18 depictsthe number of Palestinian labourers working in Israel. The figure increasedmore than five-fold from 22,600 in 1970 to 129,500 in 1987, constituting inthat year 42 per cent of the total labour force in the territory. 45 / Bythat stage, work in Israel effectively constituted a sector of its own and thepredominant source of employment and income for Palestinian labourers,contributing one-third of gross national product (GNP). In 1989, the numberemployed in Israel decreased to 125,000, or 40 per cent of the totalPalestinian labour force. The majority of Palestinians working in Israel weremale and the bulk came from rural areas and refugee camps. 46 / With theimpact of the intifada , Israeli measures and the aftermath of the Gulf War,the total number of Palestinians working in Israel began to fall steadily,reaching no more than 60,000 to 70,000 by 1992. 47 /
2. Sectoral distribution of Palestinians working in Israel
Table 19 depicts the sectoral distribution of Palestinians working inIsrael. The construction sector is the largest employer, absorbing aroundhalf of Palestinian workers in Israel. The Israeli agricultural, industrialand services sectors employ the rest, with the share of the latter increasing.The share of Palestinian employment in the Israeli agricultural sector
- 23 -
decreased during 1970-1989, whereas that of the industrial and servicessectors increased up to 1987. Table 18 traces the origin of Palestinianworkers in Israel, with the West Bank including east Jerusalem, accounting forover two-thirds of the total. The main difference between workers from theWest Bank and Gaza Strip is that the former tend to be less engaged in theagricultural sector than those from Gaza Strip. 48 / The proportions ofthose working in the industrial sector tend to be the same for bothareas. 49 /
It must be noted that data in table 19 do not include Palestinianlabourers from east Jerusalem, who are distributed among the construction,industry, and transport sectors as well as restaurants, hotels and personalservices, with scarcely any in the agricultural sector. It is estimated thatby 1987, 75 per cent of these labourers worked in both the construction andindustrial sectors, 18 per cent worked in personal services, transport,commerce, restaurants and hotels services and only 7 per cent worked inagriculture. 50 /
Israeli statistical data do not refer to the distribution of femalePalestinian labourers in Israel. It is, however, estimated thatalmost 60 per cent of Palestinian females employed in Israel worked inagriculture and 11 per cent worked in factories in cleaning jobs rather thanproduction. 51 / The balance worked in personal services where their jobswere also confined to cleaning.
3. Occupational structure of Palestinians working in Israel
Israel CBS statistics depict a relatively high education level ofPalestinian workers in Israel. According to these statistics, 55 per cent ofall Palestinian workers in Israel in 1987 had acquired less than nine years ofschooling. 52 / The field survey conducted in 1985 reveals differentfindings: the educational level of Palestinian labourers in Israel is low,with only 33 per cent reaching nine years of schooling. 53 / The discrepancymay be owing to differences in definitions and survey methods (in particularthe less comprehensive nature of the 1985 survey). The low percentage ofskilled and highly educated workers is a result of Israeli demand forunskilled and semi-skilled Palestinian workers, largely in the constructionsector but also in the industrial and agricultural sectors.
4. Work conditions of Palestinian labourers in Israel
(a) Employment status
The overwhelming majority of the Palestinian labour force in Israel workson a daily, hourly or per-piece basis. Only 6 per cent work on a contractualbasis. 54 / Israeli labour law applies to those labourers who acquire workpermits from employment offices in the territory. These are estimated toconstitute only a quarter of the total number of Palestinian labourers inIsrael. 55 / Those who do not acquire such work permits are considered to beworking illegally. Consequently, their employers are not bound by the labourlaw and are free to offer any or no privileges. Palestinian workers withoutcontracts are liable to arbitrary dismissal by their employers.
- 24 -
(b) Wages and labour input
As the majority of Palestinian labourers in Israel are employed on adaily basis, the discussion of wages here is confined to the average dailywage. Table 20 indicates that the average nominal daily wage of Palestinianlabourers in Israel increased from $3.4 to $18.7 during 1970-1989 for WestBank workers. For Gaza Strip workers, the average nominal daily wageincreased from $3.4 to $21.2 over the same period. The highest daily wagerate was paid in the construction sector, where in 1989 it reached $20.9 and$22.2 for workers from the West Bank and Gaza Strip, respectively.
As compared to the rising price level, especially in the 1980s, averagereal wages are estimated to have decreased. The average nominal daily wagerepresents net pay after several deductions have been made, including incometax, Israeli national insurance, unemployment contribution, value-added tax,labour union enrolment fee, and health insurance. These deductions can amountto as much as 50 per cent of gross wages. 56 / For most workers, the costsof transportation to jobs in Israel, in some cases amounting to one-third ofnet wages, further shrinks their take-home pay.
According to the 1985 field survey, the average nominal daily wage for aPalestinian labourer in Israel accounts for only 36 per cent of that of hisIsraeli counterpart. 57 / Conversely, the average nominal daily wage of thePalestinian labourer in Israel exceeded that in the West Bank by 18 per centand that in the Gaza Strip by 15 per cent in 1989. However, once thedeductions from the wages of Palestinian labourers working in Israel areeffected, the average nominal daily wage in the territory may be higher thanthat paid to a Palestinian labourer for an equivalent job in Israel, asPalestinians employed in Israel cannot benefit from many of the contributionsfor which they pay.
Finally, it should be noted that the wage level of Palestinian labourersfrom the territory working in Israel does not represent a strong pull factorto work in Israel. Rather, it would appear that push factors such as thedeterioration of economic conditions resulting in widespread unemployment inthe territory have prompted Palestinian labourers to work in Israel.
Table 21 indicates that the average number of monthly working days forWest Bank labourers in Israel in 1987 was 22.5 days, a level which decreasedfollowing the intifada . The same trend was observed in Gaza Strip, where theaverage number of monthly working days in 1987 was 21.2; it has decreasedsince. In most sectors of employment in Israel, the decrease in the averagenumber of monthly work days after 1987 was not as precipitous as in domesticeconomic sectors. Adverse conditions during this period appear to haveaffected workers in the domestic market more than those who continued to workin Israel.
(c) Health and safety
Although CBS publications do not refer to professional health and safety,social insurance, and other privileges available to the Palestinian labourersin Israel, a 1983 publication issued by the Israeli Ministry of Labour andSocial Welfare indicates that the safety and health of Palestinian labourersare insured. 58 / This insurance includes treatment in Israeli hospitals in
- 25 -
case of injury during working hours. Every worker and his family is coveredby health insurance in the clinics and hospitals of the West Bank and GazaStrip. These benefits apply only to those Palestinians working in Israelthrough the employment office and who have obtained work permits. 59 /
It is estimated by Palestinian sources that in fact only 31 per centand 29 per cent have health or accident insurance, respectively. 60 / Thisproportion roughly corresponds to that of officially registered Palestinianworkers in Israel (i.e. around one quarter of the total employed in Israel).Also, despite the fact that the labour law and the Israeli labour legislationentitles the labourer to annual leave, a bonus or pension on servicetermination, only a small percentage of Palestinian labourers in Israelactually receive these kinds of benefits. 61 /
(d) Labour union organization
Palestinians from the West Bank and Gaza Strip, working in Israel areentitled to join labour unions in the territory. With the exception of thosefrom east Jerusalem, Palestinian workers cannot join Israeli unions headed bythe Histadrut . Only a small percentage of Palestinian labourers in Israelenrol in labour unions, accounting for only 7 per cent in 1985. 62 / Thereason behind this is that labour unions in the territory cannot file lawsuits concerning labour disputes between Palestinian labourers and theirIsraeli employer, as labour unions in the territory are not recognized by theauthorities within Israel.
(e) Some social characteristics of Palestinian labourers inIsrael
According to the above-mentioned sample survey, the overwhelmingmajority, or 72 per cent of Palestinian workers in Israel originates in ruralareas and refugee camps in the territory. Of the total, some 63 per cent ismarried, 35 per cent unmarried, while the rest are widowers or divorcees.Almost 56 per cent of workers represents heads of families. 63 /
The average size of the family of a Palestinian labourer from the WestBank in Israel is 7.7 persons, which is twice the size of an Israeli family.A worker from Gaza strip usually comes from an average family of eightmembers. 64 / Almost 50 per cent of Palestinian workers in Israel has atleast one member of the family working, many of whom work in Israel. Thismeans that sometimes entire families with more than one breadwinner aretotally dependent on employment in Israel for their livelihood.
- 26 -
Chapter III
UNEMPLOYMENT IN THE WEST BANK AND GAZA STRIP
In analysing labour-force and employment trends in the occupiedterritory, three interrelated issues predominate: domestic employment-generation capacity, work opportunities outside the domestic economy, namelyin Israel and elsewhere, and unemployment. At the root of the employmentpredicament in the occupied territory is deterioration in the capacity of thedomestic productive base and in domestic service sectors to generate adequateemployment opportunities to cater to a relatively high rate of labour-forcegrowth. This reflects not so much structural transformation within thePalestinian economy as much as a change in the relations between thePalestinian economy and neighbouring economies, particularly that of Israel.Alongside modernizing, productivity-enhancing and labour-releasing changes insome sectors, growth in other domestic sectors has been subject to shocks anderosive economic forces. Unemployment and under-employment have emerged aspart of the general trend in much of the Palestinian economy to operate belowfull productive capacity, owing to marketing constraints and otherbottlenecks. Divergent trends in skill development and the nature of domesticdemand for labour have further complicated matters.
A. Unemployment before and during the intifada
Unemployment is conventionally defined as the difference between thesupply of labour at existing wage rates and working conditions and the numberactually employed at those levels. Israeli statistics define unemployment inthe territory based on the results of a random sample field survey amongfamilies there. According to this survey, an unemployed person is defined asone of working age, who had no work at all during the week of survey and whowas seeking a job through the employment offices in the territory. Thisdefinition is narrow in so far as it does not include among the unemployedthose who worked part-time during the week of the survey. With the outbreakof the intifada , and the work week affected by strikes and curfews, those witha place of work were defined as employed even if they had not worked duringthe week of the survey. 65 /
One problem with measuring unemployment is that available statistics donot reflect those employed in the informal sector, either as wage earners orself-employed. The informal sector is unregulated and therefore it is simplerto seek or leave employment. It is composed mainly of small family-basedconcerns. Production in this sector is labour-intensive with adaptedtechnology requiring skills that are acquired informally. Small retailoutlets and owner-operated enterprises are the most important constituents ofthe informal sector in the Palestinian economy. Both men and women areinvolved in this business, setting up stalls to sell agricultural produceincluding fruit, vegetables and some processed agricultural products. Inaddition, various other products are sold, such as fowl, perfume, cosmetics,watches, second-hand clothing, canned food and antiques. There are noofficial statistics or independent studies on the informal sector in theWest Bank and Gaza Strip, which tends to expand with deteriorating economicconditions. All family members can participate in the informal sector, butwomen usually are the most actively engaged. They do so either to assist themen working in Israel or as sole breadwinners for their families.
- 27 -
Israeli statistics, therefore, report low rates of unemployment of around2 per cent in most years since occupation of the territory, as indicated intable 22. It would appear, however, that the real unemployment rate in theterritory is much higher than that reported in official statistics. This isowing to the fact that in the largely unregulated Palestinian labour market,most of the unemployed search for jobs independently and do not register withthe unemployment offices.
Assuming that those employed on a part-time basis would rather havefull-time jobs, and making allowance for those seeking employment but who havenot registered with the employment offices, the rate of unemployment may beestimated at 22 per cent and 17 per cent for the West Bank and Gaza Strip,respectively, in 1989. 66 / This contrasts with Israeli CBS data whichindicate that, in 1989, the rate stood at 4.4 per cent in the West Bank and2.5 per cent in Gaza Strip, higher than the rates prevalent before theintifada . Males were reported to constitute the highest proportion of theunemployed, registering around 90 per cent in 1989 for the West Bank and96 per cent for Gaza Strip. The rate of female unemployment in the femalelabour force is higher than the corresponding rate for males in Gaza Strip.
One possible indicator of the size of the "grey area" ofun(der)employment is revealed in Israeli statistics, under the heading of"employed persons, temporarily absent from work". The number of this categoryof employed persons jumped significantly with the beginning of the Palestinianuprising, from some 11,000 in 1987 to over 36,000 in 1988 and 26,000 in 1989.When added to the officially reported category of unemployed, these data giveunemployment levels in 1988-1990 of between 37,000 and 44,000, or between 13and 15 per cent, which appear to be more realistic estimates of the widespreadunemployment reported in the occupied territory, especially after 1988.Massive unemployment has emerged since 1990, with the addition to the ranks ofthe unemployed of 40,000-50,000 Palestinians previously working in Israel.
The major cause of unemployment in the territory is the lack of workopportunities in the domestic market, owing to an unstable economic andpolitical situation and the lack of sufficient jobs to absorb the large numberof well-trained and qualified workforce. Moreover, for political reasons,some Palestinians have not been allowed to seek employment opportunities, thusfalling under the "involuntary" category of the unemployed. 67 /
Two types of unemployment can be distinguished in the Palestinianeconomy, namely; cyclical and structural unemployment. 68 / In the case ofthe Palestinian labour force, the 1985 study revealed 69 / that cyclicalunemployment accounted for almost 60 per cent of the unemployed whilestructural unemployment stood at 40 per cent. The former reflects the impactof fluctuations in economic activity and other cyclical factors (such as thebiannual olive crop in the agricultural sector) while the latter is largely aresult of university and other post-secondary graduates unable to findappropriate jobs, a problem which is more prevalent in Gaza Strip than in theWest Bank. 70 / A sample survey conducted in the territory inmid-1991, 71 / depicted that of the total unemployed, cyclical unemployment
- 28 -
accounted for 56 per cent and structural unemployment for 44 per cent. Thisreflected the impact of the Gulf crisis in 1991 when a large number ofqualified Palestinians returned from Kuwait and the other oil-producing Arabcountries in the Gulf.
The majority of the unemployed in the West Bank originate in urban areas,whereas the majority of those in the Gaza Strip originate in refugeecamps. 72 / The survey undertaken in 1991 73 / revealed that those underthe age of 34 constituted the majority of unemployed labourers in theterritory, representing 78 per cent of the unemployed. This high figure notonly reflects the inability of the economy to absorb the most active group ofthe labour force but also implies an element of despair leading to social andpolitical unrest which is bound to reach the very fabric of the Palestiniansociety.
Since 1987, the intifada aroused in the Palestinian consciousness thenecessity to strengthen self-reliance and lessen dependency on Israel invarious economic sectors. It led, inter alia , to an increase in domesticemployment, a drop in the number of labourers working in Israel and a fall inthe number of monthly working days and weekly working hours in both domesticand Israeli labour markets. Whereas the proportion of Palestinian labourforce employed domestically increased with the onset of the intifada , theoverall unemployment rate also increased owing to the dismissal of largenumbers of Palestinian workers by Israeli and Palestinian employers for avariety of reasons. 74 / Both the number and proportion of Palestinianlabourers working in Israel decreased as indicated previously. 75 /Increased employment in the domestic labour market was most pronounced in theindustrial sector, especially in establishments that employed eight or morelabourers.
As noted, the drop in the number of weekly working hours and monthlyworking days after the intifada resulted from the recurrent general andpartial strikes, widespread unrest and Israeli measures. In addition, theauthorities sometimes prohibited transport between villages and cities, cutoff electricity and stopped the fuel supply to the territory. As aconsequence, average weekly working hours in the West Bank and Gaza Stripdropped sharply, as did the average weekly hours for labourers working inIsrael. Monthly working days decreased for the same reasons.
B. The impact of new emigration to Israel and the Gulf crisis on Palestinianunemployment
The dramatic changes that took place in the former Soviet Union andeastern Europe between late 1989 and 1991 led to mass emigration of Jews fromthose countries to Israel. The number of new immigrants to Israel registered192,017 in 1990, 76 / and totalled 197,000 in 1991. 77 / In less thanthree years, some 406,582 new immigrants had settled in Israel.
To determine the effect of this wave of immigration to Israel onemployment opportunities in Israel for the Palestinians, the educational anddemographic characteristics of the migrants are of pertinence. Israeli dataindicates that 23 per cent of immigrants who arrived in 1990 were lessthan 15 years of age; 12 per cent were from 15-24 years and 12 per cent were65 years old and above. 78 /
- 29 -
Since the 15 to 24 years category is usually the age group enrolled inthe educational system and thus excluded from the active labour force, theproportion of new immigrants of working age may be estimated at around53 per cent. Assuming high participation and activity rates, this translatesto around 200,000 new entrants into the Israeli labour force between 1989 and1991. Owing to the qualifications of new migrants and the kinds of jobs theysought, these immigrants were not in direct competition with Palestiniansemployed in Israel who are largely unskilled, as compared to only 2 per centof new Israeli immigrants being unskilled. The balance of immigrants in 1990was composed of 39 per cent scientists; 34 per cent technicians; 4 per centmanagers and writers; 6 per cent salespeople and servants, under 1 per centagricultural workers; and, 13 per cent skilled industrial workers. 79 /Israeli statistics indicate that in 1991 some 27,000 immigrants wereuniversity graduates, 16,000 engineers and 3,250 physicians. 80 / Thus,only a small proportion of the immigrant labour force would potentiallycompete with Palestinians working in Israel.
Owing to the fact that unemployment in Israel was high, registering10.6 per cent in 1990, 81 / and economic conditions were such that not manyjob opportunities could be readily created for the new immigrants, the lattermay have opted to accept jobs held by Palestinians so as to stay in Israel,thus posing a problem for the Palestinian workers. By the end of 1989, Israelstarted to restrict the employment of Palestinians inside Israel by notissuing the necessary permits for Palestinians so as to prevent them fromreaching their work place. This encouraged Israeli businesses to employ newimmigrants.
This situation was further aggravated by the Gulf crisis. Almost allPalestinian workers were denied entry into Israel at the onset of the crisis.After the Gulf War, most Palestinians were also prevented from returning totheir jobs in the Gulf. Gradually, more workers were allowed to go back totheir jobs in Israel but only after obtaining valid working papers from theIsraeli authorities. In 1991, about 70 per cent of Palestinian workers whoused to work in Israel before the outbreak of the Gulf crisis had returned towork in Israel. This resulted in some 32,000 Palestinians losing their jobsin Israel: 13,000 from Gaza Strip and 19,000 from the West Bank. 82 /
With the outbreak of the Gulf crisis, thousands of Palestinians who hadbeen working in the Gulf but maintained their residence permits returned tothe occupied territory. They totalled about 30,000 according to Israelisources in the territory. 83 / Owing to the deteriorating economicconditions in the territory in the aftermath of the Gulf War, the majority ofthese returnee Palestinian workers failed to find alternative jobs, andremained unemployed.
The new immigration into Israel coupled with the Gulf crisis aggravatedthe unemployment situation in the occupied territory. The rising unemploymentrate was reflected in Israeli official statistics which reported unemploymentat 10.3 per cent in the West Bank and 3.7 per cent in Gaza Strip in1991. 84 / Compared with official statistics for previous years, theserates of unemployment were especially high. However, these figuresunderestimated the rates of unemployment in the territory, owing to flaws inthe sample, as mentioned earlier.

- 30 -
C. Developments since 1991 affecting Palestinian unemployment 85/
After the two-month ban on entry of Palestinians to Israel in 1991, alabour permit/pass system for Palestinians working in Israel, alreadyinstituted in the Gaza Strip, was generally applied, with at least80,000 permits valid by early 1993 (approximately 45,000 in the West Bank and35,000 in Gaza Strip). An additional unspecified number of Palestinians wereable to obtain jobs in Israel on a seasonal or irregular basis, withoutpasses. Israel CBS data indicate that as many as 98,000 Palestinians wereclassified as working (i.e. including those working part-time or "temporarilyabsent from work") in Israel in 1991: some 56,000 from the West Bank and42,000 from Gaza Strip. Average weekly work hours per employee in 1991remained some 18 per cent below the pre-1987 highs. Taking CBS data on labourinput into account, this translates into the full-time equivalent ofapproximately 46,000 workers in Israel from the West Bank and 34,000 from theGaza Strip. Since 1991, the impact of further reductions in job opportunitiesin Israel has been unemployment on a scale never experienced in the occupiedterritory, with a sharp reduction in national income.
No comprehensive official figures have been published for 1992 and 1993;preliminary data for 1992 indicate a return to pre-1988 levels of employmentin Israel, especially from the West Bank (up to 70,000). However, byearly 1993 relatively high unemployment in Israel and related Israeligovernment policies had gradually reduced reliance on Palestinian workers,except for construction and some agricultural branches. With the totalclosure of the occupied territory as of April 1993, no Palestinian workersentered Israel for several weeks and some Israeli employers adjusted to themost recent cut-back. However, months after the closure, tens of thousands ofjobs previously performed by Palestinians in Israeli construction andagriculture had yet to be filled by Israelis; 40,000 work permits forPalestinians had been issued, with an officially proposed ceiling of 70,000;and, "import" of labour from elsewhere was being considered.
The major consequence of these developments for the Palestinian economyhas been "runaway" unemployment (especially in the impoverished Gaza Strip),which was reported to have reached the respective levels of about 40 and25 per cent in Gaza Strip and the West Bank, prior to the sealing off of theterritory. Palestinian sources estimated that by mid-1993, unemployment inGaza Strip had reached over 55 per cent (67,000 persons) and in the West Bank35 per cent (71,000 persons). While such levels may be considered to reflecttransitory (or cyclical) as opposed to structural levels of unemployment, insome localities (rural communities and refugee camps) unemployment wasreported to have topped 70 per cent, as in Gaza Strip in April 1993.
Notwithstanding positive developments in the policy environment since1993, an increasingly critical situation persists as regards growingunemployment, underemployment and the emergence of poverty, especially inGaza Strip. While this mainly reflects the fall in employment opportunitiesfor Palestinian workers in Israel and in the oil-producing countries of theregion, and the frequent closure of Israel for security reasons, domesticfactors are also at play. In particular, sectors of Palestinian domesticeconomy (except agriculture) have proven incapable of adequately absorbingPalestinian workers no longer employed in Israel (at least 40,000 since 1987),new entrants to the labour force (some 13,000 annually), returnees from Kuwait

- 31 -
and the Gulf countries since 1990 (estimated at the time at around 15,000), inaddition to those made redundant owing to the decline in production levels ofseveral domestic sectors since 1987 (especially industry, construction andpublic and private services). Unemployment was cited at around 25 per cent(out of a labour force of some 350,000) in early 1994 by some internationalsources, and up to 40 per cent by Palestinian sources. This burden surelychallenges policy makers and entrepreneurs alike. Notwithstanding differentinterpretations of the nature and dimensions of the employment problem in theoccupied territory (i.e. the extent to which it is a question of unemploymentor underemployment), the issue remains one of special urgency. Job creation,through private and public investment programmes, will remain a top priorityand an overriding challenge in the coming years, along with other key economicand social considerations.
- 32 -
Chapter IV
HUMAN RESOURCE DEVELOPMENT AND EMPLOYMENT PROSPECTSIN THE PALESTINIAN TERRITORY
Developing countries often suffer from severe imbalances in their labourmarket. These distortions are characterized by an excess demand for skilledand technical capacities and a surplus supply of unskilled and semi-skilledlabour in both the modern and traditional sectors. Human resource strategiesof developing countries aim at addressing these issues by developing technicaland managerial skills and creating job opportunities for the surplus labourforce. Education is the most effective avenue for such human resourcedevelopment endeavours.
The labour market in the territory comprises a growing number ofgraduates from the traditional educational system but with no evident jobopportunities. As a result, many are prompted either to emigrate or join theIsraeli labour market where they are often obliged to accept jobs unrelated totheir field of specialization. At the same time, there is a shortage ofproductive and industrial technical skills in the labour market of theterritory such as chemical engineers, mechanical designers and machine-relatedconstruction skills. The following sections attempt to clarify the causes ofthis problem and present elements of a feasible framework for the developmentof human resources in the territory, taking into account the need forsynchronization with Palestinian labour markets.
A. Higher education and vocational training system
1. Higher education system
The higher education system in the territory consists of 6 universitiesand 16 intermediate colleges. The West Bank houses 5 of the universities and15 of the intermediate colleges whereas Gaza Strip has 1 university and1 college. These universities and intermediate colleges are non-governmental;each is administered by a special board of trustees whose function is todefine the general academic policy of the institution and the number ofstudents that will be accepted during each academic year. A Higher EducationCouncil, independent of Israeli authorities, establishes policy guidelines andcoordinates among the universities.
Some 14,000 students were enrolled in Palestinian universities during theacademic year 1987/88, 38 per cent of whom were female. 86 / Table 23indicates the distribution of students by various fields of specialization.Almost 32 per cent of the students were enrolled in liberal arts programmes.Not all universities offered education in all fields. For example, only twouniversities - An-Najah and Bir-Zeit - had schools of engineering. Laboratorymedicine and X-ray technology were taught only at Al-Quds University. 87 /None of the universities had faculties of medicine or pharmacy and manyengineering programmes and scientific specializations were not available.Hence, large numbers of Palestinian students wishing to study suchspecializations have been obliged to travel abroad to study in Arab and/ornon-Arab universities.

- 33 -
Data on the number of applications for enrolment in universities suggesta high demand on the educational system. For example, during the academicyear 1987/88, only 59 per cent of the 6,741 applicants were accepted in thevarious programmes of An-Najah University, and ultimately only 47 per centjoined these universities. 88 / Table 24 shows the distribution ofgraduates according to fields of specialization between 1975 and 1989 in theterritory.
Table 25 reveals that the number of students enrolled in the16 intermediate colleges (offering post-secondary diplomas) of the West Bankand Gaza Strip totalled 6,326 during the scholastic year 1985/86, of whichalmost 48 per cent was female. Programmes in education and teacher-trainingabsorb some 61 per cent of the students enrolled in intermediate collegeswhich, in part, explains the high female proportion in total.
2. Vocational training
Vocational training in the territory consists of training at thesecondary level, training centres, courses, and on-the-job training. Duringthe academic year 1990/1991, there were 13 vocational secondary schools in theWest Bank, of which 4 specialized in commerce, 8 in industrial training, and 1in agriculture. There were no such schools in the Gaza Strip. A minimum ofnine scholastic years including compulsory and preparatory stages are requiredas well as an entrance exam to qualify for admission. Programmes at theseschools take three years to complete after which students are eligible to sitfor general vocational secondary examination of the Jordanian Ministry ofEducation and Teaching. The highest number of students were enrolled inservice-related vocational schools, totalling 1,425 in 1987/88. 89 / Theseinclude training in areas such as electricity maintenance, car mechanics,carpentry, smithery and agricultural mechanization.
There is no local regulatory or inspection committee for vocationalteaching, unlike other types of education. 90 / Vocational teaching,especially in industrial programmes, has been negatively affected since 1967owing to the lack of overall guidance and cohesion in curricula,interruptions, programme changes, shortage in cadres , equipment andfunding. 91 /
There are four vocational centres in the West Bank and two in Gaza Strip,with a total enrolment of 1,473 in 1987. 92 / These centres are privatelyrun by various religious and other organizations, including UNRWA whichoperates one in Qalandya and another in Gaza Strip. 93 / The curricula forthe centres run for two or three years with many hours devoted to practicaltraining. With the completion of the study programme, students who pass theexamination are entitled to either a certificate of industrial diploma or acertificate of completion of study. 94 /
Periodic vocational courses are offered by various establishments both inthe West Bank and Gaza Strip. These include local charities, UNRWA andforeign institutions. Students are admitted in most of these coursesregardless of their educational levels. With the successful completion ofthese courses, which could be as long as 18 months, a certificate is issuedwhich usually helps students get a job. These courses are characterized bytheir practical nature. 95 / Courses are offered in many vocations
- 34 -
including: electricity; radio and television; construction; whitewashing,cementing and tiling; shoe manufacturing; secretarial studies; officeadministration; practical nursing; and sewing.
The vocational training system in the occupied territory is elementarywhen compared with that of Israel. It has equally fallen out of line withdevelopments in vocational training in neighbouring Jordan. The system lacksthe diversity and sophistication of its Israeli counterpart. Vocationaltraining in Israel includes training in electronics, tools manufacturing,industrial chemistry, diamond polishing, and computers. 96 /
Whereas the percentage of secondary students joining vocational schoolsis rather low, at 5 per cent in the West Bank and 4 per cent in the GazaStrip, it is high in Israel, accounting for 48 per cent. 97 / Thisdisparity is owing to the low absorptive capacity of the vocational schools inthe territory. Only 48 per cent of applicants to vocational schools areaccepted, 98 / underlining the need to establish more such institutions infuture and to streamline and rationalize their vital role.
3. On-the-job training
On-the-job training is almost non-existent in the territory. Thistraining is confined to industries and takes place largely in Israel. Onestudy has indicated 99 / that 55 per cent of Palestinian labourers in Israelhad learned the basic skills in their vocations during work in Israel. Thereis no on-the-job training for engineers, physicians, and pharmacists in theterritory. Those individuals have to arrange their own training in othercountries. In addition, there are no establishments for on-the-job trainingin the field of administration, as is the case in Jordan, where twoindependent institutions for administrative training exist; i.e. the JordanianInstitute for Public Administration, and the Jordanian Institute forManagement. These institutions organize training courses for governmentemployees and managers from the private sector. 100 / Some foreign andinternational organizations have expressed interest in designing courses inthe fields of health, agriculture and teaching.
4. The labour market and the educational and training system
With the steady increase in the number of inhabitants in the territory,the demand for schooling has increased. The number of students registered atschools in the territory more than doubled from 222,200 in 1967/68 to 488,400in 1988/89. 101 / At the same time, the trend in demand of universityeducation was also on the rise. The increasing number of university graduateshas not been met with an adequate increase in job opportunities available inthe territory. As a result, university graduates constitute a high percentageof the unemployed. With the insufficient absorptive capacity of thevocational training system and the lack of diverse training programmes in suchareas as chemical and mechanical engineering and technical design, the revivaland development of the industrial sector in the territory cannot proceedefficiently. Moreover, many programmes of vocational training centres set upby the authorities after 1967 are tailored to the needs of the Israeli
- 35 -
economy. Vocations included in those centres are mainly within the field ofconstruction, including tiling, cementing, building and smithery. 102 /The lack of skills and slow acquisition of technology has been one of themajor factors behind the stagnation of the industrial sector.
B. Human resource development: problems and objectives
The problem areas affecting the development of Palestinian humanresources in the territory fall into five major categories. The firstcategory has to do with the short supply of highly-qualified scientificmanpower, such as agronomists, veterinarians, engineers, specialistphysicians, etc. It is true that these scientific categories are available inthe urban areas, but the Palestinian rural areas are lacking thesespecialists. Those available also suffer from a relatively low standard ofqualification. There is an urgent need for rehabilitation programmes toimprove their performance and increase their productivity.
The second problem area relates to an acute shortage of technicalmanpower, such as nurses, agronomists’ assistants, technical supervisors andother middle-level professional personnel. The shortage in this category isnot only in terms of quantity but also quality. This category of labour has alower standard of proficiency. The West Bank and Gaza Strip are in shortsupply of this category more than the first category, owing to a preferencefor university education which is expected to provide a higher income andsocial status. In addition, there is a lack of institutional infrastructurefor technical and vocational education, to provide education and training tothis category of manpower. The programmes of vocational education centres andthe community colleges in the West Bank and Gaza Strip are restricted toservice-oriented traditional vocations. They do not have the ability andqualifications to offer advanced technical education and/or vocationaltraining that would serve the process of economic development, particularly inthe industrial and agricultural sectors. Training in some professions, suchas nursing, hotel and postal management is totally lacking.
The third category relates to managers, administrators and administrativespecialists, which are absent or in short supply. In other words, there is ashortage of top managerial and administrative personnel. This applies to boththe private and public sectors.
The fourth category pertains to trainers. There is a limited supply ofteachers and instructors at primary and secondary schools and at theuniversity level. Those working in the education sector suffer frominadequacies in teaching qualifications owing to insufficient trainingcourses. Moreover, education and training programmes at all levels lackmodern teaching equipment, instruments and installations to upgrade thescientific qualification of teachers and enhance their abilities to conveyinformation to their students in the best way possible. Additionally,highly-qualified people tend to leave for more lucrative employment abroad.
Finally, the West Bank and Gaza Strip also suffer from a shortage ofclerical personnel such as bookkeepers, secretaries, stenograph and businessmachine operators, as well as experts in radio and television programmes,
- 36 -
computers, communications, and repair of household electrical appliances.There is also a total lack of expertise in the field of civil aviation,shipping and multi-modal transport systems which in turn affects employment.
The problem areas relating to human resource development, as illustratedabove, cover all economic sectors at varying degrees.
In agriculture, vocational training is limited to agricultural secondaryschools. These schools function with limited facilities and within veryrestricted space. As such, they are not geared to meet the current and futureneeds of agriculture in the West Bank and Gaza Strip.
In the industrial sector, a general shortage of training facilities toteach industrial vocations prevails throughout the territory. Most industrialschools and colleges lack qualified trainers, in addition to shortages ofmodern machines, equipment and library facilities. Many specializations areparticularly lacking in vocational industrial schools in the territory in suchareas as electricity generation, transfer and distribution of electricity,wireless and wire communications, diesel mechanics, heating and air-conditioning, designing and manufacturing of machines, chemical engineering,and computer-run machine engineering. In the services sector, education andtraining in postal, hotel and nursing are completely absent in addition totraining at lower levels in other areas of expertise in the West Bank andGaza Strip.
In view of the above, some salient goals emerge for human resourcedevelopment efforts in the context of immediate and future socio-economicdevelopment needs in the West Bank and Gaza Strip. These include:
1. Coordinated planning and supervision of both vocational and universityeducation to develop local manpower in accordance with the current and futureneeds of the Palestinian economy in the West Bank and Gaza Strip;
2. Improved organization of university education programmes in the territoryin addition to the rationalization and development of the quality of itsoutput, including the introduction of new specializations such as agronomy andapplied engineering in accordance with the needs of various productivesectors;
3. Rehabilitation of the teaching staff at schools, universities andcommunity colleges;
4. Development of applied scientific research in various economic spheres,especially through universities;
5. Introduction of advanced and modern educational tools in schools anduniversities to upgrade the performance of those in charge and increase theirproductivity, thus increasing the qualification of graduates at variouslevels;
- 37 -
6. Expansion of vocational training in community colleges with emphasis ontechnical education, including industrial chemistry, computer use and otherexpertise. With regard to agriculture, a similar drive is required to providea variety of specialized cadres in community colleges aimed at serving thesector in various areas;
7. Expansion of programmes geared to upgrading the professional knowledge ofemployees in vocational schools, especially those involved in nursing,agricultural, industrial and business education. New specializations need tobe introduced into vocational schools serving the industrial sector,especially in such areas as micro electronics, wire and wirelesscommunication, general electronics, diesel mechanics, electricity transfer andgeneration, as well as in postal and hotel services;
8. Improving the infrastructure of industrial training centres by providingmodern equipment, machines, varieties of tools and workshops along withtraining and educational programmes.
9. Development of human resources and training of Palestinian manpower inline with the demands of the domestic market. Training and education whichused to be directed towards increasing the qualification of Palestinian labourforce for export are redundant at this stage of reconstruction anddevelopment. Besides, high-level trained manpower has to be increased in allcategories at a rate higher than the rate of increase of the Palestinianlabour force and even at a rate greater than that of domestic economic growth,particularly in the area of technical or technological manpower related tograduates of community college and other similar institutes. The creation ofmaterial incentives in terms of wage increases, moral support and improvementof social status, not to mention the change of traditional social attitudestowards technical and technological employees, are imperative for expandingthe base of skilled employees for jobs in technical and logistics areas.
C. Entrepreneurship and development needs
The existence of a vital entrepreneurial class is increasingly recognizedas essential for successful growth and development of any economy. The verylack of this category underlies the slow pace of development in manycountries. Discoveries and scientific innovations create what might be termed"horizons of growth and economic development". An entrepreneur exploits andtransforms these horizons and possibilities into an economic reality that maytake several forms: innovative economic methods to produce common products,introduction of goods or services previously unknown, discovery of new marketsto sell products or introducing installations or new organization to make thebest use of the innovations and discoveries brought about by scientists.Neither is the entrepreneur’s role restricted to such endeavours alone. Itequally extends to managers and officers of public and private institutions.Moreover, it is not necessary for entrepreneurs to have new ideas of theirown. They can also organize and mobilize the efforts of others.
In a wider application of the concept, engineers and agronomists may alsobe classified as belonging to the entrepreneurial class because of theirinnovative new methods of industrial or agricultural production. Agriculturalassistants also train farmers on how to use these methods. Public healthofficers, male and female nurses and medical assistants can also belong to the
- 38 -
entrepreneurial category. Such employees bring new innovations in the fieldof medicine to their work. Engineers are also included under this categoryfor they are considered designers of change; university professors, directorsof educational institutions and teachers all may be construed as part of theentrepreneurial category for they are in charge of the education sector, andit is they who develop new generations of manpower.
With regard to the situation in the Palestinian territory, theentrepreneurial spirit certainly abounds, but it is very much restricted tothe private sector: namely industry, agriculture and services. Whileentrepreneurs may be identified in these and other economic sectors, theirinventive and innovative abilities have been constrained and their scope foraction curtailed. In the public or government sector, designated officershave had the upper hand for more than 25 years without the real involvement ofthe Palestinian people in the areas concerned. A Palestinian entrepreneurialclass, in the widest sense of the term, has yet to emerge in the territory.
In the agricultural sector, Palestinian farmers have proved themselvescapable and have succeeded in absorbing modern agricultural technology and itsapplication to their farms, with success in increasing their farms’productivity. Unfortunately, obstacles encountered with respect to the exportof agricultural surplus to foreign markets have prevented further exploitationof this potential. Despite these problems, the private sector has endeavouredto find alternative markets for agricultural produce in Europe. Constraints,including cumbersome regulations, poor infrastructure, limited financialresources, lack of expertise and experience in dealing with developed marketsin Europe have prevented Palestinian farmers from competing with similarproduce from other sources.
In the industrial sector, entrepreneurs in some branches have scoredimportant successes, particularly in textiles, shoes, and marble. Palestinianentrepreneurs have succeeded in developing these industries and in supportingtheir capacity to compete and realize comparative advantages, throughsuccessful application of the limited available technology and higherproduction efficiency. The entrepreneurs concerned have succeeded indeveloping these industries qualitatively, by introducing elements ofinnovation and invention, thus strengthening their competitive capability.There are further examples of successes, including in minerals andagricultural tools industries. Nevertheless, the entrepreneurial category inthe industrial sector continues to suffer from logistic and other constraints.Adequate financial support has long been a key impediment.
Some industries which were established on the basis of sub-contractingare still struggling with innovation, particularly as these industries havebeen confined to sub-contracting since 1988. The factories concerned began toproduce and market a standard line directly to the local and Israeli markets.Shoe factories are a case in point. They have failed to manufacture new typesof shoes; textile factories have failed to develop new models. Trainingprogrammes are needed in order to support entrepreneurs in these and otherproductive sectors in the occupied territory.
- 39 -
D. Areas for action
One of the most pressing needs confronting the occupied Palestinianterritory is to deal with the high rate of unemployment. As a first step, therelevant Palestinian institutions need to attempt to ascertain the exactnumber of unemployed as well as their qualifications and experience. Thisinformation is essential in order to create appropriate employmentopportunities in various economic and social sectors. These data areparticularly important as regards returnees from the oil-producing countries.Ascertaining their potential, in terms of the expertise they have acquired,could help in turning a negative employment situation into a positive benefit,if directed towards initiating new industries and businesses.
Parallel to these efforts, the relevant Palestinian institutions shoulddevelop and conduct appropriate workshops and training programmes aimed atfacilitating the absorption of the unemployed into relevant areas ofPalestinian economic and social structures. The chambers of commerce andindustry and trade unions could be appropriate mechanisms for such action.More emphasis should be placed on projects with a strong employment-generationelement in both the West Bank and Gaza Strip; this would included agro-basedindustries, housing, welfare and social services, infrastructure, industry andtourism, and other labour-intensive activities. Immediate employment-generation projects should be identified to absorb some of the growing numberof unemployed workers. In addition to housing and other labour-intensive workopportunities, the public sector could fruitfully engage workers in a numberof public works projects. The municipalities could play an important role inthis respect. Meanwhile, Palestinian labour unions and employers shouldinitiate a dialogue on remuneration and practices that have contributed tounemployment and related problems.
The education system has not helped alleviate the present state ofaffairs: education programmes were geared to external needs and respondedaccordingly. The actual domestic needs of the Palestinian economic and socialsectors were placed second, while restrictions imposed under occupationaggravated the disarticulation between economic and human resourcedevelopment. Weaknesses inherent in the Palestinian education system, whetherrelated to curricula, facilities, teacher-training, finance or other factors,have led to a distortion and imbalance in the present labour market in theWest Bank and Gaza Strip, reflected in increasing structural unemployment. Aradical reform of the structure and orientation of the education system at alllevels is necessary, geared to serving primarily the growing and changingneeds of the emerging Palestinian economic and social structures. Improvingthe orientation and quality of education and training in public schools andvocational institutions should help reduce structural unemployment.
The existing labour force largely lacks specific skills to meet thetechnical requirements of jobs at lower skill levels; this affects both menand women. Such needs are likely to increase in line with efforts to improvethe economic and social situation of the Palestinian people. It is necessaryto assess the extent and nature of training provided by vocational trainingcentres as compared to the immediate needs of workers. The training
- 40 -
programmes of existing vocational training centres and community collegescould then be strengthened accordingly. More emphasis should be placed ondeveloping programmes which could ensure the absorption of women intotechnical and vocational areas. The programmes of existing vocationaltraining centres should likewise be strengthened to meet the needs formiddle-level technicians in various fields.
Developments since 1993 have rendered urgent the adoption of integratedhuman resource development programmes. The imperative of achieving a rapidimprovement in the living condition of the Palestinian people cuts across alllevels of society and sectors of economic activity. In this context, threeinter-related sectors appear to be especially relevant to the task ofPalestinian social and economic revival. First, the need to begin to providedecent housing along with efficient utilities to all social groups, ataffordable prices. Secondly, hand-in-hand with shelter goes the provision ofadequate health care, sanitation and environmental protection services,consistent with accepted norms and capable of supporting a growing populationand a vibrant economy.
Thirdly, an essential ingredient to the long-term success of thePalestinian economic development effort will be the creation of awell-educated, technically competent and diverse labour force, with vigorousparticipation by women, former detainees and the disabled. The urgency ofproviding for appropriate technical and scientific training, retraining andre-engagement of a generation of intifada -period youth in the educationalprocess and in reconstruction cannot be overemphasised. OptimizingPalestinian society’s primary asset, namely its human resources, could well bethe sine qua non of successful passage from the legacy of strife andoccupation to an era of peace and prosperity. The detailed programmes ofassistance prepared recently by International Labour Office (ILO) andUnited Nations Education, Scientific and Cultural Organization (UNESCO) inthis domain constitute timely contributions towards enabling the Palestinianpeople to face the challenges of their economic and social development.
Notes
1/ UNCTAD, "Selected statistical series on the economy of the occupiedPalestinian territory", 1986-1987, (unpublished, 1991).
2/ See, e.g. Meron Benvenisti and Shlomo Khayat, The West Bank andGaza Atlas , Jerusalem, West Bank Data Base Project, 1988, p. 28.
3/ World Bank, World Development Report 1990 , Washington, D.C.,United States of America, August 1990, p. 191.
4/ See section 3 below.
5/ See World Bank, "World Development Report 1990", op. cit., p. 260.
- 41 -
6/ For comparison, the labour force participation rates in the mid-1980sin selected countries were: 39 per cent in Israel, 25 per cent in Syria,28 per cent in Egypt, 27 per cent in Iraq, and 43 per cent in Turkey. Thelabour force participation rate in the Arab countries ranged between25 per cent and 32 per cent. See Jordanian-Palestinian Joint Committee,Development of labour force in the occupied homeland , Research Paper No. 1,Amman 1985, p. 18 (in Arabic).
7/ Calculated from data in Ibid. p. 18.
8/ Ibid.
9/ Calculated by the author from the Statistical yearbook 1987 ,Department of Statistics, Amman, 1987.
10/ Calculated from data in Israel, CBS, Statistical abstract of Israel ,Jerusalem, CBS, 1990, p. 322 (It is not clear if these figures include orexclude members of the armed forces).
11/ For more details on the informal labour market, see chapter II.
12/ Jordanian-Palestinian Joint Committee, "Development of labour forcein the occupied homeland", op. cit., p. 24.
13/ Ibid., p. 24.
14/ Meron Benvenisti, The West Bank data base project , AmericanEnterprise Institute of Public Research, Washington and London, 1984, p. 3,and Stuart A. Gabriel, "The determinants of labour migration from theWest Bank and Gaza", (unpublished paper, Department of Economics, Ben GurionUniversity of Negev, Beer Sheva, July 1983), p. 3.
15/ Ibid., Benvenisti, p. 4.
16/ Net migration from West Bank during the period September 1967 untilthe end of 1988 reached 170,400 persons. See Israel, CBS, "Statisticalabstract ...", op. cit., p. 708.
17/ Net migration from the Gaza Strip reached 120,000 during theperiod 1968-1988, op. cit., p. 708.
18/ Abdelfattah Abu-Shokor, "Labour force external migration from theoccupied Palestinian territory", Samed Al-Iktisadi (vol. 11, January-February-March, 1989), p. 54 (in Arabic).
19/ Benvenisti, "West Bank data base ...", op. cit., p. 4.
- 42 -
20/ A. Abu-Shokor, "Labour force external migration ...", op. cit.,p. 58.
21/ Ibid., p. 58.
22/ Ibid., pp. 66-68.
23/ Labour force in Jordan 1982-1983 , Jordan, Department of Statistics,Demographic research and analysis unit, Amman: April 1987 (in Arabic), p. 93.
24/ Ibid., p. 84.
25/ Benvenisti and Khayat, The West Bank and Gaza Atlas , op. cit., p. 28.
26/ Israel, CBS, Judea, Samaria and Gaza area statistics , vol. XVIII,no. 2, Jerusalem, 1988, p. 116.
27/ Ibid.
28/ Abdelfattah Abu-Shokor, "Socio-economic conditions of the West Bankand Gaza Strip workers in Israel", Nablus, An-Najah National University,Documentation, Transcript and Publication Centre, April 1987, p. 30.
29/ Calculated from Israel, CBS, Statistical abstract of Israel ,Jerusalem, 1985, p. 323.
30/ Israel, CBS, "Statistical abstract... 1990", op. cit., p. 737.
31/ Ibid.
32/ Ibid.
33/ Israel, CBS, "Statistical abstract... 1990", op. cit ., p. 737.
34/ Calculated form Israel, CBS, Statistical abstract of Israel ,Jerusalem, various issues.
35/ Nawaf Kalaldeh, "Main characteristics and participation rate offemale labour force in Jordan", in Department of General Statistics,Demographic Research and Analysis Unit, Labour Force in Jordan , Amman:April 1987 (in Arabic), p. 261.
36/ Abdelfattah Abu-Shokor, Labour market in West Bank and Gaza Strip ,Nablus, An-Najah National University, February 1987, p. 160.
37/ Ibid., p. 105.
- 43 -
38/ Israeli Ministry of Labour and Social Affairs, Department of Interna-tional Relations, Labour and employment in Judea, Samaria and Gaza District ,Jerusalem, 1983, p. 47.
39/ A. Abu-Shokor, "Labour market...", op. cit., p. 106.
40/ Ibid., p. 109.
41/ Lloyd G. Reynolds, Labour economics and labour relations , New Jersey,1978, 7th. edition, p. 309.
42/ A. Abu-Shokor, "Labour market...", op. cit., p. 109.
43/ Institute der Deutschen Wirtschaft, Zahlen fuer wirtschaft-LichenEntwicklung der Bundesrepublik Deutschland , Koeln 1986, Tabelle 86 c. (inGerman)
44/ A. Abu-Shokor, "Socio-economic conditions...", op. cit., p. 24.
45/ The size of the labour force in the West Bank in 1987 reached177,600, in east Jerusalem 27,700 and in the Gaza Strip 100,200, Israel, CBS,Statistical Abstract of Israel , various issues.
46/ A. Abu-Shokor, "Socio-economic conditions...", op. cit., p. 109.
47/ See UNCTAD "Developments in the economy of the occupied Palestinianterritory" (TD/B/40(1)/8).
48/ UNCTAD, "Selected statistical...", op. cit.., and Israel, CBS,"Statistical abstract... 1990", op. cit., p. 755.
49/ A. Abu-Shokor, "Socio-economic conditions...", op. cit., p. 47.
50/ Ibid., p. 47.
51/ Ibid., p. 51.
52/ Israel, CBS, Judea, Samaria and Gaza Area statistics , Jerusalem,1988, p. 139.
53/ A. Abu-Shokor, "Labour market...", op. cit., p. 53.
54/ Israel, CBS, "Judea, Samaria...", op. cit., p. 217.
55/ A. Abu-Shokor, "Socio-economic conditions...", op. cit., p. 62.
56/ Ibid., p. 72.

- 44 -
57/ Ibid., p. 75.
58/ Israel Ministry of Labour and Social Affairs, "Labour andemployment..." op. cit., p. 14.
59/ A. Abu-Shokor, "Socio-economic conditions...", op. cit., p. 62.
60/ Ibid., p. 59.
61/ Ibid., p. 64.
62/ Ibid., p. 70.
63/ Ibid., p. 28 and p. 118.
64/ Ibid., p. 258.
65/ See the introduction of tables on p. 105 in Israel, CBS, "Statisticalabstract ... 1990", op. cit.
66/ Calculated from data included in ibid., p. 724.
67/ A. Abu-Shokor, "Labour market ...", op. cit., p. 96.
68/ For more details about the basis of this classification ofunemployment, see Lloyd C. Atkinson, Economics , Homewood, Illinois, 1982,pp. 107-110.
69/ A. Abu-Shokor, "Labour market ...", op. cit., p. 104.
70/ Ibid.
71/ A. Abu-Shokor, "Unemployment in the OPT from 1968-1991",United Nations Economic and Social Committee for Western Asia (ESCWA), Amman,1992, p. 36.
72/ A. Abu-Shokor, "Labour market ...", op. cit., p. 91.
73/ A. Abu-Shokor, "Unemployment ...", op. cit., p. 28.
74/ Israel, CBS, "Statistical abstract ... 1990", op. cit., p. 729.
75/ Ibid.
76/ Israel, CBS, Statistical Abstract of Israel , Jerusalem, CBS, 1991,p. 166.
- 45 -
77/ Al-Quds , Jerusalem, 4 December 1991, No. 7797 (in Arabic).
78/ Calculated from data in Israel, CBS, "Statistical abstract ... 1991",op. cit., p. 172.
79/ Ibid., p. 173.
80/ Al-Quds , Jerusalem, 4 December 1991, No. 7797 (in Arabic).
81/ Calculated from the data published in Israel, CBS, "Statisticalabstract ... 1991", pp. 351 and 330.
82/ Ibid., p. 731.
83/ Al-Fajr , Jerusalem, 26 August 1990 (in Arabic).
84/ Information obtained from the Department of Statistics, Nablus,West Bank.
85/ This section is adapted from UNCTAD reports, "Developments in theeconomy of the occupied Palestinian territory", (TD/B/40(1)/8), paras. 36-38;and (TD/B/41(1)/3), para. 34. For more information on the original sources ofdata noted here, reference may be made to these reports.
86/ "Statistical guidelines of the Palestinian universities for theacademic years 1987/1988 and 1988/1989", Jerusalem, Higher Education Council,1990, p. 15.
87/ Ibid., p. 17.
88/ Ibid., p. 34.
89/ Hassan Al-Qiq, Vocational training and education in the occupiedterritories , Jerusalem, Arab Thought Forum, 1988, p. 12 (in Arabic).
90/ Mahmoud Miari, "Vocational teaching in the occupied territories",Bir-Zeit University, Centre for the Study and Documentation of the PalestinianSociety, January 1991, p. 7.
91/ Hassan Al-Qiq, "Vocational ...", op. cit., p. 2.
92/ Ibid., p. 11.
93/ Mahmoud Miari, "Vocational ...", op. cit., p. 8.
94/ Ibid., p. 8.

- 46 -
95/ Ibid., p. 10.
96/ Ibid., p. 13.
97/ Ibid., p. 14.
98/ Ibid., p. 15.
99/ See A. Abu-Shokor, "Socio-economic conditions ...", op. cit., p. 56.
100 / "Manpower development in Jordan" (unpublished paper, Jordan Ministryof Labour), p. 15.
101 / Israel, CBS, "Statistical abstract ... 1990", op. cit., p. 755.
102 / Hassan Al-Qiq, "Vocational ...", op. cit., p. 3.
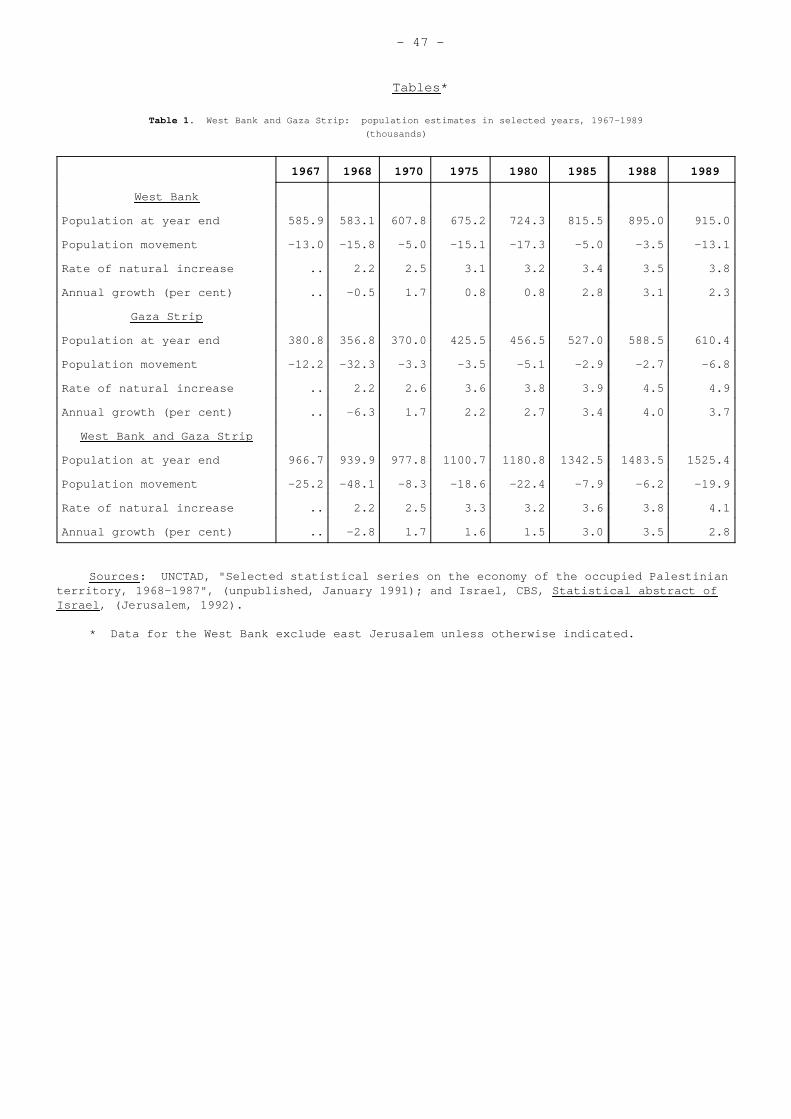
- 47 -
Tables *
Table 1. West Bank and Gaza Strip: population estimates in selected years, 1967-1989
(thousands)
1967 1968 1970 1975 1980 1985 1988 1989
West Bank
Population at year end 585.9 583.1 607.8 675.2 724.3 815.5 895.0 915.0
Population movement -13.0 -15.8 -5.0 -15.1 -17.3 -5.0 -3.5 -13.1
Rate of natural increase .. 2.2 2.5 3.1 3.2 3.4 3.5 3.8
Annual growth (per cent) .. -0.5 1.7 0.8 0.8 2.8 3.1 2.3
Gaza Strip
Population at year end 380.8 356.8 370.0 425.5 456.5 527.0 588.5 610.4
Population movement -12.2 -32.3 -3.3 -3.5 -5.1 -2.9 -2.7 -6.8
Rate of natural increase .. 2.2 2.6 3.6 3.8 3.9 4.5 4.9
Annual growth (per cent) .. -6.3 1.7 2.2 2.7 3.4 4.0 3.7
West Bank and Gaza Strip
Population at year end 966.7 939.9 977.8 1100.7 1180.8 1342.5 1483.5 1525.4
Population movement -25.2 -48.1 -8.3 -18.6 -22.4 -7.9 -6.2 -19.9
Rate of natural increase .. 2.2 2.5 3.3 3.2 3.6 3.8 4.1
Annual growth (per cent) .. -2.8 1.7 1.6 1.5 3.0 3.5 2.8
Sources : UNCTAD, "Selected statistical series on the economy of the occupied Palestinianterritory, 1968-1987", (unpublished, January 1991); and Israel, CBS, Statistical abstract ofIsrael , (Jerusalem, 1992).
* Data for the West Bank exclude east Jerusalem unless otherwise indicated.
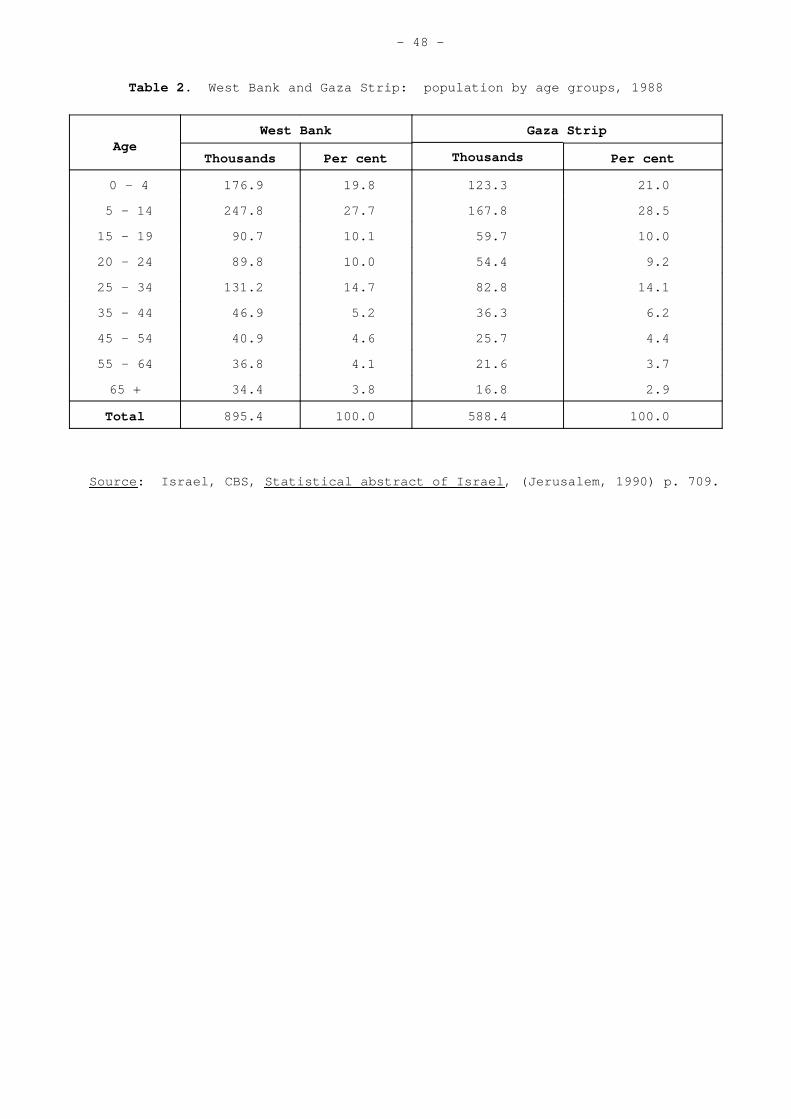
- 48 -
Table 2. West Bank and Gaza Strip: population by age groups, 1988
AgeWest Bank Gaza Strip
Thousands Per cent Thousands Per cent
0 - 4 176.9 19.8 123.3 21.0
5 - 14 247.8 27.7 167.8 28.5
15 - 19 90.7 10.1 59.7 10.0
20 - 24 89.8 10.0 54.4 9.2
25 - 34 131.2 14.7 82.8 14.1
35 - 44 46.9 5.2 36.3 6.2
45 - 54 40.9 4.6 25.7 4.4
55 - 64 36.8 4.1 21.6 3.7
65 + 34.4 3.8 16.8 2.9
Total 895.4 100.0 588.4 100.0
Source : Israel, CBS, Statistical abstract of Israel , (Jerusalem, 1990) p. 709.

- 49 -
Table 3 . West Bank: population aged 14 and over by labour force characteristics inselected years, 1968-1989
1968 1970 1975 1980 1985 1988 a/ 1989 a/
thousands
Population aged 14+ 308.6 322.9 366.9 401.0 443.8 459.1 469.5
Total labour force 93.0 118.4 133.9 136.8 159.2 188.1 189.1
Employed labour force 82.9 114.6 132.3 134.8 151.2 183.0 180.8
Unemployed labour force 10.1 3.8 1.6 2.0 8.0 5.1 8.3
Labour force employed in the WB .. 99.8 91.9 94.2 103.8 119.0 115.4
Labour force employed in Israel .. 14.7 40.4 40.6 47.5 64.0 65.4
Male labour force 79.2 94.4 109.6 111.5 137.5 163.6 168.8
Female labour force 13.8 24.0 24.3 25.3 21.7 24.5 20.3
per cent
Labour force participation rate 15.9 19.5 19.8 18.9 19.6 21.0 20.7
Crude activity rate 30.1 36.7 36.5 34.1 35.9 41.0 40.3
Male crude activity rate 56.5 61.4 61.9 57.7 63.9 73.3 73.6
Female crude activity rate 8.3 14.2 12.8 12.4 9.5 10.4 8.5
Unemployment rate 10.9 3.2 1.2 1.5 5.0 2.7 4.4
Male labour force 85.2 79.8 81.9 81.5 86.4 87.0 89.3
Female labour force 14.8 20.2 18.1 18.5 13.6 13.0 10.7
Sources : UNCTAD, "Selected statistical series on the economy of the occupiedPalestinian territory, 1968-1987", (unpublished, 1991);
Israel, CBS, Statistical abstract of Israel , (Jerusalem, 1992) p. 732.
a/ Data refer to persons aged 15 and over. The 1988 figure for populationaged 15 and over does not correspond with the total for the same age groups intable 2, owing to discrepencies between population and labour force statistics in theoriginal sources.
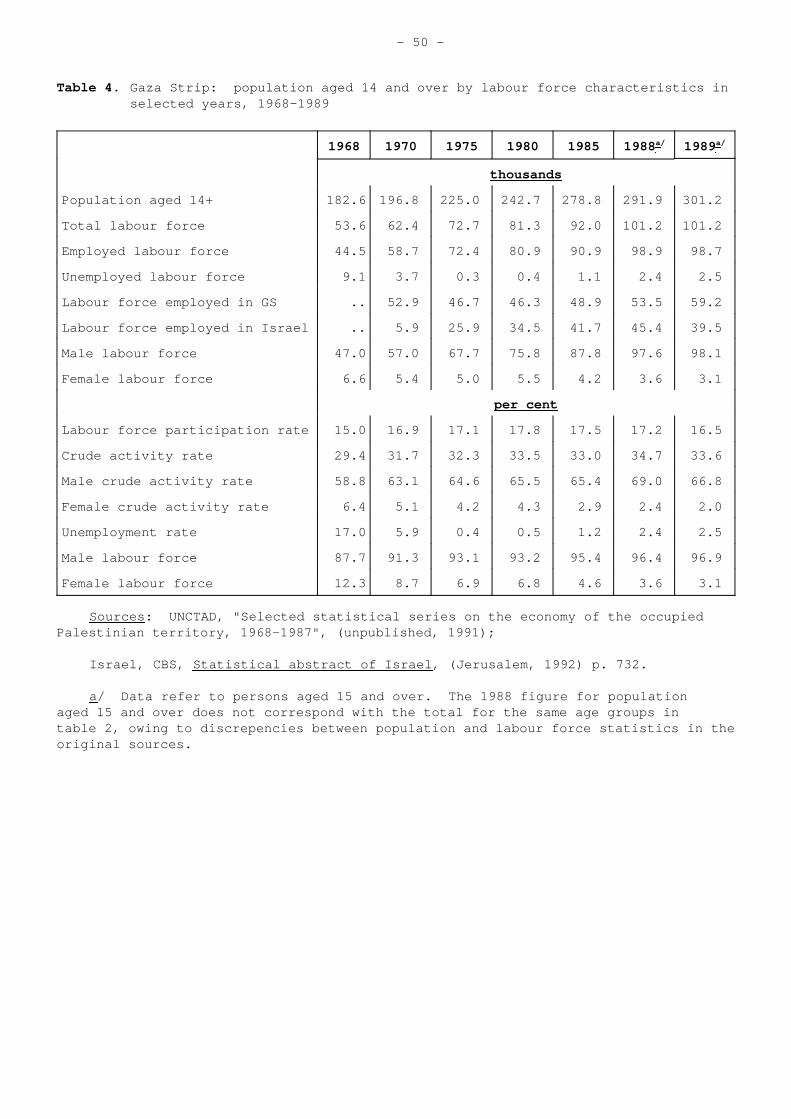
- 50 -
Table 4. Gaza Strip: population aged 14 and over by labour force characteristics inselected years, 1968-1989
1968 1970 1975 1980 1985 1988 a/ 1989 a/
thousands
Population aged 14+ 182.6 196.8 225.0 242.7 278.8 291.9 301.2
Total labour force 53.6 62.4 72.7 81.3 92.0 101.2 101.2
Employed labour force 44.5 58.7 72.4 80.9 90.9 98.9 98.7
Unemployed labour force 9.1 3.7 0.3 0.4 1.1 2.4 2.5
Labour force employed in GS .. 52.9 46.7 46.3 48.9 53.5 59.2
Labour force employed in Israel .. 5.9 25.9 34.5 41.7 45.4 39.5
Male labour force 47.0 57.0 67.7 75.8 87.8 97.6 98.1
Female labour force 6.6 5.4 5.0 5.5 4.2 3.6 3.1
per cent
Labour force participation rate 15.0 16.9 17.1 17.8 17.5 17.2 16.5
Crude activity rate 29.4 31.7 32.3 33.5 33.0 34.7 33.6
Male crude activity rate 58.8 63.1 64.6 65.5 65.4 69.0 66.8
Female crude activity rate 6.4 5.1 4.2 4.3 2.9 2.4 2.0
Unemployment rate 17.0 5.9 0.4 0.5 1.2 2.4 2.5
Male labour force 87.7 91.3 93.1 93.2 95.4 96.4 96.9
Female labour force 12.3 8.7 6.9 6.8 4.6 3.6 3.1
Sources : UNCTAD, "Selected statistical series on the economy of the occupiedPalestinian territory, 1968-1987", (unpublished, 1991);
Israel, CBS, Statistical abstract of Israel , (Jerusalem, 1992) p. 732.
a/ Data refer to persons aged 15 and over. The 1988 figure for populationaged 15 and over does not correspond with the total for the same age groups intable 2, owing to discrepencies between population and labour force statistics in theoriginal sources.
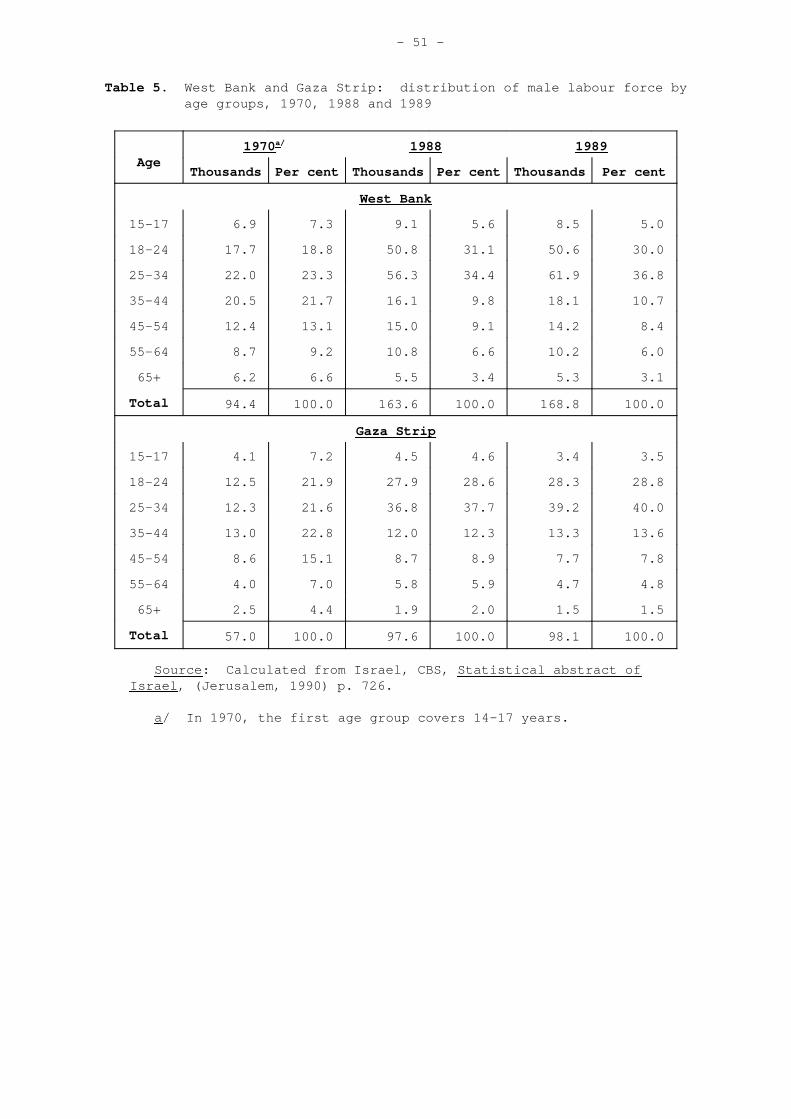
- 51 -
Table 5. West Bank and Gaza Strip: distribution of male labour force byage groups, 1970, 1988 and 1989
Age1970 a/ 1988 1989
Thousands Per cent Thousands Per cent Thousands Per cent
West Bank
15-17 6.9 7.3 9.1 5.6 8.5 5.0
18-24 17.7 18.8 50.8 31.1 50.6 30.0
25-34 22.0 23.3 56.3 34.4 61.9 36.8
35-44 20.5 21.7 16.1 9.8 18.1 10.7
45-54 12.4 13.1 15.0 9.1 14.2 8.4
55-64 8.7 9.2 10.8 6.6 10.2 6.0
65+ 6.2 6.6 5.5 3.4 5.3 3.1
Total 94.4 100.0 163.6 100.0 168.8 100.0
Gaza Strip
15-17 4.1 7.2 4.5 4.6 3.4 3.5
18-24 12.5 21.9 27.9 28.6 28.3 28.8
25-34 12.3 21.6 36.8 37.7 39.2 40.0
35-44 13.0 22.8 12.0 12.3 13.3 13.6
45-54 8.6 15.1 8.7 8.9 7.7 7.8
55-64 4.0 7.0 5.8 5.9 4.7 4.8
65+ 2.5 4.4 1.9 2.0 1.5 1.5
Total 57.0 100.0 97.6 100.0 98.1 100.0
Source : Calculated from Israel, CBS, Statistical abstract ofIsrael , (Jerusalem, 1990) p. 726.
a/ In 1970, the first age group covers 14-17 years.
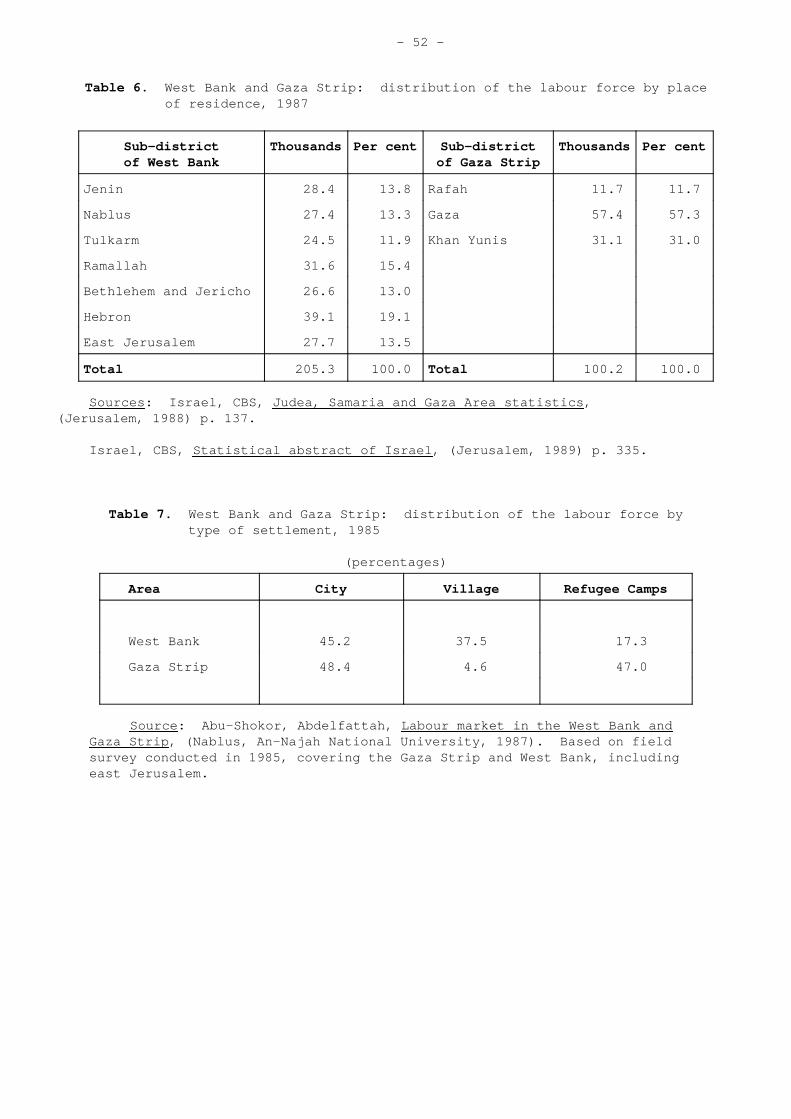
- 52 -
Table 6. West Bank and Gaza Strip: distribution of the labour force by placeof residence, 1987
Sub-districtof West Bank
Thousands Per cent Sub-districtof Gaza Strip
Thousands Per cent
Jenin 28.4 13.8 Rafah 11.7 11.7
Nablus 27.4 13.3 Gaza 57.4 57.3
Tulkarm 24.5 11.9 Khan Yunis 31.1 31.0
Ramallah 31.6 15.4
Bethlehem and Jericho 26.6 13.0
Hebron 39.1 19.1
East Jerusalem 27.7 13.5
Total 205.3 100.0 Total 100.2 100.0
Sources : Israel, CBS, Judea, Samaria and Gaza Area statistics ,(Jerusalem, 1988) p. 137.
Israel, CBS, Statistical abstract of Israel , (Jerusalem, 1989) p. 335.
Table 7. West Bank and Gaza Strip: distribution of the labour force bytype of settlement, 1985
(percentages)
Area City Village Refugee Camps
West Bank 45.2 37.5 17.3
Gaza Strip 48.4 4.6 47.0
Source : Abu-Shokor, Abdelfattah, Labour market in the West Bank andGaza Strip , (Nablus, An-Najah National University, 1987). Based on fieldsurvey conducted in 1985, covering the Gaza Strip and West Bank, includingeast Jerusalem.
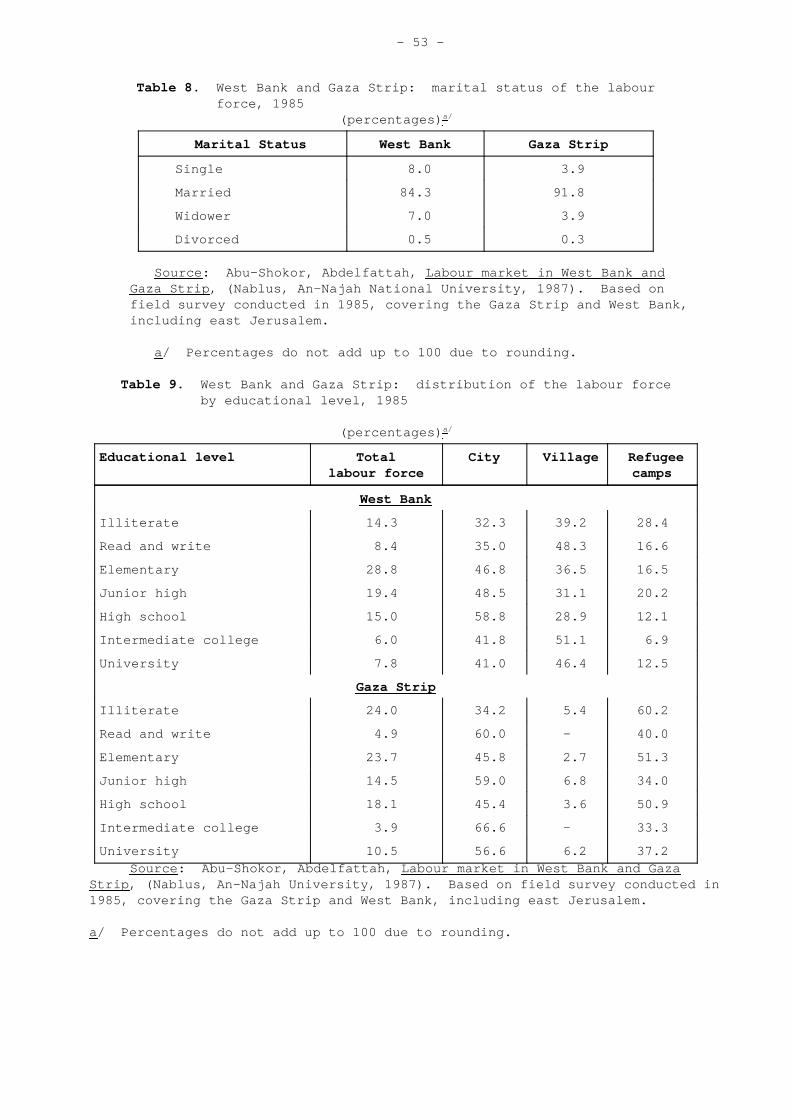
- 53 -
Table 8. West Bank and Gaza Strip: marital status of the labourforce, 1985
(percentages) a/
Marital Status West Bank Gaza Strip
Single 8.0 3.9
Married 84.3 91.8
Widower 7.0 3.9
Divorced 0.5 0.3
Source : Abu-Shokor, Abdelfattah, Labour market in West Bank andGaza Strip , (Nablus, An-Najah National University, 1987). Based onfield survey conducted in 1985, covering the Gaza Strip and West Bank,including east Jerusalem.
a/ Percentages do not add up to 100 due to rounding.
Table 9. West Bank and Gaza Strip: distribution of the labour forceby educational level, 1985
(percentages) a/
Educational level Totallabour force
City Village Refugeecamps
West Bank
Illiterate 14.3 32.3 39.2 28.4
Read and write 8.4 35.0 48.3 16.6
Elementary 28.8 46.8 36.5 16.5
Junior high 19.4 48.5 31.1 20.2
High school 15.0 58.8 28.9 12.1
Intermediate college 6.0 41.8 51.1 6.9
University 7.8 41.0 46.4 12.5
Gaza Strip
Illiterate 24.0 34.2 5.4 60.2
Read and write 4.9 60.0 - 40.0
Elementary 23.7 45.8 2.7 51.3
Junior high 14.5 59.0 6.8 34.0
High school 18.1 45.4 3.6 50.9
Intermediate college 3.9 66.6 - 33.3
University 10.5 56.6 6.2 37.2Source : Abu-Shokor, Abdelfattah, Labour market in West Bank and Gaza
Strip , (Nablus, An-Najah University, 1987). Based on field survey conducted in1985, covering the Gaza Strip and West Bank, including east Jerusalem.
a/ Percentages do not add up to 100 due to rounding.
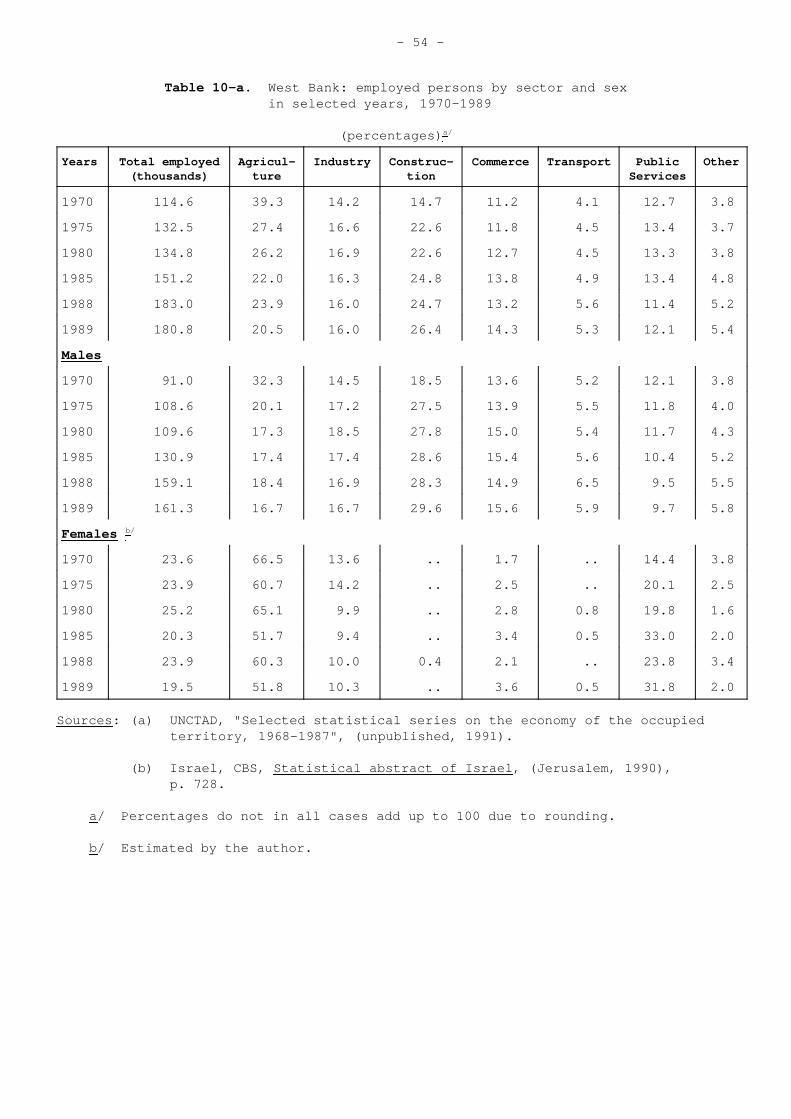
- 54 -
Table 10-a. West Bank: employed persons by sector and sexin selected years, 1970-1989
(percentages) a/
Years Total employed(thousands)
Agricul-ture
Industry Construc-tion
Commerce Transport PublicServices
Other
1970 114.6 39.3 14.2 14.7 11.2 4.1 12.7 3.8
1975 132.5 27.4 16.6 22.6 11.8 4.5 13.4 3.7
1980 134.8 26.2 16.9 22.6 12.7 4.5 13.3 3.8
1985 151.2 22.0 16.3 24.8 13.8 4.9 13.4 4.8
1988 183.0 23.9 16.0 24.7 13.2 5.6 11.4 5.2
1989 180.8 20.5 16.0 26.4 14.3 5.3 12.1 5.4
Males
1970 91.0 32.3 14.5 18.5 13.6 5.2 12.1 3.8
1975 108.6 20.1 17.2 27.5 13.9 5.5 11.8 4.0
1980 109.6 17.3 18.5 27.8 15.0 5.4 11.7 4.3
1985 130.9 17.4 17.4 28.6 15.4 5.6 10.4 5.2
1988 159.1 18.4 16.9 28.3 14.9 6.5 9.5 5.5
1989 161.3 16.7 16.7 29.6 15.6 5.9 9.7 5.8
Females b/
1970 23.6 66.5 13.6 .. 1.7 .. 14.4 3.8
1975 23.9 60.7 14.2 .. 2.5 .. 20.1 2.5
1980 25.2 65.1 9.9 .. 2.8 0.8 19.8 1.6
1985 20.3 51.7 9.4 .. 3.4 0.5 33.0 2.0
1988 23.9 60.3 10.0 0.4 2.1 .. 23.8 3.4
1989 19.5 51.8 10.3 .. 3.6 0.5 31.8 2.0
Sources : (a) UNCTAD, "Selected statistical series on the economy of the occupiedterritory, 1968-1987", (unpublished, 1991).
(b) Israel, CBS, Statistical abstract of Israel , (Jerusalem, 1990),p. 728.
a/ Percentages do not in all cases add up to 100 due to rounding.
b/ Estimated by the author.
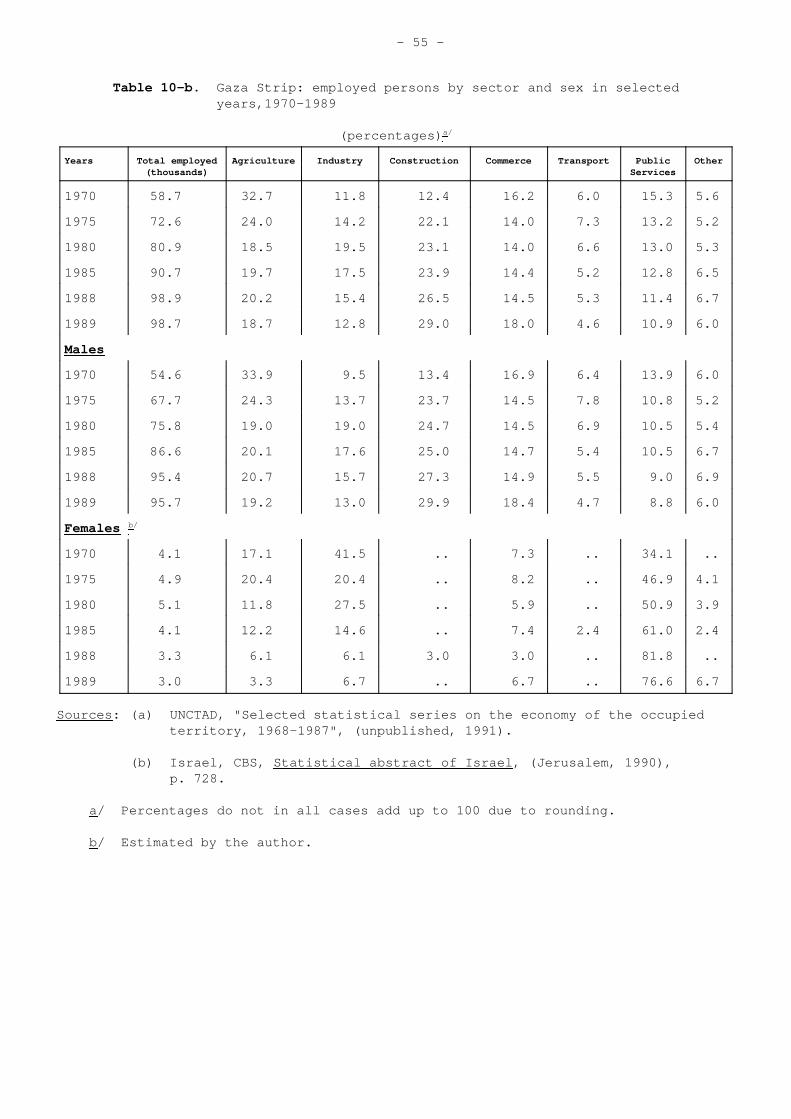
- 55 -
Table 10-b. Gaza Strip: employed persons by sector and sex in selectedyears,1970-1989
(percentages) a/
Years Total employed(thousands)
Agriculture Industry Construction Commerce Transport PublicServices
Other
1970 58.7 32.7 11.8 12.4 16.2 6.0 15.3 5.6
1975 72.6 24.0 14.2 22.1 14.0 7.3 13.2 5.2
1980 80.9 18.5 19.5 23.1 14.0 6.6 13.0 5.3
1985 90.7 19.7 17.5 23.9 14.4 5.2 12.8 6.5
1988 98.9 20.2 15.4 26.5 14.5 5.3 11.4 6.7
1989 98.7 18.7 12.8 29.0 18.0 4.6 10.9 6.0
Males
1970 54.6 33.9 9.5 13.4 16.9 6.4 13.9 6.0
1975 67.7 24.3 13.7 23.7 14.5 7.8 10.8 5.2
1980 75.8 19.0 19.0 24.7 14.5 6.9 10.5 5.4
1985 86.6 20.1 17.6 25.0 14.7 5.4 10.5 6.7
1988 95.4 20.7 15.7 27.3 14.9 5.5 9.0 6.9
1989 95.7 19.2 13.0 29.9 18.4 4.7 8.8 6.0
Females b/
1970 4.1 17.1 41.5 .. 7.3 .. 34.1 ..
1975 4.9 20.4 20.4 .. 8.2 .. 46.9 4.1
1980 5.1 11.8 27.5 .. 5.9 .. 50.9 3.9
1985 4.1 12.2 14.6 .. 7.4 2.4 61.0 2.4
1988 3.3 6.1 6.1 3.0 3.0 .. 81.8 ..
1989 3.0 3.3 6.7 .. 6.7 .. 76.6 6.7
Sources : (a) UNCTAD, "Selected statistical series on the economy of the occupiedterritory, 1968-1987", (unpublished, 1991).
(b) Israel, CBS, Statistical abstract of Israel , (Jerusalem, 1990),p. 728.
a/ Percentages do not in all cases add up to 100 due to rounding.
b/ Estimated by the author.
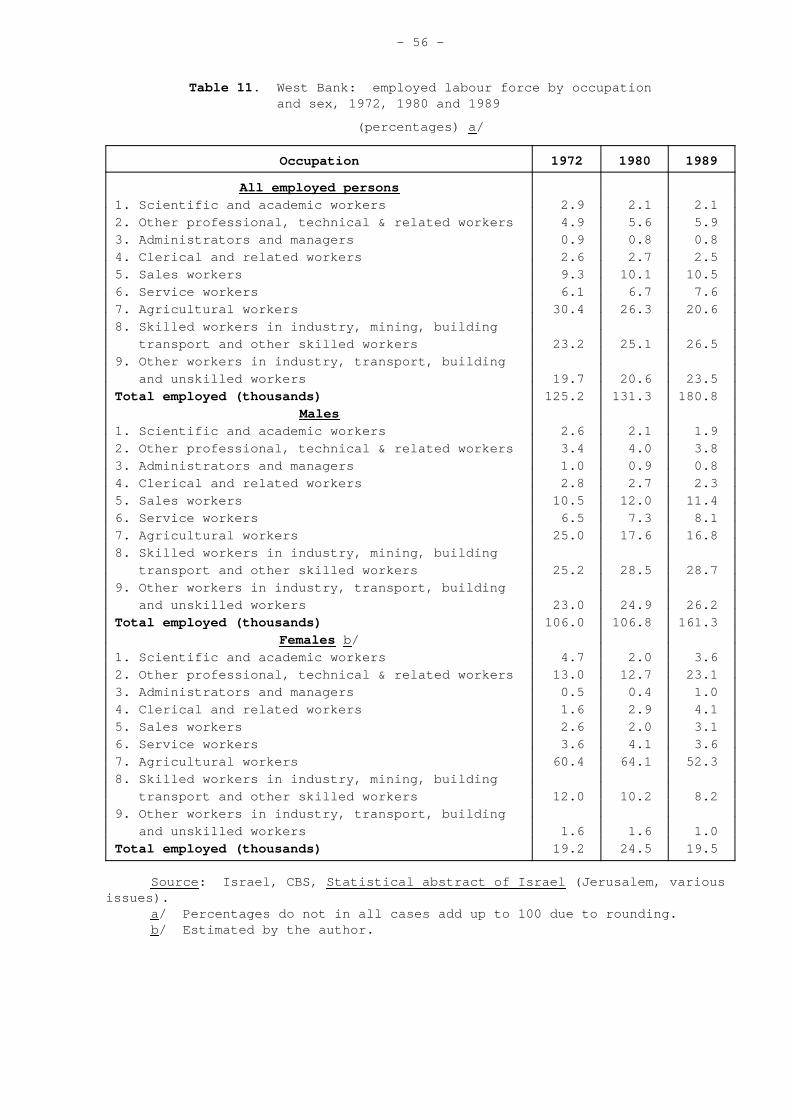
- 56 -
Table 11. West Bank: employed labour force by occupationand sex, 1972, 1980 and 1989
(percentages) a /
Occupation 1972 1980 1989
All employed persons1. Scientific and academic workers 2.9 2.1 2.12. Other professional, technical & related workers 4.9 5.6 5.93. Administrators and managers 0.9 0.8 0.84. Clerical and related workers 2.6 2.7 2.55. Sales workers 9.3 10.1 10.56. Service workers 6.1 6.7 7.67. Agricultural workers 30.4 26.3 20.68. Skilled workers in industry, mining, building
transport and other skilled workers 23.2 25.1 26.59. Other workers in industry, transport, building
and unskilled workers 19.7 20.6 23.5Total employed (thousands) 125.2 131.3 180.8
Males1. Scientific and academic workers 2.6 2.1 1.92. Other professional, technical & related workers 3.4 4.0 3.83. Administrators and managers 1.0 0.9 0.84. Clerical and related workers 2.8 2.7 2.35. Sales workers 10.5 12.0 11.46. Service workers 6.5 7.3 8.17. Agricultural workers 25.0 17.6 16.88. Skilled workers in industry, mining, building
transport and other skilled workers 25.2 28.5 28.79. Other workers in industry, transport, building
and unskilled workers 23.0 24.9 26.2Total employed (thousands) 106.0 106.8 161.3
Females b/1. Scientific and academic workers 4.7 2.0 3.62. Other professional, technical & related workers 13.0 12.7 23.13. Administrators and managers 0.5 0.4 1.04. Clerical and related workers 1.6 2.9 4.15. Sales workers 2.6 2.0 3.16. Service workers 3.6 4.1 3.67. Agricultural workers 60.4 64.1 52.38. Skilled workers in industry, mining, building
transport and other skilled workers 12.0 10.2 8.29. Other workers in industry, transport, building
and unskilled workers 1.6 1.6 1.0Total employed (thousands) 19.2 24.5 19.5
Source : Israel, CBS, Statistical abstract of Israel (Jerusalem, variousissues).
a/ Percentages do not in all cases add up to 100 due to rounding.b/ Estimated by the author.
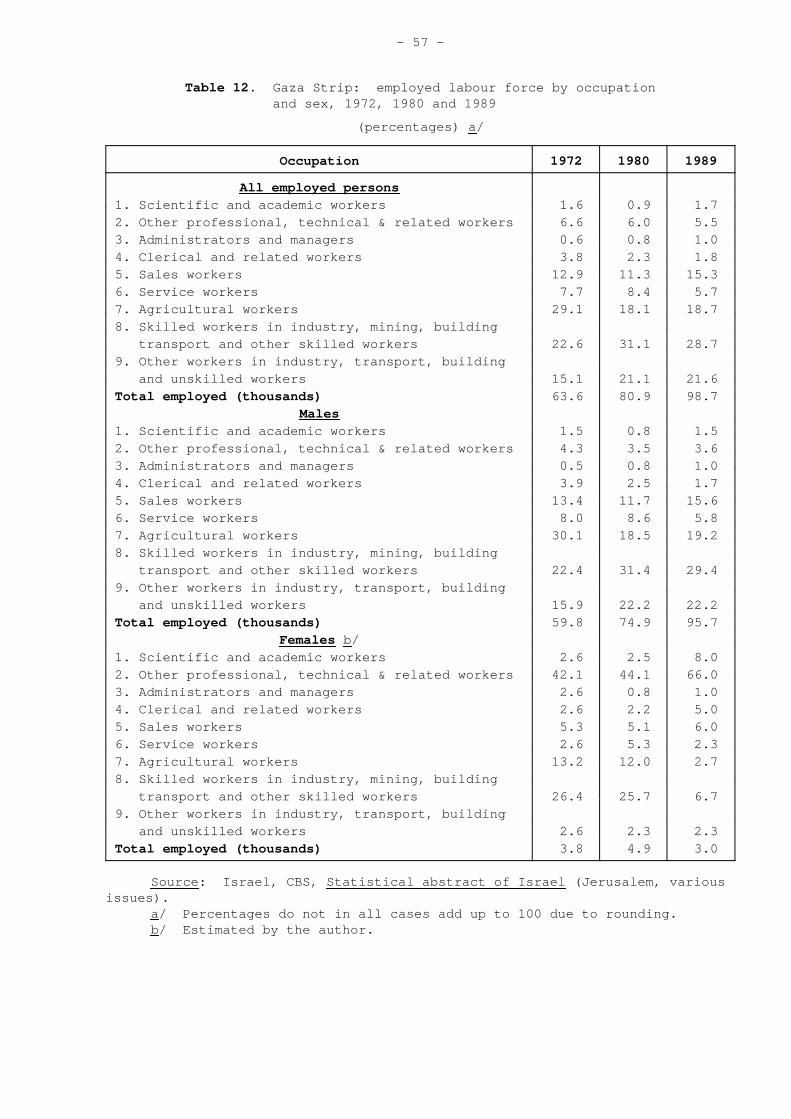
- 57 -
Table 12. Gaza Strip: employed labour force by occupationand sex, 1972, 1980 and 1989
(percentages) a /
Occupation 1972 1980 1989
All employed persons1. Scientific and academic workers 1.6 0.9 1.72. Other professional, technical & related workers 6.6 6.0 5.53. Administrators and managers 0.6 0.8 1.04. Clerical and related workers 3.8 2.3 1.85. Sales workers 12.9 11.3 15.36. Service workers 7.7 8.4 5.77. Agricultural workers 29.1 18.1 18.78. Skilled workers in industry, mining, building
transport and other skilled workers 22.6 31.1 28.79. Other workers in industry, transport, building
and unskilled workers 15.1 21.1 21.6Total employed (thousands) 63.6 80.9 98.7
Males1. Scientific and academic workers 1.5 0.8 1.52. Other professional, technical & related workers 4.3 3.5 3.63. Administrators and managers 0.5 0.8 1.04. Clerical and related workers 3.9 2.5 1.75. Sales workers 13.4 11.7 15.66. Service workers 8.0 8.6 5.87. Agricultural workers 30.1 18.5 19.28. Skilled workers in industry, mining, building
transport and other skilled workers 22.4 31.4 29.49. Other workers in industry, transport, building
and unskilled workers 15.9 22.2 22.2Total employed (thousands) 59.8 74.9 95.7
Females b/1. Scientific and academic workers 2.6 2.5 8.02. Other professional, technical & related workers 42.1 44.1 66.03. Administrators and managers 2.6 0.8 1.04. Clerical and related workers 2.6 2.2 5.05. Sales workers 5.3 5.1 6.06. Service workers 2.6 5.3 2.37. Agricultural workers 13.2 12.0 2.78. Skilled workers in industry, mining, building
transport and other skilled workers 26.4 25.7 6.79. Other workers in industry, transport, building
and unskilled workers 2.6 2.3 2.3Total employed (thousands) 3.8 4.9 3.0
Source : Israel, CBS, Statistical abstract of Israel (Jerusalem, variousissues).
a/ Percentages do not in all cases add up to 100 due to rounding.b/ Estimated by the author.

- 58 -
Table 13. West Bank and Gaza Strip: employment status of thePalestinian labour force in selected years, 1970-1989
Employmentstatus
1970 1975 1980 1985 1989
Thousands Percent
Thousands Percent
Thousands Percent
Thousands Percent
Thousands Percent
West Bank
Employees 56.5 49.3 76.6 57.8 78.2 58.0 91.8 60.7 110.5 61.1
Employers/ 58.1 50.7 55.9 42.2 56.6 42.0 59.4 39.3 70.3 38.9
Self-emp.
Total 114.6 100.0 132.5 100.0 134.8 100.0 151.2 100.0 180.8 100.0
Gaza Strip
Employees 35.2 60.0 49.3 67.9 52.3 64.6 61.7 68.0 61.2 62.0
Employers/ 23.5 40.0 23.3 32.1 28.6 35.4 29.0 32.0 37.5 38.0
Self-emp.
Total 58.7 100.0 72.6 100.0 80.9 100.0 90.7 100.0 98.7 100.0
Sources : Israel, CBS, Statistical abstract of Israel , (Jerusalem, 1986and 1990) p. 707 and p. 731.
Table 14. West Bank and Gaza Strip: employment statusof labour force by employers, 1985
(percentages) a /
Employers sector West Bank Gaza Strip
Public sector 22.6 24.6
Private sector 26.0 18.0
UNRWA 6.4 11.3
Daily workers 44.9 46.0
Source : A. Abu-Shokor, Abdelfattah, Labour market in West Bankand Gaza Strip , (Nablus, An-Najah National University, 1987) p. 31.Based on field survey conducted in 1985, covering the Gaza Stripand West Bank, including east Jerusalem.
a/ Percentages do not add up to 100 due to rounding.

- 59 -
Table 15. West Bank and Gaza Strip: average daily wage peremployee by sector in selected years, 1970-1989
(US dollars) a /
Sectors 1970 1975 1980 1985 1989
West Bank
1. Agriculture, forestry and fishing 1.7 5.0 5.1 5.7 14.5
2. Industry, mining and manufacturing 2.0 5.3 5.8 7.2 14.1
3. Construction, building andpublic works
2.9 7.2 7.6 8.5 19.6
4. Commerce, restaurants and hotels 1.7 5.0 5.9 7.7 15.6
5. Transport, storage and communication 2.3 5.3 5.7 8.6 13.8
6. Public and community services 2.3 5.9 6.4 8.7 12.4
7. Other 1.7 4.6 5.0 6.1 12.2
All sectors - average b/ 2.3 6.5 6.1 7.9 15.8
Gaza Strip
1. Agriculture, forestry and fishing 1.7 4.4 5.7 5.9 17.7
2. Industry, mining and manufacturing 1.4 5.6 6.3 6.6 18.1
3. Construction, building andpublic works
2.0 6.9 8.2 7.7 21.2
4. Commerce, restaurants and hotels 1.1 5.5 6.7 6.8 19.2
5. Transport, storage and communication 1.7 5.5 6.8 7.8 17.1
6. Public and community services 2.3 6.7 6.8 9.9 15.6
7. Other 1.1 4.6 5.7 5.5 18.6
All sectors - average b/ 2.0 5.9 6.9 7.5 18.5
Source : Israel, CBS, Statistical abstract of Israel (Jerusalem, variousissues).
a/ Converted into US dollars according to the following average exchangerates:
1970 US dollar = 3.5 Israeli pounds1975 US dollar = 0.6555 Israeli shekels = 6.5 Israeli pounds1980 US dollar = 5.6422 Israeli shekels = 56.4 Israeli pounds1985 US dollar = 1.2764 New Israeli shekels = 127.6 Israeli shekels1989 US dollar = 1.9182 New Israeli shekels = 191.8 Israeli shekels.
b/ The average for all sectors is not the arithmetic mean of thesectoral averages.
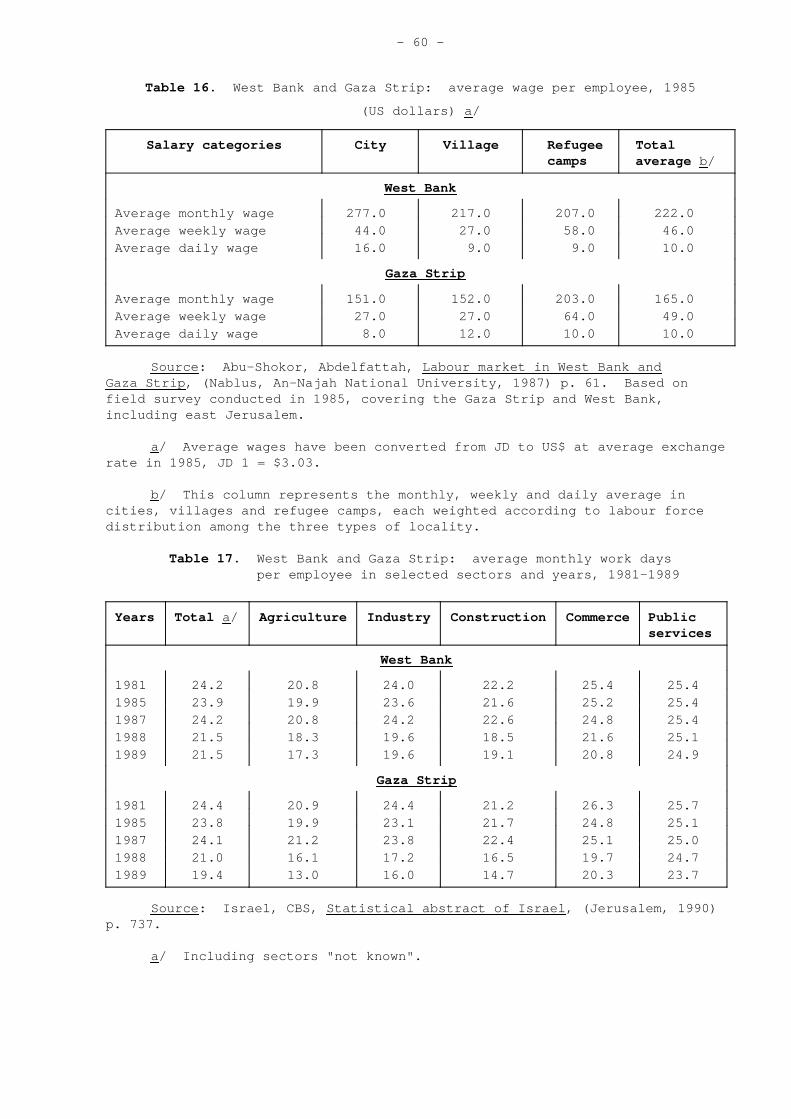
- 60 -
Table 16. West Bank and Gaza Strip: average wage per employee, 1985
(US dollars) a /
Salary categories City Village Refugeecamps
Totalaverage b/
West Bank
Average monthly wage 277.0 217.0 207.0 222.0Average weekly wage 44.0 27.0 58.0 46.0Average daily wage 16.0 9.0 9.0 10.0
Gaza Strip
Average monthly wage 151.0 152.0 203.0 165.0Average weekly wage 27.0 27.0 64.0 49.0Average daily wage 8.0 12.0 10.0 10.0
Source : Abu-Shokor, Abdelfattah, Labour market in West Bank andGaza Strip , (Nablus, An-Najah National University, 1987) p. 61. Based onfield survey conducted in 1985, covering the Gaza Strip and West Bank,including east Jerusalem.
a/ Average wages have been converted from JD to US$ at average exchangerate in 1985, J D 1 = $3.03.
b/ This column represents the monthly, weekly and daily average incities, villages and refugee camps, each weighted according to labour forcedistribution among the three types of locality.
Table 17. West Bank and Gaza Strip: average monthly work daysper employee in selected sectors and years, 1981-1989
Years Total a/ Agriculture Industry Construction Commerce Publicservices
West Bank
1981 24.2 20.8 24.0 22.2 25.4 25.41985 23.9 19.9 23.6 21.6 25.2 25.41987 24.2 20.8 24.2 22.6 24.8 25.41988 21.5 18.3 19.6 18.5 21.6 25.11989 21.5 17.3 19.6 19.1 20.8 24.9
Gaza Strip
1981 24.4 20.9 24.4 21.2 26.3 25.71985 23.8 19.9 23.1 21.7 24.8 25.11987 24.1 21.2 23.8 22.4 25.1 25.01988 21.0 16.1 17.2 16.5 19.7 24.71989 19.4 13.0 16.0 14.7 20.3 23.7
Source : Israel, CBS, Statistical abstract of Israel , (Jerusalem, 1990)p. 737.
a/ Including sectors "not known".
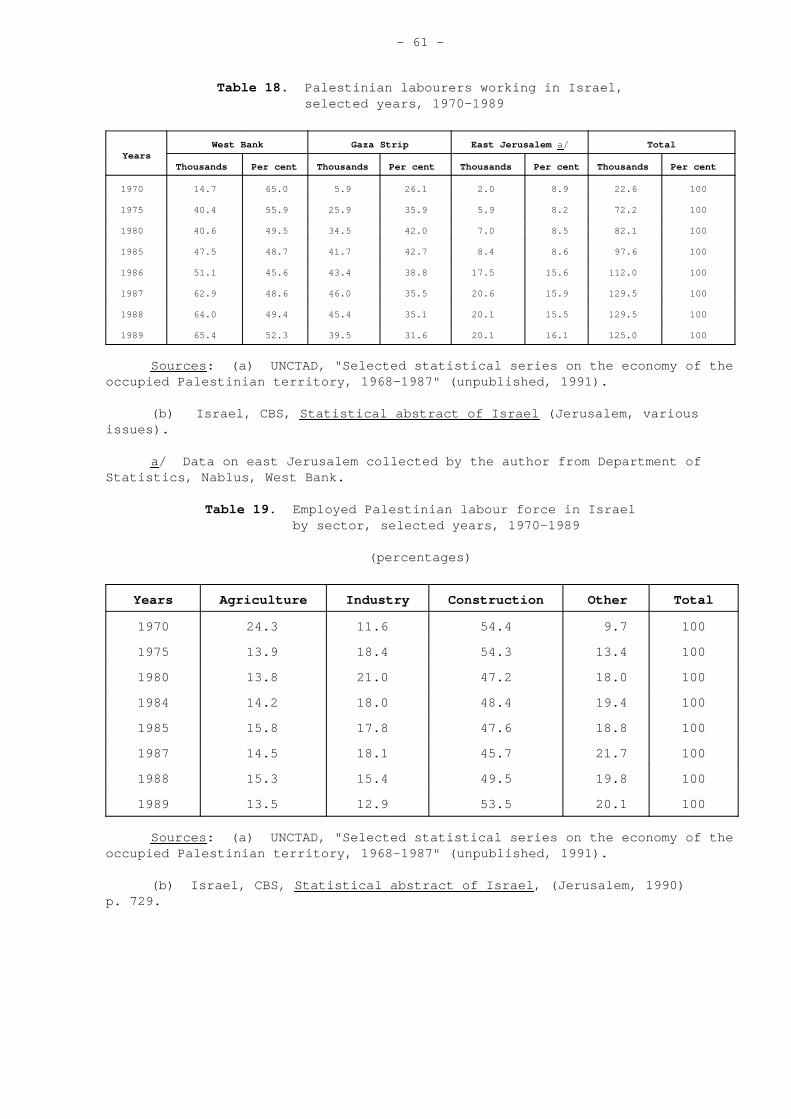
- 61 -
Table 18. Palestinian labourers working in Israel,selected years, 1970-1989
YearsWest Bank Gaza Strip East Jerusalem a/ Total
Thousands Per cent Thousands Per cent Thousands Per cent Thousands Per cent
1970 14.7 65.0 5.9 26.1 2.0 8.9 22.6 100
1975 40.4 55.9 25.9 35.9 5.9 8.2 72.2 100
1980 40.6 49.5 34.5 42.0 7.0 8.5 82.1 100
1985 47.5 48.7 41.7 42.7 8.4 8.6 97.6 100
1986 51.1 45.6 43.4 38.8 17.5 15.6 112.0 100
1987 62.9 48.6 46.0 35.5 20.6 15.9 129.5 100
1988 64.0 49.4 45.4 35.1 20.1 15.5 129.5 100
1989 65.4 52.3 39.5 31.6 20.1 16.1 125.0 100
Sources : (a) UNCTAD, "Selected statistical series on the economy of theoccupied Palestinian territory, 1968-1987" (unpublished, 1991).
(b) Israel, CBS, Statistical abstract of Israel (Jerusalem, variousissues).
a/ Data on east Jerusalem collected by the author from Department ofStatistics, Nablus, West Bank.
Table 19. Employed Palestinian labour force in Israelby sector, selected years, 1970-1989
(percentages)
Years Agriculture Industry Construction Other Total
1970 24.3 11.6 54.4 9.7 100
1975 13.9 18.4 54.3 13.4 100
1980 13.8 21.0 47.2 18.0 100
1984 14.2 18.0 48.4 19.4 100
1985 15.8 17.8 47.6 18.8 100
1987 14.5 18.1 45.7 21.7 100
1988 15.3 15.4 49.5 19.8 100
1989 13.5 12.9 53.5 20.1 100
Sources : (a) UNCTAD, "Selected statistical series on the economy of theoccupied Palestinian territory, 1968-1987" (unpublished, 1991).
(b) Israel, CBS, Statistical abstract of Israel , (Jerusalem, 1990)p. 729.
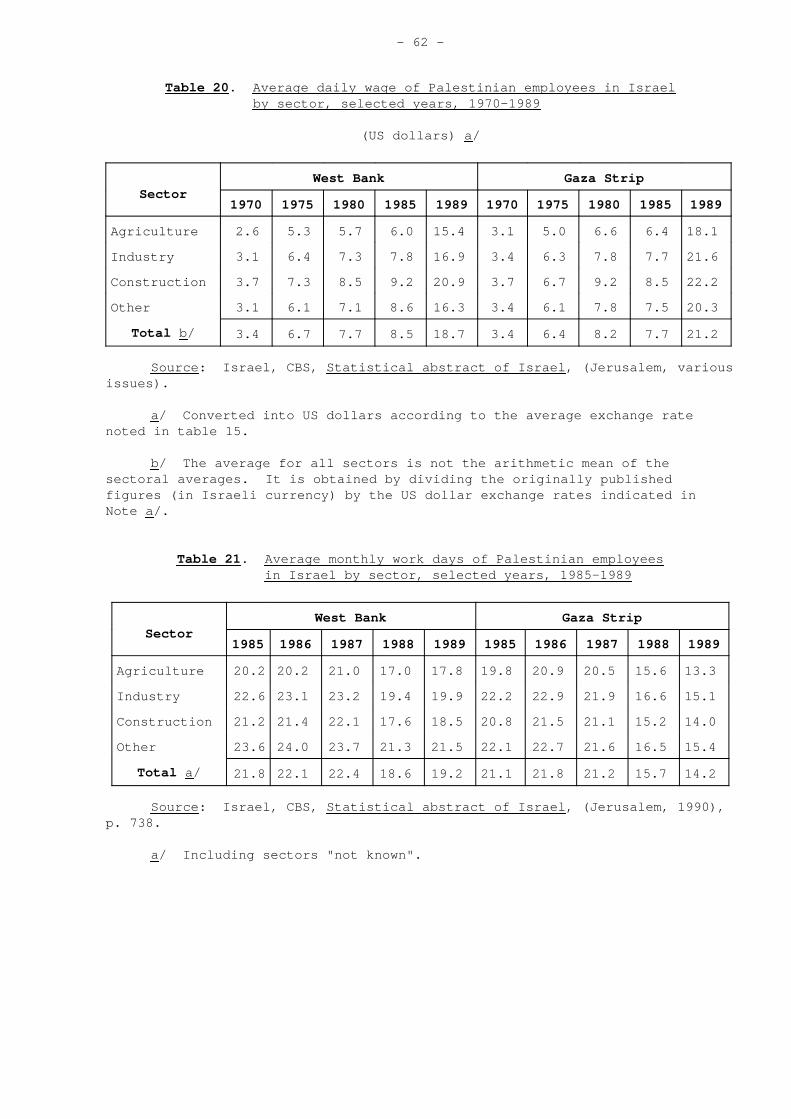
- 62 -
Table 20 . Average daily wage of Palestinian employees in Israelby sector, selected years, 1970-1989
(US dollars) a /
SectorWest Bank Gaza Strip
1970 1975 1980 1985 1989 1970 1975 1980 1985 1989
Agriculture 2.6 5.3 5.7 6.0 15.4 3.1 5.0 6.6 6.4 18.1
Industry 3.1 6.4 7.3 7.8 16.9 3.4 6.3 7.8 7.7 21.6
Construction 3.7 7.3 8.5 9.2 20.9 3.7 6.7 9.2 8.5 22.2
Other 3.1 6.1 7.1 8.6 16.3 3.4 6.1 7.8 7.5 20.3
Total b/ 3.4 6.7 7.7 8.5 18.7 3.4 6.4 8.2 7.7 21.2
Source : Israel, CBS, Statistical abstract of Israel , (Jerusalem, variousissues).
a/ Converted into US dollars according to the average exchange ratenoted in table 15.
b/ The average for all sectors is not the arithmetic mean of thesectoral averages. It is obtained by dividing the originally publishedfigures (in Israeli currency) by the US dollar exchange rates indicated inNote a /.
Table 21 . Average monthly work days of Palestinian employeesin Israel by sector, selected years, 1985-1989
SectorWest Bank Gaza Strip
1985 1986 1987 1988 1989 1985 1986 1987 1988 1989
Agriculture 20.2 20.2 21.0 17.0 17.8 19.8 20.9 20.5 15.6 13.3
Industry 22.6 23.1 23.2 19.4 19.9 22.2 22.9 21.9 16.6 15.1
Construction 21.2 21.4 22.1 17.6 18.5 20.8 21.5 21.1 15.2 14.0
Other 23.6 24.0 23.7 21.3 21.5 22.1 22.7 21.6 16.5 15.4
Total a/ 21.8 22.1 22.4 18.6 19.2 21.1 21.8 21.2 15.7 14.2
Source : Israel, CBS, Statistical abstract of Israel , (Jerusalem, 1990),p. 738.
a/ Including sectors "not known".
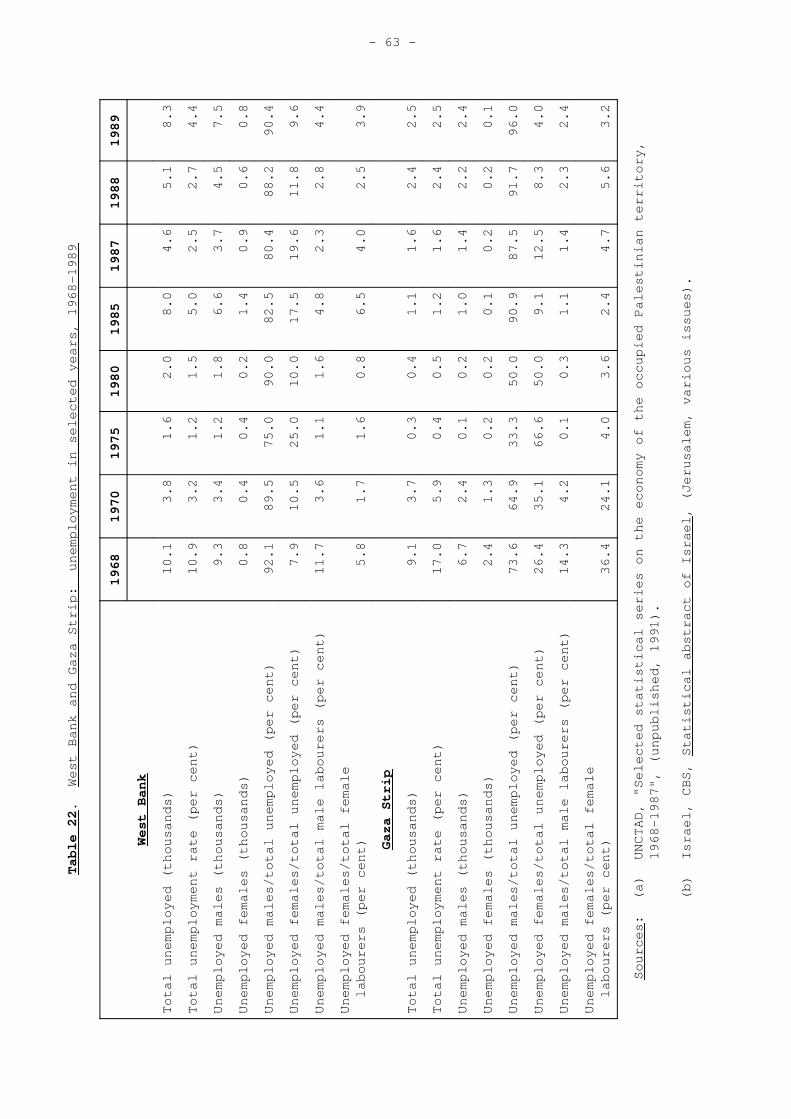
- 63 -
Ta
ble
22
.W
est
Ba
nk
an
dG
aza
Str
ip:
un
em
plo
yme
nt
inse
lect
ed
yea
rs,
19
68
-19
89
19
68
19
70
19
75
19
80
19
85
19
87
19
88
19
89
We
stB
an
k
To
tal
un
em
plo
yed
(th
ou
san
ds)
10
.13
.81
.62
.08
.04
.65
.18
.3
To
tal
un
em
plo
yme
nt
rate
(pe
rce
nt)
10
.93
.21
.21
.55
.02
.52
.74
.4
Un
em
plo
yed
ma
les
(th
ou
san
ds)
9.3
3.4
1.2
1.8
6.6
3.7
4.5
7.5
Un
em
plo
yed
fem
ale
s(t
ho
usa
nd
s)0
.80
.40
.40
.21
.40
.90
.60
.8
Un
em
plo
yed
ma
les/
tota
lu
ne
mp
loye
d(p
er
cen
t)9
2.1
89
.57
5.0
90
.08
2.5
80
.48
8.2
90
.4
Un
em
plo
yed
fem
ale
s/to
tal
un
em
plo
yed
(pe
rce
nt)
7.9
10
.52
5.0
10
.01
7.5
19
.61
1.8
9.6
Un
em
plo
yed
ma
les/
tota
lm
ale
lab
ou
rers
(pe
rce
nt)
11
.73
.61
.11
.64
.82
.32
.84
.4
Un
em
plo
yed
fem
ale
s/to
tal
fem
ale
lab
ou
rers
(pe
rce
nt)
5.8
1.7
1.6
0.8
6.5
4.0
2.5
3.9
Ga
zaS
trip
To
tal
un
em
plo
yed
(th
ou
san
ds)
9.1
3.7
0.3
0.4
1.1
1.6
2.4
2.5
To
tal
un
em
plo
yme
nt
rate
(pe
rce
nt)
17
.05
.90
.40
.51
.21
.62
.42
.5
Un
em
plo
yed
ma
les
(th
ou
san
ds)
6.7
2.4
0.1
0.2
1.0
1.4
2.2
2.4
Un
em
plo
yed
fem
ale
s(t
ho
usa
nd
s)2
.41
.30
.20
.20
.10
.20
.20
.1
Un
em
plo
yed
ma
les/
tota
lu
ne
mp
loye
d(p
er
cen
t)7
3.6
64
.93
3.3
50
.09
0.9
87
.59
1.7
96
.0
Un
em
plo
yed
fem
ale
s/to
tal
un
em
plo
yed
(pe
rce
nt)
26
.43
5.1
66
.65
0.0
9.1
12
.58
.34
.0
Un
em
plo
yed
ma
les/
tota
lm
ale
lab
ou
rers
(pe
rce
nt)
14
.34
.20
.10
.31
.11
.42
.32
.4
Un
em
plo
yed
fem
ale
s/to
tal
fem
ale
lab
ou
rers
(pe
rce
nt)
36
.42
4.1
4.0
3.6
2.4
4.7
5.6
3.2
So
urc
es
:(a
)U
NC
TA
D,
"Se
lect
ed
sta
tistic
al
serie
so
nth
ee
con
om
yo
fth
eo
ccu
pie
dP
ale
stin
ian
terr
itory
,1
96
8-1
98
7",
(un
pu
blis
he
d,
19
91
).
(b)
Isra
el,
CB
S,
Sta
tistic
al
ab
stra
cto
fIs
rae
l,
(Je
rusa
lem
,va
rio
us
issu
es)
.
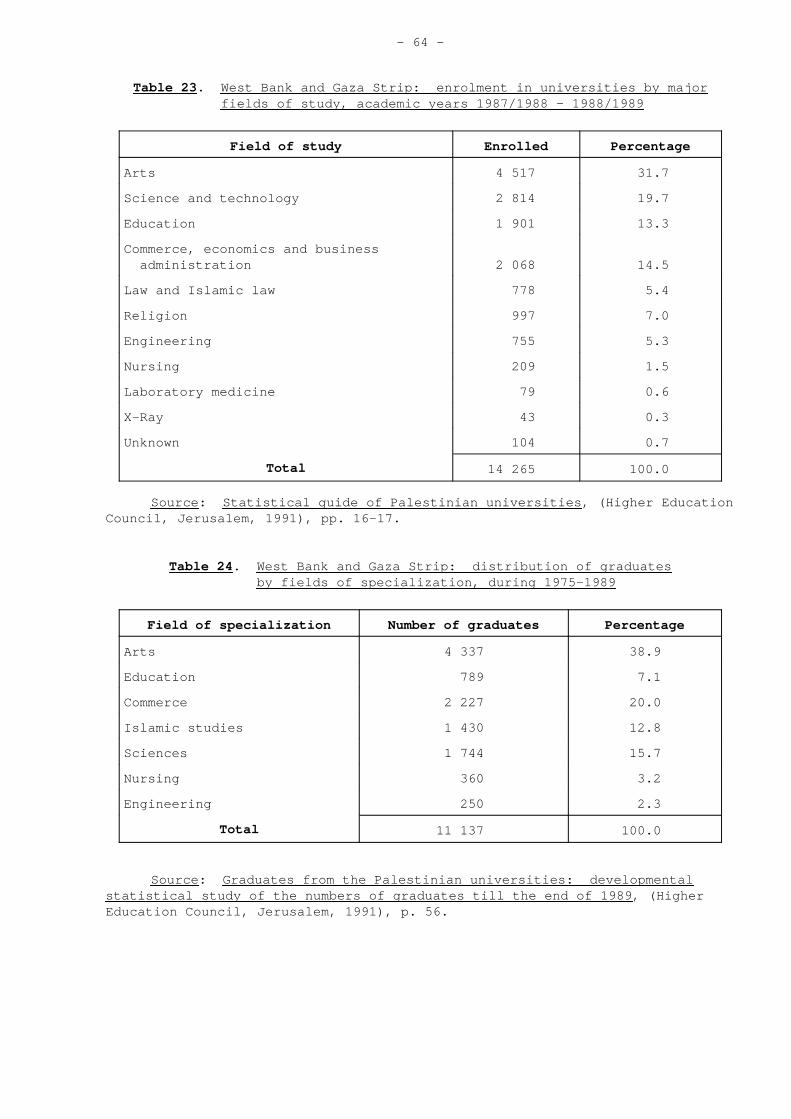
- 64 -
Table 23 . West Bank and Gaza Strip: enrolment in universities by majorfields of study, academic years 1987/1988 - 1988/1989
Field of study Enrolled Percentage
Arts 4 517 31.7
Science and technology 2 814 19.7
Education 1 901 13.3
Commerce, economics and businessadministration 2 068 14.5
Law and Islamic law 778 5.4
Religion 997 7.0
Engineering 755 5.3
Nursing 209 1.5
Laboratory medicine 79 0.6
X-Ray 43 0.3
Unknown 104 0.7
Total 14 265 100.0
Source : Statistical guide of Palestinian universities , (Higher EducationCouncil, Jerusalem, 1991), pp. 16-17.
Table 24 . West Bank and Gaza Strip: distribution of graduatesby fields of specialization, during 1975-1989
Field of specialization Number of graduates Percentage
Arts 4 337 38.9
Education 789 7.1
Commerce 2 227 20.0
Islamic studies 1 430 12.8
Sciences 1 744 15.7
Nursing 360 3.2
Engineering 250 2.3
Total 11 137 100.0
Source : Graduates from the Palestinian universities: developmentalstatistical study of the numbers of graduates till the end of 1989 , (HigherEducation Council, Jerusalem, 1991), p. 56.
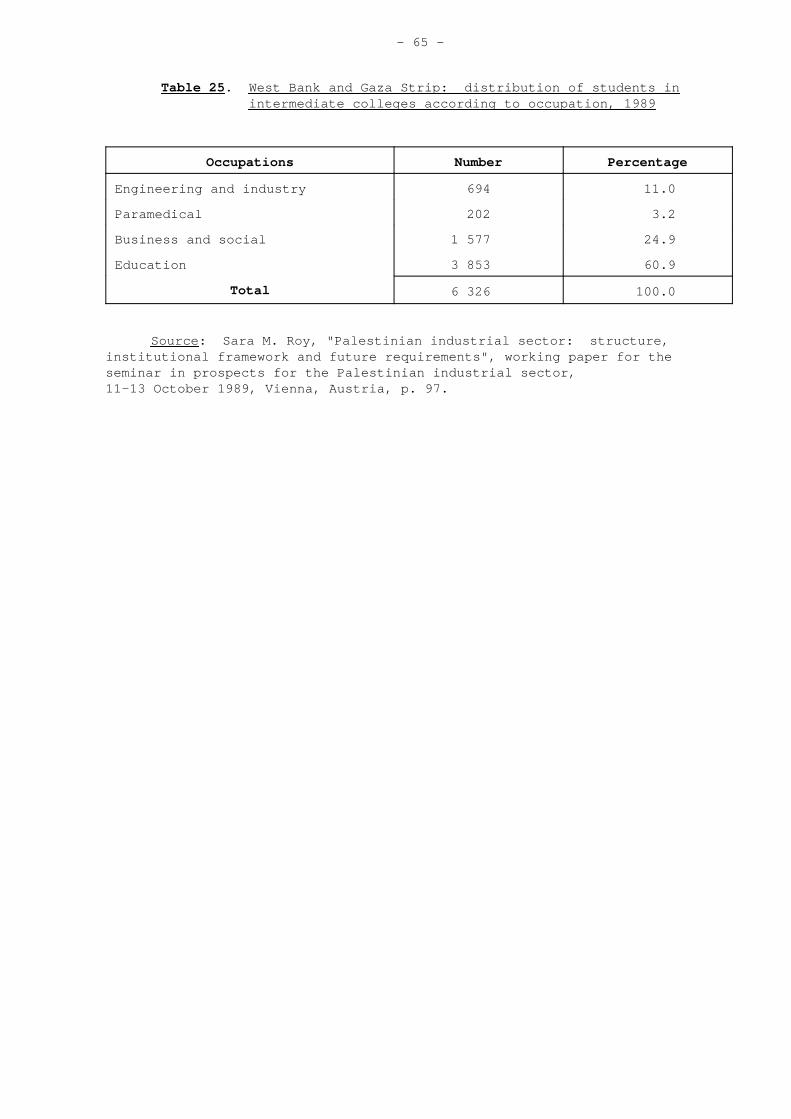
- 65 -
Table 25 . West Bank and Gaza Strip: distribution of students inintermediate colleges according to occupation, 1989
Occupations Number Percentage
Engineering and industry 694 11.0
Paramedical 202 3.2
Business and social 1 577 24.9
Education 3 853 60.9
Total 6 326 100.0
Source : Sara M. Roy, "Palestinian industrial sector: structure,institutional framework and future requirements", working paper for theseminar in prospects for the Palestinian industrial sector,11-13 October 1989, Vienna, Austria, p. 97.

- 66 -
REFERENCES
Abu-Shokor, Abdelfattah, "Labour force external migration in the OPT, size,characteristics, motives", Samed Al-Iktisadi (Vol. 11, January-February-March,Amman: 1989 (in Arabic)).
_______ Socio-economic conditions of the West Bank and Gaza Strip workers inIsrael , Documentation, Transcript and Publication Centre, An-Najah N.University, Nablus: April 1987 (in Arabic).
_______ Labour market in the West Bank and Gaza Strip , An-Najah University,Nablus: February 1987 (in Arabic).
_______ Unemployment in the occupied Palestinian territory 1968-1991 ,United Nations Economic and Social Commission for Western Asia (ESCWA), Amman:1992 (in Arabic).
_______ "The situation of the industrial sector in the occupied Palestinianterritories", Samed Al-Iktisadi (Vol. 12, July-August-September 1990), Amman:1990 (in Arabic).
_______ External migration from the West Bank and Gaza Strip and its socialand economic impact , Arab Thought Forum, Jerusalem: 1990 (in Arabic).
_______ et al., Industrialization in the West Bank , An-Najah University,Documentation, Transcript and Publications Centre, Nablus: 1992 (in Arabic).
Al-Fajr newspaper, 26 August 1990, Jerusalem: 1990 (in Arabic).
Al-Qig, Hasan, Vocational training and education in the occupied territories ,Arab Thought Forum, Jerusalem: 1988 (in Arabic).
Al-Quds newspaper, 4 December 1991, No. 7797, Jerusalem: 1991 (in Arabic).
Atkinson, Lloyd C., Economics , Homewood, Illinois 60430: 1982.
Benvenisti, Meron, The West Bank data base project: a survey of Israelipolicies , American Enterprise Institute of Public Research, Washington andLondon: 1984.
_______ and Shlomo Khayat, The West Bank and Gaza atlas , WBDP, The JerusalemPost , Jerusalem: 1988.
Franz, Wolfgang, Arbeitsokonomik, Spriger Verlag, Berlin, Heidelburg,New York: 1991.
Higher Education Council, Statistical guidelines for Palestinian universitiesfor the academic years 1987/1988 , Jerusalem: 1990 (in Arabic).
- 67 -
_______ Statistical guidelines for Palestinian universities and communitycolleges, 1992/1993 , Jerusalem: 1993.
Hindiah, Suha et al., "Sidewalk women sellers - phenomenon of stalls in theinformal Palestinian economy", Miscellaneous Research Series, AfaqFilistineyah , Bir-Zeit University, Bir-Zeit: July 1991 (in Arabic).
Institut der Deutschen Wirtschaft, Zahlen fuer Wirtschaftlichen Entwicklungder Bundesrepublik Deutschland, Koeln: 1986.
Israel, Central Bureau of Statistics, Statistical abstract of Israel ,Jerusalem: various issues.
_______ Judea, Samaria and Gaza Area statistics , Vol. XVIII, 2, 1988,Jerusalem: 1988.
Israel Ministry of Labour and Social Affairs, Department of InternationalRelations, Labour and employment in Judea, Samaria and Gaza district ,Jerusalem: 1983.
Jordan, Department of Statistics, Statistical Yearbook , 1987, No. 38, Amman:1987 (in Arabic).
_______ Demographic research and analysis Unit, Labour force in Jordan,1982-1983 , Amman: April 1987 (in Arabic).
Jordan, Ministry of Labour, "Manpower development in Jordan", unpublishedpaper, Amman.
Jordanian-Palestinian Joint Committee, General Secretariat: "Development ofthe labour force in the occupied homeland", Research No. 1, Amman: 1985(in Arabic).
Kalaldeh, Nawaf, "Main characteristics and participation rate of female labourforce in Jordan", in Department of Statistics, Demographic research andanalysis Unit, Labour Force in Jordan , Amman: April 1987 (in Arabic).
Kleinman, Ephraim, "Open borders and labour mobility: Israel, the West Bankand Gaza Strip", in Gideon Fisheloson (ed.): Economic cooperation in theMiddle East , Westview Press, Boulder, San Francisco and London: 1989.
Kubursi, Atef, "Jobs, education and development: the case of the West Bank",in George T. Abed (ed.): Development under prolonged occupation , Arab UnityStudies Centre, Beirut: 1989 (in Arabic).
Karam, Antonious, Economy of underdevelopment and development , NationalDevelopment Centre, Kuwait, 1980 (in Arabic).
Masri, Munzer, "Education and training and the future of Jordanian labourmarket" in Nabil Khouri and Ahmad Kasem (ed.): Labour force structure inJordanian labour market , Royal Scientific Society and International LabourOrganization, Amman, 1991 (in Arabic).

- 68 -
Masri, Husni, Palestinian secondary education under Israeli occupation: factsand perspectives , An-Najah University, Nablus: 1991 (in Arabic).
Miari, Mahmmud, Vocational teaching in the occupied territories , Centre forthe Study and Documentation of the Palestinian Society, Bir-Zeit University,Bir-Zeit: January 1991 (in Arabic).
Pissarides, Christopher A., "Labour market in the Middle East andNorth Africa", Discussion Paper Series, World Bank (Middle East andNorth Africa), No. 5, February 1993.
Reynolds, Lloyd G., Labour economics and labour relations , 7th edition,New Jersey: 1978.
Roy, Sara M., "Palestinian industrial sector: structure, institutionalframework and future requirements", working paper prepared for the Seminar onProspects for the Palestinian Industrial Sector, 11-30 October 1989, Vienna,Austria.
UNCTAD, "Selected statistical series on the economy of the occupiedPalestinian territory, 1968-1987", unpublished, 1991.
_______ "Developments in the economy of the occupied Palestinian territory",(TD/B/40(1)/8), 1993.
_______ "Developments in the economy of the occupied Palestinian territory",(TD/B/40(1)/3), 1994.
United Nations Development Programme (Policy Division), Education and trainingin the 1990s, developing countries’ needs and strategies , New York, 1989.
World Bank, World development report, 1990 , Washington, D.C., August, 1990.
-----


![EMPLOYMENT AND LABOUR RELATIONS ACT CAP 366tanzania.go.tz/egov_uploads/documents/Employment and LAbour... · chapter 366 _____ employment and labour relations act [principal legislation]](https://img.pdfslide.us/doc/110x75/5ab3c5f17f8b9a7e1d8e8ff0/employment-and-labour-relations-act-cap-and-labourchapter-366-employment.jpg)