Embed Size (px)
Citation preview
22 POWER FINANCIAL CORPORATION 2015 ANNUAL REPORT
Review of Financial Performance
MARCH 23, 2016This Annual Report is intended to provide interested shareholders and others with selected information concerning Power Financial Corporation. For further
information concerning the Corporation, shareholders and other interested persons should consult the Corporation’s disclosure documents, such as its Annual
Information Form and Management’s Discussion and Analysis (MD&A). Copies of the Corporation’s continuous disclosure documents can be obtained on the
Corpo ration’s website at www.powerfinancial.com, at www.sedar.com, or from the office of the Secretary at the addresses shown at the end of this report.
FORWARD-LOOKING STATEMENTS › Certain statements in this document, other than statements of historical fact, are forward-looking statements based on certain assumptions and reflect the Corporation’s current expectations, or with respect to disclosure regarding the Corporation’s public subsidiaries, reflect such subsidiaries’ disclosed current expectations. Forward-looking statements are provided for the purposes of assisting the reader in understanding the Corporation’s financial performance, financial position and cash flows as at and for the periods ended on certain dates and to present information about management’s current expectations and plans relating to the future and the reader is cautioned that such statements may not be appropriate for other purposes. These statements may include, without limitation, statements regarding the operations, business, financial condition, expected financial results, performance, prospects, opportunities, priorities, targets, goals, ongoing objectives, strategies and outlook of the Corporation and its subsidiaries, as well as the outlook for North American and international economies for the current fiscal year and subsequent periods. Forward-looking statements include statements that are predictive in nature, depend upon or refer to future events or conditions, or include words such as “expects”, “anticipates”, “plans”, “believes”, “estimates”, “seeks”, “intends”, “targets”,
“projects”, “forecasts” or negative versions thereof and other similar expressions, or future or conditional verbs such as “may”, “will”, “should”, “would” and “could”.
By its nature, this information is subject to inherent risks and uncertainties that may be general or specific and which give rise to the possibility that expectations, forecasts, predictions, projections or conclusions will not prove to be accurate, that assumptions may not be correct and that objectives, strategic goals and priorities will not be achieved. A variety of factors, many of which are beyond the Corporation’s and its subsidiaries’ control, affect the operations, performance and results of the Corporation and its subsidiaries and their businesses, and could cause actual results to differ materially from current expectations of estimated or anticipated events or results. These factors include, but are not limited to: the impact or unanticipated impact of general economic, political and market factors in North America and internationally, interest and foreign exchange rates, global equity and capital markets, management of market liquidity and funding risks,
changes in accounting policies and methods used to report financial condition (including uncertainties associated with critical accounting assumptions and estimates), the effect of applying future accounting changes, business competition, operational and reputational risks, technological change, changes in government regulation and legislation, changes in tax laws, unexpected judicial or regulatory proceedings, catastrophic events, the Corporation’s and its subsidiaries’ ability to complete strategic transactions, integrate acquisitions and implement other growth strategies, and the Corporation’s and its subsidiaries’ success in anticipating and managing the foregoing factors.
The reader is cautioned to consider these and other factors, uncertainties and potential events carefully and not to put undue reliance on forward-looking statements. Information contained in forward-looking statements is based upon certain material assumptions that were applied in drawing a conclusion or making a forecast or projection, including management’s perceptions of historical trends, current conditions and expected future developments, as well as other considerations that are believed to be appropriate in the circumstances, including that the list of factors in the previous paragraph, collectively, are not expected to have a material impact on the Corporation and its subsidiaries. While the Corporation considers these assumptions to be reasonable based on information currently available to management, they may prove to be incorrect.
Other than as specifically required by applicable Canadian law, the Corporation undertakes no obligation to update any forward-looking statement to reflect events or circumstances after the date on which such statement is made, or to reflect the occurrence of unanticipated events, whether as a result of new information, future events or results, or otherwise.
Additional information about the risks and uncertainties of the Corporation’s business and material factors or assumptions on which information contained in forward-looking statements is based is provided in its disclosure materials, including its most recent Management’s Discussion and Analysis and its most recent Annual Information Form, filed with the securities regulatory authorities in Canada and available at www.sedar.com.
ALL TABUL AR AMOUNTS ARE IN MILLIONS OF CANADIAN DOLL ARS, UNLESS OTHERWISE NOTED.
Readers are reminded that a list of the abbreviations used throughout can be found on the inside front cover of this report. In addition, the following
abbreviations are used in the Review of Financial Performance and in the Financial Statements and Notes thereto: Audited Consolidated Financial
Statements of Power Financial and Notes thereto for the year ended December 31, 2015 (the 2015 Consolidated Financial Statements or the Financial
Statements); International Financial Reporting Standards (IFRS).
23POWER FINANCIAL CORPORATION 2015 ANNUAL REPORT
OverviewPower Financial, a subsidiar y of Power Corporation, is a diversified
management and holding company with substantial operations in the
financial services sector in Canada, the United States and Europe, through its
controlling interests in Lifeco and IGM. Power Financial also holds, together
with the Frère Group, of Belgium, a controlling interest in Pargesa, a holding
company which focuses on a limited number of significant and strategic core
holdings, held through its subsidiary, GBL. Lifeco (TSX: GWO) and IGM (TSX:
IGM) are public companies listed on the Toronto Stock Exchange. Pargesa is
a public company listed on the Swiss Stock Exchange (SIX: PARG).
LIFECOLifeco is an international financial services holding company with subsidiaries
offering life insurance, health insurance, retirement and investment services
and engaged in the asset management and reinsurance businesses.
As at December 31, 2015, Power Financial and IGM held 67.4% and 4.0%,
respectively, of Lifeco’s common shares, representing approximately 65%
of the voting rights attached to all outstanding Lifeco voting shares. Voting
rights of a life insurance company are limited by law to 65%.
During 2015, Lifeco completed two acquisitions in its Europe segment. In
the first quarter of 2015, Lifeco acquired the assets and liabilities associated
with The Equitable Life Assurance Society’s annuity business in the U.K. The
transaction involved the initial reinsurance of approximately 31,000 policies
with liabilities and supporting assets of approximately $1.6 billion. The initial
reinsurance arrangement was effective January 1, 2015 and the ultimate
transfer is expected to be completed in 2016, subject to final court approval. In
the third quarter of 2015, Lifeco completed the acquisition of Legal & General
International (Ireland) Limited (LGII), a provider of investment and wealth
management solutions for high-net-worth individuals in the U.K.
IGM FINANCIALIGM is a financial services company which serves the financial needs of
Canadians through its principal subsidiaries, each operating distinctly within
the advice segment of the financial services market.
As at December 31, 2015, Power Financial and Great-West Life, a subsidiary
of Lifeco, held 60.4% and 3.8%, respectively, of IGM’s common shares.
Power Financial’s equity interest in IGM increased by 1.6% from 58.8% as
at December 31, 2014 to 60.4% as at December 31, 2015 as a result of IGM’s
repurchases and subsequent cancellation of its common shares. Great-West
Life’s equity interest increased from 3.7% to 3.8% over the same period.
PARGESA AND GBLPower Financial Europe B.V., a wholly owned subsidiary of Power Financial,
and the Frère Group of Belgium each hold a 50% interest in Parjointco, which,
as at December 31, 2015, held a 55.5% interest in Pargesa, representing 75.4%
of the voting rights in that company.
Pargesa is a holding company, which at December 31, 2015, held a 50% interest
in GBL, representing 52% of the voting rights in that company. GBL, a Belgian
holding company, is listed on the Brussels Stock Exchange (EBR: GBLB).
As at December 31, 2015, GBL’s portfolio was mainly comprised of investments
in: Imerys – mineral-based specialty solutions for industry (EPA: NK);
LafargeHolcim – cement, aggregates and concrete (SIX: HOLN and EPA: LHN);
Total – oil, gas and alternative energies (EPA: FP); Pernod Ricard – wines and
spirits (EPA: RI); SGS – testing, inspection and certification (SIX: SGSN); and
Engie (formerly called GDF Suez) – electricity, natural gas, and energy and
environmental services (EPA: GSZ).
On June 1, 2015, Holcim Ltd (Holcim) launched a public exchange offer for all
the shares of Lafarge. The offer closed on July 3, 2015. Shares representing
87.46% of the share capital of Lafarge were tendered to the offer. Holcim and
Lafarge announced on July 10, 2015, that they had completed their global
merger and officially launched LafargeHolcim, whose shares are traded on
the Swiss Exchange and on the Euronext in Paris. The exchange offer was
subsequently reopened from July 15 to July 28, 2015, resulting in LafargeHolcim
holding 96.4% of the share capital of Lafarge. In September 2015, LafargeHolcim
implemented a “squeeze-out” procedure for the Lafarge shares not tendered
to the public exchange offer, which closed on October 23, 2015. LafargeHolcim
also distributed in September 2015 a post-closing stock dividend of one new
LafargeHolcim share for 20 existing shares (with no impact on the earnings
of GBL).
On June 30, 2015, in accordance with IFRS 5 – Non-Current Assets Held for Sale
and Discontinued Operations, GBL classified its investment in Lafarge as held for
sale. On July 10, 2015, GBL classified its resulting investment in LafargeHolcim
as available for sale and consequently the investment was recorded at fair
value. Accordingly, mark-to-market gains representing reversals of a portion
of a previously recorded impairment charge were recorded by GBL (see “Other
Items” below).
At December 31, 2015, GBL held a 9.4% economic and voting interest in
LafargeHolcim, and the LafargeHolcim share price was lower than the
carrying value of the investment. Under IFRS, available-for-sale investments
are marked to market and impairment charges are recorded if the loss is
significant or prolonged. As these criteria were not present at December 31,
2015, GBL did not record an impairment charge on LafargeHolcim. The share
price has continued to decline in 2016 and was €38.8 per share on March 11, 2016,
a price where the above mentioned criteria are present. GBL has indicated,
should the March 31, 2016 share price be the same as the March 11 share price,
they would record a non-cash impairment charge of €1,584 million, of which
the Corporation’s share is approximately C$340 million.
In 2015, GBL disposed of a 0.5% equity interest in Total, which resulted in gains
of SF225 million for Pargesa. As at December 31, 2015, GBL held a 2.4% equity
interest in Total. In February 2016, GBL sold an additional 1% equity interest in
Total, resulting in a gain to be recorded in the first quarter of 2016. Following
this transaction, GBL held a 1.4% equity interest in Total.
WEALTHSIMPLEIn 2015, Power Financial, through a wholly owned subsidiary, invested in
Wealthsimple, a technology-driven investment manager. Power Financial’s
investment amounted to $17 million at December 31, 2015. Subsequent
to December 31, 2015, Power Financial made a second equity investment
in Wealthsimple, bringing the total investment to date to $30 million,
representing a 60.4% equity interest.
Basis of PresentationThe 2015 Consolidated Financial Statements of the Corporation have been
prepared in accordance with IFRS and are presented in Canadian dollars.
Lifeco and IGM are controlled by Power Financial and their financial
statements are consolidated with those of Power Financial. Consolidated
financial statements present, as a single economic entity, the assets,
liabilities, revenues, expenses and cash flows of the parent company and its
operating subsidiaries. The consolidated financial statements present the
financial results of Power Financial (parent) and Lifeco and IGM (operating
subsidiaries) after the elimination of intercompany balances and transactions.
24 POWER FINANCIAL CORPORATION 2015 ANNUAL REPORT
REVIEW OF FINANCIAL PERFORMANCE
Power Financial’s investment in Pargesa is held through Parjointco. Parjointco
is a holding company jointly controlled by Power Financial and the Frère
Group. Parjointco’s only investment is its interest in Pargesa. Power Financial’s
investment in Parjointco is accounted for using the equity method, in which:
▪ The investment is initially recognized at cost and adjusted thereafter for
post-acquisition changes in Power Financial’s share of Pargesa’s net assets
(shareholders’ equity);
▪ Power Financial’s net earnings or loss includes its share of Pargesa’s net
earnings or loss; and
▪ Power Financial’s other comprehensive income includes its share of
Pargesa’s other comprehensive income.
Power Financial’s investment in Wealthsimple is accounted for using the
equity method.
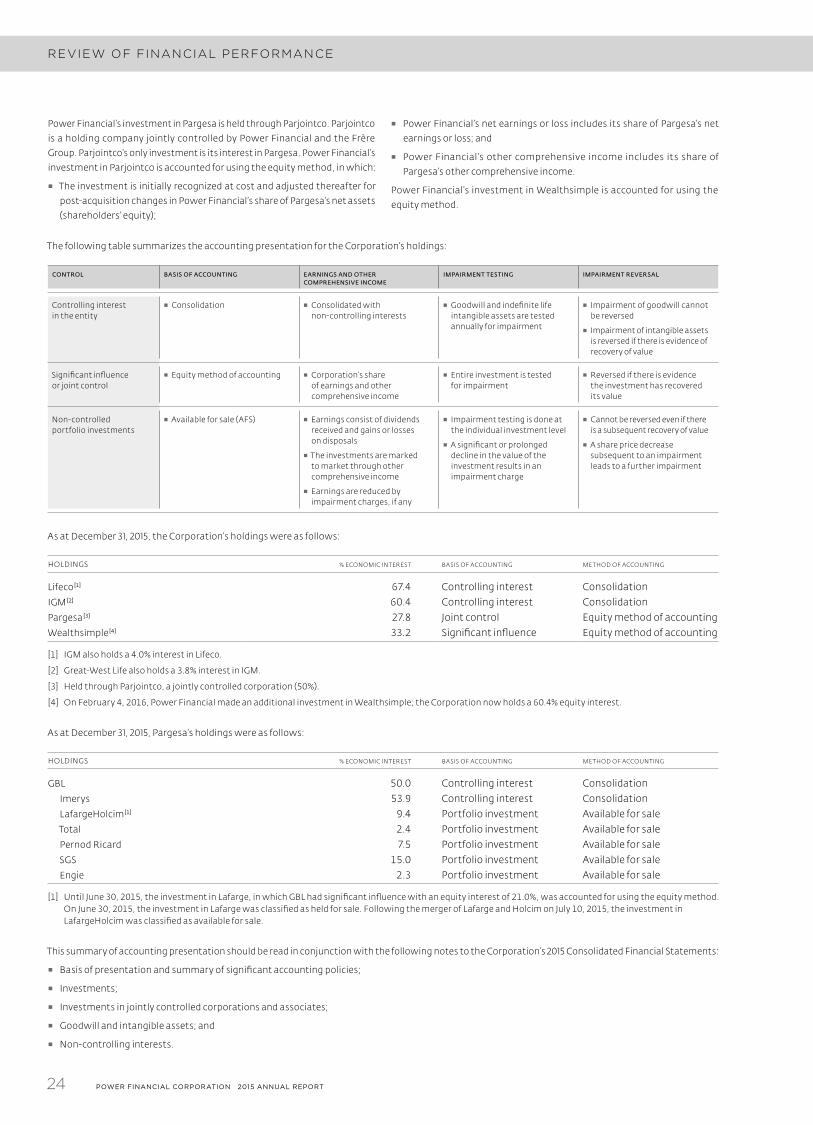
The following table summarizes the accounting presentation for the Corporation’s holdings:
CONTROL BASIS OF ACCOUNTING EARNINGS AND OTHER COMPREHENSIVE INCOME
IMPAIRMENT TESTING IMPAIRMENT REVERSAL
Controlling interest in the entity
▪ Consolidation ▪ Consolidated with non-controlling interests
▪ Goodwill and indefinite life intangible assets are tested annually for impairment
▪ Impairment of goodwill cannot be reversed
▪ Impairment of intangible assets is reversed if there is evidence of recovery of value
Significant influence or joint control
▪ Equity method of accounting ▪ Corporation’s share of earnings and other comprehensive income
▪ Entire investment is tested for impairment
▪ Reversed if there is evidence the investment has recovered its value
Non-controlled portfolio investments
▪ Available for sale (AFS) ▪ Earnings consist of dividends received and gains or losses on disposals
▪ The investments are marked to market through other comprehensive income
▪ Earnings are reduced by impairment charges, if any
▪ Impairment testing is done at the individual investment level
▪ A significant or prolonged decline in the value of the investment results in an impairment charge
▪ Cannot be reversed even if there is a subsequent recovery of value
▪ A share price decrease subsequent to an impairment leads to a further impairment
As at December 31, 2015, the Corporation’s holdings were as follows:
HOLDINGS % ECONOMIC INTEREST BASIS OF ACCOUNTING METHOD OF ACCOUNTING
Lifeco [1] 67.4 Controlling interest ConsolidationIGM [2] 60.4 Controlling interest ConsolidationPargesa [3] 27.8 Joint control Equity method of accountingWealthsimple [4] 33.2 Significant influence Equity method of accounting
[1] IGM also holds a 4.0% interest in Lifeco.
[2] Great-West Life also holds a 3.8% interest in IGM.
[3] Held through Parjointco, a jointly controlled corporation (50%).
[4] On February 4, 2016, Power Financial made an additional investment in Wealthsimple; the Corporation now holds a 60.4% equity interest.
As at December 31, 2015, Pargesa’s holdings were as follows:
HOLDINGS % ECONOMIC INTEREST BASIS OF ACCOUNTING METHOD OF ACCOUNTING
GBL 50.0 Controlling interest ConsolidationImerys 53.9 Controlling interest ConsolidationLafargeHolcim [1] 9.4 Portfolio investment Available for saleTotal 2.4 Portfolio investment Available for salePernod Ricard 7.5 Portfolio investment Available for saleSGS 15.0 Portfolio investment Available for saleEngie 2.3 Portfolio investment Available for sale
[1] Until June 30, 2015, the investment in Lafarge, in which GBL had significant influence with an equity interest of 21.0%, was accounted for using the equity method. On June 30, 2015, the investment in Lafarge was classified as held for sale. Following the merger of Lafarge and Holcim on July 10, 2015, the investment in LafargeHolcim was classified as available for sale.
This summary of accounting presentation should be read in conjunction with the following notes to the Corporation’s 2015 Consolidated Financial Statements:
▪ Basis of presentation and summary of significant accounting policies;
▪ Investments;
▪ Investments in jointly controlled corporations and associates;
▪ Goodwill and intangible assets; and
▪ Non-controlling interests.
25POWER FINANCIAL CORPORATION 2015 ANNUAL REPORT
NON-IFRS FINANCIAL MEASURES AND PRESENTATIONIn analyzing the financial results of the Corporation and consistent with the
presentation in previous periods, “Net earnings attributable to common
shareholders”, presented in the section “Results of Power Financial
Corporation”, are comprised of:
▪ operating earnings attributable to common shareholders; and
▪ other items or non-operating earnings, which include the after-tax
impact of any item that in management’s judgment would make the
period-over-period comparison of results from operations less meaningful.
Other items include the Corporation’s share of items presented as other
items or non-operating earnings by a subsidiary or a jointly controlled
corporation or associate.
Management uses these financial measures in its presentation and analysis of
the financial performance of Power Financial, and believes that they provide
additional meaningful information to readers in their analysis of the results
of the Corporation. Operating earnings, as defined by the Corporation, assist
the reader in comparing the current period’s results to those of previous
periods as items that are not considered to be ongoing operating activities
are excluded from this non-IFRS measure.
Operating earnings attributable to common shareholders and operating
earnings per share are non-IFRS financial measures that do not have a
standard meaning and may not be comparable to similar measures used by
other entities. For a reconciliation of these non-IFRS measures to results
reported in accordance with IFRS, see the “Results of Power Financial
Corporation – Earnings Summar y – Condensed Supplementar y Non-
Consolidated Statements of Earnings” section below.
In this review of financial per formance, a non-consolidated basis of
presentation is also used by the Corporation to present and analyze its
results, financial position and cash flows. In this basis of presentation,
Power Financial’s interests in Lifeco and IGM are accounted for using the
equity method. Presentation on a non-consolidated basis is a non-IFRS
presentation. However, it is useful to the reader as it presents the holding
company’s (parent) results separately from the results of its operating
subsidiaries. Reconciliations of the non-IFRS basis of presentation with the
presentation in accordance with IFRS are included elsewhere in this review
of financial performance.
Results of Power Financial Corporation
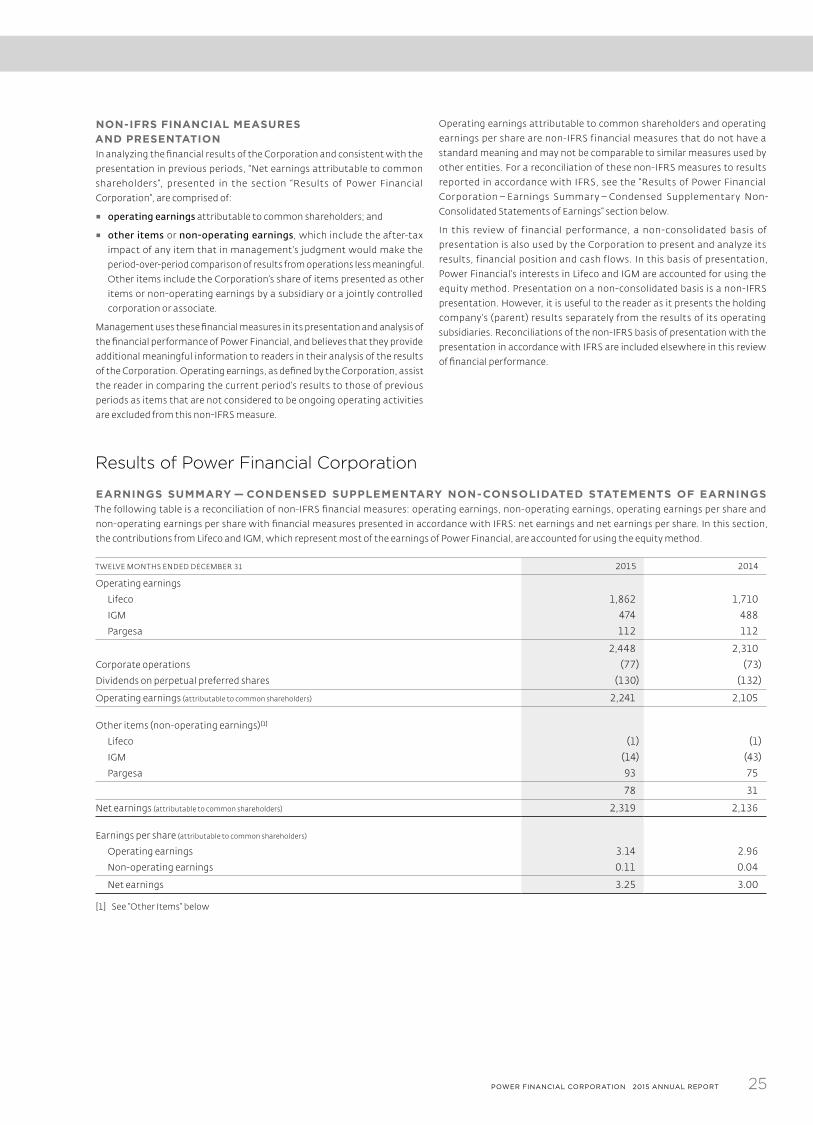
EARNINGS SUMMARY — CONDENSED SUPPLEMENTARY NON-CONSOLIDATED STATEMENTS OF EARNINGSThe following table is a reconciliation of non-IFRS financial measures: operating earnings, non-operating earnings, operating earnings per share and
non-operating earnings per share with financial measures presented in accordance with IFRS: net earnings and net earnings per share. In this section,
the contributions from Lifeco and IGM, which represent most of the earnings of Power Financial, are accounted for using the equity method.
T WELVE MONTHS ENDED DECEMBER 31 2015 2014
Operating earnings
Lifeco 1,862 1,710
IGM 474 488
Pargesa 112 112
2,448 2,310
Corporate operations (77) (73)
Dividends on perpetual preferred shares (130) (132)
Operating earnings (attributable to common shareholders) 2,241 2,105
Other items (non-operating earnings) [1]
Lifeco (1) (1)
IGM (14) (43)
Pargesa 93 75
78 31
Net earnings (attributable to common shareholders) 2,319 2,136
Earnings per share (attributable to common shareholders)
Operating earnings 3.14 2.96
Non-operating earnings 0.11 0.04
Net earnings 3.25 3.00
[1] See “Other Items” below
26 POWER FINANCIAL CORPORATION 2015 ANNUAL REPORT
REVIEW OF FINANCIAL PERFORMANCE
NET EARNINGS (attributable to common shareholders)
Net earnings attributable to common shareholders for the twelve-month
period ended December 31, 2015 were $2,319 million or $3.25 per share,
compared with $2,136 million or $3.00 per share in the corresponding period
in 2014, an increase of 8.3% on a per share basis.
A discussion on the results of the Corporation is provided in the
sections “Contribution to operating earnings”, “Corporate operations of
Power Financial”, and “Other items” below.
OPERATING EARNINGS (attributable to common shareholders)
Operating earnings attributable to common shareholders for the twelve-
month period ended December 31, 2015 were $2,241 million or $3.14 per share,
compared with $2,105 million or $2.96 per share in the corresponding period
in 2014, an increase of 6.1% on a per share basis.
CONTRIBUTION TO OPERATING EARNINGS — LIFECO, IGM AND PARGESAPower Financial’s share of operating earnings from Lifeco, IGM and Pargesa increased by 6% for the year ended December 31, 2015, compared with the same
period in 2014, from $2,310 million to $2,448 million.
LifecoLifeco’s contribution to Power Financial’s operating earnings for the twelve-
month period ended December 31, 2015, was $1,862 million, compared with
$1,710 million for the corresponding period in 2014.
▪ Lifeco reported operating earnings attributable to Lifeco common
shareholders of $2,762 million or $2.774 per share for the twelve-month
period ended December 31, 2015, compared with $2,546 million or $2.549 per
share in the corresponding period in 2014, an increase of 8.8% on a per
share basis.
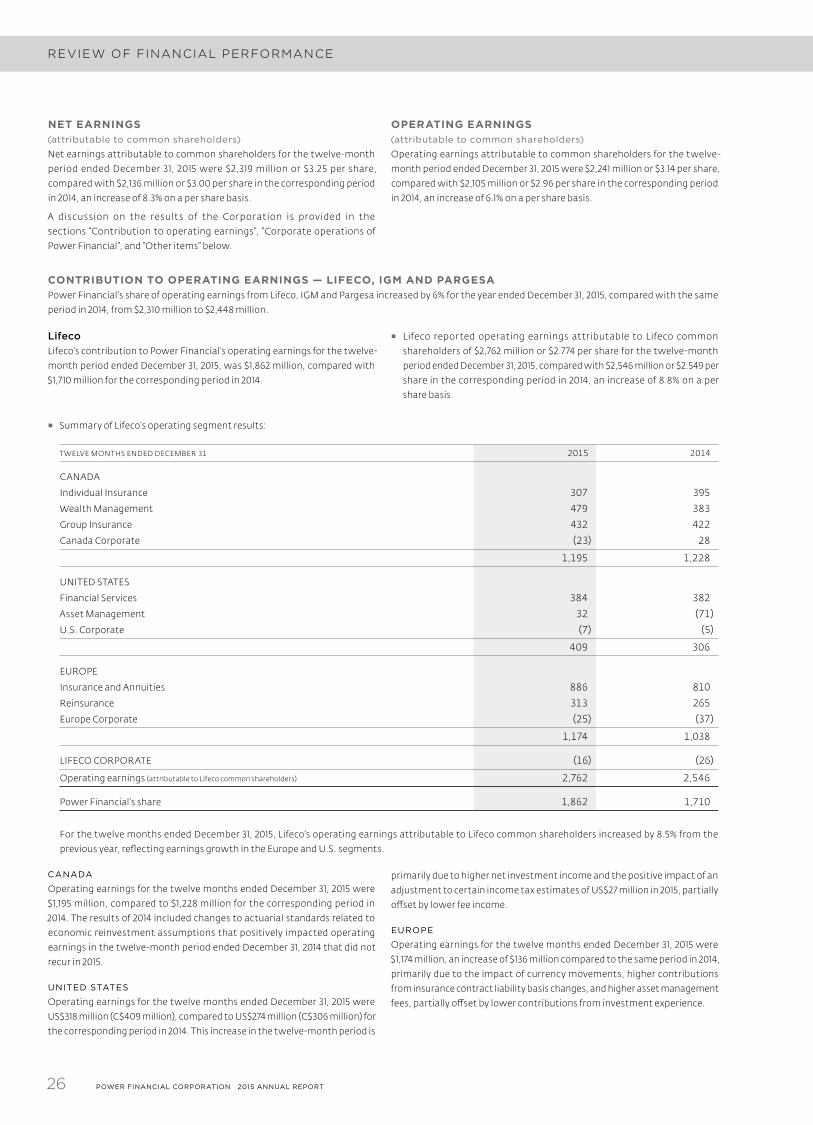
▪ Summary of Lifeco’s operating segment results:
T WELVE MONTHS ENDED DECEMBER 31 2015 2014
CANADA
Individual Insurance 307 395
Wealth Management 479 383
Group Insurance 432 422
Canada Corporate (23) 28
1,195 1,228
UNITED STATES
Financial Services 384 382
Asset Management 32 (71)
U.S. Corporate (7) (5)
409 306
EUROPE
Insurance and Annuities 886 810
Reinsurance 313 265
Europe Corporate (25) (37)
1,174 1,038
LIFECO CORPORATE (16) (26)
Operating earnings (attributable to Lifeco common shareholders) 2,762 2,546
Power Financial’s share 1,862 1,710
For the twelve months ended December 31, 2015, Lifeco’s operating earnings attributable to Lifeco common shareholders increased by 8.5% from the
previous year, reflecting earnings growth in the Europe and U.S. segments.
CANADA
Operating earnings for the twelve months ended December 31, 2015 were
$1,195 million, compared to $1,228 million for the corresponding period in
2014. The results of 2014 included changes to actuarial standards related to
economic reinvestment assumptions that positively impacted operating
earnings in the twelve-month period ended December 31, 2014 that did not
recur in 2015.
UNITED STATES
Operating earnings for the twelve months ended December 31, 2015 were
US$318 million (C$409 million), compared to US$274 million (C$306 million) for
the corresponding period in 2014. This increase in the twelve-month period is
primarily due to higher net investment income and the positive impact of an
adjustment to certain income tax estimates of US$27 million in 2015, partially
offset by lower fee income.
EUROPE
Operating earnings for the twelve months ended December 31, 2015 were
$1,174 million, an increase of $136 million compared to the same period in 2014,
primarily due to the impact of currency movements, higher contributions
from insurance contract liability basis changes, and higher asset management
fees, partially offset by lower contributions from investment experience.
27POWER FINANCIAL CORPORATION 2015 ANNUAL REPORT
IGM FinancialIGM’s contribution to Power Financial’s operating earnings was $474 million for the twelve-month period ended December 31, 2015, compared with $488 million
for the corresponding period in 2014.
▪ IGM reported operating earnings available to IGM common shareholders of $796 million or $3.21 per share for the twelve-month period ended December 31,
2015, compared with $826 million or $3.27 per share in the corresponding period in 2014.
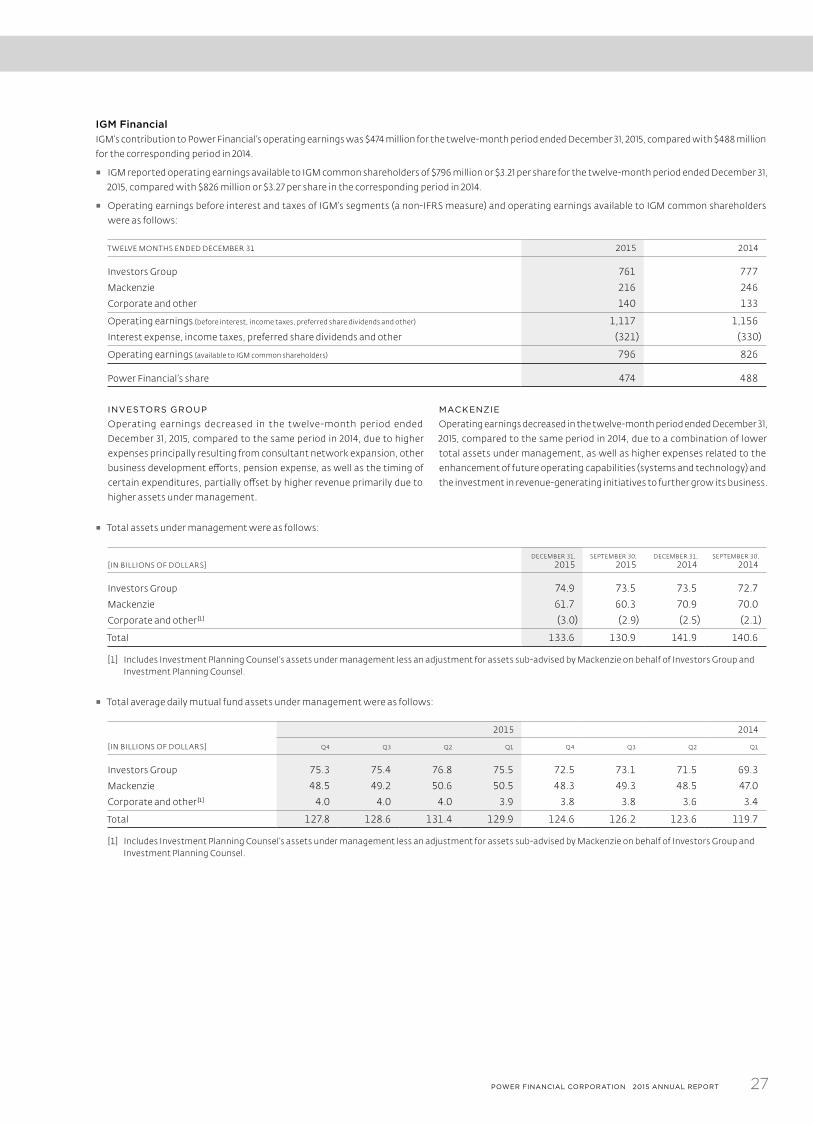
▪ Operating earnings before interest and taxes of IGM’s segments (a non-IFRS measure) and operating earnings available to IGM common shareholders
were as follows:
T WELVE MONTHS ENDED DECEMBER 31 2015 2014
Investors Group 761 777
Mackenzie 216 246
Corporate and other 140 133
Operating earnings (before interest, income taxes, preferred share dividends and other) 1,117 1,156
Interest expense, income taxes, preferred share dividends and other (321) (330)
Operating earnings (available to IGM common shareholders) 796 826
Power Financial’s share 474 488
INVESTORS GROUP
Operating earnings decreased in the twelve-month period ended
December 31, 2015, compared to the same period in 2014, due to higher
expenses principally resulting from consultant network expansion, other
business development efforts, pension expense, as well as the timing of
certain expenditures, partially offset by higher revenue primarily due to
higher assets under management.
MACKENZIE
Operating earnings decreased in the twelve-month period ended December 31,
2015, compared to the same period in 2014, due to a combination of lower
total assets under management, as well as higher expenses related to the
enhancement of future operating capabilities (systems and technology) and
the investment in revenue-generating initiatives to further grow its business.
▪ Total assets under management were as follows:
[IN BILLIONS OF DOLL ARS]DECEMBER 31,
2015SEPTEMBER 30,
2015DECEMBER 31,
2014SEPTEMBER 30,
2014
Investors Group 74.9 73.5 73.5 72.7
Mackenzie 61.7 60.3 70.9 70.0
Corporate and other [1] (3.0) (2.9) (2.5) (2.1)
Total 133.6 130.9 141.9 140.6
[1] Includes Investment Planning Counsel’s assets under management less an adjustment for assets sub-advised by Mackenzie on behalf of Investors Group and Investment Planning Counsel.
▪ Total average daily mutual fund assets under management were as follows:
2015 2014
[IN BILLIONS OF DOLL ARS] Q4 Q3 Q2 Q1 Q4 Q3 Q2 Q1
Investors Group 75.3 75.4 76.8 75.5 72.5 73.1 71.5 69.3
Mackenzie 48.5 49.2 50.6 50.5 48.3 49.3 48.5 47.0
Corporate and other [1] 4.0 4.0 4.0 3.9 3.8 3.8 3.6 3.4
Total 127.8 128.6 131.4 129.9 124.6 126.2 123.6 119.7
[1] Includes Investment Planning Counsel’s assets under management less an adjustment for assets sub-advised by Mackenzie on behalf of Investors Group and Investment Planning Counsel.
28 POWER FINANCIAL CORPORATION 2015 ANNUAL REPORT
REVIEW OF FINANCIAL PERFORMANCE
PargesaPargesa’s contribution to Power Financial’s operating earnings was $112 million for the twelve-month period ended December 31, 2015, same as in the
corresponding period in 2014.
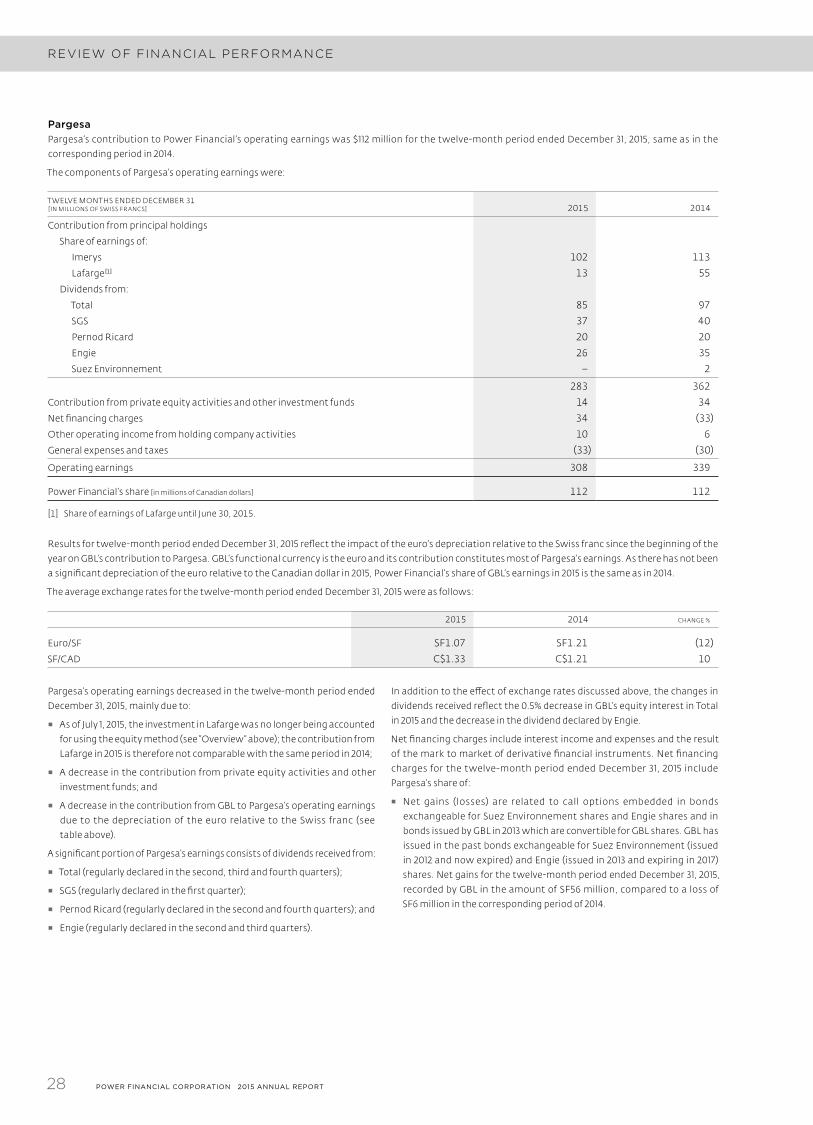
The components of Pargesa’s operating earnings were:
T WELVE MONTHS ENDED DECEMBER 31[IN MILLIONS OF SWISS FRANCS] 2015 2014
Contribution from principal holdings
Share of earnings of:
Imerys 102 113
Lafarge [1] 13 55
Dividends from:
Total 85 97
SGS 37 40
Pernod Ricard 20 20
Engie 26 35
Suez Environnement − 2
283 362
Contribution from private equity activities and other investment funds 14 34
Net financing charges 34 (33)
Other operating income from holding company activities 10 6
General expenses and taxes (33) (30)
Operating earnings 308 339
Power Financial’s share [in millions of Canadian dollars] 112 112
[1] Share of earnings of Lafarge until June 30, 2015.
Results for twelve-month period ended December 31, 2015 reflect the impact of the euro’s depreciation relative to the Swiss franc since the beginning of the
year on GBL’s contribution to Pargesa. GBL’s functional currency is the euro and its contribution constitutes most of Pargesa’s earnings. As there has not been
a significant depreciation of the euro relative to the Canadian dollar in 2015, Power Financial’s share of GBL’s earnings in 2015 is the same as in 2014.
The average exchange rates for the twelve-month period ended December 31, 2015 were as follows:
2015 2014 CHANGE %
Euro/SF SF1.07 SF1.21 (12)
SF/CAD C$1.33 C$1.21 10
Pargesa’s operating earnings decreased in the twelve-month period ended
December 31, 2015, mainly due to:
▪ As of July 1, 2015, the investment in Lafarge was no longer being accounted
for using the equity method (see “Overview” above); the contribution from
Lafarge in 2015 is therefore not comparable with the same period in 2014;
▪ A decrease in the contribution from private equity activities and other
investment funds; and
▪ A decrease in the contribution from GBL to Pargesa’s operating earnings
due to the depreciation of the euro relative to the Swiss franc (see
table above).
A significant portion of Pargesa’s earnings consists of dividends received from:
▪ Total (regularly declared in the second, third and fourth quarters);
▪ SGS (regularly declared in the first quarter);
▪ Pernod Ricard (regularly declared in the second and fourth quarters); and
▪ Engie (regularly declared in the second and third quarters).
In addition to the effect of exchange rates discussed above, the changes in
dividends received reflect the 0.5% decrease in GBL’s equity interest in Total
in 2015 and the decrease in the dividend declared by Engie.
Net financing charges include interest income and expenses and the result
of the mark to market of derivative financial instruments. Net financing
charges for the twelve-month period ended December 31, 2015 include
Pargesa’s share of:
▪ Net gains (losses) are related to call options embedded in bonds
exchangeable for Suez Environnement shares and Engie shares and in
bonds issued by GBL in 2013 which are convertible for GBL shares. GBL has
issued in the past bonds exchangeable for Suez Environnement (issued
in 2012 and now expired) and Engie (issued in 2013 and expiring in 2017)
shares. Net gains for the twelve-month period ended December 31, 2015,
recorded by GBL in the amount of SF56 million, compared to a loss of
SF6 million in the corresponding period of 2014.
29POWER FINANCIAL CORPORATION 2015 ANNUAL REPORT
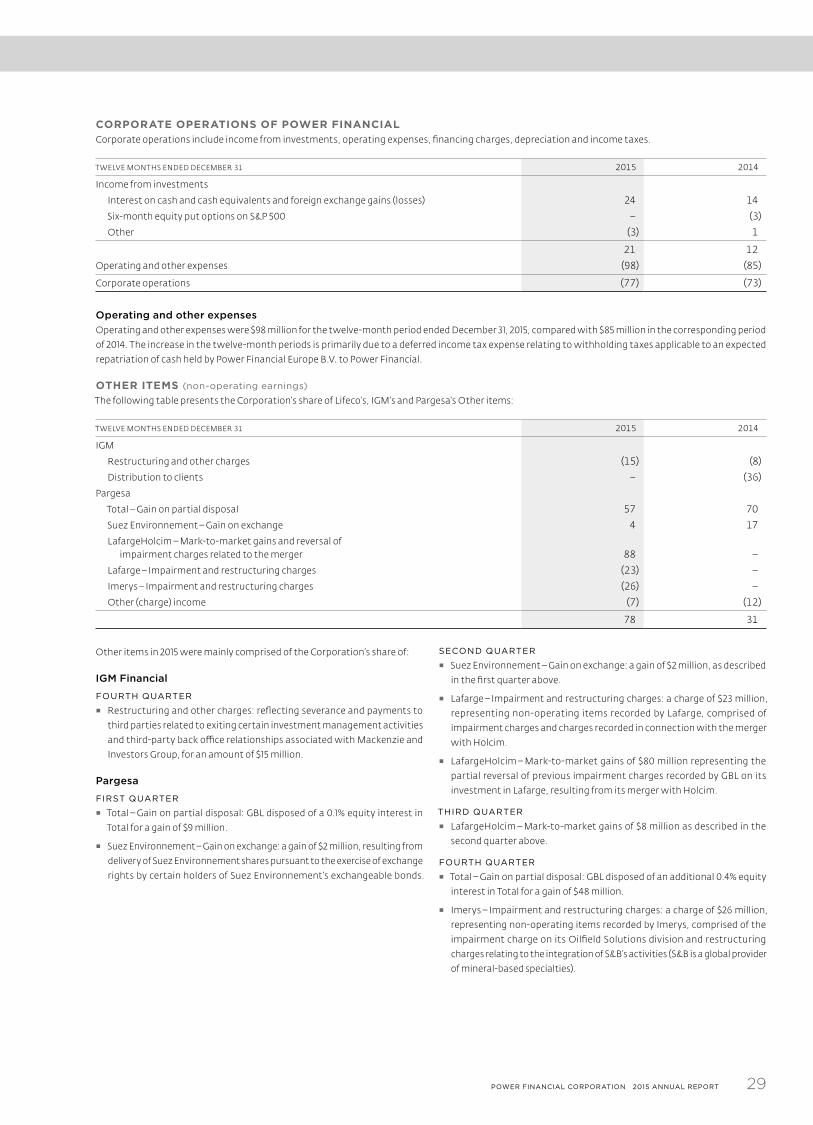
CORPORATE OPERATIONS OF POWER FINANCIALCorporate operations include income from investments, operating expenses, financing charges, depreciation and income taxes.
T WELVE MONTHS ENDED DECEMBER 31 2015 2014
Income from investments
Interest on cash and cash equivalents and foreign exchange gains (losses) 24 14
Six-month equity put options on S&P 500 − (3)
Other (3) 1
21 12
Operating and other expenses (98) (85)
Corporate operations (77) (73)
Operating and other expensesOperating and other expenses were $98 million for the twelve-month period ended December 31, 2015, compared with $85 million in the corresponding period
of 2014. The increase in the twelve-month periods is primarily due to a deferred income tax expense relating to withholding taxes applicable to an expected
repatriation of cash held by Power Financial Europe B.V. to Power Financial.
OTHER ITEMS (non-operating earnings)
The following table presents the Corporation’s share of Lifeco’s, IGM’s and Pargesa’s Other items:
T WELVE MONTHS ENDED DECEMBER 31 2015 2014
IGM
Restructuring and other charges (15) (8)
Distribution to clients − (36)
Pargesa
Total – Gain on partial disposal 57 70
Suez Environnement – Gain on exchange 4 17
LafargeHolcim – Mark-to-market gains and reversal of impairment charges related to the merger 88 −
Lafarge – Impairment and restructuring charges (23) −
Imerys – Impairment and restructuring charges (26) −
Other (charge) income (7) (12)
78 31
Other items in 2015 were mainly comprised of the Corporation’s share of:
IGM Financial
FOURTH QUARTER ▪ Restructuring and other charges: reflecting severance and payments to
third parties related to exiting certain investment management activities
and third-party back office relationships associated with Mackenzie and
Investors Group, for an amount of $15 million.
Pargesa
FIRST QUARTER ▪ Total – Gain on partial disposal: GBL disposed of a 0.1% equity interest in
Total for a gain of $9 million.
▪ Suez Environnement – Gain on exchange: a gain of $2 million, resulting from
delivery of Suez Environnement shares pursuant to the exercise of exchange
rights by certain holders of Suez Environnement’s exchangeable bonds.
SECOND QUARTER ▪ Suez Environnement – Gain on exchange: a gain of $2 million, as described
in the first quarter above.
▪ Lafarge – Impairment and restructuring charges: a charge of $23 million,
representing non-operating items recorded by Lafarge, comprised of
impairment charges and charges recorded in connection with the merger
with Holcim.
▪ LafargeHolcim – Mark-to-market gains of $80 million representing the
partial reversal of previous impairment charges recorded by GBL on its
investment in Lafarge, resulting from its merger with Holcim.
THIRD QUARTER ▪ LafargeHolcim – Mark-to-market gains of $8 million as described in the
second quarter above.
FOURTH QUARTER ▪ Total – Gain on partial disposal: GBL disposed of an additional 0.4% equity
interest in Total for a gain of $48 million.
▪ Imerys – Impairment and restructuring charges: a charge of $26 million,
representing non-operating items recorded by Imerys, comprised of the
impairment charge on its Oilfield Solutions division and restructuring
charges relating to the integration of S&B’s activities (S&B is a global provider
of mineral-based specialties).
30 POWER FINANCIAL CORPORATION 2015 ANNUAL REPORT
REVIEW OF FINANCIAL PERFORMANCE
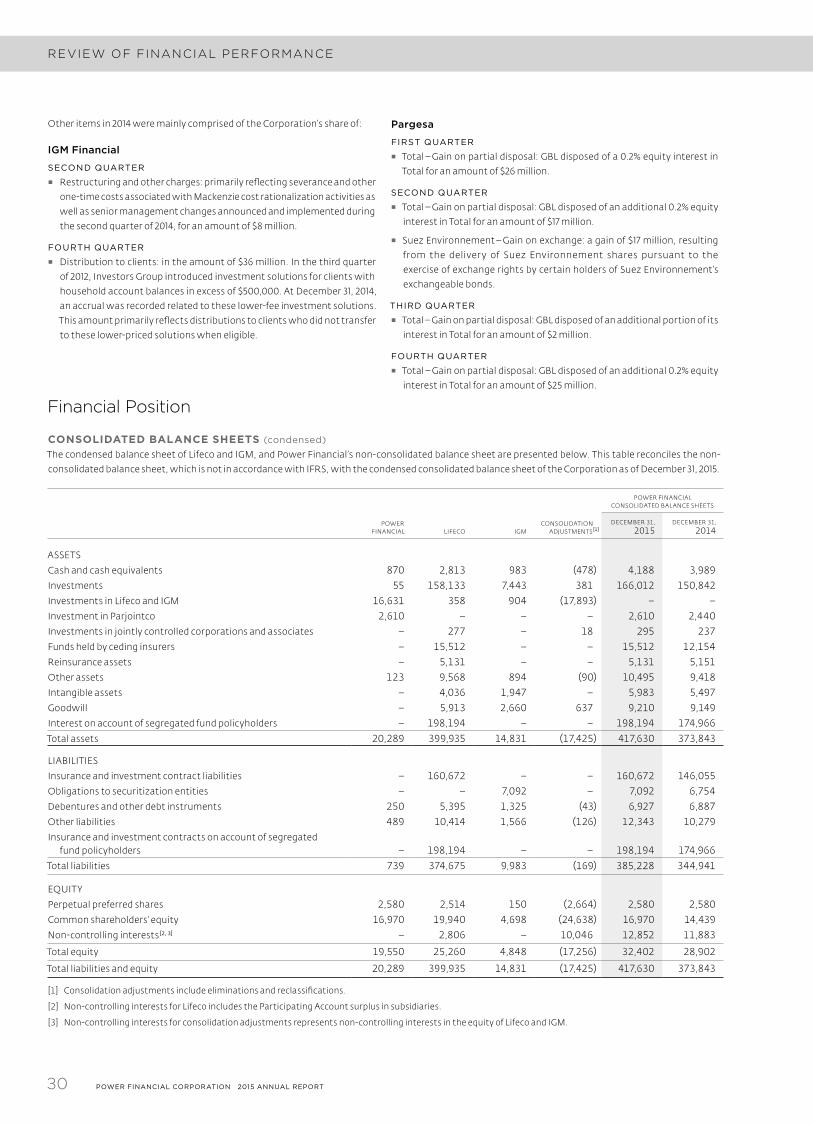
Other items in 2014 were mainly comprised of the Corporation’s share of:
IGM Financial
SECOND QUARTER ▪ Restructuring and other charges: primarily reflecting severance and other
one-time costs associated with Mackenzie cost rationalization activities as
well as senior management changes announced and implemented during
the second quarter of 2014, for an amount of $8 million.
FOURTH QUARTER ▪ Distribution to clients: in the amount of $36 million. In the third quarter
of 2012, Investors Group introduced investment solutions for clients with
household account balances in excess of $500,000. At December 31, 2014,
an accrual was recorded related to these lower-fee investment solutions.
This amount primarily reflects distributions to clients who did not transfer
to these lower-priced solutions when eligible.
Pargesa
FIRST QUARTER ▪ Total – Gain on partial disposal: GBL disposed of a 0.2% equity interest in
Total for an amount of $26 million.
SECOND QUARTER ▪ Total – Gain on partial disposal: GBL disposed of an additional 0.2% equity
interest in Total for an amount of $17 million.
▪ Suez Environnement – Gain on exchange: a gain of $17 million, resulting
from the deliver y of Suez Environnement shares pursuant to the
exercise of exchange rights by certain holders of Suez Environnement’s
exchangeable bonds.
THIRD QUARTER ▪ Total – Gain on partial disposal: GBL disposed of an additional portion of its
interest in Total for an amount of $2 million.
FOURTH QUARTER ▪ Total – Gain on partial disposal: GBL disposed of an additional 0.2% equity
interest in Total for an amount of $25 million.
Financial Position
CONSOLIDATED BALANCE SHEETS (condensed)
The condensed balance sheet of Lifeco and IGM, and Power Financial’s non-consolidated balance sheet are presented below. This table reconciles the non-
consolidated balance sheet, which is not in accordance with IFRS, with the condensed consolidated balance sheet of the Corporation as of December 31, 2015.
POWER FINANCIAL CONSOLIDATED BAL ANCE SHEETS
POWER FINANCIAL LIFECO IGM
CONSOLIDATION ADJUSTMENTS [1]
DECEMBER 31,2015
DECEMBER 31,2014
ASSETS
Cash and cash equivalents 870 2,813 983 (478) 4,188 3,989Investments 55 158,133 7,443 381 166,012 150,842Investments in Lifeco and IGM 16,631 358 904 (17,893) − −Investment in Parjointco 2,610 − − − 2,610 2,440Investments in jointly controlled corporations and associates − 277 − 18 295 237Funds held by ceding insurers − 15,512 − − 15,512 12,154Reinsurance assets − 5,131 − − 5,131 5,151Other assets 123 9,568 894 (90) 10,495 9,418Intangible assets − 4,036 1,947 − 5,983 5,497Goodwill − 5,913 2,660 637 9,210 9,149Interest on account of segregated fund policyholders − 198,194 − − 198,194 174,966Total assets 20,289 399,935 14,831 (17,425) 417,630 373,843
LIABILITIES
Insurance and investment contract liabilities − 160,672 − − 160,672 146,055Obligations to securitization entities − − 7,092 − 7,092 6,754Debentures and other debt instruments 250 5,395 1,325 (43) 6,927 6,887Other liabilities 489 10,414 1,566 (126) 12,343 10,279Insurance and investment contracts on account of segregated
fund policyholders − 198,194 − − 198,194 174,966Total liabilities 739 374,675 9,983 (169) 385,228 344,941
EQUITY
Perpetual preferred shares 2,580 2,514 150 (2,664) 2,580 2,580Common shareholders’ equity 16,970 19,940 4,698 (24,638) 16,970 14,439Non-controlling interests [2, 3] − 2,806 − 10,046 12,852 11,883
Total equity 19,550 25,260 4,848 (17,256) 32,402 28,902
Total liabilities and equity 20,289 399,935 14,831 (17,425) 417,630 373,843
[1] Consolidation adjustments include eliminations and reclassifications.
[2] Non-controlling interests for Lifeco includes the Participating Account surplus in subsidiaries.
[3] Non-controlling interests for consolidation adjustments represents non-controlling interests in the equity of Lifeco and IGM.
31POWER FINANCIAL CORPORATION 2015 ANNUAL REPORT
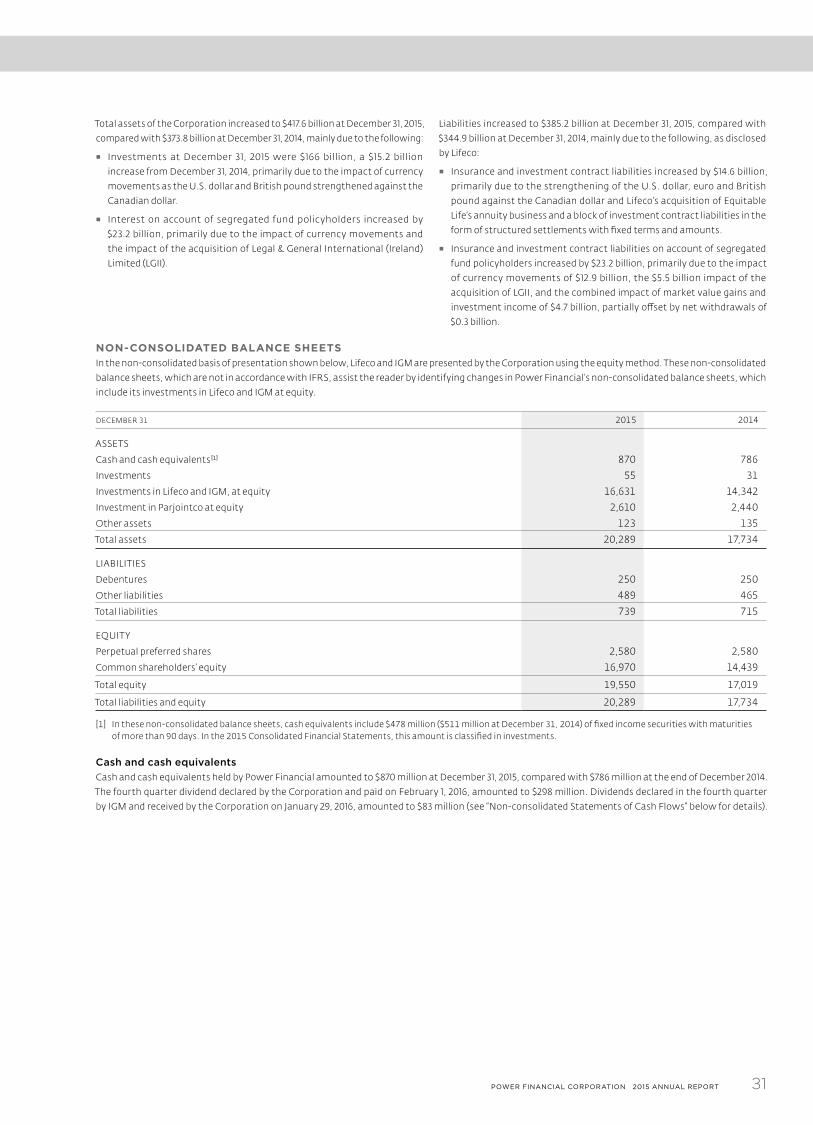
Total assets of the Corporation increased to $417.6 billion at December 31, 2015,
compared with $373.8 billion at December 31, 2014, mainly due to the following:
▪ Investments at December 31, 2015 were $166 billion, a $15.2 billion
increase from December 31, 2014, primarily due to the impact of currency
movements as the U.S. dollar and British pound strengthened against the
Canadian dollar.
▪ Interest on account of segregated fund policyholders increased by
$23.2 billion, primarily due to the impact of currency movements and
the impact of the acquisition of Legal & General International (Ireland)
Limited (LGII).
Liabilities increased to $385.2 billion at December 31, 2015, compared with
$344.9 billion at December 31, 2014, mainly due to the following, as disclosed
by Lifeco:
▪ Insurance and investment contract liabilities increased by $14.6 billion,
primarily due to the strengthening of the U.S. dollar, euro and British
pound against the Canadian dollar and Lifeco’s acquisition of Equitable
Life’s annuity business and a block of investment contract liabilities in the
form of structured settlements with fixed terms and amounts.
▪ Insurance and investment contract liabilities on account of segregated
fund policyholders increased by $23.2 billion, primarily due to the impact
of currency movements of $12.9 billion, the $5.5 billion impact of the
acquisition of LGII, and the combined impact of market value gains and
investment income of $4.7 billion, partially offset by net withdrawals of
$0.3 billion.
NON-CONSOLIDATED BALANCE SHEETSIn the non-consolidated basis of presentation shown below, Lifeco and IGM are presented by the Corporation using the equity method. These non-consolidated
balance sheets, which are not in accordance with IFRS, assist the reader by identifying changes in Power Financial’s non-consolidated balance sheets, which
include its investments in Lifeco and IGM at equity.
DECEMBER 31 2015 2014
ASSETS
Cash and cash equivalents [1] 870 786
Investments 55 31
Investments in Lifeco and IGM, at equity 16,631 14,342
Investment in Parjointco at equity 2,610 2,440
Other assets 123 135
Total assets 20,289 17,734
LIABILITIES
Debentures 250 250
Other liabilities 489 465
Total liabilities 739 715
EQUITY
Perpetual preferred shares 2,580 2,580
Common shareholders’ equity 16,970 14,439
Total equity 19,550 17,019
Total liabilities and equity 20,289 17,734
[1] In these non-consolidated balance sheets, cash equivalents include $478 million ($511 million at December 31, 2014) of fixed income securities with maturities of more than 90 days. In the 2015 Consolidated Financial Statements, this amount is classified in investments.
Cash and cash equivalentsCash and cash equivalents held by Power Financial amounted to $870 million at December 31, 2015, compared with $786 million at the end of December 2014.
The fourth quarter dividend declared by the Corporation and paid on February 1, 2016, amounted to $298 million. Dividends declared in the fourth quarter
by IGM and received by the Corporation on January 29, 2016, amounted to $83 million (see “Non-consolidated Statements of Cash Flows” below for details).
32 POWER FINANCIAL CORPORATION 2015 ANNUAL REPORT
REVIEW OF FINANCIAL PERFORMANCE
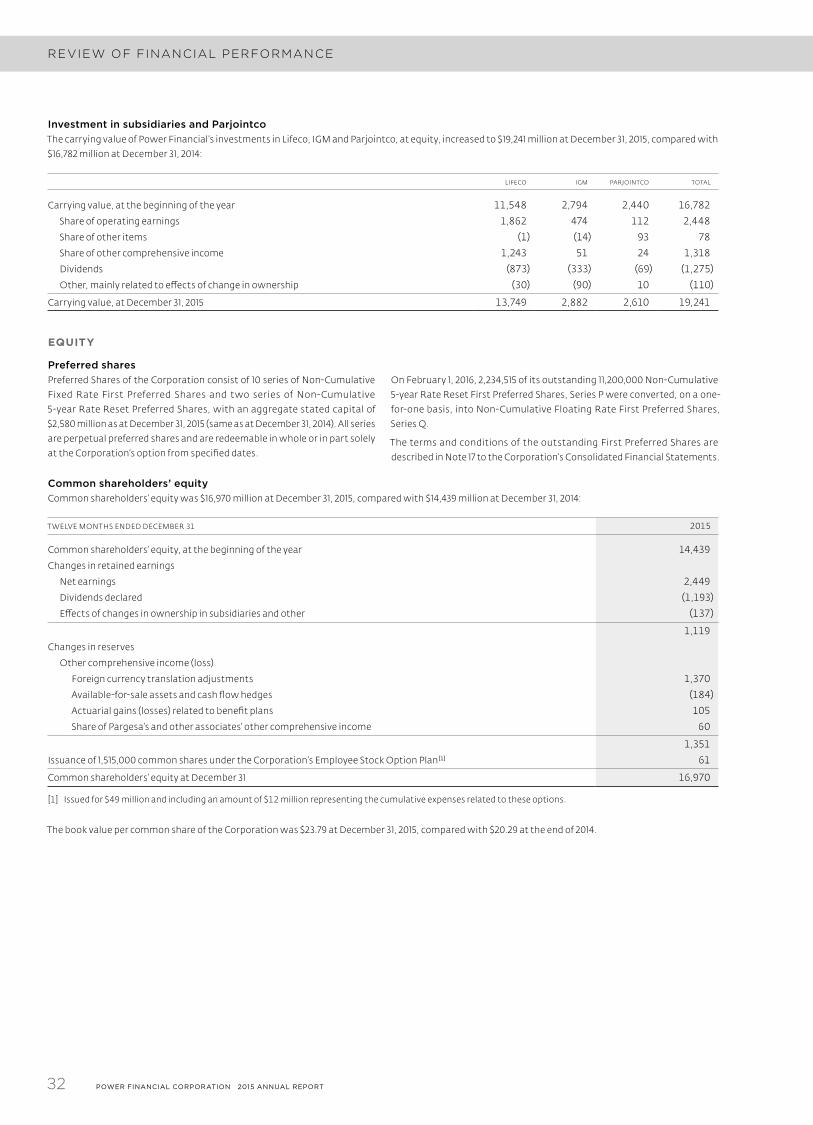
Investment in subsidiaries and ParjointcoThe carrying value of Power Financial’s investments in Lifeco, IGM and Parjointco, at equity, increased to $19,241 million at December 31, 2015, compared with
$16,782 million at December 31, 2014:
LIFECO IGM PARJOINTCO TOTAL
Carrying value, at the beginning of the year 11,548 2,794 2,440 16,782
Share of operating earnings 1,862 474 112 2,448
Share of other items (1) (14) 93 78
Share of other comprehensive income 1,243 51 24 1,318
Dividends (873) (333) (69) (1,275)
Other, mainly related to effects of change in ownership (30) (90) 10 (110)
Carrying value, at December 31, 2015 13,749 2,882 2,610 19,241
EQUITY
Preferred sharesPreferred Shares of the Corporation consist of 10 series of Non-Cumulative
Fixed Rate First Preferred Shares and two series of Non-Cumulative
5-year Rate Reset Preferred Shares, with an aggregate stated capital of
$2,580 million as at December 31, 2015 (same as at December 31, 2014). All series
are perpetual preferred shares and are redeemable in whole or in part solely
at the Corporation’s option from specified dates.
On February 1, 2016, 2,234,515 of its outstanding 11,200,000 Non-Cumulative
5-year Rate Reset First Preferred Shares, Series P were converted, on a one-
for-one basis, into Non-Cumulative Floating Rate First Preferred Shares,
Series Q.
The terms and conditions of the outstanding First Preferred Shares are
described in Note 17 to the Corporation’s Consolidated Financial Statements.
Common shareholders’ equityCommon shareholders’ equity was $16,970 million at December 31, 2015, compared with $14,439 million at December 31, 2014:
T WELVE MONTHS ENDED DECEMBER 31 2015
Common shareholders’ equity, at the beginning of the year 14,439
Changes in retained earnings
Net earnings 2,449
Dividends declared (1,193)
Effects of changes in ownership in subsidiaries and other (137)
1,119
Changes in reserves
Other comprehensive income (loss)
Foreign currency translation adjustments 1,370
Available-for-sale assets and cash flow hedges (184)
Actuarial gains (losses) related to benefit plans 105
Share of Pargesa’s and other associates’ other comprehensive income 60
1,351
Issuance of 1,515,000 common shares under the Corporation’s Employee Stock Option Plan [1] 61
Common shareholders’ equity at December 31 16,970
[1] Issued for $49 million and including an amount of $12 million representing the cumulative expenses related to these options.
The book value per common share of the Corporation was $23.79 at December 31, 2015, compared with $20.29 at the end of 2014.
33POWER FINANCIAL CORPORATION 2015 ANNUAL REPORT
Outstanding number of common sharesAs of the date hereof, there were 7 13,238,680 common shares of the
Corporation outstanding, compared with 711,723,680 as at December 31,
2014. The increase in the number of outstanding common shares reflects the
options exercised under the Corporation’s Employee Stock Option Plan. As of
the date hereof, options were outstanding to purchase up to an aggregate
of 8,773,932 common shares of the Corporation under the Corporation’s
Employee Stock Option Plan.
The Corporation filed a short-form base shelf prospectus dated November 24,
2014, pursuant to which, for a period of 25 months thereafter, the Corporation
may issue up to an aggregate of $3 billion of First Preferred Shares, common
shares, subscription receipts and unsecured debt securities, or any
combination thereof. This filing provides the Corporation with the flexibility
to access debt and equity markets on a timely basis.
Cash Flows
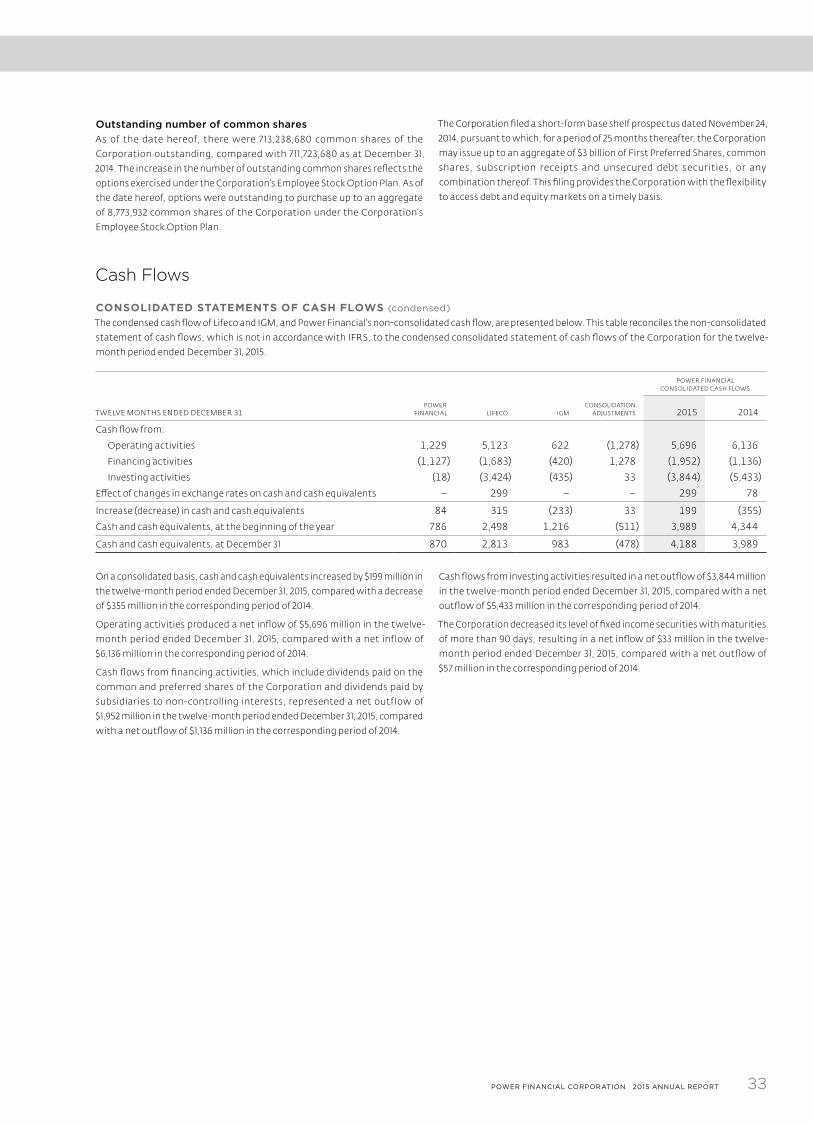
CONSOLIDATED STATEMENTS OF CASH FLOWS (condensed)
The condensed cash flow of Lifeco and IGM, and Power Financial’s non-consolidated cash flow, are presented below. This table reconciles the non-consolidated
statement of cash flows, which is not in accordance with IFRS, to the condensed consolidated statement of cash flows of the Corporation for the twelve-
month period ended December 31, 2015.
POWER FINANCIAL CONSOLIDATED CASH FLOWS
T WELVE MONTHS ENDED DECEMBER 31POWER
FINANCIAL LIFECO IGMCONSOLIDATION
ADJUSTMENTS 2015 2014
Cash flow from:
Operating activities 1,229 5,123 622 (1,278) 5,696 6,136
Financing activities (1,127) (1,683) (420) 1,278 (1,952) (1,136)
Investing activities (18) (3,424) (435) 33 (3,844) (5,433)
Effect of changes in exchange rates on cash and cash equivalents − 299 − − 299 78
Increase (decrease) in cash and cash equivalents 84 315 (233) 33 199 (355)
Cash and cash equivalents, at the beginning of the year 786 2,498 1,216 (511) 3,989 4,344
Cash and cash equivalents, at December 31 870 2,813 983 (478) 4,188 3,989
On a consolidated basis, cash and cash equivalents increased by $199 million in
the twelve-month period ended December 31, 2015, compared with a decrease
of $355 million in the corresponding period of 2014.
Operating activities produced a net inflow of $5,696 million in the twelve-
month period ended December 31, 2015, compared with a net inflow of
$6,136 million in the corresponding period of 2014.
Cash flows from financing activities, which include dividends paid on the
common and preferred shares of the Corporation and dividends paid by
subsidiaries to non-controlling interests, represented a net outflow of
$1,952 million in the twelve-month period ended December 31, 2015, compared
with a net outflow of $1,136 million in the corresponding period of 2014.
Cash flows from investing activities resulted in a net outflow of $3,844 million
in the twelve-month period ended December 31, 2015, compared with a net
outflow of $5,433 million in the corresponding period of 2014.
The Corporation decreased its level of fixed income securities with maturities
of more than 90 days, resulting in a net inflow of $33 million in the twelve-
month period ended December 31, 2015, compared with a net outflow of
$57 million in the corresponding period of 2014.
34 POWER FINANCIAL CORPORATION 2015 ANNUAL REPORT
REVIEW OF FINANCIAL PERFORMANCE
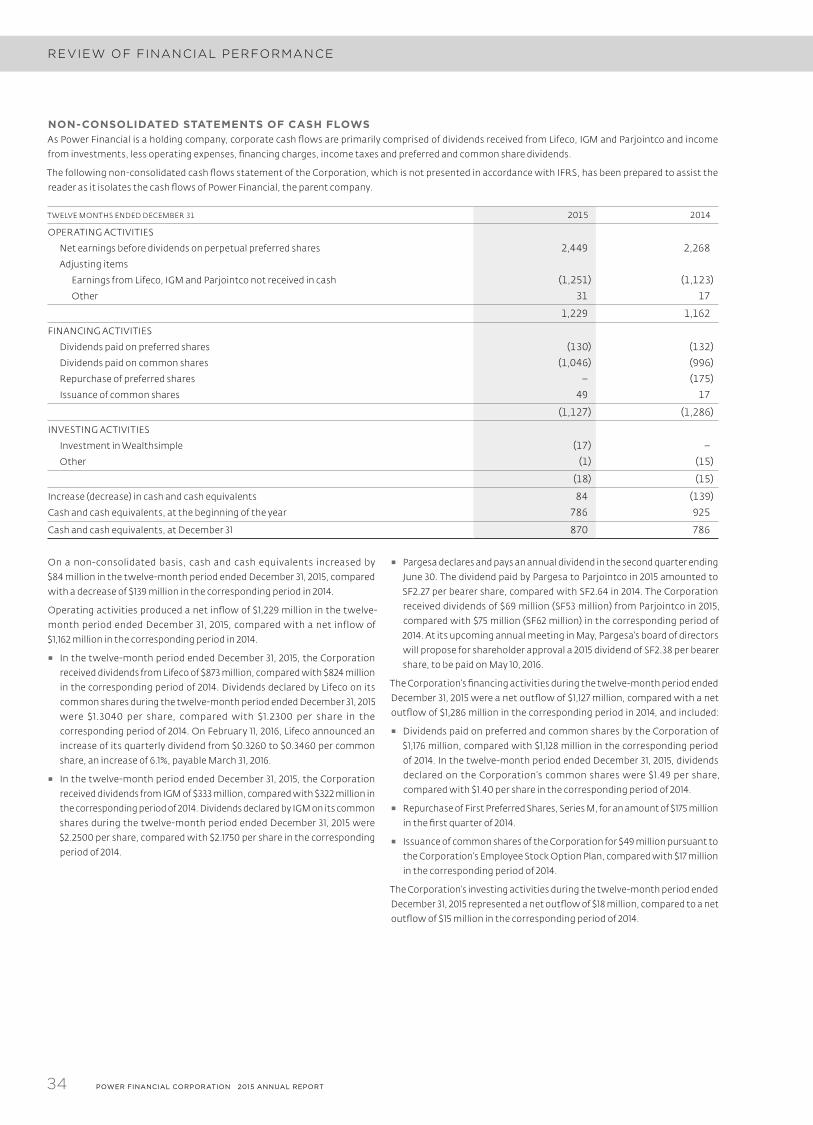
NON-CONSOLIDATED STATEMENTS OF CASH FLOWSAs Power Financial is a holding company, corporate cash flows are primarily comprised of dividends received from Lifeco, IGM and Parjointco and income
from investments, less operating expenses, financing charges, income taxes and preferred and common share dividends.
The following non-consolidated cash flows statement of the Corporation, which is not presented in accordance with IFRS, has been prepared to assist the
reader as it isolates the cash flows of Power Financial, the parent company.
T WELVE MONTHS ENDED DECEMBER 31 2015 2014
OPERATING ACTIVITIES
Net earnings before dividends on perpetual preferred shares 2,449 2,268
Adjusting items
Earnings from Lifeco, IGM and Parjointco not received in cash (1,251) (1,123)
Other 31 17
1,229 1,162
FINANCING ACTIVITIES
Dividends paid on preferred shares (130) (132)
Dividends paid on common shares (1,046) (996)
Repurchase of preferred shares − (175)
Issuance of common shares 49 17
(1,127) (1,286)
INVESTING ACTIVITIES
Investment in Wealthsimple (17) −
Other (1) (15)
(18) (15)
Increase (decrease) in cash and cash equivalents 84 (139)
Cash and cash equivalents, at the beginning of the year 786 925
Cash and cash equivalents, at December 31 870 786
On a non-consolidated basis, cash and cash equivalents increased by
$84 million in the twelve-month period ended December 31, 2015, compared
with a decrease of $139 million in the corresponding period in 2014.
Operating activities produced a net inflow of $1,229 million in the twelve-
month period ended December 31, 2015, compared with a net inflow of
$1,162 million in the corresponding period in 2014.
▪ In the twelve-month period ended December 31, 2015, the Corporation
received dividends from Lifeco of $873 million, compared with $824 million
in the corresponding period of 2014. Dividends declared by Lifeco on its
common shares during the twelve-month period ended December 31, 2015
were $1.3040 per share, compared with $1.2300 per share in the
corresponding period of 2014. On February 11, 2016, Lifeco announced an
increase of its quarterly dividend from $0.3260 to $0.3460 per common
share, an increase of 6.1%, payable March 31, 2016.
▪ In the twelve-month period ended December 31, 2015, the Corporation
received dividends from IGM of $333 million, compared with $322 million in
the corresponding period of 2014. Dividends declared by IGM on its common
shares during the twelve-month period ended December 31, 2015 were
$2.2500 per share, compared with $2.1750 per share in the corresponding
period of 2014.
▪ Pargesa declares and pays an annual dividend in the second quarter ending
June 30. The dividend paid by Pargesa to Parjointco in 2015 amounted to
SF2.27 per bearer share, compared with SF2.64 in 2014. The Corporation
received dividends of $69 million (SF53 million) from Parjointco in 2015,
compared with $75 million (SF62 million) in the corresponding period of
2014. At its upcoming annual meeting in May, Pargesa’s board of directors
will propose for shareholder approval a 2015 dividend of SF2.38 per bearer
share, to be paid on May 10, 2016.
The Corporation’s financing activities during the twelve-month period ended
December 31, 2015 were a net outflow of $1,127 million, compared with a net
outflow of $1,286 million in the corresponding period in 2014, and included:
▪ Dividends paid on preferred and common shares by the Corporation of
$1,176 million, compared with $1,128 million in the corresponding period
of 2014. In the twelve-month period ended December 31, 2015, dividends
declared on the Corporation’s common shares were $1.49 per share,
compared with $1.40 per share in the corresponding period of 2014.
▪ Repurchase of First Preferred Shares, Series M, for an amount of $175 million
in the first quarter of 2014.
▪ Issuance of common shares of the Corporation for $49 million pursuant to
the Corporation’s Employee Stock Option Plan, compared with $17 million
in the corresponding period of 2014.
The Corporation’s investing activities during the twelve-month period ended
December 31, 2015 represented a net outflow of $18 million, compared to a net
outflow of $15 million in the corresponding period of 2014.
35POWER FINANCIAL CORPORATION 2015 ANNUAL REPORT
Capital ManagementAs a holding company, Power Financial’s objectives in managing its capital
are to:
▪ provide attractive long-term returns to shareholders of the Corporation;
▪ provide sufficient financial flexibility to pursue its growth strategy to invest
on a timely basis in its operating companies and other investments as
opportunities present; and
▪ maintain an appropriate credit rating to ensure stable access to the
capital markets.
The Corporation manages its capital taking into consideration the risk
characteristics and liquidity of its holdings. In order to maintain or adjust its
capital structure, the Corporation may adjust the amount of dividends paid
to shareholders, return capital to shareholders or issue capital.
The Board of Directors of the Corporation is responsible for capital
management. Management of the Corporation is responsible for establishing
capital management procedures and for implementing and monitoring its
capital plans. The Board of Directors of the Corporation reviews and approves
capital transactions such as the issuance, redemption and repurchase of
common shares, perpetual preferred shares and debentures. The boards of
directors of the public subsidiaries, as well as those of Pargesa and GBL, are
responsible for their respective company’s capital management.
The Corporation holds positions in long-term investments as well as cash
and fixed income securities for liquidity purposes. With the exception
of debentures and other debt instruments, the Corporation’s capital is
permanent, matching the long-term nature of its investments. The
capital structure of the Corporation consists of perpetual preferred shares,
debentures, common shareholders’ equity, and non-controlling interests.
The Corporation views perpetual preferred shares as a permanent and
cost-effective source of capital consistent with its strategy of maintaining a
relatively low level of debt.
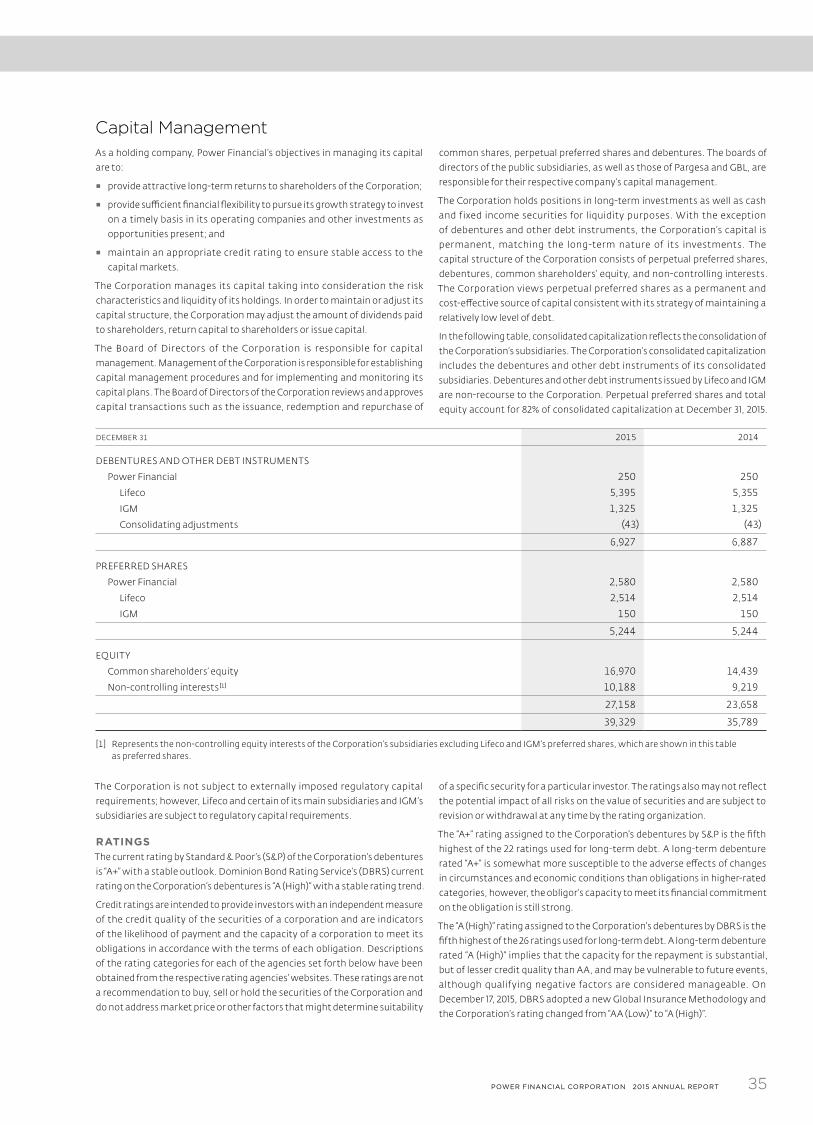
In the following table, consolidated capitalization reflects the consolidation of
the Corporation’s subsidiaries. The Corporation’s consolidated capitalization
includes the debentures and other debt instruments of its consolidated
subsidiaries. Debentures and other debt instruments issued by Lifeco and IGM
are non-recourse to the Corporation. Perpetual preferred shares and total
equity account for 82% of consolidated capitalization at December 31, 2015.
DECEMBER 31 2015 2014
DEBENTURES AND OTHER DEBT INSTRUMENTS
Power Financial 250 250
Lifeco 5,395 5,355
IGM 1,325 1,325
Consolidating adjustments (43) (43)
6,927 6,887
PREFERRED SHARES
Power Financial 2,580 2,580
Lifeco 2,514 2,514
IGM 150 150
5,244 5,244
EQUITY
Common shareholders’ equity 16,970 14,439
Non-controlling interests [1] 10,188 9,219
27,158 23,658
39,329 35,789
[1] Represents the non-controlling equity interests of the Corporation’s subsidiaries excluding Lifeco and IGM’s preferred shares, which are shown in this table as preferred shares.
The Corporation is not subject to externally imposed regulatory capital
requirements; however, Lifeco and certain of its main subsidiaries and IGM’s
subsidiaries are subject to regulatory capital requirements.
RATINGSThe current rating by Standard & Poor’s (S&P) of the Corporation’s debentures
is “A+” with a stable outlook. Dominion Bond Rating Service’s (DBRS) current
rating on the Corporation’s debentures is “A (High)” with a stable rating trend.
Credit ratings are intended to provide investors with an independent measure
of the credit quality of the securities of a corporation and are indicators
of the likelihood of payment and the capacity of a corporation to meet its
obligations in accordance with the terms of each obligation. Descriptions
of the rating categories for each of the agencies set forth below have been
obtained from the respective rating agencies’ websites. These ratings are not
a recommendation to buy, sell or hold the securities of the Corporation and
do not address market price or other factors that might determine suitability
of a specific security for a particular investor. The ratings also may not reflect
the potential impact of all risks on the value of securities and are subject to
revision or withdrawal at any time by the rating organization.
The “A+” rating assigned to the Corporation’s debentures by S&P is the fifth
highest of the 22 ratings used for long-term debt. A long-term debenture
rated “A+” is somewhat more susceptible to the adverse effects of changes
in circumstances and economic conditions than obligations in higher-rated
categories, however, the obligor’s capacity to meet its financial commitment
on the obligation is still strong.
The “A (High)” rating assigned to the Corporation’s debentures by DBRS is the
fifth highest of the 26 ratings used for long-term debt. A long-term debenture
rated “A (High)” implies that the capacity for the repayment is substantial,
but of lesser credit quality than AA, and may be vulnerable to future events,
although qualifying negative factors are considered manageable. On
December 17, 2015, DBRS adopted a new Global Insurance Methodology and
the Corporation’s rating changed from “AA (Low)” to “A (High)”.
36 POWER FINANCIAL CORPORATION 2015 ANNUAL REPORT
REVIEW OF FINANCIAL PERFORMANCE
Risk ManagementPower Financial is a holding company that holds substantial interests in the
financial services sector through its controlling interest in each of Lifeco
and IGM. As a result, the Corporation bears the risks associated with being
a significant shareholder of these operating companies. The respective
boards of directors of Lifeco, IGM, Pargesa and GBL are responsible for the risk
oversight function at their respective companies. The risk committee of the
board of directors of Lifeco is responsible for its risk oversight, and the board
of directors of IGM provides oversight and carries out its risk management
mandate through various committees. Certain officers of the Corporation are
members of these boards and committees of these boards and, consequently,
in their role as directors, they participate in the risk oversight function at the
operating companies. Pargesa, a holding company, is also subject to risks
due to the nature of its activities and also those of its direct subsidiary GBL.
These risks relate to credit, liquidity and market risk as described in Pargesa’s
consolidated financial statements for the year ended December 31, 2015.
The Corporation believes that a prudent approach to risk is achieved through a
governance model that focuses on the active oversight of its investments. The
Board of Directors of the Corporation has overall responsibility for operational
risks associated with financial instruments and for monitoring management’s
implementation and maintenance of policies and controls to manage the risks
associated with the Corporation’s business as a holding company.
The Board of Directors provides oversight and carries out its risk management
mandate primarily through the following committees:
▪ The Audit Committee addresses risks related to financial reporting.
▪ The Compensation Committee considers risks associated with the
Corporation’s compensation policies and practices.
▪ The Governance and Nominating Committee oversees the Corporation’s
approach to appropriately address potential r isk s related to
governance matters.
▪ The Related Party and Conduct Review Committee oversees the risks
related to transactions with related parties of the Corporation.
There are certain risks inherent in an investment in the securities of the
Corporation and in the activities of the Corporation, including the following
risks and others discussed elsewhere in this review of financial performance,
which investors should carefully consider before investing in securities of the
Corporation. The following is a review of certain risks that could impact the
financial condition and financial performance, and the value of the equity of
the Corporation. This description of risks does not include all possible risks,
and there may be other risks of which the Corporation is not currently aware.
OWNERSHIP OF COMMON AND PREFERRED SHARESThe share price of Power Financial and its subsidiaries may be volatile
and subject to fluctuations in response to numerous factors beyond
Power Financial’s and such subsidiaries’ control. Economic conditions may
adversely affect Power Financial and its subsidiaries, including fluctuations
in foreign exchange, inflation and interest rates, as well as monetary policies,
business investment and the health of capital markets in Canada, the United
States and Europe. In recent years, financial markets have experienced
significant price and volume fluctuations that have affected the market prices
of equity securities held by the Corporation and its subsidiaries and that
have often been unrelated to the operating performance, underlying asset
values or prospects of such companies. These factors may cause decreases
in asset values that are deemed to be significant or prolonged, which may
result in impairment charges. In periods of increased levels of volatility and
related market turmoil, Power Financial subsidiaries’ operations could be
adversely impacted and the trading price of Power Financial’s securities may
be adversely affected.
LAWS, RULES AND REGULATIONSThere are many laws, governmental rules and regulations and stock exchange
rules that apply to the Corporation. Changes in these laws, rules and
regulations, or their interpretation by governmental agencies or the courts,
could have a significant effect on the business and the financial condition of
the Corporation. The Corporation, in addition to complying with these laws,
rules and regulations, must also monitor them closely so that changes therein
are taken into account in the management of its activities.
FINANCIAL INSTRUMENTS RISKPower Financial has established policies, guidelines and procedures designed
to identify, measure, monitor and mitigate material risks associated with
financial instruments. The key risks related to financial instruments are
liquidity risk, credit risk and market risk.
▪ Liquidity risk is the risk that the Corporation will not be able to meet all
cash outflow obligations as they come due.
▪ Credit risk is the potential for financial loss to the Corporation if a
counterparty in a transaction fails to meet its obligations.
▪ Market risk is the risk that the fair value or future cash flows of a financial
instrument will fluctuate as a result of changes in market factors. Market
factors include three types of risks: currency risk, interest rate risk and
equity price risk.
▪ Currency risk relates to the Corporation operating in different currencies
and converting non-Canadian earnings at different points in time at
different foreign exchange levels when adverse changes in foreign
currency exchange rates occur.
▪ Interest rate risk is the risk that the fair value of future cash flows of a
financial instrument will fluctuate because of changes in the market
interest rates.
▪ Equity price risk is the uncertainty associated with the valuation of
assets arising from changes in equity markets.
Liquidity riskAs a holding company, Power Financial’s ability to meet its obligations,
including payment of interest, other operating expenses and dividends,
and to complete current or desirable future enhancement opportunities or
acquisitions generally depends upon dividends from its principal subsidiaries
(Lifeco and IGM) and Pargesa, and its ability to raise additional capital.
Dividends to shareholders of Power Financial will be dependent on the
operating performance, profitability, financial position and creditworthiness
of the subsidiaries of Power Financial and on their ability to pay dividends
to Power Financial. The ability of Lifeco and IGM, which are also holding
companies, to meet their obligations and pay dividends is dependent upon
receipt of dividends from their subsidiaries. The payment of interest and
dividends by Lifeco’s principal subsidiaries is subject to restrictions set out
in relevant corporate and insurance laws and regulations, which require
that solvency and capital ratios be maintained. The payment of interest and
dividends by IGM’s principal subsidiaries is subject to corporate laws and
regulations which require that solvency standards be maintained. In addition,
certain subsidiaries of IGM must also comply with capital and liquidity
requirements established by regulatory authorities.
37POWER FINANCIAL CORPORATION 2015 ANNUAL REPORT
Power Financial regularly reviews its liquidity requirements and seeks
to maintain a sufficient level of liquidity to meet its operating expenses,
financing charges and payment of preferred share dividends for a reasonable
period of time. If required, the ability of Power Financial to arrange additional
financing in the future will depend in part upon prevailing market conditions
as well as the business performance of Power Financial and its subsidiaries.
Although the Corporation has been able to access capital on financial markets
in the past, there can be no assurance this will be possible in the future. The
inability of Power Financial to access sufficient capital on acceptable terms
could have a material adverse effect on Power Financial’s business, prospects,
dividend paying capability and financial condition, and further enhancement
opportunities or acquisitions.
Power Financial’s management of liquidity risk has not changed materially
since December 31, 2014.
Credit riskFixed income securities and derivatives are subject to credit risk.
Power Financial mitigates credit risk on its fixed income securities by
adhering to an investment policy that establishes guidelines which provide
exposure limits by defining admissible securities, minimum rating and
concentration limits.
Fixed income securities, which are included in investments and in cash and
cash equivalents, consist primarily of bonds, bankers’ acceptances and
highly liquid temporary deposits with Canadian chartered banks and banks
in jurisdictions where Power Financial operates as well as bonds and short-
term securities of, or guaranteed by, the Canadian or U.S. governments.
Power Financial regularly reviews the credit ratings of its counterparties.
The maximum exposure to credit risk on these financial instruments is their
carrying value.
Derivatives continue to be utilized on a basis consistent with the risk
management guidelines of Power Financial and are monitored by the
Corporation for effectiveness as economic hedges even if specific hedge
accounting requirements are not met. Power Financial regularly reviews the
credit ratings of derivative financial instrument counterparties. Derivative
contracts are over-the-counter with counterparties that are highly rated
financial institutions.
Power Financial’s exposure to and management of credit risk related to
cash and cash equivalents, fixed income securities and derivatives have not
changed materially since December 31, 2014.
Market riskPower Financial’s financial instruments are comprised of cash and cash
equivalents, fixed income securities and debentures.
CURRENCY RISK
In managing its own cash and cash equivalents and fixed income securities,
Power Financial may hold cash balances denominated in foreign currencies
and thus be exposed to fluctuations in exchange rates. In order to protect
against such fluctuations, Power Financial may from time to time enter
into currency-hedging transactions with highly rated financial institutions.
As at December 31, 2015, approximately 88% of Power Financial’s cash
and cash equivalents and fixed income securities were denominated in
Canadian dollars.
Power Financial is exposed through Parjointco to foreign exchange risk as
a result of Parjointco’s investment in Pargesa, a company whose functional
currency is the Swiss franc. Foreign currency translation gains and losses from
Pargesa are recorded in other comprehensive income.
INTEREST RATE RISK
Power Financial’s financial instruments do not have significant exposure to
interest rate risk.
EQUITY PRICE RISK
Power Financial’s financial instruments do not have significant exposure to
equity price risk.
Power Financial’s management of financial instruments risk has not changed materially since December 31, 2014. For a further discussion of Power Financial’s
financial instruments risk management, refer to Note 21 to the Corporation’s 2015 Consolidated Financial Statements. Lifeco’s and IGM’s management of
financial instruments risk has not changed materially since December 31, 2014.
Financial Instruments
FAIR VALUE OF FINANCIAL INSTRUMENTSFinancial instruments held by the Corporation and its subsidiaries include
investments, derivative financial instruments, debentures and other debt
instruments, investment contract liabilities and certain other assets
and liabilities.
Fair value represents the amount that would be exchanged in an arm’s-length
transaction between willing parties and is best evidenced by a quoted market
price, if one exists. Fair values represent management’s estimates and are
generally calculated using market information and at a specific point in time
and may not reflect future fair values. The calculations are subjective in nature,
involve uncertainties and matters of significant judgment.
The Corporation’s financial assets and financial liabilities recorded at fair value
and those for which fair value is disclosed have been categorized based upon
the following fair value hierarchy:
▪ Level 1 inputs utilize observable, unadjusted quoted prices in active
markets for identical assets or liabilities that the Corporation has the
ability to access.
▪ Level 2 inputs utilize other-than-quoted prices included in Level 1 that are
observable for the asset or liability, either directly or indirectly.
▪ Level 3 inputs utilize one or more significant inputs that are not based on
observable market inputs and include situations where there is little, if any,
market activity for the asset or liability.
In certain cases, the inputs used to measure fair value may fall into
different levels of the fair value hierarchy. In such cases, the level in the fair
value hierarchy within which the fair value measurement falls has been
determined based on the lowest level input that is significant to the fair
value measurement. The Corporation’s assessment of the significance of
a particular input to the fair value measurement requires judgment and
considers factors specific to the asset or liability.
38 POWER FINANCIAL CORPORATION 2015 ANNUAL REPORT
REVIEW OF FINANCIAL PERFORMANCE
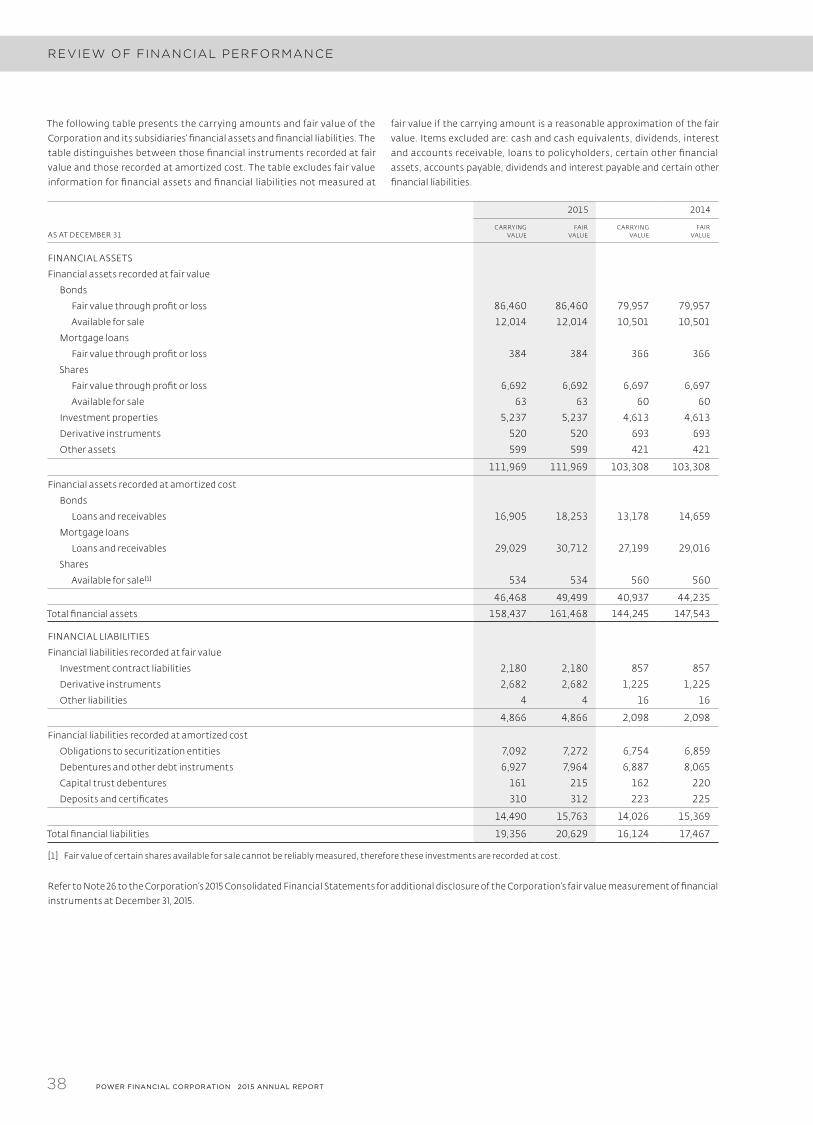
The following table presents the carrying amounts and fair value of the
Corporation and its subsidiaries’ financial assets and financial liabilities. The
table distinguishes between those financial instruments recorded at fair
value and those recorded at amortized cost. The table excludes fair value
information for financial assets and financial liabilities not measured at
fair value if the carrying amount is a reasonable approximation of the fair
value. Items excluded are: cash and cash equivalents, dividends, interest
and accounts receivable, loans to policyholders, certain other financial
assets, accounts payable, dividends and interest payable and certain other
financial liabilities.
2015 2014
AS AT DECEMBER 31CARRYING
VALUEFAIR
VALUECARRYING
VALUEFAIR
VALUE
FINANCIAL ASSETS
Financial assets recorded at fair value
Bonds
Fair value through profit or loss 86,460 86,460 79,957 79,957
Available for sale 12,014 12,014 10,501 10,501
Mortgage loans
Fair value through profit or loss 384 384 366 366
Shares
Fair value through profit or loss 6,692 6,692 6,697 6,697
Available for sale 63 63 60 60
Investment properties 5,237 5,237 4,613 4,613
Derivative instruments 520 520 693 693
Other assets 599 599 421 421
111,969 111,969 103,308 103,308
Financial assets recorded at amortized cost
Bonds
Loans and receivables 16,905 18,253 13,178 14,659
Mortgage loans
Loans and receivables 29,029 30,712 27,199 29,016
Shares
Available for sale [1] 534 534 560 560
46,468 49,499 40,937 44,235
Total financial assets 158,437 161,468 144,245 147,543
FINANCIAL LIABILITIES
Financial liabilities recorded at fair value
Investment contract liabilities 2,180 2,180 857 857
Derivative instruments 2,682 2,682 1,225 1,225
Other liabilities 4 4 16 16
4,866 4,866 2,098 2,098
Financial liabilities recorded at amortized cost
Obligations to securitization entities 7,092 7,272 6,754 6,859
Debentures and other debt instruments 6,927 7,964 6,887 8,065
Capital trust debentures 161 215 162 220
Deposits and certificates 310 312 223 225
14,490 15,763 14,026 15,369
Total financial liabilities 19,356 20,629 16,124 17,467
[1] Fair value of certain shares available for sale cannot be reliably measured, therefore these investments are recorded at cost.
Refer to Note 26 to the Corporation’s 2015 Consolidated Financial Statements for additional disclosure of the Corporation’s fair value measurement of financial
instruments at December 31, 2015.
39POWER FINANCIAL CORPORATION 2015 ANNUAL REPORT
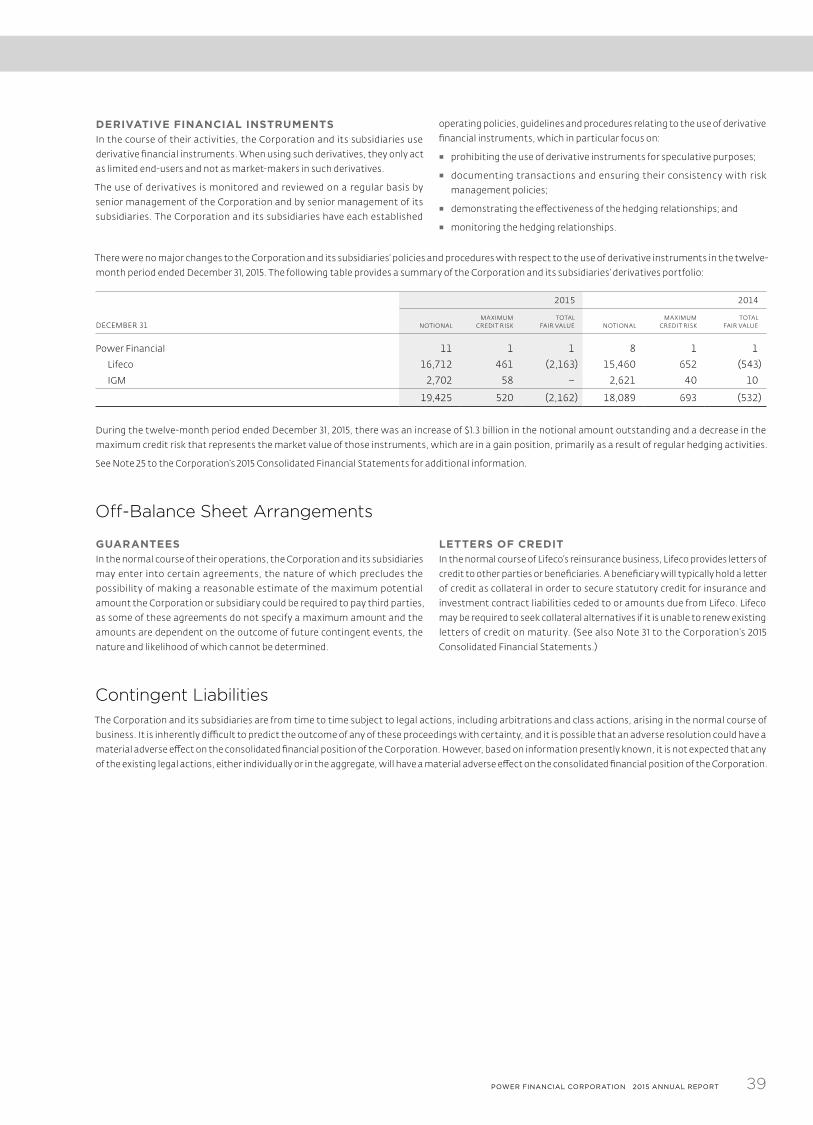
DERIVATIVE FINANCIAL INSTRUMENTSIn the course of their activities, the Corporation and its subsidiaries use
derivative financial instruments. When using such derivatives, they only act
as limited end-users and not as market-makers in such derivatives.
The use of derivatives is monitored and reviewed on a regular basis by
senior management of the Corporation and by senior management of its
subsidiaries. The Corporation and its subsidiaries have each established
operating policies, guidelines and procedures relating to the use of derivative
financial instruments, which in particular focus on:
▪ prohibiting the use of derivative instruments for speculative purposes;
▪ documenting transactions and ensuring their consistency with risk
management policies;
▪ demonstrating the effectiveness of the hedging relationships; and
▪ monitoring the hedging relationships.
There were no major changes to the Corporation and its subsidiaries’ policies and procedures with respect to the use of derivative instruments in the twelve-
month period ended December 31, 2015. The following table provides a summary of the Corporation and its subsidiaries’ derivatives portfolio:
2015 2014
DECEMBER 31 NOTIONALMA XIMUM
CREDIT RISKTOTAL
FAIR VALUE NOTIONALMA XIMUM
CREDIT RISKTOTAL
FAIR VALUE
Power Financial 11 1 1 8 1 1
Lifeco 16,712 461 (2,163) 15,460 652 (543)
IGM 2,702 58 − 2,621 40 10
19,425 520 (2,162) 18,089 693 (532)
During the twelve-month period ended December 31, 2015, there was an increase of $1.3 billion in the notional amount outstanding and a decrease in the
maximum credit risk that represents the market value of those instruments, which are in a gain position, primarily as a result of regular hedging activities.
See Note 25 to the Corporation’s 2015 Consolidated Financial Statements for additional information.
Off-Balance Sheet Arrangements
GUARANTEESIn the normal course of their operations, the Corporation and its subsidiaries
may enter into certain agreements, the nature of which precludes the
possibility of making a reasonable estimate of the maximum potential
amount the Corporation or subsidiary could be required to pay third parties,
as some of these agreements do not specify a maximum amount and the
amounts are dependent on the outcome of future contingent events, the
nature and likelihood of which cannot be determined.
LETTERS OF CREDITIn the normal course of Lifeco’s reinsurance business, Lifeco provides letters of
credit to other parties or beneficiaries. A beneficiary will typically hold a letter
of credit as collateral in order to secure statutory credit for insurance and
investment contract liabilities ceded to or amounts due from Lifeco. Lifeco
may be required to seek collateral alternatives if it is unable to renew existing
letters of credit on maturity. (See also Note 31 to the Corporation’s 2015
Consolidated Financial Statements.)
Contingent LiabilitiesThe Corporation and its subsidiaries are from time to time subject to legal actions, including arbitrations and class actions, arising in the normal course of
business. It is inherently difficult to predict the outcome of any of these proceedings with certainty, and it is possible that an adverse resolution could have a
material adverse effect on the consolidated financial position of the Corporation. However, based on information presently known, it is not expected that any
of the existing legal actions, either individually or in the aggregate, will have a material adverse effect on the consolidated financial position of the Corporation.
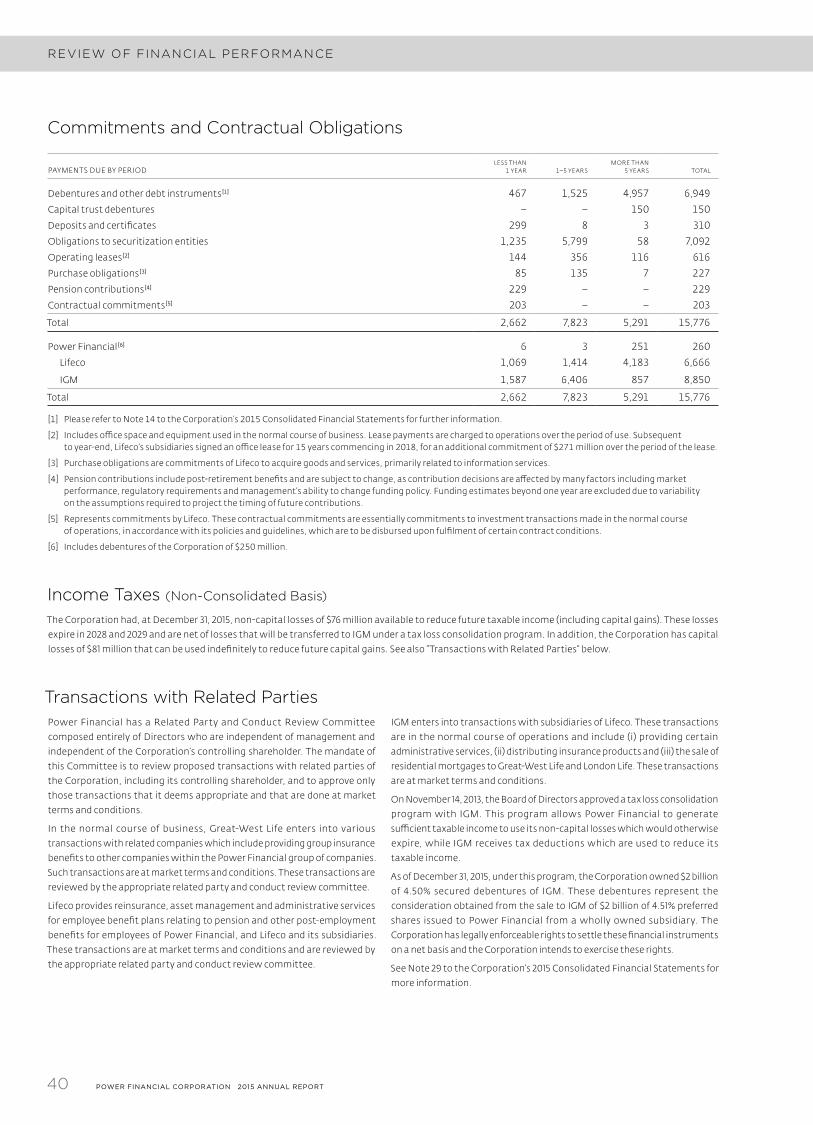
40 POWER FINANCIAL CORPORATION 2015 ANNUAL REPORT
REVIEW OF FINANCIAL PERFORMANCE
Commitments and Contractual Obligations
PAYMENTS DUE BY PERIODLESS THAN
1 YEAR 1–5 YEARSMORE THAN
5 YEARS TOTAL
Debentures and other debt instruments [1] 467 1,525 4,957 6,949
Capital trust debentures − − 150 150
Deposits and certificates 299 8 3 310
Obligations to securitization entities 1,235 5,799 58 7,092
Operating leases [2] 144 356 116 616
Purchase obligations [3] 85 135 7 227
Pension contributions [4] 229 − − 229
Contractual commitments [5] 203 − − 203
Total 2,662 7,823 5,291 15,776
Power Financial [6] 6 3 251 260
Lifeco 1,069 1,414 4,183 6,666
IGM 1,587 6,406 857 8,850
Total 2,662 7,823 5,291 15,776
[1] Please refer to Note 14 to the Corporation’s 2015 Consolidated Financial Statements for further information.
[2] Includes office space and equipment used in the normal course of business. Lease payments are charged to operations over the period of use. Subsequent to year-end, Lifeco’s subsidiaries signed an office lease for 15 years commencing in 2018, for an additional commitment of $271 million over the period of the lease.
[3] Purchase obligations are commitments of Lifeco to acquire goods and services, primarily related to information services.
[4] Pension contributions include post-retirement benefits and are subject to change, as contribution decisions are affected by many factors including market performance, regulatory requirements and management’s ability to change funding policy. Funding estimates beyond one year are excluded due to variability on the assumptions required to project the timing of future contributions.
[5] Represents commitments by Lifeco. These contractual commitments are essentially commitments to investment transactions made in the normal course of operations, in accordance with its policies and guidelines, which are to be disbursed upon fulfilment of certain contract conditions.
[6] Includes debentures of the Corporation of $250 million.
Income Taxes (Non-Consolidated Basis)
The Corporation had, at December 31, 2015, non-capital losses of $76 million available to reduce future taxable income (including capital gains). These losses
expire in 2028 and 2029 and are net of losses that will be transferred to IGM under a tax loss consolidation program. In addition, the Corporation has capital
losses of $81 million that can be used indefinitely to reduce future capital gains. See also “Transactions with Related Parties” below.
Transactions with Related PartiesPower Financial has a Related Party and Conduct Review Committee
composed entirely of Directors who are independent of management and
independent of the Corporation’s controlling shareholder. The mandate of
this Committee is to review proposed transactions with related parties of
the Corporation, including its controlling shareholder, and to approve only
those transactions that it deems appropriate and that are done at market
terms and conditions.
In the normal course of business, Great-West Life enters into various
transactions with related companies which include providing group insurance
benefits to other companies within the Power Financial group of companies.
Such transactions are at market terms and conditions. These transactions are
reviewed by the appropriate related party and conduct review committee.
Lifeco provides reinsurance, asset management and administrative services
for employee benefit plans relating to pension and other post-employment
benefits for employees of Power Financial, and Lifeco and its subsidiaries.
These transactions are at market terms and conditions and are reviewed by
the appropriate related party and conduct review committee.
IGM enters into transactions with subsidiaries of Lifeco. These transactions
are in the normal course of operations and include (i) providing certain
administrative services, (ii) distributing insurance products and (iii) the sale of
residential mortgages to Great-West Life and London Life. These transactions
are at market terms and conditions.
On November 14, 2013, the Board of Directors approved a tax loss consolidation
program with IGM. This program allows Power Financial to generate
sufficient taxable income to use its non-capital losses which would otherwise
expire, while IGM receives tax deductions which are used to reduce its
taxable income.
As of December 31, 2015, under this program, the Corporation owned $2 billion
of 4.50% secured debentures of IGM. These debentures represent the
consideration obtained from the sale to IGM of $2 billion of 4.51% preferred
shares issued to Power Financial from a wholly owned subsidiary. The
Corporation has legally enforceable rights to settle these financial instruments
on a net basis and the Corporation intends to exercise these rights.
See Note 29 to the Corporation’s 2015 Consolidated Financial Statements for
more information.
41POWER FINANCIAL CORPORATION 2015 ANNUAL REPORT
Summary of Critical Accounting Estimates and JudgmentsIn the preparation of the financial statements, management of the
Corporation and the managements of its subsidiaries — Lifeco and IGM —
are required to make estimates and assumptions that affect the reported
amounts of assets, liabilities, net earnings and related disclosures. Key sources
of estimation uncertainty and areas where significant judgments made by the
management of the Corporation and the managements of its subsidiaries are:
the entities to be consolidated, insurance and investment contract liabilities,
fair value measurements, investment impairment, goodwill and intangible
assets (including deferred selling commissions), income taxes and employee
future benefits. These are described in the notes to the Corporation’s 2015
Consolidated Financial Statements.
CONSOLIDATIONManagement of the Corporation consolidates all subsidiaries and entities
in which it has determined that the Corporation has control. Control is
evaluated according to the ability of the Corporation to direct the relevant
activities of the subsidiary or other structured entity in order to derive variable
returns. Management of the Corporation and each of its subsidiaries exercice
judgment in determining whether control exists. Judgment is exercised in
the evaluation of the variable returns and in determining the extent to which
the Corporation and its subsidiaries have the ability to exercise the power to
generate variable returns.
INSURANCE AND INVESTMENT CONTRACT LIABILITIESInsurance and investment contract liabilities represent the amounts
required, in addition to future premiums and investment income, to provide
for future benefit payments, policyholder dividends, commission and policy
administrative expenses for all insurance and annuity policies in force with
Lifeco. The Appointed Actuaries of Lifeco’s subsidiaries are responsible for
determining the amount of the liabilities to make appropriate provisions for
Lifeco’s obligations to policyholders. The Appointed Actuaries determine
the insurance and investment contract liabilities using generally accepted
actuarial practices, according to the standards established by the Canadian
Institute of Actuaries. The valuation of insurance contracts uses the Canadian
Asset Liability Method (CALM). This method involves the projection of future
events in order to determine the amount of assets that must be set aside
currently to provide for all future obligations and involves a significant amount
of judgment.
In the computation of insurance contract liabilities, valuation assumptions
have been made regarding rates of mortality and morbidity, investment returns,
levels of operating expenses, rates of policy termination and rates of utilization
of elective policy options or provisions. The valuation assumptions use best
estimates of future experience together with a margin for adverse deviation.
These margins are necessary to provide for possibilities of misestimation and/or
future deterioration in the best estimate assumptions and provide reasonable
assurance that insurance contract liabilities cover a range of possible outcomes.
Margins are reviewed periodically for continued appropriateness.
Investment contract liabilities are measured at fair value determined using
discounted cash flows utilizing the yield curves of financial instruments with
similar cash flow characteristics.
Additional details regarding these estimates can be found in Note 12 to the
Corporation’s 2015 Consolidated Financial Statements.
FAIR VALUE MEASUREMENTThe carrying values of financial assets necessarily reflect the prevailing market
liquidity and the liquidity premiums embedded in the market pricing methods
that the Corporation and its subsidiaries rely upon.
Fair value movement on the assets supporting insurance contract liabilities
is a major factor in the movement of insurance contract liabilities. Changes
in the fair value of bonds designated or classified as fair value through
profit or loss that support insurance contract liabilities are largely offset by
corresponding changes in the fair value of liabilities, except when the bond
has been deemed impaired.
The following is a description of the methodologies used to determine
fair value.
BONDS AT FAIR VALUE THROUGH PROFIT OR LOSS AND AVAILABLE FOR SALE
Fair values for bonds recorded at fair value through profit or loss or available
for sale are determined with reference to quoted market bid prices primarily
provided by third-party independent pricing sources. The Corporation and
its subsidiaries maximize the use of observable inputs and minimize the use
of unobservable inputs when measuring fair value. The Corporation and
its subsidiaries obtain quoted prices in active markets, when available, for
identical assets at the balance sheet dates to measure bonds at fair value in
its fair value through profit or loss and available-for-sale portfolios. Where
prices are not quoted in a normally active market, fair values are determined
by valuation models.
The Corporation and its subsidiaries estimate the fair value of bonds not
traded in active markets by referring to actively traded securities with similar
attributes, dealer quotations, matrix pricing methodology, discounted cash
flow analyses and/or internal valuation models. This methodology considers
such factors as the issuer’s industry, the security’s rating, term, coupon rate
and position in the capital structure of the issuer, as well as yield curves, credit
curves, prepayment rates and other relevant factors. For bonds that are not
traded in active markets, valuations are adjusted to reflect illiquidity, and such
adjustments are generally based on available market evidence. In the absence
of such evidence, management’s best estimate is used.
SHARES AT FAIR VALUE THROUGH PROFIT OR LOSS AND AVAILABLE FOR SALE
Fair values for publicly traded shares are generally determined by the last
bid price for the security from the exchange where it is principally traded.
Fair values for shares for which there is no active market are determined by
discounting expected future cash flows. The Corporation and its subsidiaries
maximize the use of observable inputs and minimize the use of unobservable
inputs when measuring fair value. The Corporation and its subsidiaries obtain
quoted prices in active markets, when available, for identical assets at the
balance sheet dates to measure shares at fair value in its fair value through
profit or loss and available-for-sale portfolios.
MORTGAGE LOANS AND BONDS CLASSIFIED AS LOANS AND RECEIVABLES
The fair values disclosed for bonds and mortgage loans classified as loans and
receivables are determined by discounting expected future cash flows using
current market rates. Valuation inputs typically include benchmark yields and
risk-adjusted spreads based on current lending activities and market activity.
42 POWER FINANCIAL CORPORATION 2015 ANNUAL REPORT
REVIEW OF FINANCIAL PERFORMANCE
INVESTMENT PROPERTIES
Fair values for investment properties are determined using independent
qualif ied appraisal ser vices and include any adjustments by Lifeco
management for material changes in proper ty cash flows, capital
expenditures or general market conditions in the interim period between
appraisals. The determination of the fair value of investment property
requires the use of estimates including future cash flows (such as future
leasing assumptions, rental rates, capital and operating expenditures) and
discount, reversionary and overall capitalization rates applicable to the
asset based on current market conditions. Investment properties under
construction are valued at fair value if such values can be reliably determined;
otherwise, they are recorded at cost.
INVESTMENT IMPAIRMENTInvestments are reviewed regularly on an individual basis at the end of each
reporting period to determine whether there is any objective evidence that
the investment is impaired. The Corporation and its subsidiaries consider
various factors in the impairment evaluation process, including, but not
limited to, the financial condition of the issuer, specific adverse conditions
affecting an industry or region, decline in fair value not related to interest
rates, bankruptcy or defaults, and delinquency in payments of interest
or principal.
Investments are deemed to be impaired when there is no longer reasonable
assurance of collection. The fair value of an investment is not a definitive
indicator of impairment, as it may be significantly influenced by other factors,
including the remaining term to maturity and liquidity of the asset. However,
market price is taken into consideration when evaluating impairment.
For impaired mortgage loans, and bonds classified as loans and receivables,
provisions are established or impairments recorded to adjust the carrying
value to the net realizable amount. Wherever possible the fair value of
collateral underlying the loans or observable market price is used to establish
net realizable value. For impaired available-for-sale bonds, the accumulated
loss recorded in other comprehensive income is reclassified to net investment
income. Impairments on available-for-sale debt instruments are reversed if
there is objective evidence that a permanent recovery has occurred. As well,
when determined to be impaired, interest is no longer accrued and previous
interest accruals are reversed.
Impairment losses on available-for-sale shares are recorded if the loss is
significant or prolonged and subsequent losses are recorded in net earnings.
GOODWILL AND INDEFINITE LIFE INTANGIBLES IMPAIRMENT TESTINGGoodwill and indefinite life intangible assets are tested for impairment
annually or more frequently if events indicate that impairment may have
occurred. Indefinite life intangible assets that were previously impaired are
reviewed at each reporting date for evidence of reversal.
Goodwill and indefinite life intangible assets have been allocated to cash
generating units or to groups of cash generating units (CGU), representing
the lowest level that the assets are monitored for internal reporting purposes.
Goodwill and indefinite life intangible assets are tested for impairment
by comparing the carrying value of the CGU to the recoverable amount of
the CGU to which the goodwill and indefinite life intangible assets have
been allocated.
An impairment loss is recognized for the amount by which the asset’s carrying
amount exceeds its recoverable amount. The recoverable amount is the
higher of the asset’s fair value less cost of disposal or value in use, which is
calculated using the present value of estimated future cash flows expected
to be generated.
DEFERRED SELLING COMMISSIONSCommissions paid by IGM on the sale of certain mutual fund products are
deferred and amortized over a maximum period of seven years. IGM regularly
reviews the carrying value of deferred selling commissions with respect to
any events or circumstances that indicate impairment. Among the tests
performed by IGM to assess recoverability is the comparison of the future
economic benefits derived from the deferred selling commission asset in
relation to its carrying value. At December 31, 2015, there were no indications
of impairment to deferred selling commissions.
43POWER FINANCIAL CORPORATION 2015 ANNUAL REPORT
PENSION PLANS AND OTHER POST-EMPLOYMENT BENEFITSThe Corporation and its subsidiaries maintain funded defined benefit pension
plans for certain employees and advisors, unfunded supplementary employee
retirement plans for certain employees, and unfunded post-employment
health, dental and life insurance benefits to eligible employees, advisors
and their dependants. The Corporation’s subsidiaries also maintain defined
contribution pension plans for eligible employees and advisors.
The defined benefit pension plans provide pensions based on length of
service and final average earnings. Expenses for the defined benefit plans
are actuarially determined using the projected unit credit method prorated
on service based upon management of the Corporation and its subsidiaries’
assumptions about discount rates, compensation increases, retirement ages
of employees, mortality and expected health care costs. Any changes in these
assumptions will impact the carrying amount of defined benefit obligations.
The Corporation and its subsidiaries’ accrued benefit liability in respect of
defined benefit plans is calculated separately for each plan by discounting the
amount of the benefit that employees have earned in return for their service
in current and prior periods and deducting the fair value of any plan assets.
▪ The Corporation and its subsidiaries determine the net interest component
of the pension expense for the period by applying the discount rate used
to measure the accrued benefit liability at the beginning of the annual
period to the net accrued benefit liability. The discount rate used to value
liabilities is determined using a yield curve of AA corporate debt securities.
▪ If the plan benefits are changed, or a plan is curtailed, any past service costs
or curtailment gains or losses are recognized immediately in net earnings.
▪ Net interest costs, current service costs, past service costs and curtailment
gains or losses are included in operating and administrative expenses.
▪ Remeasurements arising from defined benefit plans represent actuarial
gains and losses, and the actual return on plan assets, less interest calculated
at the discount rate and changes in the asset ceiling. Remeasurements are
recognized immediately through other comprehensive income and are not
reclassified to net earnings.
▪ The accrued benefit asset (liability) represents the plan surplus (deficit).
▪ Payments to the defined contribution plans are expensed as incurred.
INCOME TAXES
Current income taxCurrent income tax is based on taxable income for the year. Current tax
liabilities (assets) for the current and prior periods are measured at the
amount expected to be paid to (recovered from) the taxation authorities using
the rates that have been enacted or substantively enacted at the balance
sheet date. Current tax assets and current tax liabilities are offset, if a legally
enforceable right exists to offset the recognized amounts and the entity
intends either to settle on a net basis, or to realize the assets and settle the
liabilities simultaneously.
A provision for tax uncertainties which meets the probable threshold for
recognition is measured based on the probability weighted average approach.
Deferred income taxDeferred income tax is the tax expected to be payable or recoverable on
differences arising between the carrying amounts of assets and liabilities
in the financial statements and the corresponding tax basis used in the
computation of taxable income and on unused tax attributes, and is
accounted for using the balance sheet liability method. Deferred tax liabilities
are generally recognized for all taxable temporary differences and deferred
tax assets are recognized to the extent that it is probable that future taxable
profits will be available against which deductible temporary differences and
unused tax attributes can be utilized.
Deferred tax assets and liabilities are measured at the tax rates expected to
apply in the year when the asset is realized or the liability is settled, based on
tax rates and tax laws that have been enacted or substantively enacted at the
balance sheet date. Deferred tax assets and deferred tax liabilities are offset,
if a legally enforceable right exists to net current tax assets against current
tax liabilities and the deferred taxes relate to the same taxable entity and the
same taxation authority.
The carrying amount of deferred tax assets is reviewed at each balance sheet
date and reduced to the extent that it is no longer probable that sufficient
future taxable profits will be available to allow all or part of the deferred
tax asset to be utilized. Unrecognized deferred tax assets are reassessed at
each balance sheet date and are recognized to the extent that it has become
probable that future taxable profits will allow the deferred tax asset to
be recovered.
Deferred tax liabilities are recognized for taxable temporary differences
arising on investments in the subsidiaries, jointly controlled corporations and
associates, except where the group controls the timing of the reversal of the
temporary differences and it is probable that the temporary differences will
not reverse in the foreseeable future.
44 POWER FINANCIAL CORPORATION 2015 ANNUAL REPORT
REVIEW OF FINANCIAL PERFORMANCE
Changes in Accounting PoliciesThere were no changes to the Corporation’s accounting policies for the year ended December 31, 2015.
Future Accounting ChangesThe Corporation and its subsidiaries continuously monitor the potential
changes proposed by the International Accounting Standards Board (IASB)
and analyze the effect that changes in the standards may have on their
consolidated financial statements when they become effective.
IFRS 4 — INSURANCE CONTRACTSIn June 2013, the IASB issued a revised IFRS 4, Insurance Contracts exposure
draft proposing changes to the accounting standard for insurance contracts.
The IASB continues to deliberate the proposals in this exposure draft. The
proposed standard differs significantly from Lifeco’s current accounting and
actuarial practices under the Canadian Asset Liability Method (CALM) and is
expected to produce more volatile financial results.
Lifeco has disclosed that it is actively monitoring developments in this area
and that it will continue to measure insurance contract liabilities under
current accounting and actuarial policies, including CALM, until a new IFRS
for insurance contract measurement is issued and effective.
IFRS 9 — FINANCIAL INSTRUMENTSThe IASB issued IFRS 9, Financial Instruments, which replaces IAS 39,
Financial Instruments: Recognition and Measurement, the current standard for
accounting for financial instruments. The standard was completed in three
separate phases:
▪ Classification and measurement: this phase requires that financial assets
be classified at either amortized cost or fair value on the basis of the entity’s
business model for managing the financial assets and the contractual cash
flow characteristics of the financial assets.
▪ Impairment methodology: this phase replaces the current incurred loss
model for impairment of financial assets with an expected loss model.
▪ Hedge accounting: this phase replaces the current rule-based hedge
accounting requirements in IAS 39 with guidance that more closely aligns
the accounting with an entity’s risk management activities.
In December 2015, the IASB published an exposure draft with proposed
amendments to IFRS 4, Insurance Contracts to alleviate the temporary
consequences of the different effective dates with IFRS 9. Companies whose
business model is to predominantly issue insurance contracts are allowed the
option to defer the effective date of IFRS 9 until the earliest of the mandatory
effective date of IFRS 4 or January 1, 2021. For companies that do not issue
insurance contracts, the effective date of January 1, 2018 should remain. The
Corporation and its subsidiaries are evaluating the impact of the adoption
of this standard.
IFRS 15 — REVENUE FROM CONTRACTS WITH CUSTOMERSThe IASB issued IFRS 15, Revenue from Contracts with Customers, which provides
a single model for entities to use in accounting for revenue arising from
contracts with customers. The model requires an entity to recognize revenue
as the goods or services are transferred to customers in an amount that
reflects the expected consideration. The revenue recognition requirements
in IFRS 15 do not apply to the revenue arising from insurance contracts, leases
and financial instruments.
The standard will be effective January 1, 2018. The Corporation and its
subsidiaries are evaluating the impact of the adoption of this standard.
IFRS 16 — LEASESIn January 2016, the IASB issued IFRS 16, Leases, which requires a lessee to
recognize a right-of-use asset representing its right to use the underlying
leased asset and a corresponding lease liability representing its obligation to
make lease payments for all leases. A lessee recognizes the related expense
as depreciation on the right-of-use asset and interest on the lease liability.
Short-term (less than 12 months) and low-value asset leases are exempt from
these requirements.
The standard will be effective January 1, 2019. The Corporation and its
subsidiaries are evaluating the impact of the adoption of this standard.
Disclosure Controls and ProceduresBased on their evaluations as at December 31, 2015, the Chief Executive Officer and Chief Financial Officer have concluded that the Corporation’s disclosure
controls and procedures were effective as at December 31, 2015.
Internal Control Over Financial ReportingThe Corporation’s internal control over financial reporting is designed to
provide reasonable assurance regarding the reliability of financial reporting
and that the preparation of financial statements for external purposes is
in accordance with IFRS. The Corporation’s management is responsible
for establishing and maintaining effective internal control over financial
reporting. All internal control systems have inherent limitations and may
become ineffective because of changes in conditions. Therefore, even those
systems determined to be effective can provide only reasonable assurance
with respect to financial statement preparation and presentation.
The Corporation’s management, under the supervision of the Chief Executive
Officer and the Chief Financial Officer, has evaluated the effectiveness of the
Corporation’s internal control over financial reporting as at December 31,
2015, based on the Internal Control – Integrated Framework (COSO 2013
Framework) published by The Committee of Sponsoring Organizations of
the Treadway Commission. Based on such evaluation, the Chief Executive
Officer and the Chief Financial Officer have concluded that the Corporation’s
internal control over financial reporting was effective as at December 31, 2015.
There have been no changes in the Corporation’s internal control over financial
reporting during the year ended December 31, 2015 which have materially
affected, or are reasonably likely to materially affect, the Corporation’s
internal control over financial reporting.
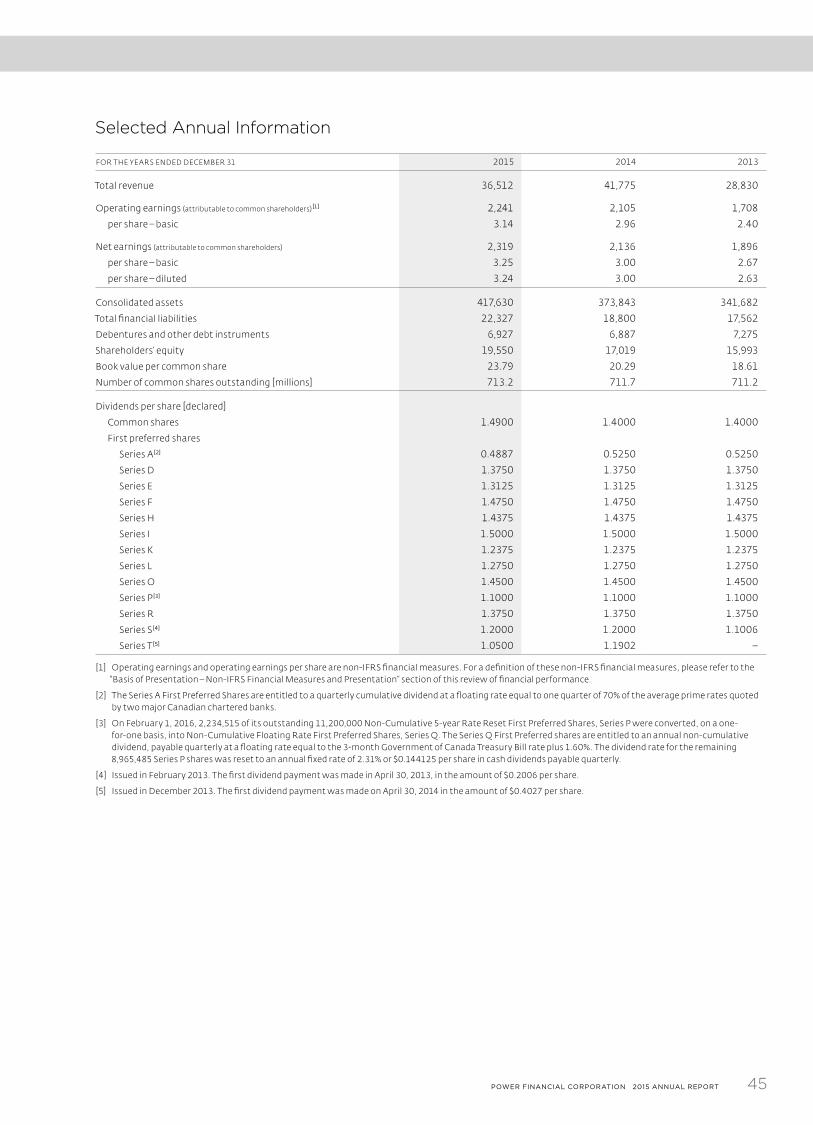
45POWER FINANCIAL CORPORATION 2015 ANNUAL REPORT
Selected Annual Information
FOR THE YEARS ENDED DECEMBER 31 2015 2014 2013
Total revenue 36,512 41,775 28,830
Operating earnings (attributable to common shareholders) [1] 2,241 2,105 1,708
per share – basic 3.14 2.96 2.40
Net earnings (attributable to common shareholders) 2,319 2,136 1,896
per share – basic 3.25 3.00 2.67
per share – diluted 3.24 3.00 2.63
Consolidated assets 417,630 373,843 341,682
Total financial liabilities 22,327 18,800 17,562
Debentures and other debt instruments 6,927 6,887 7,275
Shareholders’ equity 19,550 17,019 15,993
Book value per common share 23.79 20.29 18.61
Number of common shares outstanding [millions] 713.2 711.7 711.2
Dividends per share [declared]
Common shares 1.4900 1.4000 1.4000
First preferred shares
Series A [2] 0.4887 0.5250 0.5250
Series D 1.3750 1.3750 1.3750
Series E 1.3125 1.3125 1.3125
Series F 1.4750 1.4750 1.4750
Series H 1.4375 1.4375 1.4375
Series I 1.5000 1.5000 1.5000
Series K 1.2375 1.2375 1.2375
Series L 1.2750 1.2750 1.2750
Series O 1.4500 1.4500 1.4500
Series P [3] 1.1000 1.1000 1.1000
Series R 1.3750 1.3750 1.3750
Series S [4] 1.2000 1.2000 1.1006
Series T [5] 1.0500 1.1902 −
[1] Operating earnings and operating earnings per share are non-IFRS financial measures. For a definition of these non-IFRS financial measures, please refer to the “Basis of Presentation – Non-IFRS Financial Measures and Presentation” section of this review of financial performance.
[2] The Series A First Preferred Shares are entitled to a quarterly cumulative dividend at a floating rate equal to one quarter of 70% of the average prime rates quoted by two major Canadian chartered banks.
[3] On February 1, 2016, 2,234,515 of its outstanding 11,200,000 Non-Cumulative 5-year Rate Reset First Preferred Shares, Series P were converted, on a one-for-one basis, into Non-Cumulative Floating Rate First Preferred Shares, Series Q. The Series Q First Preferred shares are entitled to an annual non-cumulative dividend, payable quarterly at a floating rate equal to the 3-month Government of Canada Treasury Bill rate plus 1.60%. The dividend rate for the remaining 8,965,485 Series P shares was reset to an annual fixed rate of 2.31% or $0.144125 per share in cash dividends payable quarterly.
[4] Issued in February 2013. The first dividend payment was made in April 30, 2013, in the amount of $0.2006 per share.
[5] Issued in December 2013. The first dividend payment was made on April 30, 2014 in the amount of $0.4027 per share.


![Financial Results, Performance Highlights & Limited Review for Dec 31, 2014 (Standalone) [Result]](https://img.pdfslide.us/doc/110x75/577cb0fc1a28aba7118b65b9/financial-results-performance-highlights-limited-review-for-dec-31-2014.jpg)


![Financial Results, Performance Review & Limited Review Report for June 30, 2015 (Standalone) [Company Update]](https://img.pdfslide.us/doc/110x75/577cb2a31a28aba7118c1f28/financial-results-performance-review-limited-review-report-for-june-30.jpg)