Embed Size (px)
Citation preview
http://rer.aera.netResearch
Review of Educational
http://rer.sagepub.com/content/60/2/265The online version of this article can be found at:
DOI: 10.3102/00346543060002265
1990 60: 265REVIEW OF EDUCATIONAL RESEARCHChen-Lin C. Kulik, James A. Kulik and Robert L. Bangert-Drowns
Effectiveness of Mastery Learning Programs: A Meta-Analysis
Published on behalf of
American Educational Research Association
and
http://www.sagepublications.com
can be found at:Review of Educational ResearchAdditional services and information for
http://rer.aera.net/alertsEmail Alerts:
http://rer.aera.net/subscriptionsSubscriptions:
http://www.aera.net/reprintsReprints:
http://www.aera.net/permissionsPermissions:
http://rer.sagepub.com/content/60/2/265.refs.htmlCitations:
at UNIV OF KENTUCKY on December 27, 2010http://rer.aera.netDownloaded from

Review of Educational Research Summer 1990, Vol. 60, No. 2, pp. 265-299
Effectiveness of Mastery Learning Programs: A Meta-Analysis
Chen-Lin C. Kulik and James A. Kulik University of Michigan
and
Robert L. Bangert-Drowns State University of New York
A meta-analysis of findings from 108 controlled evaluations showed that mastery learning programs have positive effects on the examination performance of students in colleges, high schools, and the upper grades in elementary schools. The effects appear to be stronger on the weaker students in a class, and they also vary as a function of mastery procedures used, experimental designs of studies, and course content. Mastery programs have positive effects on student attitudes toward course content and instruction but may increase student time on instructional tasks. In addition, self paced mastery programs often reduce the completion rates in college classes.
Mastery learning is not a new idea in education. In several individualized systems of instruction developed during the 1920s and 1930s, students were required to demonstrate their mastery of each lesson on formal tests before moving on to new material (Washburne & Marland, 1963). But mastery learning programs did not become a prominent feature on the educational landscape until the 1960s (J. Kulik, 1983). At that time several educators developed teaching methodologies in which mastery learning played a key role.
Two approaches became especially influential: Bloom's Learning for Mastery (LFM) and Keller's Personalized System of Instruction (PSI). In both LFM and PSI courses, material to be learned is divided into short units, and students take formative tests on each unit of material (Bloom, 1968; Keller, 1968). LFM and PSI differ in several respects, however. Lessons in LFM courses are teacher presented, and students move through these courses at a uniform, teacher-controlled pace. Lessons in PSI courses are presented largely through written materials, and students move through these lessons at their own rates. Students who fail unit quizzes in PSI courses must restudy material and take tests on the material until they are able to demonstrate mastery. Students who fail unit quizzes in LFM courses usually
The material in this report is based on work supported by National Science Foundation Grant No. MDR 8470258. Any opinions, findings, and conclusions or recommendations expressed in this report are those of the authors and do not necessarily reflect the views of the National Science Foundation. Requests for reprints should be sent to Chen-Lin C. Kulik, Center for Research on Learning and Teaching, University of Michigan, 109 E. Madison St., Ann Arbor, MI 48109.
265
at UNIV OF KENTUCKY on December 27, 2010http://rer.aera.netDownloaded from

Kulik, Kulik, and Bangert-Drowns
receive individual or group tutorial help on the unit before moving on to new material.
Bloom's (1968) article on the mastery model is now generally recognized as the classic theoretical formulation on the topic. The article contrasts a conventional model of school learning with the mastery model. In the conventional model, all students in a class, no matter what their initial aptitude, receive the same instruction. Because instruction is uniform for all, whereas aptitude for learning varies, the end result of instruction varies. Aptitude scores are usually normally distributed at the beginning of a conventional class; final examination scores are usually normally distributed at course end. With mastery learning, on the other hand, each student is given the amount and kind of instruction individually needed. Instruction varies according to need, and the end result is a uniformly high level of performance for all.
Bloom (1968) has made a number of specific predictions about the gains from mastery learning procedures. One is that in mastery classes, 90% of the students will achieve at the level previously reached by the top 10%. That means that the vast majority of students in mastery classrooms should perform at or above the 90th percentile on criterion examinations. With all but a few students performing at this same high level, variation in student performance should be near zero. The correlation between initial aptitude and final performance should also be near zero in mastery learning courses.
Bloom (1976) has also suggested that students will not have to put in much more time on school tasks to achieve this level of proficiency. According to Bloom, students with weak backgrounds need more time to reach proficiency only in the initial stages of a course. Their need for extra time vanishes as they master the fundamental material. In the later stages of a course, all mastery students should approach new material with a confident command of the fundamentals. Eventually, all students in mastery courses should learn at the same quick pace. Instructional needs of less able students should become indistinguishable from the needs of more able students.
Three major reviews of evaluation studies of mastery programs have appeared in the literature within the past decade. Each of the reviews used a quantitative, or meta-analytic, methodology to integrate the evaluation findings, but the reviewers reached different conclusions about the effectiveness of mastery programs. Guskey and Gates (1985) reported that LFM procedures produced an average improvement on examination scores of 0.78 standard deviations, or strong positive effects. Along with Cohen (J. Kulik, Kulik, & Cohen, 1979), we reported somewhat lower, but still impressive, effects in our review of PSI studies. We found that the average effect of PSI was to raise student scores on final examinations by 0.49 standard deviations, or by a moderate amount. In his review of LFM programs in elementary and secondary schools, however, Slavin (1987) charged that earlier reviews exaggerated the effects of mastery programs. We were unable to calculate an average effect for the 17 studies analyzed by Slavin, because he reported only the direction of differences for several comparisons. The median effect in the 17 studies, however, was an increase in examination scores of 0.25 standard deviations, a low effect.
Resolving the differences in reviewer conclusions is complicated by at least two factors. One is the limited focus of each review. Our review (J. Kulik et al., 1979) focused on PSI studies completed before 1978 and covered almost no studies
266
at UNIV OF KENTUCKY on December 27, 2010http://rer.aera.netDownloaded from
Mastery Learning Effects
carried out as dissertation research. Guskey and Gates (1985) restricted their review to LFM programs, and Slavin (1987) restricted his to group-based LFM programs in elementary and secondary schools. Although reviews by Guskey and Gates and Slavin both covered LFM programs, the overlap in their study pools was slight: Only 5 of the 25 precollege studies reviewed by Guskey and Gates were included in the pool of 17 studies that Slavin analyzed.
Another complicating factor in integrating review results is the different ways in which reviewers select studies, code and analyze data, and report their findings. Each set of reviewers of the mastery learning literature had its own standards for selecting studies; each focused on an idiosyncratic set of study features to analyze; and each conducted statistical analyses and reported results in its own ways. Given such idiosyncrasies, one cannot get a clear picture of mastery learning results simply by summing or averaging findings in the three reviews.
The primary purpose of the present review is to present in a consistent format as much of the available evidence on effectiveness of mastery programs as possible so that conclusions can be drawn both about overall effectiveness of the programs and about the factors that influence estimates of program effectiveness. Like other recent reviews, this one uses a meta-analytic methodology to integrate the study findings.
Method
The meta-analytic approach used in this review is similar to that described by Glass, McGaw, and Smith (1981). Their approach requires a reviewer (a) to locate studies of an issue through objective and replicable searches, (b) to code the studies for salient features, (c) to describe study outcomes on a common scale, and (d) to use statistical methods to find relationships between study features and study outcomes.
Data Sources
To find studies on mastery learning programs, we carried out computer searches of two library databases: (a) ERIC, a database on educational materials from the Educational Resources Information Center, consisting of the two files Research in Education and Current Index to Journals in Education; and (b) Comprehensive Dissertation Abstracts. The empirical studies retrieved in these computer searches were the primary source of data for our analyses. A second source of data was a supplementary set of studies located by branching from bibliographies in the review articles retrieved by computer.
To be included in the meta-analysis, studies had to meet four criteria: 1. The studies had to be field evaluations of mastery programs. Performance of
students taught for mastery had to be compared to performance of students taught by a conventional teaching method. Excluded on the basis of this criterion were studies that simply compared two or more mastery methods (e.g., Calhoun, 1976; Dunkelberger & Heikkinen, 1984; Fuchs, Tindal, & Fuchs, 1985) and studies that examined learning of specially prepared laboratory materials in an area not ordinarily covered in the school's curriculum (e.g., Arlin & Webster, 1983).
2. Students in the mastery program had to be held to a realistically high level of performance. The criterion for mastery had to be at least 70% correct on quizzes;
267
at UNIV OF KENTUCKY on December 27, 2010http://rer.aera.netDownloaded from
Kulik, Kulik, and Bangert-Drowns
performance below this level is usually associated with letter grades of D and F. Excluded from this review because of an unusually low standard for mastery on tests was a study by Stinnard and Dolphin (1981), which used 56% correct as its mastery criterion.
3. The studies had to be free from serious methodological flaws. Excluded because of differential exposure of comparison groups to items included on criterion examinations was a study by Swanson and Denton (1977). Also excluded were four studies in which comparison groups did not take criterion examinations in comparable numbers under comparable conditions. In Lewis and Wolfs (1973) study, the criterion examination was optional for members of the mastery group but required for members of the control group, and it was taken by different proportions of the two groups. In three other studies (Moore, Hauck, & Gagne, 1973; Moore, Mahan, & Ritts, 1969; Nazzaro, Todorov, & Nazzaro, 1972), students in the mastery groups had up to two semesters to take the criterion examination, whereas students in the comparison group took the criterion examination at the end of one semester.
4. The reports had to contain quantitative results from which size of effect could be calculated or estimated. Studies by Guskey (1982, 1984), for example, had to be excluded from the analysis because they provided no results from which individual within-class variation in criterion examinations could be estimated.
Study Features
Fifteen variables were used to describe treatments, methodologies, settings, and publication histories of the studies. These variables were chosen on the basis of an examination of study features analyzed in other quantitative reviews and a preliminary examination of the studies located for this analysis. Two coders independently coded each of the studies on each of the variables. The coders then jointly reviewed their coding forms and discussed any disagreements. They resolved these disagreements by jointly reexamining the studies whose coding was in dispute.
Four of the 15 variables described procedures used in mastery testing:
1. Pacing. Students in the mastery learning programs proceeded through a course at their own pace or progressed through material as a group.
2. Mastery level on unit tests. Programs varied in the percentage correct needed to establish mastery on a unit test.
3. Demonstration of mastery. Some programs required a formal demonstration of mastery on each unit test (i.e., students had to take alternative forms of unit tests until they reached a prespecified mastery level of performance), whereas in other programs mastery could be demonstrated less formally by completion of prescribed remedial activities.
4. Duration of treatment. Programs varied in the number of weeks of duration.
Seven variables were used to describe the experimental designs of the studies:
1. Subject assignment. Students were assigned to experimental and control groups either randomly or by nonrandom procedures.
2. Teacher effects. In some studies the same instructor or instructors taught both
268
at UNIV OF KENTUCKY on December 27, 2010http://rer.aera.netDownloaded from
Mastery Learning Effects
experimental and control groups, whereas in other studies different instructors taught experimental and control groups.
3. Historical effects. In some studies experimental and control groups were taught concurrently (e.g., in the same semester), whereas in other studies experimental and control groups were taught consecutively (e.g., in two different semesters).
4. Frequency of testing. In some studies experimental and control groups took the same number of unit tests. In other studies students in the control group were tested less frequently than students in the experimental group.
5. Amount of quiz feedback. In some studies experimental and control groups received the same amount of feedback on unit quizzes. In other studies, however, amount of feedback for experimental and control students differed for one of two reasons: (a) Control students took fewer quizzes than did experimental-group students and thus necessarily received less feedback, or (b) experimental and control students took the same number of unit quizzes but experimental-group students received feedback on specific items missed, whereas control students received only information on total quiz scores.
6. Locally developed versus standardized criterion tests. Studies used either local tests, nationally standardized tests, or a combination of the two.
7. Objectively versus subjectively scored criterion tests. Some studies used objective, machine-scoreable criterion examinations, whereas others used essay tests or other nonobjective tests to measure final performance.
Two variables were used to describe the settings in which the evaluations were conducted:
1. Class level. Courses were at the precollege level or college level. 2. Course content. The subject taught was (a) mathematics, (b) science, or (c)
social sciences.
Finally, two variables were used to describe the publication histories of the studies:
1. Year of the report. The publication or release year of each study was recorded. 2. Source of the study. The three document types were (a) technical reports,
including clearinghouse documents, papers presented at conventions, and so forth; (b) dissertations; and (c) professional publications, including articles and scholarly books.
Outcome Measures
The instructional outcome measured most often in the 108 studies was student learning, as indicated on examinations given at the end of instruction. Other outcome variables measured in the studies were (a) performance on a follow-up or retention examination given some time after the completion of the program of instruction, (b) attitude toward instruction, (c) attitude toward the subject matter being taught, (d) course completion, and (e) amount of time needed for instruction.
For statistical analysis, outcomes had to be expressed on a common scale of measurement. The metric used to express effects measured on examinations and attitude scales was the one recommended by Glass et al. (1981). Each outcome was
269
at UNIV OF KENTUCKY on December 27, 2010http://rer.aera.netDownloaded from
Kulik, Kulik, and Bangert-Drowns
coded as an effect size, defined as the difference between the mean scores of two groups divided by the standard deviation of the control group. For most studies, effect sizes could be calculated directly from reported means and standard deviations. For some studies, however, effect sizes had to be retrieved from t and F ratios. Formulas used in estimating effect sizes from such statistics were those given by Glass et al. (1981).
The application of the formulas given by Glass and his colleagues was straightforward in most cases. In some studies, however, more than one value was available for use in the numerator of the formula for calculating effect size, and more than one value was available for the denominator. For example, some investigators reported raw-score differences between groups as well as covariance-adjusted differences, and some reported differences on a postmeasure as well as differences in pre-post gains. Effect sizes calculated from these measures differ in the reliability with which they estimate treatment effects, as indicated by their standard errors (J. Kulik & Kulik, 1986). Our procedure was to calculate effect sizes from the measures that provided the most reliable estimate of the treatment effect. This meant using co variance-adjusted differences when available rather than raw-score differences and using differences in gains when available rather than differences on posttests alone. In addition, some reports contained several measures of variation that might be considered for use as the denominator in the formula for calculating effect size. Our procedure was to employ the measure that provided the best estimate of the unrestricted population variation in the criterion variable. Our procedures thus produced interpretable rather than operative effect sizes (J. Kulik & Kulik, 1986).
For measurement of the size of mastery learning effects on course completion, we used the statistic h (Cohen, 1977). This statistic is appropriate for use when proportions are being compared. It is defined as the difference between the arcsine transformation of proportions associated with the experimental and control groups. To code mastery effects on instructional time, we used a ratio of two quantities: the instructional time required by the experimental group divided by the instructional time required by the control group.
Unit of Statistical Analysis
Some studies reported more than one finding for a given outcome area. Such findings sometimes resulted from the use of more than one experimental or control group in a single study and sometimes from the use of several subscales and subgroups to measure a single outcome. Using several effect sizes to represent results from one outcome area of one study seemed to be inappropriate to us because the effect sizes were usually nonindependent. They often came from a single group of subjects or from overlapping subject groups, and they almost always represented the effects of a single program implemented in a single setting. To represent a single outcome by several effect sizes would violate the assumption of independence necessary for many statistical tests and would also give undue weight to studies with multiple groups and multiple scales.
The procedure that we adopted, therefore, was to calculate only one effect size for each outcome area of each study. A single rule helped us to decide which effect size best represented the study's findings. The rule was to use the effect size from what would ordinarily be considered the most methodologically sound comparison
270
at UNIV OF KENTUCKY on December 27, 2010http://rer.aera.netDownloaded from

Mastery Learning Effects
when comparisons differed in methodological adequacy. When results from both a true experimental comparison and a quasi-experiment were available from the same study, results of the true experiment were recorded. When intermediate and final results were available from a study, the final results were used. When transfer effects were measured in addition to effects in the area of instruction, the direct effects were coded for the analysis. In all other cases, our procedure was to use total scores and total group results rather than subscore and subgroup results in calculating effect sizes.
Results Our search procedures yielded 108 studies judged to be suitable for analysis. A
total of 72 of the 108 studies used Keller's PSI approach in college-level teaching. The other 36 studies used Bloom's LFM approach. A total of 19 of the LFM studies were carried out with college students. Although the remaining 17 LFM studies spanned the grade levels from 1 through 12, the focus was clearly on the upper grades: high school, junior high, and, to a lesser extent, upper elementary classes. Only 2 LFM studies contained results from primary grades.
Because almost all of the studies in the pool investigated effects on examination performance, we were able to carry out a complete statistical analysis of examination effects. The analysis covered both average effects and the relationship between study effects and study features. We carried out less complete statistical analyses of other outcome areas because of the limited number of studies in these areas.
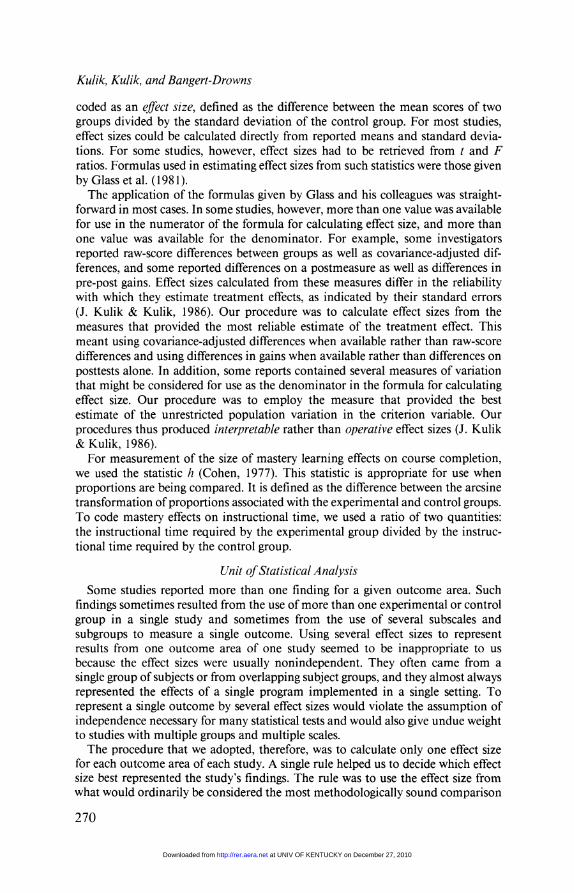
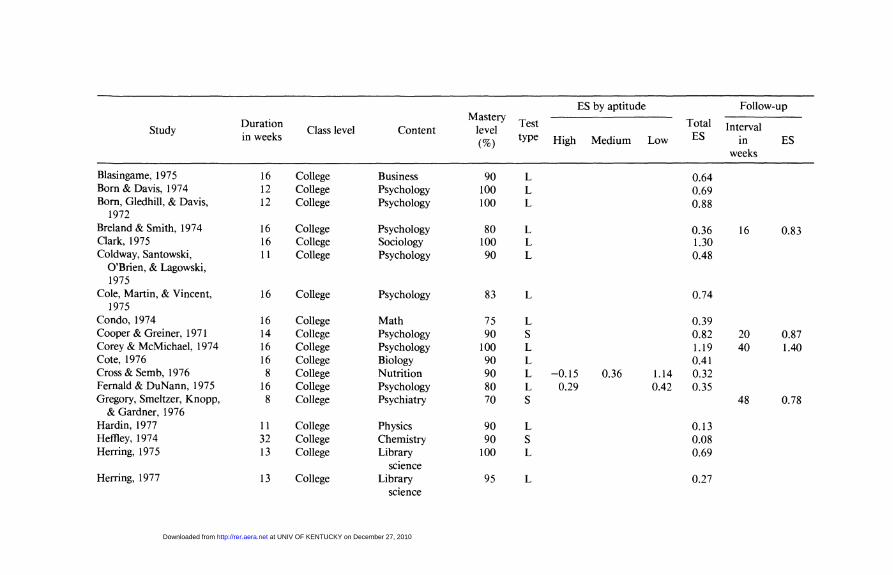
Examination Performance A total of 103 of the 108 studies of mastery programs reported results from
examinations given at the end of instruction (Table 1). All but 7 of these studies reported that mastery programs had positive effects on the examinations. Also, 67 of the 96 studies with positive effects reported that the difference in amount learned by experimental and control groups was great enough to be considered statistically significant. None of the studies with negative results reported statistically significant differences. Overall, these lopsided box-score results strongly favor the hypothesis that mastery programs have a positive effect on student learning.
The index of effect size provides a more precise measure of the strength of treatment effects. The average effect size in the 103 studies was 0.52. That is, the average effect of mastery learning programs was to raise student achievement scores by 0.52 standard deviations. The standard error of the mean was 0.033. This effect is highly significant by conventional statistical standards, (̂102) = 15.78, p < .001. It is also an effect of moderate size. The average student in a mastery learning class performed at the 70th percentile (equivalent to a z score of 0.52), whereas the average student in a class taught without a mastery requirement performed at the 50th percentile.
Examination Performance and Student Aptitude Thirteen studies provided data on final examination performance for students at
different ability levels (Table 1). In 9 of these studies, effects were stronger for less able students, and in 4 studies effects were stronger for more able students. The average effect size in all 13 studies was also higher for the less able students (M = 0.61) than for the more able ones (M = 0.40). The difference, however, is not significant (t = 1.23, p > .10).
271
at UNIV OF KENTUCKY on December 27, 2010http://rer.aera.netDownloaded from
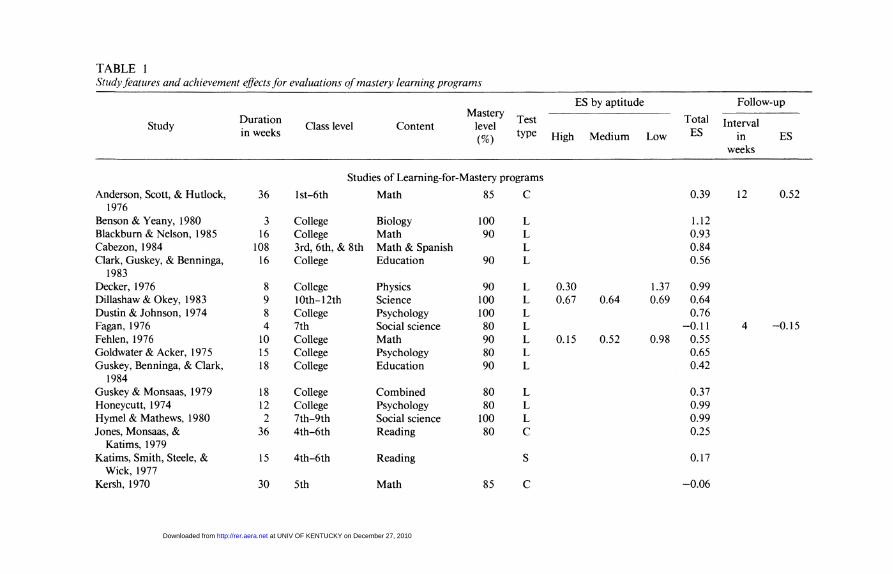
TABLE 1 Study features and achievement effects for evaluations of mastery learning programs
Duration Class level Content Mastery
level Test
ES by aptitude
Total
Follow-•up
Study Duration Class level Content Mastery
level Test Total Interval in weeks {%) type High Medium Low ES in
weeks ES
Studies of Learning-for-Mastery programs
Anderson, Scott, & Hutlock, 36 lst-6th Math 85 C 0.39 12 0.52 1976
Benson & Yeany, 1980 3 College Biology 100 L 1.12 Blackburn & Nelson, 1985 16 College Math 90 L 0.93 Cabezon, 1984 108 3rd, 6th, & 8th Math & Spanish L 0.84 Clark, Guskey, & Benninga, 16 College Education 90 L 0.56
1983 Decker, 1976 8 College Physics 90 L 0.30 1.37 0.99 Dillashaw & Okey, 1983 9 10th-12th Science 100 L 0.67 0.64 0.69 0.64 Dustin & Johnson, 1974 8 College Psychology 100 L 0.76 Fagan, 1976 4 7th Social science 80 L -0.11 4 -0.15 Fehlen, 1976 10 College Math 90 L 0.15 0.52 0.98 0.55 Goldwater & Acker, 1975 15 College Psychology 80 L 0.65 Guskey, Benninga, & Clark, 18 College Education 90 L 0.42
1984 Guskey & Monsaas, 1979 18 College Combined 80 L 0.37 Honeycutt, 1974 12 College Psychology 80 L 0.99 Hymel & Mathews, 1980 2 7th-9th Social science 100 L 0.99 Jones, Monsaas, & 36 4th-6th Reading 80 C 0.25
Katims, 1979 Katims, Smith, Steele, & 15 4th-6th Reading S 0.17
Wick, 1977 Kersh, 1970 30 5th Math 85 c -0.06
at UNIV OF KENTUCKY on December 27, 2010http://rer.aera.netDownloaded from

Knight, Williams, & 12 College Psychology 100 L 1.58 Jardon,1975
Lewis, 1984 12 College Math 80 L 0.57 Long, Okey, & Yeany, 1978 5 8th Science 100 L 0.43 Lueckmeyer & Chiappetta, 6 10th Science 80 L 0.39
1981 Martin & Srikameswaran, 32 College Chemistry 75 L 0.28
1974 Mevarech, 1980 6 9th Math 80 L 0.79 Mevarech, 1985 15 5th Math 80 L 0.70 Mevarech, 1986 12 7th Math 80 L 0.76 1.32 0.87 Myers, 1976 11 College Geography 85 L 0.36 Nation, Knight, Lamberth, 8 College Psychology 100 L 0.90
&Dyck, 1974 Nation, Massad, & Wilker- 8 College Psychology 90 L 0.39
son, 1977 Nation & Roop, 1975 16 College Psychology 100 L 0.58 Okey, 1974 2 3rd & 4th Math L 0.49 Saunders-Harris & Yeany, 5 7th Science 100 L 0.42
1981 Sheldon & Miller, 1973 17 College Math 75 L 0.28 Slavin & Karweit, 1984 26 9th Math 80 S 0.02 Strasler, 1979 5 7th Ecology & Ge
ometry L 1.06
Yeany, Dost, & 2 College Biology 100 L 0.61 Matthew, 1980
Studies of the Personalized System of Instruction
Abraham & Newton, 1974 16 College Economic 100 S 0.45 Austin & Gilbert, 1973 16 College Physics 100 L 0.36 8 0.47 Badia, Stutts, & Harsh, 1978 16 College Psychology L 0.42 Billings, 1974 16 College Economic 100 S 0.15
at UNIV OF KENTUCKY on December 27, 2010http://rer.aera.netDownloaded from
ES by aptitude Follow-•up
Duration Class level Content
Mastery level
Test Total Study
Duration Class level Content
Mastery level
Test Total Interval in weeks (%) type High Medium Low ES in
weeks ES
Blasingame, 1975 16 College Business 90 L 0.64 Born & Davis, 1974 12 College Psychology 100 L 0.69 Born, Gledhill, & Davis, 12 College Psychology 100 L 0.88
1972 Breland & Smith, 1974 16 College Psychology 80 L 0.36 16 0.83 Clark, 1975 16 College Sociology 100 L 1.30 Coldway, Santowski, 11 College Psychology 90 L 0.48
O'Brien, & Lagowski, 1975
Cole, Martin, & Vincent, 16 College Psychology 83 L 0.74 1975
Condo, 1974 16 College Math 75 L 0.39 Cooper & Greiner, 1971 14 College Psychology 90 S 0.82 20 0.87 Corey & McMichael, 1974 16 College Psychology 100 L 1.19 40 1.40 Cote, 1976 16 College Biology 90 L 0.41 Cross &Semb, 1976 8 College Nutrition 90 L -0.15 0.36 1.14 0.32 Fernald & DuNann, 1975 16 College Psychology 80 L 0.29 0.42 0.35 Gregory, Smeltzer, Knopp, 8 College Psychiatry 70 S 48 0.78
& Gardner, 1976 Hardin, 1977 11 College Physics 90 L 0.13 Heffley, 1974 32 College Chemistry 90 S 0.08 Herring, 1975 13 College Library
science 100 L 0.69
Herring, 1977 13 College Library science
95 L 0.27
at UNIV OF KENTUCKY on December 27, 2010http://rer.aera.netDownloaded from

Herrmann, 1984 64 College Psychology 80 L 0.84 Hindman, 1974 16 College Psychology 85 L 0.87 Jackman, 1982 12 College Chemistry 95 L 0.84 Jacko, 1974 12 College Home
economics 90 L 0.92 0.73 0.83
C. Kulik & Kulik, 1976 16 College Statistics 100 L 0.92 0.31 0.55 Leppmann & Herrmann, 32 College Psychology 80 L 0.87
1981 Locksley, 1977 16 College Math 90 L 0.21 0.09 0.15 M. Lu, 1976 16 College Math 100 L 0.76 9 » 0.92 P. Lu, 1976 16 College Psychology 100 L 0.63 5 1.00 Lubkin, 1974 16 College Engineering 100 L 0.41 Malec, 1975 18 College Statistics 100 L 0.20 McFarland, 1976 16 College Composition 90 L 0.68 McMichael & Corey, 1969 16 College Psychology 100 L 0.81 Mevarech & Werner, 1985 13 College Gerontology 80 L 0.14 Morris & Kimbrill, 1972 16 College Psychology 100 L 0.68 Nord, 1975 16 College Statistics 90 L 0.25 Pascarella, 1977 16 College Math 100 L 0.68 Peluso & Baranchik, 1977 16 College Math L 0.47 Phillippas & Sommerfeldt, 16 College Physics L 0.20
1972 Pollack & Roeder, 1975 College Political
science 80 L 0.61
Rosati, 1975 24 College Engineering 100 L -0.08 0.61 0.27 Roth, 1973 16 College Engineering 100 L 0.57 Roth, 1975 16 College Engineering 100 L 1.14 Schielack, 1983 16 College Math 100 L 0.96 Schimpfhauser, Horrocks, 22 College Biochemistry 80 S 1.13 0.39 0.79
Richardson, Alben, Schumm, & Sprecher, 1974
at UNIV OF KENTUCKY on December 27, 2010http://rer.aera.netDownloaded from
ES by aptitude Follow--up
Duration Class level Content
Mastery level
Test Total Study
Duration Class level Content
Mastery level
Test Total Interval in weeks {%) type High Medium Low ES in
weeks ES
Schwartz, 1981 30 College Biochemistry 90 L 0.59 24 0.73 Sharpies, Smith, & Strasler, 32 College Engineering 90 L 0.79 10 0.44
1976 Sheppard & MacDermott, 9 College Psychology 100 L 0.53
1970 Siegfried & Strand, 1976 16 College Economics 100 L 0.16 Silberman & Parker, 1974 16 College Chemistry 90 S 0.27 Smiernow & Lawley, 1980 16 College Engineering 90 L 0.27 Smith, 1976 16 College Math 90 S 0.22 Spector, 1976 16 College Economics 90 S 0.42 Spevack, 1976 16 College Chemistry 100 L 0.09 -0.17 0.02 Steele, 1974 16 College Math L 0.61 Stout, 1978 16 College Psychology 90 L 0.27 Taylor, 1977 15 College Math L 0.59 Thompson, 1980 16 College Math 85 C -0 .04 0.08 0.02 Tietenberg, 1975 16 College Economics L -0 .04 Toepher, Shaw, & 16 College Psychology 90 L 0.69
Moniot, 1972 Vandenbroucke, 1974 28 College Chemistry 90 S -0 .22 VanVerth & Dinan, 1974 16 College Chemistry L 0.00 Walsh, 1977 16 College Earth science 90 L 0.17 White, 1974 16 College Math 100 L 0.32 Witters & Kent, 1972 16 College Psychology 80 L 0.46
(Study I) Witters & Kent, 1972 16 College Anthropology 85 L 0.52
(Study II)
Note. ES = effect size; L = 1 ocal; S = standardized; C = combined.
at UNIV OF KENTUCKY on December 27, 2010http://rer.aera.netDownloaded from
Mastery Learning Effects
Follow-Up Examination
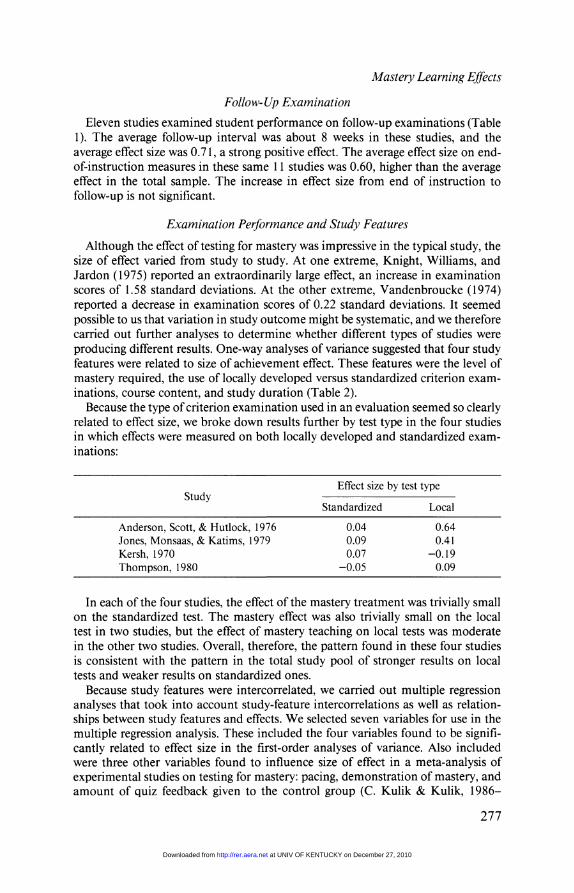
Eleven studies examined student performance on follow-up examinations (Table 1). The average follow-up interval was about 8 weeks in these studies, and the average effect size was 0.71, a strong positive effect. The average effect size on end-of-instruction measures in these same 11 studies was 0.60, higher than the average effect in the total sample. The increase in effect size from end of instruction to follow-up is not significant.
Examination Performance and Study Features
Although the effect of testing for mastery was impressive in the typical study, the size of effect varied from study to study. At one extreme, Knight, Williams, and Jardon (1975) reported an extraordinarily large effect, an increase in examination scores of 1.58 standard deviations. At the other extreme, Vandenbroucke (1974) reported a decrease in examination scores of 0.22 standard deviations. It seemed possible to us that variation in study outcome might be systematic, and we therefore carried out further analyses to determine whether different types of studies were producing different results. One-way analyses of variance suggested that four study features were related to size of achievement effect. These features were the level of mastery required, the use of locally developed versus standardized criterion examinations, course content, and study duration (Table 2).
Because the type of criterion examination used in an evaluation seemed so clearly related to effect size, we broke down results further by test type in the four studies in which effects were measured on both locally developed and standardized examinations:
Study Effect size by test type
Study Standardized Local
Anderson, Scott, & Hutlock, 1976 0.04 0.64 Jones, Monsaas, & Katims, 1979 0.09 0.41 Kersh, 1970 0.07 -0.19 Thompson, 1980 -0.05 0.09
In each of the four studies, the effect of the mastery treatment was trivially small on the standardized test. The mastery effect was also trivially small on the local test in two studies, but the effect of mastery teaching on local tests was moderate in the other two studies. Overall, therefore, the pattern found in these four studies is consistent with the pattern in the total study pool of stronger results on local tests and weaker results on standardized ones.
Because study features were intercorrelated, we carried out multiple regression analyses that took into account study-feature intercorrelations as well as relationships between study features and effects. We selected seven variables for use in the multiple regression analysis. These included the four variables found to be significantly related to effect size in the first-order analyses of variance. Also included were three other variables found to influence size of effect in a meta-analysis of experimental studies on testing for mastery: pacing, demonstration of mastery, and amount of quiz feedback given to the control group (C. Kulik & Kulik, 1986-
277
at UNIV OF KENTUCKY on December 27, 2010http://rer.aera.netDownloaded from
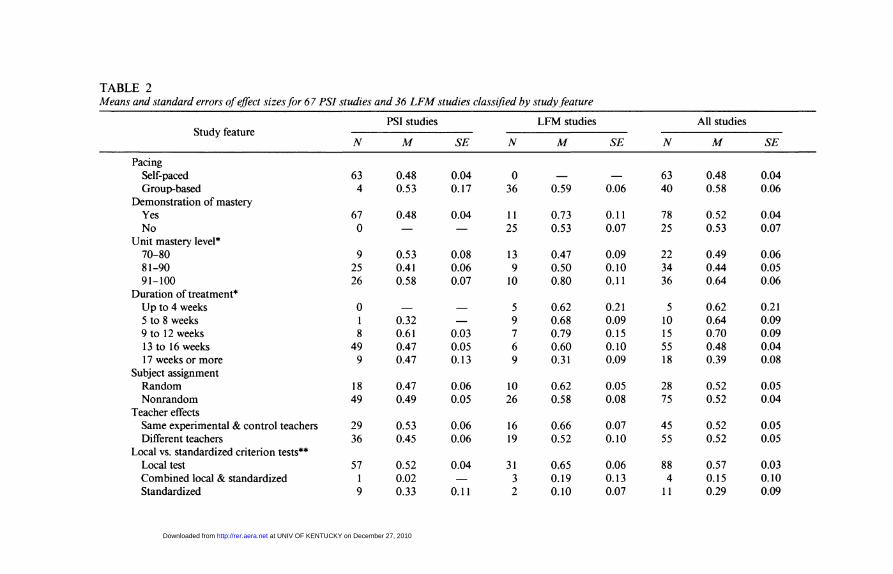
TABLE 2 Means and standard errors of effect sizes for 67 PSI studies and 36 LFM studies classified by study feature
PSI studies LFM studies All studies Study feature Study feature
N M SE N M SE N M SE
Pacing Self-paced 63 0.48 0.04 0 — — 63 0.48 0.04 Group-based 4 0.53 0.17 36 0.59 0.06 40 0.58 0.06
Demonstration of mastery Yes 67 0.48 0.04 11 0.73 0.11 78 0.52 0.04 No 0 — — 25 0.53 0.07 25 0.53 0.07
Unit mastery level* 70-80 9 0.53 0.08 13 0.47 0.09 22 0.49 0.06 81-90 25 0.41 0.06 9 0.50 0.10 34 0.44 0.05 91-100 26 0.58 0.07 10 0.80 0.11 36 0.64 0.06
Duration of treatment* Up to 4 weeks 0 — — 5 0.62 0.21 5 0.62 0.21 5 to 8 weeks 1 0.32 — 9 0.68 0.09 10 0.64 0.09 9 to 12 weeks 8 0.61 0.03 7 0.79 0.15 15 0.70 0.09 13 to 16 weeks 49 0.47 0.05 6 0.60 0.10 55 0.48 0.04 17 weeks or more 9 0.47 0.13 9 0.31 0.09 18 0.39 0.08
Subject assignment Random 18 0.47 0.06 10 0.62 0.05 28 0.52 0.05 Nonrandom 49 0.49 0.05 26 0.58 0.08 75 0.52 0.04
Teacher effects Same experimental & control teachers 29 0.53 0.06 16 0.66 0.07 45 0.52 0.05 Different teachers 36 0.45 0.06 19 0.52 0.10 55 0.52 0.05
Local vs. standardized criterion tests** Local test 57 0.52 0.04 31 0.65 0.06 88 0.57 0.03 Combined local & standardized 1 0.02 — 3 0.19 0.13 4 0.15 0.10 Standardized 9 0.33 0.11 2 0.10 0.07 11 0.29 0.09
at UNIV OF KENTUCKY on December 27, 2010http://rer.aera.netDownloaded from

Objective vs. subjective scoring Objective 51 0.52 0.04 32 0.59 0.06 83 0.54 0.04 Nonobjective 12 0.36 0.09 4 0.61 0.17 16 0.42 0.08
Number of quizzes for control group Same as in experimental group 6 0.22 0.11 16 0.68 0.10 22 0.55 0.09 Conventional number 60 0.50 0.04 20 0.52 0.06 80 0.50 0.03
Amount of feedback for control group Same as in experimental group 5 0.22 0.13 8 0.51 0.13 13 0.40 0.10 Conventional amount 61 0.49 0.04 28 0.61 0.07 87 0.53 0.03
Class level Pre-college 0 — — 17 0.49 0.09 17 0.49 0.09 College 67 0.48 0.04 19 0.68 0.08 86 0.53 0.04
Course content* Math 14 0.44 0.07 11 0.50 0.10 25 0.47 0.06 Science 19 0.37 0.08 8 0.61 0.11 27 0.44 0.07 Social science 30 0.59 0.05 12 0.67 0.12 42 0.61 0.05
Source of study Unpublished 12 0.57 0.08 10 0.64 0.12 22 0.60 0.07 Dissertation 9 0.37 0.12 7 0.48 0.17 16 0.42 0.10 Published 46 0.48 0.05 19 0.60 0.08 65 0.52 0.04
Year of report Up to 1975 40 0.51 0.05 11 0.58 0.15 51 0.52 0.05 1976-1980 22 0.39 0.05 14 0.60 0.09 36 0.47 0.05 1981 and after 5 0.73 0.15 11 0.58 0.08 16 0.63 0.07
*/?<.05 **/?<.01
at UNIV OF KENTUCKY on December 27, 2010http://rer.aera.netDownloaded from

Kulik, Kulik, and Bangert-Drowns
1987). The multiple correlation of the seven variables with effect size is .51. The coefficients of two of the seven variables—requirement of formal demonstration of mastery and the duration of treatment—were very small and not significant (p > .20). When these two variables are eliminated from the regression equation, the multiple correlation of the remaining set of five variables with effect size is .50. Thus, about 25% of the variance in the results of these studies can be explained by variation on these five variables (Table 3).
All five variables contributed significantly to the prediction of effect sizes. First, group-based programs produced larger effects than did self-paced ones. Second, programs with a high mastery standard were more effective than programs with lower standards. Third, programs whose effects were measured on locally developed tests produced larger effects than did programs whose effects were measured on standardized, commercial tests. Fourth, effects were larger in studies in which control groups received less quiz feedback than did experimental groups. In studies where comparison groups received the same amount of quiz feedback, treatment effects were smaller. Finally, subject matter being taught was significantly related to effect size. Mastery learning programs in the social sciences were more effective than mastery programs in such areas as mathematics and the natural sciences.
Studies of Keller's PSI and Bloom's LFM were different in many features, including some that were significantly related to effect size (Table 2). The PSI programs investigated in the studies were largely self-paced (94%), lasted about one semester, required a high level of mastery, and required that all students formally demonstrate achievement of such mastery. In addition, all PSI studies that we located were carried out at the college level. LFM programs, on the other hand, were all group based, lasted anywhere from 2 to 108 weeks, required relatively low levels of mastery, and often did not require that mastery be formally demonstrated. About half of the studies of LFM programs were carried out at the precollege level. In terms of experimental design, more LFM studies than PSI studies provided the same amount of quiz feedback for students in experimental and control groups.
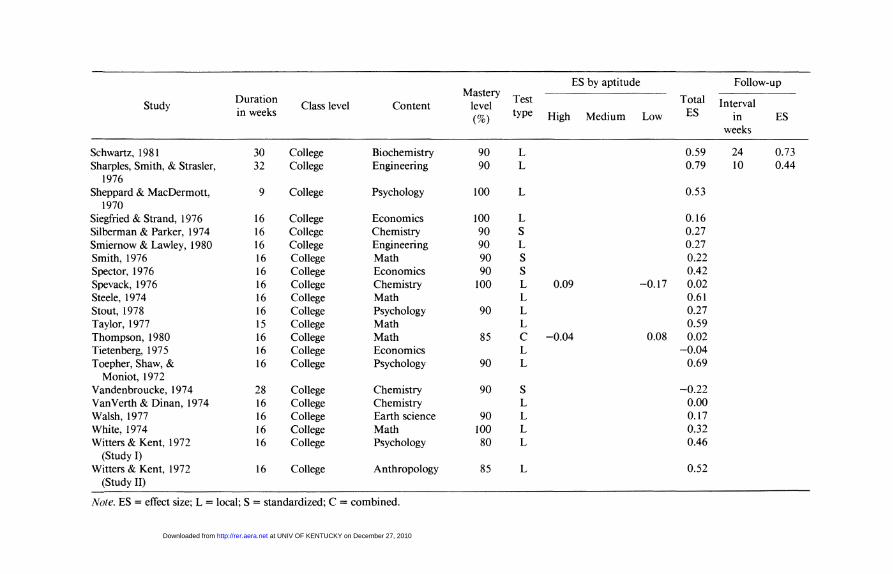
In spite of their differences in features, PSI studies and LFM studies reported similar effects (Figure 1). A total of 62 out of 67 studies of PSI programs (or 93%)
TABLE 3 Multiple regression analysis of achievement effect sizes
T A A . • UT Partial Regression _ , , ... Independent variable , . «- • ^ Probability
correlation coefficient Constant -0.374 .394 Pacing (1 = self, 2 = group) .221 0.141 .039 Unit mastery level (M = 90.92, .258 0.010 .016
SD = 8.49) Local vs. standardized criterion test - .286 -0.134 .007
(1 = local, 2 = combined, 3 = standardized)
Amount of quiz feedback for control - .249 -0.210 .021 group (1 = same as for experimental group, 2 = conventional number)
Social science course (1 = no, 2 = yes) .268 0.158 .012
280
at UNIV OF KENTUCKY on December 27, 2010http://rer.aera.netDownloaded from

Mastery Learning Effects
20
15
in LJ
o ID f— (/) Li_
o UJ CD
io H
o-*-
Legend A PSI
X LFM
-1.8 -1.4 - 1 - 0 . 6 - 0 . 2 0.2 0.6
EFFECT SIZE 1.4 1.8
FIGURE 1. Effects of mastery learning programs on student achievement in 67 PSI and 36 LFM studies
and 34 out of 36 studies of LFM (or 94%) produced results that were favorable to the experimental treatment. In all, 69% of the positive PSI results and 71% of the positive LFM results were statistically significant. The average effect of PSI was to raise student examination scores by 0.48 standard deviations; the average effect of LFM was to raise scores by 0.59 standard deviations. The difference in effects of the two methods is nonsignificant, £(102) = 1.50, p > .10.
Variation in Examination Performance
Testing for mastery also reduced variation in student examination performance. Fifty-two of the 101 studies reported amount of variation in final examination scores for experimental and control groups separately, and in the majority of studies (37 out of 52) the variation in final examination scores was less for the experimental group (Table 4). In the average study, variation of examination scores of the experimental group was 77% of the variation in scores of the control group.
Instructional Time
Although the experimental-group students outperformed the students in the control group in most cases, the experimental group required slightly more instructional time. Eight studies reported on instructional time for experimental and control groups separately, and six of these studies showed more instructional time for the experimental group (Table 4). In the typical (or median) case, the experimental group required 4% more instructional time than did the control group.
281
at UNIV OF KENTUCKY on December 27, 2010http://rer.aera.netDownloaded from

TABLE 4 Noncognitive effects of programs of mastery learning
Study Time ratio Completion Variance Effect on attitudes (ES)
Study (X/C) rate (h) ratio (X/C) Subject Method
Studies of Learning-for-Mastery programs
Blackburn & Nelson, 1985 0.31 0.41 Cabezon, 1984 0.74 Clark, Guskey, & Benninga, 1983 0.35 Dillashaw & Okey, 1983 1.16 Fehlen, 1976 0.24 0.83 Guskey, Benninga, & Clark, 1984 0.44 Honeycutt, 1974 0.97 Hymel & Mathews, 1980 0.27 Jones, Monsaas, & Katims, 1979 0.76 Katims, Smith, Steele, & Wick, 1977 1.19 Kersh, 1970 -0.09 Lewis, 1984 1.35 Lueckmeyer & Chiappetta, 1981 0.86 Martin & Srikameswaran, 1974 1.24 Mevarech, 1980 1.04 0.71 Mevarech, 1986 1.08 Myers, 1976 1.05 Okey, 1974 0.95 Sheldon & Miller, 1973 0.86 Slavin & Karweit, 1984 1.09 Yeany, Dost, & Matthew, 1980 1.05 0.27
Studies of Personalized System of Instruction programs
Abraham & Newton, 1974 1.56 0.24 Austin & Gilbert. 1973 -0.14 0.53
at UNIV OF KENTUCKY on December 27, 2010http://rer.aera.netDownloaded from
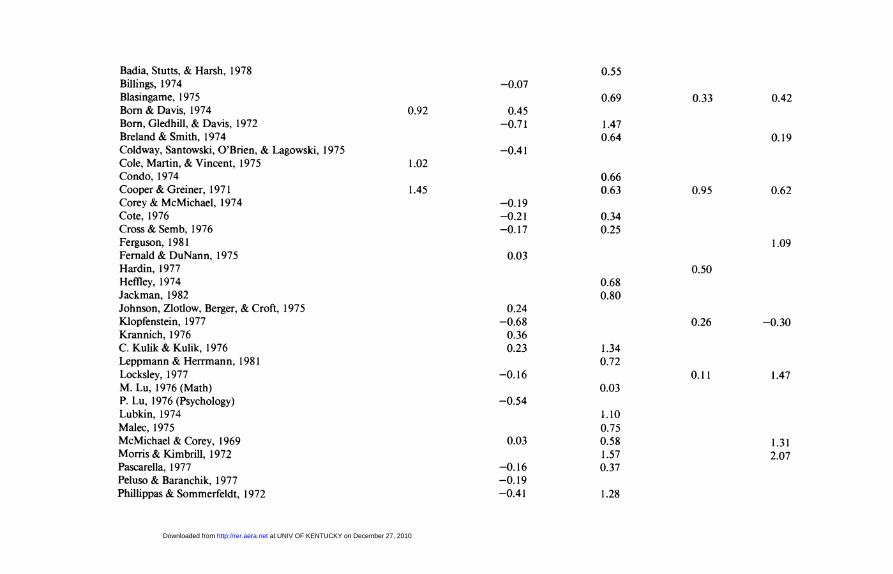
Badia, Stutts, & Harsh, 1978 0.55 Billings, 1974 -0.07 Blasingame, 1975 0.69 0.33 0.42 Born & Davis, 1974 0.92 0.45 Born, Gledhill, & Davis, 1972 -0.71 1.47 Breland & Smith, 1974 0.64 0.19 Coldway, Santowski, O'Brien, & Lagowski, 1975 -0.41 Gole, Martin, & Vincent, 1975 1.02 Condo, 1974 0.66 Cooper & Greiner, 1971 1.45 0.63 0.95 0.62 Corey & McMichael, 1974 -0.19 Cote, 1976 -0.21 0.34 Cross &Semb, 1976 -0.17 0.25 Ferguson, 1981 1.09 Fernald & DuNann, 1975 0.03 Hardin, 1977 0.50 Heffley, 1974 0.68 Jackman, 1982 0.80 Johnson, Zlotlow, Berger, & Croft, 1975 0.24 Klopfenstein, 1977 -0.68 0.26 -0.30 Krannich, 1976 0.36 C. Kulik & Kulik, 1976 0.23 1.34 Leppmann & Herrmann, 1981 0.72 Locksley, 1977 -0.16 0.11 1.47 M. Lu, 1976 (Math) 0.03 P. Lu, 1976 (Psychology) -0.54 Lubkin, 1974 1.10 Malec, 1975 0.75 McMichael & Corey, 1969 0.03 0.58 1.31 Morris & Kimbrill, 1972 1.57 2.07 Pascarella, 1977 -0.16 0.37 Peluso & Baranchik, 1977 -0.19 Phillippas & Sommerfeldt, 1972 -0.41 1.28
at UNIV OF KENTUCKY on December 27, 2010http://rer.aera.netDownloaded from

Study Time ratio Completion Variance Effect on attitudes (ES) Study
(X/C) rate (h) ratio (X/C) Subject Method
Pollack & Roeder, 1975 1.02 1.08 Rosati, 1975 0.96 -0.22 0.71 Roth, 1973 1.21 0.41 Roth, 1975 -0.41 0.81 0.34 Schielack, 1983 0.12 0.82 0.58 Schimpfhauser et al., 1974 0.75 Schwartz, 1980 -0.15 1.07 Sharpies, Smith, & Strasler, 1976 -0 .13 -0.96 Sheppard & MacDermott, 1970 1.03 0.33 Siegfried & Strand, 1976 0.47 0.71 Silberman & Parker, 1974 0.45 Smiernow & Lawley, 1980 -0.15 Smith, 1976 -0.05 1.23 0.54 Spector, 1976 0.79 Spevack, 1976 1.37 Steele, 1974 -0.21 0.87 Stout, 1978 -0 .13 0.61 Taylor, 1977 0.55 Thompson, 1980 0.24 -0.17 Tietenberg, 1975 0.96 Vandenbroucke, 1974 -0 .33 VanVerth & Dinan, 1974 -0 .03 Walsh, 1977 0.94 0.68 White, 1974 0.78
Note. ES = effect size.
at UNIV OF KENTUCKY on December 27, 2010http://rer.aera.netDownloaded from

Mastery Learning Effects
Only one of the eight studies showed a substantial increase in instructional time, and this study examined effects of a self-paced program (Cooper & Greiner, 1971).
Attitude Toward Instructional Method
Eighteen studies examined student ratings of the quality of the instructional method used in the course (Table 4). Sixteen of the 18 studies found more positive attitudes and 2 studies found more negative attitudes in the mastery learning class. Overall, the average effect size in the 18 studies was 0.63, /(17) = 4.50, p < .001.
Attitude Toward Subject
Fourteen studies examined the effects of mastery programs on student attitudes toward the subject matter that they were being taught (Table 4). Twelve of these 14 studies reported that student attitudes were more positive in mastery classes than in conventional classes; 2 studies found negative effects. The average effect size for student attitudes toward subject was 0.40, /(13) = 3.08, p < .01.
Course Completion
Thirty-two studies compared the numbers of students completing mastery and conventional classes (Table 4). In each of these studies, PSI was the mastery teaching method. Nine of the 32 studies found a higher completion rate in the mastery class, and 23 studies found a higher completion rate in the control class. The average h for attrition for these 32 studies was -0.14, /(31) = 2.86, p < .01. The effect was a small one favoring conventional instruction.
To determine whether examination effects were related to course completion, we examined the 29 PSI studies with data on both course completion and examination performance. Average effect size on examinations was 0.46 in the 23 studies in which the completion rate was lower for the PSI students; average effect size was 0.55 in the 6 studies in which the completion rate was lower for conventionally instructed students. The difference in effect size for the two groups of studies is not significant, /(28) = 0.61, p > .10. Examination effects were intermediate (M = 0.49) in the 38 studies that did not report completion rates separately for experimental and control classes.
Discussion
The data show that mastery learning programs have positive effects on student achievement. On the average, such programs raise final examination scores by about 0.5 standard deviations, or from the 50th to the 70th percentile, in colleges, high schools, and the upper grades of elementary schools. Although PSI and LFM strategies differ on several points and the two teaching methods have been studied in distinct ways, studies of PSI and LFM report similar results. PSI raised examination scores by an average of 0.48 standard deviations; LFM raised examination scores by an average of 0.59 standard deviations.
Some types of studies, however, find especially large effect sizes. Studies with large effect sizes are, first of all, likely to examine teaching in the social sciences rather than in mathematics, the natural sciences, or humanities. Second, the studies are likely to use locally developed rather than nationally standardized tests as criterion measures of student achievement. Third, the mastery programs in studies with large effect sizes require students to move through course material at the
285
at UNIV OF KENTUCKY on December 27, 2010http://rer.aera.netDownloaded from

Kulik, Kulik, and Bangert-Drowns
teacher's pace, not at individual student rates. Fourth, the mastery programs in these studies also require students to perform at a high level on unit quizzes (e.g., 100% correct). And fifth, in studies that report strong effects, control students receive less quiz feedback than experimental students do. Equating the amount of quiz feedback for experimental and control students reduces the size of the mastery effect.
In studies with the five key characteristics, effect sizes as large as 0.8 are common. For example, students who are required to meet a high mastery standard in group-based courses in the social sciences typically score 0.89 standard deviations higher on locally developed criterion examinations than do students in conventional classes. These mastery students also score 0.76 standard deviations higher on standardized examinations than do conventionally taught students. In group-based courses other than those in the social sciences, scores of students held to a high mastery standard are 0.73 standard deviations higher on local examinations and 0,60 standard deviations higher on standardized examinations than the scores of conventionally taught students,
The data also suggest that effects of mastery programs are not uniform on all students in a class. Although both low and high aptitude students gain from such programs, low aptitude students may gain more. The average improvement in scores of high aptitude students is 0.40 standard deviations; the improvement of low aptitude students is 0.61 standard deviations. Mastery programs, in other words, may smooth out differences between high and low aptitude learners. The leveling effect of such programs can be seen in other statistical indexes. Variation in final examination scores is smaller in mastery classes than in other classes, and the correlation between aptitude and achievement is also reduced in mastery classes.
The effects of mastery learning programs are as clear on follow-up examinations as they are on end-of-instruction examinations. Thus, the benefits of mastery programs appear to be relatively enduring, not just short-term, effects. In addition to influencing student examination performance, mastery learning programs have a positive effect on student attitudes. Mastery students are more satisfied with the instruction they receive and more positive toward the content they are taught than are students in conventional classes.
The most consistently negative effect of mastery programs is on course completion. The percentage of students that complete PSI college classes is smaller than the percentage that complete conventional classes. Although the difference in percentage of completion is not large and the difference is not found in every PSI study, the finding is common enough to be a concern. The developers of PSI methodology seem to be aware that some college students fail to complete self-paced courses on time, and they have worked to develop procedures to control procrastination and raise completion rates in PSI courses (Keller & Sherman, 1974).
Interestingly enough, the effect of PSI on course completion does not appear to be related to its effect on student achievement. Superior examination scores are characteristic of PSI classes with elevated, normal, and below-average completion rates. The effect of PSI on student achievement, in other words, is a robust effect that shows up under a variety of conditions. Higher student achievement in PSI classes is not an illusion created by the withdrawal of the weaker students before final-examination time.
286
at UNIV OF KENTUCKY on December 27, 2010http://rer.aera.netDownloaded from
Mastery Learning Effects
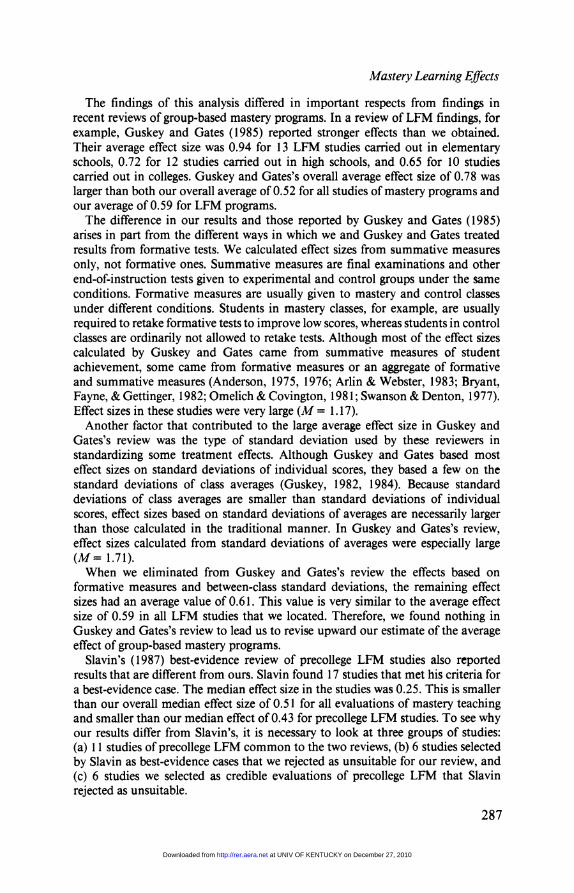
The findings of this analysis differed in important respects from findings in recent reviews of group-based mastery programs. In a review of LFM findings, for example, Guskey and Gates (1985) reported stronger effects than we obtained. Their average effect size was 0.94 for 13 LFM studies carried out in elementary schools, 0.72 for 12 studies carried out in high schools, and 0.65 for 10 studies carried out in colleges. Guskey and Gates's overall average effect size of 0.78 was larger than both our overall average of 0.52 for all studies of mastery programs and our average of 0.59 for LFM programs.
The difference in our results and those reported by Guskey and Gates (1985) arises in part from the different ways in which we and Guskey and Gates treated results from formative tests. We calculated effect sizes from summative measures only, not formative ones. Summative measures are final examinations and other end-of-instruction tests given to experimental and control groups under the same conditions. Formative measures are usually given to mastery and control classes under different conditions. Students in mastery classes, for example, are usually required to retake formative tests to improve low scores, whereas students in control classes are ordinarily not allowed to retake tests. Although most of the effect sizes calculated by Guskey and Gates came from summative measures of student achievement, some came from formative measures or an aggregate of formative and summative measures (Anderson, 1975, 1976; Arlin & Webster, 1983; Bryant, Fayne, & Gettinger, 1982; Omelich & Covington, 1981; Swanson & Denton, 1977). Effect sizes in these studies were very large (M = 1.17).
Another factor that contributed to the large average effect size in Guskey and Gates's review was the type of standard deviation used by these reviewers in standardizing some treatment effects. Although Guskey and Gates based most effect sizes on standard deviations of individual scores, they based a few on the standard deviations of class averages (Guskey, 1982, 1984). Because standard deviations of class averages are smaller than standard deviations of individual scores, effect sizes based on standard deviations of averages are necessarily larger than those calculated in the traditional manner. In Guskey and Gates's review, effect sizes calculated from standard deviations of averages were especially large (M= 1.71).
When we eliminated from Guskey and Gates's review the effects based on formative measures and between-class standard deviations, the remaining effect sizes had an average value of 0.61. This value is very similar to the average effect size of 0.59 in all LFM studies that we located. Therefore, we found nothing in Guskey and Gates's review to lead us to revise upward our estimate of the average effect of group-based mastery programs.
Slavin's (1987) best-evidence review of precollege LFM studies also reported results that are different from ours. Slavin found 17 studies that met his criteria for a best-evidence case. The median effect size in the studies was 0.25. This is smaller than our overall median effect size of 0.51 for all evaluations of mastery teaching and smaller than our median effect of 0.43 for precollege LFM studies. To see why our results differ from Slavin's, it is necessary to look at three groups of studies: (a) 11 studies of precollege LFM common to the two reviews, (b) 6 studies selected by Slavin as best-evidence cases that we rejected as unsuitable for our review, and (c) 6 studies we selected as credible evaluations of precollege LFM that Slavin rejected as unsuitable.
287
at UNIV OF KENTUCKY on December 27, 2010http://rer.aera.netDownloaded from

Kulik, Kulik, and Bangert-Drowns
On the 11 studies common to the two reviews, there is not much disagreement. The median of our effect sizes for these studies is 0.34; the median of Slavin's effect sizes is 0.27. In 7 of 11 cases, the effect sizes calculated by Slavin and us agree exactly (Anderson et al., 1976; Fagan, 1976; Long, Okey, & Yeany, 1978; Lueck-meyer & Chiappetta, 1981; Mevarech, 1980, 1986; Slavin & Karweit, 1984). In 3 other cases, effect sizes agree fairly well. Slavin reported effects sizes of 0.09 and 0.18 for the Jones et al. (1979) study, whereas we calculated effect sizes of 0.09 and 0.41, for an average of 0.25. Slavin reported an effect size of 0.25 for the study by Katims, Smith, Steele, and Wick (1977), whereas we calculated an effect size of 0.17. Slavin reported only direction of differences for Kersh's (1971) study, whereas we reported an average effect size of -0.06.
The only serious disagreement on the 11 studies concerns Cabezon's (1984) results. Slavin calculated effect sizes of 0.40 on Spanish examinations and 0.14 on mathematics examinations in Cabezon's study. These effect sizes differ strikingly from those calculated by Cabezon himself for his own data. Cabezon reported improvements of 0.64 standard deviations in Spanish after 1 year of mastery learning and 1.03 standard deviations after 3 years. He reported improvements of 0.37 standard deviations in mathematics after 1 year of mastery learning and 0.65 standard deviations after 3 years. When a study reports results from examinations given in early and later stages of a treatment, our practice is to represent the treatment effect by the later results. We therefore represented the results of Cabezon's study by an effect size of 0.84—the average of Cabezon's 3-year effect sizes for Spanish and mathematics.
Slavin's figure is much lower for two reasons. First, he threw out Cabezon's 3-year data altogether, arguing that they came from a pilot project and that experimental groups in pilot projects are likely to be atypical. It is true that Cabezon described 3-year students as a pilot group, but it is also clear from the context that Cabezon used the term not to suggest atypicality but rather to emphasize the fact that these students were involved in the project from its first, or pilot, year. Cabezon, in fact, took pains to describe the random stratified sampling plan that he used to draw experimental and control classes in the pilot year, and his report contains results of statistical tests of the comparability of pilot-year experimental and control classes on intelligence, age, socioeconomic status, and so forth. Cabezon concluded that the groups were comparable on all of these factors.
Slavin also rejected Cabezon's calculations of 1-year effect sizes. Instead of reporting Cabezon's figures, Slavin reported his own recalculated effect sizes for Cabezon's first-year results. Slavin's recalculations involved use of Raven's Progressive Matrices test as a covariate. Three points are worth noting. First, Cabezon did not employ the Raven's test as a covariate in his analyses. Second, Cabezon did not report statistics needed for post hoc use of the Raven's test as a covariate: (a) the correlation between Raven's test scores and criterion scores, and (b) within-group standard deviations on Raven's test. Third, the size of the adjustment that Slavin made on Cabezon's reported effect sizes is inconsistent with plausible estimates of covariate-criterion correlations and estimates of variation on the Raven's test in the population studied.
We also disagree with Slavin on six studies that he counts as best-evidence cases and that we consider to be inadequate as evaluations of mastery learning. In three of the studies the experimental group was not taught in a mastery program. In
288
at UNIV OF KENTUCKY on December 27, 2010http://rer.aera.netDownloaded from
Mastery Learning Effects
Gutkin's (1985) study the experimental group consists of students whose teachers were taught in one type of inservice training program; the teachers of control students were taught in another type of inservice program. Neither experimental nor control students were taught by mastery methods. In Hecht's (1980) study, tutoring help was available for experimental-group students who wanted it but not for control students. Otherwise, all students followed the same procedures, and all took two forms of each unit test. The two groups differed therefore not in mastery versus nonmastery teaching but rather in the availability of optional tutoring for one group. In Wyckoff s (1974) study, the nature of the treatment is unclear. All members of both mastery and conventional classes moved on to new material after a unit test was given. The decision to move on to new material in the mastery class was contingent on 50% of the students achieving a 70% mastery level on a unit test. Because few students ever scored below 70% on the unit tests, however, mastery students moved immediately from one unit to the next. Overall, these three studies fail to meet Slavin's best-evidence criteria of an explicit mastery criterion and at least two testing cycles for the experimental group, and they also fail to meet our requirement that the experimental group be taught by a mastery method.
In the other three studies the control group was not taught in a conventional program. In Fuchs et al.'s (1985) study the control group was taught by a mastery treatment based on a commercial basal reading series; the purpose of the study was to compare effects of two mastery approaches. In Chance's (1980) study students in the control group worked at their own rates, both individually and in pairs, on specially programmed material. In Dunkelberger and Heikkinen's (1984) study, the control group worked through mastery materials with mastery monitored internally; the purpose of the experiment was to compare outcomes in groups of students with mastery monitored internally and externally. Slavin's classification of these three studies as best-evidence cases is puzzling to us. His criteria for best-evidence cases include a requirement that the control group receive conventional group-based instruction; he claims to have rejected as unsuitable studies in which the control treatment was self-paced instruction.
Finally, we believe that Slavin's review ignores credible evidence contained in six other studies of LFM. Two of the studies that Slavin explicitly rejected as best-evidence cases seem to us to meet all of his as well as our own criteria for credible evidence (Dillashaw & Okey, 1983; Strasler, 1979). Slavin eliminated Dillashaw and Okey's study from his analysis because he considered it to lack a control for pretest differences. In fact, Dillashaw and Okey separately examined effects of pretest standing and treatment in an analysis of variance design in which pretest score was a blocking variable. In our view, this design separates adequately the effects of pretest standing and treatment, and the use of this design does not diminish the importance of Dillashaw and Okey's evidence. Slavin also eliminated Strasler's (1979) study from his analysis because he considered it to be too short in duration. He set 4 weeks as the minimum duration for a best-evidence study and counted Strasler's study as a 2-week experiment. Students in Strasler's study, in fact, were instructed for more than 4 weeks by mastery procedures. In our view, therefore, the study merits serious consideration, even by reviewers who impose a length requirement on studies they analyze.
Slavin also eliminated from his analysis studies by Hymel and Mathews (1980)
289
at UNIV OF KENTUCKY on December 27, 2010http://rer.aera.netDownloaded from

Kulik, Kulik, and Bangert-Drowns
and Okey (1974) because of their short duration (2 weeks) and studies by Mevarech (1985) and Saunders-Harris and Yeany (1981) because they examined only a single experimental and control group. In our view, it is a mistake for reviewers to dismiss out of hand studies of short duration and limited size. Such studies may give as true an indication of the potential of experimental educational methods as long-term, large-scale studies do. Treatment fidelity is usually difficult to ensure in long-term, large-scale implementations of experimental methods because school systems usually find it difficult to implement truly distinct experimental and control treatments on a long-term, large-scale basis. In addition, treatment diffusion can be a problem in long-term programs. Given such complications, it seems to us a mistake to give all the weight in reviews to long-range, large-scale studies and to give no weight to shorter and smaller studies in which control may be greater and treatments more distinct.
Overall, the studies that Slavin selected as best-evidence cases do not seem to us to represent the best in evaluations of precollege LFM programs. Several of Slavin's best-evidence studies do not evaluate effects of mastery programs at all, and several others do not meet his other requirements for a best-evidence case. In addition, Slavin's review ignores evidence and minimizes effects in studies that do qualify as best-evidence cases. The average effect size that we calculated for 13 precollege LFM studies that meet Slavin's best-evidence criteria is 0.43. When we added evidence from 4 other credible evaluations, we found an average effect size of 0.49 for precollege LFM studies.
Slavin has also argued that results in best-evidence cases are not all equal. Simply looking at an overall average effect seems to him to be nearly meaningless. The best evidence in the best-evidence cases, according to Slavin, comes from comparisons in which (a) achievement of experimental and control groups is measured on standardized rather than locally developed tests, and (b) no extra time is allowed for feedback and remediation tasks in the experimental class. Slavin has reported that in evaluations that meet these two requirements, mastery teaching turns out to be no more effective than conventional instruction.
Slavin is correct in pointing out that size of effect differs in LFM evaluations that use standardized and local tests as criterion measures. None of the five LFM studies that employed standardized criterion tests found a significant or even small effect on the standardized test. And yet two of the same studies found moderate treatment effects on locally developed tests. Several PSI studies found moderately strong effects on standardized tests, but the PSI literature is generally consistent with the LFM literature in showing clearly larger effects on local tests.
Slavin has suggested* therefore, that LFM procedures do not produce greater mastery of subject areas. The difference in results on standardized and local tests suggests to him that mastery teachers may be consciously or unconsciously "teach* ing the test" or that evaluators may be consciously or unconsciously slanting tests toward the content emphasized in the experimental program. Either scenario leads to the same conclusion. LFM programs do not get good marks on the tests that count—the nationally standardized ones.
Two points are worth noting. First, the demonstrably superior performance of LFM students on locally developed tests is not offset by demonstrably poorer performance on standardized tests. LFM students perform as well as conventionally instructed students on standardized tests, and they perform at a clearly higher level
290
at UNIV OF KENTUCKY on December 27, 2010http://rer.aera.netDownloaded from

Mastery Learning Effects
on the locally developed tests used in most LFM evaluations. Second, many educational researchers think that local tests provide the best evidence on effectiveness because these tests usually focus on the curricula taught in a specific school system at a particular grade level, whereas standardized tests sample broadly over a wide range of grades and school systems. Block and Burns (1976), in fact, excluded all results from standardized tests in their review of LFM and PSI studies, arguing that standardized tests provided inappropriate criteria for judging local courses. Guskey (1987) and Anderson and Burns (1987) have also questioned the value of standardized tests in LFM evaluations. Our view is that both local and standardized tests can provide valuable information at this point. It seems to us premature to drop either criterion as inappropriate.
Slavin has also investigated the hypothesis that some of the improvement in performance attributed to LFM results may in fact stem from the extra time provided for corrective instruction in LFM classes. Slavin's results, however, did not support this hypothesis. Treatment effects in what Slavin classified as extra-time studies were no larger than effects in his equal-time studies. Slavin admitted, however, that the distinction between the two types of studies was "often subtle and difficult to discriminate, as many authors did not clarify when or how corrective instruction was delivered or what the control groups were doing during the time when mastery classes received corrective instruction" (1987, p. 192). In fact, we could not reproduce Slavin's classification of extra-time and equal-time studies based on the descriptions that the investigators gave in their reports. For example, Mevarech (1980), whose study Slavin classified as an extra-time evaluation, stressed the equality of time for mastery and other students. Anderson and his collegues (1976), whose study Slavin classifed as an equal-time study, pointed out that teachers believed that mastery students covered more instructional units in less time.
Subjective classifications seem to us to be a poor substitute for objective data, but unfortunately only a small fraction of the investigators provided data on time requirements for mastery learning. An analysis of these data suggests that mastery classes make greater demands on student time than do conventional classes. Two points should be kept in mind about these time demands, however. First, the increase in student workload in mastery programs is, on the average, relatively modest in size. Although one or two self-paced college courses increased student workloads by a great deal, the typical mastery program required only 4% more time than a conventional program does. That means that for each hour that students in a conventional class spend on their work, mastery students put in 62 or 63 minutes. We believe that most teachers will find this increase in student workload to be a reasonable one, given the gain in learning that is likely to result from it.
Second, the best available data suggest that examination-score increases as large as those found in this meta-analysis will not result from increases in instructional time alone. Levin and Meister (1986), for example, found that increasing instructional time in elementary schools by approximately 50%—without changing the way in which the time was used—resulted in examination-score increases of only 0.03 standard deviations for mathematics and 0.07 standard deviations for reading. Mastery programs produce larger effects on examination scores with far smaller commitments of instructional time.
291
at UNIV OF KENTUCKY on December 27, 2010http://rer.aera.netDownloaded from
Kulik, Kulik, and Bangert-Drowns
It should also be noted that the findings of this analysis are consistent with predictions of mastery theory. The mastery model predicts higher examination scores, reduced variation in examination scores, and more positive academic attitudes with mastery teaching, and we found all these effects in mastery classes. The effects, however, were not as large as those sometimes claimed for mastery procedures.
One often-cited prediction from the mastery model, for example, is that mastery teaching will raise the performance of 90% of the students to a level ordinarily achieved by only the top 10%. This prediction implies that 90% of the students taught for mastery will score at or above the 90th percentile on course examinations. To achieve such an improvement in student performance, an increase in average score of more than two standard deviations would be necessary. Such a predicted effect is far larger than the increase of 0.5 standard deviations found in this metaanalysis.
Even though an improvement of 0.5 standard deviations may fall far below expectations, it is nonetheless a relatively strong one for an educational effect. We recently reviewed meta-analyses in nearly 40 different areas of educational research (J. Kulik & Kulik, 1989). Few educational treatments of any sort were consistently associated with achievement effects as large as those produced by mastery teaching. Peer- and cross-age tutoring programs, for example, were associated with increases in examination scores of 0.4 standard deviations, computer-based teaching programs with increases of 0.35 standard deviations, programmed texts with increases of 0.15 standard deviations, and "open" education programs with decreases of 0.1 standard deviations. In evaluation after evaluation, mastery programs have produced more impressive gains.
References Abraham, F. J., & Newton, J. M. (1974, April). The interview technique as a personalized
system of instruction for economics: The Oregon experience. Paper presented at the National Conference on Personalized Instruction in Higher Education, Washington, DC.
Anderson, L. W. (1975). Student involvement in learning and school achievement. California Journal of Educational Research, 26, 53-62.
Anderson, L. W. (1976). An empirical investigation of individual differences in time to learn. Journal of Educational Psychology, 68, 226-233.
Anderson, L. W., & Burns, R. B. (1987). Values, evidence, and mastery learning. Review of Educational Research, 5 7, 215-223.
Anderson, L. W., Scott, C, & Hutlock, N. (1976, April). The effects of a mastery learning program on selected cognitive, affective and ecological variables in grades 1 through 6. Paper presented at the annual meeting of the American Educational Research Association, San Francisco.
Arlin, M., & Webster, J. (1983). Time costs of mastery learning. Journal of Educational Psychology, 75, 187-195.
Austin, S. M, & Gilbert, K. E. (1973). Student performance in a Keller-Plan course in introductory electricity and magnetism. American Journal of Physics, 41, 12-18.
Badia, P., Stutts, C, & Harsh, J. (1978). Do methods of instruction and measures of different abilities and study habits interact? In J. G. Sherman, R. S. Ruskin, & R. M. Lazar (Eds.), Personalized instruction in education today (pp. 113-128). San Francisco: San Francisco Press.
Benson, J. S., & Yeany, R. H. (1980, April). Generalizability of diagnostic-prescriptive teaching strategies across student locus of control and multiple instructional units. Paper presented at the annual meeting of the American Educational Research Association, Boston. (ERIC
292
at UNIV OF KENTUCKY on December 27, 2010http://rer.aera.netDownloaded from

Mastery Learning Effects
Document Reproduction Service No. 187 534) Billings, D. B. (1974). PSI versus the lecture course in the principles of economics: A quasi-
controlled experiment. In R. S. Ruskin & S. F. Bono (Eds.), Personalized instruction in higher education (pp. 30-37). Washington, DC: Center for Personalized Instruction.
Blackburn, K. T., & Nelson, D. (1985, April). Differences between a group using a traditional format with mastery learning and a group using a traditional format only in developmental mathematics courses at the university level: Implications for teacher education programs. Paper presented at the annual meeting of the American Educational Research Association, Chicago. (ERIC Document Reproduction Service No. ED 258 948)
Blasingame, J. W. (1975). Student attitude and performance in a personalized system of instruction course in business administration—Correlates of performance with personality traits. Dissertation Abstracts International, 36, 3840 (University Microfilms No. 75-2834)
Bloom, B. S. (1968, May). Mastery learning. In Evaluation comment (Vol. 1, No. 2). Los Angeles: University of California at Los Angeles, Center for the Study of Evaluation of Instructional Programs.
Bloom, B. S. (1976). Human characteristics and school learning. New York: McGraw-Hill. Born, D. G., & Davis, M. L. (1974). Amount and distribution of study in a personalized
instruction course and in a lecture course. Journal of Applied Behavior Analysis, 7, 365— 375.
Born, D. G., Gledhill, S. M., & Davis, M. L. (1972). Examination performance in lecture-discussion and personalized instruction courses. Journal of Applied Behavior Analysis, 5, 33-43.
Breland, N. S. & Smith, M. P. (1974). A comparison of PSI and traditional methods of instruction for teaching introduction to psychology. In R. S. Ruskin & S. F. Bono (Eds.), Personalized instruction in higher education (pp. 21-25). Washington, DC: Center for Personalized Instruction.
Bryant, N. D., Fayne, H. R., & Gettinger, M. (1982). Applying the mastery model to sight word instruction for disabled readers. Journal of Experimental Education, 50, 116-121.
Cabezon, E. (1984). The effects of marked changes in student achievement pattern on the students, their teachers, and their parents: The Chilean case. Unpublished doctoral dissertation, University of Chicago.
Calhoun, J. F. (1976). The combination of elements in the personalized system of instruction. Teaching of Psychology, 3, 73-76.
Chance, C. E. (1980). The effects of feedback/corrective procedures on reading achievement and retention. Unpublished doctoral dissertation, University of New Orleans.
Clark, C. P., Guskey, T. P., & Benninga, J. S. (1983). The effectiveness of mastery learning strategies in undergraduate education courses. Journal of Educational Research, 76, 210-214.
Clark, S. G. (1975). An innovation for introductory sociology: Personalized system of instruction. In J. M. Johnston (Ed.), Behavior research and technology in higher education (pp. 117-124). Springfield, IL: Charles C Thomas.
Cohen, J. (1977). Statistical power analysis for the behavioral sciences (rev. ed.). New York: Academic Press.
Coldway, D. O., Santowski, M., O'Brien, R., & Lagowski, V. (1975). Comparison of small-group contingency management with the personalized system of instruction and the lecture system. In J. M. Johnston (Ed.), Research and technology in college and university teaching (pp. 215-224). Gainesville: University of Florida.
Cole, C, Martin, S., & Vincent, J. (1975). A comparison of two teaching formats at the college level. In J. M. Johnston (Ed.), Behavior research and technology in higher education. Springfield, IL: Charles C Thomas.
Condo, P. (1974, April). The analysis and evaluation of a self-paced course in calculus. Paper presented at the National Conference on Personalized Instruction in Higher Education, Washington, DC.
293
at UNIV OF KENTUCKY on December 27, 2010http://rer.aera.netDownloaded from

Kulik, Kulik, and Bangert-Drowns
Cooper, J. L., & Greiner, J. M. (1971). Contingency management in an introductory psychology course produces better retention. Psychological Record, 21, 391-400.
Corey, J. R., & McMichael, J. S. (1974). Retention in a PSI introductory psychology course. In J. G. Sherman (Ed.), PSI: 41 germinal papers (pp. 17-19). Menlo Park, CA: W. A. Benjamin.
Cote, J. D. (1976). Biology by PSI in a community college. In B. A. Green, Jr. (Ed.), Personalized instruction in higher education (pp. 67-72). Washington, DC: Center for Personalized Instruction.
Cross, M. Z., & Semb, G. (1976). An analysis of the effects of personalized instruction on students at different initial performance levels in an introductory college nutrition course. Journal of Personalized Instruction, 1, 47-50.
Decker, D. F. (1976). Teaching to achieve learning mastery by using retesting techniques. (ERIC Document Reproduction Service No. ED 133 002)
Dillashaw, F. G., & Okey, J. R. (1983). Effects of a modified mastery learning strategy on achievement, attitudes, and on-task behavior of high school chemistry students. Journal of Research in Science Teaching, 20, 203-211.
Dunkelberger, G. E., & Heikkinen, H. (1984). The influence of repeatable testing on retention in mastery learning. School Science and Mathematics, 84, 590-597.
Dustin, D. S., & Johnson, S. L. (1974). Some effects of a test criterion. Unpublished manuscript, State University of New York, Plattsburgh.
Fagan, J. S. (1976). Mastery learning: The relationship of mastery procedures and aptitude to the achievement and retention of transportation-Environmental concepts by seventh grade students. Dissertation Abstracts International, 36, 5981. (University Microfilms No. 76-6402)
Fehlen, J. E. (1976). Mastery learning techniques in the traditional classroom setting. School Science and Mathematics, 76, 241-245.
Ferguson, W. (1981). Personalized instruction in business education. Journal of Experimental Education, 50, 9-13.
Fernald, P. S., & DuNann, D. H. (1975). Effects of individualized instruction upon low- and high-achieving students, study behavior, and students' evaluation of mastery. Journal of Experimental Education, 43, 27-34.
Fuchs, L. S., Tindal, F., & Fuchs, D. (1985). A comparison of mastery learning procedures among high and low ability students. Unpublished manuscript, Vanderbilt University, Nashville, TN. (ERIC Document Reproduction Service No. ED 259 307)
Glass, G. V., McGaw, B., & Smith, M. L. (1981). Meta-analysis in social research. Beverly Hills, CA: Sage Publications.
Goldwater, B. C, & Acker, L. E. (1975). Instructor-paced, mass-testing for mastery performance in an introductory psychology course. Teaching of Psychology, 2, 152-155.
Gregory, I., Smeltzer, D. J., Knopp, W., & Gardner, M. (1976). Teaching of psychiatry by PSI: Impact on National Board Examination Scores. Unpublished manuscript, Ohio State University, Columbus.
Guskey, T. R. (1982). The effects of staff development on teachers' perceptions about effective teaching. Journal of Educational Research, 78, 378-381.
Guskey, T. R. (1984). The influence of changes in instructional effectiveness upon the affective characteristics of teachers. American Educational Research Journal, 21, 245-259.
Guskey, T. R. (1987). Rethinking mastery learning reconsidered. Review of Educational Research, 57, 225-229.
Guskey, T. R., Benninga, J. S., & Clark, C. B. (1984). Mastery learning and students' attributions at the college level. Research in Higher Education, 20, 491-498.
Guskey, T. R., & Gates, S. L. (1985, April). A synthesis of research on group-based mastery learning programs. Paper presented at the annual meeting of the American Educational Research Association, Chicago. (ERIC Document Reproduction Service No. ED 262 088)
Guskey, T. R., & Monsaas, J. A. (1979). Mastery learning: A model for academic success in
294
at UNIV OF KENTUCKY on December 27, 2010http://rer.aera.netDownloaded from
Mastery Learning Effects
urban junior colleges. Research in Higher Education, 11, 263-274. Gutkin, J. (1985, March). The effect of diagnostic inservice training on class reading achieve
ment and number of lessons covered. Paper presented at the annual meeting of the American Educational Research Association, Chicago. (ERIC Document Reproduction Service No. ED 260 382)
Hardin, L. D. (1977). A study of the influence of a physics personalized system of instruction versus lecture on cognitive reasoning, achievement, attitudes and critical thinking. Dissertation Abstracts International, 38, 4711A-4712A. (University Microfilms No. 77-30,826)
Hecht, L. W. (1980, April). Stalking mastery learning in its natural habitat. Paper presented at the annual meeting of the American Educational Research Association, Boston.
Heffley, P. D. (1974). The implementation of the personalized system of instruction in the freshman chemistry course at Canisius College. In R. S. Ruskin & S. F. Bono (Eds.), Personalized instruction in higher education (pp. 140-145). Washington, DC: Center for Personalized Instruction.
Herring, B. G. (1975, December). Cataloguing and classification (One of a series of reports on the project titled Expansion of Keller Plan Instruction in Engineering & Selected Other Disciplines.) Austin: University of Texas.
Herring, B. G. (1977). The written PSI study guide in a non-PSl course. Austin: University of Texas at Austin.
Herrmann, T. (1984, August). TELIDON as an enhancer of student interest and performance. Paper presented at the annual meeting of the American Psychological Association, Toronto, Canada. (ERIC Document Reproduction Service No. ED 251 004)
Hindman, C. D. (1974). Evaluation of three programming techniques in introductory psychology courses. In R. S. Ruskin & S. F. Bono (Eds.), Personalized instruction in higher education (pp. 38-42). Washington, DC: Center for Personalized Instruction.
Honeycutt, J. K. (1974, April). The effect of computer managed instruction on content learning of undergraduate students. Paper presented at the annual meeting of the American Educational Research Association, Chicago. (ERIC Document Reproduction Service No. ED 089 682)
Hymel, G. M., & Mathews, G. (1980). Effects of a mastery approach on social studies achievement and unit evaluation. Southern Journal of Educational Research, 14, 191-204.
Jackman, L. E. (1982). Evaluation of a modified Keller Method in a biochemistry laboratory course. Journal of Chemical Education, 59, 225-227.
Jacko, E. J. (1974). Lecture instruction versus a personalized system of instruction: Effects on individuals with differing achievement anxiety and academic achievement. Dissertation Abstracts International, 35, 3521. (University Microfilms No. AAD 74-27211)
Johnson, W. G., Zlotlow, S., Berger, J. L., & Croft, G. (1975). A traditional lecture versus a PSI course in personality: Some comparisons. Teaching of Psychology, 2, 156-158.
Jones, B. F., Monsaas, J. A., & Katims, M. (1979, April). Improving reading comprehension: Embedding diverse learning strategies within a mastery learning instructional framework. Paper presented at the annual meeting of the American Educational Research Association, San Francisco. (ERIC Document Reproduction Service No. ED 170 698)
Katims, M., Smith, J. K., Steele, C, & Wick, J. W. (1977, April). The Chicago Mastery Learning Reading Program: An interim evaluation. Paper presented at the annual meeting of the American Educational Research Association, New York. (ERIC Document Reproduction Service No. ED 137 737)
Keller, F. S. (1968). "Good-bye, teacher..." Journal of Applied Behavioral Analysis, 1, 79-89.
Keller, F. S., & Sherman, J. G. (1974). The Keller plan handbook. Menlo Park, CA: Benjamin. Kersh, M. E. (1971). A strategy of mastery learning in fifth grade arithmetic. Unpublished
doctoral dissertation, University of Chicago. Klopfenstein, K. F. (1977). The Personalized System of Instruction in introductory calculus.
The American Mathematical Monthly, 84, 120-124.
295
at UNIV OF KENTUCKY on December 27, 2010http://rer.aera.netDownloaded from

Kulik, Kulik, and Bangert-Drowns
Knight, J. M., Williams, J. D., & Jardon, M. L. (1975). The effects of contingency avoidance on programmed student achievement. Research in Higher Education, 3, 11-17.
Krannich, L. K. (1976, May). The PSI approach to teaching a chemical problem solving pre-general chemistry course. Paper presented at the Third National Conference on Personalized Instruction in Higher Education, Washington, DC.
Kulik, C.-L. C, & Kulik, J. A. (1976). PSI and the mastery model. In B. A. Green, Jr. (Ed.), Personalized instruction in higher education (pp. 155-159). Washington, DC: Center for Personalized Instruction.
Kulik, C.-L. C, & Kulik, J. A. (1986-1987). Mastery testing and student learning: A metaanalysis. Journal of Educational Technology Systems, 15, 325-345.
Kulik, J. A. (1983). Individualized systems of instruction. In H. E. Mitzel (Ed.), The encyclopedia of educational research (5 th ed., pp. 851-858). New York: Macmillan.
Kulik, J. A., & Kulik, C.-L. C. (1986, April). Operative and interpretable effect sizes in metaanalysis. Paper presented at the annual meeting of the American Educational Research Association, San Francisco. (ERIC Document Reproduction Service No. ED 275 758)
Kulik, J. A., & Kulik, C.-L. C. (1989). Meta-analysis in education. International Journal of Educational Research, 13, 221-340.
Kulik, J. A., Kulik, C.-L. C, & Cohen, P. A. (1979). A meta-analysis of outcome studies of Keller's Personalized System of Instruction. American Psychologist, 34, 307-318.
Leppmann, P. K., & Herrmann, T. F. (1981, August). PSI—What are the critical elements? Paper presented at the annual meeting of the American Psychological Association, Los Angeles. (ERIC Document Reproduction Service No. ED 214 502)
Levin, H. M., & Meister, G. (1986). Is CAI cost-effective? Phi Delta Kappan, 67, 745-749. Lewis, D. K., & Wolf, W. A. (1973). Implementation of a self-pace learning (Keller plan) in
a first year course. Journal of Chemical Education, 50, 51-56. Lewis, E. W. (1984). The effects of a mastery learning strategy and an interactive computerized
quiz strategy on student achievement and attitude in college trigonometry. Dissertation Abstracts International, 45, 2430A. (University Microfilms No. DA84-24589)
Locksley, N. (1977). The Personalized System of Instruction (PSI) in a university mathematics class. Dissertation Abstracts International, 37, 4194. (University Microfilms No. ADD76-28194)
Long, J. C, Okey, J. R., & Yeany, R. H. (1978). The effects of diagnosis with teacher on student directed remediation on science achievement and attitudes. Journal of Research in Science Teaching, 15, 505-511.
Lu, M. C. (1976). The retention of material learned by PSI in a mathematics course. In B. A. Green, Jr. (Ed.), Personalized instruction in higher education (pp. 151-154). Washington, DC: Center for Personalized Instruction.
Lu, P. H. (1976). Teaching human growth and development by the Personalized System of Instruction. Teaching of Psychology, 3, 127-128.
Lubkin, J. L. (1974). Engineering statistics: A Keller Plan course with novel problems and novel features. In R. S. Ruskin & S. F. Bono (Eds.), Personalized instruction in higher education: Proceedings of the First National Conference held by the Center for Personalized Instruction (pp. 153-161). Washington, DC: Center for Personalized Instruction.
Lueckmeyer, C. L., & Chiappetta, W. L. (1981). An investigation into the effects of a modified mastery learning strategy on achievement in a high school human physiology unit. Journal of Research in Science Teaching, 18, 269-273.
Malec, M. A. (1975). PSI: A brief report and reply to Francis. Teaching Sociology, 2, 212-217.
Martin, R. R., & Srikameswaran, K. (1974). Correlation between frequent testing and student performance. Journal of Chemical Education, 51, 485-486.
McFarland, B. (1976). An individualized course in elementary composition for the marginal student. In B. A. Green, Jr. (Ed.), Personalized instruction in higher education (pp. 45-52). Washington, DC: Center for Personalized Instruction.
296
at UNIV OF KENTUCKY on December 27, 2010http://rer.aera.netDownloaded from

Mastery Learning Effects
McMichael, J., & Corey, J. R. (1969). Contingency management in an introductory psychology course produces better learning. Journal of Applied Behavior Analysis, 2, 79-83.
Mevarech, Z. R. (1980). The role of teaching-learning strategies and feedback-corrective procedures in developing higher cognitive achievement. Unpublished doctoral dissertation, University of Chicago.
Mevarech, Z. R. (1985). The effects of cooperative mastery learning strategies on mathematical achievement. Journal of Educational Research, 78, 372-377.
Mevarech, Z. R. (1986). The role of feedback corrective procedure in developing mathematics achievement and self-concept in desegregated classrooms. Studies in Educational Evaluation, 12, 197-203.
Mevarech, Z. R., & Werner, S. (1985). Are mastery learning strategies beneficial for developing problem solving skills? Higher Education, 14, 425-432.
Moore, J. W., Hauck, W. E., & Gagne, E. D. (1973). Acquisition, retention, and transfer in an individualized college physics course. Journal of Educational Psychology, 64, 335-340.
Moore, J. W., Mahan, J. M., & Ritts, C. A. (1969). Continuous progress concept of instruction with university students. Psychological Reports, 25, 887-892.
Morris, C, & Kimbrill, G. (1972). Performance and attitudinal effects of the Keller method in an introductory psychology course. Psychological Record, 22, 523-530.
Myers, R. R. (1976). The effects of mastery and aptitude on achievement and attitude in an introductory college geography course. Dissertation Abstracts International, 36, 5874. (University Microfilm No. 76-6436)
Nation, J. R., Knight, J. M., Lamberth, J., & Dyck, D. (1974). Programmed student achievement: A test of the avoidance hypothesis. Journal of Experimental Education, 42, 57-61.
Nation, J. R., Massad, P., & Wilkerson, P. (1977). Student performance in introductory psychology following termination of the programmed achievement contingency at mid-semester. Teaching of Psychology, 4, 116-119.
Nation, J. R., & Roop, S. S. (1975). A comparison of two mastery approaches to teaching introductory psychology. Teaching of Psychology, 2, 108-111.
Nazzaro, J. R., Todorov, J. C, & Nazzaro, J. N. (1972). Student ability and individualized instruction. Journal of College Science Teaching, 2, 29-30.
Nord, S. B. (1975). Comparative achievement and attitude in individualized and class instructional settings. Dissertation Abstracts International, 35, 5129A. (University Microfilm No. 75-02,314)
Okey, J. R. (1974). Altering teacher and pupil behavior with mastery teaching. School Science and Mathematics, 74, 530-535.
Omelich, C. L., & Covington, M. V. (1981). Do the learning benefits of behavioral instruction outweigh the psychological costs? Paper presented at the annual meeting of the Western Psychological Association, Los Angeles.
Pascarella, E. T. (1977, April). Aptitude-treatment interaction in a college calculus course taught in personalized system of instruction and conventional formats. Paper presented at the annual meeting of the American Educational Research Association, New York.
Peluso, A., & Baranchik, A. J. (1977). Self-paced mathematics instruction: A statistical comparison with traditional teaching. The American Mathematical Monthly, 84, 124-129.
Phillippas, M. A., & Sommerfeldt, R. W. (1972). Keller vs. lecture method in general physics instruction. American Journal of Physics, 40, 1800.
Pollack, N. F., & Roeder, P. W. (1975). Individualized instruction in an introductory government course. Teaching Political Science, 8, 18-36.
Rosati, P. A. (1975). A comparison of the personalized system of instruction with the lecture method in teaching elementary dynamics. In J. M. Johnston (Ed.), Behavior research and technology in higher education. Springfield, IL: Charles C Thomas.
Roth, C. H., Jr. (1973). Continuing effectiveness of personalized self-paced instruction in digital systems engineering. Engineering Education, 63(6).
297
at UNIV OF KENTUCKY on December 27, 2010http://rer.aera.netDownloaded from

Kulik, Kulik, and Bangert-Drowns
Roth, C. H., Jr. (1975, December). Electrical engineering laboratory I (One of a series of reports on the project titled Expansion of Keller Plan Instruction in Engineering and Selected Other Disciplines.) Austin: University of Texas.
Saunders-Harris, R. L., & Yeany, R. H. (1981). Diagnosis, remediation, and locus of control: Effects on immediate and retained achievement and attitude. Journal of Experimental Education, 49, 220-224.
Schielack, V. P., Jr. (1983). A personalized system of instruction versus a conventional method in a mathematics course for elementary education majors. Dissertation Abstracts International, 43, 2267. (University Microfilms No. 82-27717)
Schimpfhauser, F., Horrocks, L., Richardson, K., Alben, J., Schumm, D., & Sprecher, H. (1974). The personalized system of instruction as an adaptable alternative within the traditional structure of medical basic sciences. In R. S. Ruskin & S. F. Bono (Eds.), Personalized instruction in higher education (pp. 61-69). Washington, DC: Center for Personalized Instruction.
Schwartz, P. L. (1980). A controlled trial of teaching clinical biochemistry by Keller Plan. Journal of Medical Education, 55, 1013-1020.
Schwartz, P. L. (1981). Retention of knowledge in clinical biochemistry and the effect of Keller Plan. Journal of Medical Education, 56, 778-781.
Sharpies, D. K., Smith, D. J., & Strasler, G. M. (1976). Individually-paced learning in civil engineering technology: An approach to mastery. Columbia: South Carolina State Board for Technical and Comprehensive Education. (ERIC Document Reproduction Service No. ED 131 870)
Sheldon, M. S., & Miller, E. D. (1973). Behavioral objectives and mastery learning applied to two areas of junior college instruction. Los Angeles: University of California at Los Angeles. (ERIC Document Reproduction Service No. ED 082 730)
Sheppard, W. C, & MacDermott, H. G. (1970). Design and evaluation of a programmed course in introductory psychology. Journal of Applied Behavior Analysis, 3, 5-11.
Siegfried, J. J., & Strand, S. H. (1976). An evaluation of the Vanderbilt-JCEE experimental PSI course in elementary economics. The Journal of Economic Education, 8, 9-26.
Silberman, R., & Parker, B. (1974). Student attitudes and the Keller plan. Journal of Chemical Education, 57, 393.
Slavin, R. E. (1987). Mastery learning reconsidered. Review of Educational Research, 57, 175-213.
Slavin, R. E., & Karweit, N. L. (1984). Mastery learning and student teams: A factorial experiment in urban general mathematics classes. American Educational Research Journal, 21, 725-736.
Smiernow, G. A., & Lawley, A. (1980). Decentralized sequenced instruction (DSI) at Drexel. Engineering Education, 70, 423-426.
Smith, J. E. (1976). A comparison of the traditional method and a personalized system of instruction in college mathematics. Dissertation Abstracts International, 37, 904. (University Microfilms No. AAD76-18370)
Spector, L. C. (1976). The effectiveness of personalized system of instruction in economics. Journal of Personalized Instruction, 1, 118-122.
Spevack, H. M. (1976). A comparison of the personalized system of instruction with the lecture recitation system for nonscience oriented chemistry students at an open enrollment community college. Dissertation Abstracts International, 36, 4385A-4386A. (University Microfilms No. 76-01,757)
Steele, W. F. (1974, April). Mathematics 101 at Heidelberg College—PSI vs. tradition. Paper presented at the National Conference on Personalized Instruction in Higher Education, Washington, DC.
Stinard, T. A., & Dolphin, W. D. (1981). Which students benefit from self-paced mastery instruction and why. Journal of Educational Psychology, 73, 754-763.
Stout, L. J. (1978). A comparison of four different pacing strategies of personalized system of
298
at UNIV OF KENTUCKY on December 27, 2010http://rer.aera.netDownloaded from

Mastery Learning Effects
instruction and a traditional lecture format. Dissertation Abstracts International, 38, 6205. (University Microfilms No.AAD78-08600)
Strasler, G. M. (1979, April). The process of transfer in a learning for mastery setting. Paper presented at the annual meeting of the American Educational Research Association, San Francisco. (ERIC Document Reproduction Service No. ED 174 642)
Swanson, D. H., & Denton, J. J. (1977). Learning for Mastery versus Personalized System of Instruction: A comparison of remediation strategies with secondary school chemistry students. Journal of Research in Science Teaching, 14, 515-524.
Taylor, V. (1977, April). Individualized calculus for the "life-long" learner: A two-semester comparison of attitudes and effectiveness. Paper presented at the Fourth National Conference of the Center for Personalized Instruction, San Francisco.
Thompson, S. B. (1980). Do individualized mastery and traditional instructional systems yield different course effects in college calculus? American Educational Research Journal, 77,361-375.
Tietenberg, T. H. (1975). Teaching intermediate microeconomics using the personalized system of instruction. In J. M. Johnston (Ed.), Behavior research and technology in higher education (pp. 75-89). Springfield, IL: Charles C Thomas.
Toepher, C, Shaw, D., & Moniot, D. (1972). The effect of item exposure in a contingency management system. Paper presented at the annual meeting of the American Psychological Association, Honolulu, HI.
Vandenbroucke, A. C, Jr. (1974, April). Evaluation of the use of a personalized system of instruction in general chemistry. Paper presented at the National Conference on Personalized Instruction in Higher Education, Washington, DC.
VanVerth, J. E., & Dinan, F. J. (1974). A Keller plan course in organic chemistry. In R. S. Ruskin & S. F. Bono (Eds.), Personalized instruction in higher education (pp. 162-168). Washington, DC: Center for Personalized Instruction.
Walsh, R. G., Sr. (1977). The Keller Plan in college introductory physical geology: A comparison with the conventional teaching method. Dissertation Abstracts International, 37, 4257. (University Microfilms No. AAD76-30292)
Washburne, C. W., & Marland, S. P. (1963). Winnetka: The history and significance of an educational experiment. Englewood Cliffs, NJ: Prentice-Hall.
White, M. E. (1974). Differential equations by PSI. In R. S. Ruskin & S. F. Bono (Eds.), Personalized instruction in higher education (pp. 169-171). Washington, DC: Center for Personalized Instruction.
Witters, D. R., & Kent, G. W. (1972). Teaching without lecturing—Evidence in the case for individualized instruction. The Psychological Record, 22, 169-175.
Wyckoff, D. B. (1974). A study of mastery learning and its effects on achievement of sixth grade social studies students. Dissertation Abstracts International, 35, 5160A. (University Microfilms No. 75-3748)
Yeany, R. H., Dost, R. J., & Matthew, R. W. (1980). The effects of diagnostic-prescriptive instruction and locus of control on the achievement and attitudes of university students. Journal of Research in Science Teaching, 17, 537-545.
Authors
CHEN-LIN C. KULIK is Assistant Research Scientist, Center for Research on Learning and Teaching, 109 E. Madison St., Ann Arbor, MI 48109. She specializes in research synthesis and psychological measurement.
JAMES A. KULIK is Research Scientist, Center for Research on Learning and Teaching, 109 E. Madison St., Ann Arbor, MI 48109. He specializes in research synthesis and educational evaluation.
ROBERT L. BANGERT-DROWNS is Assistant Professor, University of Albany/SUNY, ED 313, 1400 Washington Ave., Albany, NY 12222. He specializes in critical thinking, instructional design, and research synthesis.
299
at UNIV OF KENTUCKY on December 27, 2010http://rer.aera.netDownloaded from