Embed Size (px)
Citation preview

REVIEW OF DEPTH TO BEDROCK IN GLOUCESTER INNER HARBOR
Prepared for:
Maguire Group, Inc.
One Court Street New Britain, CT 06051
Prepared by:
Science Applications
International Corporation Admiral's Gate
221 Third Street Newport, RI 02840
In association with:
CoastalVision 215 Eustis Avenue Newport, RI 02840
January 2000
Massachusetts Coastal Zone Management Office Dredged Material Management Plan
Phase 2C Program
SAIC Project No. 01-0440-04-4391-500 SAIC Report No. 483

Table of Contents 1.0 INTRODUCTION .................................................................................................... 1 2.0 GEOLOGICAL INFORMATION............................................................................ 1 3.0 CONDITION SURVEYS ......................................................................................... 4 4.0 ACOUSTIC SURVEYS ........................................................................................... 4 5.0 FINDINGS................................................................................................................ 6 6.0 RECOMMENDATIONS.......................................................................................... 6 7.0 REFERENCES ......................................................................................................... 8
ii

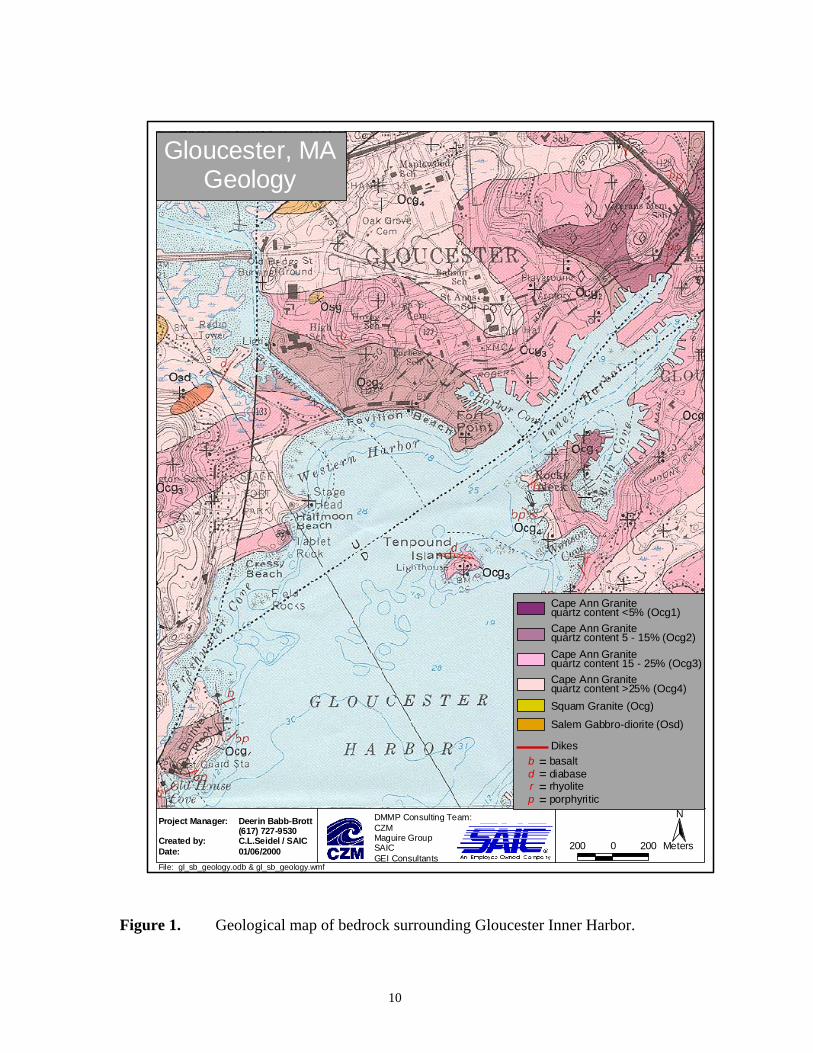
List of Figures Figure 1. Geological map of bedrock surrounding Gloucester Inner Harbor .............................10 Figure 2. Cross-section of Gloucester Harbor. The cross-section shows the high angle
thrust fault that runs along the axis of Gloucester Harbor ...........................................11 Figure 3. Ledge identified in 1995 by U.S. Army Corps of Engineers.......................................12 Figure 4. Tracklines of subbottom surveys in Gloucester Harbor ..............................................13 Figure 5. Interpreted depth to bedrock based on acoustic surveys..............................................14 Figure 6. Example acoustic reflection transect ...........................................................................15 Figure 7. Recommended subsurface data collection ...................................................................16 Figure 8. Suggested inner harbor disposal cells with average depth below MLW for fill
surface ..........................................................................................................................17
iii

1.0 INTRODUCTION The Gloucester Harbor Committee, after several discussions with the DMMP technical team, felt that it would be valuable to investigate any potential for siting Confined Aquatic Disposal (CAD) cells in the inner harbor of Gloucester. The construction of CAD cells requires the excavation of aquatic sediments (generally silt and/or sand) below the existing sediment surface. The size of the cell that can be constructed will depend on the properties of sediments in the area proposed (the depth of soft sediment, the ability of the sediments to support a side slope, the permeability of the sediments). In many areas of the northeastern United States, there is a highly variable thickness of sediment accumulated over irregular bedrock surfaces. Just as the land surface in Cape Ann is formed of hills and lowlands, the harbor areas represent drowned topography that has accumulated sediments since the last glacier left New England. These sediments have covered these drowned hills and lowlands leaving a relatively smooth layer of silt of varying depths. The primary limitation in defining potential locations for, and capacities of, CAD cells was the unknown depth of soft sediment throughout much of the harbor. Information available in the Phase 1 and Phase 2 reviews of candidate disposal sites (subbottom survey data, geotechnical review) was insufficient to provide detailed recommendations for locations of CAD cells within the harbor. There were two primary difficulties: the subbottom survey data were obscured throughout much of the harbor by the characteristics of the silt in the harbor (gas bubbles or surface reflectors), and the geotechnical data (ledge areas, borehole data, bathymetry) was not entered into a common reference format. The committee recommended further exploration of all available information on bedrock depth in the Gloucester Harbor area. We reviewed all available geological literature, Corps of Engineers documents, and the subbottom records to develop GIS layers of local geological features (faults, bedrock units), ledge removal areas, bathymetry and depth to bedrock. The geological data were consistent with the ledge removal areas and bedrock depth mapping. The subbottom data were carefully reviewed to draw inferences on bedrock depth in areas obscured by strong reflectors or gas deposits. The subbottom data were analyzed to confirm all reported or inferred depths and were then remapped onto a GIS layer. This provided the most accurate depiction (with relative confidence levels) of areas of the harbor that might have sufficient depth to bedrock to merit additional direct sampling. 2.0 GEOLOGICAL INFORMATION Recent geologic maps and articles were reviewed to provide the best understanding of the underlying fabric of the rocks expected to lay beneath the inner harbor of Gloucester. While there has been no detailed investigation of the bedrock geology within the inner harbor, the information available from the surrounding area is quite helpful.
1

In the most basic sense, the area of Gloucester inner harbor (or for that matter the entire Cape Ann area) was formed through two major geologic processes: placement and fracturing of the igneous rocks deep within the mantle of the earth and erosion of this bedrock by glacial activity. The glacial activity smoothed the existing bedrock and in places deposited sand, silt and till (a compact, concrete-like sediment). For the purposes of predicting the depth to bedrock within the harbor, the distribution of these processes in the area is quite important. The landscape of the Cape Ann area and much of New England is controlled by the underlying bedrock (Denny 1982). While the erosion and deposition associated with the glacial episodes of the Quaternary Era have altered the topography and created large landforms (e.g., Cape Cod, Stellwagen Bank), for the most part the shape of New England and location of harbors is related to bedrock distribution. In the determination of the most likely locations for CAD cells we need to account for bedrock geology, glacial deposits and recent estuarine deposits. Three features of the bedrock geology may help define potential locations for CAD cells: the nature of the bedrock (any variations in bedrock might produce lows or highs in topography); the locations of dikes (potentially zones of softer or harder rock); and the location of faults (generally areas of weakness that may have been preferentially eroded by glaciers). In the Cape Ann area, the bedrock is remarkably uniform, composed of Ordovician Era (450 million years before present) intrusive igneous rocks known as the Cape Ann Granite (Dennen 1992, [Cape Ann Complex of Zen et al. 1983]). These rocks were formed when molten rock from deep within the earth’s mantle rose and partially melted rocks in the lower and intermediate crust. Variations within the Cape Ann Granite suite of rocks (see Figure 1) are likely to be a result of incorporation of different proportions of crust material into the magma (represented by proportion of quartz in the rock). During the cooling of the granite, the material was split and allowed deeper liquid rock to flow into the splits and form “dikes” of different composition. Some of these may have fed extrusion of the magma in the form of volcanic vents creating ash and lava deposits (Lynn rhyolite). Much later the cooled granite and dike material was split during an episode when large areas of rock were subject to strain and fractured in large faults. These are regional faults with a very distinct trend (direction) and angle (Barosh et al. 1977, Barosh 1984). The faults are part of a layered “thrust” zone of eastern Massachusetts (Bell 1968) with northeast trending high angle faults where the western side of the fault rode over the eastern side (Figure 2). One branch of the local major north-northeast fault, trends east-northeast from Freshwater Cove through the Inner Harbor of Gloucester where it branches again (Figure 1). This fault is likely to be the controlling geological factor in the shape of the harbor itself. The axis of the harbor and the two inner segments of the harbor parallel the trend of the fault. While this might offer hope for deep areas of bedrock, other evidence (presence of ledge, acoustic survey) suggests that while the inner harbor was clearly formed by removal of material along the fault line, it was not removed to great depth.
2

One interesting aspect of the local geology is the theory that because the Cape Ann Granite was never subjected to the regional alteration (metamorphism) seen in rocks to the north and west, Cape Ann (and the Boston area) was not part of present North America until long after its formation (Barosh 1984, Hon et al. 1993). Many authors agree that it was likely formed during the closure of the “proto-Atlantic” or Iapetus Ocean. The present Atlantic was formed by a rifting of the continents during which the area represented by Cape Ann became part of the North American continent and the ocean opened further east. This theory has no practical relevance to the location of CAD cells in Gloucester Harbor but the lack of metamorphism does. The limited folding and deformation seen in the granites of Cape Ann may not have provided conditions for deep excavation of the bedrock along folds or seams between rock types. The bedrock geology was modified by fluvial (river) erosion, probably during a period of low sea level (Oldale and Wommack 1987) and then by several sequences of glaciation. The episodes of glaciation were accompanied by drowning of the land by the sea (the weight of the ice depresses the crust and the melting of the ice creates a rise in sea level) and subsequent draining of the land (shore regression) when the crust rebounded following the removal of the weight of the ice. This complex combination of events may remove much of the overlying soil horizon and deposit sands and gravels, till, silt or clay. These deposits can fill glacially scoured depressions with tens of meters of unconsolidated materials (Oldale and Wommack 1987). Based on borehole data, Gloucester Harbor appears to have glacial deposits under the recent silt (USACE 1995 and associated borehole logs). Sand and clay deposits of glacial origin have been used for CAD cell development in Massachusetts (Boston Harbor and Hyannis Harbor). Following the period of glaciation, the coastal areas of Cape Ann were inundated by the sea and recent marine deposits have accumulated (harbor silts, sands). These recent deposits tend to be fine-grained inside bedrock harbors (such as Gloucester) and often have high organic contents. The organic content can lead to creation of methane gas below the surface of the sediments and the surface can be modified by biological activity and winnowing from vessel wakes. Both of these conditions can interfere with acoustic methods of determining sediment depth (see below). Significance: The geological results suggest that locally, bedrock contours should reflect the general patterns seen on the land surface, with the location of faults or dikes serving as indicators of potential topographic lows in the bedrock contours. Because there is little variation in the type of bedrock seen in Cape Ann, it is unlikely that there are significant areas of softer rocks that might have been eroded more extensively by glaciation. The distribution of glacial deposits is difficult to predict from available evidence, but much of the marine sediment probably covers some thickness of glacial drift or till. An example is the results of borings taken on land and in the nearshore zone during reconstruction of the Coast Guard dock and helipad in 1972. These borings show an
3

average of 10-15 feet of unconsolidated material (fine sand and silt) before refusal of probes (nearshore) or encountering rock (land) (USCG 1972). Further evidence is seen in the borehole data from 1964 (USACE 1964). The 1964 data concentrated on areas suspected of ledge, but most boreholes contained 5–10 feet of sand, gravel or till. The recent marine silts, which are easily penetrated by probes, appear to mantle the glacial deposits and in some cases, rock outcrops (USCG 1972, USACE 1995). 3.0 CONDITION SURVEYS Dredging projects have been conducted in Gloucester Harbor since the late 1800’s to deepen the channel and remove rock obstructions (USACE 1995). The history of the identification of ledge areas and their removal provides important clues to the likelihood of bedrock depth in the inner harbor area. Between 1870 and 1916 a total of 3,536 cy of rock were removed in the inner harbor to a depth of –15 feet MLW. After the channel was authorized to –20 feet MLW, 1,000 cy of ledge were removed in 1964. Recent studies to determine the feasibility of deepening the existing channel and turning basin to either –24 or –26 feet MLW reviewed existing probe and borehole data to determine ledge areas that might need to be removed (Figure 3). This data review does not provide evidence for any areas of deep sediment layers above bedrock, but the majority of the probe studies only determined conditions to –23 feet MLW. However, there are numerous areas within the inner harbor (Ledge areas A, B, C, D, and E) where probe studies met refusal (hard sediment or rock) at –18 to –20 feet MLW. Probe and borehole data from 1959 and 1964 were reviewed in this study and compared to acoustic data (see below). The map constructed by the Corps to delineate contours of subsurface ledge was placed as an image in the GIS database to aid interpretation of acoustic records and evaluation of the potential for location of CAD cells (Figure 3). In addition, searches were made of the microfiche records at the Concord office of the New England District, U.S. Army Corps of Engineers to locate additional historical survey maps. Sketch maps from ca. 1900 and 1929 showed significant areas of ledge had been removed adjacent to the present Coast Guard station and in the North Channel of the Inner Harbor. These historical maps lend further support for the conclusion that much of the inner harbor area is underlain with shallow bedrock with a thin (<5 foot) layer of sediment. 4.0 ACOUSTIC SURVEYS In addition to the circumstantial evidence compiled from geological and condition surveys, there is direct evidence of depth to bedrock compiled from acoustic subbottom surveys. Subbottom seismic (or acoustic) profiling is a standard technique for determining changes in acoustic impedance below the sediment/water interface. The acoustic impedance, while a product of the velocity and density of sound in a sediment layer, is also affected by differences in surface roughness, porosity, and grain size, among other factors (Hamilton 1970; LeBlanc et al. 1992). In general, sound penetrates further into fine-grained sediment because the impedance of high-water content silt and clay is
4

closer to that of the water column. The ability to detect subbottom layers is similarly dependent on the acoustic impedance contrast between sediment layers (Myre and DeAngelo 1999). The presence of subbottom reflectors depends on changes in acoustic impedance between the water column and the sediment (first bottom reflector), and between subbottom layers of different lithologies. In general, the basement reflector (bedrock) is a dark (high amplitude) subbottom reflector because of the acoustic contrast between the basement rock and overlying sediments. Acoustic surveys were conducted from 19–20 December, 1998 and consisted of 31 lanes oriented perpendicular to the main channel and spaced at 50 m intervals (Myre and DeAngelo 1999). In addition, subbottom data were collected along four evenly spaced lanes in each of the two forks of the innermost harbor. Survey operations were conducted in the ATC areas and in the OD area from Ten Pound Island midway into the harbor (Figure 4). Details of the acquisition and processing of the subbottom acoustic records are available in Myre and DeAngelo (1999). The records from 1998 were reexamined in light of the renewed interest in locating CAD cells within Gloucester inner harbor. Each survey lane was reviewed to distinguish clear horizons of bedrock, those obscured by artifacts and those with no discernable bedrock. In general the subbottom profile records provided the ability to detect and map the basement bedrock layer. Two basic factors impeded the ability to confidently trace subbottom reflectors. The first problem in measuring subbottom reflectors was the presence of natural gas. The presence of gas in sediments is common, usually attributable to the decomposition of organic matter (commonly methane and other similar gasses). These gas “wipe-outs” prevent any distinction of subbottom layers. The second problem was in areas of coarse surface sediments; commonly the resolution below these sediments varied greatly from a complete loss of subbottom reflectors to a fair ability to distinguish the basement reflector. Subbottom data directly below these coarse sediments, frequently below the shipping channel, showed the presence of “multiples” that obscured the subbottom reflectors. The term “multiple” refers to strong reflections of sound from the sediment/water interface that arrive after an additional round trip through the water column. These multiples are easily identified because they arrive at specific multiples of time (travel time round trip through the water column), imitate the surface reflector, but appear to be a discrete distance “below” the sediment/water interface (Myre and DeAngelo 1999). The reviewed data was gridded and each grid was assigned values for depth (Figure 5). A depth interval was assigned 0-1 meters if it was clear based on acoustic and ledge data that bedrock protruded at the surface. This re-gridded data revealed that while the general pattern of bedrock depth distribution was the same as the 1999 report, there were important differences. In some areas, multiple reflectors had been digitized as bedrock reflectors exaggerating the potential depth. In other areas the data from along channel was obscured completely by the channel reflector, while cross channel data could be interpreted more clearly (each end of the lane had clear bedrock reflector outside the
5
channel). The resultant grid has less small-scale variation in depth for two reasons: one, a more conservative gridding routine; two, elimination of some data conflicts. The most significant area of deep bedrock occurs near the entrance to the harbor (Figure 5). This area is the most complex geologically (cut by a fault, dikes and several groups of Cape Ann granite) and appears to have some buried topography. An example of the acoustic data from a lane through this area reveals that the channel area is all but obscured by the surface reflector while a clear bedrock reflector can be seen at one end of the record (Figure 6). An additional area of deep bedrock occurs southwest of Ten Pound Island in a section of the record that was not originally digitized (a turn between lanes, Figure 4). While the depth to bedrock may be as much as 10 m, we currently have fragmentary evidence of the scale of the area with this depth. 5.0 FINDINGS 1. Subbottom records provide additional information when examined in relation to maps
of ledge, bedrock geology and the USACE condition survey. 2. Much of the inner harbor subbottom has a characteristic bottom type that provides a
strong surface reflection and obscures deeper subbottom information. This appears to be related to ship traffic, as it occurs in the authorized channel but outside of the area dredged to maintain navigation depth (shipping lanes).
3. Where the feature is present, we can only speculate on depth to bedrock. In some
cases adjacent areas provide depth to bedrock and some extrapolation is possible. 4. Most of the inner harbor shows no evidence for significant sediment depth (>3m)
based on ledge distribution, bedrock geology, and fragmentary subbottom evidence. An exception is Smith Cove which is visible on the subbottom records and may have as much as 3-5 m depth to bedrock.
5. Outside the harbor there are distinct areas of shallow and deep bedrock - which can
be clearly seen on subbottom records. Southwest of Ten Pound Island there is an area which shows evidence of at least 10 m of depth to bedrock (not shown on grid).
6. Some areas previously mapped with extensive depth to bedrock (near entrance to
harbor) appear to have a much smaller area of deep bedrock surface. This may limit their utility for CAD cells.
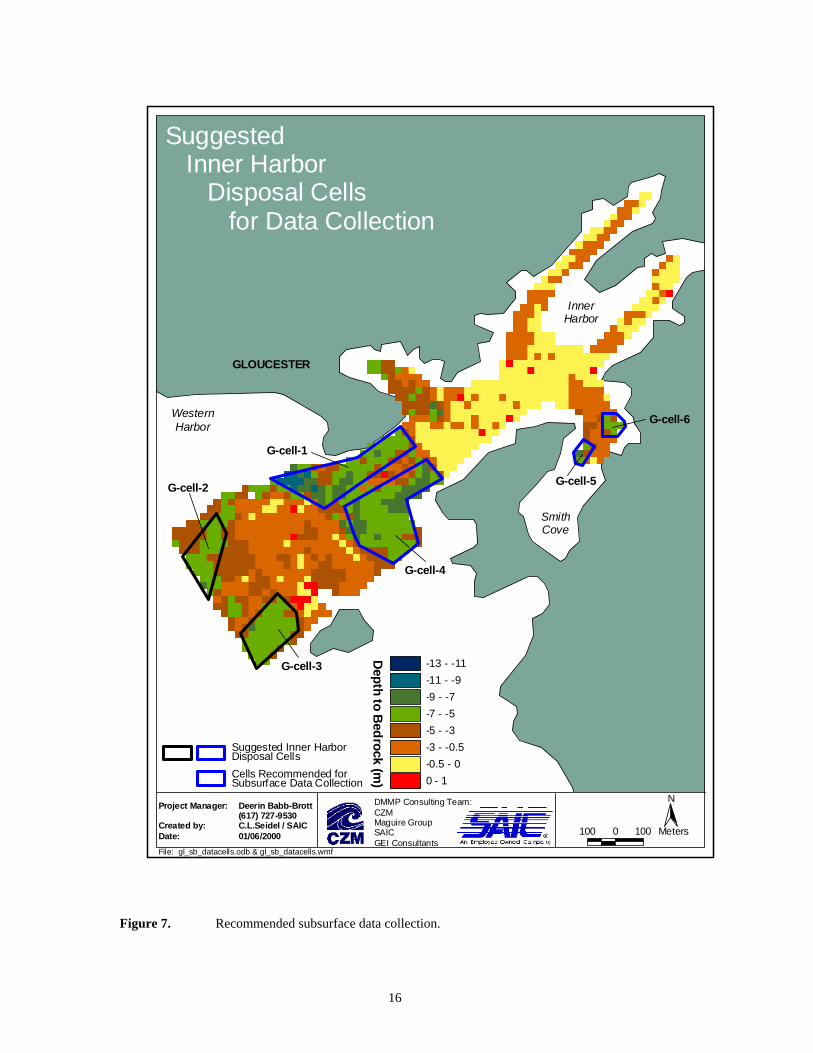
6.0 RECOMMENDATIONS In Gloucester, the bedrock depth is relatively shallow, and quite variable in the area near the entrance to the harbor, as shown by all of the data reviewed here. Despite careful re-analysis, some of the information contains a level of uncertainty due to loss of subbottom information. Some of the noise of the data was due to the presence of an acoustic reflecting surface layer associated with the shipping channel. This reflector was
6

persistent in the shipping lanes even in the areas outside of the dredged channel. These results suggest that ship traffic may produce a slightly coarse lag deposit in the channel that acts as an acoustic “ringer” obscuring the penetration of the acoustic signal. Therefore, in general, the estimates of bedrock depth from the channel area may be highly uncertain due to the need to extrapolate bedrock depth from the margins of the channel. All of the evidence (acoustic, condition surveys, geology) are consistent with an expectation that the bedrock depth in the inner harbor is quite shallow (less than 5 feet below sediment surface). While this area was identified by the committee as the most desirable region to locate a CAD cell, apart from Smith Cove, there do not appear to be any significant areas of depth within the inner harbor. Recommended subsurface data collection We do not recommend collection of borehole data in the inner harbor area (apart from Smith Cove) as the evidence for shallow bedrock is sufficiently compelling in our professional judgement to remove this area from consideration. Because of the difficulty in collecting reliable acoustic data within the harbor it will be necessary to collect ground-truth borehole data in any cell that is proposed as a preferred alternative (Figure 7). The areas in Smith Cove may be too small to serve as CAD cells, but if they are considered a small number of boreholes (2-3 for each cell) could provide sufficient design information to conduct an alternatives analysis. The depth to bedrock in the areas near the entrance to the harbor (G-Cell-1 and -4) is highly speculative, although there are some points within the dataset that are well-characterized. These areas are the areas with the greatest need for data collection, if the cells are deemed to be Preferred Alternative Disposal Sites. The areas outside the harbor (G-Cell-2, and –3) are relatively well-characterized and should not need confirmatory borehole exploration. It might be worthwhile to investigate the area to the southwest of Ten Pound Island with direct exploration as there was fragmentary evidence of significant depth to bedrock Recommended disposal cells The suggested disposal cell locations are modifications of the outlines of the Proposed Preferred Alternative Disposal Sites of Phase 2 (Figure 8). Rather than presume any interaction with other resource issues, these locations are based on the physical possibilities of CAD cell development. Therefore they still need to be evaluated in the same manner as the Proposed Preferred Alternative Disposal Sites. G-Cell-1 This proposed cell is a revised outline that corresponds to G3-ATC-A The average depth to bedrock is 6.4 m over an area of 48,973 m2 G-Cell-2 This proposed cell is a revised outline that corresponds to G3-ATC-B The average depth to bedrock is 5.5 m over an area of 22,969 m2
7

G-Cell-3 This proposed cell is a revised outline that corresponds to G3-ATC-C The average depth to bedrock is 5.6 m over an area of 30,215 m2 G-Cell-4 This proposed cell is a revised outline that corresponds to G3-ATC-D and includes area in the channel. The average depth to bedrock is 6 m over an area of 62,617 m2 G-Cell-5 This is a new cell located in Smith Cove that is quite small but might be used for small volumes, particularly if any maintenance or new dredging was conducted in the Cove The average depth to bedrock is 5.7 m over an area of 3,937 m2 G-Cell-6 This is a new cell located in Smith Cove that is quite small but might be used for small volumes, particularly if any maintenance or new dredging was conducted in the Cove The average depth to bedrock is 5.6 m over an area of 5,710 m2 7.0 REFERENCES Barosh, P.J., Fahey, R.J., and Pease, M.H., Jr., 1977. Preliminary Compilation of the
Bedrock Geology of the Land Area of the Boston Two Degree Sheet, New England Seismotectonic Study Report, Weston Observatory, Boston College.
Barosh, P.J. 1984. Regional Geology and tectonic history of southeastern New England,
in Hanson, S.L. ed.: New England Intercoll. Geol. Conf. 76th ann. Meeting Salem State College, Salem, Massachusetts, p. I-1 to I-35.
Bell, K.G. 1968. Faults in eastern Massachusetts [abs.]: Geological Society of America
Special Paper 115, NE Section, 2nd Annual Meeting, Boston, Mass., 1967, p. 250. Dennen, W.H. 1992. Bedrock Geologic Map of the Gloucester and Rockport
Quadrangles, Essex County, Massachusetts: U.S. Geological Survey Miscellaneous Investigations Series Map I-2285.
Denny, C.S. 1982. Geomorphology of New England: U.S. Geological Survey
Professional Paper 1208, 18 p. Hamilton, E. L. (1970). Reflection coefficients and bottom losses at normal incidence
computed from pacific sediment properties. Geophysics, 35:995-1004. Hon, R., Paige, M.L., and Loftenius, C.J. 1993. Petrogenesis of two diverse mid-
paleozoic complexes for eastern Massachusetts: A-Type Cape Ann Granite and I-Type Sharpners Pond Quartz Diorite, in Cheney, J.T. and Hepburn, J.C. ed: Field Trip Guidebook for the Northeastern United States: 1993 Geological Society of America Annual Meeting and 85th Annual New England Intercollegiate Geological Conference, October 25-28 Boston, Massachusetts.
8

LeBlanc, L. R., L. Mayer, M. Rufino, S. Schock, and J. King. (1992). Marine sediment
classification using the chirp sonar. J. Acoust. Soc. Am., 91(1):107-115. Maguire Group. (1997a). Preliminary geotechnical investigations, Dredged Material
Management Plan Task B. Submitted to Massachusetts Coastal Zone Management Agency, Boston, MA. Submitted by GEI Consultants, Inc., Winchester, MA.
Myre, P.L. and DeAngelo, E.C. 1999. Capacity analysis of CAD sites within Salem,
Gloucester, and New Bedford Harbors. Report submitted by Maguire Group to Massachusetts Coastal Zone Management Agency, March 1999, SAIC Report No. 467.
Oldale, R.N. and Wommack, L.E. 1987. Maps and seismic profiles showing geology of
the inner continental shelf, Cape Ann, Massachusetts to New Hampshire. U.S. Geological Survey Miscellaneous Field Studies Map MF-1892.
Ocean Surveys Inc. 1991. Hydrographic chart, post dredge survey-outfall extension
Gloucester Harbor, Gloucester, MA. Prepared for Maitland Brothers., Co. USACE 1964. Gloucester Harbor, Gloucester, Massachusetts. Record of Explorations.
Drawing number 266-Dr. 37, 7 sheets. U.S. Army Corps of Engineers, Waltham, MA, June 1964.
USACE 1995. Gloucester Harbor, Gloucester, Massachusetts, Navigation Improvement
Study Reconnaissance Report. Department of the Army Corps of Engineers, New England Division, July 1995.
- Appendix D and associated Condition surveys and subsurface data obtained from
microfiche collections held at New England District (NAE). Data includes borehole results and probe surveys within the inner harbor (1884-1965).
- Bathymetric condition survey sheets (1994 & 1999) USCG 1972. U.S. Coast Guard Station, Gloucester, Massachusetts Boring Plan, Boring
Log On-shore, Boring Log Off-shore. C.G. Drawings No. 6250, L-2,L-3,L-4. U.S. Coast Guard First District, Boston, Massachusetts, February 1972.
Zen, E-an, ed., Goldsmith, Richard, Ratcliffe, N.M., Robinson, Peter, and Stanley, R.S.
compilers. 1983. Bedrock Geologic Map of Massachusetts: U.S. Geological Survey Scale 1:250,000. Open-File Report 81-1327.
9
Project Manager:
Created by: Date:
Deerin Babb-Brott(617) 727-9530C.L.Seidel / SAIC01/06/2000
DMMP Consulting Team:CZMMaguire GroupSAICGEI Consultants
200 0 200 Meters
N
File: gl_sb_geology.odb & gl_sb_geology.wmf
Gloucester, MAGeology
Cape Ann Granitequartz content <5% (Ocg1)Cape Ann Granitequartz content 5 - 15% (Ocg2)Cape Ann Granitequartz content 15 - 25% (Ocg3)Cape Ann Granitequartz content >25% (Ocg4)Squam Granite (Ocg)Salem Gabbro-diorite (Osd)
Dikesbasaltdiabaserhyoliteporphyritic
====
bdrp
Figure 1. Geological map of bedrock surrounding Gloucester Inner Harbor.
10

WesternHarbor
GLOUCESTER
SoutheastHarbor
A'
F a u l t L i n
e
Cross-section Line
Project Manager:
Created by: Date:
Deerin Babb-Brott(617) 727-9530C.L.Seidel / SAIC01/06/2000
DMMP Consulting Team:CZMMaguire GroupSAICGEI Consultants
300 0 300 Meters
N
File: gl_sb_cross.odb & gl_sb_cross.wmf
SubbottomCross-Section
Figure 2. Cross-section of Gloucester Harbor. The cross-section shows the high
angle thrust fault that runs along the axis of Gloucester Harbor.
11

Figure 3. Ledge identified in 1995 by U.S. Army Corps of Engineers.
12

GLOUCESTER Inner Harbor
SmithCove
WesternHarbor
SoutheastHarbor
Project Manager:
Created by: Date:
Deerin Babb-Brott(617) 727-9530C.L.Seidel / SAIC01/06/2000
DMMP Consulting Team:CZMMaguire GroupSAICGEI Consultants
Subbottom Survey Tracklines
100 0 100 200 Meters
N
File: gl_sb_tracks.odb & gl_sb_tracks.wmf
Figure 4. Tracklines of subbottom surveys in Gloucester Harbor.
13

-13 - -11-11 - -9-9 - -7-7 - -5-5 - -3-3 - -0.5-0.5 - 00 - 1
Project Manager:
Created by: Date:
Deerin Babb-Brott(617) 727-9530C.L.Seidel / SAIC01/06/2000
DMMP Consulting Team:CZMMaguire GroupSAICGEI Consultants
Depth to Bedrock
100 0 100 200 Meters
N
File: gl_sb_grid.odb & gl_sb_grid.wmf
Depth to Bedrock (m)
Figure 5. Interpreted depth to bedrock based on acoustic surveys.
14

GLOUCESTER
Inner Harbor
SmithCove
WesternHarbor
-13 - -11-11 - -9-9 - -7-7 - -5-5 - -3-3 - -0.5-0.5 - 00 - 1
Project Manager:
Created by: Date:
Deerin Babb-Brott(617) 727-9530C.L.Seidel / SAIC01/06/2000
DMMP Consulting Team:CZMMaguire GroupSAICGEI Consultants
Acoustic Reflection Transects
100 0 100 200 Meters
N
File: gl_sb_ref lec.odb & gl_sb_reflec.wmf
Depth to Bedrock (m)
Survey Transects
Survey Transect 14
Surface Reflection Noisein Shipping Channel
Bedrock Reflector
Multiple Reflector
Figure 6. Example acoustic reflection transect.
15
GLOUCESTER
WesternHarbor
SmithCove
InnerHarbor
G-cell-1
G-cell-4
G-cell-3
G-cell-2 G-cell-5
G-cell-6
Project Manager:
Created by: Date:
Deerin Babb-Brott(617) 727-9530C.L.Seidel / SAIC01/06/2000
DMMP Consulting Team:CZMMaguire GroupSAICGEI Consultants
100 0 100 Meters
N
File: gl_sb_datacells.odb & gl_sb_datacells.wmf
Suggested Inner Harbor Disposal Cells for Data Collection
Suggested Inner HarborDisposal CellsCells Recommended forSubsurface Data Collection
Depth to Bedrock (m)
-13 - -11-11 - -9-9 - -7-7 - -5-5 - -3-3 - -0.5-0.5 - 00 - 1
Figure 7. Recommended subsurface data collection.
16

GLOUCESTER
WesternHarbor
SmithCove
InnerHarbor
G-cell-1
G-cell-4
G-cell-3
G-cell-2 G-cell-5
G-cell-6
Project Manager:
Created by: Date:
Deerin Babb-Brott(617) 727-9530C.L.Seidel / SAIC01/06/2000
DMMP Consulting Team:CZMMaguire GroupSAICGEI Consultants
100 0 100 Meters
N
File: gl_sb_cells.odb & gl_sb_cells.wmf
Suggested Inner HarborDisposal Cells
Suggested Inner HarborDisposal Cells
Depth to Bedrock (m)
-13 - -11-11 - -9-9 - -7-7 - -5-5 - -3-3 - -0.5-0.5 - 00 - 1
Cell NameG-cell-1G-cell-2G-cell-3G-cell-4G-cell-5G-cell-6
Average Depth to Bedrock (m) 6.369 5.494 5.605 5.984 5.687 5.590
Average Water Depth(m) 5.486 8.839 9.144 5.486 4.267 3.962
Area (sq. m)4897322969302156261739375710
Figure 8. Suggested inner harbor disposal cells with average depth below MLW for
fill surface.
17