Embed Size (px)
Citation preview
Review of Basic Principles inReview of Basic Principles inOptics, Optics, WavefrontWavefront and and
WavefrontWavefront Error Error
Austin Roorda, Ph.D.University of California, Berkeley
Google my name to find copies of these slides for free use and distribution
Geometrical Optics
Relationships between
pupil size, refractiveerror and blur

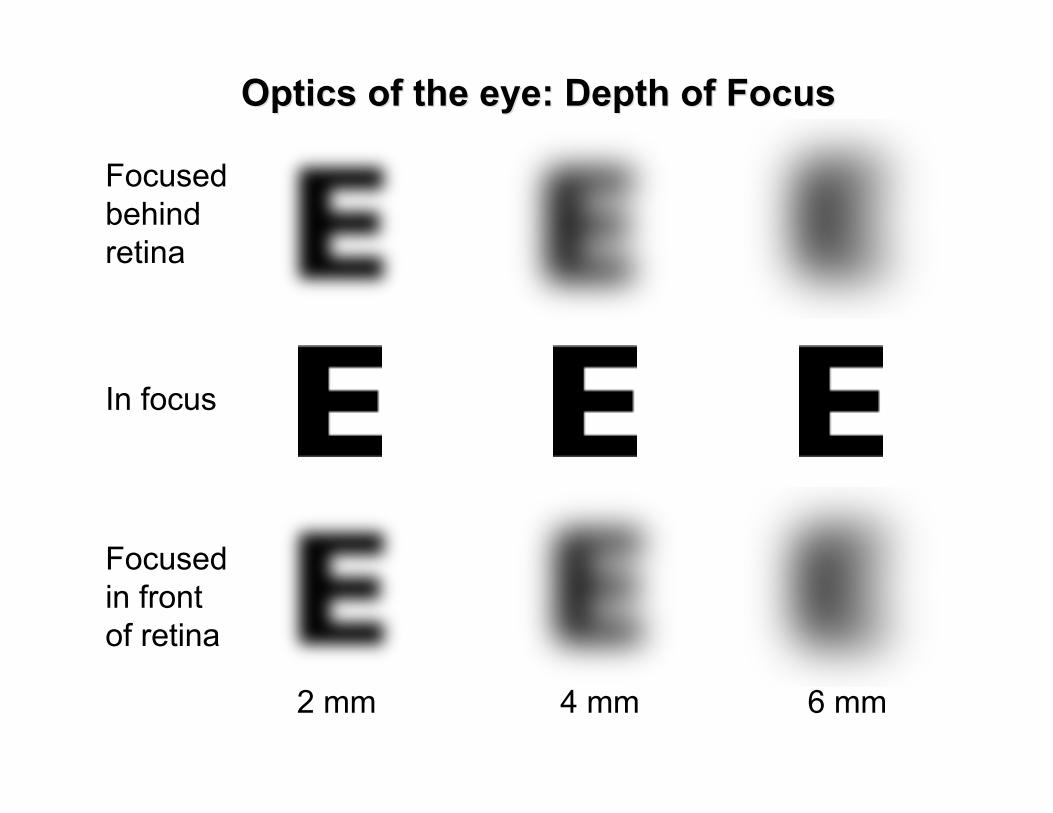
Optics of the eye: Depth of Focus Optics of the eye: Depth of Focus
2 mm 4 mm 6 mm
2 mm 4 mm 6 mm
In focus
Focusedin frontof retina
Focusedbehindretina
Optics of the eye: Depth of Focus Optics of the eye: Depth of Focus

DemonstrationRole of Pupil Size and Defocus on Retinal Blur
Draw a cross like this one on a page. Hold it so close that is it completely out of focus, then squint.You should see the horizontal line become clear. The line becomes clear because you have usedyour eyelids to make your effective pupil size smaller, thereby reducing the blur due to defocus onthe retina image. Only the horizontal line appears clear because you have only reduced the blur inthe horizontal direction.
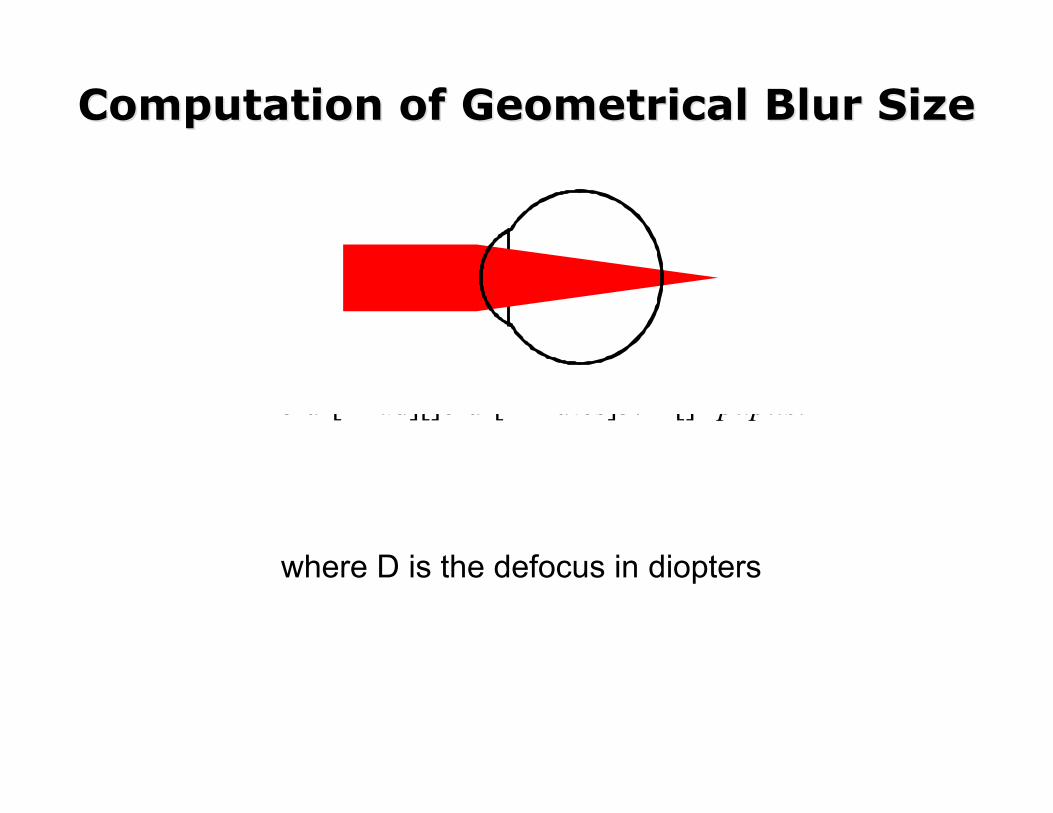
Computation of Geometrical Blur SizeComputation of Geometrical Blur Size
blur[mrad][]blur[minutes]3.44[]DpupilsizemmDpupilsizemm=×=××
where D is the defocus in diopters

Application of Blur EquationApplication of Blur Equation
• 1 D defocus, 8 mm pupil produces27.52 minute blur size ~ 0.5 degrees
Physical Optics
The Wavefront

What is the Wavefront?What is the Wavefront?
converging beam=
spherical wavefront
parallel beam=
plane wavefront
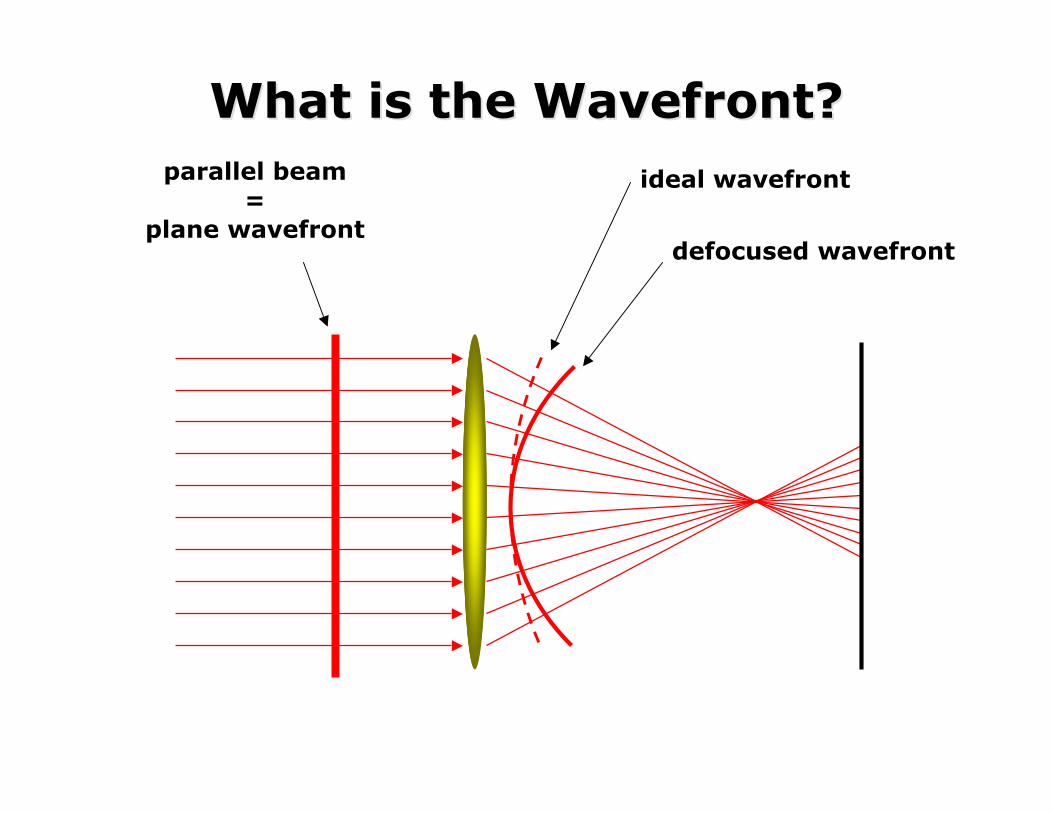
What is the Wavefront?What is the Wavefront?ideal wavefrontparallel beam
=plane wavefront
defocused wavefront

What is the Wavefront?What is the Wavefront?parallel beam
=plane wavefront aberrated beam
=irregular wavefront
ideal wavefront

What is the Wavefront?What is the Wavefront?
aberrated beam=
irregular wavefront
diverging beam=
spherical wavefront
ideal wavefront
The Wave Aberration
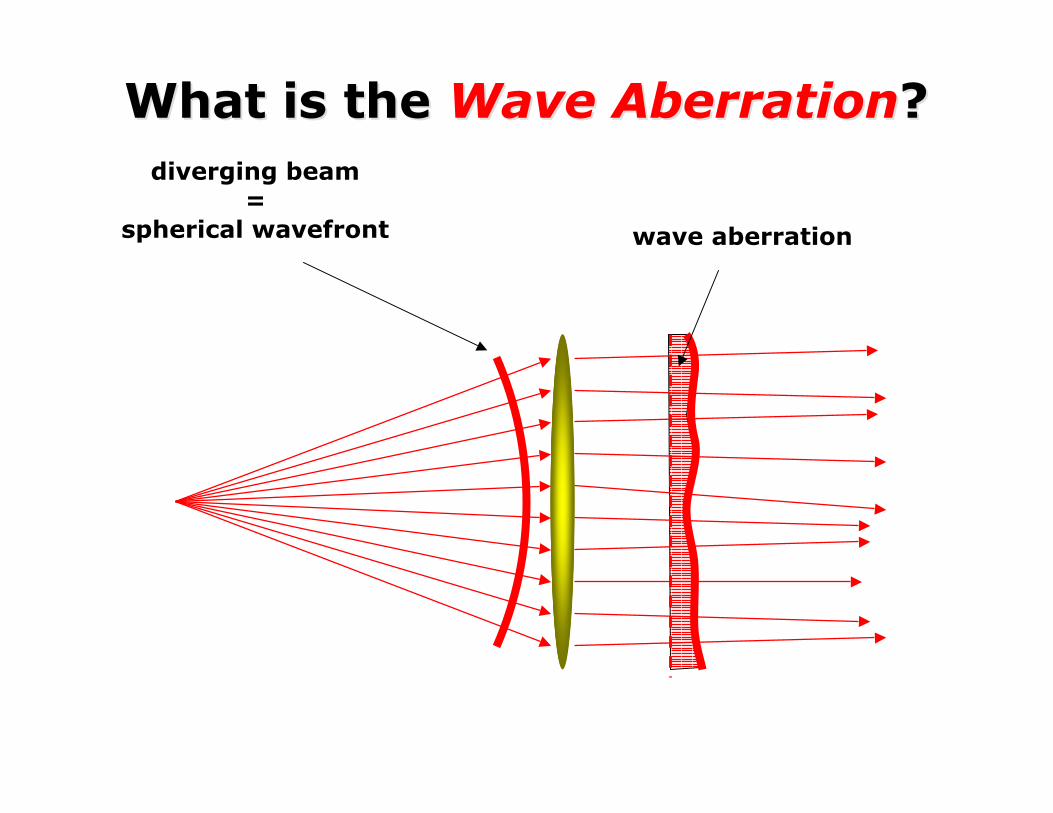
What is the What is the Wave AberrationWave Aberration??diverging beam
=spherical wavefront wave aberration

-3 -2 -1 0 1 2 3
-3
-2
-1
0
1
2
3
Wavefront Aberration
mm (right-left)
mm
(sup
erio
r-inf
erio
r)
Wave Aberration: DefocusWave Aberration: Defocus
-3 -2 -1 0 1 2 3
-3
-2
-1
0
1
2
3
Wavefront Aberration
mm (right-left)
mm
(sup
erio
r-inf
erio
r)
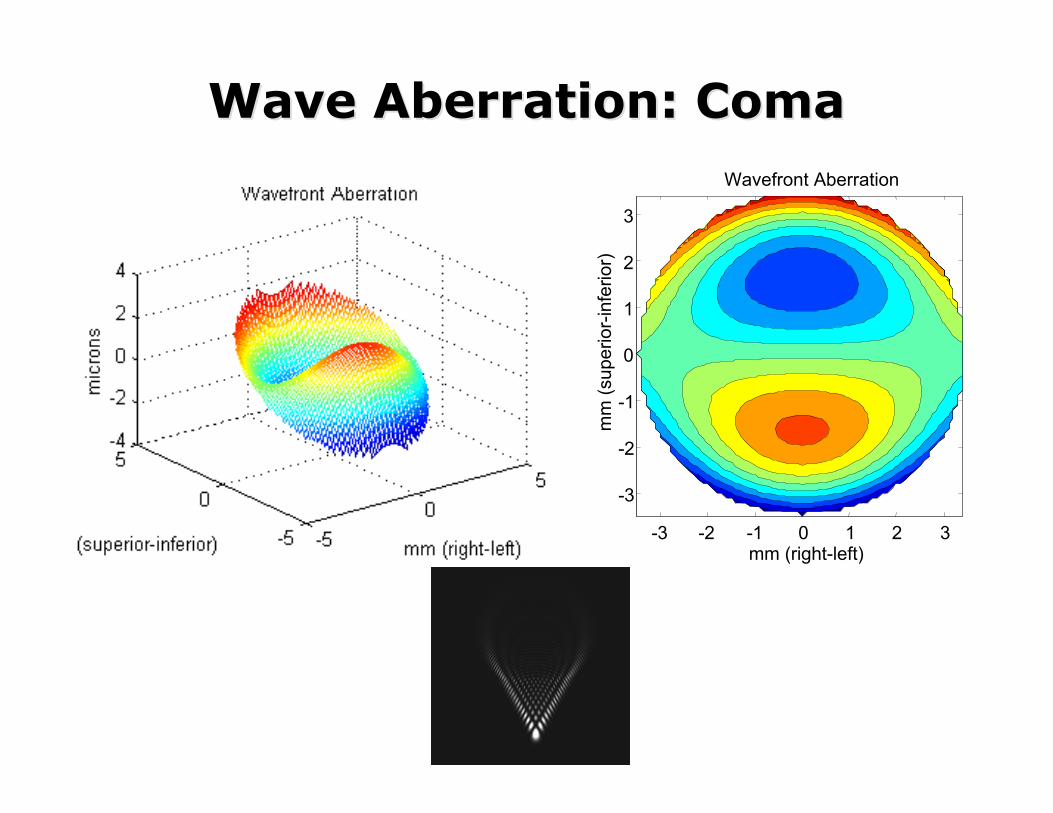
Wave Aberration: ComaWave Aberration: Coma
-3 -2 -1 0 1 2 3
-3
-2
-1
0
1
2
3
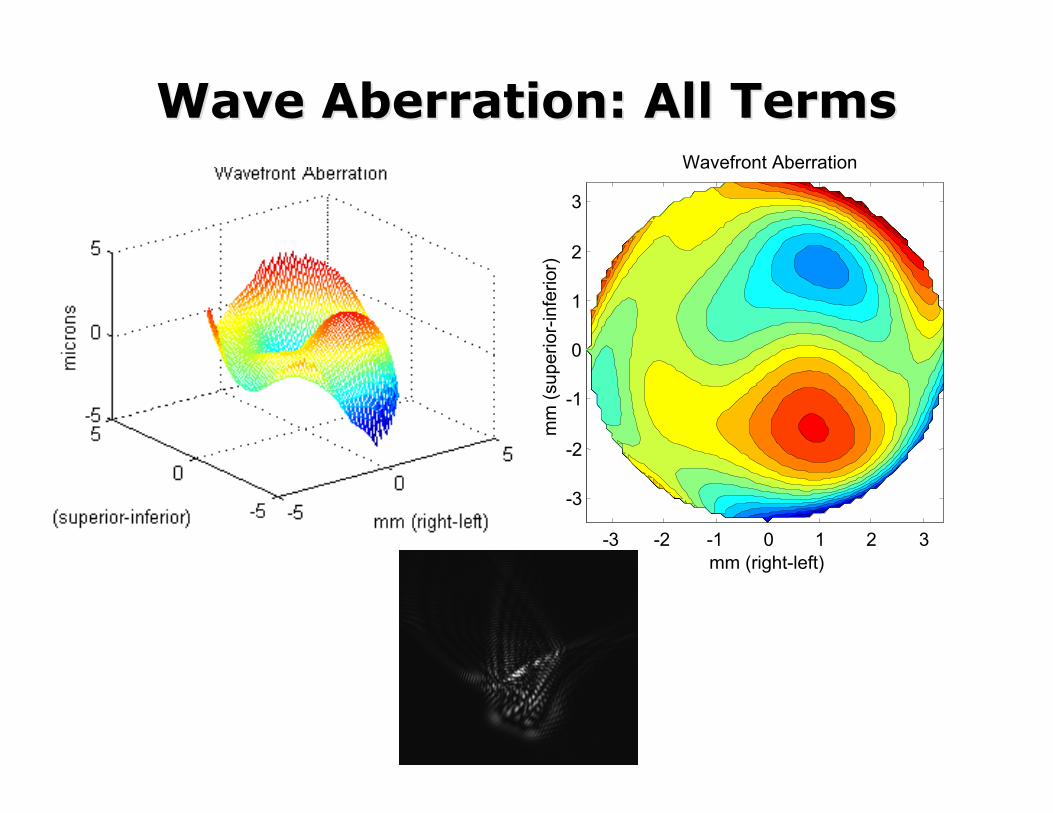
Wavefront Aberration
mm (right-left)m
m (s
uper
ior-i
nfer
ior)
Wave Aberration: All TermsWave Aberration: All Terms

Zernike Polynomials

-2 -1 0 1 2-2.5
-2
-1.5
-1
-0.5
0
0.5
1
1.5
2
Wave Aberration Contour MapWave Aberration Contour Map
mm (right-left)
mm
(sup
erio
r-inf
erio
r)
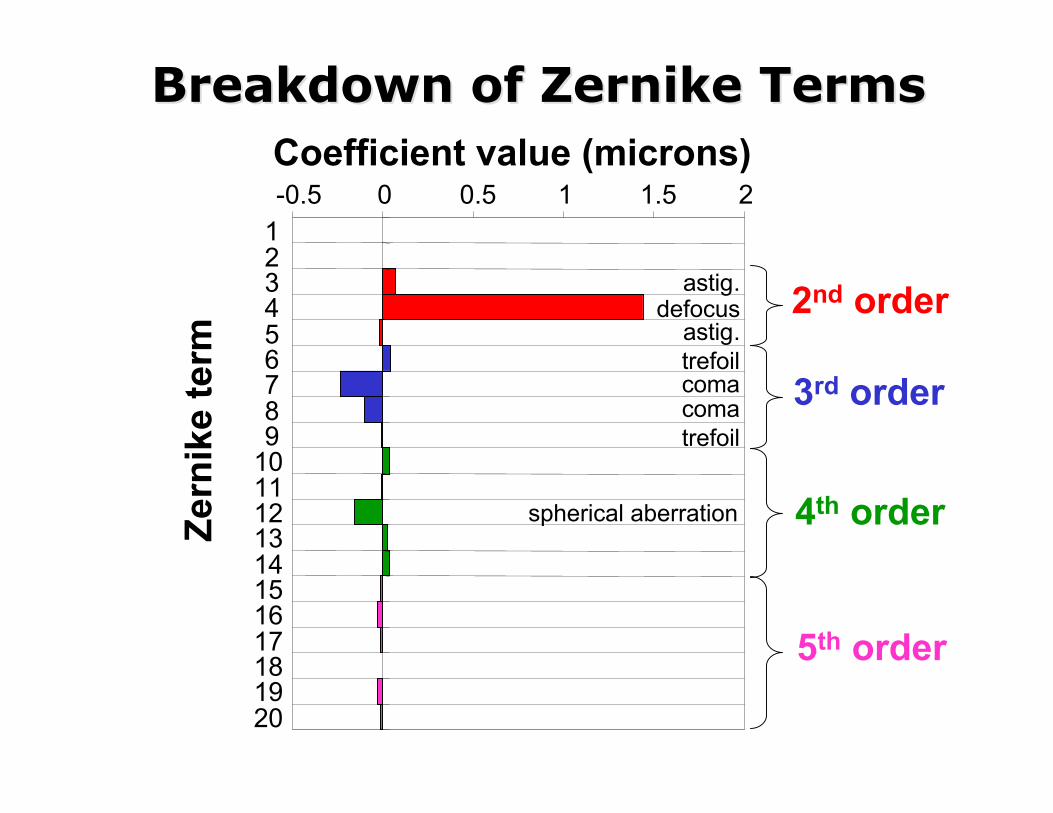
Breakdown of Zernike TermsBreakdown of Zernike Terms
-0.5 0 0.5 1 1.5 2123456789
1011121314151617181920
Zern
ike
term
Coefficient value (microns)
astig.defocus
astig.trefoilcomacomatrefoil
spherical aberration
2nd order
3rd order
4th order
5th order

The Point Spread Function
The Point Spread Function, or PSF, isthe image that an optical system
forms of a point source.
The point source is the mostfundamental object, and forms the
basis for any complex object.
The PSF is analogous to the ImpulseResponse Function in electronics.
Airy Disc
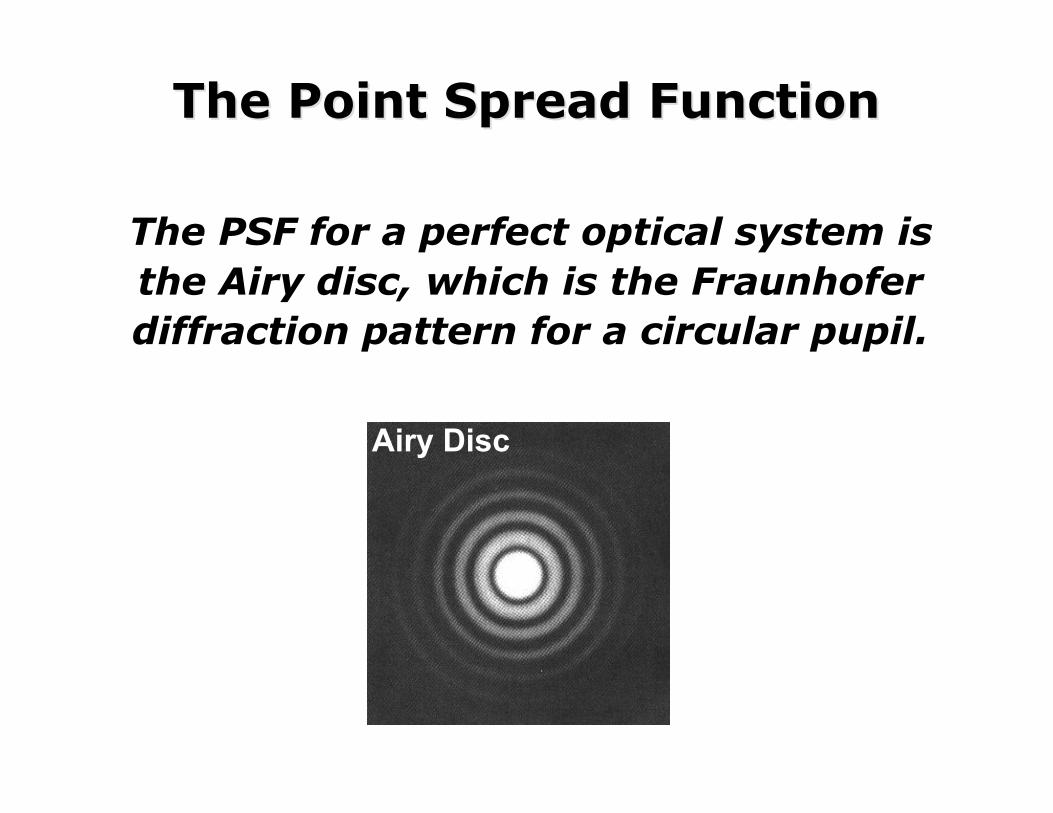
The Point Spread FunctionThe Point Spread Function
The PSF for a perfect optical system isthe Airy disc, which is the Fraunhoferdiffraction pattern for a circular pupil.
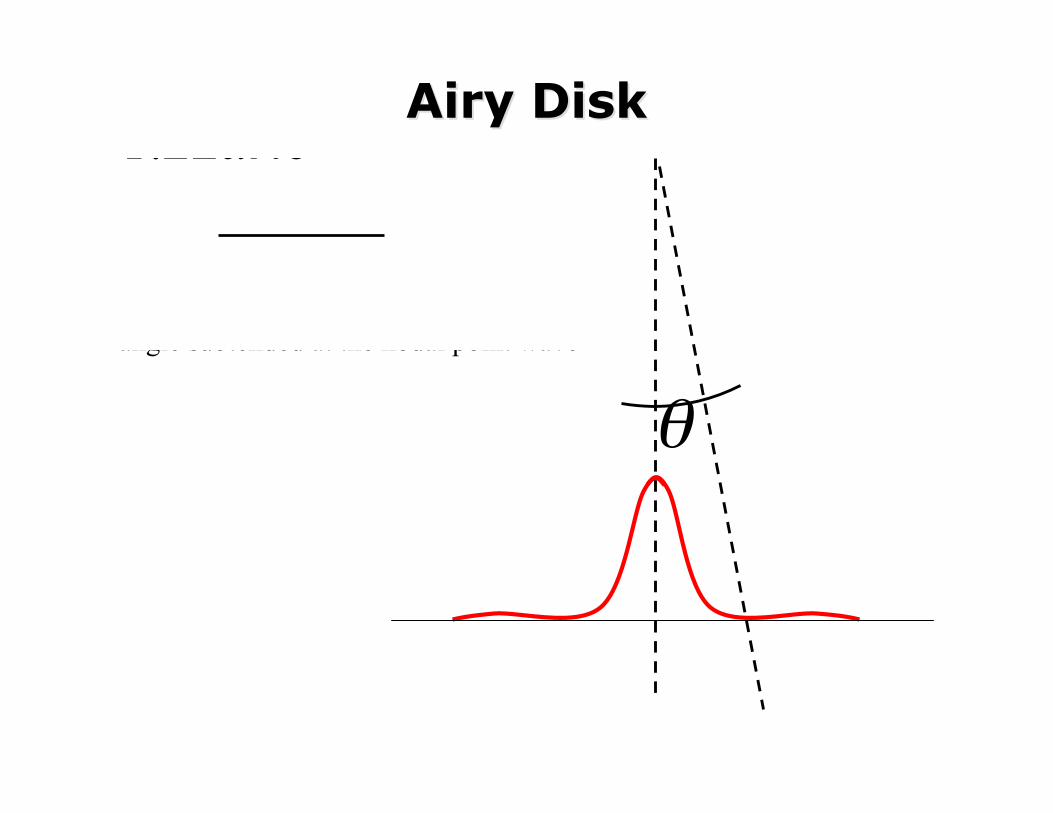
Airy DiskAiry Disk
θ
1.22aλθ⋅=
angle subtended at the nodal point wavelength of the light pupil diameteraθλ≡≡≡

angle subtended at the nodal point wavelength of the light pupil diameter1.22aaθλλθ≡≡≡⋅=
0
0.5
1
1.5
2
2.5
1 2 3 4 5 6 7 8
pupil diameter (mm)
PS
F A
iry D
isk
radi
us (m
inut
es)
As the pupil size gets larger, the Airydisc gets smaller.

Point Spread Function vs. Pupil SizePoint Spread Function vs. Pupil Size
1 mm 2 mm 3 mm 4 mm
5 mm 6 mm 7 mm
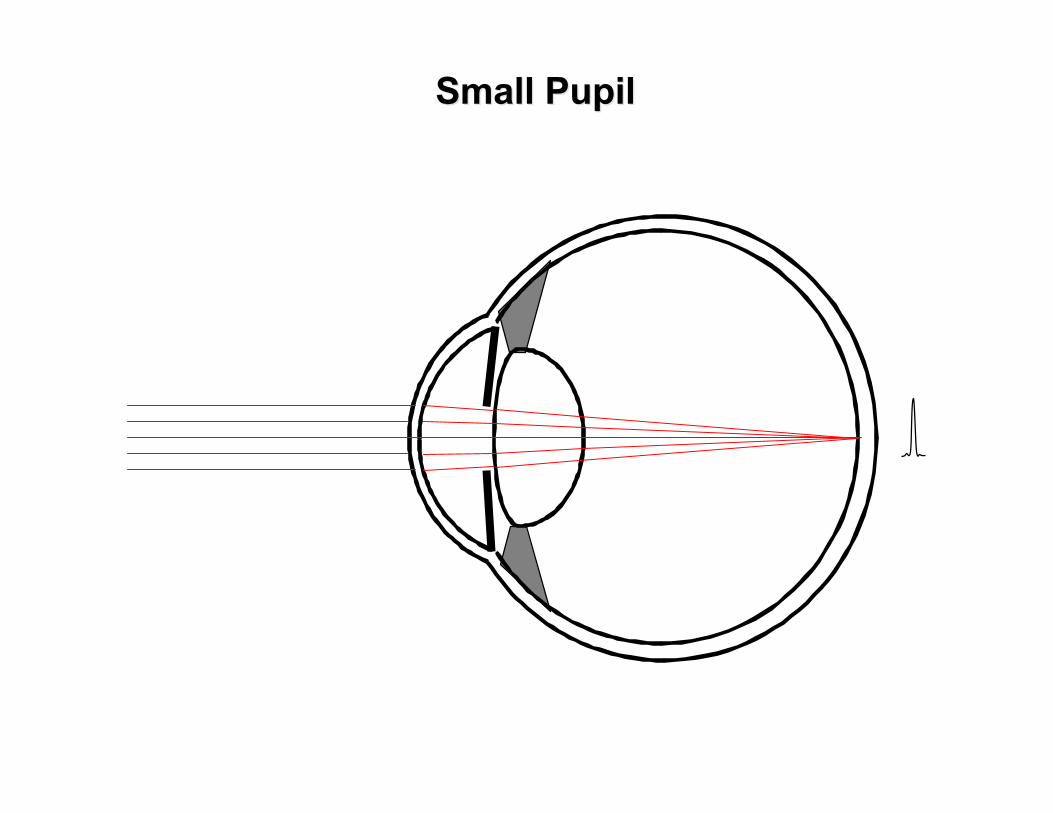
Small PupilSmall Pupil

Point Spread Function vs. Pupil SizePoint Spread Function vs. Pupil Size
1 mm 2 mm 3 mm 4 mm 5 mm 6 mm 7 mm
Perfect Eye
Typical Eye

Larger pupilLarger pupil

Resolution

Rayleigh resolution
limit
Unresolved point sources
Resolved

minmin angle subtended at the nodal point wavelength of the light pupil diameter1.22aaθλλθ≡≡≡⋅=
0
0.5
1
1.5
2
2.5
1 2 3 4 5 6 7 8
pupil diameter (mm)
PS
F A
iry D
isk
radi
us (m
inut
es)
As the pupil size gets larger, the Airydisc gets smaller.

Keck telescope:(10 m reflector)About 4500 timesbetter than the eye!

Convolution
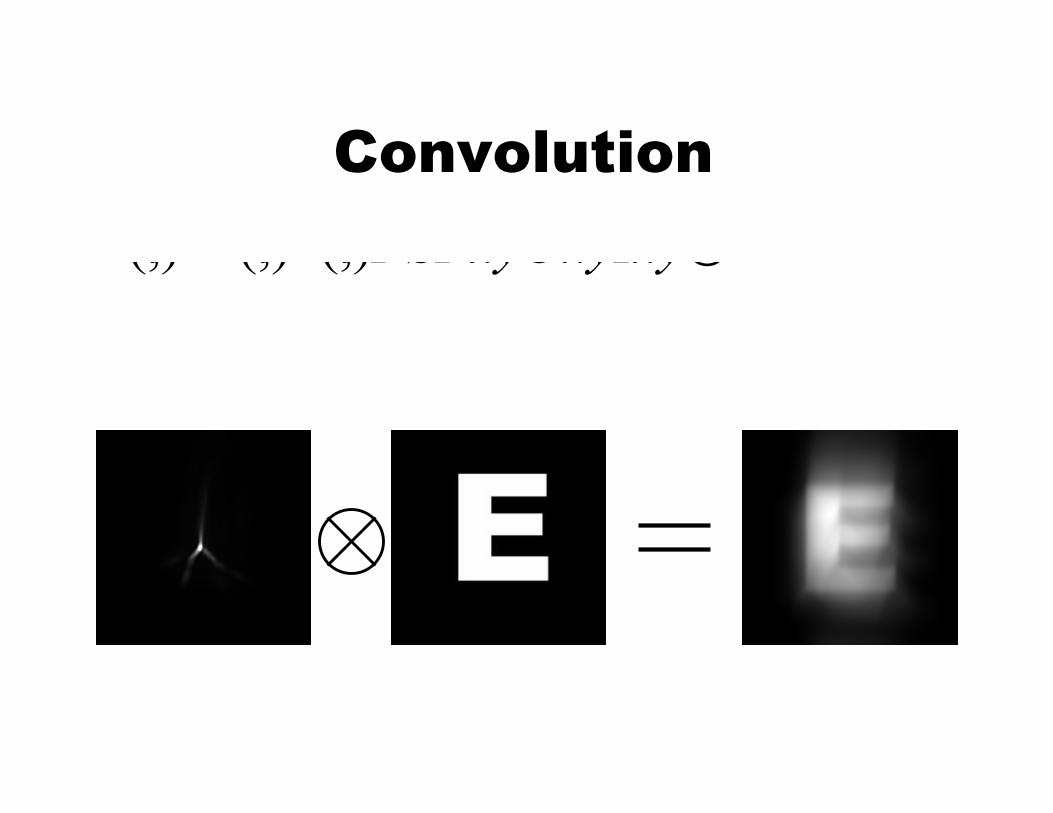
(,) (,) (,)PSFxyOxyIxy⊗=Convolution
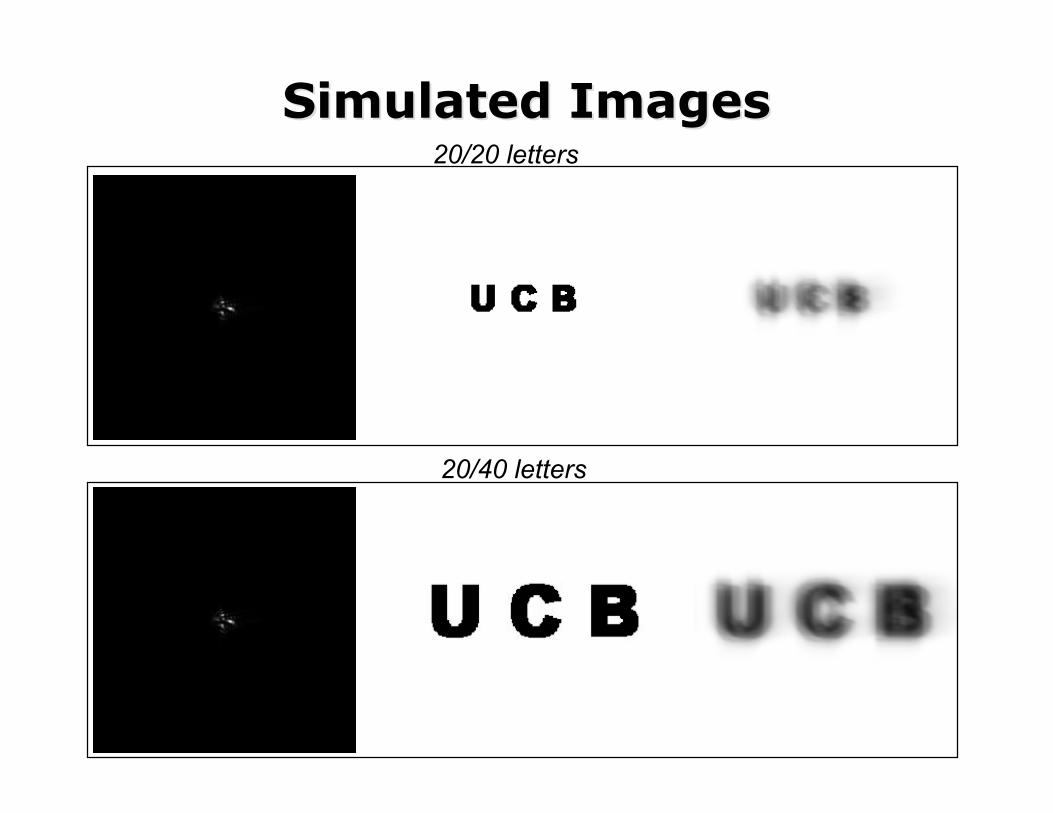
Simulated ImagesSimulated Images
20/40 letters
20/20 letters

MTFModulation Transfer
Function

low medium high
object:100% contrast
image
spatial frequency
cont
rast
1
0
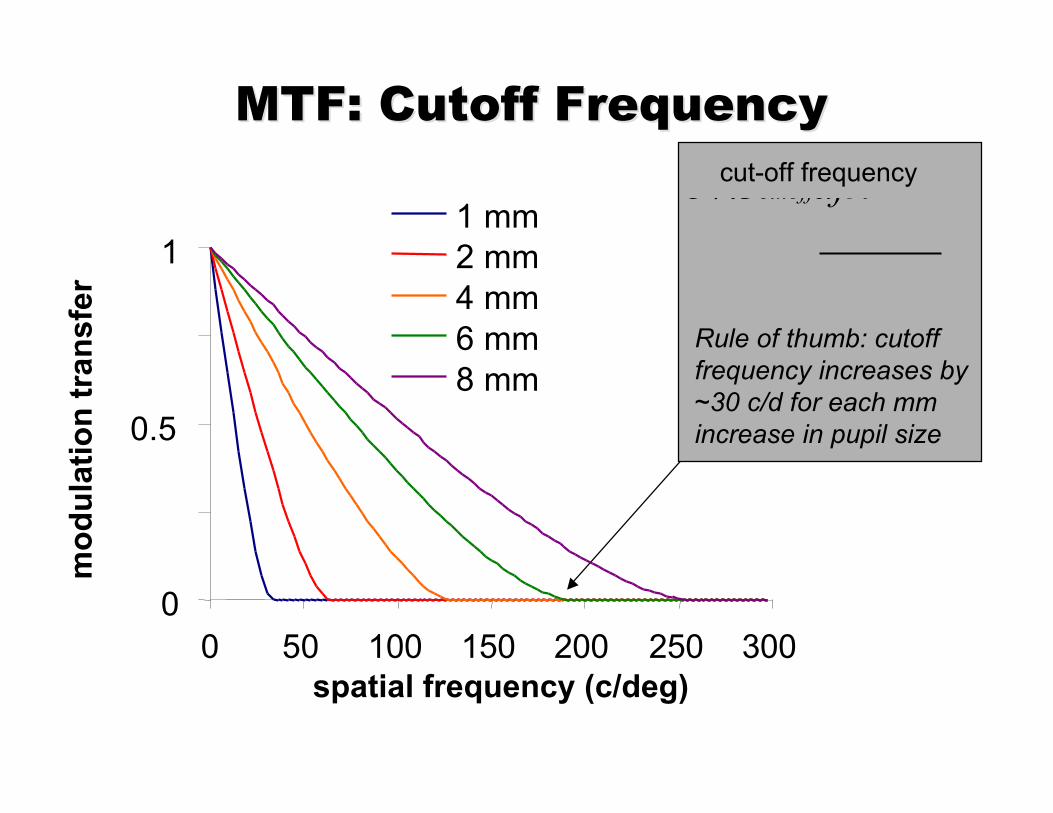
MTF: Cutoff FrequencyMTF: Cutoff Frequency
0
0.5
1
0 50 100 150 200 250 300
1 mm2 mm4 mm6 mm8 mm
mod
ulat
ion
tran
sfer
spatial frequency (c/deg)
cut-off frequency57.3cutoffafλ=⋅
Rule of thumb: cutofffrequency increases by~30 c/d for each mmincrease in pupil size

Modulation Transfer FunctionModulation Transfer Function
vertical spatial frequency (c/d) horizontal spatial
frequency (c/d) c/deg-100 0 100
0.2
0.4
0.6
0.8

PTFPhase Transfer
Function

object
image
spatial frequency
phas
e sh
ift 180
0
-180
low medium high

Phase Transfer FunctionPhase Transfer Function
• Contains information about asymmetryin the PSF
• Contains information about contrastreversals (spurious resolution)

Relationships Between Wave Aberration,
PSF and MTF

()2(,),(,)iWxyiiPSFxyFTPxyeπλ−=
(){},(,)xyiiMTFffAmplitudeFTPSFxy=
The PSF is the Fourier Transform (FT) of the pupil function
The MTF is the amplitude component of the FT of the PSF
(){},(,)xyiiPTFffPhaseFTPSFxy=The PTF is the phase component of the FT of the PSF
The OTF (MTF and PTF) can also be computed asthe autocorrelation of the pupil function

arcsec-200 -100 0 100 200
mm (right-left)-2 -1 0 1 2
-0.5
0
0.5
c/deg-100 0 100
0.2
0.4
0.6
0.8
c/deg-100 0 100
-0.5
0
0.5
Point Spread FunctionWavefront Aberration
Modulation Transfer Function Phase Transfer Function

Point Spread Function
arcsec-200 -100 0 100 200
mm (right-left)
Wavefront Aberration
-2 -1 0 1 2-0.5
0
0.5
c/deg
Modulation Transfer Function
-100 0 100
0.2
0.4
0.6
0.8
c/deg
Phase Transfer Function
-100 0 100
-150
-100
-50
0
50
100
150

c/deg-100 0 100
-150
-100
-50
0
50
100
150
c/deg-100 0 100
0.2
0.4
0.6
0.8
mm (right-left)-2 -1 0 1 2
-0.5
0
0.5
1
1.5
arcsec-1000 -500 0 500 1000
Point Spread FunctionWavefront Aberration
Modulation Transfer Function Phase Transfer Function
Conventional Metrics to Define Imagine Quality

Root Mean SquareRoot Mean Square()()()()()21,, pupil area, wave aberration, average wave aberrationRMSWxyWxydxdyAAWxyWxy=−−−−∫∫
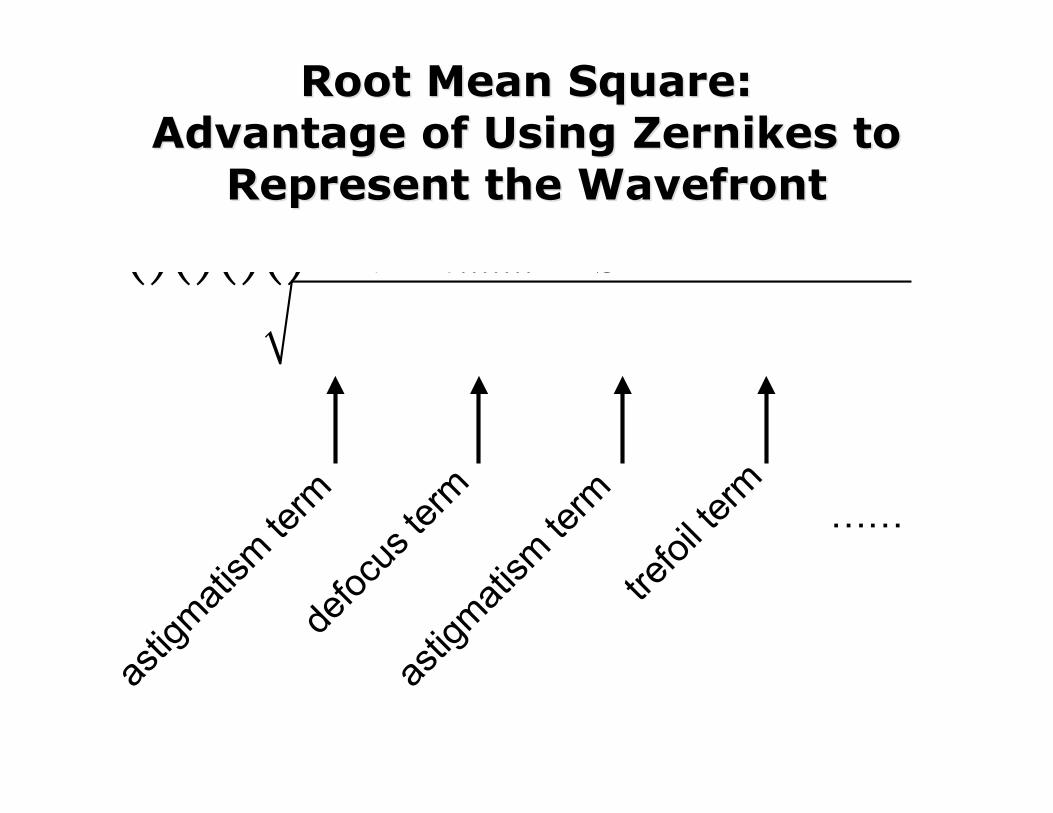
Root Mean Square:Root Mean Square:Advantage of Using Advantage of Using ZernikesZernikes to to
Represent the WavefrontRepresent the Wavefront
()()()()222220212223.......RMSZZZZ−−=+++
astig
matism
term
defoc
us te
rm
astig
matism
term
trefoi
l term ……

StrehlStrehl Ratio Ratio
diffraction-limited PSF
Hdl
Heye
actual PSF
Strehl Ratio = eyedlHH
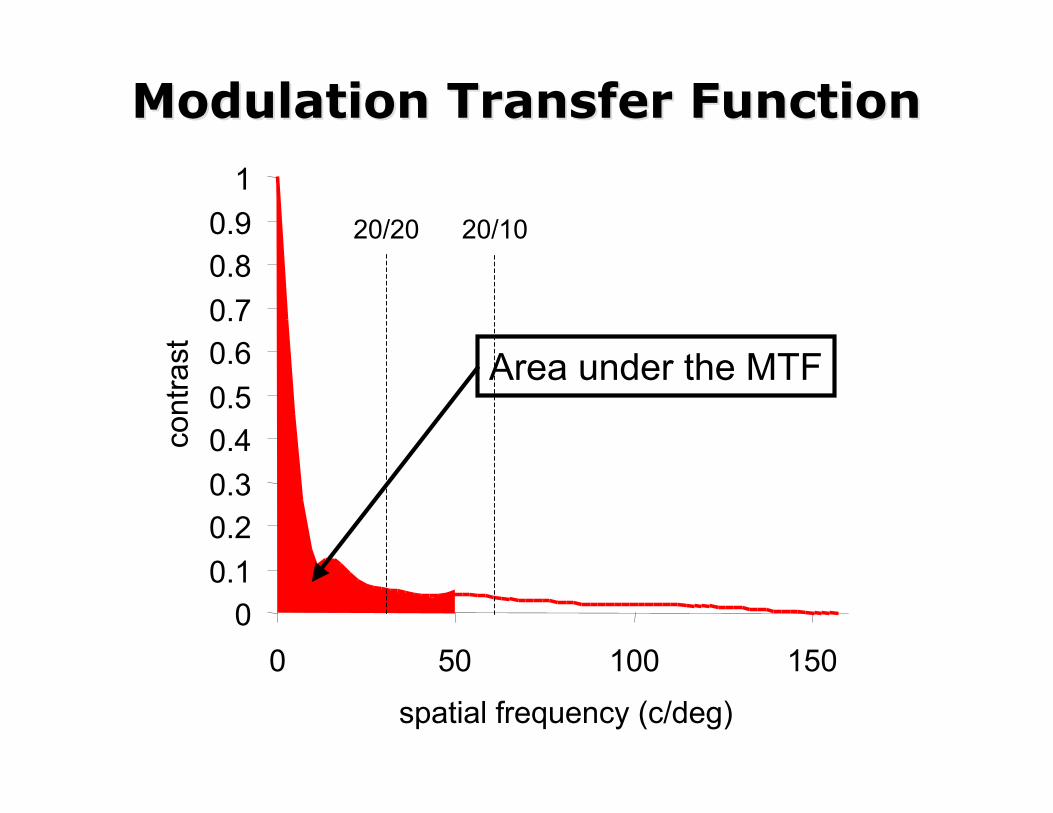
Modulation Transfer FunctionModulation Transfer Function
00.10.20.30.40.50.60.70.80.9
1
0 50 100 150
spatial frequency (c/deg)
cont
rast Area under the MTF
20/20 20/10
Metrics to Define Image QualityMetrics to Define Image Quality
Other Metrics
Campbell,C.E. (2004). Improving visual function diagnostic metrics with the use ofhigher-order aberration information from the eye. J.Refract.Surg. 20, S495-S503
Cheng,X., Bradley,A., Hong,X., & Thibos,L. (2003). Relationship between refractive errorand monochromatic aberrations of the eye. Optom.Vis.Sci. 80, 43-49.
Cheng,X., Bradley,A., & Thibos,L.N. (2004). Predicting subjective judgment of best focuswith objective image quality metrics. J.Vis. 4, 310-321.
Guirao,A. & Williams,D.R. (2003). A method to predict refractive errors from waveaberration data. Optom.Vis.Sci. 80, 36-42.
Marsack,J.D., Thibos,L.N., & Applegate,R.A. (2003). Scalar metrics of optical qualityderived from wave aberrations predict visual performanc. J.Vis. 4, 322-328.
Sarver,E.J. & Applegate,R.A. (2004). The importance of the phase transfer function tovisual function and visual quality metrics. J.Refract.Surg. 20, S504-S507

Typical Values for Wave AberrationTypical Values for Wave Aberration
• Strehl ratios are about 5% for a 5 mm pupil that hasbeen corrected for defocus and astigmatism.
• Strehl ratios for small (~ 1 mm) pupils approach 1,but the image quality is poor due to diffraction.
Strehl Ratio

Typical Values for Wave AberrationTypical Values for Wave AberrationPopulation Statistics
spherical aberration
comacomatrefoil
trefoil

Typical Values for Wave AberrationTypical Values for Wave Aberration
Iglesias et al, 1998Navarro et al, 1998Liang et al, 1994Liang and Williams, 1997Liang et al, 1997Walsh et al, 1984He et al, 1999Calver et al, 1999Calver et al, 1999Porter et al., 2001He et al, 2002He et al, 2002Xu et al, 2003Paquin et al, 2002Paquin et al, 2002Carkeet et al, 2002Cheng et al, 2004
0
0.2
0.4
0.6
0.8
1
1.2
0 1 2 3 4 5 6 7 8 9pupil size (mm)
rms
wav
e ab
erra
tion
(mic
rons
) Shack Hartmann MethodsOther Methods
Change in aberrations with pupil size

Typical Values for Wave AberrationTypical Values for Wave AberrationChange in aberrations with age
Monochromatic Aberrations as a Function of Age, from Childhood to Advanced AgeIsabelle Brunette,1 Juan M. Bueno,2 Mireille Parent,1,3 Habib Hamam,3 and Pierre Simonet3

Other Optical Factors that Degrade Image Quality
Retinal Sampling
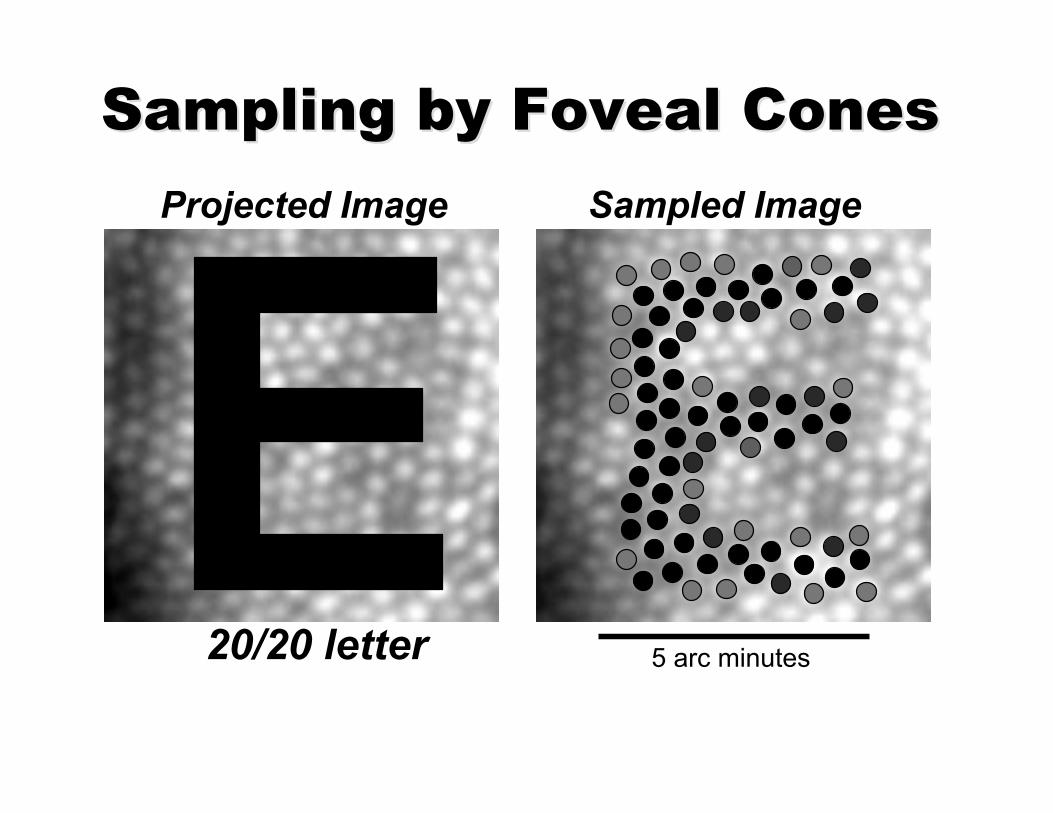
Projected Image Sampled Image
5 arc minutes20/20 letter
Sampling by Foveal ConesSampling by Foveal Cones

5 arc minutes20/5 letter
Projected Image Sampled Image
Sampling by Foveal ConesSampling by Foveal Cones

NyquistNyquist Sampling Theorem Sampling Theorem

Photoreceptor Sampling >> Spatial Frequency
I
0
1
I
0
1
nearly 100% transmitted

I
0
1
I
0
1
nearly 100% transmitted
Photoreceptor Sampling = 2 x Spatial Frequency
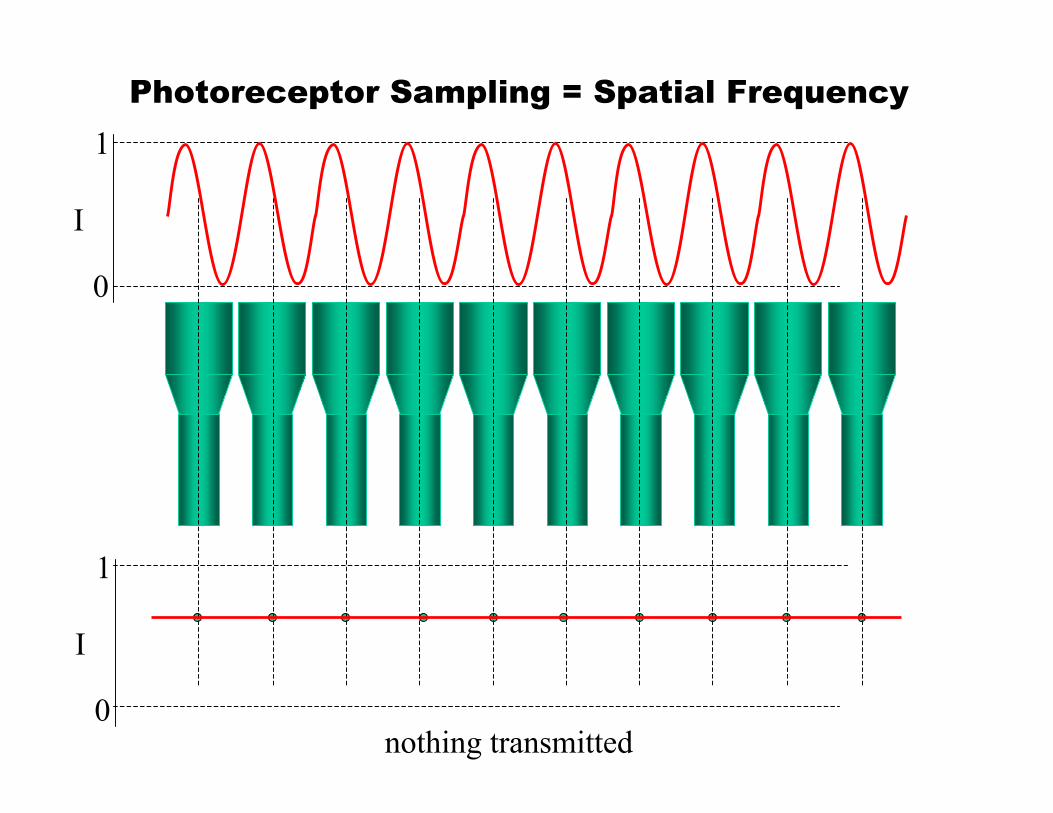
I
0
1
I
0
1
nothing transmitted
Photoreceptor Sampling = Spatial Frequency

Nyquist theorem:The maximum spatial frequency that canbe detected is equal to _ of the samplingfrequency.
foveal cone spacing ~ 120 samples/deg
maximum spatial frequency:60 cycles/deg (20/10 or 6/3 acuity)

MTF: Cutoff FrequencyMTF: Cutoff Frequency
0
0.5
1
0 50 100 150 200 250 300
1 mm2 mm4 mm6 mm8 mm
mod
ulat
ion
tran
sfer
spatial frequency (c/deg)
cut-off frequency57.3cutoffafλ=⋅
Rule of thumb: cutofffrequency increases by~30 c/d for each mmincrease in pupil size
Nyquist limit

Thankyou!