Embed Size (px)
Citation preview

Review of Basic ConceptsReview of Basic Concepts
Psychological Science 342
Advanced Statistics

Basic TerminologyBasic Terminology
• Descriptive statisticsDescriptive statistics Central tendency, variabilityCentral tendency, variability
Displaying dataDisplaying data
• Inferential statisticsInferential statistics Populations and SamplesPopulations and Samples
Hypothesis testingHypothesis testing
t tests, ANOVA, Regressiont tests, ANOVA, Regression

Measurement Basics
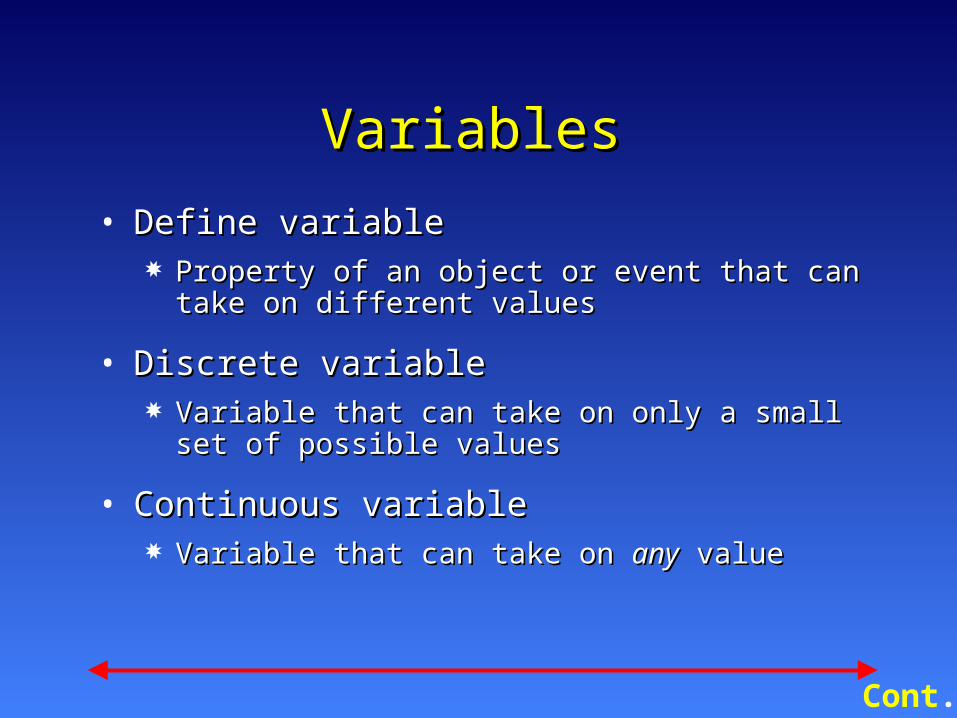
VariablesVariables
• Define variableDefine variable Property of an object or event that can take on Property of an object or event that can take on
different valuesdifferent values
• Discrete variableDiscrete variable Variable that can take on only a small set of Variable that can take on only a small set of
possible valuespossible values
• Continuous variableContinuous variable Variable that can take on Variable that can take on anyany value value
Cont.

VariablesVariables--cont.--cont.
• Independent variablesIndependent variables Those variables controlled by the Those variables controlled by the
experimenterexperimenter
• Dependent variablesDependent variables Those variables being measured Those variables being measured
The data or scoreThe data or score

Random AssignmentRandom Assignment• DefineDefine
Each P has an equal chance of being in Each P has an equal chance of being in any conditionany condition
Equates groupsEquates groups
Defines experimental (vs. correlational) Defines experimental (vs. correlational) procedureprocedure
Independent/Predictor variableIndependent/Predictor variable

Random SamplingRandom Sampling• DefineDefine
Each member of a population has an Each member of a population has an equal chance of being included equal chance of being included
GeneralizabilityGeneralizability
Do psychologists use random Do psychologists use random sampling?sampling?

Scales of MeasurementScales of Measurement
• DefinitionDefinition
• Nominal scalesNominal scales
• Ordinal scalesOrdinal scales
• Interval scalesInterval scales
• Ratio scalesRatio scales

Sample ProblemsSample Problems
• For each of the following identify the For each of the following identify the IV (s), DV(s), whether the variable is IV (s), DV(s), whether the variable is categorical or continuous, and level categorical or continuous, and level of measurementof measurement

Sample ProblemsSample Problems
• 1. People will read a paragraph more 1. People will read a paragraph more quickly if it has a title than if it doesn’t quickly if it has a title than if it doesn’t have a title.have a title.
• 2. People from collectivist cultures 2. People from collectivist cultures have lower self-esteem than people have lower self-esteem than people from individualist cultures, and the from individualist cultures, and the difference is larger for males than for difference is larger for males than for females.females.

Sample ProblemsSample Problems
• 3. The right hemisphere is more 3. The right hemisphere is more specialized (i.e., faster) than the left specialized (i.e., faster) than the left hemisphere for negative emotion hemisphere for negative emotion words and the left hemisphere is words and the left hemisphere is more specialized than the right more specialized than the right hemisphere for positive emotion hemisphere for positive emotion words.words.

Sample ProblemsSample Problems
• 4. When taking an exam, increasing 4. When taking an exam, increasing levels of noise is associated with levels of noise is associated with better performance for extraverts better performance for extraverts than for introverts.than for introverts.
• 5. People will retain more information 5. People will retain more information if a text is written in an ugly font than if a text is written in an ugly font than if it is written in a non-ugly font.if it is written in a non-ugly font.

Sample ProblemsSample Problems
• 6. People appear to be more 6. People appear to be more outgoing on facebook than in real outgoing on facebook than in real life.life.
• 7. Reported well-being increases as 7. Reported well-being increases as a function of temperature (up to a function of temperature (up to 80F) and whether or not it is sunny.80F) and whether or not it is sunny.

Deciding on a ProcedureDeciding on a Procedure
• Decision treeDecision tree
• What types of variables?What types of variables?
• How many groups or variables?How many groups or variables?

Goodness of Fit Chi-square
One Category
Contingency Table Chi-square
Two Categories
Categorical
See next slide
Continuous
Type of Dependent Variable
Choosing a Procedure
Cont.

Correlation
Degree of Relationship
Regression
Form of Relationship
One Predictor
Multiple Regression
Two Predictors
Continuous IV
See next slide
Categorical IV
Continuous DV
Choosing a Procedure
Cont.

T w o -sam p le t
In de pe nd ent
R e la te d S a m p le t
D e pe n de nt
T w o G ro u ps
A no va
In de pe n de nt G rou ps
R e pe a ted m e a su res A n o va
D e pe n d en t M e a su res
M u ltip le G ro u ps
C a te g orica l IV
Choosing a Procedure

NotationNotation
• Variable namesVariable names X and YX and Y
• Individual valuesIndividual values XXii
• X versus XX versus Xii
• Summation Summation notationnotation XX
XX22
((X)X)22
XYXY
X X YY
ConstantsConstants

Hypothetical data on family size by decade of 20th Hypothetical data on family size by decade of 20th centurycentury
Decade (X)
Family Size(Y)
X2
Y2
X – Y
XY
3 5.2 9 27.04 -2.2 15.6
4 4.8 16 23.04 -0.8 19.2
5 3.5 25 12.25 1.5 17.5
6 2.5 36 6.25 3.5 15.0
7 2.3 49 5.29 4.7 16.1
25 18.3 138 73.87 6.7 83.4
Displaying Data

The Sternberg ExampleThe Sternberg Example
• One to five digits displayedOne to five digits displayed
• Followed by a single digitFollowed by a single digit
• Was single digit in first set?Was single digit in first set?
• Predictions of sequential processingPredictions of sequential processing
• Predictions of parallel processingPredictions of parallel processing

The Following is a The Following is a Simple Demonstration.Simple Demonstration.
Click to BeginClick to Begin

4 7 3 6 9
4
Click Mouse
Was the single digit in the comparison set?

Plotting DataPlotting Data
• HistogramsHistograms Values of dependent variable on Values of dependent variable on XX axis axis
• discuss grouping or “bins”discuss grouping or “bins”
Frequency on Frequency on YY axis axis
Histogram of Sternberg’s dataHistogram of Sternberg’s data

Histogram of Reaction TimeHistogram of Reaction Time

Stem-and-Leaf DisplayStem-and-Leaf DisplayStem-and-leaf of RxTime N = 300Leaf Unit = 1.0
7 3 6788999 27 4 00001112223333344444 62 4 55555566666666666777777777888899999 103 5 00000111111111111222222222233333333444444 150 5 55555556666666666777777788888888888899999999999 150 6 000000000000111111111112222222222222233333333334444444 96 6 555555556666666677777777777777889999999 57 7 0111122222222333444444 35 7 5566667788899 22 8 000112333 13 8 5678 9 9 044 6 9 558 3 10 44 1 10 1 11 1 11 1 12 1 12 5

ScatterplotsScatterplots
• Plot two variables against each Plot two variables against each other.other.
• Points represent coordinates on Points represent coordinates on each axis.each axis.
• Dependent variable on Dependent variable on YY axis. axis.
• See next slide for exampleSee next slide for example

Scatterplot of Solar Scatterplot of Solar Radiation and CancerRadiation and Cancer

Describing DistributionsDescribing Distributions
• SymmetrySymmetry
• ModalityModality BimodalBimodal
UnimodalUnimodal
• SkewnessSkewness Positively skewedPositively skewed
Negatively skewedNegatively skewed

Figure 3.9 Figure 3.9
Score
2.832.43
2.031.63
1.23.83
.43.03
-.37-.77
-1.17-1.57
-1.98-2.38
-2.78
20
10
0
Std. Dev = 1.02
Mean = -.01
N = 200.00
Score
5.505.00
4.504.00
3.503.00
2.502.00
1.501.00
.500.00
-.50-1.00
-1.50-2.00
16
14
12
10
8
6
4
2
0
Std. Dev = 1.79
Mean = 1.54
N = 200.00
Score
4.394.07
3.753.44
3.122.80
2.492.17
1.851.54
1.22.90
.59.27
-.05
40
30
20
10
0
Std. Dev = .73
Mean = .96
N = 200.00
Score
5.895.57
5.254.94
4.624.30
3.993.67
3.353.04
2.722.40
2.091.77
1.45
30
20
10
0
Std. Dev = .91
Mean = 4.85
N = 200.00

Measures of Central Tendency

ModeMode
• The most common valueThe most common value
• There may be severalThere may be several
• Bimodal distribution has two distinct Bimodal distribution has two distinct modes.modes.

MedianMedian
• Center value in an ordered seriesCenter value in an ordered series Average of two center values for an Average of two center values for an
even number of pointseven number of points
• Median locationMedian location location of central value location of central value
defined as (defined as (NN + 1)/2 + 1)/2

MeanMean
• What we normally call the “average”What we normally call the “average”
• Denoted as “xbar” Denoted as “xbar”
• Calculated as Calculated as
• This will be our most common statisticThis will be our most common statistic
X
NΣX
X

Advantages & Advantages & DisadvantagesDisadvantages
• MeanMean Most common statisticMost common statistic
Easily manipulated algebraicallyEasily manipulated algebraically
Good statistical propertiesGood statistical properties
Easily influenced by extreme scoresEasily influenced by extreme scores
• MedianMedian Slightly less desirable statistical properties than meanSlightly less desirable statistical properties than mean
May not be good to ignore extreme valuesMay not be good to ignore extreme values

Measures of Variability

The General ProblemThe General Problem
• Central tendency only deals with the Central tendency only deals with the centercenter
• DispersionDispersion Variability of the data around somethingVariability of the data around something
The spread of the pointsThe spread of the points
• Example: Mice and MusicExample: Mice and Music

Mice and MusicMice and Music
• Study by David MerrellStudy by David Merrell
• Raised some mice in quiet environmentRaised some mice in quiet environment
• Raised some mice listening to MozartRaised some mice listening to Mozart
• Raised other mice listening to AnthraxRaised other mice listening to Anthrax
• Dependent variable is the time to run a Dependent variable is the time to run a straight alley maze after 4 weeks.straight alley maze after 4 weeks.

ResultsResults
• Anthrax mice took much longer to runAnthrax mice took much longer to run
• Much greater variability in Anthrax groupMuch greater variability in Anthrax group See following graphs for Anthrax and MozartSee following graphs for Anthrax and Mozart
Both Both XX axes are 500 units wide axes are 500 units wide
• We often see greater variability with We often see greater variability with larger meanlarger mean

WEEK4
472.2416.7361.1305.6250.0194.4138.983.327.8
Mozart Group12
10
8
6
4
2
0
Std. Dev = 36.10
Mean = 114.6
N = 24.00

WEEK4
2050.0
2000.0
1950.0
1900.0
1850.0
1800.0
1750.0
1700.0
1650.0
1600.0
Anthrax Group10
8
6
4
2
0
Std. Dev = 103.14
Mean = 1825.9
N = 24.00

Range and Related Range and Related StatisticsStatistics
• The rangeThe range Distance from lowest to highest scoreDistance from lowest to highest score
Too heavily influenced by extremesToo heavily influenced by extremes
• The interquartile range (IQR)The interquartile range (IQR) Delete lowest and highest 25% of scoresDelete lowest and highest 25% of scores
IQR is range of what remainsIQR is range of what remains
May be too May be too littlelittle influenced by extremes influenced by extremes

Trimmed SamplesTrimmed Samples
• Delete a fixed (usually small) Delete a fixed (usually small) percentage of extreme scorespercentage of extreme scores
• Trimmed statistics are statistics Trimmed statistics are statistics computed on trimmed samples.computed on trimmed samples.

Deviation ScoresDeviation Scores
• DefinitionDefinition distance between a score and a measure of distance between a score and a measure of
central tendencycentral tendency
usually deviation around the meanusually deviation around the mean
• ImportanceImportance
)( XX

VarianceVariance
• Definitional formulaDefinitional formula
• ExampleExample
See next slideSee next slide
1)( 2
2
NXX
s

X 2 4 5 8 7 4 30
)( XX -3 -1 0 3 2 -1 0
2)( XX 9 1 0 9 4 1 24
80.4524
1)( 2
2
NXX
s
Calculation

Standard DeviationStandard Deviation• Definitional formulaDefinitional formula
The square root of the varianceThe square root of the variance
1)( 2
2
NXX
ss

Computational FormulaComputational Formula

EstimatorsEstimators
• MeanMean Unbiased estimate of population mean (Unbiased estimate of population mean ())
• Define unbiasedDefine unbiased Long range average of statistic is equal to the Long range average of statistic is equal to the
parameter being estimated.parameter being estimated.
• VarianceVariance
Unbiased estimate of Unbiased estimate of 221)( 2
2
NXX
s
Cont.

Estimators--cont.Estimators--cont.
UsingUsing•
gives biased estimategives biased estimate
Standard deviationStandard deviation• use square root of use square root of unbiasedunbiased estimate. estimate.
NXX
s2
2 )(
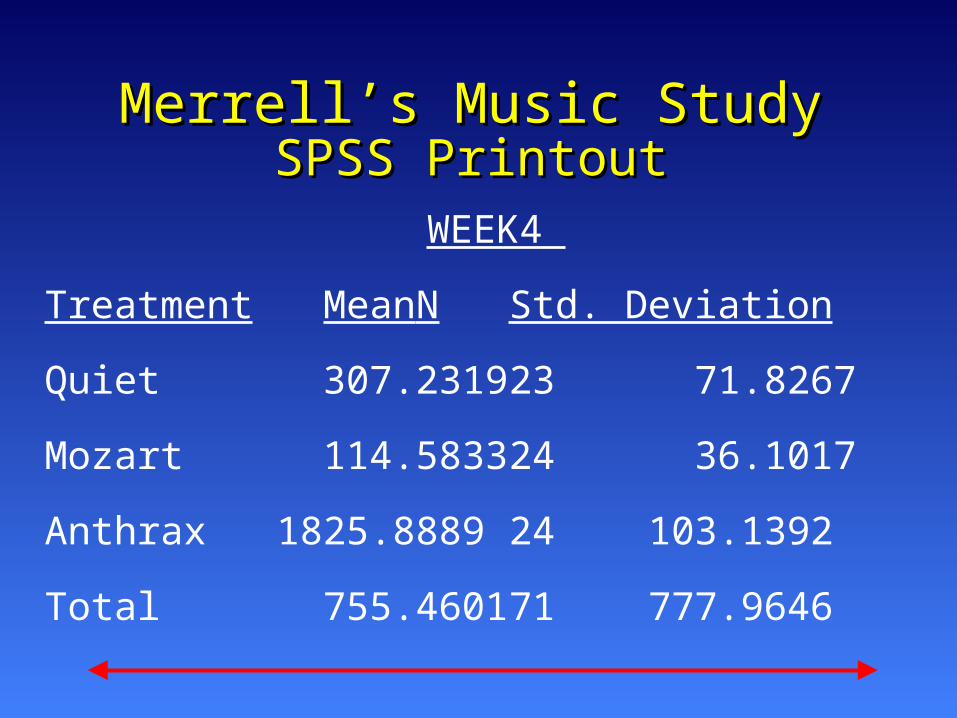
Merrell’s Music Study Merrell’s Music Study SPSS SPSS PrintoutPrintout WEEK4
Treatment Mean N Std. Deviation
Quiet 307.2319 23 71.8267
Mozart 114.5833 24 36.1017
Anthrax 1825.8889 24 103.1392
Total 755.4601 71 777.9646

BoxplotsBoxplots• The general problemThe general problem
A display that shows dispersion for center and tails A display that shows dispersion for center and tails of distributionof distribution
• Calculational steps (Calculational steps (simple solutionsimple solution)) Find medianFind median Find top and bottom 25% points (quartiles)Find top and bottom 25% points (quartiles) eliminate top and bottom 2.5% (fences)eliminate top and bottom 2.5% (fences) Draw boxes to quartiles and whiskers to fences, with Draw boxes to quartiles and whiskers to fences, with
remaining points as outliers remaining points as outliers
• Boxplots for comparing groupsBoxplots for comparing groups
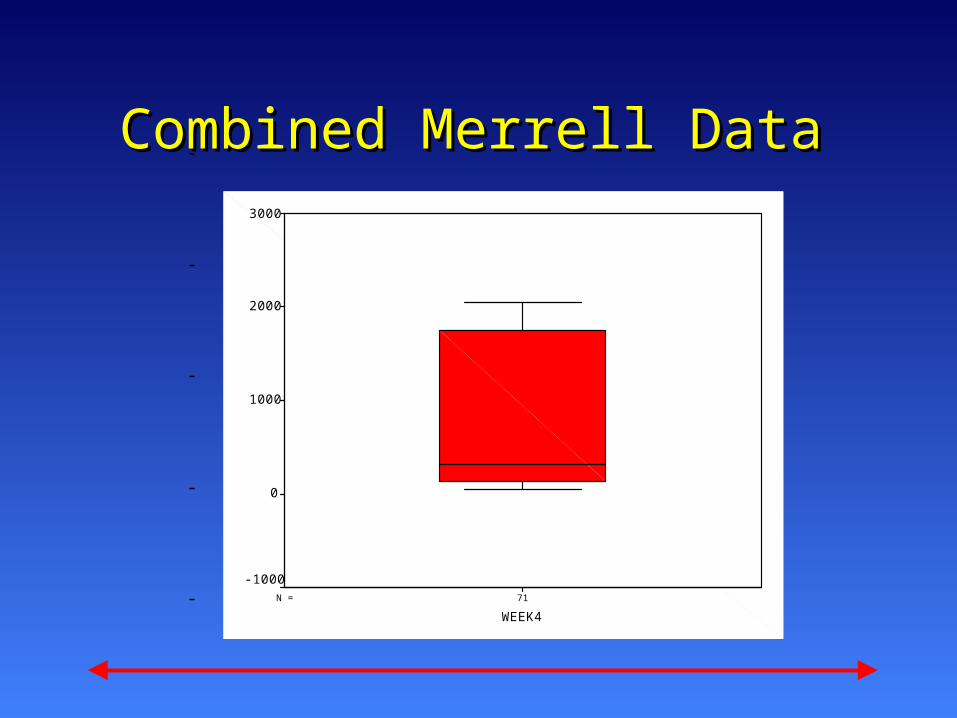
Combined Merrell DataCombined Merrell Data
71N =
WEEK4
3000
2000
1000
0
-1000

Merrell Data by GroupMerrell Data by Group
242423N =
Treatment Condition
AnthraxMozartQuiet
WE
EK
4
3000
2000
1000
0
-1000