Embed Size (px)
Citation preview

North American
Wood Fiber
Review
1 © 2011 Wood Resources International LLC.
Table of Contents
The North American Pulpwood and Biomass Market This Quarter ....................................................... 2
Wood Fiber Prices in North America 2Q/2011 ............................................................................................ 3 Softwood fiber prices, metric tons .............................................................................................................................. 4
Hardwood fiber prices, metric tons ............................................................................................................................. 5
Softwood and hardwood fiber prices, green short tons ............................................................................................... 6
The US Regional Wood Fiber Market Updates .......................................................................................... 7 The South wood fiber market update .......................................................................................................................... 7
The Lake States and Northeast wood fiber market updates ........................................................................................ 8
The Western wood fiber market update ...................................................................................................................... 9
Wood chip prices in the Northwest ..................................................................................................................... 10
Wood chip consumption and inventory in the Northwest ................................................................................... 11
Pulplog prices in the Northwest ........................................................................................................................... 13
Residue and woody biomass prices in the West .................................................................................... 14
Canada Wood Fiber Market and Industry Update .................................................................................. 15 Wood chip and pulpwood prices in Western Canada ............................................................................................... 16
Wood chip and pulpwood prices in Eastern Canada ................................................................................................. 17
North American Woody Biomass Market Update ................................................................................... 18 North American Woody biomass policies and issues update .................................................................................. 18
North American Woody biomass industry update .................................................................................................... 20
North American Regional market updates ................................................................................................................ 21
Interior British Columbia and Mississippi/Alabama ......................................................................................... 21
US Southeast and Northeast ............................................................................................................................... 22
Northern California and Western Washington ................................................................................................... 23
Regional Woody Biomass Price Comparison ......................................................................................................... 24
North America Wood Fiber Trade ............................................................................................................. 25 US wood chip trade ................................................................................................................................................... 25
Imports ................................................................................................................................................................. 25
Exports ................................................................................................................................................................. 26
Canada wood chip trade ............................................................................................................................................ 27
Imports ................................................................................................................................................................. 27
Exports ................................................................................................................................................................. 28
North America Wood Pellet Exports to Europe ........................................................................................ 29
North America Sawlog Markets and Exports ............................................................................................ 31 Sawlog prices ....................................................................................................................................................... 31
Sawlog exports .................................................................................................................................................... 33
The Global Forest Industry the past quarter – update from the WRQ .................................................. 34
The Global Wood Fiber Indices (SFPI and HFPI) ................................................................................... 35
Subscription Information, Disclaimer and Copyright Laws ................................................................... 36
North American Wood Fiber Review
June, 2011

North American
Wood Fiber Review
© 2011 Wood Resources International LLC. 2
The North American Pulpwood and Biomass Market This Quarter April - June, 2011
Tsunamis and tornadoes have yet to affect North
American commodity prices
While Japan’s earthquake and tsunami was the
major development in 1Q/11, anticipated demand
for rebuilding lumber has yet to take hold. The
series of tornadoes across the US South brought
widespread damage in April, but the impact on
building materials pricing has not yet been seen.
The German government’s decision to close its
nuclear plants by 2022, triggered by the Japanese
Fukushima nuclear drama, holds some promise for
additional pellet demand from the wood-to-energy
industry segment in North America. However any
market impact is still months or years away.
Western Canadian wood chip prices stabilize,
pulplog prices surge on the BC coast
In Canadian dollar terms, wood fiber chip prices
stabilized, tied as they are to product formulae. In
US dollars, BC softwood chip prices rose less than
four percent from US$106/odmt to US$110/odmt,
with transportation and exchange rate changes
accounting for most of the increase.
BC Coast pulplog prices, in contrast, rose a striking
20 percent in US dollar terms, from US$42/green
ton in 1Q/11 to US$49/green ton in 2Q/11.
Northwest U.S. fiber prices increase again
Fiber buyers in the Northwest U.S. were still
scrambling for adequate fiber supplies in 2Q/11
resulting in higher prices for the fourth quarter in a
row. Softwood residual chip prices rose 20 percent
to US$129/odmt from the previous quarter.
With western lumber production falling once again
in the second quarter, less residual chips will be
generated, and therefore whole log chips are likely
to grow in importance for the rest of the year.
Whole-log chips represent a higher percentage of
the total fiber consumption in 2Q/11, which has
resulted in a blended (residual and whole log)
delivered price of US$136/odmt this quarter.
Fiber prices in Ontario and Quebec stable,
Maritimes continue rising
Wood prices in Ontario and Quebec were
unchanged in Canadian dollars, but up slightly in
the U.S. dollars due to strengthening of the
Canadian dollar. In the Maritime Provinces of Nova
Scotia and New Brunswick, both softwood and
hardwood roundwood prices rose by double digits.
New woody biomass and pellet facilities open or
are near completion
Georgia Biomass, in Waycross, Georgia officially
opened its pellet facility in 2Q/11, paving the way
for an additional consumption of 1.5 million green
tons of wood fiber for pellet production. All
production is expected to be exported to Europe.
New England Wood Pellets officially opened its
85,000 ton capacity pellet plant in Deposit, New
York – the largest such plant in the Northeast.
Trebio Renewable Biomass in Quebec should
complete its new 130,000 ton capacity pellet plant
in the next few months, which will also be the
largest pellet plant in Eastern Canada.
In Lufkin Texas, Aspen Power’s 50MW biomass
plant, the largest in the state, was conducting final
test burns before beginning operations.
Two additional biomass “hotspots” to be tracked
British Columbia’s Interior is the center of North
America’s pellet export industry and over the next
decade, it will continue to invite innovation in
utilizing wood fiber for new products.
In addition, there are a number of new or announced
biomass, pellet, or biofuel projects in Mississippi
and Western Alabama. How these new players will
interact with what is the heart of the southern pulp
and paper industry will be fascinating.
These two areas will now be monitored (page 21
this edition) in NAWFR’s Biomass section.

North American
Wood Fiber
Review
3 © 2011 Wood Resources International LLC.
Wood Fiber Prices in North America
Second Quarter 2011
Avg Min Max Avg Min Max
Softwood
U.S.
Northwest 129 89 192 109 57 156
Lake States 108 95 130 121 102 145
Northeast 105 60 154 106 79 142
Southeast 71 61 79 73 62 83
South Central 73 59 83 69 59 82
Canada
British Columbia 110 95 133 122 93 156
Alberta 117 89 143 ..... ..... .....
Ontario 120 93 140 148 111 171
Quebec 130 104 156 166 124 187
Maritimes ..... ..... ..... 118 100 146
Hardwood
U.S.
Northwest 108 96 121 72 59 89
Lake States 73 55 97 93 62 111
Northeast 82 68 121 108 91 149
Southeast 65 58 73 72 63 82
South Central 68 53 76 68 58 83
Canada
Ontario 81 73 93 91 76 109
Quebec 85 73 96 99 78 114
Maritimes ..... ..... ..... 98 86 130
US$/odmt (delivered) US$/odmt (delivered)
Wood Chips Roundwood
Notes:
All prices in US dollars in US$/odmt (oven-dry metric ton). 1 odmt equal to 1.102 short tons (dry weight) or 2204 lb.
Roundwood prices are delivered to pulpmill or chipping facility.
Chip prices are for residual chips and do not include chips manufactured from roundwood.
Exchange rate: Can$0.964/US$ (Average 2Q/2011)
Sources:
U.S. – Lake States WRI sources and the Timber Mart-North published by Prentiss & Carlisle Management Co.
All other regions Data collected by North American Wood Fiber Review and Wood Resource Quarterly.

North American
Wood Fiber Review
© 2011 Wood Resources International LLC. 4
Alberta Chips 117 (89-143)
Ontario Chips 120 (93-140)
Roundwood 148 (111-171)
Quebec Chips 130 (104-156)
Roundwood 166 (124-187)
Canadian Maritimes Roundwood 118 (100-146)
U.S. Pacific Northwest Chips 129 (89-192)
Roundwood 109 (57-156)
)
British Columbia Chips 110 (95-133)
Roundwood 122 (93-156)
)
U.S. Lake States Chips 108 (95-130)
Roundwood 121 (102-145)
U.S. South Central Chips 73 (59-83)
Roundwood 69 (59-82)
U.S. Southeast Chips 71 (61-79)
Roundwood 73 (62-83)
U.S. Northeast Chips 105 (60-154)
Roundwood 106 (79-142)
Notes:
Units in US$/odmt (delivered). 1odmt (oven-dry metric ton) equal to 1.102 short tons or 2204 lb.
Roundwood prices are delivered to pulpmill or chipping facility.
Chip prices are for residual chips and do not include chips manufactured by roundwood
Exchange rate: Can$0.964/US$ (Average 2Q/2011)
Sources:
US – Lake States WRI sources and the Timber-Mart North published by Prentiss & Carlisle Management Co.
All other regions Data collected by Wood Resources International and WRQ sources.
Softwood Fiber Prices in North America
Second Quarter 2011

North American
Wood Fiber
Review
5 © 2011 Wood Resources International LLC.
U.S. Pacific Northwest
Chips 108 (96-121)
Roundwood 72 (59-89)
U.S. South Central
Chips 68 (53-76)
Roundwood 68 (58-83)
U.S. Southeast
Chips 65 (58-73)
Roundwood 72 (63-82)
U.S. Northeast
Chips 82 (68-121)
Roundwood 108 (91-149)
)
Quebec
Chips 85 (73-96)
Roundwood 99 (78-114)
Canadian Maritimes
Roundwood 98 (86-130)
U.S. Lake States
Chips 73 (55-97)
Roundwood 93 (62-111)
Ontario
Chips 81 (73-93)
Roundwood 91 (76-109)
Hardwood Fiber Prices in North America
Second Quarter 2011
Notes:
Units in US$/odmt (delivered). 1odmt (oven-dry metric ton) equal to 1.102 short tons or 2204 lb.
Roundwood prices are delivered to pulpmill or chipping facility.
Chip prices are for residual chips and do not include chips manufactured by roundwood
Exchange rate: Can$0.964/US$ (Average 2Q/2011)
Sources:
US – Lake States WRI sources and the Timber-Mart North published by Prentiss & Carlisle Management Co.
All other regions Data collected by Wood Resources International and WRQ sources.

North American
Wood Fiber Review
© 2011 Wood Resources International LLC. 6
Wood Fiber Prices in North America
2Q/10 – 2Q/11
2Q/10 3Q/10 4Q/10 1Q/11 2Q/11 Change 2Q/10 3Q/10 4Q/10 1Q/11 2Q/11 Change
y/y (%) y/y (%)
Softwood
U.S.
Northwest 40 42 47 49 59 45 29 31 34 41 44 52
Lake States 46 46 46 48 49 7 43 43 44 49 49 13
Northeast 40 41 41 44 48 19 41 40 39 42 43 6
South East 33 31 31 32 32 -1 29 29 30 30 30 1
South Central 34 34 33 33 33 -4 31 28 29 28 28 -10
Canada
British Columbia 46 47 47 48 50 9 37 37 38 41 49 32
Alberta 43 48 49 51 53 24 …. …. …. …. …. na
Ontario 53 52 54 54 55 3 56 56 57 59 60 7
Quebec 57 57 58 58 59 3 63 62 64 66 67 7
Maritimes ..... …. …. …. …. na 36 35 37 42 48 32
Hardwood
U.S.
Northwest 52 50 50 50 49 -6 32 34 31 31 29 -9
Lake States 32 32 32 33 33 3 34 35 36 38 38 12
Northeast 37 37 37 37 37 1 38 38 37 40 44 14
South East 29 29 29 29 29 0 31 30 30 30 29 -6
South Central 31 31 31 31 31 -1 33 29 29 28 28 -16
Canada
Ontario 35 35 36 36 37 4 35 35 36 36 37 4
Quebec 37 37 38 38 39 3 37 37 38 39 40 7
Maritimes …. …. …. …. …. na 33 33 34 36 40 18
Wood Chips Roundwood
US$/green tons ob (delivered)US$/green tons (delivered)
Notes:
All prices in U.S. dollars per green tons (2000 lbs) or equal to 0.907 metric tonnes
Roundwood prices are delivered to pulpmill or chipping facility.
Chip prices are for residual chips and do not include chips manufactured from roundwood.
Exchange rate: Can$0.964/US$ (Average 2Q/2011)
Sources:
U.S.-Lake States WRI sources and the Timber Mart-North published by Prentiss & Carlisle Management Co.
All other regions Data collected by North American Wood Fiber Review and Wood Resource Quarterly.

North American
Wood Fiber
Review
7 © 2011 Wood Resources International LLC.
0
5
10
15
20
25
30
35
40
Softwood chips Softwood
roundwood
Hardwood
chips
Hardwood
roundwood
US
$/g
reen
ton (
del
iver
ed)
South Central Fiber Prices
1Q/10 2Q/10 3Q/10 4Q/10 1Q/11 2Q/11
0
5
10
15
20
25
30
35
Softwood
chips
Softwood
roundwood
Hardwood
chips
Hardwood
roundwood
US
$/g
reen
ton (
del
iver
ed)
South East Fiber Prices
1Q/10 2Q/10 3Q/10 4Q/10 1Q/11 2Q/11
South Central fiber prices drift lower
Violent storms in Mississippi and Alabama, and
flooding along the Mississippi River dominated
weather news in this region during the 2Q/11.
Wildfires across the state of Texas added to the
region’s drama. The river flooding resulted in
curtailments to a few pulpmills and chipping
facilities, and there were also some seasonal
maintenance outages. These temporary reductions
in demand canceled out reductions of fiber
production which occurred secondary to the weather
and fire events.
In some buyer’s opinions, cleanup from Alabama’s
swath of damage from tornadoes (estimated at 14
million green tons of wood over 230,000 acres) has
raised the likelihood that overall delivered softwood
roundwood prices may drop in 3Q/11. While
salvaging is difficult and more costly, the sheer
volume of wood that is under pressure to be brought
in before it deteriorates will bring a surge of supply
to the market.
Sawmill residual chip prices remained unchanged,
though lumber production showed growth through
the 1Q/11.
High diesel prices have been the only factor
applying pressure towards increasing delivered
wood cost, but except in specific instances, those
increases have been negligible.
Southeast fiber prices also see small decreases
Wildfires primarily in Georgia during May created
salvage opportunities similar to those in Mississippi
and Alabama. The “advantage” in this situation, in
contrast to the twisted damaged wood left by
tornadoes, is the relatively clean sweep of fire
leaving stands in much better shape for conventional
salvage harvest operations. As a result, a brief
“flood” of freshly killed roundwood entered the
supply arena in the Southern end of this region, with
local pulp mills being quick to take advantage of the
increased supply.
Both softwood and hardwood delivered wood prices
in the Southeast dropped on average one US$/green
ton. Several contacts noted that while lower
delivered wood prices were the norm, rising
Southeast stumpage prices wherever new
competition has emerged. One such example is in
Southeast Georgia where a major new pellet plant
has begun operations.
Southwide region further improves its
comparative advantage
With other pulp regions experiencing significant
increases in wood costs this quarter – whether from
sawmill reductions in residual chips or extended
transitions from spring to summer access to wood,
the South’s low, stable wood prices continue to
make the region a formidable world competitor.
US South Wood Fiber Market Update April - June, 2011

North American
Wood Fiber Review
© 2011 Wood Resources International LLC. 8
0
10
20
30
40
50
US
$/g
reen
ton
(deli
ver
ed)
Lake States Wood Fiber Prices
Sftwd Roundwood Hwd Roundwood
Sftwd chips Hwd chips
0
10
20
30
40
50
60
US
$/g
reen
ton (
del
iver
ed)
Northern New England Wood Fiber Prices
Sftwd Roundwood Mixed Hwd Roundwood
Poplar Roundwood Mixed Hwd Chips
Wood fiber prices rise slightly due to increased
diesel costs and wet operating conditions
Though there was much concern over the long wet
transition from winter to late spring, the Lake States
region experienced relatively little price movement.
Softwood residual chips showed a two percent rise
from the previous quarter, though the rise in
residual softwood chips is thought to be more a
function of scarcity due reduced sawmill production
than increased demand.
While both softwood and hardwood roundwood
prices were steady this quarter, both are nearly 13-
14 percent higher than one year ago. Softwood
roundwood, US$43/green ton in 2Q/10, is now
US$49/green ton. Hardwood roundwood,
US$34/green ton then, is now US$39/green ton.
Wet conditions this past fall and winter, in
particular where early snows had prevented freezing
in mixed spruce and fir stands, resulted in the jump
in softwood roundwood prices and prices have
remained elevated to date. As summer access to
wood begins to take hold, delivered wood prices
should ease, though pressure from higher diesel
prices may prevent any net change.
Northern New England hardwood roundwood
still scarce resulting in further price increases
Mixed hardwood, sorted poplar roundwood, and
hardwood residual chip prices all rose significantly
in 2Q/11 in Maine, the center of Northern New
England’s pulp and paper industry. Hardwood
roundwood rose 11 percent from the previous
quarter, while poplar rose 10 percent. Hardwood
residual chip prices rose nearly six percent, though
like other regions, this reflected slowing lumber
production and shrinking residual chip supply.
On an annual basis, hardwood roundwood prices
have climbed nearly 26 percent in one year – from
US$39/green ton to US$49/green ton in 2Q/11. The
rise is a result of both long and short term factors.
The long running dispute over using Canadian
bonded labor has resulted in some contractors
reducing their capacity and workforce. In the short
term, a slow wet spring, lower than hoped for
inventories coming out of winter, and high diesel
prices were repeatedly cited.
Broader Northeast regional wood fiber prices
outside of Northern New England remain
significantly lower and more stable.
Lake States - Northeast Wood Fiber Market Update
April - June, 2011

North American
Wood Fiber
Review
9 © 2011 Wood Resources International LLC.
124
147141
162
140
152
119 116
159
175 170
186
147
167
150
141
0
25
50
75
100
125
150
175
200
Douglas-fir Hemlock Douglas-fir Hemlock Douglas-fir Hemlock Douglas-fir Hemlock
W. Washington Lower Columbia R. W. Oregon Inland Empire
US
$/B
DU
(d
eliv
ered
)
Residual and Roundwood Chip Prices 2Q/2011 Northwest U.S.
Residual chips Roundwood chips
0
20
40
60
80
100
120
140
160
180
in $
/BD
U d
eliv
ered
Douglas-fir and hemlock chip prices at the
Lower Columbia River pulpmills
DF Residual chips DF Whole-log chips
HEM Residual chips HEM Whole-log chips
Wood fiber price rises show no abatement
For the fourth straight quarter, weighted wood chip
prices in the Pacific Northwest rose substantially.
The weighted price of Douglas-fir chips (both
residual and whole log) is now US$144/bdu, up 42
percent from 2Q/10, and 13 percent from 1Q/11.
Hemlock prices, once nearly indistinguishable from
those of Douglas-fir, have “separated,” currently
averaging US$155/bdu, up 47 percent from 2Q/10.
The current price surge is a result of four primary
factors: sawmill lumber production well below
historical volumes, high pulpmill production due to
strong product prices, a reopened pulpmill in
Washington, and strong Chinese demand for logs.
Western sawmill lumber production continues well
below capacity in spite of some selling to the China
market. The resulting lack of residual chips has,
according to the Forest Resources Association,
culminated in nearly 46 percent of wood fiber
consumed by Northwest pulpmills being
manufactured chips in the first five months of 2011.
Historically, sawmill residual chips have provided
70-75 percent of the furnish to the region’s
pulpmills.
High product prices for most pulp and paper grades
continue, resulting in continued high operating rates
and high demand for fiber at the region’s pulpmills.
A newly reopened pulpmill in Cosmopolis
Washington has also further increased the demand
for hemlock in particular, as this is the preferred
species for the mill’s primary product.
In addition, the strong log demand from China
continues to siphon off some of the available chip-
n-saw grade logs used in a pinch in pulpmill whole
log chipping operations or in sawmills.
The rise in chip prices has moved the Pacific
Northwest into the highest cost fiber region in the
U.S this year. In fact, the prices now in the PNW
rival those in the traditionally highest-priced
Eastern Canadian Provinces of Ontario and Quebec.
Northwest U.S. pulplog prices rise
Hemlock pulplog prices have climbed 62 percent
from one year ago. In 2Q/10, the average price was
US$29/green ton, and is now US$47/green ton.
Douglas-fir pulplog prices have risen 45 percent in
the past year – from US$29/green ton in 2Q/10 to
US$42/green ton this quarter.
To date, most of the increase in pulplog prices has
been confined to the West side of the Cascade
mountains. Still Douglas-fir and hemlock pulplog
prices east of the Cascade mountains have risen 21-
25 percent from 2Q/10 to 2Q/11, and reports are
increasing regarding new log concentration yards
being set up or reopened on the east side for 3Q/11.
This portends an interesting summer and fall.
Northwest U.S. Wood Fiber Market Update April - June, 2011

North American
Wood Fiber Review
© 2011 Wood Resources International LLC. 10
in US$/bdu (delivered) Ave Ave Ave Ave
Washington 140 113 - 195 160 90 - 211 See US West average See US West average
Northwest (Puget Sound)
Lower Columbia River 154 127 - 190 172 127 - 197 See US West average See US West average
(SW WA + NW OR)
Oregon 143 118 - 180 157 118 - 185 na na
(Willamette Valley)
Inland Empire 129 99 - 166 125 97 - 166 na na
(E. Washington, Idaho)
US West, weighted average 144 99 - 195 155 90 - 211 112 82 - 139 126 105 - 137
Douglas-Fir Hemlock Cedar Hardwood
Range Range Range Range
0
20
40
60
80
100
120
140
160
W. Washington Lower Columbia R. W. Oregon Inland Empire
US
$/B
DU
Douglas-fir chip prices in Northwest U.S.
2Q/10 3Q/10 4Q/10 1Q11 2Q11
Notes:
Wood chip prices in above table and graph include both residual chips and chips manufactured from roundwood.
Prices are in US$/BDU delivered to domestic pulpmills. 1 BDU = 2400 lb. = 1.09 metric ton (dry weight)
1 BDU = 1.2 BDT
Wood Chip Prices – Northwest U.S.
April - June, 2011

North American
Wood Fiber
Review
11 © 2011 Wood Resources International LLC.
Northwest U.S. Wood Chip Inventories
Company Location Jun-10 Sep-10 Dec-10 Mar-11 Jun-11
Blue Heron Paper Co. Oregon City, Or 0.7 0.2 0.4 closed closed
Boise Cascade Corp. Wallula, Wa 21 24 44 39 34
Cascade Pacific Pulp LLC Halsey, Or 40 25 30 32 40
Clearwater Paper Corp. Lewiston, Id 29 39 56 59 35
Cosmo Speciality Cellulose Cosmopolis, Wa - - - - 15
Georgia Pacific Corp. Camas, Wa/Wauna, Or 35 25 31 18 28Toledo, Or 13 17 23 10 12Coos Bay, Or 5 3 4 3 1
Inland Empire Paper Co. Spokane, Wa 1 6 6 8 3
International Paper Springfield, Or 15 15 18 15 15
Kimberly Clark Everett, Wa 15 21 24 17 13
Longview Fibre Co. Longview, Wa 54 57 50 40 67
Nippon Paper Industries Port Angeles, Wa 0.5 0.5 0.8 0.7 0.6
Oregon Chip Terminal Coos Bay, Or 28 14 4 14 12
Ponderay Newsprint Co. Usk, Wa 2 2 2 2 3
Port Townsend Paper Pt Townsend, Wa 7 10 12 10 8
Roseburg Forest Products Coos Bay, Or 30 30 28 30 8
Simpson Paper Co. Tacoma, Wa 15 24 24 21 10
SP Newsprint Co. Newberg, Or 0 0.5 1 0.7 0.7
Weyerhaeuser Co. Longview, Wa 33 29 34 25 33
TOTAL Northwest U.S. (in 1000 BDU) 344 342 392 344 338
Change Y/Y (%) -20 -30 -14 -21 -2
Notes:
Inventories in the above table include both chips and sawdust, and represent the estimated on-hand volumes at the end
of 2Q/11.
North American
Wood Fiber Review
© 2011 Wood Resources International LLC. 12
0
100
200
300
400
500
600
700
800
in 1
00
0 B
DU
's
Chip and sawdust inventory in Northwest U.S.
WA (Puget S.) East WA/ID/MT Lower Columbia River
OR (Willamette V.) Export Total
Source: North American Wood Fiber Review
0
10
20
30
40
50
60
0
200
400
600
800
1000
1200
Inv
ento
ry (d
ays)
Co
nsu
mp
tio
n (1
00
0 B
DT
)
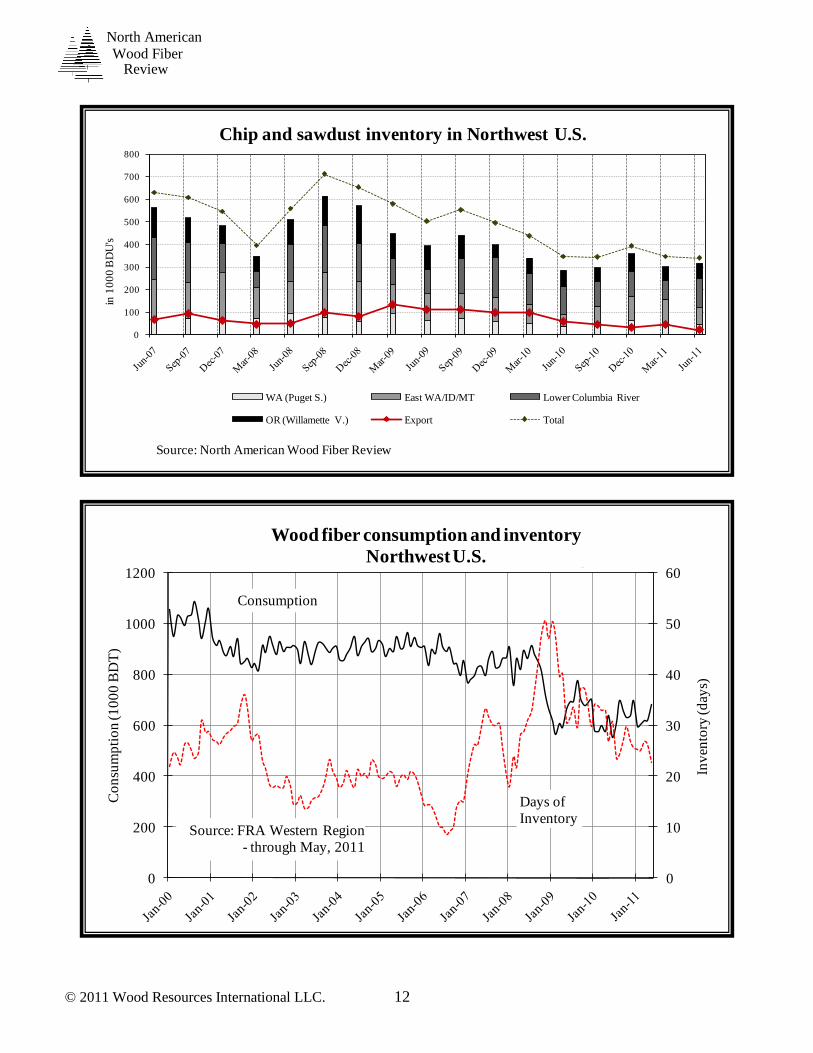
Wood fiber consumption and inventory
Northwest U.S.
Consumption
Days of
InventorySource: FRA Western Region
- through May, 2011

North American
Wood Fiber
Review
13 © 2011 Wood Resources International LLC.
US$/green ton (delivered)
Hardwood
Ave Range Ave Range Ave Range
Washington, West 44 30-59 49 35-63 29 24-35
Lower Columbia River 44 38-52 50 40-59 29 25-36
(SW WA + NW OR)
Oregon, West 46 40-55 46 40-55 29 27-35
Inland Empire 34 23-50 34 23-50 ..... .....
Weighted Average 42 (23-59) 47 (23-63) 29 (24-36)
Pulplog Prices – Northwest U.S.
April - June 2011
Douglas-fir Hem-fir
Notes:
1BDT equivalent to 2000 lb or .907 metric ton
0
5
10
15
20
25
30
35
40
45
50
US
$/G
reen
to
n (
deli
vere
d)
Pulplog Prices in Northwest U.S. 2001 - current
Douglas-fir Hem-fir

North American
Wood Fiber Review
© 2011 Wood Resources International LLC. 14
US$/BDT (delivered)
Ave Range Ave Range Ave Range Ave Range
Washington, West ..... ..... 48 33-61 35 26-47 46 41-58
Lower Columbia River ..... ..... 52 40-59 33 20-40 42 31-49
(SW WA + NW OR)
Oregon, West 60 35-71 55 38-72 33 24-40 43 40-50
Northern California ..... ..... ..... ..... 36 30-45 49 42-52
Inland Empire 39 19-70 53 15-89 38 15-55 58 45-65
Weighted Average 52 (19-71) 52 (15-89) 35 (15-55) 47 (31-65)
Residue and Woody Biomass Prices - Western U.S.
Shavings Sawdust Mill
Woody Biomass
Forest
Sawmill
April - June 2011
0
10
20
30
40
50
60
70
US
$/B
DT
(d
eli
vere
d)
Sawmill Residue Prices in the Western U.S. 2000 - current
Shavings Sawdust

North American
Wood Fiber
Review
15 © 2011 Wood Resources International LLC.
Coastal BC pulplog prices rise due to continued
demand pressures
Pulplog prices along the BC coast were up sharply
in 2Q/11, 17 percent from the previous quarter.
Hemlock pulplogs rose to C$$49/m3 from C$42/m3
in 1Q/11. A combination of strong pulpmill
production, increased log exports to China, and
slow pulplog production from heavy snowpack
lingering in mid-elevation forest stands were cited
as the three primary factors. Anticipated seasonal
increases in harvest levels, just beginning now in
the late 2Q/11, should ease pressure on high prices
this summer.
In contrast to 2Q/11 pulplog prices, softwood chip
prices, which are tied to market pulp prices, were
essentially unchanged in BC’s coast region.
Similarly in BC’s Northern Interior, softwood chip
prices stayed the same. Because the region’s
sawmills were running at higher operating rates to
meet increased lumber demand from China, a
relatively strong supply of residual wood chips
reduced price pressure, which mitigated the
increased costs of diesel and thus helped prevent
higher delivered fiber costs.
In the BC Southern Interior, softwood prices rose
11 percent from the previous quarter, pressured
somewhat by the higher chip prices on the Coast, as
well as a bit of exposure to the price surge in the
neighboring US Pacific Northwest. The longer
distances between consuming mills and fiber
suppliers in the Southern Interior as compared to the
Coastal and Northern Interior regions - was an
additional pressure on pricing due to higher cost of
diesel.
Alberta softwood fiber prices continue slow rise
Alberta softwood fiber prices crept higher for the
third straight quarter to C$103/bdu – FOB. What is
not evident in this price measured at the sawmill
bin, are the increasing trucking costs, which have
risen dramatically the past year. Part of the
challenge for transportation continues to come from
competition with the oil patch sector. Both truck
drivers and mill workers have attractive benefits
and pay offered to them in the oil industry as an
alternative to forest products mills.
Wood fiber prices unchanged in Quebec and
Ontario
In Ontario and Quebec, softwood and hardwood
chip and roundwood prices remained unchanged
this quarter. With sawmills in the region historically
focused on the US domestic market, and not in
position to participate in the increased Chinese
lumber market, there was little good news for
lumber prices or mill production. Yet, as the impact
of negotiated 2011 yearly chip contracts set in, it
also became clear that some wood fiber buyers’
anticipation of reductions in chip prices generally
did not occur.
Maritime roundwood prices rise dramatically
Wood fiber prices in the Maritime Provinces of
New Brunswick and Nova Scotia continued to grow
by double digits in an apparent bid by fiber buyers
to entice private woodland owners into increasing
their harvest levels.
Softwood roundwood prices rose nearly 18 percent
in 2Q/11 from the previous quarter. With the
delivered price now averaging C$114/odmt, it also
represents a 17 percent increase from 2Q/10.
Hardwood roundwood prices increased eight
percent from the previous quarter.
On another note of interest, Paper Excellence
acquired the Northern Pulp-owned Pictou mill in
Nova Scotia, its fifth Canadian pulp mill acquisition
by the Indonesian company.
Canadian Wood Fiber Market and Industry Update
April - June, 2011

North American
Wood Fiber Review
© 2011 Wood Resources International LLC. 16
Wood Chip and Pulpwood Prices - Western Canada April - June, 2011
Can$/BDU (FOB sawmill)
Douglas-Fir Hem-fir Spruce/pine/fir CedarAve Range Ave Range Ave Range Ave Range
British ColumbiaNorth Interior ..... ..... 95 81-116 95 81-116 ..... .....
South Interior 80 69-94 89 76-103 89 76-103 67 52-82
Coast 100 87-121 111 92-126 ..... ..... 72 55-85
Alberta ..... ..... ..... ..... 103 73-130 ..... .....
British ColumbiaNorth Interior ..... ..... 33 28-38 33 28-38 ..... .....
South Interior 33 30-39 38 32-65 38 32-65 ..... .....
Coast 40 36-43 49 42-60 ..... ..... ..... .....
RESIDUAL WOOD CHIP
ROUNDWOOD
Can$/m3 ub (delivered)
0
20
40
60
80
100
120
BC, Coast BC, N. Interior BC, S. Interior Alberta
Can
$/B
DU
(F
OB
saw
mil
l)
RESIDUAL WOOD CHIP PRICES - Western Canada
1Q/10 2Q/10 3Q/10 4Q/10 1Q/11 2q/11
Notes.
Domestic residual chips in Can$ per BDU at sawmill
Domestic log prices in Can$ per m3 (delivered to pulpmill or sawmill)
1 green ton approximately 0.92 cubic metre (Douglas-fir/hemlock) and 1.11 cubic metre (spruce/pine)
1BDU = 2400 Lb. = 1.09 metric ton (dry weight)
Exchange rate: Can$0.964/US$ (Average 2Q/2011)

North American
Wood Fiber
Review
17 © 2011 Wood Resources International LLC.
Notes.
Domestic residual chip and log prices in Can$ per odmt (delivered to pulp mill or chip plant)
1odmt (dry weight) = 1.102 short tons (dry weight) = 2204 lb
Exchange rate: Can$0.964/US$ (Average 2Q/2011)
Sources: Industry contacts and the Wood Resource Quarterly
Wood Chip and Pulpwood Prices - Eastern Canada April - June, 2011
Hardwood Hardwood
Ave Range Ave Range Ave Range Ave Range
Ontario 116 90-135 78 70-90 143 107-165 88 73-105
Quebec 125 100-150 82 70-93 160 120-180 95 75-110
Maritime Prov. na na na na 114 96-141 94 83-125
WOOD CHIPS ROUNDWOOD
Can$/odmt (delivered) Can$/odmt (delivered)
Softwood Softwood
0
20
40
60
80
100
120
140
160
180
Ontario chips Ontario roundwood Quebec chips Quebec roundwood Maritimes roundwood
Can
$/o
dm
t (d
elli
ver
ed)
SOFTWOOD FIBER PRICES - Eastern Canada
1Q/10 2Q/10 3Q/10 4Q/10 1Q/11 2Q/11

North American
Wood Fiber Review
© 2011 Wood Resources International LLC. 18
North American Woody Biomass Policies and Issues Update
April - June, 2011
Canadian and U.S. renewable energy policies
continue to be mixed in purpose and intensity
Policies meant to encourage further utilization of
woody biomass as a renewable energy source,
continue to vary in intent and consequences in both
the U.S. and Canada. At times, woody biomass
policies are caught up with broader policies
pertaining to wood allotments or forest regulations,
the result being apparent contradictions in direction.
For example, in the U.S., the 9th
Circuit Court,
which covers most of the Western States, has ruled
that runoff from logging roads – public or private -
is subject to Environmental Protection Agency
regulations under the Clean Water Act. If the ruling
is upheld (it is under appeal), significant new
restrictions are likely for both timber harvesting and
subsequent woody biomass utilization.
In contrast, Washington State continues to
encourage greater woody biomass utilization off
those same private and state forestlands with
proposed legislation intended to produce a next
generation jet fuel.
Canadian polices vary from East to West
In Canada, the Province of Nova Scotia has
implemented a new policy reducing clearcutting to
50 percent of the total harvest. While the motive is
to ensure sustainability, it is unclear whether the
regulations apply to harvest acres or volume, and
what might be exceptions for disease or
regeneration, as well as other technical questions.
At the same time, the NS government is providing
five million dollars in funding to provide training,
and technical services to non-industrial woodlot
owners, as well as harvest tracking, and monitoring.
The Province is also lowering the amount of woody
biomass that can be utilized towards reaching a
Provincial goal of 40 percent renewable energy by
2020. A previous cap of 500,000odmt/year, has
been lowered to 300,000odmt/year which can be
used to generate electricity.
In Ontario, the Provincial Government’s program to
redistribute available forest tenures met with steady
criticism from industry groups, as well as individual
companies not able to acquire an allotment.
Ontario’s Forest Tenure Modernization Act was
also criticized for its fast track timetable, and the
lack of hearings in the rural areas of the Province
most affected by the pending reforms.
In British Columbia, enthusiasm continues to be
expressed by Provincial forest officials, both for
generating new lumber markets in Asia in general,
as well as for continuing to assist efforts to salvage
the stands killed by the Mountain Pine beetle. These
efforts indirectly support the robust BC pellet
export industry resulting in new ventures or
explorations of additional facilities.
Canada’s Pulp and Paper Green Transformation
Program approaches conclusion
Canada’s Pulp and Paper Green Transformation
Program (PPGTP) is now less than one year from
its ending date. Companies received a maximum
funding envelope based on a per liter credit for
black liquor produced by their mills in 2009. They
have until March 31, 2012 to draw on this funding
to finance approved capital projects. The one billion
dollar program has generally been seen as a positive
incentive in promoting woody biomass utilization
and greater efficiencies in the energy consumption
of the pulp and paper industry.
Looking back, the top six qualifiers for Canada’s
PPGTP funds were:
C$143 million, Domtar Inc.
C$122 million, Canfor Pulp Limited Partnership
C$88 million, West Fraser, Ltd
C$69 million, Alpac Forest Products
C$59 million, Diashowa-Marubeni
C$57 million Mercer Celgar

North American
Wood Fiber
Review
19 © 2011 Wood Resources International LLC.
0
2
4
6
8
10
12
14
US
(H
enry
Hu
b)
US
$/m
mb
dt;
C
anad
a (A
lber
ta H
ub
) C
an$
/gig
ajo
ule
North American Natural Gas Prices
US (Henry Hub) Canada (Alberta Hub)
Biomass Crop Assistance Program on the edge
This time last year, BCAP was concluding its
injection of money into the woody biomass market,
generating a wide variety of takers and resistance.
(The BCAP matching payments totaled over $243
million as reported by the USDA in October, 2010)
This year, having morphed into an agricultural
program focused on new project areas for dedicated
crops, BCAP is now on the edge of being defunded
altogether. The U.S. House Agriculture
Appropriations Subcommittee has voted to
eliminate all BCAP funding for 2012.
New Jersey withdraws from regional carbon
trading program
In New Jersey, the governor removed his state from
participating in the 10-state Regional Greenhouse
Gas Initiative (RGGI) because of concerns over the
value received for a Carbon Valuation and Trading
program. The program required power producers to
buy and sell permits for the right to emit CO2 but
Governor Christie remarked "Reduced emissions
have been due to increased use of natural gas, and
the decreased use of coal. We're seeing that the
market, and not RGGI, has created incentives to
reduce the use of carbon-based fuels.”
REC’s and PPAs take center stage
The New Jersey action highlighted ongoing
negotiations across the country between utilities and
renewable power producers over rates they are
willing to pay for power, and what is needed to
cover the producers’ costs. Renewable Energy
Credits (REC’s) have been one source of income for
power producers in addition to the rates established
in their power purchase agreement rates (PPA). The
value of REC’s may now become a concern if state
governments, as in the case of New Jersey, question
the value received.
Regarding PPA’s, California biomass plants are in
tough negotiations for “viable” PPA rates.
Similarly, four NH biomass plants have stated they
are likely to shut down if they're not able to secure
adequate short-term energy contracts with Public
Service of New Hampshire utility.
Fossil Fuel prices continue mixed trends
Low natural gas prices continued to emphasize the
attractiveness of this fuel, no doubt slowing
investment commitments in new woody biomass
projects.
Conversely, the benchmark West Texas
Intermediate crude price remained high, spurring
continued industry efforts to secure more favorably
priced and less volatile energy sources.
Woody Biomass Policies and Issues Update continued April - June, 2011
0
20
40
60
80
100
120
140
160
US
$/B
arre
l
North American Crude Oil Benchmark Price
West Texas Intermediate (WTI)

North American
Wood Fiber Review
© 2011 Wood Resources International LLC. 20
0
100
200
300
400
500
600
US
an
d C
anad
ian
cu
rren
cies
-C
ents
per
Gal
lon
US and Canada National Average Retail Diesel Prices
US National Average Canada Average
Diesel fuel prices across the continent continue to
climb, adding to the costs to delivered woody
biomass
High diesel prices were mentioned by fiber buyers
and contractors in every region of North America as
a factor in either more costly wood fiber and
biomass, or in preventing what would otherwise be
falling delivered costs for regional oversupplies.
As shown in the above graph, diesel prices have
returned towards those peak prices of mid 2008
before the economic stumble. From the low of
April, 2009, the US average diesel price has risen
85 percent, from $2.22/gallon to $4.12, while in
Canada, the per litre price has climbed 47 percent,
from C$3.32 to C$4.88/US gallon equivalent.
Diesel prices have cooled and dropped in some
regions towards the end of the quarter, but remain at
historically high levels.
Biomass facilities across the continent ready to
enter the market
In Lufkin, Texas, Aspen Power LLC is procuring
woody biomass supplies and preparing for final test
burns at its 50 MW plant. In addition, Southern
Power is building a 99 MW plant in Sacul Texas,
with a startup date set for early 2012. The two
facilities alone will increase demand for woody
biomass in the region by more than two million
green tons yearly.
In the US mid-Atlantic states of Virginia and North
Carolina, increased woody biomass use is in store.
Enviva has plans for a 350,000 metric ton
capacity pellet plant in Ahoskie, NC.
IP’s shuttered Franklin, VA mill is being
considered as a possible pellet facility, in
addition to IP’s decision to “repurpose” a
portion of its mill to produce fluff pulp.
Dominion Power has one power plant in Hurt,
Virginia utilizing woody biomass, is nearing
completion of a Virginia City hybrid facility
within a year that will use both biomass and
natural gas, and recently announced that three
other coal burning power plants will be
converted to woody biomass use in the next
several years.
In Canada, several significant biomass utilization
projects are moving forward.
Abitibibowater’s Thunder Bay Ontario pulpmill
is building a 40 MW biomass cogeneration unit
(CHP) that will move the mill from its current
23% internally generated power to 60-62
percent.
Conifex Timber announced plans for a 36 MW
CHP unit at one of its two Mackenzie, British
Columbia sawmills
New Page has begun constructing a 60 MW
CHP unit at its Point Tupper, Nova Scotia mill.
Trebio Renewable Biomass is completing its
130 mton capacity pellet plant in Portage du
Fort, Quebec with pellet export plans.
Two new biomass hotspots are now being
tracked by the NAWFR
On the following pages, two new biomass hotspots
are highlighted: British Columbia’s interior, the
major pellet exporting region in North America; and
Mississippi/Western Alabama in the heart of the
U.S. Southern pulp and paper industry.
North American Woody Biomass Industry Update
April - June, 2011

North American
Wood Fiber
Review
21 © 2011 Wood Resources International LLC.
Interior British Columbia
The pellet industry in the
interior of British Columbia
has been a pioneer of woody
biomass utilization in the
form of wood pellet exports.
For many years, this region has
proven to be a formidable
competitor to the US solid wood industry in terms
of lumber production, spawning heated rhetoric and
challenges regarding the Softwood Lumber
Agreement between the US and Canada. The
volumes BC produced were in response to the
booming US housing market, but recently due to the
Mountain Pine Beetle epidemic. With the US
housing market now just a fondly remembered
phenomenon, BC’s solid wood industry continues
to churn out lumber, now destined for China.
Through it all, the literal mountains of sawdust
generated by lumber production found an
improbable home in a pellet export industry selling
product into a long distance energy sector market in
Europe. With an historic sawdust price range of
C$23-28/odmt (FOB), a handful of pellet
companies have emerged to dominate the current
export trade. However, smaller pellet manufacturers
are also present, and more continue to explore
opportunities to utilize residues in the region
(including one biofuels refinery project in
Kamloops, BC announced by Raven Biofuels).
Somewhat surprising, there even remains a surplus
of sawdust in the region. And while sawdust and
pellets remain the big biomass story, one of the
largest biomass plants in Canada producing
electricity is Capital Power LLC’s 66 MW facility
in Williams Lake, BC, utilizing primarily sawmill
residues. Several of the region’s pulpmills consume
woody biomass, and several integrated expansion
projects that will result in even more woody
biomass utilization are underway.
Mississippi/Western Alabama
The emergence of a woody
biomass hotspot in what can be
considered the heart of the US
Southern pulpmill industry will
create interesting dynamics. While woody
biomass, primarily bark, has long been utilized by
pulpmills for a portion of their power needs, the
drop in pulpmill capacity over the past several
years has resulted in a large positive growth/drain
ratio of available fiber. This trend is particularly
noticeable in Mississippi.
With the yearly occurrence of hurricanes, and this
year’s strikingly destructive tornadoes, there is also
a recurring surge of woody biomass material
available for salvage.
KiOR is the most visible new player in this region.
The Texas based company has announced up to
five facilities to be built over the next several
years, producing a drop-in “bio crude” which has
already been accepted (on paper) from Hunt
Refining, a Tennessee-based company with a
refinery in Tuscaloosa, Alabama. Construction has
begun on KiOR’s first site in Columbus, MS. The
company has also attracted a second off-take
agreement with Catchlight LLC – a joint venture
between Weyerhaeuser and Chevron Corporation.
Enviva Pellets has acquired two operating pellet
plants in Amory and Wiggins, MS with plans to
expand, while Westervelt Renewable LLC has
announced plans to build a 250,000 ton capacity
export pellet facility in Aliceville, Alabama.
Three other emerging companies in this region are:
Bluefire – a cellulosic ethanol enterprise
planning to build in Fulton, Mississippi.
Coskata – with announced plans to build a
commercial ethanol plant in Boligee, Alabama.
New Biomass Energy – which plans to build a
65,000 ton capacity torrified wood pellet plant
in Quitman, Mississippi.
Woody Biomass Regional Updates
April - June, 2011

North American
Wood Fiber Review
© 2011 Wood Resources International LLC. 22
0
10
20
30
40
50
60
70
80
90
US
$/B
DT
(d
eli
vere
d)
Maine -Northern New Hampshire Forest Biomass Prices
Source: North American Wood Fiber Review
0
10
20
30
40
50
US
$B
DT
(d
eliv
ered
)
South, mill biomass prices
Source: North American Wood Fiber Review
South Georgia, North Florida, and
Southeast Alabama
Georgia Biomass LLC, held
its official opening of its pellet
plant in Waycross, Georgia,
during 2Q/11, and is now procuring
softwood roundwood for its
manufacturing. Bulk pellet delivery to Europe
is the next step and should begin late in the 2Q/11.
At full production, the plant is expected to produce
750,000 tons of pellets annually.
This region has several woody biomass projects
underway which have previously described in back
issues of NAWFR. Two updates however, are
worth mentioning:
The large 100 MW plant in Gainesville, Florida
biomass plant has announced the securing of a
power purchase agreement with a local utility.
This has triggered site clearing as the project’s
first phase of actual construction.
Vega Biofuels is the latest company to emerge
in the region, announcing plans to build a “bio-
coal” facility in Cordele, Georgia. This
company is one of a handful of businesses now
pursuing or having announced commercial-scale
pellet torrefaction as their manufacturing
process.
Southwide mill biomass residue prices in 2Q/11
have drifted slightly lower to US$42/bdt delivered.
Northern New England
In the 2Q/11, it became more difficult to
make a profit by generating woody
biomass supplies from the forests in
Northern New England. Demand has
decreased because of the closures of
two regional stand-alone biomass
plants and the two Katahdin pulpmills
in Millinocket Maine which closed in April.
Because biomass plants and pulpmills are faced
with the short-term challenge of keeping some
contractors in the game, prices remained stable.
Higher diesel prices also kept average delivered
woody biomass from deteriorating further. (See
graph)
Several local participants believe they are seeing
delivered woody biomass prices at the true bottom,
if operations are to survive. Emphasis is being
made on the need for contractors to deliberately
integrate their biomass production with other
harvest operations for additional efficiencies.
At the same time, there is a concern that regional
electricity market prices are not sustainable for
several of the region’s stand-alone biomass plants.
Those facilities with low debts have a small
advantage over those who don’t. At the same time,
biomass plants that are simply the higher-cost units
in a larger owner portfolio of renewable power
generating facilities, are more vulnerable to
shutdowns for strategic financial reasons.
Woody Biomass Regional Updates continued
April - June, 2011

North American
Wood Fiber
Review
23 © 2011 Wood Resources International LLC.
0
10
20
30
40
50
60
US
$/B
DT
(d
eliv
ered
)
Northern California Woody Biomass Prices
non differentiated mill forest ag urban
Source: North American Wood Fiber Review
0
10
20
30
40
50
60
70U
S$
/BD
T (
del
iver
ed)
Western Washington Woody Biomass Prices
mill forest urban
Source: North American Wood Fiber Review
Northern California
Northern California biomass
plants are finally beginning to
gain access to forest biomass
after a series of late winter
storms that produced significant
late season snowpack. Forest
biomass is an important seasonal
component of many mill’s fiber
sources though at a noticeably higher cost.
Similar to New England, the relatively slow
California economy and an apparent preference for
wind and solar renewable power, keeps the aging
stand-alone biomass plants in a constant quest for
power purchase agreements at adequate rates. A
few mountain plants remain closed for this reason
among others, though Laidlaw Energy LLC
announced an agreement to purchase an idled plant
in Susanville, CA. Previously owned by Renegy,
the 14 MW biomass plant will need refurbishing
and startup is not expected till 2012.
Forest biomass prices climbed nearly nine percent
in 2Q/11 from the previous quarter (see graph). The
average to US$49/bdt was primarily due to longer
hauling distances, but higher diesel costs also
played a role. Mill residues rose slightly, likely due
in to constrained sawmill lumber production, and
lower available supplies (still less expensive than
forest biomass).
Western Washington
In contrast to Northern
California, Western Washington
biomass consumers were
benefiting from a “glut” of
woody biomass.
In spite of the abundance of biomass,
delivered prices did not drop, partly due to
increased diesel prices (see graph). Similar to
Northern New England, biomass buyers were also
calculating how to work long term with preferred
suppliers to keep them in the game.
Adding to the challenge of keeping a biomass
harvesting infrastructure in place, the surge of log
exports to Asia has created new concentrations of
woody biomass at unexpected locations – export
docks. While the overall volume of biomass may
not be significantly larger (a portion of these logs
would have been debarked at sawmills under
“normal” circumstances), the logistics of moving
biomass from origin to destination have changed.
In late May, Grays Harbor Paper, located in
Hoquiam, Washington, announced its closure. The
mill was unique in that it powered itself entirely by
woody biomass, most of that coming from the
forest. Its closure removed a significant consumer
of woody biomass from the Western Washington
hotspot, contributing to oversupply.
Woody Biomass Regional Updates continued
April - June, 2011

North American
Wood Fiber Review
© 2011 Wood Resources International LLC. 24
0
10
20
30
40
50
60
70
80
90
US
$/B
DT
(d
eliv
ered
)
Selected Regional Prices of Mill and Forest Biomass
South mill biomass Northeast forest biomass Northwest mill biomass
Northwest forest biomass California mill biomass California forest biomass
Unit: US$/BDT (delivered)
4Q/09 1Q/10 2Q/10 3Q/10 4Q/10 1Q/11 2Q/11 Q/Q Y/Y
South, mill 40 46 40 44 43 43 42 -2 5
Northeast, forest 60 56 58 56 52 52 52 0 -10
Northwest, mill 34 32 31 34 32 34 35 3 13
Northwest, forest 47 42 37 45 45 46 47 2 27
N California mill 34 27 31 34 32 35 36 3 16
N California forest 48 45 39 45 44 45 49 9 26
Change (%)
Woody Biomass prices in the US
Source:
North American Wood Fiber Review. Conversion of green tons to bone dry tons assumes 50% moisture content
Woody Biomass Regional Price Comparison
June, 2011

North American
Wood Fiber
Review
25 © 2011 Wood Resources International LLC.
0
20
40
60
80
100
120
140
1000 o
dm
t
Wood Chip Imports to the U.S.
US West US Other Total
Origin 1q/09 2q/09 3q/09 4q/09 1q/10 2q/10 3q/10 4q/10 1q/11 Q/Q Y/Y
1000 odmt
Canada, BC 18 15 26 0 17 17 20 10 23 130 35
Canada other 1 5 3 0 0 0 0 0 0 0 na
Other 0 0 0 0 0 50 23 0 0 0 na
Total 19 20 29 0 17 67 43 10 23 130 35
Change Q/Q (%) -21 5 45 -100 na 294 -36 -77 130
Change (%)
North American Wood Fiber Trade
While a relatively quiet quarter of wood chip trade
within North America (in contrast to logs and
lumber), we note that wood chips were exported to
China from the US West Coast in 2Q/11.
Our sister publication, the Wood Resource
Quarterly, further analyses wood fiber trade in the
Pacific Rim.
U.S. Wood Chip Imports

North American
Wood Fiber Review
© 2011 Wood Resources International LLC. 26
North American Wood Fiber Trade continued
U.S. Wood Chip Exports
0
50
100
150
200
250
Washington Oregon Other West North South
10
00
mt (d
ry w
eigh
t)
Wood Chip Exports from the U.S.
1Q/10 2Q/10 3Q/10 4Q/10 1Q/11
1Q11 WA OR Other West North South Total, U.S. Q/Q Y/Y
Conifer Chips
Japan 0 164 0 0 0 164 -21 -12
Canada 49 0 8 35 0 92 5 -26
Other 0 22 0 0 77 99 50 29
Total 49 186 8 35 77 355 -2 -9
Change Q/Q (%) 23 -10 -11 -10 17 -2
Non-Conifer Chips
Japan 0 0 0 0 0 0 na 0
Canada 0 0 0 58 0 58 -18 205
Other 0 0 0 0 0 0 na na
Total 0 0 0 58 0 58 -18 205
Change Q/Q (%) na na na -18 na -18
TOTAL 49 186 8 93 77 413 -4 1
Change Q/Q (%) 23 -10 -11 -15 17 -4
Change (%)

North American
Wood Fiber
Review
27 © 2011 Wood Resources International LLC.
North American Wood Fiber Trade continued
Canadian Wood Chip Imports
Destination Ontario Quebec Other Total
Origin WA Other Total Total Total Total Total
3Q/09 58 9 67 15 48 33 163
4Q/09 37 10 47 17 46 20 130
1Q/10 80 4 84 4 34 22 144
2Q/10 46 9 55 14 29 44 142
3Q/10 51 10 61 17 47 29 154
4Q/10 40 9 53 18 50 42 163
1Q/11 49 11 60 21 38 34 153
Change, Q/Q (%) 23 22 13 17 -24 -19 -6
Change, Y/Y (%) -39 175 -29 425 12 55 6
Wood Chip Imports to Canada
British Columbia
0
50
100
150
200
250
300
350
10
00
met
ric
ton
(d
ry w
eig
ht)
Wood Chip Imports to Canada
BC Quebec Ontario Other Total
Note: Virtually all BC imports are softwood chips, Eastern Canada’s are split between hardwood and softwood

North American
Wood Fiber Review
© 2011 Wood Resources International LLC. 28
North American Wood Fiber Trade continued
Canadian Wood Chip Exports
Origin Total
Destination U.S. Japan Total US Turkey Other Total All
2Q/09 15 41 56 5 0 0 5 61
3Q/09 26 81 107 3 0 0 3 110
4Q/09 0 61 61 0 18 0 18 79
1Q/10 17 78 95 0 0 1 1 96
2Q/10 17 76 93 0 0 0 0 93
3Q/10 20 48 68 0 0 16 16 84
4Q/10 10 54 64 0 0 0 0 641Q/11 23 99 122 1 21 0 22 144
Change, Q/Q (%) 130 83 91 na na na na 125
Change, Y/Y (%) 35 27 28 na na na na 50
Wood Chip Exports from Canada
British Columbia Other Provinces
0
20
40
60
80
100
120
140
160
10
00
od
mt
Wood Chip Exports from Canada
BC to U.S. BC to Japan
Other Provinces to U.S. Other Provinces to Overseas
Total
Prices for softwood chips exported to Japan 2Q/2011 (US$/BDU, FOB):
Douglas fir, U.S. $169.00 $169.00 (1Q/11)
SPF, Canada $170.00 $170.00 (1Q/11)

North American
Wood Fiber
Review
29 © 2011 Wood Resources International LLC.
North American Wood Pellet Exports to Europe
0
50
100
150
200
250
300
350
400
450
10
00
to
ns
2007 642
2008 7492009 1275
2010r 1480
Pellet exports from North America to Europe
Canada US North America
Source: WRI database
in thousand metric tons % Change % Change
Canada US North America Q/Q Y/Y
3Q09 195 156 351 42 66
4Q09 227 97 324 -8 44
1Q10 202 201 403 24 14
2Q10 180 115 295 -27 19
3Q10r 274 137 411 39 17
4Q10r 233 138 371 -10 15
1Q11 228 57 285 -23 -29
A drop in pellet exports in 4Q/10 and 1Q/11 shows
a decline first in Canada, and most recently in the
U.S. Volumes shipped to Europe were at the level
of those two years ago in 1Q/09
The recent volume decline is more likely to be more
from short-term European market adjustments that
reflect concerns over some EU member states’
economies, rather than a shift from interest in, and
plans for, further significant woody biomass
utilization.
The announcement by the German government in
May that its nuclear plants would be phased out by
2022 was both startling and vague. If even just a
significant portion of the energy now produced from
nuclear power is removed, renewable energy in all
forms, including pellets, is likely to benefit.

North American
Wood Fiber Review
© 2011 Wood Resources International LLC. 30
0
50
100
150
200
250
300
350
400
450
10
00
ton
s
2007 642
2008 749
2009 1275
2010r 1480
Pellet imports to Europe from North America
NL Belgium UK Other Total
Source: WRI database
Western Canada pellet export segment update
British Columbia has a secure hold as North
America’s largest exporter of pellets to Europe, as
well as the longest shipping distance to its market.
Notwithstanding the logistics, additional interest in
joining the BC export pellet industry continues.
A new company, Biomass Secure Power (BSP)
issued a 2Q/11 press release stating it secured a 10
year agreement to provide over one million tons of
pellets annually to a South Korean conglomerate,
LG International. BSP said it was in the process of
securing two sites in British Columbia on which to
build pellet plants using a torrified wood
manufacturing process. Construction on these
plants is yet to commence but according to the
company statement, shipments to South Korea will
begin in 2012.
South Korea has established national renewable
energy and carbon emission reduction goals, so the
general demand is increasing. There are, of course,
a few other Pacific Rim nations besides Canada
(and the U.S.) - notably Australia and Indonesia -
which have expressed interest in developing a
export pellet sector.
Viridis, another BC-based company announced
plans this quarter to acquire a U.S. pellet company,
Confluence Energy which operates in Kremmling
Colorado. At the same time, Viridis stated it had
signed agreements to provide export pellets to
Europe from its Okanagan Pellet Company facility
in Kelowna BC.
Additional pellet production in Eastern Canada
Besides the two major Maritime Provinces pellet
exporters to Europe, Shaw Resources and Enligna,
Group Savioe has at times exported bulk product at
times from its St Quentin facility in New
Brunswick. The next likely exporter is Holson
Forest Products Ltd, located in Roddickton,
Newfoundland. The company is nearing completion
of its pellet facility with announced export plans of
its own.
Several other Eastern Canadian businesses with
pellet export plans are emerging, of which most
located within reach of the St Lawrence Seaway.
Furthest along, Trebio Renewable Biomass is well
into construction of a 130,000 ton pellet facility in
Portage-du-Fort, Quebec, with rail access to move
product to the Seaway.
Another pellet association formed in the U.S.
Last quarter, we neglected to note a third U.S. pellet
exporter also located in the biomass hotspot of
Southeast Georgia and Northern Florida. Fram
Renewable Fuels, with its smaller capacity facility
in Baxley, GA, differs from the other two larger
pellet exporters (Green Circle Bioenergy and
Georgia Biomass) in that its wood fiber sourcing
strategy emphasizes the utilization of mill residuals,
rather than softwood roundwood.
Fram Renewables is also one of the founding four
members of a newly established US Industrial Pellet
Association, along with Green Circle Bioenergy,
Enviva Biomass and Westervelt Company. In a
statement issued by its Executive Director Seth
Ginther, the USIPA will focus on issues of
importance to these pellet producers: sustainability,
uniformity of contracts, and certification standards
for industrial wood pellets.
North American Wood Pellet Exports to Europe - continued

North American
Wood Fiber
Review
31 © 2011 Wood Resources International LLC.
North American Sawlog Markets and Exports
Notes.
Prices in the table and graphs in this section are for log species and grades mainly being processed into construction and better
grades of lumber.
Douglas-fir and hemlock (US Northwest): One mbf approximately equal six cubic meters (m3).
Southern pine (US South): One green short ton is approximately equal to 0.7 cubic meter.
Wood Resource Quarterly was the major source for sawlog prices. In addition, US South prices were also sourced from the
Timber-Mart South.
North American Sawlog Markets and Exports
0
10
20
30
40
50
60
70
80
90
100
US
$/m
3 (d
eliv
ered
)
Sawlog prices in the US and Canada 2009 - 2011
US, NW Douglas-fir
US, NW Hemlock
US, SC Pine
US, SE Pine
Can W, Coast Hemlock
Can W, Int. SPF
Can East Mixed sw
Sawlog prices have trended upward in nearly all
regions of North America the past two years
Sawlog prices were up in US dollar terms in all
major regions of North America except the US
South in the first quarter of 2011. This upward trend
has been ongoing for more than two years with
sawmills in the Pacific Northwest and Coastal
British Columbia in particular experiencing
substantially higher log costs in recent months.
The elevation in log costs in the Western U.S. can
be explained by the substantial increase in log
exports the past two years. In the 1Q/11, the U.S.
west coast exports to Asia reached almost 1.9
million m3, which can be compared to only 900,000
m3 in the first quarter last year.
The average Douglas-fir price in the Northwest U.S.
went up almost 50 percent in two years, reaching its
highest level since 2007. Douglas-fir sawlog prices
in the Northwest U.S. rose 20 percent to US$90/m3
delivered in the 1Q/11 alone. Hemlock prices
followed closely with a 17 percent increase from the
4Q/10.

North American
Wood Fiber Review
© 2011 Wood Resources International LLC. 32
Sawlog Markets in North America - continued
Western Canadian sawlog prices influenced by
Asian demand
While still the lowest on the continent, sawlog
prices in Western Canada have followed the same
pattern as in the Northwest U.S. Coastal Hemlock
prices rose 10 percent to C$54/m3 in 1Q/11 from
the previous quarter, while SPF sawlog prices from
the B.C. interior rose at a slower pace of five
percent in 1Q/11.
Eastern Canadian softwood sawlog prices
slightly up
Eastern Canada’s softwood prices drifted up only
three percent from the 4Q/10, but the region still has
the second highest average sawlog price on the
continent. Smaller volumes per acre, smaller average
stem size, and relatively long transport distances
create a challenging baseline for the region.
Southern sawlog prices buck the trend
Pine sawlog prices in the U.S. South have been
surprisingly stable the past two years. In the 1Q/11,
they were only slightly higher than two years ago,
averaging US$62/m3 delivered to mill. Delivered
sawlog prices in the South, as with pulpwood
roundwood, are the lowest in the U.S.
North American lumber production rises year to
year, then slows in 2Q/11
Lumber production in North America was 12
percent higher in the 1Q this year as compared to
the same quarter in 2010, reaching its highest level
since the beginning of the financial crises in late
2008 (see graph next column).
The biggest production increases the past quarter
occurred in British Columbia and Northwest U.S.
thanks to higher lumber exports to China. Had it not
been for the export market, both lumber production
and sawlog prices along the North American west
coast would most likely have been lower this year
than last.
U.S. regional differences noted
Despite the fact that the Western U.S. exported
more lumber in the 1Q/11, it was actually the U.S.
South that increased production the most.
According to the Western Wood Products
Association, lumber production in the U.S. South
during the 1Q/11 was 16 percent higher than it was
in the 1Q/10. This contrasts with the situation in the
Western regions of the U.S. and Canada, where
production was only up seven percent from 1Q/10.
Western Canada doubles China lumber exports
Continued demand for lumber by the Chinese
market has benefited the BC sawmills in particular.
During the first four months of 2011, Canadian
lumber exports to China more than doubled from
the same period last year, making China the second
biggest market after the US for Canadian sawmills.
West Coast lumber production slows in early
2Q/11
Lumber production statistics in April showed a drop
in both the Northwest U.S and British Columbia.
The drops in production mainly reflect a leveling
off of Chinese demand, as well as by the substantial
increases in regional lumber inventories from one
year ago.
0
5
10
15
20
25
bil
lio
n b
oard
fee
t
Softwood Lumber Production in North America
US Canada N. America

North American
Wood Fiber
Review
33 © 2011 Wood Resources International LLC.
0
200
400
600
800
1000
1200
1400
1600
1800
2000
10
00
m3
Log exports from the US to Asia 2008 - 2011
China
Japan
S. Korea
Total
U.S. Log Exports to Asia
US log exports to Asia
1000 m3
1Q/09 2Q 3Q 4Q 1Q/10 2Q 3Q 4Q 1Q/11 Q/Q Y/Y
Washington
China 21 27 16 19 59 198 409 356 458 29 676
Japan 125 111 81 98 69 104 98 70 75 7 9
S. Korea 190 277 290 257 224 195 98 142 174 23 -22
Total 336 415 387 374 352 497 605 568 707 24 101
Oregon
China 0 60 84 92 130 248 456 388 484 25 272
Japan 272 337 329 316 304 369 296 360 364 1 20
S. Korea 7 38 40 23 46 102 54 80 119 49 159
Total 279 435 453 431 480 719 806 828 967 17 101
Alaska
China 26 79 173 178 31 83 325 219 52 -76 68
Japan 2 48 75 137 0 64 67 72 36 -50 na
S. Korea 5 67 21 80 44 96 53 123 19 -85 -57
Total 33 194 269 395 75 243 445 414 107 -74 43
US West, total
China 47 166 273 289 220 529 1190 963 994 3 352
Japan 399 496 485 551 373 537 461 502 475 -5 27
S. Korea 202 382 351 360 314 393 205 345 312 -10 -1
TOTAL 648 1044 1109 1200 907 1459 1856 1810 1781 -2 96
Change (%)
Note:
Not included are minor log volumes exported from California, and log volumes imported to Taiwan

North American
Wood Fiber Review
© 2011 Wood Resources International LLC. 34
Global timber markets
Higher lumber production,
increased log trade, and a weak
US dollar were three factors that
pushed sawlog prices up in dollar
terms worldwide in the 1Q/11. In
many regions, prices reached
their highest levels since WRQ
started tracking log prices in
1995.
The Global Sawlog Price Index
(GSPI) increased for the eighth
consecutive quarter to an all-
time-high of US$88.14/m3. In
two years, the GSPI has gone up
by 33 percent, substantially more
than the increase in global
pulpwood prices.
Global pulpwood price
Wood fiber costs for pulp mills
worldwide rose for the third
consecutive quarter in the 1Q/11.
The Softwood Wood Fiber
Price Index (SFPI) increased
1.9 percent in the 1Q, reaching
US$105.60/odmt, the highest
level since 3Q/08. The US
Northwest, European markets,
Chile, Australia and New
Zealand saw the biggest wood
fiber price increases this quarter.
The Hardwood Wood Fiber
Price Index (HFPI) was also up
1.9 percent from the 4Q/10, and
is now close to an all-time high
of US$110.33. Fiber prices were
up in most markets, with the
highest increases in Europe,
Australia and Chile, and only
small upward prices adjustments
in Canada and Russia. Hardwood
fiber costs even declined in the
US South.
Global pulp markets
Global pulp markets have not
quite developed as many analysts
forecasted a year ago. Rather
than the predicted retraction in
market pulp prices this spring,
prices stayed strong and actually
increased to record high levels in
the month of April. The NBSK
price in Europe in early May was
US$1008/ton, according to
FOEX.
During the first two months of
2011, production of market
pulp was up five percent
compared to last year. The
biggest increase was in Western
Europe, which produced nine
percent more in 2011 than 2010.
Global lumber markets
Global demand for softwood
Lumber increased by about 18
percent in 2010. This came after
a year when wood consumption
worldwide was the lowest it had
been in almost 50 years. This
upward trend in consumption has
continued thus far in 2011, with
total volume consumed being
around 20 percent higher than the
same period in early 2010.
Not surprisingly, China has been
the major driver in the higher
lumber demand. The country’s
sawmills are far from being able
to meet the increased demand,
and as a result there has been a
substantial increase in import
volumes the past five year.
During the first two months of
2011, lumber production was up
in most provinces of Canada.
The biggest increases were in
Ontario (28%), Alberta (16%)
and Southern BC (16%).
The housing market in the US
South have fared relatively better
than the rest of the country, and
as a consequence, regional
lumber consumption was higher
than in other regions of the US.
Global biomass markets
While the U.S. and Canadian
domestic pellet industry
struggled through another year of
weak domestic market demand
and overcapacity, pellet export
shipments to Europe continued to
rise, up 21 percent in 2010.
Prices for wood pellets in the
three major markets in Europe,
Sweden, Germany and Austria
have gone up the past two years.
Global conifer sawlog price 1995 - 2011
0
10
20
30
40
50
60
70
80
90
100
1q/9
5
1q/9
6
1q/9
7
1q/9
8
1q/9
9
1q/0
0
1q/0
1
1q/0
2
1q/0
3
1q/0
4
1q/0
5
1q/0
6
1q/0
7
1q/0
8
1q/0
9
1q/1
0
1q/1
1
US
$/m
3
Source: Wood Resource Quarterly
Global Wood Fiber Price Indices 1988 - 2011
0
20
40
60
80
100
120
1q 8
8
1q 9
0
1q 9
2
1q 9
4
1q 9
6
1q 9
8
1q 0
0
1q 0
2
1q 0
4
1q 0
6
1q 0
8
1q 1
0
US
$/o
dm
t
Softwood
Hardwood
Source: Wood Resource Quarterly
The Global Forest Industry in 1Q, 2011

North American
Wood Fiber
Review
35 © 2011 Wood Resources International LLC.
Wood Resource Quarterly
Global Wood Fiber Price Indices (US$/odmt)
Wood fiber costs for pulp mills worldwide rose for
the third consecutive quarter in the 1Q/11. The
Softwood Wood Fiber Price Index (SFPI) increased 1.9 percent in the 1Q, reaching
US$105.60/odmt, the highest level since 3Q/08. The
US Northwest, European markets, Chile, Australia
and New Zealand saw the biggest wood fiber price
increases this quarter; there were only modest price
changes in US South, Canada and Brazil.
Softwood Wood Fiber Price Index (SFPI)
1q/2008 109.67
2q 112.53
3q 110.43
4q 97.32
1q/2009 89.00
2q 90.01
3q 93.12
4q 98.34
1q/2010 99.55
2q 98.29
3q 99.80
4q 103.60
1q/2011 105.60
The Hardwood Wood Fiber Price Index (HFPI)
was also up 1.9 percent from the 4Q/10, and is now
close to an all-time high of US$110.33. Fiber prices
were up in many of the same markets as those for
softwood fiber, with the highest increases in Europe,
Australia and Chile, and only small upward prices
adjustments in Canada and Russia. Hardwood fiber
costs even declined in the US South.
Hardwood Wood Fiber Price Index (HFPI)
1q/2008 106.11
2q 108.77
3q 110.71
4q 98.38
1q/2009 91.99
2q 94.92
3q 99.15
4q 106.19
1q/2010 105.90
2q 103.37
3q 104.88
4q 108.28
1q/2011 110.33
Note. The Global Average Wood Fiber Price Index
is a weighted average of delivered wood fiber prices
for the pulp industry in all regions tracked by the
publication Wood Resource Quarterly. These
regions together account for 85-90% of the world’s
wood-based pulp production capacity. The price is
based on current quarter average prices, and
country/regional wood fiber consumption data. The
global average for softwood and hardwood is
calculated in nominal US$ per oven-dried metric
ton of wood fiber.
Softwood Wood Fiber Price Index (SFPI)
0
20
40
60
80
100
120
1q 8
8
1q 9
0
1q 9
2
1q 9
4
1q 9
6
1q 9
8
1q 0
0
1q 0
2
1q 0
4
1q 0
6
1q 0
8
1q 1
0
US
$/o
dm
t
Softwood Wood Fiber Price Index (SFPI)
0
20
40
60
80
100
120
1q 8
8
1q 9
0
1q 9
2
1q 9
4
1q 9
6
1q 9
8
1q 0
0
1q 0
2
1q 0
4
1q 0
6
1q 0
8
1q 1
0
US
$/o
dm
t

North American
Wood Fiber Review
© 2011 Wood Resources International LLC. 36
The “North American Wood Fiber Review” is published quarterly by Wood Resources International, LLC. The
report is published in March, June, September and December. The annual subscription rate for 2011 is US$ 1200
(single user option) and $2000 (multi-user license), which includes both a mailed copy of the report, as well as a
down-loadable version of the report from our web site (www.woodprices.com).
In addition to the North American Wood Fiber Review, the company also publishes the Wood Resource Quarterly,
the source for global wood price data and market information, in its 24th year of comprehensive analysis of wood
market trends for the international forest industry. Each report is approximately 50 pages in length and includes
sawlog, pulplog, wood chip prices and market information from all major regions of the world. Timely knowledge
of global wood costs and trends remains a cornerstone for competent internal strategic planning within the forest
product industry.
Join the large group of the international forest industry analysts in over 25 countries by subscribing to the Wood
Resource Quarterly, the only wood market publication that has consistently tracked delivered pulpwood and sawlog
prices and market developments worldwide since 1988. The report is available as a delivered hard copy and in PDF
format on our web site.
For more information, or to initiate your subscription, please contact us at [email protected]
Contact Details: Mr. Håkan Ekström
P.O. Box 1891, Bothell, WA 98041, USA
Phone: +1-425-402-8809
E-mail: [email protected]
www.woodprices.com
Disclaimer
Prices published in the North American Wood Fiber Review are collected from sources believed to be reliable and
having a good knowledge of the market place. Prices in the report are the best estimates for the published quarter and
they may vary depending on special agreements and specific conditions.
Wood Resources International LLC has made every effort to ensure accuracy and completeness of
information provided but our company is not responsible for financial losses or damages of any kind resulting from
actions taken based on the contents of this report. We disclaim responsibility for errors that may have occurred when
gathering and publishing data.
International and U.S. Federal Copyright Laws:
• All Wood Resources International LLC (WRI) printed, e-mailed, downloaded or faxed subscriptions, articles,
and reports are protected under US Federal and international copyright laws as proprietary information.
• No part or total of any WRI publication may be reproduced, transmitted or retransmitted in any form, or by
any means, electronic or mechanical, including photocopy, facsimile, or any information storage and retrieval
system, including intranet, without expressly written permission. It is also illegal to share access password with
non-subscribers.
• Violation of the US copyright law can result in fines of up to US$150,000, plus attorney’s fees (Title 17 USC,
§504).
Subscription information