Embed Size (px)
Citation preview

25.000
30.000
35.000
40.000
45.000
50.000
0
5.000
10.000
15.000
20.000
Brazil China India Japan Russia United States European Union2000 2005 2008 2009
Dredging in Figures
DREDGING IN FIGURES
2010REVIEWof the global dredging market
Dredging in Figures – 2010
2
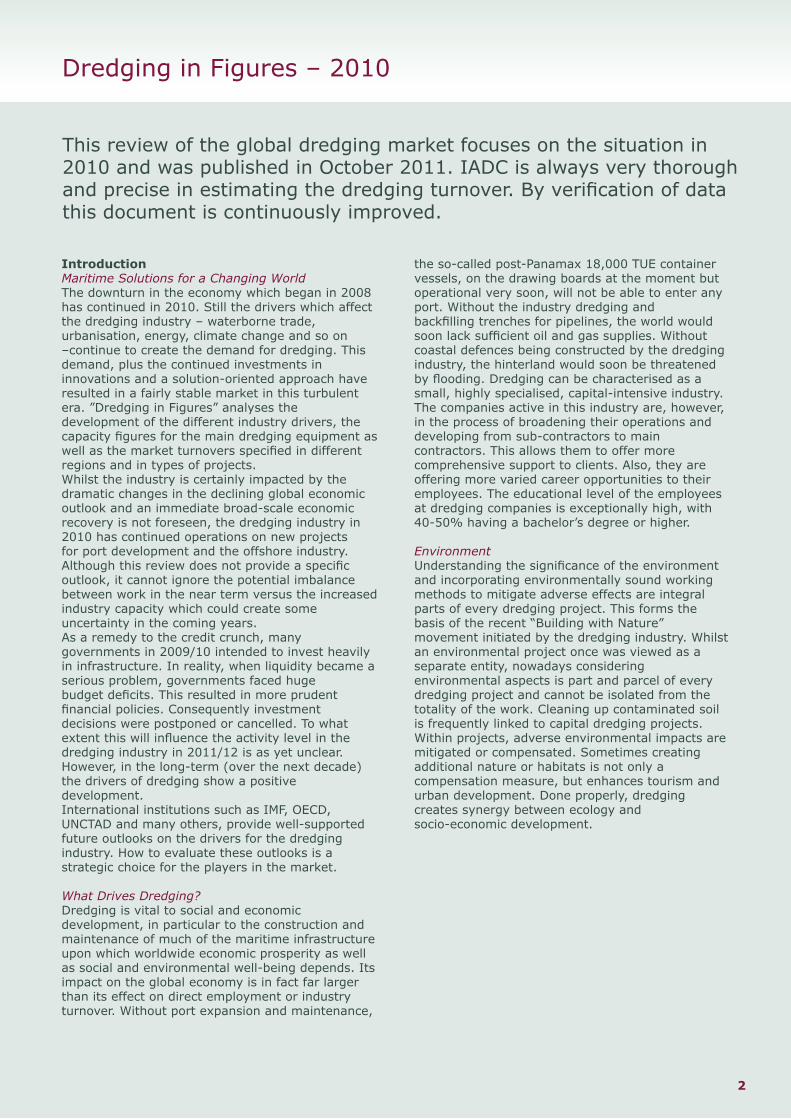
This review of the global dredging market focuses on the situation in 2010 and was published in October 2011. IADC is always very thorough and precise in estimating the dredging turnover. By verification of data this document is continuously improved.
Introduction Maritime Solutions for a Changing WorldThe downturn in the economy which began in 2008 has continued in 2010. Still the drivers which affect the dredging industry – waterborne trade, urbanisation, energy, climate change and so on –continue to create the demand for dredging. This demand, plus the continued investments in innovations and a solution-oriented approach have resulted in a fairly stable market in this turbulent era. ”Dredging in Figures” analyses the development of the different industry drivers, the capacity figures for the main dredging equipment as well as the market turnovers specified in different regions and in types of projects. Whilst the industry is certainly impacted by the dramatic changes in the declining global economic outlook and an immediate broad-scale economic recovery is not foreseen, the dredging industry in 2010 has continued operations on new projects for port development and the offshore industry. Although this review does not provide a specific outlook, it cannot ignore the potential imbalance between work in the near term versus the increased industry capacity which could create some uncertainty in the coming years. As a remedy to the credit crunch, many governments in 2009/10 intended to invest heavily in infrastructure. In reality, when liquidity became a serious problem, governments faced huge budget deficits. This resulted in more prudent financial policies. Consequently investment decisions were postponed or cancelled. To what extent this will influence the activity level in the dredging industry in 2011/12 is as yet unclear. However, in the long-term (over the next decade) the drivers of dredging show a positive development. International institutions such as IMF, OECD, UNCTAD and many others, provide well-supported future outlooks on the drivers for the dredging industry. How to evaluate these outlooks is a strategic choice for the players in the market.
What Drives Dredging? Dredging is vital to social and economic development, in particular to the construction and maintenance of much of the maritime infrastructure upon which worldwide economic prosperity as well as social and environmental well-being depends. Its impact on the global economy is in fact far larger than its effect on direct employment or industry turnover. Without port expansion and maintenance,
the so-called post-Panamax 18,000 TUE container vessels, on the drawing boards at the moment but operational very soon, will not be able to enter any port. Without the industry dredging and backfilling trenches for pipelines, the world would soon lack sufficient oil and gas supplies. Without coastal defences being constructed by the dredging industry, the hinterland would soon be threatened by flooding. Dredging can be characterised as a small, highly specialised, capital-intensive industry. The companies active in this industry are, however, in the process of broadening their operations and developing from sub-contractors to main contractors. This allows them to offer more comprehensive support to clients. Also, they are offering more varied career opportunities to their employees. The educational level of the employees at dredging companies is exceptionally high, with 40-50% having a bachelor’s degree or higher.
EnvironmentUnderstanding the significance of the environment and incorporating environmentally sound working methods to mitigate adverse effects are integral parts of every dredging project. This forms the basis of the recent “Building with Nature” movement initiated by the dredging industry. Whilst an environmental project once was viewed as a separate entity, nowadays considering environmental aspects is part and parcel of every dredging project and cannot be isolated from the totality of the work. Cleaning up contaminated soil is frequently linked to capital dredging projects. Within projects, adverse environmental impacts are mitigated or compensated. Sometimes creating additional nature or habitats is not only a compensation measure, but enhances tourism and urban development. Done properly, dredging creates synergy between ecology and socio-economic development.
3
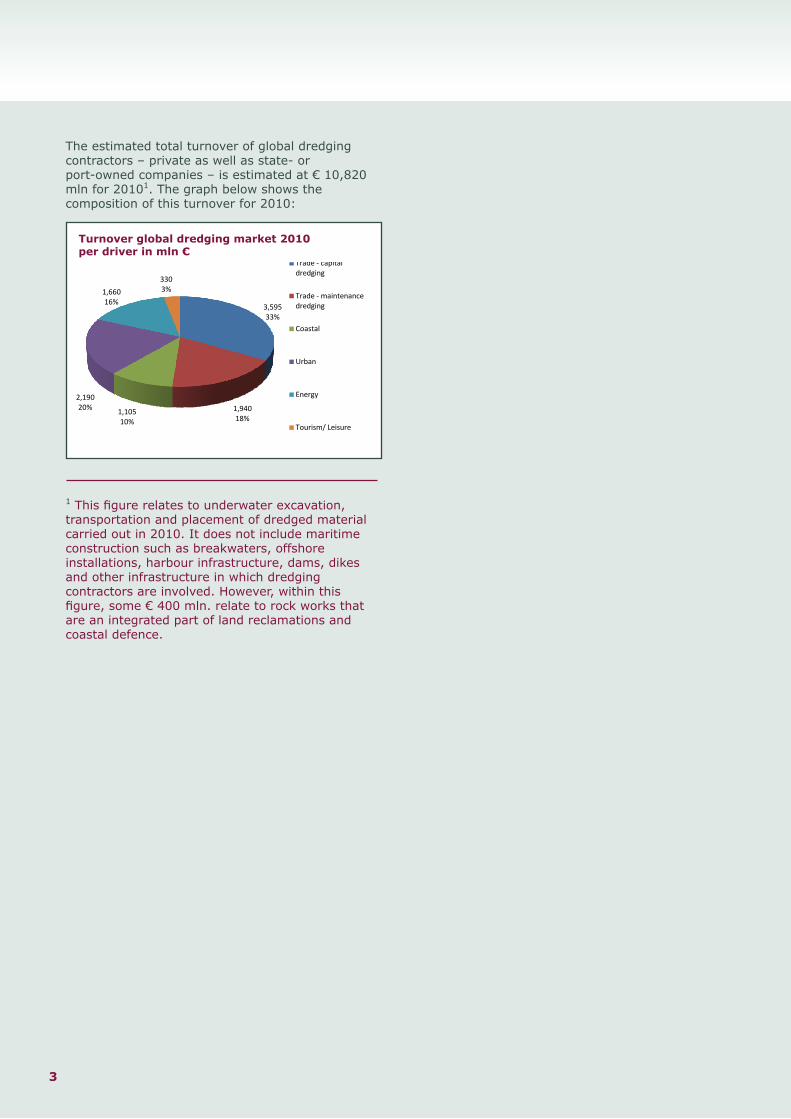
The estimated total turnover of global dredging contractors – private as well as state- or port-owned companies – is estimated at € 10,820 mln for 20101. The graph below shows the composition of this turnover for 2010:
1 This figure relates to underwater excavation, transportation and placement of dredged material carried out in 2010. It does not include maritime construction such as breakwaters, offshore installations, harbour infrastructure, dams, dikes and other infrastructure in which dredging contractors are involved. However, within this figure, some € 400 mln. relate to rock works that are an integrated part of land reclamations and coastal defence.
Turnover global dredging market 2010 per driver in mln €
3,59533%
1,94018%
1,10510%
2,19020%
1,66016%
3303%
Trade ‐ capital dredging
Trade ‐maintenance dredging
Coastal
Urban
Energy
Tourism/ Leisure

4
Developments of Drivers World TradeAs a result of the global economic downturn, waterborne trade fell with 4.5% in 2009. However, trade picked up again rather quickly in 2010. As mentioned above, container ships are getting larger, putting increased demand on the capacity and efficiency of ports. Dredging solutions support ports in meeting this challenge by maintaining and deepening channels as well as supplying dredged material for building berths, quay walls and hinterland infrastructure. Before the drop of 4.5% in 2009, the waterborne trade increased with 36.5%, between 2000 and 2008. The turnover in capital and maintenance dredging for ports and harbours has grown in the period 2000 to 2010 from €2,000 mln. to € 5,535 mln, which implies an average growth rate of 6,4%.
Demography and Climate, Urban Development and Coastal DefenceThe population worldwide is growing, especially in coastal areas. According to the United Nations, three billion people are living along thousands of kilometres of coastal zones. Even prior to 1950 in developed regions more people lived in urban areas than in rural areas. A UN study predicts a similar development for the developing regions through 2020.
At present, eight out of the ten largest cities in the world are located along a coast and their residents need more space and improved safety. The GDP graphic shows an estimated recovery in 2010 of 4.3%; this increasing economic value has to be protected against sea level rise and fluctuations in atmospheric conditions. Although from year to year these fluctuations are substantial, it does seem that the frequency and intensity of storms are increasing, thus increasing the need for effective and sustainable coastal defence. For many years, urban development has been a strong driver for the dredging industry and this driver is expected to continue.
Global seaborne trade 1970-2009 in mln ton(Source UNCTAD 2010)
Relation urban-rural civilisation (Source UN 2010)
Gross domestic product 2000-2010 in PPP per capita in $ (Source IMF 2010)
2,533
3,135 3,265 3,399 3,081
4 000
5,000
6,000
7,000
8,000
9,000
1,442 1,871 1,755 2,163 2,698 2,747 2,732 2,649448
796 9681,288
1,849 1,972 2,079 2,113
676
1,037 1,285
2,533
0
1,000
2,000
3,000
4,000
5,000
1970 1980 1990 2000 2006 2007 2008 20090
1970 1980 1990 2000 2006 2007 2008 2009
Tanker Dry Bulk Others
35,000
40,000
45,000
50,000
15,000
20,000
25,000
30,000
35,000
0
5,000
10,000
15,000
Brazil China India Japan Russia United States
European Union
Brazil China India Japan Russia United States
European Union
2000 2005 2008 2009 2010
United Nations Department of Economic and Social Affairs/Population Division 3 World Urbanization Prospects: The 2009 Revision
Figure II. Urban and rural populations by development group, 1950-2050
0.0
1000.0
2000.0
3000.0
4000.0
5000.0
6000.0
1950 1960 1970 1980 1990 2000 2010 2020 2030 2040 2050
Year
Popu
latio
n (m
illion
s)
More developed regions, urban population Less developed regions, urban population
More developed regions, rural population Less developed regions, rural population
TABLE 1. TOTAL, URBAN AND RURAL POPULATIONS BY DEVELOPMENT GROUP, SELECTED PERIODS, 1950-2050
Population (billion) Average annual rate of change (percentage)
Development group 1950 1975 2009 2025 2050 1950-1975 1975-2009 2009-2025 2025-2050
Total population
World.................................... 2.53 4.06 6.83 8.01 9.15 1.89 1.53 1.00 0.53
More developed regions.... 0.81 1.05 1.23 1.28 1.28 1.02 0.48 0.22 -0.01
Less developed regions..... 1.72 3.01 5.60 6.73 7.87 2.25 1.82 1.16 0.63
Urban population
World.................................... 0.73 1.51 3.42 4.54 6.29 2.91 2.40 1.76 1.31
More developed regions.... 0.43 0.70 0.92 1.01 1.10 1.97 0.82 0.58 0.33
Less developed regions..... 0.30 0.81 2.50 3.52 5.19 3.96 3.30 2.15 1.55
Rural population
World.................................... 1.80 2.55 3.41 3.48 2.86 1.39 0.85 0.12 -0.77
More developed regions.... 0.39 0.35 0.31 0.26 0.18 -0.39 -0.35 -1.01 -1.62Less developed regions..... 1.41 2.20 3.10 3.21 2.69 1.77 1.01 0.22 -0.71
5
EnergyDespite attempts to find alternative fuel sources, fossil fuels still dominate global energy needs. More and more these resources are being exploited offshore, which increases demand for dredging services. Dredging is needed to prepare the seabed and dig trenches for pipelines, and then protect these pipelines by backfilling with sand, gravel and rock. The strong increase in the demand for liquefied natural gas (LNG) is frequently being exported from remote locations. This necessitates new port infrastructures, thus creating a maritime infrastructure demand of its own. On the sustainable side, more and more wind farms are being placed at sea. In 2010, energy-related dredging accounted for an estimated 15% of the total dredging market.
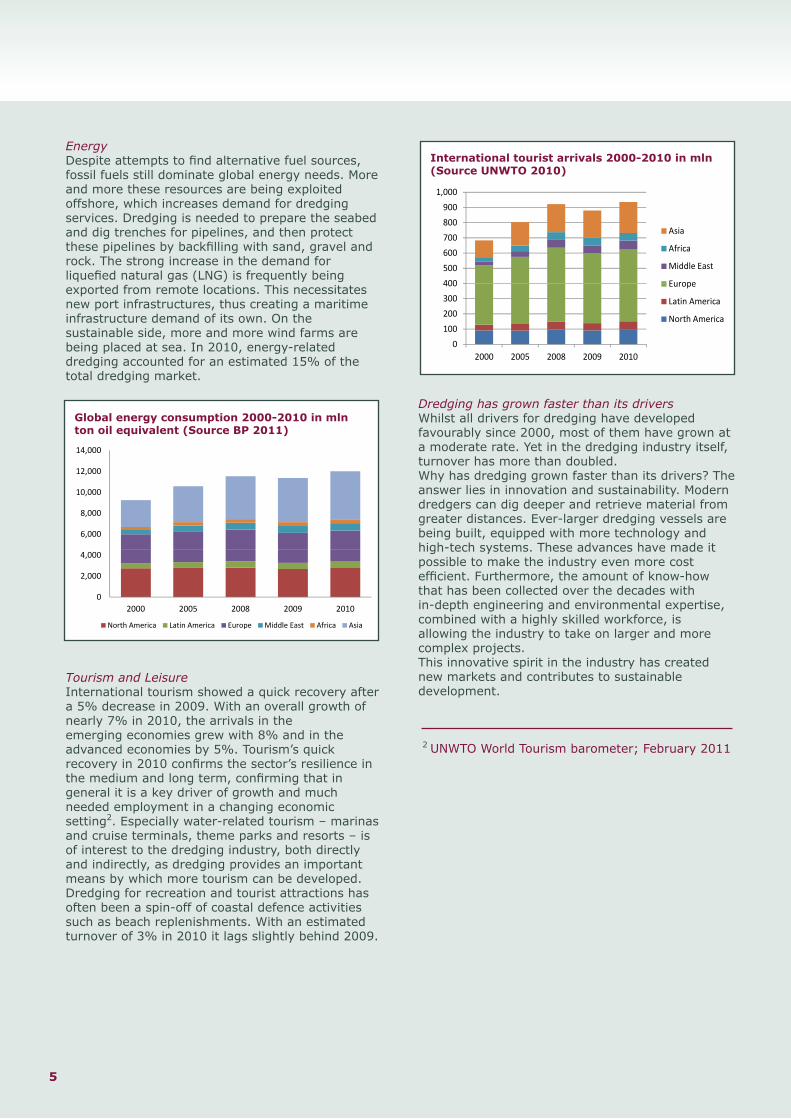
Tourism and LeisureInternational tourism showed a quick recovery after a 5% decrease in 2009. With an overall growth of nearly 7% in 2010, the arrivals in the emerging economies grew with 8% and in the advanced economies by 5%. Tourism’s quick recovery in 2010 confirms the sector’s resilience in the medium and long term, confirming that in general it is a key driver of growth and much needed employment in a changing economic setting2. Especially water-related tourism – marinas and cruise terminals, theme parks and resorts – is of interest to the dredging industry, both directly and indirectly, as dredging provides an important means by which more tourism can be developed. Dredging for recreation and tourist attractions has often been a spin-off of coastal defence activities such as beach replenishments. With an estimated turnover of 3% in 2010 it lags slightly behind 2009.
Dredging has grown faster than its driversWhilst all drivers for dredging have developed favourably since 2000, most of them have grown at a moderate rate. Yet in the dredging industry itself, turnover has more than doubled. Why has dredging grown faster than its drivers? The answer lies in innovation and sustainability. Modern dredgers can dig deeper and retrieve material from greater distances. Ever-larger dredging vessels are being built, equipped with more technology and high-tech systems. These advances have made it possible to make the industry even more cost efficient. Furthermore, the amount of know-how that has been collected over the decades with in-depth engineering and environmental expertise, combined with a highly skilled workforce, is allowing the industry to take on larger and more complex projects.This innovative spirit in the industry has created new markets and contributes to sustainable development.
2 UNWTO World Tourism barometer; February 2011
Global energy consumption 2000-2010 in mln ton oil equivalent (Source BP 2011)
International tourist arrivals 2000-2010 in mln(Source UNWTO 2010)
400
500
600
700
800
900
1,000
Asia
Africa
Middle East
Europe
0
100
200
300
400
2000 2005 2008 2009 2010
Europe
Latin America
North America
6,000
8,000
10,000
12,000
14,000
0
2,000
4,000
2000 2005 2008 2009 2010
North America Latin America Europe Middle East Africa Asia

6
Development capacity 2000–2010Dredging is carried out with a variety of specially developed equipment, that come in many sizes and types. Dredging equipment, classified according to the methods of excavation and operation, can be grouped into the following main categories: • mechanical dredgers (backhoes, grab and dipper dredgers) are well suited to removing hard-packed material or debris and to working in confined areas.
• hydraulic dredgers (hopper and cutter dredgers) add large amounts of process water and thus change the original structure of sediments; they “slurry the sediment”. Transport methods associated with hydraulic dredgers are pipeline and hopper transport. In some cases, hydraulic dredgers may pump the materials into barges for transport.
The selection of dredging equipment for a particular project will depend on a combination of factors including the type of physical environment, the method of placement, the distance to the disposal site as well as the nature, quantity and quality of the material to be dredged.
Analysing the developments in capacity of dredging equipment is a difficult task. Many dredging vessels are inland vessels and may not be mentioned in any ship register. For obvious reasons these are not included in our calculations. In addition, comparing
the capacity of different types of equipment, e.g., a backhoe with a trailing suction hopper dredger, or older vessels with high-tech, newly built vessels can be challenging, therefore we do not attempt to do this. This analysis focuses solely on the main types of equipment: • trailing suction hopper dredgers (TSHD), • cutter suction dredgers (CSD) and • backhoe/grab/dipper dredgers.
In this analysis the following vessels have been identified as being active in 2010: a total of 1,481 vessels comprising 311 backhoes, 565 CSDs and 604 TSHDs. For TSHDs capacity is measured in deadweight tonnage (carrying capacity), for CSDs and backhoes in total installed diesel power in kW. Vessels are further categorised by type of owner: • state- and/or port-owned plant, • private dredging contractors that are members of IADC, and • other private dredging contractors, whether operating in free or in closed markets. In closed markets only homeland contractors may bid for a government tender.
The total industry capacity of TSHDs has increased by 62% since 2000 to 3.6 mln deadweight tonnes in 2010, which is an average increase of nearly 4% per annum over the last decade.From 2000 to 2010 the share of IADC member companies in TSHD capacity increased from 41% to 44%. Most of this increase is due to medium, large and jumbo high-tech vessels. The increase in state- and/or port-owned vessels is substantially related to China.
The total capacity of CSDs has increased with 75% since 2000 to 2.6 mln installed kW in 2010, which is an average increase of 4,3% per annum over the last decade.
Total capacity TSHD 2000-2010 in DWT

7
New, larger ocean-going CSDs have been added to supplement older cutter fleets. The growth of state- and/or port-owned CSDs since 2000 is nearly all related to China.
Since 2000, the total capacity of backhoe/grab/dip-per dredgers has increased with 41% to 295,000 total installed kW in 2010, which is an average increase of nearly 3% per annum over the last decade.IADC members’ capacity increased with 111% up to 83.000 kW.
55%
26%
28%
50%
22%80,000
100,000
120,000
140,000
160,000
2000
2010yin kW
19%
26%
0
20,000
40,000
60,000
IADC Other private State & Ports
2010
Capa
city
Total capacity CSD 2000-2010 in kW
Total capacity backhoe/grab/dipper 2000-2010 in kW
35%
44%
31%
38%
31%
600,000
800,000
1,000,000
1,200,000
2000
2010tyin kW
21%
0
200,000
400,000
IADC Other private State & Ports
2010
Capa
ci

8
Regional market size In 2010, the Middle East, Europe and China were the largest dredging markets representing 59% of global turnover. For this review, Europe includes Turkey, Western Russia and the Black Sea countries. Eastern Russia, Caspian Sea countries, Japan and SE Asia are included in Asia.
Since 2000, the global dredging turnover has nearly tripled. However, compared to 2009, turnover in 2010 decreased slightly by 2%. Not all regional markets have developed at the same pace. Compared to 2009, the Middle East market dropped by more than 40%. As far as can be estimated, the Chinese market grew by 15% from 2009 to 2010. Part of this growth may be the result of more comprehensive data response. The Australian market again showed an increase of over 20% from 2009 to 2010. Dredging turnover in Europe remained fairly stable.
The volume of dredging executed by state- and/or port-owned companies as well as dredging projects closed to international tenders is still substantial, with China as number 1 and the USA number 2. In China, some projects are open for international tenders. The USA market is effectively closed by the
Jones Act, which makes it impossible for a non-USA owned and controlled contractor to tender. In India, state-owned DCI has a preferred position in public tendering, although historically foreign companies from time to time have been active in the private sector. Globally, the market share of these closed markets was 42% in 2010.
The market share of private contractors that are members of IADC increased over the last decade from 43% in 2000 to 52% in 2010. When looking only at markets with free access, IADC members represent a total of 89% market share in 2010 (2000: 75%)
Quantity of dredged materialDredging around the world in financial terms, such as turnover, is quantifiable. However, the total quantity of cubic metres dredged annually is not published by the industry as it makes little sense to do so. Dredging a cubic metre of silt cannot be compared to dredging a cubic metre of rock. Furthermore, the total quantity of material dredged annually depends heavily on the specific project and circumstances (e.g.: soil, accessibility, sailing distances to borrow areas), which have a large impact on production.
Turnover 2010 global dredging market per area in mln €
Dredging market shares 2010 of total market € 10,820 mln
5,62952%
4,49542%
Open markets IADC members
Open markets non IADC members
6966%
Closed markets
freemarkets
closedmarkets
Africa 805 75Central/South America 960 35Australia 605 0Europe 1,820 30Middle East 1,155 45India 355 150Asia 600 260China 0 2,975North America 25 925
total * 6,325 4,495
58% 42%
*) of which stone works € 400 mln
505860
2,975950
10,820
total 2010
880995605
1,8501,200
9
Definitions and methodologyThis review relates to the annual turnover estimated for 2010. ‘Carried out in 2010’ therefore does not necessarily mean ‘contract awarded in 2010’, nor that payment was received in 2010. It only reflects work that was actually performed in 2010. For projects only partially performed in 2010 (e.g.: a project started on 1-1-2009 and finalised on 30-6-2010), the value of the part actually executed in 2010 has been attributed.Dredging projects in inland waterways – as far as known – are included in the survey as well as stone protection works for quay walls and coastal protection (excluding stone dumping through FFP vessels and stone-dumpers). Only ‘wet work’ has been calculated in the figures so no land-based ‘dry’ engineering works are included. Ecological measures and remedial dredging as such are integrated in the other categories.
Types of projectsTrade: • harbour extensions, excluding offshore crude oil terminals and LNG terminals (see Energy) and excluding marinas and cruise terminals (see Tourism and Leisure)• navigation channels• maintenance dredging
Coastal defence: • beach replenishment• dike building/raising and flood defence works (wet work only)• other shore protection measures
Urban development: • land reclamation for, e.g.: - industrial infrastructure (oil refineries, chemical plants, waste treatment plants, waste disposal sites, waste water treatment plants, water desalination plants, power plants) - trade and service infrastructure (trade fairs, business parks, conference centres) - transport infrastructure (airports, roads, parking facilities, rail projects) - residential real estate (housing driven by demographical pressure)• immersed tunnels, dams and bridges• outfalls• controlled storage building for contaminated materials
Energy: • offshore crude oil terminals and LNG terminals• cables and pipelines (including backfilling and protection)• dredging related to oil drilling facilities (e.g.: platforms, glory holes)• other offshore installations (e.g.: wind farms)
Tourism: • recreation (theme parks, recreation piers/wharfs, shopping malls)• marinas and cruise terminals• land reclamation for hotels, holiday resorts, beaches
Methodology Dredging in Figures has been carefully compiled by a Delphi survey amongst IADC members, analyses of company reports and other (public) sources. All information has been verified to the best of our ability, but IADC and its members cannot be held responsible for any inaccuracies. The review does not necessarily reflect the opinions of individual IADC members. Please contact IADC if you wish to reproduce any or all information in this review either electronically and/or in any other form.
For further enquiries, please contact the IADC Secretariat:tel: +31(0)70 352 33 34 e-mail: [email protected]
IADC stands for “International Association of Dredging Companies” and is the global umbrella organisation for contractors in the private dredging industry. As such IADC is dedicated to promoting the skills, integrity and reliability of its members, as well as the contributions of the dredging industry to worldwide prosperity in general. IADC has over one hundred main and associated members. Together they represent the forefront of the dredging industry.

IADCAlexanderveld 842585 DB The HagueThe Netherlands
Tel: +31(0)70 352 33 34
E-mail: [email protected] Website: www.iadc-dredging.com
Design: Renato Rauwerda (IADC)