Embed Size (px)
Citation preview
Environmental Health Perspectives • volume 118 | number 8 | August 2010 1173
Review
The first epidemiologic studies on the impact of air pollution on health were undertaken as a consequence of the extreme pollution episodes that took place in the decades from 1930 to 1960. The association between air pollution and certain health variables was made clear by simple graphic representations or by compari-sons of mortality rates for these time periods (Firket 1931; Logan 1953). Since that time, air pollution levels have fallen substantially, such that, to evaluate their effects on health, longer time series are required. To this end, epidemiologists began to use dynamic regres-sion models in the 1970s that consisted of models in which the relationship between the dependent and explanatory variables were dis-tributed over time, rather than being expected to occur simultaneously. Moreover, investiga-tors were able to control for residual auto-correlation, with the error being specified by means of autoregressive integrated moving-average models (ARIMA). The problem with these types of models is that they assume that the dependent variable is distributed normally, which, in fact, is extremely rare in the daily outcome count variables of morbidity and mortality events (Saez et al. 1999).
The early 1990s saw the appearance of linear models based on Poisson regression, in which a parametric approach was used to con-trol for trend and seasonality because the event counts more typically have a Poisson distribu-tion. These models use the variable “time” and its transforms, quadratic and sinusoidal func-tions (sine or cosine) of different frequency and amplitude, to control for the effect on the dependent variable (mortality or morbidity) of unmeasured variables that may vary seasonally, such as in pollen concentration, meteorologi-cal variables, and influenza outbreaks, or that may have a trend, such as changes in a city’s population distribution, in order to ascertain the effect of such variables on the dependent variable (Saez et al. 1999). Insofar as changes in a city’s population pyramid are concerned, Poisson regression is particularly useful only when cases, rather than the entire popula-tion, can be enumerated, because this form of regression analysis does not require knowledge of the denominator as long as population flux is in steady state (Loomis et al 2005).
Nevertheless, Poisson regression poses the problem that, if any of these unmeasured vari-ables follows a cyclical component of varying
frequency and width (as might be the case of pollen concentration or influenza), the para-metric functions of time or of its sinusoidal transforms cannot be easily “adapted” to such changes. These limitations led to the develop-ment of nonparametric Poisson regression with the application of generalized additive models (GAMs) that use nonparametric func-tions of the variable “time” (Kelsall et al. 1997), which adapt flexibly to the irregular cyclic components of unmeasured variables and allow for flexible fits for important vari-ables, such as temperature, barometric pres-sure, and relative humidity, thus reducing any potential confounding due to these factors.
One difficulty with this method is that the number of degrees of freedom of the smoothed nonparametric function must be specified by the researcher, with discrepancies arising as to the most appropriate way to calculate this. Because inappropriate determination of the number of degrees of freedom can lead to bias in the estimates of nonparametric Poisson designs, epidmiologists focused on the case-crossover (CCO) design that purported to con-trol time trends.The CCO design was proposed by Maclure (1991) to identify risk factors of acute events; it is characterized by the fact that each subject serves as his or her own control by assessing referent exposure at a point in time prior to the event. By virtue of its design, this type of study controls for the influence of con-founding variables that remain constant in the subject at both dates, that of the event and that
Addre s s cor re spondence to A . F igue i ra s , Departamento de Medicina Preventiva y Salud Pública, Facultad de Medicina, c/ San Francisco s/n, 15786 Santiago de Compostela (A Coruña), Spain. Telephone: 34-981-581-237/34-981-951-192. Fax: 34-981-572-282. E-mail: [email protected]
We thank M. Benedict for his help with the English version of this article.
This study was supported by grant CIBERESP-MET-007 from the Consortium for Biomedical Research in Epidemiology and Public Health [CIBER en Epidemiología y Salud Pública (CIBERESP)], Spain. A.T. was funded by project PI080354 [Fondo de Investigaciones Sanitarias (FIS)] of the Subdirectorate-General for Research Evaluation and Development and by project 200930I008 [Consejo Superior de Investigaciones Científicas (CSIC)].
The authors declare they have no actual or potential competing financial interests.
Received 21 September 2009; accepted 31 March 2010.
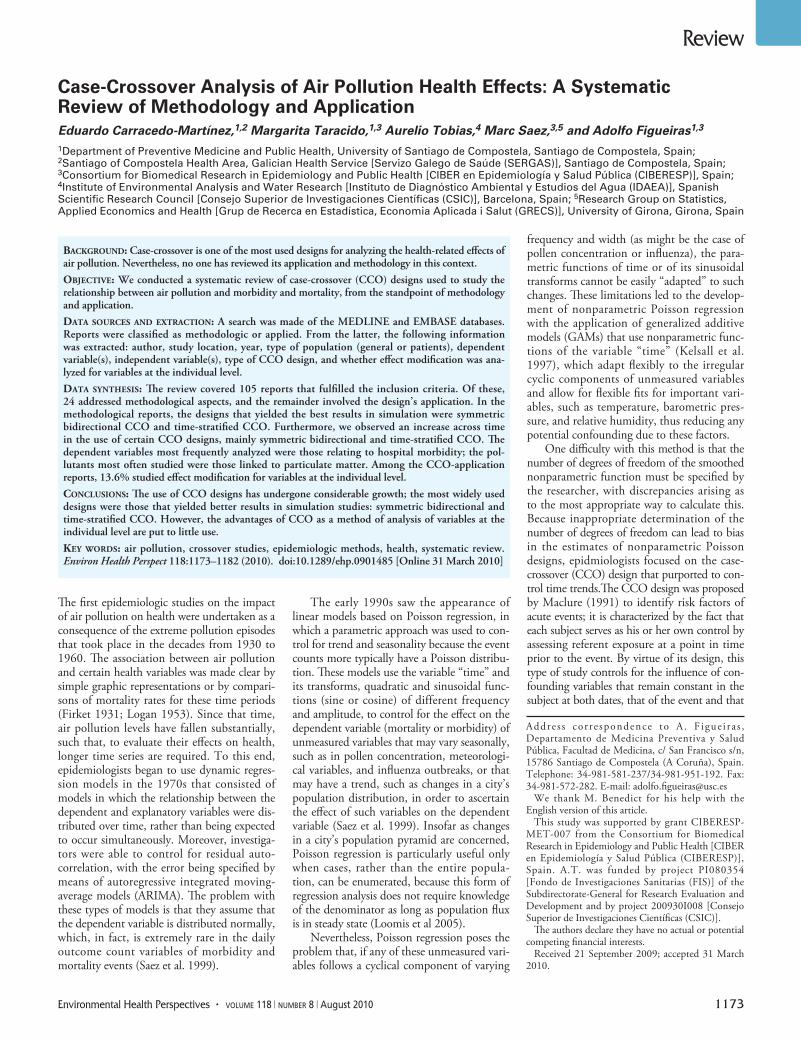
Case-Crossover Analysis of Air Pollution Health Effects: A Systematic Review of Methodology and ApplicationEduardo Carracedo-Martínez,1,2 Margarita Taracido,1,3 Aurelio Tobias,4 Marc Saez,3,5 and Adolfo Figueiras1,3
1Department of Preventive Medicine and Public Health, University of Santiago de Compostela, Santiago de Compostela, Spain; 2Santiago of Compostela Health Area, Galician Health Service [Servizo Galego de Saúde (SERGAS)], Santiago de Compostela, Spain; 3Consortium for Biomedical Research in Epidemiology and Public Health [CIBER en Epidemiología y Salud Pública (CIBERESP)], Spain; 4Institute of Environmental Analysis and Water Research [Instituto de Diagnóstico Ambiental y Estudios del Agua (IDAEA)], Spanish Scientific Research Council [Consejo Superior de Investigaciones Científicas (CSIC)], Barcelona, Spain; 5Research Group on Statistics, Applied Economics and Health [Grup de Recerca en Estadística, Economia Aplicada i Salut (GRECS)], University of Girona, Girona, Spain
Background: Case-crossover is one of the most used designs for analyzing the health-related effects of air pollution. Nevertheless, no one has reviewed its application and methodology in this context.
oBjective: We conducted a systematic review of case-crossover (CCO) designs used to study the relationship between air pollution and morbidity and mortality, from the standpoint of methodology and application.
data sources and extraction: A search was made of the MEDLINE and EMBASE databases.Reports were classified as methodologic or applied. From the latter, the following information was extracted: author, study location, year, type of population (general or patients), dependent variable(s), independent variable(s), type of CCO design, and whether effect modification was ana-lyzed for variables at the individual level.
data synthesis: The review covered 105 reports that fulfilled the inclusion criteria. Of these, 24 addressed methodological aspects, and the remainder involved the design’s application. In the methodological reports, the designs that yielded the best results in simulation were symmetric bidirectional CCO and time-stratified CCO. Furthermore, we observed an increase across time in the use of certain CCO designs, mainly symmetric bidirectional and time-stratified CCO. The dependent variables most frequently analyzed were those relating to hospital morbidity; the pol-lutants most often studied were those linked to particulate matter. Among the CCO-application reports, 13.6% studied effect modification for variables at the individual level.
conclusions: The use of CCO designs has undergone considerable growth; the most widely used designs were those that yielded better results in simulation studies: symmetric bidirectional and time-stratified CCO. However, the advantages of CCO as a method of analysis of variables at the individual level are put to little use.
key words: air pollution, crossover studies, epidemiologic methods, health, systematic review. Environ Health Perspect 118:1173–1182 (2010). doi:10.1289/ehp.0901485 [Online 31 March 2010]
Carracedo-Martínez et al.
1174 volume 118 | number 8 | August 2010 • Environmental Health Perspectives
of the referent time, such as sex, smoking his-tory, occupational history, and genetics. This design was initially used to assess the effect of exposures measured at an individual level (tele-phone calls and traffic accidents, physical or sexual activity, and acute myocardial infarction) and was not applicable to exposures with a time trend, such as air pollution. Thus, if an inves-tigator selected exposure control dates before the effect, and there was a trend, prior expo-sures would be systematically higher or lower than at the date of the effect. To circumvent this bias, Navidi (1998) developed a variant of this design, bidirectional CCO, which is con-ceptually characterized by having control time periods before and after the event, something that made it possible to control for the effect of long-term trend and seasonality on the vari-able “exposure.” This design was already appro-priate for ecologic-type exposures, such as air pollution, because the existence of registries means that the values of such exposure can be ascertained even after the event. In addition, pollution values are not affected by the presence of prior morbidity and mortality events. In the CCO design, the referent time periods rep-resent the counterfactual exposure experience of the individual, had he or she not become sick; because in air pollution pre- and postevent exposure values are independent of the hazard-period exposure, those that are postevent ref-erent can be appropriate. One advantage of CCO design over Poisson regression is its abil-ity to assess potential effect modification (i.e., statistical interaction) at the individual level rather than at the group level (Figueiras et al. 2005). As an alternative analytic methodol-ogy to Poisson regression, the CCO approach allows for direct modeling of interaction terms, rather than depending on multiple subgroup analyses (Figueiras et al. 2005).
We conducted a systematic review of the CCO design used to study the relationship between air pollution and morbidity and mortality, from both a methodologic and an applied standpoint.
Materials and MethodsWe conducted a bibliographic search in January 2009 using the MEDLINE (National Library of Medicine, Bethesda, MD, USA) and EMBASE (Elsevier, New York, NY, USA) databases and the key words case-crossover* and pollution*; the time frame was 1999 through 2008. From the total number of papers, we selected a series of reports based on the language used and the topic addressed in the title and/or abstract, thereby eliminat-ing all that were not written in English or Spanish and that did not address the subject targeted for study. All the reports chosen in this way were reviewed, and additional reports were selected from among those cited in the respective references.
The reports retrieved were classified into two major groups: methodology reports in which new CCO designs were described or existing designs compared, generally by means of simulation studies, and application reports, in which some CCO design was applied for the purpose of analyzing the relationship between air pollution and health.
The methodology reports were in turn classified into those that conducted simula-tion studies to compare CCO designs with one another or with other designs, such as Poisson time-series, and those that described theoretical aspects pertaining to CCO design.
From the application reports, the fol-lowing data were obtained for comparison: author, study location, year, dependent variable(s), independent variable(s), and type of CCO design (unidirectional, symmetric, semisymmetric, or time stratified). The mod-eling of interaction terms between pollut-ants and the individual characteristics of the subjects was also assessed, to record whether the reports had analyzed effect modification. For this purpose, only interactions with sub-jects’ individual variables were considered, with the following deemed ineligible: stud-ies only reporting interactions between pol-lutants and pollen, meteorological variables, or other pollutants; and stratified analyses in which different models were constructed for each subgroup and no interaction term was included in a single model.
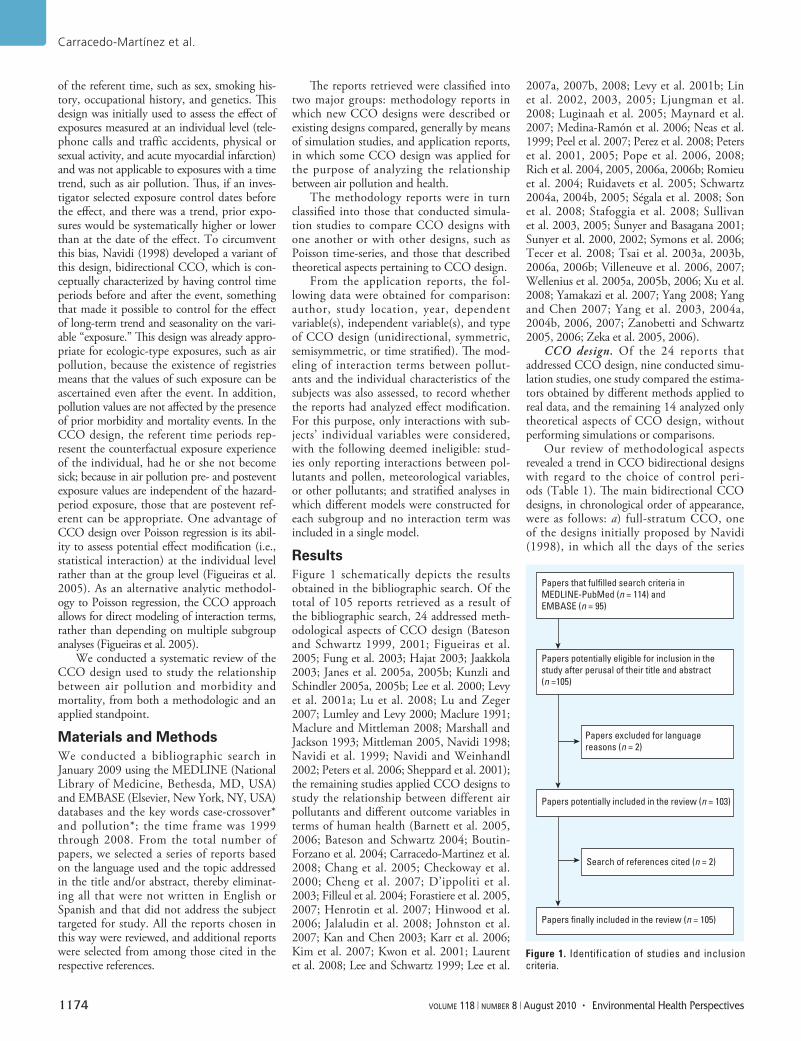
ResultsFigure 1 schematically depicts the results obtained in the bibliographic search. Of the total of 105 reports retrieved as a result of the bibliographic search, 24 addressed meth-odological aspects of CCO design (Bateson and Schwartz 1999, 2001; Figueiras et al. 2005; Fung et al. 2003; Hajat 2003; Jaakkola 2003; Janes et al. 2005a, 2005b; Kunzli and Schindler 2005a, 2005b; Lee et al. 2000; Levy et al. 2001a; Lu et al. 2008; Lu and Zeger 2007; Lumley and Levy 2000; Maclure 1991; Maclure and Mittleman 2008; Marshall and Jackson 1993; Mittleman 2005, Navidi 1998; Navidi et al. 1999; Navidi and Weinhandl 2002; Peters et al. 2006; Sheppard et al. 2001); the remaining studies applied CCO designs to study the relationship between different air pollutants and different outcome variables in terms of human health (Barnett et al. 2005, 2006; Bateson and Schwartz 2004; Boutin-Forzano et al. 2004; Carracedo-Martinez et al. 2008; Chang et al. 2005; Checkoway et al. 2000; Cheng et al. 2007; D’ippoliti et al. 2003; Filleul et al. 2004; Forastiere et al. 2005, 2007; Henrotin et al. 2007; Hinwood et al. 2006; Jalaludin et al. 2008; Johnston et al. 2007; Kan and Chen 2003; Karr et al. 2006; Kim et al. 2007; Kwon et al. 2001; Laurent et al. 2008; Lee and Schwartz 1999; Lee et al.
2007a, 2007b, 2008; Levy et al. 2001b; Lin et al. 2002, 2003, 2005; Ljungman et al. 2008; Luginaah et al. 2005; Maynard et al. 2007; Medina-Ramón et al. 2006; Neas et al. 1999; Peel et al. 2007; Perez et al. 2008; Peters et al. 2001, 2005; Pope et al. 2006, 2008; Rich et al. 2004, 2005, 2006a, 2006b; Romieu et al. 2004; Ruidavets et al. 2005; Schwartz 2004a, 2004b, 2005; Ségala et al. 2008; Son et al. 2008; Stafoggia et al. 2008; Sullivan et al. 2003, 2005; Sunyer and Basagana 2001; Sunyer et al. 2000, 2002; Symons et al. 2006; Tecer et al. 2008; Tsai et al. 2003a, 2003b, 2006a, 2006b; Villeneuve et al. 2006, 2007; Wellenius et al. 2005a, 2005b, 2006; Xu et al. 2008; Yamakazi et al. 2007; Yang 2008; Yang and Chen 2007; Yang et al. 2003, 2004a, 2004b, 2006, 2007; Zanobetti and Schwartz 2005, 2006; Zeka et al. 2005, 2006).
CCO design. Of the 24 reports that addressed CCO design, nine conducted simu-lation studies, one study compared the estima-tors obtained by different methods applied to real data, and the remaining 14 analyzed only theoretical aspects of CCO design, without performing simulations or comparisons.
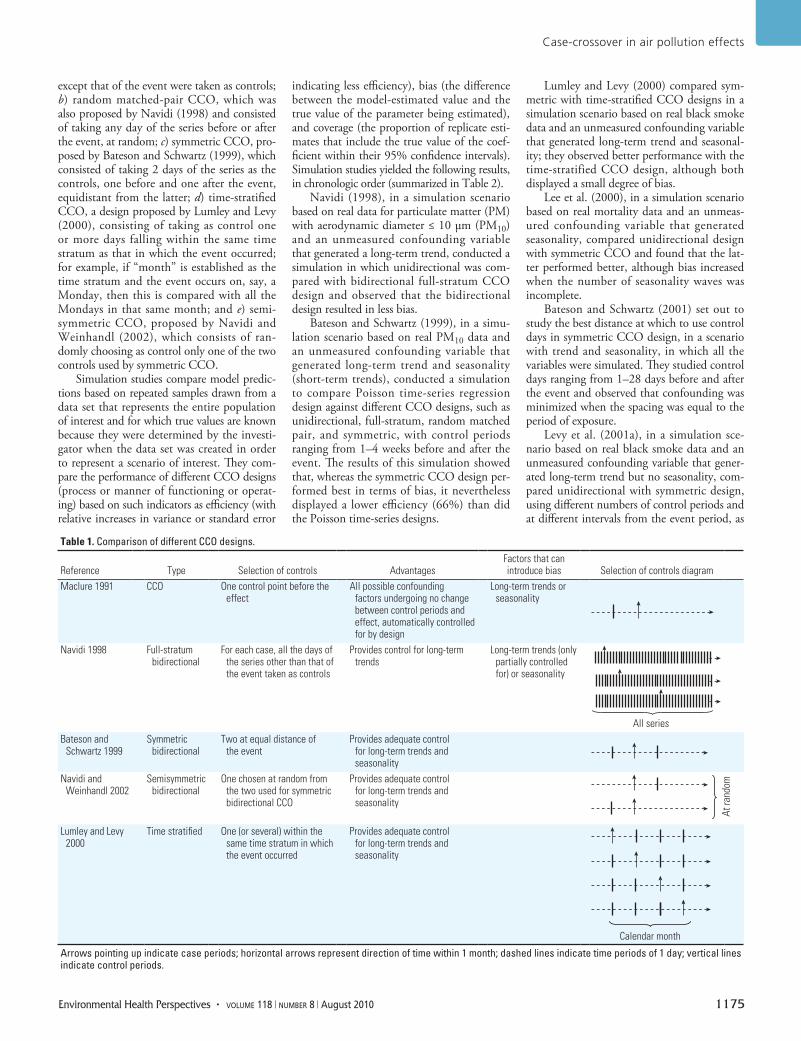
Our review of methodological aspects revealed a trend in CCO bidirectional designs with regard to the choice of control peri-ods (Table 1). The main bidirectional CCO designs, in chronological order of appearance, were as follows: a) full-stratum CCO, one of the designs initially proposed by Navidi (1998), in which all the days of the series
Figure 1. Identification of studies and inclusion criteria.
Papers potentially included in the review (n = 103)
Search of references cited (n = 2)
Papers finally included in the review (n = 105)
Papers potentially eligible for inclusion in the study after perusal of their title and abstract (n =105)
Papers excluded for language reasons (n = 2)
Papers that fulfilled search criteria in MEDLINE-PubMed (n = 114) and EMBASE (n = 95)
Case-crossover in air pollution effects
Environmental Health Perspectives • volume 118 | number 8 | August 2010 1175
except that of the event were taken as controls; b) random matched-pair CCO, which was also proposed by Navidi (1998) and consisted of taking any day of the series before or after the event, at random; c) symmetric CCO, pro-posed by Bateson and Schwartz (1999), which consisted of taking 2 days of the series as the controls, one before and one after the event, equidistant from the latter; d) time-stratified CCO, a design proposed by Lumley and Levy (2000), consisting of taking as control one or more days falling within the same time stratum as that in which the event occurred; for example, if “month” is established as the time stratum and the event occurs on, say, a Monday, then this is compared with all the Mondays in that same month; and e) semi-symmetric CCO, proposed by Navidi and Weinhandl (2002), which consists of ran-domly choosing as control only one of the two controls used by symmetric CCO.
Simulation studies compare model predic-tions based on repeated samples drawn from a data set that represents the entire population of interest and for which true values are known because they were determined by the investi-gator when the data set was created in order to represent a scenario of interest. They com-pare the performance of different CCO designs (process or manner of functioning or operat-ing) based on such indicators as efficiency (with relative increases in variance or standard error
indicating less efficiency), bias (the difference between the model-estimated value and the true value of the parameter being estimated), and coverage (the proportion of replicate esti-mates that include the true value of the coef-ficient within their 95% confidence intervals). Simulation studies yielded the following results, in chronologic order (summarized in Table 2).
Navidi (1998), in a simulation scenario based on real data for particulate matter (PM) with aerodynamic diameter ≤ 10 μm (PM10) and an unmeasured confounding variable that generated a long-term trend, conducted a simulation in which unidirectional was com-pared with bidirectional full-stratum CCO design and observed that the bidirectional design resulted in less bias.
Bateson and Schwartz (1999), in a simu-lation scenario based on real PM10 data and an unmeasured confounding variable that generated long-term trend and seasonality (short-term trends), conducted a simulation to compare Poisson time-series regression design against different CCO designs, such as unidirectional, full-stratum, random matched pair, and symmetric, with control periods ranging from 1–4 weeks before and after the event. The results of this simulation showed that, whereas the symmetric CCO design per-formed best in terms of bias, it nevertheless displayed a lower efficiency (66%) than did the Poisson time-series designs.
Lumley and Levy (2000) compared sym-metric with time-stratified CCO designs in a simulation scenario based on real black smoke data and an unmeasured confounding variable that generated long-term trend and seasonal-ity; they observed better performance with the time-stratified CCO design, although both displayed a small degree of bias.
Lee et al. (2000), in a simulation scenario based on real mortality data and an unmeas-ured confounding variable that generated seasonality, compared unidirectional design with symmetric CCO and found that the lat-ter performed better, although bias increased when the number of seasonality waves was incomplete.
Bateson and Schwartz (2001) set out to study the best distance at which to use control days in symmetric CCO design, in a scenario with trend and seasonality, in which all the variables were simulated. They studied control days ranging from 1–28 days before and after the event and observed that confounding was minimized when the spacing was equal to the period of exposure.
Levy et al. (2001a), in a simulation sce-nario based on real black smoke data and an unmeasured confounding variable that gener-ated long-term trend but no seasonality, com-pared unidirectional with symmetric design, using different numbers of control periods and at different intervals from the event period, as
Table 1. Comparison of different CCO designs.
Reference Type Selection of controls AdvantagesFactors that can introduce bias Selection of controls diagram
Maclure 1991 CCO One control point before the effect
All possible confounding factors undergoing no change between control periods and effect, automatically controlled for by design
Long-term trends or seasonality
Navidi 1998 Full-stratum bidirectional
For each case, all the days of the series other than that of the event taken as controls
Provides control for long-term trends
Long-term trends (only partially controlled for) or seasonality
All seriesBateson and
Schwartz 1999Symmetric
bidirectionalTwo at equal distance of
the eventProvides adequate control
for long-term trends and seasonality
Navidi and Weinhandl 2002
Semisymmetric bidirectional
One chosen at random from the two used for symmetric bidirectional CCO
Provides adequate control for long-term trends and seasonality
At r
ando
m
Lumley and Levy 2000
Time stratified One (or several) within the same time stratum in which the event occurred
Provides adequate control for long-term trends and seasonality
Calendar month
Arrows pointing up indicate case periods; horizontal arrows represent direction of time within 1 month; dashed lines indicate time periods of 1 day; vertical lines indicate control periods.
Carracedo-Martínez et al.
1176 volume 118 | number 8 | August 2010 • Environmental Health Perspectives
well as the influence of auto correlation (cor-relation of a temporal series variable with its own previous or posterior values) between control periods and overlapping (bias result-ing from the use of incorrect referent peri-ods), and concluded that the symmetric CCO design performed better, with less bias when the distance of the control periods from the event was 7 days and when auto correlation and overlapping were avoided.
Navidi and Weinhandl (2002) conducted a simulation in a scenario based on real PM10 data and an unmeasured confounding variable that generated long-term trend and seasonal-ity, in which they compared Poisson time-series design with the following CCO designs: symmetric with control periods separated by 7 days with respect to the case date, semi-symmetric with the control period separated by 7 days with respect to the case date, ran-dom matched pair, and full-stratum. They concluded that the semisymmetric design per-formed best.
Fung et al. (2003) conducted a simulation in a simulation scenario based on real PM with aerodynamic diameter ≤ 2.5 μm (PM2.5) data and an unmeasured confounding vari-able that generated long-term trend and sea-sonality, in which they compared Poisson time-series design against uni directional, sym-metric, and semisymmetric CCO designs. They concluded that, although the symmet-ric design displayed a better performance in terms of bias than did the other designs studied, it was none theless similar to that of the Poisson time-series design, which showed a better coverage and statistical power thanks to its greater efficiency.
Figueiras et al. (2005), in a simulation study that used a simulation scenario based on real PM10 data and an unmeasured confound-ing variable that could generate long-term trend and seasonality, compared the Poisson time-series design with a number of CCO
designs: symmetric, semisymmetric, time stratified, full symmetric (14 control periods before and after event) analyzed by longitu-dinal designs, and full semisymmetric (seven control periods before and after event) ana-lyzed by longitudinal designs. They reported that the full semisymmetric design displayed the least bias together with the best cover-age and statistical power but proved unstable when the beta value (strength of association between the pollutant and the event) varied with respect to the usual values. Although semisymmetric CCO displayed fewer biases than did symmetric or time-stratified CCO (both of which yielded similar results), it suf-fered from the drawback of having a lower statistical power.
It is particularly interesting to note that three of these simulation studies (Bateson and Schwartz 1999; Figueiras et al. 2005; Navidi and Weinhandl 2002) generated data for simulations using the same equations to
determine trend and seasonality, before going on to use different real pollution data, such that comparable scenarios were investigated by each set of investigators.
In a separate study, Peters et al. (2006) analyzed a real database by means of a CCO and an alternative design (Poisson time-series design or Cox regression analysis) and then compared the results, observing that the time-stratified CCO design yielded results and conclusions similar to those of the Poisson time-series design and Cox regression analysis.
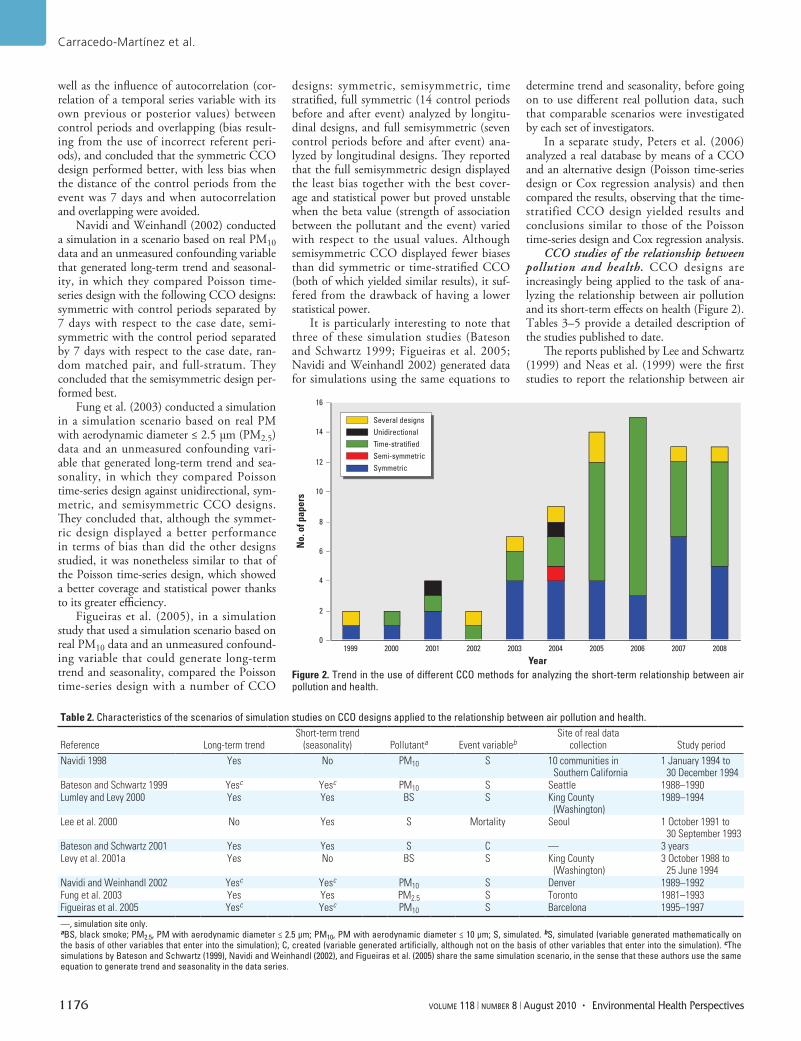
CCO studies of the relationship between pollution and health. CCO designs are increasingly being applied to the task of ana-lyzing the relationship between air pollution and its short-term effects on health (Figure 2). Tables 3–5 provide a detailed description of the studies published to date.
The reports published by Lee and Schwartz (1999) and Neas et al. (1999) were the first studies to report the relationship between air
Table 2. Characteristics of the scenarios of simulation studies on CCO designs applied to the relationship between air pollution and health.
Reference Long-term trendShort-term trend
(seasonality) Pollutanta Event variablebSite of real data
collection Study periodNavidi 1998 Yes No PM10 S 10 communities in
Southern California1 January 1994 to
30 December 1994Bateson and Schwartz 1999 Yesc Yesc PM10 S Seattle 1988–1990Lumley and Levy 2000 Yes Yes BS S King County
(Washington)1989–1994
Lee et al. 2000 No Yes S Mortality Seoul 1 October 1991 to 30 September 1993
Bateson and Schwartz 2001 Yes Yes S C — 3 yearsLevy et al. 2001a Yes No BS S King County
(Washington)3 October 1988 to
25 June 1994Navidi and Weinhandl 2002 Yesc Yesc PM10 S Denver 1989–1992Fung et al. 2003 Yes Yes PM2.5 S Toronto 1981–1993Figueiras et al. 2005 Yesc Yesc PM10 S Barcelona 1995–1997
—, simulation site only.aBS, black smoke; PM2.5, PM with aerodynamic diameter ≤ 2.5 µm; PM10, PM with aerodynamic diameter ≤ 10 µm; S, simulated. bS, simulated (variable generated mathematically on the basis of other variables that enter into the simulation); C, created (variable generated artificially, although not on the basis of other variables that enter into the simulation). cThe simulations by Bateson and Schwartz (1999), Navidi and Weinhandl (2002), and Figueiras et al. (2005) share the same simulation scenario, in the sense that these authors use the same equation to generate trend and seasonality in the data series.
Figure 2. Trend in the use of different CCO methods for analyzing the short-term relationship between air pollution and health.
0
2
4
6
8
10
12
14
16
20001999 2001 2002 2003 2004 2005 2006 2007 2008
Year
No.
of p
aper
s
Several designsUnidirectionalTime-stratifiedSemi-symmetricSymmetric
Case-crossover in air pollution effects
Environmental Health Perspectives • volume 118 | number 8 | August 2010 1177
pollution and mortality using a CCO design. These studies performed a reanalysis of the effects of air pollution and mortality in the cities of Philadelphia and Seoul, respectively, and obtained a relationship that proved sta-tistically significant. These results are similar to those previously obtained with the Poisson time-series design and thus strengthen the relationship of causality, inasmuch as the same relationship was observed when different sta-tistical methods were applied.
Analysis of which CCO designs were most commonly used in the published reports showed that 7.7% of these were unidirectional and the remainder bidirectional. The most fre-quently used bidirectional designs were sym-metric (42.2% of studies) and time stratified (48.9% of studies). The semisymmetric bidi-rectional design was used in only one study. Figure 2 depicts the time trend in the use of the different CCO designs. Although unidirec-tional designs were used in the initial period, they were gradually discarded. Most of the published studies used a 1-day control period, but six studies used a 1-hr control period.
Most of the studies that employed sym-metric CCO designs used day 7 before and
after the event as the control days (n = 23), although a variety of other schemes were also used (Table 3). Studies that used time-stratified CCO typically selected a control day on the same day of the week during the same month as the event, although other schemes (e.g., select-ing days during the same month with compa-rable temperature) were also used (Table 4). Studies that used uni directional CCO designs used a variety of schemes to select control days (e.g., day 7 before the event) (Table 5).
The dependent variables studied were mor-tality related in 25 cases and morbidity related in the remainder: hospital admissions in 35 studies, hospital emergencies in 7 studies, episodes of arrhythmias recorded in pace-makers in 5 studies, telephone calls to medical emergencies in 2 studies, and others based on disease-specific registers, such as stroke (1 study), cardiac arrest (3 studies), and isch-emic heart disease (2 studies).
In 77 studies, the air pollutant ana-lyzed was particulate level, mostly measured as PM10 (61 studies), followed by PM2.5 (22 studies), black smoke (11 studies), haze coefficient (3 studies), total suspended PM (4 studies), sulfate particles (1 study), and PM
with aerodynamic diameter < 7mm (1 study). Insofar as gaseous air pollutants were con-cerned, sulfur dioxide was used on 47 studies, nitrogen dioxide on 48, ozone on 44, carbon monoxide on 43, and oxides of oxygen (Ox), oxides of nitrogen (NOx), and nitrogen oxide on 1 study each.
In most cases, the general population was studied. Patients were studied in only 9 studies: cardiac pacemaker carriers in 5, chronic obstructive pulmonary disease patients in 2, and asthma and heart failure patients in 1 study each.
Of all the studies that addressed applica-tion of CCO designs, 11 (13.6%) made use of analysis of effect modification of variables at the individual level.
Common steps and requirements for CCO study designs. The procedures followed in con-ducting a study into the relationship between air pollution and health, taking all reports on CCO design methodology and application into account, are outlined in the Appendix.
In brief, CCO studies begin by confirm-ing that data meet a series of necessary requi-sites and end with a sensitivity analysis, after passing through a series of intermediate steps
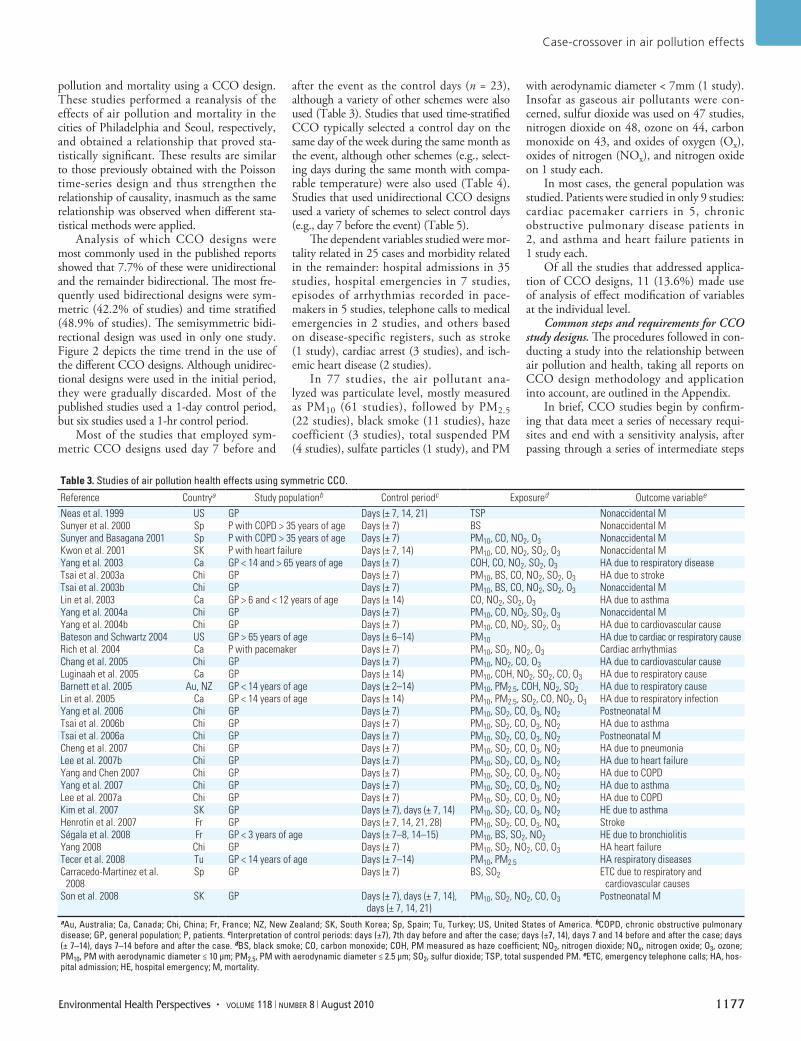
Table 3. Studies of air pollution health effects using symmetric CCO.
Reference Countrya Study populationb Control periodc Exposured Outcome variablee
Neas et al. 1999 US GP Days (± 7, 14, 21) TSP Nonaccidental MSunyer et al. 2000 Sp P with COPD > 35 years of age Days (± 7) BS Nonaccidental MSunyer and Basagana 2001 Sp P with COPD > 35 years of age Days (± 7) PM10, CO, NO2, O3 Nonaccidental MKwon et al. 2001 SK P with heart failure Days (± 7, 14) PM10, CO, NO2, SO2, O3 Nonaccidental MYang et al. 2003 Ca GP < 14 and > 65 years of age Days (± 7) COH, CO, NO2, SO2, O3 HA due to respiratory diseaseTsai et al. 2003a Chi GP Days (± 7) PM10, BS, CO, NO2, SO2, O3 HA due to strokeTsai et al. 2003b Chi GP Days (± 7) PM10, BS, CO, NO2, SO2, O3 Nonaccidental MLin et al. 2003 Ca GP > 6 and < 12 years of age Days (± 14) CO, NO2, SO2, O3 HA due to asthmaYang et al. 2004a Chi GP Days (± 7) PM10, CO, NO2, SO2, O3 Nonaccidental MYang et al. 2004b Chi GP Days (± 7) PM10, CO, NO2, SO2, O3 HA due to cardiovascular causeBateson and Schwartz 2004 US GP > 65 years of age Days (± 6–14) PM10 HA due to cardiac or respiratory causeRich et al. 2004 Ca P with pacemaker Days (± 7) PM10, SO2, NO2, O3 Cardiac arrhythmiasChang et al. 2005 Chi GP Days (± 7) PM10, NO2, CO, O3 HA due to cardiovascular causeLuginaah et al. 2005 Ca GP Days (± 14) PM10, COH, NO2, SO2, CO, O3 HA due to respiratory causeBarnett et al. 2005 Au, NZ GP < 14 years of age Days (± 2–14) PM10, PM2.5, COH, NO2, SO2 HA due to respiratory causeLin et al. 2005 Ca GP < 14 years of age Days (± 14) PM10, PM2.5, SO2, CO, NO2, O3 HA due to respiratory infectionYang et al. 2006 Chi GP Days (± 7) PM10, SO2, CO, O3, NO2 Postneonatal MTsai et al. 2006b Chi GP Days (± 7) PM10, SO2, CO, O3, NO2 HA due to asthmaTsai et al. 2006a Chi GP Days (± 7) PM10, SO2, CO, O3, NO2 Postneonatal MCheng et al. 2007 Chi GP Days (± 7) PM10, SO2, CO, O3, NO2 HA due to pneumoniaLee et al. 2007b Chi GP Days (± 7) PM10, SO2, CO, O3, NO2 HA due to heart failureYang and Chen 2007 Chi GP Days (± 7) PM10, SO2, CO, O3, NO2 HA due to COPDYang et al. 2007 Chi GP Days (± 7) PM10, SO2, CO, O3, NO2 HA due to asthmaLee et al. 2007a Chi GP Days (± 7) PM10, SO2, CO, O3, NO2 HA due to COPDKim et al. 2007 SK GP Days (± 7), days (± 7, 14) PM10, SO2, CO, O3, NO2 HE due to asthmaHenrotin et al. 2007 Fr GP Days (± 7, 14, 21, 28) PM10, SO2, CO, O3, NOx StrokeSégala et al. 2008 Fr GP < 3 years of age Days (± 7–8, 14–15) PM10, BS, SO2, NO2 HE due to bronchiolitisYang 2008 Chi GP Days (± 7) PM10, SO2, NO2, CO, O3 HA heart failureTecer et al. 2008 Tu GP < 14 years of age Days (± 7–14) PM10, PM2.5 HA respiratory diseasesCarracedo-Martinez et al.
2008Sp GP Days (± 7) BS, SO2 ETC due to respiratory and
cardiovascular causesSon et al. 2008 SK GP Days (± 7), days (± 7, 14),
days (± 7, 14, 21)PM10, SO2, NO2, CO, O3 Postneonatal M
aAu, Australia; Ca, Canada; Chi, China; Fr, France; NZ, New Zealand; SK, South Korea; Sp, Spain; Tu, Turkey; US, United States of America. bCOPD, chronic obstructive pulmonary disease; GP, general population; P, patients. cInterpretation of control periods: days (±7), 7th day before and after the case; days (±7, 14), days 7 and 14 before and after the case; days (± 7–14), days 7–14 before and after the case. dBS, black smoke; CO, carbon monoxide; COH, PM measured as haze coefficient; NO2, nitrogen dioxide; NOx, nitrogen oxide; O3, ozone; PM10, PM with aerodynamic diameter ≤ 10 µm; PM2.5, PM with aerodynamic diameter ≤ 2.5 µm; SO2, sulfur dioxide; TSP, total suspended PM. eETC, emergency telephone calls; HA, hos-pital admission; HE, hospital emergency; M, mortality.
Carracedo-Martínez et al.
1178 volume 118 | number 8 | August 2010 • Environmental Health Perspectives
that include the transformation of the data-base into a matrix with CCO structure.
DiscussionThis is the first systematic review to cover the application of CCO designs to the study of the health effects of air pollution. Use of CCO designs has risen steeply in recent years and from 2003 in particular, reaching a peak in 2006. Most of the new CCO designs that
gradually appeared were based on simulation studies, which in many cases neither relied on the same scenarios nor assessed perfor-mance for variables with special characteris-tics, for example, discontinuous exposures. Most application studies have tended to study the effect of particulates on morbidity, yet few studies have taken advantage of the strength of CCO designs to assess potential effect modifications with individual variables.
CCO versus Poisson. The increase in the use of the CCO design appears to coincide with problems using Poisson regression mod-els with GAM: as far back as 2002, Dominici et al. (2002) discovered that the most fre-quently used statistical packages gave rise to unstable estimators due to inadequate con-vergence criteria that could underestimate standard errors because of the presence of concurvity in the data (Ramsay et al. 2003).
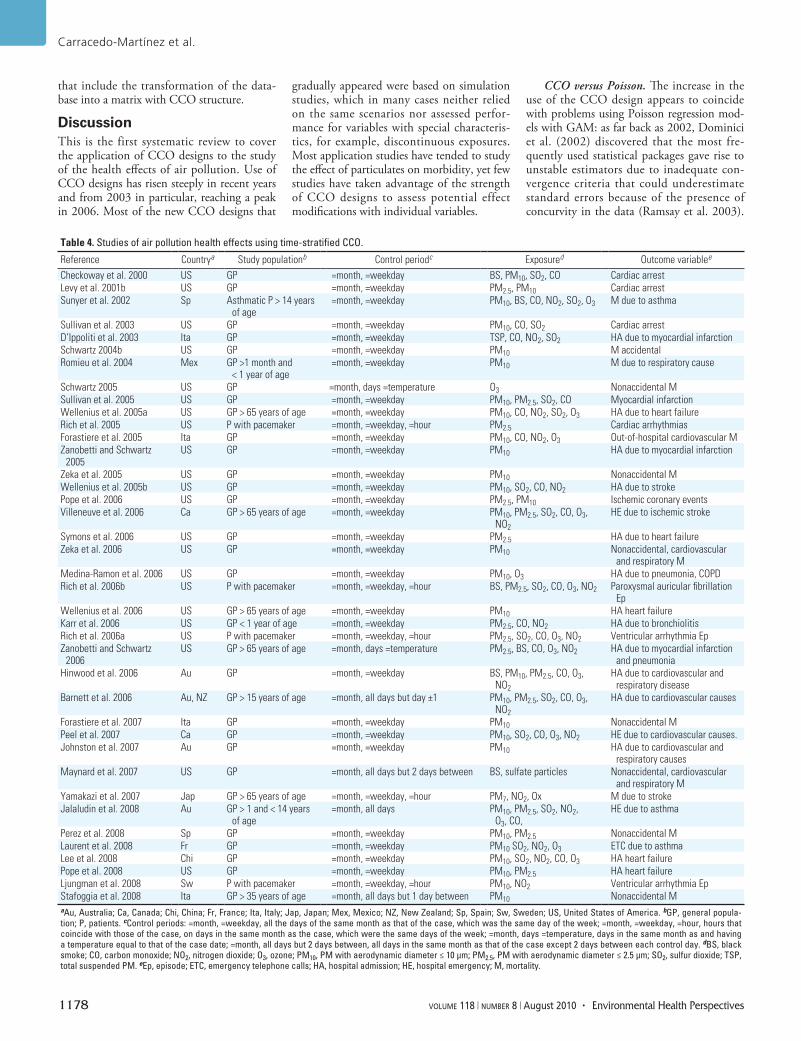
Table 4. Studies of air pollution health effects using time-stratified CCO.
Reference Countrya Study populationb Control periodc Exposured Outcome variablee
Checkoway et al. 2000 US GP =month, =weekday BS, PM10, SO2, CO Cardiac arrestLevy et al. 2001b US GP =month, =weekday PM2.5, PM10 Cardiac arrestSunyer et al. 2002 Sp Asthmatic P > 14 years
of age =month, =weekday PM10, BS, CO, NO2, SO2, O3 M due to asthma
Sullivan et al. 2003 US GP =month, =weekday PM10, CO, SO2 Cardiac arrestD’Ippoliti et al. 2003 Ita GP =month, =weekday TSP, CO, NO2, SO2 HA due to myocardial infarctionSchwartz 2004b US GP =month, =weekday PM10 M accidentalRomieu et al. 2004 Mex GP >1 month and
< 1 year of age =month, =weekday PM10 M due to respiratory cause
Schwartz 2005 US GP =month, days =temperature O3 Nonaccidental MSullivan et al. 2005 US GP =month, =weekday PM10, PM2.5, SO2, CO Myocardial infarctionWellenius et al. 2005a US GP > 65 years of age =month, =weekday PM10, CO, NO2, SO2, O3 HA due to heart failureRich et al. 2005 US P with pacemaker =month, =weekday, =hour PM2.5 Cardiac arrhythmiasForastiere et al. 2005 Ita GP =month, =weekday PM10, CO, NO2, O3 Out-of-hospital cardiovascular MZanobetti and Schwartz
2005US GP =month, =weekday PM10 HA due to myocardial infarction
Zeka et al. 2005 US GP =month, =weekday PM10 Nonaccidental MWellenius et al. 2005b US GP =month, =weekday PM10, SO2, CO, NO2 HA due to strokePope et al. 2006 US GP =month, =weekday PM2.5, PM10 Ischemic coronary eventsVilleneuve et al. 2006 Ca GP > 65 years of age =month, =weekday PM10, PM2.5, SO2, CO, O3,
NO2
HE due to ischemic stroke
Symons et al. 2006 US GP =month, =weekday PM2.5 HA due to heart failureZeka et al. 2006 US GP =month, =weekday PM10 Nonaccidental, cardiovascular
and respiratory MMedina-Ramon et al. 2006 US GP =month, =weekday PM10, O3 HA due to pneumonia, COPDRich et al. 2006b US P with pacemaker =month, =weekday, =hour BS, PM2.5, SO2, CO, O3, NO2 Paroxysmal auricular fibrillation
EpWellenius et al. 2006 US GP > 65 years of age =month, =weekday PM10 HA heart failureKarr et al. 2006 US GP < 1 year of age =month, =weekday PM2.5, CO, NO2 HA due to bronchiolitisRich et al. 2006a US P with pacemaker =month, =weekday, =hour PM2.5, SO2, CO, O3, NO2 Ventricular arrhythmia EpZanobetti and Schwartz
2006US GP > 65 years of age =month, days =temperature PM2.5, BS, CO, O3, NO2 HA due to myocardial infarction
and pneumoniaHinwood et al. 2006 Au GP =month, =weekday BS, PM10, PM2.5, CO, O3,
NO2
HA due to cardiovascular and respiratory disease
Barnett et al. 2006 Au, NZ GP > 15 years of age =month, all days but day ±1 PM10, PM2.5, SO2, CO, O3, NO2
HA due to cardiovascular causes
Forastiere et al. 2007 Ita GP =month, =weekday PM10 Nonaccidental MPeel et al. 2007 Ca GP =month, =weekday PM10, SO2, CO, O3, NO2 HE due to cardiovascular causes.Johnston et al. 2007 Au GP =month, =weekday PM10 HA due to cardiovascular and
respiratory causesMaynard et al. 2007 US GP =month, all days but 2 days between BS, sulfate particles Nonaccidental, cardiovascular
and respiratory MYamakazi et al. 2007 Jap GP > 65 years of age =month, =weekday, =hour PM7, NO2, Ox M due to strokeJalaludin et al. 2008 Au GP > 1 and < 14 years
of age =month, all days PM10, PM2.5, SO2, NO2,
O3, CO,HE due to asthma
Perez et al. 2008 Sp GP =month, =weekday PM10, PM2.5 Nonaccidental MLaurent et al. 2008 Fr GP =month, =weekday PM10 SO2, NO2, O3 ETC due to asthmaLee et al. 2008 Chi GP =month, =weekday PM10, SO2, NO2, CO, O3 HA heart failurePope et al. 2008 US GP =month, =weekday PM10, PM2.5 HA heart failureLjungman et al. 2008 Sw P with pacemaker =month, =weekday, =hour PM10, NO2 Ventricular arrhythmia EpStafoggia et al. 2008 Ita GP > 35 years of age =month, all days but 1 day between PM10 Nonaccidental MaAu, Australia; Ca, Canada; Chi, China; Fr, France; Ita, Italy; Jap, Japan; Mex, Mexico; NZ, New Zealand; Sp, Spain; Sw, Sweden; US, United States of America. bGP, general popula-tion; P, patients. cControl periods: =month, =weekday, all the days of the same month as that of the case, which was the same day of the week; =month, =weekday, =hour, hours that coincide with those of the case, on days in the same month as the case, which were the same days of the week; =month, days =temperature, days in the same month as and having a temperature equal to that of the case date; =month, all days but 2 days between, all days in the same month as that of the case except 2 days between each control day. dBS, black smoke; CO, carbon monoxide; NO2, nitrogen dioxide; O3, ozone; PM10, PM with aerodynamic diameter ≤ 10 µm; PM2.5, PM with aerodynamic diameter ≤ 2.5 µm; SO2, sulfur dioxide; TSP, total suspended PM. eEp, episode; ETC, emergency telephone calls; HA, hospital admission; HE, hospital emergency; M, mortality.
Case-crossover in air pollution effects
Environmental Health Perspectives • volume 118 | number 8 | August 2010 1179
In part, the CCO design represents a solution to the problems posed by GAM methods, but before it can become generalized, a period of time is required. For instance, we observed no marked increase in the use of these designs until some years after the discovery of GAM-related problems; a peak in use occurred 2 years after the discovery of the problems of concurvity (analog to collinearity for non-linear relationships). Currently, other (e.g., geographic) methods are also being used to analyze the link between air pollution and health (Zeger et al. 2008).
Different CCO designs and their evolu-tion. We observed an ongoing effort to per-fect the CCO design dating from the initial unidirectional design up to the bidirectional designs with their subtypes. Successive simu-lation studies have focused on studying the designs that yielded the best results in pre-vious simulations. Symmetric bidirectional CCO and time-stratified CCO most often proved to be best in different simulations. In contrast, the semisymmetric design yielded contradictory results: in some simulation studies it proved better than the symmetric design, but other studies gave opposite results (Fung et al. 2003), which could be due to differences in the simulation scenario. One consistent finding, however, is that the statis-tical efficiency of semisymmetric CCO is low compared with that of the symmetric or time-stratified CCO methods.
The rapid adoption of symmetric and time-stratified CCO designs is noteworthy, in that these began to be applied in the very same year in which their methodology was first proposed in the scientific literature. In contrast, the semisymmetric CCO design was first proposed in 2002, yet the first report
in which it was used to analyze the relation-ship between air pollution and health was published in 2004.
One possible explanation for the fact that different designs are used in practice is that they were discovered at different points in time: uni-directional were described before bidirectional methods, and within bidirectional methods, symmetric was described before time-stratified CCO. Unidirectional methods are being used less frequently because of important disadvan-tages, such as poor control of trends.
Of the three bidirectional methods, semi-symmetric is used very little because of its negligible statistical power. Symmetric and time-stratified designs had a similar percent-age of use, with a trend toward greater use of time-stratified designs, possibly because, from a theoretical point of view, they solve the “overlap bias” that symmetric designs other-wise display. However, simulation studies are not conclusive when it comes to comparing time-stratified with symmetric designs; for example, in their simulation study, Lumley and Levy (2000) reported that the time- stratified method was superior, but Figueiras et al. (2005) did not find this method to be better than the symmetric CCO.
The fact that the CCO designs most often used to analyze the relationship between air pollution and health are symmetric and time stratified, plus the rapid adoption of these same two models (they began to be used in the same year as they were proposed in the literature), together indicate that there is an interest in the correct application of this methodology. Control periods most fre-quently used for the symmetric design are 7 days before and after case, and for the time-stratified design, control periods are all the
same days of the week as the case within the same month. Thus, these two approaches pre-vent problems of autocorrelation, and control for effect of day of the week.
Interpretation of application studies. In studies that use the CCO design to analyze the relationship between air pollution and health, the most frequently used exposure is that of hospital admissions. The greater use of hospi-tal admissions than mortality as an outcome may be because, on the one hand, the hospital admission variable entails a greater number of events, thereby affording greater statistical power, and on the other hand, the time period from exposure until the event is shorter for hospital admissions than for mortality, thereby requiring a smaller number of lags, thus facili-tating statistical analysis (American Thoracic Society 1985). The type of pollutant most fre-quently analyzed with CCO designs is air-borne particulates, possibly because these have been widely studied and because exposure data are readily available. In terms of type of population, these studies seldom target dis-eased populations but focus instead on general popu lations, possibly because of the difficulty of obtaining records for a specific disease popu lation (Filleul et al. 2004).
Lessons learned and new challenges. Although the application of nonparametric Poisson models amounted to a great advance over earlier designs, enabling more flexible control of unmeasured confounding variables that change over time, the problems detected, such as the difficulty in setting the number of degrees of freedom, seem to have heightened interest in other alternatives, such as CCO. These approaches make it possible to con-trol for the influence of trend and seasonality by design. Initially, these designs resulted in
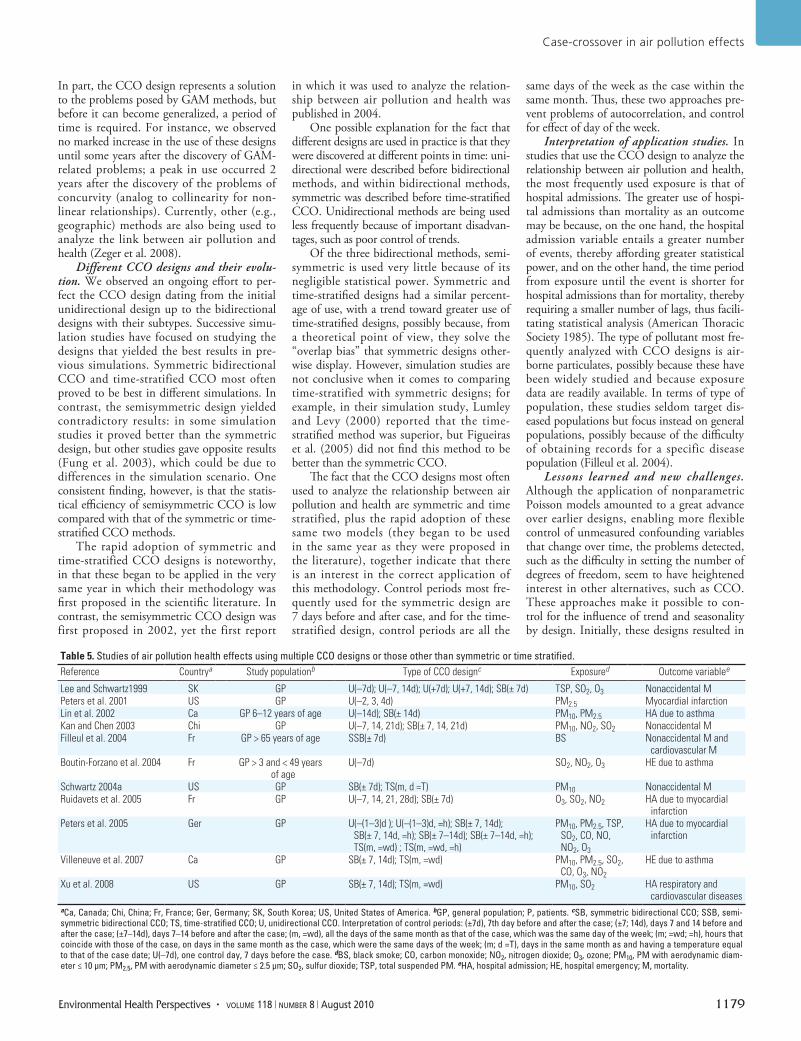
Table 5. Studies of air pollution health effects using multiple CCO designs or those other than symmetric or time stratified.Reference Countrya Study populationb Type of CCO designc Exposured Outcome variablee
Lee and Schwartz1999 SK GP U(–7d); U(–7, 14d); U(+7d); U(+7, 14d); SB(± 7d) TSP, SO2, O3 Nonaccidental MPeters et al. 2001 US GP U(–2, 3, 4d) PM2.5 Myocardial infarctionLin et al. 2002 Ca GP 6–12 years of age U(–14d); SB(± 14d) PM10, PM2.5 HA due to asthmaKan and Chen 2003 Chi GP U(–7, 14, 21d); SB(± 7, 14, 21d) PM10, NO2, SO2 Nonaccidental MFilleul et al. 2004 Fr GP > 65 years of age SSB(± 7d) BS Nonaccidental M and
cardiovascular MBoutin-Forzano et al. 2004 Fr GP > 3 and < 49 years
of ageU(–7d) SO2, NO2, O3 HE due to asthma
Schwartz 2004a US GP SB(± 7d); TS(m, d =T) PM10 Nonaccidental MRuidavets et al. 2005 Fr GP U(–7, 14, 21, 28d); SB(± 7d) O3, SO2, NO2 HA due to myocardial
infarctionPeters et al. 2005 Ger GP U(–(1–3)d ); U(–(1–3)d, =h); SB(± 7, 14d);
SB(± 7, 14d, =h); SB(± 7–14d); SB(± 7–14d, =h); TS(m, =wd) ; TS(m, =wd, =h)
PM10, PM2.5, TSP, SO2, CO, NO, NO2, O3
HA due to myocardial infarction
Villeneuve et al. 2007 Ca GP SB(± 7, 14d); TS(m, =wd) PM10, PM2.5, SO2, CO, O3, NO2
HE due to asthma
Xu et al. 2008 US GP SB(± 7, 14d); TS(m, =wd) PM10, SO2 HA respiratory and cardiovascular diseases
aCa, Canada; Chi, China; Fr, France; Ger, Germany; SK, South Korea; US, United States of America. bGP, general population; P, patients. cSB, symmetric bidirectional CCO; SSB, semi-symmetric bidirectional CCO; TS, time-stratified CCO; U, unidirectional CCO. Interpretation of control periods: (±7d), 7th day before and after the case; (±7; 14d), days 7 and 14 before and after the case; (±7–14d), days 7–14 before and after the case; (m, =wd), all the days of the same month as that of the case, which was the same day of the week; (m; =wd; =h), hours that coincide with those of the case, on days in the same month as the case, which were the same days of the week; (m; d =T), days in the same month as and having a temperature equal to that of the case date; U(–7d), one control day, 7 days before the case. dBS, black smoke; CO, carbon monoxide; NO2, nitrogen dioxide; O3, ozone; PM10, PM with aerodynamic diam-eter ≤ 10 µm; PM2.5, PM with aerodynamic diameter ≤ 2.5 µm; SO2, sulfur dioxide; TSP, total suspended PM. eHA, hospital admission; HE, hospital emergency; M, mortality.
Carracedo-Martínez et al.
1180 volume 118 | number 8 | August 2010 • Environmental Health Perspectives
certain biases in the estimators under very specific conditions, which were superseded by new control period sampling designs, although a decision must still be made as to precisely what is the most appropriate time interval between case and control periods.
In principle, CCO designs seem easier to model and involve fewer arbitrary decisions
for the researcher than do Poisson time-series designs with GAM (type of smoother, num-ber of degrees of freedom), yet CCO designs also entail arbitrariness in the selection of ref-erence periods or sampling method.
There are no known study characteristics that would favor using one referent period over another, because the heterogeneity of
the simulation studies in terms of their sce-narios and results renders it impossible to draw any conclusion in this regard. Likewise, simulation studies have tended to concen-trate on PM, and no simulation study assesses the latter’s behavior in discontinuous expo-sures (e.g., a high-ozone day). In this type of exposure where high proportions of cases and controls assume a value of zero, Poisson time series might, from a theoretical point of view, perform better than CCO methods, because the comparisons are made in the same per-son and, when the case and control periods have the same value, provide no statistical power when analyzed with conditional logistic regression. However, we are not aware of any simulation studies that have tested whether this assumption has any relevance in practice.
Theoretically, one of the great advantages of CCO designs is that individual data can be included to estimate effect modifications, but in practice most CCO-based studies on the relationship between air pollution and health do not analyze effect modification at the indi-vidual level. The scant use of this advantage might be due to the lack of availability of data at this level (Filleul et al. 2004).
Furthermore, thanks to the CCO design, we have more scientific evidence of the short-term association between air pollution and health, because at times reanalyses using CCO methodology have been run on data previ-ously analyzed with Poisson methods, and similar results have been obtained (Lee and Schwartz 1999).
One possible challenge is the applica-tion of mixed models to the analysis of CCO designs, something that, on the one hand, could furnish greater statistical power and, on the other, could extend CCO designs to spatial-temporal models. Figueiras et al. (2005) attempted to apply longitudinal mod-els to CCO designs but observed that, in the presence of autocorrelation, estimates might be biased. New approaches in this field could solve these problems.
From the standpoint of statistical analysis, Lu et al. (2008) have proposed that CCO models should be checked to see if assump-tions for using CCO methodology were satis-fied, via a series of diagnostic tools such as plotting the data. In practice, however, we have detected no CCO study on the relation-ship between air pollution and health that checked the models. Furthermore there are no formulas for calculating sample size (or statis-tical power) in CCO designs, and indeed, one study (Symons et al. 2006) applied a simulation to calculate the lower bound of detectable effects. A possible risk of CCO designs lies in “model shopping,” whereby multiple analyses are performed using differ-ent designs, and only the most interesting are then shown (Mittleman 2005). This problem
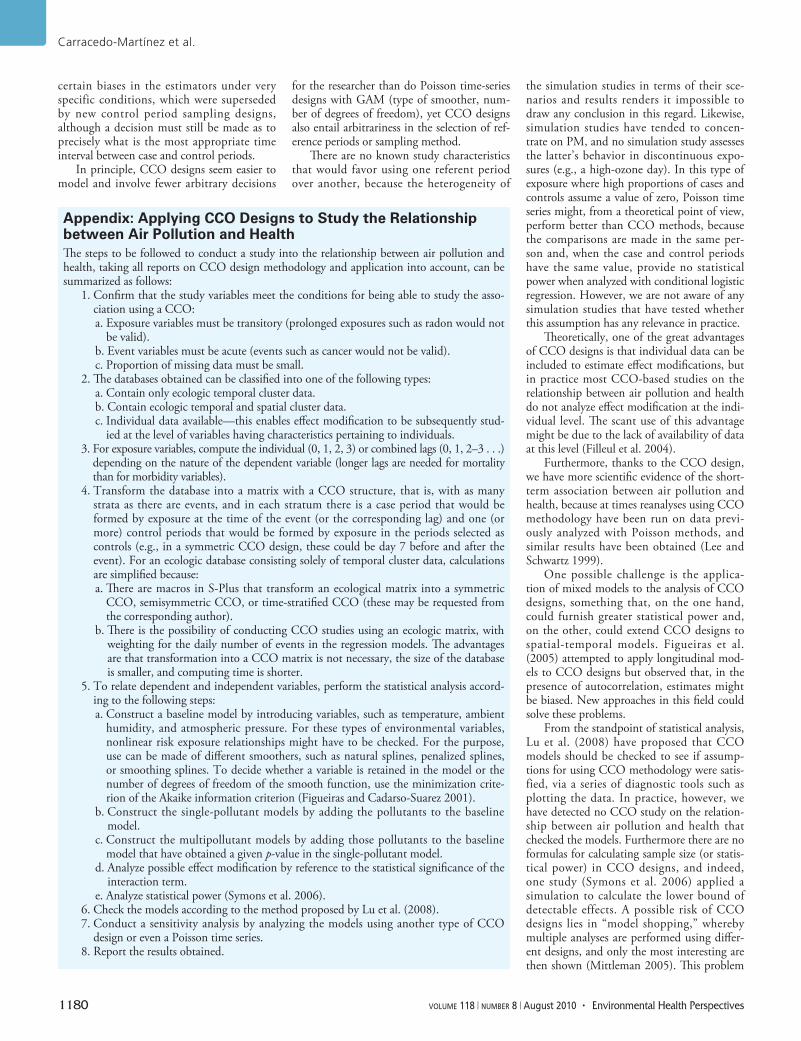
Appendix: Applying CCO Designs to Study the Relationship between Air Pollution and HealthThe steps to be followed to conduct a study into the relationship between air pollution and health, taking all reports on CCO design methodology and application into account, can be summarized as follows:
1. Confirm that the study variables meet the conditions for being able to study the asso-ciation using a CCO:a. Exposure variables must be transitory (prolonged exposures such as radon would not
be valid).b. Event variables must be acute (events such as cancer would not be valid).c. Proportion of missing data must be small.
2. The databases obtained can be classified into one of the following types:a. Contain only ecologic temporal cluster data.b. Contain ecologic temporal and spatial cluster data.c. Individual data available—this enables effect modification to be subsequently stud-
ied at the level of variables having characteristics pertaining to individuals.3. For exposure variables, compute the individual (0, 1, 2, 3) or combined lags (0, 1, 2–3 . . .)
depending on the nature of the dependent variable (longer lags are needed for mortality than for morbidity variables).
4. Transform the database into a matrix with a CCO structure, that is, with as many strata as there are events, and in each stratum there is a case period that would be formed by exposure at the time of the event (or the corresponding lag) and one (or more) control periods that would be formed by exposure in the periods selected as controls (e.g., in a symmetric CCO design, these could be day 7 before and after the event). For an ecologic database consisting solely of temporal cluster data, calculations are simplified because:a. There are macros in S-Plus that transform an ecological matrix into a symmetric
CCO, semisymmetric CCO, or time-stratified CCO (these may be requested from the corresponding author).
b. There is the possibility of conducting CCO studies using an ecologic matrix, with weighting for the daily number of events in the regression models. The advantages are that transformation into a CCO matrix is not necessary, the size of the database is smaller, and computing time is shorter.
5. To relate dependent and independent variables, perform the statistical analysis accord-ing to the following steps:a. Construct a baseline model by introducing variables, such as temperature, ambient
humidity, and atmospheric pressure. For these types of environmental variables, nonlinear risk exposure relationships might have to be checked. For the purpose, use can be made of different smoothers, such as natural splines, penalized splines, or smoothing splines. To decide whether a variable is retained in the model or the number of degrees of freedom of the smooth function, use the minimization crite-rion of the Akaike information criterion (Figueiras and Cadarso-Suarez 2001).
b. Construct the single-pollutant models by adding the pollutants to the baseline model.
c. Construct the multipollutant models by adding those pollutants to the baseline model that have obtained a given p-value in the single-pollutant model.
d. Analyze possible effect modification by reference to the statistical significance of the interaction term.
e. Analyze statistical power (Symons et al. 2006).6. Check the models according to the method proposed by Lu et al. (2008).7. Conduct a sensitivity analysis by analyzing the models using another type of CCO
design or even a Poisson time series.8. Report the results obtained.
Case-crossover in air pollution effects
Environmental Health Perspectives • volume 118 | number 8 | August 2010 1181
can be solved, in part, by means of a sensitiv-ity analysis, in which the authors show the results obtained with different CCO methods, and even compare the results against a gener-alized linear model with a Poisson response.
Limitations of our review. In assessing the reports that use effect modification with individual data, we encountered difficulties regarding use of different terminologies: some used the term “modification” to classify what is in reality “stratification into subgroups”; others referred to stratification but did not clarify whether different statistical models were used for each group of subjects of the variable “stratification,” or whether an inter-action term was introduced into the model to assess effect modi fication. Furthermore, as with any systematic review, publication bias may be present.
ConclusionsThe CCO design could be an attractive alter-native to Poisson time-series analysis with GAM, but its advantages and drawbacks are still in the process of being understood. The use of CCO designs to study the relation-ship between air pollution and health has experienced a great upsurge, but with few exceptions, full advantage has not been taken in terms of effect modification or spatial- temporal analyses. Moreover, although a number of simulations have been conducted to study the performance of CCO designs, the performance of discontinuous exposures, such as ozone, remains to be studied. A fur-ther, very important challenge would be to undertake an in-depth longitudinal analysis of CCO designs, which would enhance their sta-tistical power and enable them to be applied to spatial-temporal models.
RefeRences
American Thoracic Society. 1985. Guidelines as to what con-stitutes an adverse respiratory health effect, with special reference to epidemiologic studies of air pollution. Am Rev Respir Dis 13:666–668.
Barnett AG, Williams GM, Schwartz J, Best TS, Neller AH, Petroeschevsky, et al. 2006. The effects of air pollution on hospitalizations for cardiovascular disease in elderly people in Australian and New Zealand cities. Environ Health Perspect 114:1018–1023.
Barnett AG, Williams GM, Schwartz J, Neller AH, Best TL, Petroeschevsky AL, et al. 2005. Air pollution and child respiratory health: a case-crossover study in Auckland New Zealand. Am J Respir Crit Care Med 171:1272–1278.
Bateson TF, Schwartz J. 1999. Control for seasonal variation and time trend in case-crossover studies of acute effects of environmental exposures. Epidemiology 10:539–544.
Bateson TF, Schwartz J. 2001. Selection bias and confounding in case-crossover analyses of environmental time-series data. Epidemiology 12:654–661.
Bateson TF, Schwartz J. 2004. Who is sensitive to the effects of particulate air pollution on mortality? A case-crossover analysis of effect modifiers. Epidemiology 15:143–149.
Boutin-Forzano S, Adel N, Gratecos L, Jullian H, Garnier JM, Ramadour M, et al. 2004. Visits to the emergency room for asthma attacks and short-term variations in air pollution. A case-crossover study. Respiration 71:134–137.
Carracedo-Martinez E, Sanchez C, Taracido M, Saez M, Jato V, Figueiras A. 2008. Effect of short-term exposure
to air pollution and pollen on medical emergency calls: a case-crossover study in Spain. Allergy 63:347–353.
Chang CC, Tsai SS, Ho SC, Yang CY. 2005. Air pollution and hospital admissions for cardiovascular disease in Taipei, Taiwan. Environ Res 98:114–119.
Checkoway H, Levy D, Sheppard L, Kaufman J, Koenig J, Siscovick D. 2000. A case-crossover analysis of fine par-ticulate matter air pollution and out-of-hospital sudden cardiac arrest. Res Rep Health Eff Inst (99):5–28.
Cheng MF, Tsai SS, Wu TN, Chen PS, Yang CY. 2007. Air pollution and hospital admissions for pneumonia in a tropical city: Kaohsiung, Taiwan. J Toxicol Environ Health 70:2021–2026.
D’Ippoliti D, Forastiere F, Ancona C, Agabiti N, Fusco D, Michelozzi P, et al. 2003. Air pollution and myo cardial infarc-tion in Rome: a case-crossover analysis. Epidemiology 2003;14:528–535.
Dominici F, McDermott A, Zeger SL, Samet JM. 2002. On the use of generalized additive models in time-series studies of air pollution and health. Am J Epidemiol 156:193–203.
Figueiras A, Cadarso-Suarez C. 2001. Application of non-parametric models for calculating odds ratios and their confidence intervals for continuous exposures. Am J Epidemiol 154:264–275.
Figueiras A, Carracedo-Martinez E, Saez M, Taracido M. 2005. Analysis of case-crossover designs using longitudinal approaches: a simulation study. Epidemiology 16:239–246.
Filleul L, Rondeau V, Cantagrel A, Dartigues JF, Tessier JF. 2004. Do subject characteristics modify the effects of par-ticulate air pollution on daily mortality among the elderly? J Occup Environ Med 46:1115–1122.
Firket J. 1931. The cause of symptoms found in the Meuse Valley during the fog of December, 1930. Bull Acad R Med Belg 11:683–741.
Forastiere F, Stafoggia M, Picciotto S, Bellander T, D’Ippoliti D, Lanki T, et al. 2005. A case-crossover analysis of out-of-hospital coronary deaths and air pollution in Rome, Italy. Am J Respir Crit Care Med 172:1549–1555.
Forastiere F, Stafoggia M, Tasco C, Picciotto S, Agabiti N, Cesaroni G, et al. 2007. Socioeconomic status, particulate air pollution, and daily mortality: differential exposure or differential susceptibility. Am J Ind Med 50:208–216.
Fung KY, Krewski D, Chen Y, Burnett R, Cakmak S. 2003. Comparison of time series and case-crossover analyses of air pollution and hospital admission data. Int J Epidemiol 32:1064–1070.
Hajat S. 2003. Commentary: comparison of time series and case-crossover analyses of air pollution and hospital admission data. Int J Epidemiol 32:1071. Available: http://ije.oxfordjournals.org/cgi/content/full/32/6/1071 [accessed 1 July 2010].
Henrotin JB, Besancenot JP, Bejot Y, Giroud M. 2007. Short-term effects of ozone air pollution on ischaemic stroke occurrence: a case-crossover analysis from a 10-year population-based study in Dijon, France. Occup Environ Med 64:439–445.
Hinwood AL, De Klerk N, Rodríguez C, Jacoby P, Runnion T, Rye P, et al. 2006. The relationship between changes in daily air pollution and hospitalizations in Perth, Australia 1992–1998: a case-crossover study. Int J Environ Health Res 16:27–46.
Jaakkola JJ. 2003. Case-crossover design in air pollution epi-demiology. Eur Respir J Suppl 40:81s–85s.
Jalaludin B, Khalaj B, Sheppeard V, Morgan G. 2008. Air pol-lution and ED visits for asthma in Australian children: a case-crossover analysis. Int Arch Occup Environ Health 81:967–974.
Janes H, Sheppard L, Lumley T. 2005a. Case-crossover anal-yses of air pollution exposure data: referent selection strategies and their implications for bias. Epidemiology 16:717–726.
Janes H, Sheppard L, Lumley T. 2005b. Overlap bias in the case-crossover design, with application to air pollution exposures. Stat Med 24:285–300.
Johnston FH, Bailie RS, Pilotto LS, Hanigan IC. 2007. Ambient biomass smoke and cardio-respiratory hospital admis-sions in Darwin, Australia. BMC Public Health 7:240; doi: 10.1186/1471-2458-7-240 [Online 13 September 2007].
Kan H, Chen B. 2003. A case-crossover analysis of air pol-lution and daily mortality in Shanghai. J Occup Health 45:119–124.
Karr C, Lumley T, Shepherd K, Davis R, Larson T, Ritz B, et al. 2006. A case-crossover study of wintertime ambient air pollution and infant bronchiolitis. Environ Health Perspect 114:277–281.
Kelsall JE, Samet JM, Zeger SL, Xu J. 1997. Air pollution and mortality in Philadelphia, 1974–1988. Am J Epidemiol 146:750–762.
Kim SY, O’Neill MS, Lee JT, Cho Y, Kim J, Kim H. 2007. Air pol-lution, socioeconomic position, and emergency hospital visits for asthma in Seoul, Korea. Int Arch Occup Environ Health 80:701–710.
Kunzli N, Schindler C. 2005a. A call for reporting the relevant exposure term in air pollution case-crossover studies. J Epidemiol Community Health 59:527–530.
Kunzli N, Schindler C. 2005b. Case-crossover studies. Epidemiology 16:592–593.
Kwon HJ, Cho SH, Nyberg F, Pershagen G. 2001. Effects of ambient air pollution on daily mortality in a cohort of patients with congestive heart failure. Epidemiology 12:413–419.
Laurent O, Pedrono G, Segala C, Filleul L, Havard S, Deguen S, et al. 2008. Air pollution, asthma attacks, and socio-economic deprivation: a small-area case-crossover study. Am J Epidemiol 168:58–65.
Lee IM, Tsai SS, Chang CC, Ho CK, Yang CY. 2007a. Air pollution and hospital admissions for chronic obstructive pulmonary disease in a tropical city: Kaohsiung, Taiwan. Inhal Toxicol 19:393–398.
Lee IM, Tsai SS, Ho CK, Chiu HF, Wu TN, Yang CY. 2008. Air pollution and hospital admissions for congestive heart failure: are there potentially sensitive groups? Environ Res 108:348–353.
Lee IM, Tsai SS, Ho CK, Chiu HF, Yang CY. 2007b. Air pollution and hospital admissions for congestive heart faliure in a tropical city: Kaohsiung, Taiwan. Inhal Toxicol 19:889–904.
Lee JT, Kim H, Schwartz J. 2000. Bidirectional case-crossover studies of air pollution: bias from skewed and incomplete waves. Environ Health Perspect 108:1107–1111.
Lee JT, Schwartz J. 1999. Reanalysis of the effects of air pol-lution on daily mortality in Seoul, Korea: a case-crossover design. Environ Health Perspect 107:633–636.
Levy D, Lumley T, Sheppard L, Kaufman J, Checkoway H. 2001a. Referent selection in case-crossover analyses of acute health effects of air pollution. Epidemiology 12:186–192.
Levy D, Sheppard L, Checkoway H, Kaufman J, Lumley T, Koenig J, et al. 2001b. A case-crossover analysis of par-ticulate matter air pollution and out-of-hospital primary cardiac arrest. Epidemiology 12:193–199.
Lin M, Chen Y, Burnett RT, Villeneuve PJ, Krewski D. 2002. The influence of ambient coarse particulate matter on asthma hospitalization in children: case-crossover and time-series analyses. Environ Health Perspect 110:575–581.
Lin M, Chen Y, Burnett RT, Villeneuve PJ, Krewski D. 2003. Effect of short-term exposure to gaseous pollution on asthma hospitalisation in children: a bi-directional case-crossover analysis. J Epidemiol Community Health 57:50–55.
Lin M, Stieb DM, Chen Y. 2005. Coarse particulate matter and hospitalization for respiratory infections in children younger than 15 years in Toronto: a case-crossover analy-sis. Pediatrics 116:e235–e240.
Ljungman PL, Berglind N, Holmgren C, Gadler F, Edvardsson N, Pershagen G, et al. 2008. Rapid effects of air pollution on ventricular arrhythmias. Eur Heart J 29:2894–2901.
Logan WPD. 1953. Mortality in the London fog incident, 1952. Lancet 1:336–338.
Loomis D, Richardson DB, Elliott L. 2005. Poisson regression analysis of ungrouped data. Occup Environ Med 62:325-329.
Lu Y, Symons JM, Geyh AS, Zeger SL. 2008. An approach to checking case-crossover analyses based on equivalence with time-series methods. Epidemiology 19:169–175.
Lu Y, Zeger SL. 2007. On the equivalence of case-crossover and time series methods in environmental epidemiology. Biostatistics 8:337–344.
Luginaah IN, Fung KY, Gorey KM, Webster G, Wills C. 2005. Association of ambient air pollution with respiratory hospi-talization in a government-designated “area of concern”: the case of Windsor, Ontario. Environ Health Perspect 113:290–296.
Lumley T, Levy D. 2000. Bias in the case-crossover design: implications for studies of air pollution. Environmetrics 11:689–704.
Maclure M. 1991. The case-crossover design: a method for studying transient effects on the risk of acute events. Am J Epidemiol 133:144–153.
Maclure M, Mittleman MA. 2008. Case-crossover designs compared with dynamic follow-up designs. Epidemiology 19:176–178.
Carracedo-Martínez et al.
1182 volume 118 | number 8 | August 2010 • Environmental Health Perspectives
Marshall RJ, Jackson RT. 1993. Analysis of case-crossover designs. Stat Med 12:2333–2341.
Maynard D, Coull BA, Gryparis A, Schwartz J. 2007. Mortality risk associated with short-term exposure to traffic par-ticles and sulfates. Environ Health Perspect 115:751–755.
Medina-Ramón M, Zanobetti A, Schwartz J. 2006. The effect of ozone and PM10 on hospital admissions for pneumonia and chronic obstructive pulmonary disease: a national multicity study. Am J Epidemiol 163:579–588.
Mittleman MA. 2005. Optimal referent selection strategies in case-crossover studies: a settled issue. Epidemiology 16:715–716.
Navidi W. 1998. Bidirectional case-crossover designs for expo-sures with time trends. Biometrics 54:596–605.
Navidi W, Thomas D, Langholz B, Stram D. 1999. Statistical methods for epidemiologic studies of the health effects of air pollution. Res Rep Health Eff Inst (86):1–50.
Navidi W, Weinhandl E. 2002. Risk set sampling for case- crossover designs. Epidemiology 13:100–105.
Neas LM, Schwartz J, Dockery D. 1999. A case-crossover anal-ysis of air pollution and mortality in Philadelphia. Environ Health Perspect 107:629–631.
Peel JL, Metzger KB, Klein M, Flanders WD, Mulholland JA, Tolbert PE. 2007. Ambient air pollution and cardiovascu-lar emergency department visits in potentially sensitive groups. Am J Epidemiol 165:625–633.
Perez L, Tobias A, Querol X, Künzli N, Pey J, Alastuey A, et al. 2008. Coarse particles from Saharan dust and daily mortal-ity. Epidemiology 19:800–807.
Peters A, Dockery DW, Muller JE, Mittleman MA. 2001. Increased particulate air pollution and the triggering of myocardial infarction. Circulation 103:2810–2815.
Peters A, von Klot S, Berglind N, Hörmann A, Löwel H, Nyberg F, et al. 2006. Comparison of different methods in analyz-ing short-term air pollution effects in a cohort study of susceptible individuals. Epidemiol Perspect Innov 3:10. Available: http://www.epi-perspectives.com/content/3/1/10 [accessed 1 July 2010].
Peters A, von Klot S, Heier M, Trentinaglia I, Cyrys J, Hörmann A, et al. 2005. Particulate air pollution and non fatal cardiac events. Part I. Air pollution, personal activities, and onset of myocardial infarction in a case-crossover study. Res Rep Health Eff Inst (124):1–66.
Pope CA III, Muhlestein JB, May HT, Renlund DG, Anderson JL, Horne BD. 2006. Ischemic heart disease events triggered by short-term exposure to fine particulate air pollution. Circulation 114:2443–2448.
Pope CA III, Renlund DG, Kfoury AG, May HT, Horne BD. 2008. Relation of heart failure hospitalization to exposure to fine particulate air pollution. Am J Cardiol 102:1230–1234.
Ramsay TO, Burnett RT, Krewski D. 2003. The effect of con-curvity in generalized additive models linking mortality to ambient particulate matter. Epidemiology 14:18–23.
Rich DQ, Kim MH, Turner JR, Mittleman MA, Schwartz J, Catalana PJ, et al. 2006a. Association of ventricular arrhythmias detected by implantable cardioverter defibril-lator and ambient air pollutants in the St Louis, Missouri metropolitan area. Occup Environ Med 63:591–596.
Rich DQ, Mittleman MA, Link MS, Schwartz J, Luttmann-Gibson H, Catalana PJ, et al. 2006b. Increased risk of paroxysmal atrial fibrillation episodes associated with acute increases in ambient air pollution. Environ Health Perspect 114:120–123.
Rich DQ, Schwartz J, Mittleman MA, Link M, Luttmann-Gibson H, Catalano PJ, et al. 2005. Association of short-term ambient air pollution concentrations and ventricular arrhythmias. Am J Epidemiol 161:1123–1132.
Rich KE, Petkau J, Vedal S, Brauer M. 2004. A case-crossover analysis of particulate air pollution and cardiac arrhythmia in patients with implantable cardioverter defibrillators. Inhal Toxicol 16:363–372.
Romieu I, Ramirez-Aguilar M, Moreno-Macias H, Barraza-Villarreal A, Millar P, Hernández-Cadena L, et al. 2004. Infant mortality and air pollution: modifying effect by social class. J Occup Environ Med 46:1210–1216.
Ruidavets JB, Cournot M, Cassadou S, Giroux M, Meybeck M, Ferrieres J. 2005. Ozone air pollution is associated with acute myocardial infarction. Circulation 111:563–569.
Saez M, Perez-Hoyos S, Tobias A, Saurina C, Barceló MA, Ballester F. 1999. Métodos de series temporales en los studies epidemiológicos sobre contaminación atmosférica [in Spanish]. Rev Esp Salud Publica 73:133–143.
Schwartz J. 2004a. Is the association of airborne particles with daily deaths confounded by gaseous air pollutants? An approach to control by matching. Environ Health Perspect 112:557–561.
Schwartz J. 2004b. The effects of particulate air pollution on daily deaths: a multi-city case crossover analysis. Occup Environ Med 61:956–961.
Schwartz J. 2005. How sensitive is the association between ozone and daily deaths to control for temperature? Am J Respir Crit Care Med 171:627–631.
Ségala C, Poizeau D, Mesbah M, Willems S, Maidenberg M. 2008. Winter air pollution and infant bronchiolitis in Paris. Environ Res 106:96–100.
Sheppard L, Levy D, Checkoway H. 2001. Correcting for the effects of location and atmospheric conditions on air pol-lution exposures in a case-crossover study. J Expo Anal Environ Epidemiol 11:86–96.
Son JY, Cho YS, Lee JT. 2008. Effects of air pollution on post-neonatal infant mortality among firstborn infants in Seoul, Korea: case-crossover and time-series analyses. Arch Environ Occup Health 63:108–113.
Stafoggia M, Schwartz J, Forastiere F, Perucci CA; SISTI Group. 2008. Does temperature modify the association between air pollution and mortality? A multicity case-crossover analysis in Italy. Am J Epidemiol 167:1476–1485.
Sullivan J, Ishikawa N, Sheppard L, Siscovick D, Checkoway H, Kaufman J. 2003. Exposure to ambient fine particulate mat-ter and primary cardiac arrest among persons with and without clinically recognized heart disease. Am J Epidemiol 157:501–509.
Sullivan J, Sheppard L, Schreuder A, Ishikawa N, Siscovick D, Kaufman J. 2005. Relation between short-term fine- particulate matter exposure and onset of myocardial infarction. Epidemiology 16:41–48.
Sunyer J, Basagana X. 2001. Particles, and not gases, are associ-ated with the risk of death in patients with chronic obstruc-tive pulmonary disease. Int J Epidemiol 30:1138–1140.
Sunyer J, Basagaña X, Belmonte J, Antó JM. 2002. Effect of nitrogen dioxide and ozone on the risk of dying in patients with severe asthma. Thorax 57:687–693.
Sunyer J, Schwartz J, Tobias A, Macfarlane D, Garcia J, Antó JM. 2000. Patients with chronic obstructive pulmo-nary disease are at increased risk of death associated with urban particle air pollution: a case-crossover analy-sis. Am J Epidemiol 151:50–56.
Symons JM, Wang L, Guallar E, Howell E, Dominici F, Schwab M, et al. 2006. A Case-crossover study of fine particulate matter air pollution and onset of congestive heart failure symptom exacerbation leading to hospitalization. Am J Epidemiol 164:421–433.
Tecer LH, Alagha O, Karaca F, Tuncel G, Eldes N. 2008. Particulate matter [PM(2.5), PM(10–2.5), and PM(10)] and chil-dren’s hospital admissions for asthma and respiratory diseases: a bidirectional case-crossover study. J Toxicol Environ Health A 71:512–520.
Tsai SS, Chen CC, Hisieh HJ, Chang CC, Yang CY. 2006a. Air pollution and postneonatal mortality in a tropical city: Kaohsiung, Taiwan. Inhal Toxicol 18:185–189.
Tsai SS, Cheng M, Chiu H, Wu T, Yang CY. 2006b. Air pollu-tion and hospital admissions for asthma in a tropical city: Kaohsiung, Taiwan. Inhal Toxicol 18:549–554.
Tsai SS, Goggins WB, Chiu HF, Yang CY. 2003a. Evidence for an association between air pollution and daily stroke admis-sions in Kaohsiung, Taiwan. Stroke 34:2612–2616.
Tsai SS, Huang CH, Goggins WB, Wu TN, Yang CY. 2003b. Relationship between air pollution and daily mortality in a
tropical city: Kaohsiung, Taiwan. J Toxicol Environ Health A 66:1341–1349.
Villeneuve PJ, Chen L, Rowe BH, Coates F. 2007. Outdoor air pollution and emergency department visits for asthma among children and adults: a case-crossover study in northern Alberta, Canada. Environ Health 6:40. Available: http://www.ehjournal.net/content/6/1/40 [accessed 2 July 2010].
Villeneuve PJ, Chen L, Stieb D, Rowe BH. 2006. Associations between outdoor air pollution and emergency department visits for stroke in Edmonton, Canada. Eur J Epidemiol 21:689–700.
Wellenius GA, Bateson TF, Mittleman MA, Schwartz J. 2005a. Particulate air pollution and the rate of hospitalization for congestive heart failure among Medicare beneficiaries in Pittsburgh, Pennsylvania. Am J Epidemiol 161:1030–1036.
Wellenius GA, Schwartz J, Mittleman MA. 2005b. Air pollution and hospital admissions for ischemic and hemorrhagic stroke among Medicare beneficiaries. Stroke 36:2549–2553.
Wellenius GA, Schwartz J, Mittleman MA. 2006. Particulate air pollution and hospital admissions for congestive heart fail-ure in seven United Status cities. Am J Cardiol 97:404–408.
Xu X, Zborowski JV, Arena VC, Rager J, Talbott EO. 2008. Case-crossover analysis of air pollution and cardiorespiratory hospitalizations: using routinely collected health and envi-ronmental data for tracking: science and data. J Public Health Manag Pract 14:569–576.
Yamakazi S, Nitta H, Ono M, Green J, Fukuhara S. 2007.Intracerebral haemorrhage associated with hourly con-centration of ambient particulate matter: case-crossover analysis. Occup Environ Med 64:17-24.
Yang CY. 2008. Air pollution and hospital admissions for con-gestive heart failure in a subtropical city: Taipei, Taiwan. J Toxicol Environ Health A 71:1085–1090.
Yang CY, Chang CC, Chuang HY, Tsai SS, Wu TN, Ho CK. 2004a. Relationship between air pollution and daily mortality in a subtropical city: Taipei, Taiwan. Environ Int 30:519–523.
Yang CY, Chen CC, Chen CY, Kuo HW. 2007. Air pollution and hospital admissions for asthma in a subtropical city: Taipei, Taiwan. J Toxicol Environ Health 70:111–117.
Yang CY, Chen CJ. 2007. Air pollution and hospital admissions for chronic obstructive pulmonary disease in a subtropical city: Taipei, Taiwan. J Toxicol Environ Health 70:1214–1219.
Yang CY, Chen YS, Yang CH, Ho SC. 2004b. Relationship between ambient air pollution and hospital admissions for cardiovascular diseases in Kaohsiung, Taiwan. J Toxicol Environ Health A 67:483–493.
Yang CY, Hsieh HJ, Tsai SS, Wu TN, Chiu HF. 2006. Correlation between air pollution and postneonatal mortality in a sub-tropical city: Taipei, Taiwan. J Toxicol Environ Health 69:2033–2040.
Yang Q, Chen Y, Shi Y, Burnett RT, McGrail KM, Krewski D. 2003. Association between ozone and respiratory admis-sions among children and the elderly in Vancouver, Canada. Inhal Toxicol 15:1297–1308.
Zanobetti A, Schwartz J. 2005. The effect of particulate air pollution on emergency admissions for myocardial infarc-tion: a multicity case-crossover analysis. Environ Health Perspect 113:978–982.
Zanobetti A, Schwartz J. 2006. Air pollution and emergency admissions in Boston, MA. J Epidemiol Community Health 60:890–895.
Zeger SL, Dominici F, McDermott A, Samet JM. 2008. Mortality in the Medicare population and chronic exposure to fine particulate air pollution in urban centers (2000–2005). Environ Health Perspect 116:1614–1619.
Zeka A, Zanobetti A, Schwartz J. 2005. Short term effects of particulate matter on cause specific mortality: effects of lags and modification by city characteristics. Occup Environ Med 62:718–725.
Zeka A, Zanobetti A, Schwartz J. 2006. Individual-level modi-fiers of the effects of particulate matter on daily mortality. Am J Epidemiol 163:849–859.